33
Cowal Site Visit 9 November 2016

Cowal Site Visit 9 November 2016

Forward looking statement
� These materials prepared by Evolution Mining Limited (or “the Company”) include forward looking statements. Often, but not always, forward looking statements can generally be identified by the use of forward looking words such as “may”, “will”, “expect”, “intend”, “plan”, “estimate”, “anticipate”, “continue”, and “guidance”, or other similar words and may include, without limitation, statements regarding plans, strategies and objectives of management, anticipated production or construction commencement dates and expected costs or production outputs.
� Forward looking statements inherently involve known and unknown risks, uncertainties and other factors that may cause the Company’s actual results, performance and achievements to differ materially from any future results, performance or achievements. Relevant factors may include, but are not limited to, changes in commodity prices, foreign exchange fluctuations and general economic conditions, increased costs and demand for production inputs, the speculative nature of exploration and project development, including the risks of obtaining necessary licenses and permits and diminishing quantities or grades of reserves, political and social risks, changes to the regulatory framework within which the Company operates or may in the future operate, environmental conditions including extreme weather conditions, recruitment and retention of personnel, industrial relations issues and litigation.
� Forward looking statements are based on the Company and its management’s good faith assumptions relating to the financial, market, regulatory and other relevant environments that will exist and affect the Company’s business and operations in the future. The Company does not give any assurance that the assumptions on which forward looking statements are based will prove to be correct, or that the Company’s business or operations will not be affected in any material manner by these or other factors not foreseen or foreseeable by the Company or management or beyond the Company’s control.
� Although the Company attempts and has attempted to identify factors that would cause actual actions, events or results to differ materially from those disclosed in forward looking statements, there may be other factors that could cause actual results, performance, achievements or events not to be as anticipated, estimated or intended, and many events are beyond the reasonable control of the Company. Accordingly, readers are cautioned not to place undue reliance on forward looking statements. Forward looking statements in these materials speak only at the date of issue. Subject to any continuing obligations under applicable law or any relevant stock exchange listing rules, in providing this information the Company does not undertake any obligation to publicly update or revise any of the forward looking statements or to advise of any change in events, conditions or circumstances on which any such statement is based.
2

Overview
3
Growth � Ore Reserves increased from 1.56Moz to 2.85Moz (+83%) under Evolution ownership � Expansion of E42 pit prioritised
� E42 Stage H cutback resource definition drilling program near completion � Current life of mine plan (LOMP) includes Stage H cutback to access an additional
1.4Moz (adding 5 to 6 years to LOMP) � Resource model to be updated to incorporate results of current drill program in
early 2017 � Prospects not included in LOMP:
� E42 mining options beyond Stage H � E41/E46/Galway-Regal satellite pits � E46 deeps (underground) � Cowal regional prospects including Marsden
Transformation � Asset optimisation feasibility studies targeting:
� Improvement to plant recovery (5 to 7%) � Plant expansion to circa. 9Mtpa
1. See Evolution’s Group Mineral Resources and Ore Reserves and footnotes in the appendix of this presentation for details on Ore Reserve and Mineral Resource estimates
Cowal gold mineralisation, recent drilling and E42 open pit outline
E41 West
E46
Galway/Regal
E46 East
E42
E41 East
Open at depth

Location
Kalgoorlie 20km
4
Overview
5
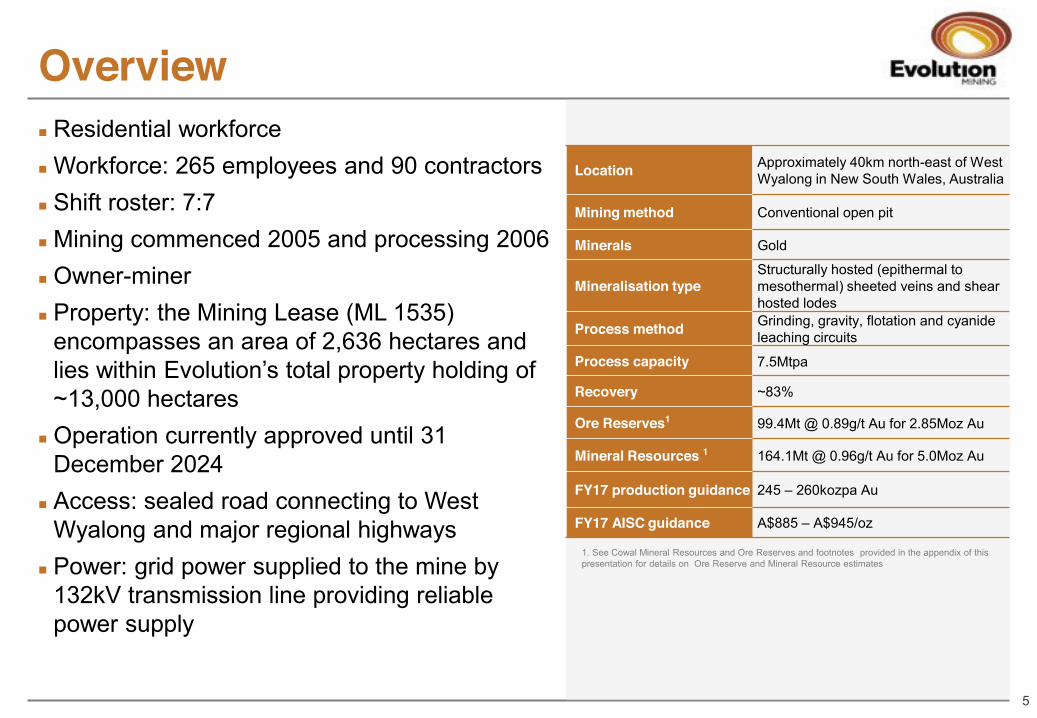
Location Approximately 40km north-east of West Wyalong in New South Wales, Australia
Mining method Conventional open pit
Minerals Gold
Mineralisation type Structurally hosted (epithermal to mesothermal) sheeted veins and shear hosted lodes
Process method Grinding, gravity, flotation and cyanide leaching circuits
Process capacity 7.5Mtpa
Recovery ~83%
Ore Reserves1 99.4Mt @ 0.89g/t Au for 2.85Moz Au
Mineral Resources 1 164.1Mt @ 0.96g/t Au for 5.0Moz Au
FY17 production guidance 245 – 260kozpa Au
FY17 AISC guidance A$885 – A$945/oz
� Residential workforce � Workforce: 265 employees and 90 contractors � Shift roster: 7:7 � Mining commenced 2005 and processing 2006 � Owner-miner � Property: the Mining Lease (ML 1535)
encompasses an area of 2,636 hectares and lies within Evolution’s total property holding of ~13,000 hectares
� Operation currently approved until 31 December 2024
� Access: sealed road connecting to West Wyalong and major regional highways
� Power: grid power supplied to the mine by 132kV transmission line providing reliable power supply
1. See Cowal Mineral Resources and Ore Reserves and footnotes provided in the appendix of this presentation for details on Ore Reserve and Mineral Resource estimates

Cowal performance and outlook
Kalgoorlie 20km
6
� Gold production of 237,940 ounces (from ~11 months of ownership) � AISC1 of A$776 per ounce � Net mine cash flow of A$146 million
FY17 guidance � Gold production guidance of 245,000 – 260,000 ounces � AISC of A$885 – A$945 per ounce � Sustaining capital: A$40M – A$45M � Major capital: nil
FY16 performance
1. AISC (All-in sustaining cost) includes C1 cash cost plus royalty expense, sustaining capital expense, general corporate and administration. Calculated on per ounce sold

Business improvement
Kalgoorlie 20km
7
� Organisational restructure � 7% reduction in workforce – cost saving of A$3.6M/year � Implementation of planning and development team to drive asset growth & transformation
� Wall steepening to unlock reserve potential (IRA now at 61o) OR increased by 76,000oz � “Drill to Mill” project � GET recovery – zero GET through primary crusher in FY16 � Mining improvements – ramp and haul road design improving tyre wear, fuel consumption and final
drive maintenance interval resulting in savings of $750k/year � Processing plant utilisation improvements – 8 week shut down cycle (>2% utilisation in FY17 to
93.5%) � Processing unit cost improvement to $13.10/t in FY17 (down 2.3% on FY16, down 7% on 5 year
average) � Gold recovery improved by 2% to 83.6% in FY16 (81.7% in FY15, 81.3% on 5 year average)

Kalgoorlie 20km
8
Pit design – wall steepening

Ore Reserves and Mineral Resources
Kalgoorlie 20km
9
1,555 2,181
2,848
5,046 471 155 76
900 201 350
725 448 272 202
309
0
1,000
2,000
3,000
4,000
5,000
6,000
Barrick D
ec 2014 Reserve
+0.40g/t Cutoff &
Stockpiles
80° BFA
, +0.40g/t Cutoff
EV
N D
ec 2014 Reserve
Stage G
90° BFA
and 10m B
erm
Stage H
Inclusion
Depletion
EV
N D
ec 2015 Reserve
E42 R
esource Stage G
E42 R
esource Stage H
E42 R
esource A$1,800 shell
E41 R
esource
E46 R
esource
Galw
ay Regal - E
46 Resource
EV
N D
ec 2015 Resource
Rese
rve/
Reso
urce
Oun
ces
(koz
)
Cowal Reserve & Resources as a function of pit design Barrick Dec 2014 Dec to Evolution Dec 2015
1. See Cowal Mineral Resources and Ore Reserves and footnotes provided in the appendix of this presentation for details on Reserve and Resource estimates. Barrick Dec 2014 Reserve sourced from Barrrick Gold Corporation. Data is reported to significant figures to reflect appropriate precision and may not sum precisely due to rounding

E42 Stage H cutback
Kalgoorlie 20km
10
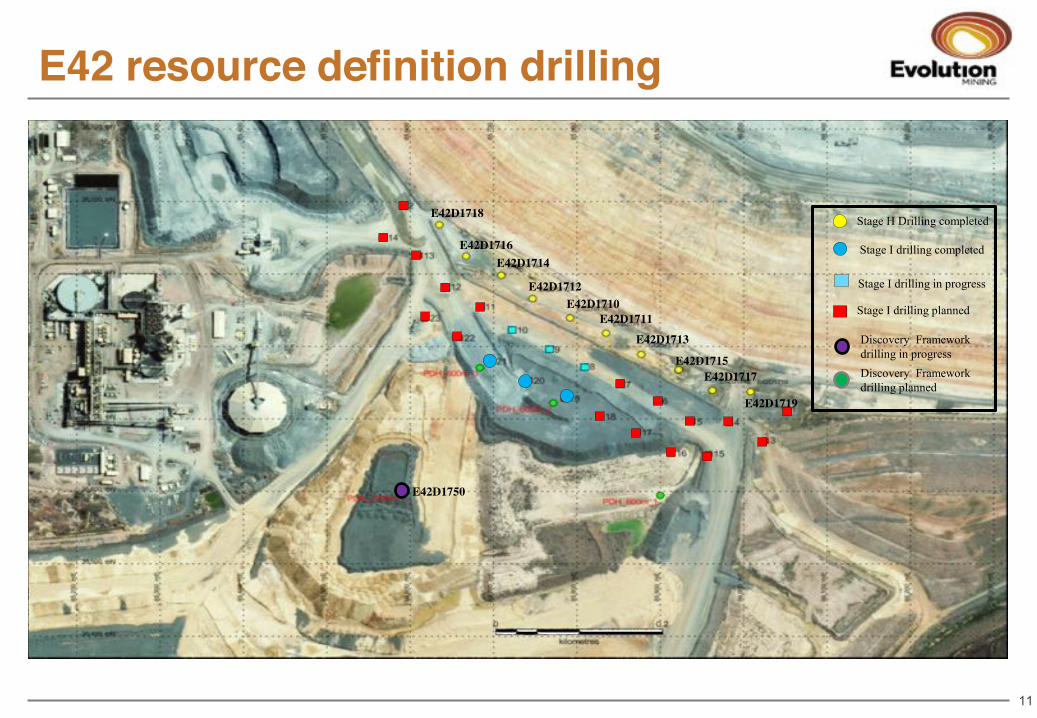
E42 resource definition drilling
11
Stage H Drilling completed
Stage I drilling completed
Stage I drilling in progress
Discovery Framework drilling in progress
E42D1750
Discovery Framework drilling planned
Stage I drilling planned
E42D1718
E42D1716 E42D1714
E42D1712
E42D1711 E42D1710
E42D1713
E42D1715 E42D1717
E42D1719

E42 pit shells and contained ounces
Kalgoorlie 20km
12
Indicated and Inferred
Resources (koz)
Unclassified Resources
(koz)
Ore movement
(Mt)
Waste movement
(Mt) Stage G 1,250 3 27.7 8.3 Stage H1 1,250 90 36.1 104.3 A$1,800/oz shell 725 85 Total 3,225 178
1. Ore and Waste movements are estimates only. Stage H Feasibility Study not yet complete.

E42 Stage H cutback – recent drill results
Kalgoorlie 20km
13
Reported intervals are down hole widths as true widths are not currently known. The information above is provided in the report entitled “September 2016 Quarterly Report” released to the ASX on 17 October 2016 and available to view at www.asx.com.au

E42 – recent drill results
14
Reported intervals are down hole widths as true widths are not currently known. The information above is provided in the report entitled “September 2016 Quarterly Report” released to the ASX on 17 October 2016 and available to view at www.asx.com.au

E42 drill results summary
15
� Total of 83 RC and diamond drill holes for 43,000 meters drilled by 30 Sept 2016 � Confirmed continuity of mineralisation within Stage H cutback design � Potential for increase in grade of current Mineral Resource � Step-out holes have intersected new zones of mineralisation beyond Stage H
� Significant intercepts included:
� 62m grading 2.16g/t Au from 530m incl. 4m @ 17.20g/t (E42D1711D) � 71m grading 6.92g/t Au from 572m incl. 1m @ 370g/t & 7m @ 7.21g/t (E42D1711F) � 41m grading 6.46g/t Au from 583m incl. 1m @152g/t & 1m @ 52.8g/t (E42D1712) � 110m grading 1.43g/t Au from 704m (E42D1712A) � 14m grading 8.09g/t Au from 610m incl. 1m @ 98.1g/t (E42D1713A) � 52m grading 4.63g/t Au from 708m incl. 1m @156g/t (E42D1717)
Reported intervals are down hole widths as true widths are not currently known. The information above is provided in the reports entitled “Cowal E42 Drilling Update” released to the ASX on 12 September 2016 and “September 2016 Quarterly Report” released to the ASX on 17 October 2016. Both are available to view at www.asx.com.au

Drilling beyond E42
Kalgoorlie 20km
16
� Satellite pits � Defining the extents of E41, E46 and Regal-Galway deposits to inform future studies
on lake bund placement and infrastructure and provide additional information for future resources and reserves
� ~2,000m DD & 2,700m AC completed in FY16 with remaining drilling in Gated Capital for FY17 following completion of Stage H drilling & dependent on lake water levels
� E46 deeps underground � Drilling likely to commence in FY18

Near mine resource definition
Kalgoorlie 20km
17
Long term regional optionality
Kalgoorlie 20km
18
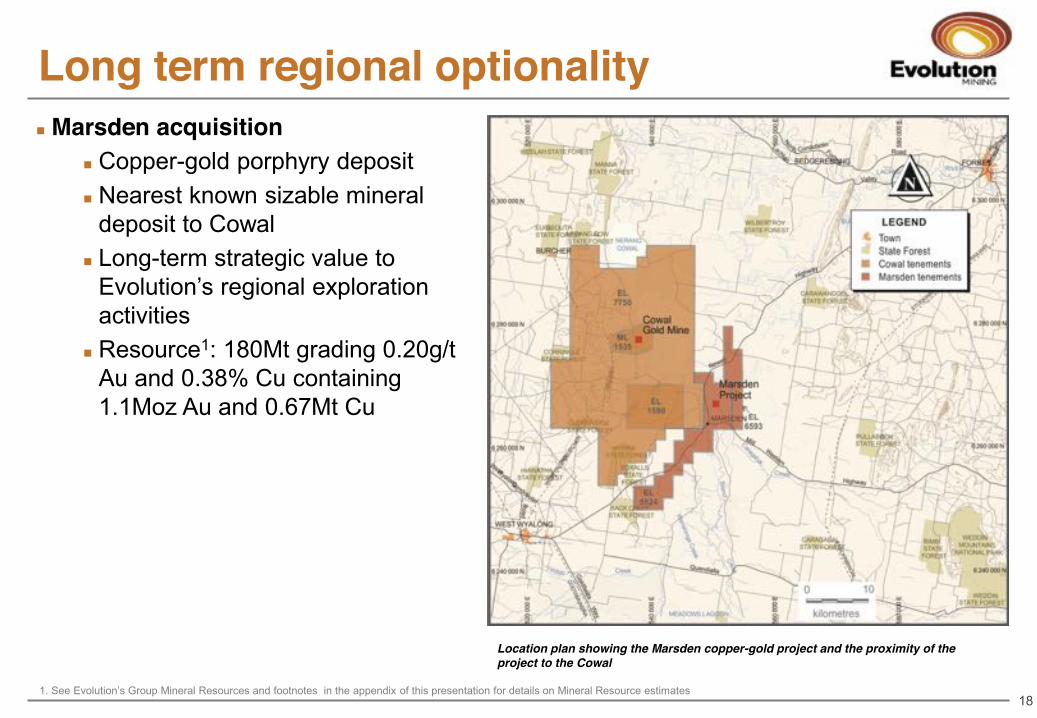
� Marsden acquisition � Copper-gold porphyry deposit � Nearest known sizable mineral
deposit to Cowal � Long-term strategic value to
Evolution’s regional exploration activities
� Resource1: 180Mt grading 0.20g/t Au and 0.38% Cu containing 1.1Moz Au and 0.67Mt Cu
Location plan showing the Marsden copper-gold project and the proximity of the project to the Cowal
1. See Evolution’s Group Mineral Resources and footnotes in the appendix of this presentation for details on Mineral Resource estimates

Planning and development
Kalgoorlie 20km
19
� Immediate focus (FY17): � E42 resource definition drilling (Stage H & beyond) � E42 Stage H Feasibility Study � Dual Leach Feasibility Study
� Targeting recovery increase of 5% to 7% � Approvals | Mod 13 to development consent
� Longer term focus: � Plant throughput upgrade – secondary crushing
� Targeting throughput increase of ~20% to 9.0Mtpa (current permit: 7.5Mtpa) � Assess additional E42 cut back potential (or underground opportunity) � Galway & Regal resource definition & development plan � E41 and E46 development plan � Approvals | Part 4 - EIS

Permitting
Kalgoorlie 20km
20
Current permit – Mod 12 � Operations currently approved to 31 December 2024 with plant throughput limited
to 7.5Mtpa � Stage H can be commenced with Mod 12
New permit required for current LOMP – Mod 13 � Mod13 required to underpin current LOM (including Stage H) � Targeting submission in December 2016 quarter � A minor amendment (s75w) with timeframe of approximately 12 months
Permitting required to unlock further potential � Major changes such as new pits or underground mines are likely to trigger a
major amendment (Part 4a) � Approvals timeline could be up to four years � Requires full EIS (Environmental Impact Study) � Involves Planning & Assessment Commission (PAC) and public consultation

A transformational asset
21
� Substantial potential to grow and transform asset � Development path now well understood (interdependencies, approvals and priorities) � Demonstrated commitment to growing and transforming asset (drilling & studies) � Prioritising E42 Stage H cut back � Seeking approval to extend mine life to 2032

Appendix
Cowal Mineral Resources Dec 2015
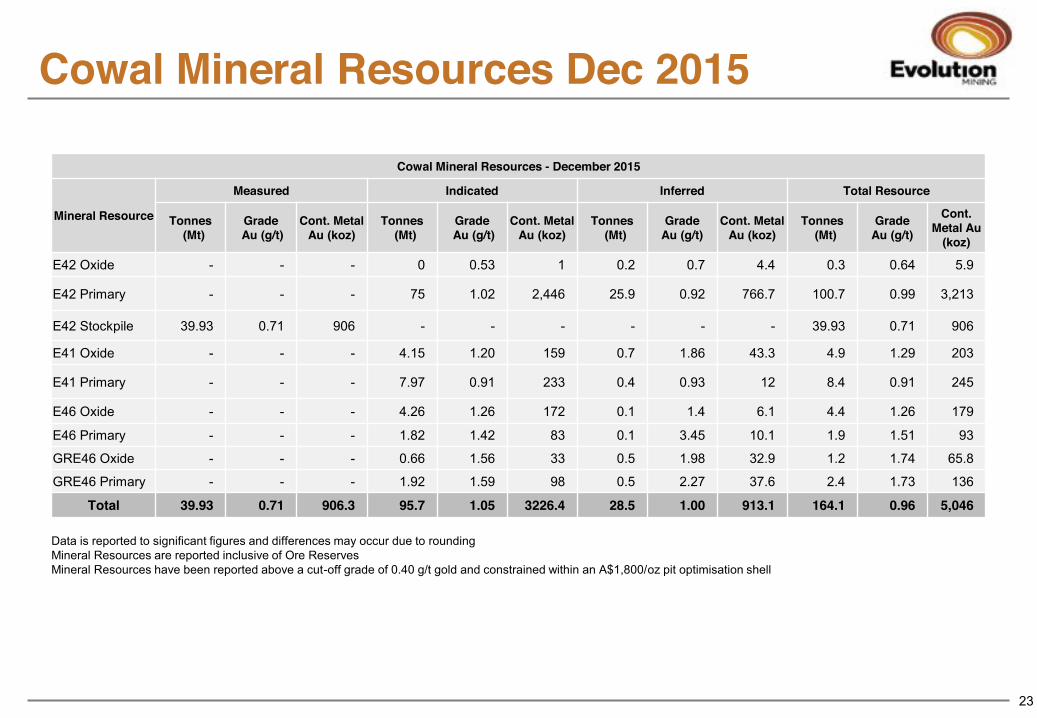
Data is reported to significant figures and differences may occur due to rounding Mineral Resources are reported inclusive of Ore Reserves Mineral Resources have been reported above a cut-off grade of 0.40 g/t gold and constrained within an A$1,800/oz pit optimisation shell
Cowal Mineral Resources - December 2015
Mineral Resource
Measured Indicated Inferred Total Resource
Tonnes (Mt)
Grade Au (g/t)
Cont. Metal Au (koz)
Tonnes (Mt)
Grade Au (g/t)
Cont. Metal Au (koz)
Tonnes (Mt)
Grade Au (g/t)
Cont. Metal Au (koz)
Tonnes (Mt)
Grade Au (g/t)
Cont. Metal Au
(koz)
E42 Oxide - - - 0 0.53 1 0.2 0.7 4.4 0.3 0.64 5.9
E42 Primary - - - 75 1.02 2,446 25.9 0.92 766.7 100.7 0.99 3,213
E42 Stockpile 39.93 0.71 906 - - - - - - 39.93 0.71 906
E41 Oxide - - - 4.15 1.20 159 0.7 1.86 43.3 4.9 1.29 203
E41 Primary - - - 7.97 0.91 233 0.4 0.93 12 8.4 0.91 245
E46 Oxide - - - 4.26 1.26 172 0.1 1.4 6.1 4.4 1.26 179
E46 Primary - - - 1.82 1.42 83 0.1 3.45 10.1 1.9 1.51 93
GRE46 Oxide - - - 0.66 1.56 33 0.5 1.98 32.9 1.2 1.74 65.8
GRE46 Primary - - - 1.92 1.59 98 0.5 2.27 37.6 2.4 1.73 136
Total 39.93 0.71 906.3 95.7 1.05 3226.4 28.5 1.00 913.1 164.1 0.96 5,046
23

Cowal Ore Reserves Dec 2015
Data is reported to significant figures and differences may occur due to rounding Ore Reserves are reported above a 0.40 g/t gold cut-off
Cowal Ore Reserves - December 2015
Ore Reserve Cut-off (g/t Au)
Proved Probable Total Reserve
Tonnes (Mt)
Grade Au (g/t)
Cont. Metal Au (koz)
Tonnes (Mt)
Grade Au (g/t)
Cont. Metal Au (koz)
Tonnes (Mt)
Grade Au (g/t)
Cont. Metal Au
(koz)
E42 oxide 0.40 - - - 0.08 0.53 1.4 0.08 0.53 1.4
E42 primary 0.40 - - - 59.39 1.02 1,939.9 59.39 1.02 1,939.9
Stockpile 0.40 39.93 0.71 906.3 - - - 39.93 0.71 906.3
Total 39.93 0.71 906.3 59.47 1.02 1,941 99.40 0.89 2,848
24
25
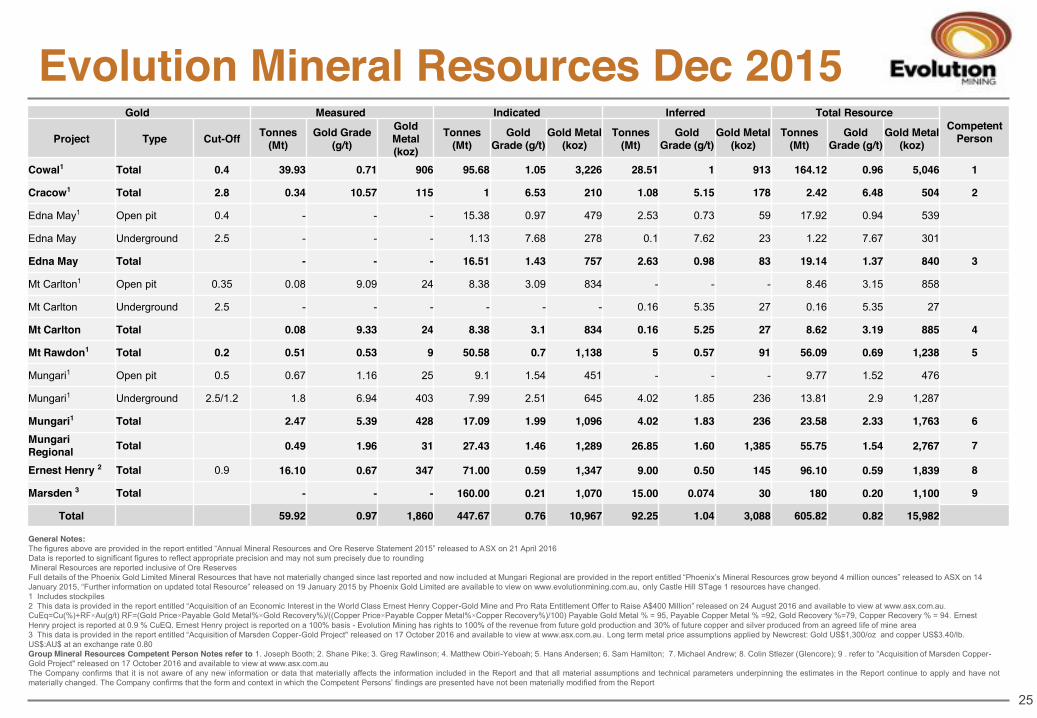
Evolution Mineral Resources Dec 2015
General Notes: The figures above are provided in the report entitled “Annual Mineral Resources and Ore Reserve Statement 2015” released to ASX on 21 April 2016 Data is reported to significant figures to reflect appropriate precision and may not sum precisely due to rounding Mineral Resources are reported inclusive of Ore Reserves Full details of the Phoenix Gold Limited Mineral Resources that have not materially changed since last reported and now included at Mungari Regional are provided in the report entitled “Phoenix’s Mineral Resources grow beyond 4 million ounces” released to ASX on 14 January 2015, “Further information on updated total Resource” released on 19 January 2015 by Phoenix Gold Limited are availab le to view on www.evolutionmining.com.au, only Castle Hill STage 1 resources have changed. 1 Includes stockpiles 2 This data is provided in the report entitled “Acquisition of an Economic Interest in the World Class Ernest Henry Copper-Gold Mine and Pro Rata Entitlement Offer to Raise A$400 Million” released on 24 August 2016 and available to view at www.asx.com.au. CuEq=Cu(%)+RF×Au(g/t) RF=(Gold Price×Payable Gold Metal%×Gold Recovery%)/((Copper Price×Payable Copper Metal%×Copper Recovery%)/100) Payable Gold Metal % = 95, Payable Copper Metal % =92, Gold Recovery %=79, Copper Recovery % = 94. Ernest Henry project is reported at 0.9 % CuEQ. Ernest Henry project is reported on a 100% basis - Evolution Mining has rights to 100% of the revenue from future gold production and 30% of future copper and silver produced from an agreed life of mine area 3 This data is provided in the report entitled “Acquisition of Marsden Copper-Gold Project" released on 17 October 2016 and available to view at www.asx.com.au. Long term metal price assumptions applied by Newcrest: Gold US$1,300/oz and copper US$3.40/lb. US$:AU$ at an exchange rate 0.80 Group Mineral Resources Competent Person Notes refer to 1. Joseph Booth; 2. Shane Pike; 3. Greg Rawlinson; 4. Matthew Obiri-Yeboah; 5. Hans Andersen; 6. Sam Hamilton; 7. Michael Andrew; 8. Colin Stlezer (Glencore); 9 . refer to “Acquisition of Marsden Copper-Gold Project" released on 17 October 2016 and available to view at www.asx.com.au The Company confirms that it is not aware of any new information or data that materially affects the information included in the Report and that all material assumptions and technical parameters underpinning the estimates in the Report continue to apply and have not materially changed. The Company confirms that the form and context in which the Competent Persons’ findings are presented have not been materially modified from the Report
Gold Measured Indicated Inferred Total Resource Competent
Person Project Type Cut-Off Tonnes (Mt)
Gold Grade (g/t)
Gold Metal (koz)
Tonnes (Mt)
Gold Grade (g/t)
Gold Metal (koz)
Tonnes (Mt)
Gold Grade (g/t)
Gold Metal (koz)
Tonnes (Mt)
Gold Grade (g/t)
Gold Metal (koz)
Cowal1 Total 0.4 39.93 0.71 906 95.68 1.05 3,226 28.51 1 913 164.12 0.96 5,046 1
Cracow1 Total 2.8 0.34 10.57 115 1 6.53 210 1.08 5.15 178 2.42 6.48 504 2
Edna May1 Open pit 0.4 - - - 15.38 0.97 479 2.53 0.73 59 17.92 0.94 539
Edna May Underground 2.5 - - - 1.13 7.68 278 0.1 7.62 23 1.22 7.67 301
Edna May Total - - - 16.51 1.43 757 2.63 0.98 83 19.14 1.37 840 3
Mt Carlton1 Open pit 0.35 0.08 9.09 24 8.38 3.09 834 - - - 8.46 3.15 858
Mt Carlton Underground 2.5 - - - - - - 0.16 5.35 27 0.16 5.35 27
Mt Carlton Total 0.08 9.33 24 8.38 3.1 834 0.16 5.25 27 8.62 3.19 885 4
Mt Rawdon1 Total 0.2 0.51 0.53 9 50.58 0.7 1,138 5 0.57 91 56.09 0.69 1,238 5
Mungari1 Open pit 0.5 0.67 1.16 25 9.1 1.54 451 - - - 9.77 1.52 476
Mungari1 Underground 2.5/1.2 1.8 6.94 403 7.99 2.51 645 4.02 1.85 236 13.81 2.9 1,287
Mungari1 Total 2.47 5.39 428 17.09 1.99 1,096 4.02 1.83 236 23.58 2.33 1,763 6 Mungari Regional Total 0.49 1.96 31 27.43 1.46 1,289 26.85 1.60 1,385 55.75 1.54 2,767 7
Ernest Henry 2 Total 0.9 16.10 0.67 347 71.00 0.59 1,347 9.00 0.50 145 96.10 0.59 1,839 8
Marsden 3 Total - - - 160.00 0.21 1,070 15.00 0.074 30 180 0.20 1,100 9
Total 59.92 0.97 1,860 447.67 0.76 10,967 92.25 1.04 3,088 605.82 0.82 15,982

General Notes: The figures above are provided in the report entitled “Annual Mineral Resources and Ore Reserve Statement 2015” released to ASX on 21 April 2016 Data is reported to significant figures to reflect appropriate precision and may not sum precisely due to rounding 1 Includes stockpiles 2 This data is provided in the report entitled “Acquisition of an Economic Interest in the World Class Ernest Henry Copper-Gold Mine and Pro Rata Entitlement Offer to Raise A$400 Million” released on 24 August 2016 and available to view at www.asx.com.au. CuEq=Cu(%)+RF×Au(g/t) RF=(Gold Price×Payable Gold Metal%×Gold Recovery%)/((Copper Price×Payable Copper Metal%×Copper Recovery%)/100) Payable Gold Metal % = 95, Payable Copper Metal % =92, Gold Recovery %=79, Copper Recovery % = 94. EHO is reported at 0.9 % CuEQ. EHO is reported on a 100% basis - Evolution Mining has rights to 100% of the revenue from future gold production and 30% of future copper and silver produced from an agreed life of mine area Group Ore Reserve Competent Person Notes refer to 1. Jason Floyd; 2. Ian Patterson; 3. Guy Davies; 4. Tony Wallace; 5. Ross McLellan; 6. Matt Varvari; 7. Alexander Campbell (Glencore) The Company confirms that it is not aware of any new information or data that materially affects the information included in the Report and that all material assumptions and technical parameters underpinning the estimates in the Report continue to apply and have not materially changed. The Company confirms that the form and context in which the Competent Persons’ findings are presented have not been materially modified from the Report
Evolution Ore Reserves Dec 2015 Gold Proved Probable Total Reserve
Competent Person Project Type Cut-Off Tonnes
(Mt) Gold Grade
(g/t) Gold Metal
(koz) Tonnes
(Mt) Gold
Grade (g/t) Gold Metal
(koz) Tonnes
(Mt) Gold
Grade (g/t) Gold Metal
(koz)
Cowal1 Open pit 0.4 39.93 0.71 906 59.47 1.02 1,941 99.4 0.89 2,848 1
Cracow1 Underground 3.5 0.5 6.11 98 0.56 5.12 92 1.06 5.59 190 2
Edna May1 Open pit 0.5 - - - 8.32 1 269 8.32 1 269 3
Edna May1 Underground 2.5 - - - 1.34 4.69 202 1.34 4.69 202 2
Edna May1 Total - - - 9.66 1.51 471 9.66 1.51 471
Mt Carlton1 Open pit 0.8 - - - 4.62 4.78 709 4.62 4.78 709 4
Mt Rawdon1 Open pit 0.3 0.51 0.53 9 33.92 0.78 855 34.43 0.78 864 5
Mungari1 Underground 2.9 1.42 5.57 254 0.57 5.6 103 1.99 5.58 357
Mungari1 Open pit 0.7 0.65 1 21 5.28 1.69 288 5.93 1.62 309
Mungari1 Total 2.07 4.13 275 5.85 2.07 390 7.92 2.57 665 6
Ernest Henry2 Total 0.9 10.9 0.6 210 47 0.53 801 57.9 0.54 1,011 7
Total 53.91 0.86 1,498 161.08 1.02 5,259 214.99 0.98 6,758
26

General Notes: Data is reported to significant figures to reflect appropriate precision and may not sum precisely due to rounding Mineral Resources are reported inclusive of Ore Reserves 2. This data is provided in the report entitled “Acquisition of an Economic Interest in the World Class Ernest Henry Copper-Gold Mine and Pro Rata Entitlement Offer to Raise A$400 Million” released on 24 August 2016 and available to view at www.asx.com.au. EHO is reported at 0.9 % CuEQ. EHO is reported at 0.9 % CuEQ. EHO is reported on a 100% basis - Evolution Mining has rights to 100% of the revenue from future gold production and 30% of future copper and silver produced from an agreed life of mine area 3. This data is provided in the report entitled “Acquisition of Marsden Copper-Gold Project" released on 17 October 2016 and available to view at www.asx.com.au Long term metal price assumptions applied by Newcrest: Gold US$/oz 1,300 and copper US$/lb 3.40 US$:AU$ at an exchange rate 0.80 Group Mineral Resources Competent Person Notes refer to : 8. Colin Stlezer (Glencore); 9. refer to “Acquisition of Marsden Copper-Gold Project" released on 17 October 2016 and available to view at www.asx.com.au Group Ore Reserve Competent Person Notes refer to : 7. Alexander Campbell (Glencore) The Company confirms that it is not aware of any new information or data that materially affects the information included in the Report and that all material assumptions and technical parameters underpinning the estimates in the Report continue to apply and have not materially changed. The Company confirms that the form and context in which the Competent Persons’ findings are presented have not been materially modified from the Report
Evolution Copper MROR Dec 2015
27
Copper Measured Indicated Inferred Total Resource Competent
Person Project Type Cut-Off Tonnes (Mt)
Copper Grade (%)
Copper Metal (kt)
Tonnes (Mt)
Copper Grade (%)
Copper Metal (kt)
Tonnes (Mt)
Copper Grade (%)
Copper Metal (kt)
Tonnes (Mt)
Copper Grade (%)
Copper Metal (kt)
Ernest Henry2 Total 0.9 16.10 1.29 208 71.00 1.15 817 9.00 1.10 99 96.10 1.17 1,124 8
Marsden3 Total - - - 160 0.4 640 15 0.19 30 180 0.38 670 9
Total 16.10 1.29 208 231.00 0.63 1,457 24.00 0.54 129 276.10 0.65 1,794
December 2015 Copper Group Mineral Resources Statement
December 2015 Copper Group Ore Reserves Statement
Copper Proved Probable Total Reserve Competent
Person Project Type Cut-Off Tonnes (Mt) Copper Grade (%)
Copper Metal (kt) Tonnes (Mt) Copper
Grade (%) Copper
Metal (kt) Tonnes (Mt) Copper Grade (%)
Copper Metal (kt)
Ernest Henry2 Total 0.9 10.9 1.17 128 47 1.03 484 57.9 1.06 612 7
Total 10.9 1.17 128 47 1.03 484 57.9 1.06 612

Cowal historic plant performance
*calendar years 28
3.6
6.6 7.2 7.4 7.2 7.0
7.3 7.0
7.4 7.0
116
240
191 233
298
269 268
297
267 258
0
50
100
150
200
250
300
0.0
1.0
2.0
3.0
4.0
5.0
6.0
7.0
8.0
9.0
10.0
2006 2007 2008 2009 2010 2011 2012 2013 2014 2015
koz
Thou
sand
s
Mt
Tonnes Processed Gold recovered

� Power supplied by AGL � Crushing
� Primary crushing: Metso 54-75 Superior MK-II gyratory crusher � Grinding
� FFE 36’ x 20.5’ SAG mill, FFE 22’ x 36.5’ ball mill � Forged steel 125mm balls (SAG), 80mm balls (ball mill)
� Screening � Schenck Vibrating screens (SAG discharge), Deklor Linear (COF)
� Recycle crusher � 2 x Sandvik H6800 hydrocone cone crushers
� Mineral liberation/recovery � Method: flotation, regrind, CIL of concentrate � Equipment: 2 x SK1200 and 10 x OK200TC (flotation), Metso Vertimill (VTM1000WB), 2 x
Metso 355kW SMDs, 4,000m3 , Pre-Ox, 2 x 4,000m3 and 6 x 1,000m3 CIL tanks � Cyanide supply – Orica � Lime supply – Boral
� Refining � 10t AARL elution circuit, ANSAC regeneration kiln
� Gravity Circuit � Falcon concentrator / Acacia Reactor 29
Process equipment

Process flowsheet
30

Mining fleet � Haulage/mine trucks
− 14 x Cat 789 dump trucks − 3 x Cat 785C dump trucks
� Drilling equipment − 2 x Atlas Copco D65 (Hired) − 2 x Terex SKF Drill
� Dozers − 3 x CAT D10T dozers − 1 x CAT834H wheel dozer
� Shovels/excavators/loaders
− 2 x Liebherr 994B hydraulic excavators − 1 x Hitachi EX3600 excavator − 2 x CAT992G loaders − 1 x CAT385 excavator
� Haul road maintenance equipment − 2 x Cat 16H graders − 1 x Cat 345 excavator − 2 x Cat water carts
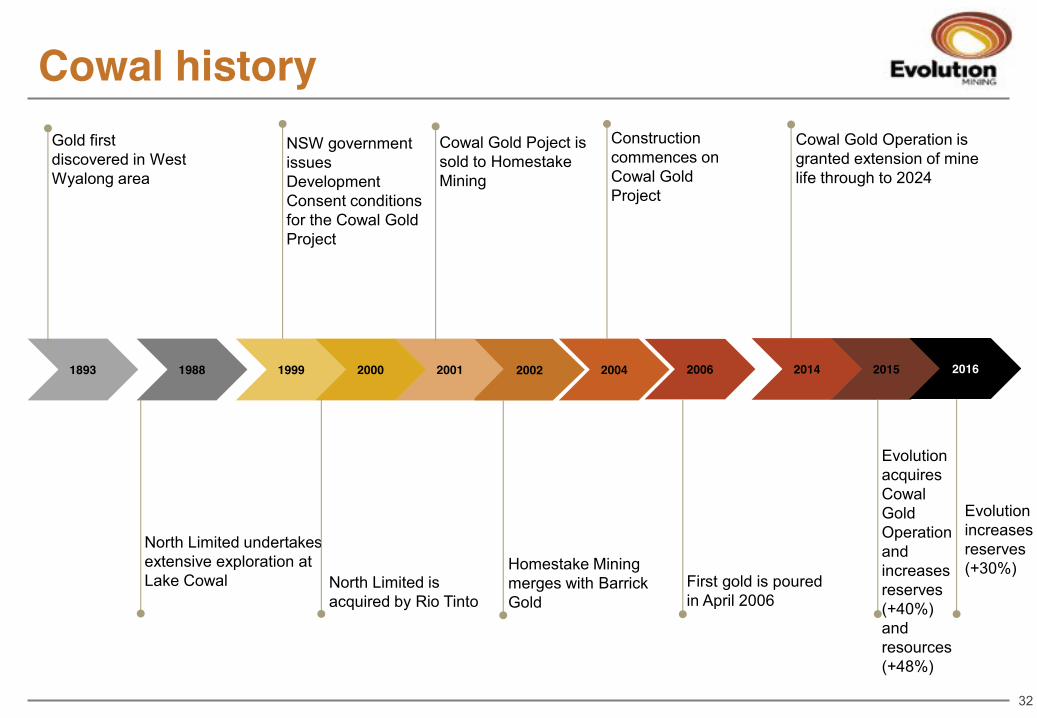
Cowal history NSW government issues Development Consent conditions for the Cowal Gold Project
North Limited is acquired by Rio Tinto
2001 1999 1988
North Limited undertakes extensive exploration at Lake Cowal
2000
Cowal Gold Operation is granted extension of mine life through to 2024
2006 2002
First gold is poured in April 2006
Cowal Gold Poject is sold to Homestake Mining
Homestake Mining merges with Barrick Gold
Construction commences on Cowal Gold Project
2014 2015
Evolution acquires Cowal Gold Operation and increases reserves (+40%) and resources (+48%)
2004 1893
Gold first discovered in West Wyalong area
2016
Evolution increases reserves (+30%)
32

Evolution Mining ASX Code: EVN
www.evolutionmining.com.au


