COYOTE POINT RECREATION AREA PHASE 2 – PRELIMINARY DESIGN REPORT Prepared for San Mateo County Parks Department Prepared by Philip Williams & Associates, Ltd. with Treadwell & Rollo March 2009 PWA REF. #1876.02
Transcript
COYOTE POINT RECREATION AREA PHASE 2 – PRELIMINARY DESIGN REPORT
Services provided pursuant to this Agreement are intended solely for the use and benefit of the San Mateo County Parks Department. No other person or entity shall be entitled to rely on the services, opinions, recommendations, plans or specifications provided pursuant to this agreement without the express written consent of Philip Williams & Associates, Ltd., 550 Kearny Street, Suite 900, San Francisco, CA 94108.
5. ENGINEER’S ESTIMATE OF LIKELY CONSTRUCTION QUANTITIES AND COSTS 15
6. REFERENCES 17
7. LIST OF PREPARERS 19
8. FIGURES 20 LIST OF APPENDICES Appendix A. Existing Site Conditions Appendix B. Geotechnical Report LIST OF TABLES Table 1. Particle Size Characteristics of Modern Beach Sediment 3 Table 2. Engineers Estimate of Likely Construction Quantities and Costs 16 LIST OF FIGURES Figure 1. Site Location Map Figure 2. Coastal Frontage Figure 3. Site Photographs Figure 4. Preferred Conceptual Alternative Figure 5. Location of Borings, CPTs, and Beach Sediment Samples Figure 6. Idealized Subsurface Profiles Figure 7. Cumulative Particle Size Distribution Curves of Modern Beach Sediment Figure 8. Equilibrium Beach Profiles and Existing Conditions Transects Figure 9. Plan View of Proposed Western Shoreline Improvements Figure 10. Typical Sections at Revetment (A) and Windsurfer Access (B) Figure 11. Plan View of Proposed Eastern Shoreline Improvements Figure 12. Cross-sections Across the Crenulate Bay Figure 13. Additional Parking Alternatives
Coyote Point is a regional recreation area operated by the San Mateo County Parks and Recreation Department (County). The recreation area is located southeast of San Francisco International Airport (Figures 1 and 2) and its coastal section is a popular destination for swimmers, windsurfers, kiteboarders, kayakers, cyclists, and walkers. In the 1990s, a series of coastal structures were built along the frontage to provide erosion protection to the recreation area, and in particular to protect a pedestrian promenade adjacent to the beach (Figure 2). Presently, these structures are failing, leading to undercutting and damage to the seaward side of the promenade (Figure 3). The San Mateo County Parks and Recreation Department (County) retained Philip Williams & Associates, Ltd. (PWA) to develop a sustainable solution to the coastal erosion problem while maintaining park functions. Part of the enhancement is to facilitate good public access to the beach and water for a variety of users, particularly swimmers, windsurfers, and kiteboarders. The project is divided into two phases; Phase 1 – conceptual alternatives and selection of preferred alternative; Phase 2 – preliminary design, permitting, and final design. In April 2008, PWA recommended a preferred conceptual design for the restoration of the Coyote Point Recreation Area shoreline, which was subsequently selected by the San Mateo County Parks Commission to take forward to Phase 2 (PWA, 2008). This Preliminary Design Report documents the project description as a basis for environmental review, permitting, and budgeting purposes, prior to design plans and specifications. 1.1 PREFERRED CONCEPTUAL ALTERNATIVE 1.1.1 East of Retail Outlet The preferred conceptual alternative removes the existing structures and realigns the shoreline to a position set back inland from its current position (between the board sports retail outlet and Coyote Point headland) (PWA, 2008). The equilibrium planform shape for the set back would be a crenulate-shaped bay (Figure 4). The crenulate-shaped bay would be held in position by an artificial upcoast hard point located close to the retail outlet, and by Coyote Point headland as the downcoast hard point. This alternative would be combined with beach nourishment within the crenulate-shaped bay cell. The beach created to the east of the retail outlet would be used for recreational activities, excluding windsurfing. 1.1.2 West of Retail Outlet The preferred conceptual alternative for the frontage west of the board sports retail outlet is armoring in combination with access ramps (Figure 4). This length of shoreline would be used by the windsurfing community.
The existing site conditions are described fully in the Phase 1 Conceptual Design Report (PWA, 2008) and the relevant physical process information extracted from that report is presented in Appendix A. Two new investigations have been carried out as part of Phase 2 to provide detail on subsurface conditions and the characteristics of the modern beach sediment. 2.1 SUBSURFACE GROUND CONDITIONS Treadwell & Rollo, Inc carried out a subsurface assessment of the site (Appendix B). A single boring (B-1) located in the eastern parking lot and three CPT’s (CPT-1, CPT-2, and CPT-3) on the lawn area between the retail outlet and the eastern parking lot (Figure 5) were recovered on October 13, 2008. The boring penetrated 25.5 feet subsurface and the CPT’s were to depths between 27 and 27.5 feet subsurface. These subsurface data in combination with the existing stratigraphic data collected for Phase 1 (PWA, 2008) shows that the near-surface geology of the eastern portion of the Recreation Area comprises alluvial fan and fluvial deposits (interbedded clay, clayey sand, sandy clay), overlain by clay (Bay Mud), overlain by sand with silt (antecedent beach deposits), overlain by fill (gravelly clay, clay, clayey sand) (Figure 6). The sand with silt forms a lens of sediment, a maximum of about nine feet thick, located beneath the eastern parking lot and the lawn area, thinning to the south into the park where it transitions with Bay Mud. This sand lens also thins and disappears to the west, beyond the retail outlet, where fill rests directly on about 5-10 feet of Bay Mud. The above interpretation of subsurface conditions is an interpretation using sparse data, and actual conditions may differ substantially from this interpretation. 2.2 BEACH PARTICLE SIZE AND EQUILIBRIUM BEACH PROFILE 2.2.1 Present-day Beach In order to gauge the particle size of sediment required to successfully nourish the crenulate beach, the grading of the current beach sediment was analyzed. The beach grading also provides data for input into formulae to estimate an equilibrium cross-shore beach profile. The particle size and equilibrium beach profiles are important parameters of the beach nourishment design at Coyote Point Recreation Area, in order to predict the type of design that will fare best in the physical conditions (Appendix A), and to predict how the beach will respond after it has been nourished. The beach at Coyote Point Recreation Area is a dynamic three-dimensional feature that varies in form and sediment composition, both temporally and spatially. Spatial variations may be due to the underlying geology, transient morphology, and influences of different types of shore protection structures. The particle size at any given point on the beach is a function of the energy of the cumulative coastal processes (wind, waves, and currents – Appendix A) and the mineralogy of the available sediment.
For a beach sampling strategy, the key to a successful beach nourishment design is to eliminate spatial variability, to determine which combination of beach samples provides the best indication of actual beach behavior over the long-term. We chose an intertidal composite of sediment samples from the existing beach between approximately mean low water and mean high water. This provides the best representation of beach behavior over time, since this zone will be the location of the main nourishment placement, and subsequent reworking. Surface sediment samples were collected from this portion of the beach east of the retail outlet on July 10, 2008. A total of 12 samples were collected along four shore-normal transects comprising three samples in each transect (Figure 5). In all cases the beach is thin and resting on mud. Particle size analyses were carried out at the University of California, Berkeley. Table 1 and Figure 7 present the medians (D50) for whole samples, and for samples with the fraction coarser than 4.7 mm removed. The latter analysis was undertaken to account for potential skewing of the data caused by incorporation of pebbles in the beach eroded from the underlying artificial fill deposits. The data in Table 1 are presented according to the approximate elevation of the sample, which was measured from the site topography map (PWA, 2008) (Figure 5). The table shows that the whole sample medians are coarser due to pebble content. When this coarser fraction (greater than 4.7 mm) is removed from the analysis, the scatter in the data caused by the biasing towards the gravel fraction is removed. The majority of samples (including those in the swash zone) have a median size of approximately 0.5 mm. This would appear to still be coarse for the moderately well protected beach at Coyote Point, and our interpretation is that the majority of the beach sediment is a coarse lag deposit and not representative of a beach that would be in equilibrium at this location. These data provide a maximum median particle size for beach nourishment. Table 1. Particle Size Characteristics of Modern Beach Sediment
2.2.2 Equilibrium Beach Profiles Median sediment particle sizes can be used to construct theoretical equilibrium beach profiles (EBP) using rules proposed by Bruun (1954) and discussed extensively in Dean (2002). The EBP has the form:
h(y) = Ay2/3 where h is the depth below mean sea level (MSL) at a distance y from the shoreline and A is a profile scale parameter with dimensions of length to the one third power. The parameter A has extensively been correlated with sediment particle size. Solving the equation shows that finer particle sizes produce a flatter sloping beach profile and coarser particle sizes produce a steeper sloping beach profile. Figure 8 shows a comparison of four measured PWA shore normal transects (PWA Survey, March 27, 2007 – Figure 5) and the EBPs constructed for median particle sizes of 0.3, 0.4, 0.5, 1.0, and 1.8 mm. The data shows that equilibrium beach profiles constructed from the finest median particle size analyzed (0.3 mm) provides the best fit to the beach transects below mean sea level. The use of finer median particle sizes for beach nourishment purposes is supported by an analysis of the relationships between median particle size, slope of the beach face, and wave climate (Wiegel, 1964). Three curves of median diameter of sand versus slope of beach face were described for three conditions of exposure; protected beaches, moderately protected beaches, and exposed beaches. In general, assuming a constant degree of exposure to waves, the Wiegel (1964) curves show that finer beach sand will produce a flatter beach slope. The Coyote Point Recreation Area can be defined as a moderately protected beach. In this case, given a median particle size between 0.4 mm and 0.5 mm, the equilibrium beach slope is between 8(H):1(V) and 12(H):1(V). However, for a finer beach of 0.3 mm, the beach slope would be 20(H):1(V), more in line with the current slope.
The proposed improvements for the western shoreline and promenade include a rock revetment, with sections of articulated block mat (Armor Flex) to facilitate windsurfer access. A plan view of the proposed actions for the western shoreline including the revetment, windsurfer and kiteboarder access, and promenade are shown in Figure 9. Typical cross-sections of the revetment and kiteboarder/windsurfer access points are presented in Figure 10A (revetment) and Figure 10B (windsurfer access ramp), respectively. 3.1 ROCK REVETMENT Prior to construction of the rock revetment, the existing armored slopes will be cleaned and cleared of unsuitable foundation materials. Side slopes will be roughly graded with bedding stone to provide a good base for the new armor overlay. There are several existing cavities and voids in the structures that should be filled with bedding stone to provide a continuous foundation surface for the new armor. Any portions of the existing armor that remain above the rough graded bedding layer should be demolished. Filter fabric will be placed on top of the bedding layer from the toe through the crest. The existing promenade will likely be damaged in the construction process and will therefore be replaced (Section 3.3). Finally, the bedding layer and filter fabric will be overlain with ½ ton class armor stone as depicted in Figure 10A. The slope of the revetment surface will be 2(H):1(V) and the height will be 13.0 feet NAVD. 3.2 ARTICULATED BLOCK MAT - WINDSURFER ACCESS The preference for the articulated block mat is Armor Flex-coated riprap because windsurfers could then utilize the Armor Flex surface. Riprap with an Armor Flex overlay would also mitigate the potential for slumping and collapse phenomena as developed over the last few years in the existing structures (PWA, 2008). Local windsurfers and representatives from the board sports retail outlet were asked for their preferences regarding the number, location, and geometry of the access points. Three locations along the rock revetment will act as points of access for windsurfers (Figure 9). One access point will be located near the retail outlet with west and west-central access points, near the gravel rigging area behind the current promenade, where the majority of windsurfers launch. Having two westerly access points in the busiest windsurfing area will reduce the likelihood of windsurfers having to line up and could accommodate two directions simultaneously. On crowded days it may be possible to use the most westerly access for entry to the water and the west-central access for exit from the water. According to local windsurfers and the retail outlet an Armor Flex surface slope of 2(H):1(V) contiguous with the adjacent rock revetment, would be too steep. Hence, the slope of the Armor Flex surface and adjacent riprap will be 3(H):1(V) to allow safer access. Figure 10B presents a typical section at the Armor
Flex. The height of the access points at the promenade will be 11 feet NAVD, providing a flush transition with the promenade surface. In addition to a safer passage on to the access area, this will allow improved visibility of the ground ahead when a windsurfer is carrying the board and sail (generally the center of the board where the base of the sailing rig attaches is positioned directly in front of the windsurfer). The access points will be 20 feet wide (minimum), to accommodate two windsurfers without their boards hanging over the adjacent riprap. Preparation of the bedding foundation will be the same as for the rock revetment (Section 3.1). However, ¼ ton class armor will be placed on the filter fabric which will support a new layer of Armor Flex (Figure 10B). 3.3 RECONSTRUCTED PROMENADE Due to unavoidable damage during construction of the revetment and access points, the old promenade will be replaced. In keeping with its current elevation, the design elevation of the new promenade behind the rock revetment will be 11 feet NAVD. This will place the promenade at the same height as the windsurfer access ramps and approximately two feet below the elevation of the fronting revetment. The new promenade will be 15 feet wide for the most part with a short wider section at the junction with the eastern end of the eastern parking lot (Figure 9). This will provide a ‘waiting’ area for people crossing from the parking lot to the beach.
4.1 SHORELINE PLANFORM The preliminary design is to set back the eastern shoreline in the form of a crenulate-shaped bay between an artificial hard point close to the retail outlet and Coyote point headland. The preliminary design was guided by the conceptual design (PWA, 2008) (Figure 4) and by the desire to create a beach-shoreline orientation in dynamic equilibrium with wave processes. The preliminary design comprises a sloping beach face, backed by a beach berm and a field of low dunes, with a new promenade skirting the back of the dunes (Figure 11). The upcoast hard point for the bay will be a breakwater comprising an easterly extension of the existing revetment design for the western shoreline (Section 3). The design length of the breakwater will be 85 feet from its tip to the point of connection with the revetment. The design planform shape of the bay was constructed using the parabolic bay shape equation of Silvester and Hsu (1997).
Rn/Rβ = 0.81β0.83 / θn0.77
Parameter β is the angle between the incident wave crest (assumed linear) and the control line (Rβ), which joins the upcoast hard point to the downcoast hard point. The radius Rn to any point on the bay periphery in static equilibrium is angled θn from the same wave crest line radiating out from the upcoast point. Once the two basic parameters, β and Rβ are known, values for pairs of Rn and θn are calculated for a bay in equilibrium under the same wave approach direction. The idealized bay planform was constructed from this formula using a control line length of 780 feet (the straight line distance from the tip of the breakwater to the west side of the headland) and an incident wave crest angle of 11o. The methodology used to calculate the incident wave crest angle is discussed in PWA (2008). The planform line constructed for the bay represents the proposed junction between the dunes and the new promenade (Figure 11). At the western end of the bay, the planform line impinges with the connecting point of the breakwater and revetment to its west. At the eastern end the planform line impinges with the point where the headland starts to protrude out into the bay. The maximum distance of this line from the existing shoreline (the seaward edge of the promenade) is 170 feet, across the current lawn area between the eastern parking lot and the retail outlet. Although mean sea level or mean tide level could be used as the datum for the planform line, the use of either of these datums would lead to a crenulate bay requiring excavation much further into the park, with loss of additional lawn area and parking lot.
4.2 SHORELINE CROSS-SECTIONAL PROFILES Even though a wide variety of troughs and ridges (berms, ridges and runnels, longshore bars) may be present on any beach profile, and the profile may change seasonally due to changes in wave climate, the most important morphological feature is the average slope between the seaward and landward limits. The backshores of many beaches usually possess a flat-topped ridge or bar known as the berm that forms at the limit of typical winter wave runup. Hence, the design cross-sectional profile of the crenulate bay-beach will comprise two main components; the elevation and width of the backshore berm and the slope of the foreshore (Figure 12). We have also added a further design feature of low dunes between the beach berm and the start of the promenade. It is possible that dunes were present at the back of the 19th century beach before land reclamation took place (PWA, 2008). 4.2.1 Dunes/Beach Berm The sand dunes are intended to provide an aesthetic and also a volume of sand to mitigate the extent of erosion. During erosion events, waves will erode the dunes and nourish the fronting beaches. When there is sufficient wide, dry beach and onshore winds, finer sands will be carried landward by the winds to nourish the dunes. A natural dune typically covers a wider area extending farther inland. Since there is not enough space for a wider dune field, we have opted for a narrow line of dunes. This unnatural configuration can be expected to erode over time, and require sand placement and planting to maintain. Also, without plants to stabilize the dunes, the sand will be blown inland by prevailing and storm winds, possibly causing a nuisance. Erosion control fabric, access limitations, planting and irrigation are probably necessary to stabilize the dunes. In order to select the elevation of the dunes and beach berm we have used the runup calculations of Schaaf and Wheeler Consultants (2006) for the Bayfront Levee Improvement project immediately to the west of our study frontage (Appendix A). They estimated the 100-year wave runup (maximum wave runup plus tidal elevation) of 9.5 feet NGVD (or 12.2 feet NAVD). We selected a nominal dune crest elevation of 12 feet NAVD, to provide a temporary barrier to extreme wave runup. It should be noted that this project is not intended to provide flood protection and a lower dune elevation may be desried for other reasons, such as views and reduced maintenance of planting. The nominal dunes base width will be 15 feet wide at a minimum (Figure 12). Immediately seaward of the sand dunes, an approximately 50 foot wide beach berm will slope downward from an elevation of 10 feet NAVD adjacent to the dunes to elevation 8 feet NAVD. The beach berm elevation estimate is based on the beach forming runup with a return period of one to five years. FEMA considers parts of the site to be within the 100-yr coastal flood plain (see PWA, 2008; Appendix A). This project is not intended to reduce flood risk. Rather, consistent with the City of San Mateo’s flood management plan, the 100-year wave runup will inundate the park up to a proposed new earth berm. This shoreline realignment project will generate earth which may be suitable for this new berm.
4.2.2 Foreshore The design foreshore seaward from the edge of the berm will vary in slope from west to east, sloping down from 8 feet NAVD to the existing 6 foot NAVD contour. Across the widest part of the bay (west) the slope will be approximately 60(H):1(V) and approximately 25(H):1(V) on the east end of the bay (Figure 12). This slope connects the seaward edge of the berm to the existing beach. An optional additive portion of new beach shown in Figure 12 connects the new foreshore with the existing break in slope at approximately 0 feet NAVD (this is approximately the sand-mudflat interface). A benefit of performing the optional additive section is to remove pilings and other debris located on the existing beach. Details on the exact limits of excavation will be determined in subsequent levels of design. Regardless, we anticipate that over time the beach slope will equilibrate to adjust to the dynamic conditions. Towards the headland the beach face slopes will gradually steepen as the break in slope progresses closer to the shoreline, while the west end of the beach will remain relatively flat. 4.2.3 Potential Fluctuations due to Sea-Level Rise One of the most important long-term concerns for the Coyote Point frontage is the physical response of the shoreline to future sea-level rise. Predicting potential shoreline recession is critical to the design. An approximate quantitative approach for predicting shoreline response to sea-level rise is to multiply the estimated amount of sea-level rise by the ratio of the foreshore width to foreshore height (Bruun, 1962; Everts, 1985).
SXYR =
where R = recession rate, Y = horizontal dimension of foreshore, and X = vertical dimension of foreshore, and S = sea-level rise. In the Phase 1 Conceptual Design Report (PWA, 2008), we recommended using a future relative sea-level rise of 0.5 feet in 50 years and 1.5 feet in 100 years, for planning purposes. A recent statement by the State of California Resources Agency recommends a ‘high-end’ estimate for global sea-level rise of 55 inches (about 4.6 feet) by 2100 and 16 inches (about 1.3 feet) by 2050, for planning purposes (CRA, 2008). In our design, the top of the foreshore (at its juncture with the beach berm) is eight feet NAVD and its slope is approximately 20(H):1(V) (Figure 12). Assuming a future relative sea-level rise of 0.5 to 1.5 feet in 50 years and 1.5 to 4.5 feet in 100 years, the corresponding estimates of shoreline recession would be approximately 10 to 30 feet in 50 years (average 20 feet) and approximately 30 to 90 feet in 100 years (average 60 feet). Shoreline recession rates would be approximately 0.2 to 0.6 ft/year averaged over 50 years and approximately 0.3 to 0.9 ft/year averaged over 100 years. Given our design width for the beach berm is 50 feet, would suggest a gradual reduction in the width of this feature over 50-year timescales, and the potential for loss of this feature and erosion of the backing
dunes, over 100-year timescales. Further beach nourishment would be required to maintain the width of the beach berm at 50 feet, in the light of future sea-level rise. 4.2.4 Design Uncertainty Although we have used established methods to provide a preliminary design, there are inherent uncertainties in some of the input parameters and the resulting equilibrium configuration. The largest uncertainty is the potential for changes in beach profile caused by storm waves and seasonal changes in wave direction. Winds from the north and northeast are responsible for generating the most extreme wind-wave conditions because of the relatively long fetch (PWA, 2008). Given the orientation of the crenulate bay planform, waves from the north have the potential to induce greater alongshore sediment transport, creating lateral shifts in the equilibrium beach profile shape. During the winter months, high-energy storm waves move sand offshore where it may form a nearshore bar, and in the process steepening and narrowing the beach profile. As high-energy wave conditions subside in late spring and early summer, the beaches recover as sand is moved onshore to rebuild the beach berm, which flattens and widens the beach profile. At the end of the summer and early fall when typically calm seas occur, the berm will be well developed, reaching its peak width. A further uncertainty relates to the potential for sediment leakage to the east around Coyote Point headland. Although the crenulate planform shape is designed to minimize sediment transport in the bay, it is possible that due to variations in sediment supply and wave direction, the system may not be completely closed. PWA (2008) indicated that sediment supply from the west is limited and would not be sufficient to replace any sediment lost from the east. It may therefore be necessary to re-nourish the beach at intervals to restore lost sediment. 4.3 EXCAVATION FOR SHORELINE REALIGNMENT 4.3.1 Composition and Quantities of Excavated Fill The site will be excavated to a depth of three feet below the design grade. Given the present site grade, this will amount to approximately 27,300 cubic yards of fill. The geotechnical investigation shows that the fill is likely to be composed of a mixture of gravelly clay, clay, and clayey sand. However, it is probable that the site has lateral heterogeneity and the composition of the boring is no guarantee of the composition of the fill elsewhere across the site. 4.3.2 Disposal of Fill The shoreline realignment entails excavation and off-haul or re-use of the fill. Some of the fill could be used as core for the new breakwater at the western end of the bay. The remaining excess soil will be the contractor's property for legal disposal off-site, including any soil sampling and testing that is required, with the option that the County could modify the contract to place soil on-site and/or conduct testing themselves. There is a possibility that the City of San Mateo may want the soil for a coastal flood
protection project which includes levees on either side of the park on City property and a low berm on the park inland of the shore. 4.4 DUNE AND BEACH NOURISHMENT The present beach is comprised of sediment with a median particle size of approximately 0.5 mm. We consider this size to be larger than is required to successfully nourish the beach for the reasons given in Section 2.2, and a preferred particle size of 0.3 mm is recommended at this stage. To nourish the beach to the design grade would require approximately 20,000 cubic yards of sand. Dunes will be built-up using sand of the appropriate particle size; generally the same or finer than the beach sands. Dune restoration will likely have a construction sequence that entails the following components. Sand will be imported to fill the landward part of the excavated area to 12 feet NAVD in front of the promenade revetment. The dunes will be sculpted to create a ‘natural’ look. They will then be planted with native vegetation to stabilize. 4.5 PROMENADE In keeping with its current elevation, the design elevation of the majority of the new promenade (apart from the eastern extremity) around the back of the bay will be at 11 feet NAVD. This will place the promenade approximately one foot below the elevation of the fronting dunes and one foot above the elevation of the top of the beach berm. A one foot high curb (or partially buried Caltrans K-Rail) will be positioned along the seaward edge of the promenade to provide stability to the landward edge of the dunes. The curb will also allow for capture of landward transport of wind blown sand, reducing spillage of this sand on to the promenade. At the eastern end of the bay where the promenade is adjacent to the access road, it will slope upwards to the east to be contiguous with the elevation of the road. This slope will not exceed 5% to be conversant with American with Disabilities Act Accessibility Guidelines. The promenade will then slope downwards at less than 20(H):1(V) to a beach access point at the eastern extremity of the beach (Figure 11). 4.6 BREAKWATER The preliminary design of the breakwater considers a previous design for the Coyote Point Marina north breakwater dogleg trunk and head (Moffatt & Nichol and PWA, 1998). The design crest elevation will be 11 feet NAVD with a width of 15 feet in keeping with the width of the promenade. Selected excavated material or imported material may be used to construct an embankment to form the breakwater sub-grade. A bedding layer and filter fabric will be placed on top allowing for rough grading of the outer and inner slopes ¼ ton armor stone. The design will incorporate side slopes of 2(H):1(V) on both sides and at the tip.
4.7 PARKING LOTS AND ACCESS ROAD 4.7.1 Parking Lot Configuration Excavation of the crenulate-shaped bay will remove a large part of the east parking lot, and necessitates reconfiguration of the parking lot landscape and vehicle spaces. The layout of the lot will be changed to accommodate as many vehicles as possible within the space available. The number of vehicle spaces is reduced from 165 to 71, a reduction of almost 60% (Figure 11). The new spaces are realigned to be perpendicular with the orientation of the new promenade. Entry to the eastern parking lot will be directly opposite the access road to the Captain’s House. This entrance is approximately 100 feet from the original entry point, which will be demolished and replaced by a portion of the new promenade. The exit from the parking lot will remain unchanged. Up to six disabled parking spaces will be located at the northeastern corner of the parking lot enabling easy access on to the promenade. Because of the reduction in number of parking spaces in the east parking lot, additional parking is proposed to maintain the existing number of parking spaces. Four alternative parking locations have been identified.. A design of the additional parking alternatives is not included in this report. The four alternatives are as follows (also see Figure 13):
• Alternative 1 – Located at the existing site of the Castaways Restaurant, which has approximately 40 existing parking spaces. Use of this site would decrease the demand for additional parking to approximately 54 spaces.
• Alternative 2 – The flat area on the west side of the entrance road has capacity for approximately 35 new parking spaces.
• Alternative 3 – The flat area south side of Beach Road just north of the existing Rifle Range parking lot has capacity for approximately 50 new parking spaces.
• Alternative 4 – The raised earth fill area bordered by Airport Boulevard to the South, the Humane Society fence to the West, and the Bay Trail gently turning to the east and north. This site would be under the existing PG&E power lines and has capacity for approximately 40 new parking spaces.
A combination of the four alternatives would be sufficient to maintain the same number of existing parking spaces. Based on the cost of new parking provided in the cost estimate below, the additional cost of new parking will range from about $240,000 to $420,000. The lower estimate assumes the reuse of the existing parking provided in Alternative 1 at Castaways Restaurant. 4.7.2 Bioretention Swales The existing parking lot slopes from the northwest to the southeast, and a storm drain under the parking lot slopes away from the shoreline to the approach road. The drain inlets are mostly landward of the limits of excavation.
The design modifications proposed for the remaining east parking lot result in a functional lot, but also implement storm water pollution best management practices (BMPs). These BMPs involve grading and landscaping into bioretention swales to avoid direct runoff to storm drains and the Bay. Three bioretention swales will be installed, one at the southern border of the parking lot, and one either side of the entrance on the eastern border of the parking lot (Figure 11). The swales will be a maximum of 10 feet wide and in vertical section will follow the guidelines in the California Stormwater BMP Handbook (2003) and the San Mateo County’s Sustainable Green Streets and Parking Lots Design Guidebook (2009). Runoff at the southern and eastern sides of the lot will be captured and filtered through the bioretention media and captured in an underground perforated pipe before reaching an outlet to the drainage system adjacent to the approach road. 4.7.3 Modification of Access Road The eastern end of the main access road adjacent to the promenade will be modified to incorporate a turn-around and drop-off point (Figure 11). This design feature will lead to loss of an additional 11 parking spaces. 4.7.4 Lighting The new parking lot configuration will include eight new lights (Figure 11). The performance specification/design build for the light standards will be determined with assistance from a County of San Mateo electrical expert. 4.8 BEACH ACCESS Access to the eastern beach will be at five points along the promenade. Access Point 1 is at the eastern end of the promenade before it starts to climb upwards around Coyote Point headland. Here, access is directly on to the beach from the promenade without the need to cross sand dunes. Access Point 2 is located at the eastern end of the eastern parking lot. The access point is adjacent to disabled parking spaces and crosses the sand dunes to the beach. Access Point 3 is located at the western end of the eastern parking lot, and crosses the sand dunes to the beach. Access Point 4 is off the promenade and crosses the dunes mid-way between the eastern parking lot and the retail outlet. Access Point 5 is off the promenade and crosses the dunes close to the retail outlet and upcoast breakwater. 4.9 LANDSCAPE PLANTING The perimeter of the site will be graded to match the existing lawn and pavement grades.
4.10 DEMOLITION Four main infrastructure components will require demolition. Approximately 1,900 linear feet of promenade, 74,700 square feet of asphalt paving as part of the eastern parking lot, the rest rooms at the eastern end of the promenade, and approximately 10 lights will be demolished or salvaged.
5. ENGINEER’S ESTIMATE OF LIKELY CONSTRUCTION QUANTITIES AND COSTS
Table 2 presents the preliminary estimate of construction quantities and costs. The estimate is divided into six main categories: mobilization, site preparation and demolition, new promenade, new shoreline revetment, new beach area, and new parking area. We assumed that the construction will be completed in two phases:
Costs were split into two phases assuming that the construction of Phase 2 starts at the end of Phase 1 construction. However, in reality there might be a significant lag between phases which will require additional work which was not considered here, such as transitions from new to existing features, drainage, and demolition. Also the existing promenade in the eastern section is not fully serviceable and hence may require partial reconstruction or closure if Phase 2 is delayed. This suggests that the cost for Phase 1 might increase if Phase 2 is not constructed shortly after. These estimates are subject to refinement and revisions as the design is developed in future stages of the project. Table 2 does not include estimated project costs for permitting, design construction, monitoring and/or ongoing maintenance. Estimated costs are presented in 2009 dollars, and would need to be adjusted to account for price escalation for implementation in future years. This opinion of probable construction costs is based on: PWA’s previous experience, bid prices from similar projects, consultation with contractors/suppliers, and R.S Means 2007 edition. These cost estimates are intended to provide an approximation of total project costs appropriate for the preliminary level of design. These cost estimates are considered to be approximately -15% to +30% accurate, and include a 25% contingency to account for project uncertainties (such as final design, permitting restrictions and bidding climate). These estimates are subject to refinement and revisions as the design is developed in future stages of the project. Please note that in providing opinions of probable construction costs, PWA has no control over the actual costs at the time of construction. The actual cost of construction may be impacted by the availability of construction equipment and crews and fluctuation of supply prices at the time the work is bid. PWA makes no warranty, expressed or implied, as to the accuracy of such opinions as compared to bids or actual costs.
Table 2. Engineers Estimate of Likely Construction Quantities and Costs Phase 1 - Western Shoreline Improvements Phase 2 - Eastern Shorelien Improvements Total (Phases 1 and 2)
Item Quantity Unit Unit Price Cost Quantity Unit Unit Price Cost Quantity Unit Total Mobilization $80,000 $125,000 $205,000
Mobilization 1 LS $80,000 $80,000 1 LS $125,000 $125,000 2 LS $205,000 Site Preparation/Demolition $57,250 $143,450 $200,700
Shoreline Revetment 950 LF $50 $47,500 350 LF $50 $17,500 1300 LF $65,000Buildings 1 EA $8,000 $8,000 1 EA $8,000Parking Lot 74,700 SF $1 $74,700 74700 SF $74,700Trail 950 LF $5 $4,750 950 LF $5 $4,750 1900 LF $9,500Lawn 67,000 SF $0.50 $33,500 67000 SF $33,500Miscellaneous 1 LS $5,000 $5,000 1 LS $5,000 $5,000 2 LS $10,000
Excavation / Local Fill 27,300 CY $20 $546,000 27300 CY $546,000Sand Fill and Grade 20,000 CY $20 $400,000 20000 CY $400,000Dune Planting 0.4 AC $5,000 $2,000 0.4 AC $2,000
New Parking $0 $317,500 $317,500
Grading 38,600 SF $0.50 $19,300 38600 SF $19,300AC Paving 38,600 SF $4 $154,400 38600 SF $154,400Striping 2,800 LF $1 $2,800 2800 LF $2,800Drainage Bioswales 500 LF $200 $100,000 500 LF $100,000Curbs 2,100 LF $10 $21,000 2100 LF $21,000Lighting 10 EA $2,000 $20,000 10 EA $20,000
Subtotal $1,010,250 $1,565,450 $2,575,700Contingency 25% of subtotal $252,600 25% of subtotal $391,400 25% $644,000Total $1,262,850 $1,956,850 $3,219,700
BCDC (San Francisco Bay Conservation and Development Commission). 1988. Sea level rise:
predictions and implications for San Francisco Bay. Bruun, P. 1954. Coast erosion and the development of beach profiles. U.S. Army Corps of Engineers,
Beach Erosion Board Technical Memorandum, 44. Bruun, P., 1962, Sea-Level Rise as a Cause of Shore Erosion, Journal of the Waterways and Harbors
Division, ASCE, Vol. 88, No. WW1, Proceedings Paper 3065, pp. 117-130, February 1962. California Stormwater BMP Handbook (2003) CRA, 2008, Letter to Governor Arnold Schwarzenegger from Phillip L. Isenberg regarding recommended
levels of sea level rise for 2050 and 2100, March 24, 2008. Dean, R.G. 2002. Beach Nourishment Theory and Practice. Advanced Series on Ocean Engineering, 18,
World Scientific Publishing, River Edge, New Jersey, 339pp. Everts, C. H., 1985, Sea Level Rise Effects on Shoreline Position, J. Waterway, Port, Coastal and Ocean
Eng., ASCE, Vol. 3, pp. 958-999. FEMA (Flood Emergency Management Agency). 2001. FIRM Flood Insurance Rate Map. City of San
Mateo, California. County of San Mateo. IPCC (Intergovernmental Panel on Climate Change). 2007. Climate Change 2007: The Physical Science
Basis. Summary for Policymakers. Moffatt & Nichol. 1992. Coyote Point Marina: Breakwater Renovation Study. Final Report prepared for
County of San Mateo, General Services Department, October 1992. Moffatt & Nichol and PWA (Philip Williams & Associates).1998. Coyote Point Marina Maintenance
Projects PreDesign Report. Final Report prepared for County of San Mateo Department of Public Works, August 1998.
Noble Consultants. 1999. Coyote Point Wave Runup. Letter Report to Church Water Consultants, June
1999. San Mateo County. 2009. Sustainable Green Streets and Parking Lots Design Guidebook.
PWA. 2008. Coyote Point Recreation Area Conceptual Design Report. Final Report prepared for County of San Mateo Parks and Recreation Department, April 2008.
Rahmstorf, S., 2007, A Semi-Empirical Approach to Projecting Future Sea-Level Rise, Science,
315(5810), pp. 368-370. Schaaf and Wheeler Consultants. 2006. Wind-Wave Hazard Analysis. Additional data to support
CLOMR request for City of San Mateo, California Bayfront Levee Improvements Case No: 03-09-1660R.
Silvester, R. and Hsu, J.R.C. 1997. Coastal Stabilization. World Scientific Publishing Co., Singapore,
578pp. Wiegel, R. L., 1964, Oceanographical Engineering, Ed. Richard Skalak, Fluid Mechanics, Prentice Hall,
Figure 1. Site Location Map Figure 2. Coastal Frontage Figure 3. Site Photographs Figure 4. Preferred Conceptual Alternative Figure 5. Location of Borings, CPTs, and Beach Sediment Samples Figure 6. Idealized Subsurface Profiles Figure 7. Cumulative Particle Size Distribution Curves of Modern Beach Sediment Figure 8. Equilibrium Beach Profiles and Existing Conditions Transects Figure 9. Plan View of Proposed Western Shoreline Improvements Figure 10. Typical Sections at Revetment (A) and Windsurfer Access (B) Figure 11. Plan View of Proposed Eastern Shoreline Improvements Figure 12. Cross-sections Across the Crenulate Bay Figure 13. Additional Parking Alternatives
figu
re 1
Coyo
te P
oint
Rec
reat
ion
Area
Coyo
te P
oint
Recr
eatio
n A
rea
San
Fran
cisc
oIn
tern
atio
nal A
irpor
t
Site
Loc
atio
n M
ap
#1876 Report/figures
N
Sour
ce: N
OAA
Coa
st Su
rvey
, Jul
y 19
95
Note
: Con
tour
s are
feet
bel
ow m
ean
lowe
r low
wat
er.
Mills C
reek
Easton
Cree
k
Sanc
hez C
reek
figu
re 2
Coyo
te P
oint
Rec
reat
ion
Area
Coa
stal
Fro
ntag
e
#1876 Report/figures
Coy
ote
Poin
tR
ecre
atio
n Ar
ea
Coy
ote
Poin
t(P
oint
San
Mat
eo)
Anim
al R
escu
e C
ente
r
Ret
ail O
utle
tEa
st P
arki
ng L
ot~1
65 s
pace
s(1
.5 a
cres
)
Wes
t Par
king
Lot
~170
spa
ces
(1.5
acr
es)
Prom
enad
eR
etai
ning
Wal
l
Res
troom
Arm
or F
lex
Unp
rote
cted
Rip
rap
Bay
Trai
l
Sour
ce o
f pho
to: H
JW G
eosp
atia
l flig
ht F
ebru
ary
17, 2
007
figu
re 3
D -
Bed
rock
(P
oint
San
Mat
eo)
C -
Arm
or F
lex
B -
Rip
rap
A -
Col
laps
ed p
rom
enad
e cu
rb
Coyo
te P
oint
Rec
reat
ion
Area
Site
Pho
togr
aphs
#1876 Report/figures
f i g u r e 4Coyote Point Recreation Area
Preferred Conceptual Alternative
#1876 R
eport
/fig
ure
s
setbackeastern shoreline
board sportsretail outlet
maintain structures
Idealized Subsurface Profiles
PWA Ref# 1876.02Source: Treadwell&Rollo #4594.01
f igure 6Coyote Point Recreation Area
C:\LouisWhite\MATLAB\coyote\sand_plot_v2.m
10-2 10-1 100 1010
20
40
60
80
100
Particle Size, mm
% F
iner
by
wei
ght
CP1CP2CP3
10-2 10-1 100 1010
20
40
60
80
100
Particle Size, mm
% F
iner
by
wei
ght
CP4CP5CP6
10-2 10-1 100 1010
20
40
60
80
100
Particle Size, mm
% F
iner
by
wei
ght
CP7CP8CP9
10-2 10-1 100 1010
20
40
60
80
100
Particle Size, mm
% F
iner
by
wei
ght
CP10CP11CP12
NB. Curves represent particle size of modernbeach sediment with the >4.7mm fraction removed.
Cumulative Particle Size Distribution Curves of Modern Beach Sediment
PWA Ref# 1876.02
f igure 7Coyote Point Recreation Area
Source: Existing condition transects (T1-T4) PWA Survey, March 27, 2007
Equilibrium Beach Profiles and Existing ConditionsTransects
This Appendix contains extracts from PWA (2008) describing the physical processes at the Coyote Point Recreation Area coastal frontage. 19th and 20th Century History In the mid to late 19th century the site of Coyote Point Recreation Area formed the northern extreme of an extensive area of salt marsh stretching south along the western shore of south San Francisco Bay (Figure A1). Point San Mateo formed an ‘island’ surrounded by Bay waters on its north and east sides, and backed by this salt marsh on its west and south sides. Between the hinterland to the west and Point San Mateo, the salt marsh was approximately 2,000 ft wide. The salt marsh was likely a marsh plain at elevations near mean higher high water. The northern edge of the salt marsh was fronted by a beach, the antecedent of the present beach, and possibly some low dunes between the beach and the marsh. Beginning in the late 19th century the salt marsh in the lee of Point San Mateo was reclaimed from the Bay to create agricultural land. An embankment was constructed that stretched from the southern tip of the headland, south to beyond the mouth of San Mateo Creek and around the city limit of San Mateo at that time. This effectively stopped tidal inundation of the entire salt marsh behind Point San Mateo. The remnant creeks remained transecting the low-lying reclaimed area. The low-lying partly reclaimed, but still wetland plain was effectively the landscape in 1922 when Pacific City Amusement Park was constructed on the reclaimed surface adjacent to the north shore, west of Point San Mateo. Two of the parks main attractions were a boardwalk at the top of the beach and a pier stretching out into the Bay from the central section of the beach (Figure A2). In order to make the beach attractive to visitors, around 2,000 tons of sand from Monterey was used to nourish the beach. Much of this sediment has now been lost, presumably offshore or to the east around Point San Mateo. In 1940 San Mateo County Parks and Recreation Department purchased 727 acres at Coyote Point, around 329 acres of which was subtidal. Except for the beach used by swimmers, park development was not immediately undertaken. Between the purchase and development of the land as a park, the majority of the Recreation Area was filled with imported material. To counter long-term erosion of the beach and frontage, sand nourishment took place between the 1960s and 1980s. In the 1960s, sediment was imported from the construction of Highway 101. However, it is believed the particle size of the sand was too fine and it was soon lost from the beach. In the 1970s and 1980s, a mix of pea gravel, sand and Bay mud was used to counter loss of the beach. In the 1990s the coastal structures were constructed at the top of the beach. Today, local windsurfers note that the piles supporting the old Pacific City boardwalk have historically been covered by beach sediment. However, over the last two years, the piles have become exposed and their tops are now sitting a few feet proud of the beach surface. This lowering of the beach has likely contributed to the undermining of the structures by allowing higher wave energies to impinge at their
bases. In addition, lowering of the beach has exposed the underlying substrate at the top of the beach along its eastern section. Bathymetry The bathymetric contours of the San Francisco Bay offshore from Coyote Point Recreation Area are generally aligned northwest-southeast, parallel to the main subtidal channel of the South Bay (Figure 1). As the shoreline is approached the contours bend into a west-northwest alignment sub-parallel to the shoreline orientation. The contours close inshore must bend further into an east-west alignment to parallel the local Coyote Point Recreation Area frontage. Water depths in the main channel north and northeast of Coyote Point reach up to -35 ft mean lower low water (MLLW). Across the shallower subtidal zone west of the channel, water depths shallow from -15 ft MLLW approximately two miles northeast of Coyote Point to -6 ft MLLW approximately one mile offshore. Topography The elevations of key structures at Coyote Point are presented in Table A1. Table A1. Elevations of Key Structures Site Feature Elevation (ft NAVD 88) Top of beach (west) 4.2-4.6 Top of beach (center) 6.0-6.6 Top of beach (east) 7.8-9.8 Promenade (seaward edge) 10.3-11.0 Promenade (landward edge) 10.7-11.3 Open grassland 5.8-18 East car parking lot 8.3-11 West car parking lot 9-11 Restrooms footing 13.2-13.4 Kite and windsurfing retail outlet footing 12.4-12.9 Animal rescue center 8.2-8.9
Beach The beach transects show that the general morphology of the beach is consistent from east to west, comprising a steeper upper beach (foreshore) and a shallower subtidal lower portion; the boundary marked by a break in slope. However, the beach dimensions vary in an east-west direction. The beach narrows from approximately 140 ft its eastern end (between the top of the beach and the break in slope) to approximately 50 ft at its western end (Table A2). The height of the top of the beach lowers from approximately 9.8 ft NAVD at the eastern end to 4.2 ft NAVD at the western end. The break in slope is higher at the western end (approximately 0.5 ft NAVD) than the eastern end (-0.8 ft NAVD). However, the beach gradients along the entire frontage are generally consistent between 1:15 and 1:13 (Table A2).
The beach transects allow us to divide the beach at Coyote Point Recreation Area into three general east-west sections. The eastern portion, in the lee of the headland, is higher (7.8-9.8 ft NAVD at the top) and wider (120-140 ft) between the promenade curb and the break in slope. The central section of beach reaches an elevation of approximately 6.0 to 6.6 ft NAVD at the collapsed curb and is approximately 100 ft wide. The western section of upper beach, fronting the riprap and Armor Flex, is the lowest and narrowest section, with a top height of 4.2 to 4.6 ft NAVD and a width of 50 to 70 ft. In general, an extension of the beach slope inland would result in a shoreline retreat of approximately 50 ft. The eastern end (transect 1) is the exception with the promenade extending only about ten feet seaward of the potential beach surface. Structures and Promenade The asphalt surface of the promenade has elevations between 10.3 and 11.3 ft NAVD. The coastal structures (rock riprap, Armor Flex articulated block mat, reinforced concrete) drop down from these elevations to the elevation of the beach immediately in front of them. Recreational Area The open grassed areas occupy the central part of the Recreation Area and vary in elevation from to 5.8 to 18 ft NAVD. The lowest point adjacent to the promenade is at approximately 11.2 ft NAVD, landward of which is lower-lying ground down to 8.2 ft NAVD. The asphalt surface of the east car parking lot slopes from north to south from approximately 11 ft NAVD at the promenade to 8.3 ft NAVD at its southern tip. The west car parking lot is generally slightly lower than the adjacent promenade and varies in elevation from approximately 9 to 11 ft NAVD. The restrooms and retail outlet are slightly raised above the surrounding profile, with their bases at approximately 12.4 to 13.4 ft NAVD. The grounds along the eastern side of the animal rescue center are at elevations between 8.2 and 8.9 ft NAVD, slightly lower than the surrounding terrain. Tidal Water Levels
The Bay-side shoreline of San Mateo County experiences mixed semidiurnal tides, with two high and two low tides of unequal heights each day. In addition, the tides exhibit strong spring-neap tide variability; spring tides exhibit the greatest difference between high and low tides while neap tides show a smaller than average range. The NOAA tidal datums for the 1983-2001 epoch for the west side of San Mateo Bridge are summarized in Table A3. The mean tidal range (defined as Mean Low Water minus Mean High Water) is 5.9 ft and the diurnal range (defined as MHHW minus MLLW) is 7.7 ft. Table A3. NOAA Tidal Datums (1983-2001 Epoch) for San Mateo Bridge (West Side)
MLLW 0 -0.6 100-year coastal floodplain Parts of the Recreation Area are located within the 100-year coastal floodplain as determined by the Federal Emergency Management Agency (FEMA, 2001). FEMA (2001) estimated the 100-year coastal flood level (base flood elevation) to be at an elevation of 7 ft NGVD (approximately 9.7 ft NAVD) (we used VERTCON to convert from NGVD to NAVD). This level is lower than the lowest point along the promenade (10.3 ft NAVD) but higher than much of the grassed area and parking areas. Since the shoreline armoring is not certified to protect to the 100-year event, the shoreline is considered by FEMA to be in the floodplain. FEMA is expected to update the flood hazards within the next ten years. The City of San Mateo is pursuing a project to increase flood protection by raising Bay levee crest elevations. Their plan includes a raised berm across the Park to connect to City levees to the west (Schaaf and Wheeler Consultants, 2006). This element would require County action. Future Relative Sea-Level Rise IPCC (2007) reported climate change simulations (using a variety of atmosphere-ocean general circulation models and a suite of greenhouse gas emissions scenarios) that project global sea-level rise over the next century due to thermal expansion as the oceans warm and changes in ocean mass due to exchanges of water with glaciers, ice sheets, groundwater, or atmosphere. IPCC (2007) predicted a global average sea-level rise between 1990 and 2100 of 0.6-1.9 ft, although considerable uncertainty surrounds these values. For example, Rahmstorf (2007) used a linear semi-empirical relationship between observed rates of sea-level rise and global mean surface temperature for the 20th century to project higher rates of sea-level rise between 1.6 and 4.6 ft during the 21st century.
The rate of subsidence at Coyote Point has been estimated at 0.06 ft over the last 20 years, equating to 0.30 ft/century. This estimate is based on the average subsidence from three benchmark locations along Old Bayshore Highway (south of San Francisco Airport), surveyed by Towill, Inc. in October 1996. Based on historic benchmark elevation data, BCDC (1988) estimated a subsidence rate of 0.20 ft/century at the west side of San Mateo Bridge. Assuming a 0.20-0.30 ft/century rate of subsidence at Coyote Point, then combining global sea-level rise with the predicted subsidence rate, gives a future relative sea-level rise at Coyote Point of approximately 0.8 to 2.2 ft/century. For planning purposes, a relative sea-level rise of 0.5 ft in 50 years and 1.5 ft in 100 years will be used. Wind-Waves The predominant wind directions at San Francisco International Airport are from the west and northwest with wind speeds often exceeding 25 mph (Figure A3). Less frequent storm events with high wind speeds (in excess of 25 mph) often have a southerly or easterly component, though the north-facing Recreation Area frontage is relatively unaffected by wind-waves from these directions. Winds from the north and northeast, however, are responsible for generating the most extreme wind-wave conditions because of the relatively long fetch (Figure A4). The predominant northwesterly winds have a much shorter fetch length. Moffatt & Nichol (1992) Moffatt & Nichol and PWA (1998) used wind fetches, water depths and diffraction techniques to transform wave heights and periods from deep water to shallow water to estimate the wave characteristics at the Coyote Point Marina. They reported wave heights and periods of 3.3-3.9 ft and 4.2-4.6 seconds, respectively, for a return period of 25 years. These estimates apply to the Coyote Point Marina immediately east of the Coyote Point headland, and therefore are slightly higher than those associated with the more sheltered shoreline to the west. Noble Consultants (1999) compiled monthly wind velocity (speed and direction) data from San Francisco Airport between 1978 and 1998. Maximum annual wind speeds were compiled from the data ranging from 18 to 46 mph, with an average of 29.5 mph, over the 21 year period. They used a wind speed of 30 mph approaching the frontage from a northerly direction to calculate a wave height of 3.0 ft and a wave period of 4.0 s at the shore.
ENVIRONMENTAL AND GEOTECHNICAL CONSULTANTS 555 MONTGOMERY STREET, SUITE 1300 SAN FRANCISCO CALIFORNIA 94111 T 415 955 9040 F 415 955 9041 www.treadwellrollo.com
27 January 2009 Project 4594.01
Mr. David Brew Philip Williams & Associates, Ltd. 720 California Street, Suite 600 San Francisco, California 94108
Subject: Geotechnical Consultation Coyote Point Recreation Area Promenade San Mateo, California Dear Mr. Brew:
This letter report presents the findings and recommendations for the Phase 2 geotechnical study of the repair and restoration of approximately 1,500 feet of promenade and beach front at the Coyote Point Recreation Area in San Mateo, California. Treadwell & Rollo previously performed a Phase 1 preliminary study and submitted a letter report dated 20 April 2007. We understand a draft conceptual design report was submitted by Philip Williams & Associates (PWA) to the County of San Mateo Parks and Recreation Department dated April 2008.
This consultation is in fulfillment of our proposal dated 17 June 2008. In preparing this report, we have 1) reviewed the conceptual design report 2) discussed the project with you, 3) performed field exploration, and 4) reviewed geology maps and logs of borings by others1 at the project site vicinity.
PROJECT DESCRIPTION
The Coyote Point Recreation Area is operated by the San Mateo County Parks and Recreation Department and is located between U.S. Highway 101 and San Francisco Bay as shown on site location map, Figure 1. The area of interest to our geotechnical investigation is the shoreline on the northwestern boundary of the Recreation Area, west of the Coyote Point, as indicated on the Site Plan, Figure 2. The shoreline is currently surrounded by a beach and a promenade to the north, an asphalt paved parking lot to the east, a lawn to the south and a retail outlet to the west. Site grades of the lawn vary between Elevations 9 to 13 feet2. The parking lot is generally level at Elevation 10 feet.
The promenade was originally constructed to accommodate pedestrian traffic along the shoreline and to facilitate access to beach areas. It is an asphalt path along the crest of the shoreline and bordered on the water side by a short reinforced concrete wall. However, the eastern section of the promenade is not protected and has been significantly undermined by wave action. The concrete wall along the undermined section has collapsed and the asphalt pathway is beginning to fall away. We understand that the promenade experienced most of its deterioration during 2004-2005 storm events. In addition to the deterioration of the promenade, the beach has also been severely eroded.
Various alternatives have been proposed to repair and restore the existing promenade and beach and protect them from future erosion. After being reviewed by the San Mateo County and San Francisco Bay Conservation and Development commission (BCDC), a preferred alternative (Alternative 5 – set back the shoreline along the eastern side) was chosen for this project. This alternative will consist of creating a
1 Lowney Associates, “City of San Mateo Outboard Levee Improvements Project,” dated March 2003. 2 Elevation is based on North American Vertical Datum (NAVD 1998) and is referenced from drawing titled “site
plan” by PWA, dated 1 July, 2008.
Mr. David Brew Philip Williams & Associates, Ltd. 27 January 2009 Page 2 crenulate shaped bay to the east of the existing retail outlet. The additional space from the set back of the existing shoreline will become a new beach. The plan will include:
1) Importing at least 2 feet of sand to create a new beach. The new beach profile, consisting of a beach berm and foreshore slope, will have a gradient of approximately 20:1 (Horizontal: Vertical) into the Bay.
2) Demolishing part of the east parking lot for the new beach and removing 5 to 6 feet of existing fill and Bay Mud (if any),
3) Constructing a new promenade3 with a 3:1 slope revetment, it is approximately 80 feet wide at the base and 3 to 4 feet in height, it will be constructed using earth fill and covered with a new asphalt/cement pavement behind the beach berm.
In addition to the above, armoring will be designed to protect the new promenade against storms. However, the design of the armoring is not within of our scope of work.
SCOPE OF SERVICES
Our scope of services consisted of:
• defining the soil profile along the proposed shoreline through drilling of a boring, performing cone penetration tests (CPTs) and researching published information
• providing recommendations for site preparation and grading including criteria for fill quality and compaction
• providing recommendations for subgrade preparation for the new promenade
• commenting on construction considerations that could affect the project
FIELD INVESTIGATION
Boring by Treadwell & Rollo
We drilled one boring, designated as B-1, as indicated on Figure 2. Prior to drilling Boring B-1, we obtained the required permit from San Mateo County Health Department (SMCHD). To check that the boring location was clear of existing utilities, we contacted Underground Service Alert (USA) and retained a private utility locator.
The boring was drilled on the east parking lot. It was drilled on 13 October 2008, by Access Soil Drilling, Inc. of San Mateo, to a depth of approximately 25.5 feet below ground surface (bgs) using a portable Minuteman drill rig equipped with a 4-inch solid stem auger. Our field engineer logged the boring and
3 Design based on figure 15, schematic cross-shore section from coyote point recreation area conceptual design
report by PWA, Ltd, dated April 2008
Mr. David Brew Philip Williams & Associates, Ltd. 27 January 2009 Page 3 obtained representative samples of the soil encountered for visual classification and laboratory testing. The boring log is presented in Appendix A as Figure A-1. The material encountered was classified according to the soil classification system described on Figure A-2.
Soil samples were obtained using the following split-barrel samplers:
• Sprague and Henwood (S&H) sampler with a 3.0-inch outside diameter and a 2.5-inch inside
diameter, with 2.43-inch inside diameter liners
• Standard Penetration Test (SPT) sampler with a 2.0-inch outside diameter and a 1.5-inch inside
diameter, without liners.
The samplers were driven with a 140-pound, safety or downhole hammer falling about 30 inches. To account for sampler size and hammer energy, the blow counts required to drive the S&H and SPT sampler the final 12 inches of an 18-inch drive were converted to approximate SPT blow counts (N-values) using a conversion factor of 0.6 and 1.0, respectively, and are presented on the boring log.
Upon completion of drilling, the hole was backfilled using cement grout, as required by the SMCHD. The soil cuttings were left on site near the landscaping area.
Cone Penetration Tests (CPTs)
CPT-1 through CPT-3 were advanced to depths ranging from 27 to 27.5 feet bgs. John Sarmiento and Associates of Orinda, California, performed the CPTs on 13 October 2008 at the approximate locations shown on Figure 2. The CPT logs, showing tip resistance and friction ratio versus depth, as well as interpreted SPT N-values, are presented in Appendix B on Figures B-1 through B-3. The soil encountered was classified according to the classification chart described on Figure B-4.
The CPTs were performed by hydraulically pushing a 1.4-inch diameter, cone-tipped probe into the ground. The cone on the end of the probe measured tip resistance, and a sleeve behind the cone tip measured frictional resistance. These parameters were continuously measured by electrical gauges within the cone during the entire depth advanced. The data were transferred to a computer while conducting each test. Accumulated data were processed by computer to provide engineering information, such as the type and approximate strength characteristics of the soil encountered.
Boring by Lowney Associates
Lowney Associates performed the geotechnical investigation for the San Mateo County Levee project (Lowney Associates, 2003). Two borings were drilled in the vicinity of the proposed project designated as EB-21 and EB-22 to depths of about 50 feet bgs at the approximate locations as shown on the Site Plan, Figure 2. Logs of these borings were used to supplement information generated by our boring and CPTs and are included in Appendix C.
Mr. David Brew Philip Williams & Associates, Ltd. 27 January 2009 Page 4 SUBSURFACE CONDITIONS
Coyote Point (formerly known as San Mateo Point) was originally an island surrounded by salt marsh. In the 1800’s the marsh between the mainland and the island was filled in. A geologic map of the vicinity is attached as Figure 3 and shows the area that was filled, as well as currently existing beach deposits and rock outcrops.
Based on the results of the borings and CPTs, we developed two idealized subsurface profiles, section A-A’ and B-B’, as shown in Figure 4. The proposed new shoreline is underlain by 7 to 9 feet of fill consisting of medium stiff to stiff sandy clay and/or medium dense clayey sand with varying amounts of silt and fine to coarse gravels. The fill is underlain by either marine clay known as Bay Mud or medium dense sand (beach deposit) overlying Bay Mud. The sand layer is approximately 5 to 9 feet thick and becomes thicker to the east. This beach deposit is considered to be potentially liquefiable during a major earthquake event. The Bay Mud is approximately 5 to 9 feet thick below the fill and approximately 3 feet thick below the sand layer. However, Bay Mud was not encountered at Boring B-1. Underlying the Bay Mud is the interbedded medium dense to very dense clayey sand and very stiff to hard clay to the maximum depth explored (50 feet bgs).
Groundwater was measured in borings and CPTs at depths of approximately 6.5 to 8 feet bgs. These depths correspond to Elevation 2.5 and 6 feet, respectively. The groundwater measurements during our field investigation were made during dry season and were not stabilized. The groundwater level likely fluctuates with the tides; but since Bay Mud is virtually impervious, water level does not drop below the Bay Mud surface.
CONCLUSIONS AND RECOMMENDATIONS
On the basis of our investigation, we conclude the project is feasible from a geotechnical standpoint. The primary geotechnical issue is the presence of Bay Mud and potentially liquefiable soil which may settle during a major earthquake event. We judge the Bay Mud may experience approximately ¾ to 1½-inch of consolidation settlement due to placement of the new fill; however, most of it should occur during the construction of the promenade and therefore long-term settlement should be minor. In addition, we estimate the medium dense sand may settle ¾ to 1-inch during a major earthquake event. However, our settlement analysis is based on limited subsurface information and laboratory test results.
A detailed slope stability analysis was not part of our scope of services. However, we judge there could be some lateral movement of the promenade slopes should a major earthquake occur near the site.
Site Preparation and Grading
Areas to be improved should be stripped of concrete/asphalt pavement, loose surface soil, vegetation, and topsoil. Topsoil and organics may be stockpiled for later use elsewhere (e.g. landscaped areas), if approved by the architect.
Mr. David Brew Philip Williams & Associates, Ltd. 27 January 2009 Page 5 The surface exposed by stripping should be scarified to a depth of at least eight inches, moisture-conditioned to above optimum moisture content and compacted to at least 90 percent (95 percent for sand with less than 10 percent fines) relative compaction4. The exposed ground surface should be kept moist during subgrade preparation.
Materials to be used as fill and backfill should consist of imported soil that is free of organic matter; contain no rocks or lumps larger than four inches in greatest dimension. Imported fill, if needed, should also meet these criteria and have a low expansion potential as defined by a liquid limit (LL) of less than 25 and a plasticity index (PI) of 8 or less. Samples of imported material should be submitted to the geotechnical engineer for approval and testing at least 72 hours before delivery to the site. We judge that the excavated onsite soil is suitable to be used as backfill material provided it meets the requirements given above. However, Bay Mud is typically not recommended to be used as fill, because of its typically high moisture content.
All fill and backfill should be placed in lifts not exceeding eight inches in loose thickness, moisture-conditioned to near optimum moisture content, and compacted to at least 90 percent relative compaction. If the fill consists of on-site sand or imported sand or gravel with less than 10 percent fines (material passing the No. 200 sieve), it should be compacted to at least 95 percent relative compaction.
We should review and approve all sources of imported fill at least three days before use at the site. The grading subcontractor should provide analytical test results or other suitable environmental documentation indicating the imported fill is free of hazardous materials at least three days before use at the site. If this data is not available, up to two weeks should be allowed to perform analytical testing on the proposed import material. For earthwork calculations, we recommend a shrinkage factor of 10 percent be used for on-site soil.
Promenade
The promenade should be constructed in stages and compacted according to the criteria presented in the previous section. The promenade slopes should not be steeper than 2:1 (horizontal:vertical). Since the promenade is only designed for pedestrian traffic, no specific pavement design is required. However, we judge that at least 4 inches of Aggregate Base (AB) should be placed and compacted to at least 95 percent of relative compaction beneath 2 inches of asphalt.
GEOTECHNICAL SERVICES DURING CONSTRUCTION
During final design, we should be retained to consult with the design team as geotechnical issues arise. Prior to construction, we should review the project plans and specifications to check their conformance with the intent of our recommendations. During construction, we should observe site excavation, promenade subgrade preparation, installation, fill placement and compaction. These observations will allow us to compare the actual with the anticipated soil conditions and to check that the contractors’ work conforms to the geotechnical aspects of the plans and specifications.
4 Relative compaction refers to the in-place dry density of soil expressed as a percentage of the maximum dry
density of the same material, as determined by the ASTM D1557 laboratory compaction procedure.
Mr. David Brew Philip Williams & Associates, Ltd. 27 January 2009 Page 6 LIMITATIONS
The conclusions and recommendations presented in this letter result from limited subsurface investigation and engineering studies based on our interpretation of the existing geotechnical conditions. Actual subsurface conditions may vary. If any variations or undesirable conditions are encountered during construction, or if the proposed construction will differ from that described in this report, Treadwell & Rollo, Inc. should be notified to make supplemental recommendations, as necessary.
We trust this letter provides the information you require at this time. If you have any questions, please call.
Sincerely yours, TREADWELL & ROLLO, INC.
Timothy Chi-To Wong, P.E. #70430 Richard D. Rodgers, G.E.#732 Project Engineer Principal
45940102.RDR
Attachments: Figure 1 – Site Location Map Figure 2 – Site Plan Figure 3 – Idealized Geologic Cross Sections A-A’ and B-B’ Figure 4 – Geology map Appendix A – Figure A-1: Log of Boring B–1 Figure A-2: Classification Chart Appendix B – Figures B-1 through B-3: Cone Penetration Test Results Figure B-4: Classification Chart Appendix C – Boring Logs by Others
REFERENCES
Geologic Map of the Montara Mountain and San Mateo 7-1/2’ Quadrangles, San Mateo County, California, 1994.
Lowney Associates, boring logs from “City of San Mateo Outboard Levee Improvements Project,” dated March 2003.
Philip Williams & Associates, Ltd, “Draft Coyote Point Recreation Area Conceptual Design Report,” dated April 2008.
Treadwell & Rollo, Inc. Project No. 4594.01 “Geotechnical Consultation coyote Point Recreation Area Promenade, Phase 1,” dated 20 April 2007.
COYOTE POINT RECREATION AREA PROMENADESan Mateo, California
LEGEND:
Boring showing elevation of Franciscan bedrock (Mean Sea Level)
-443
APPENDIX A
13.0
14.3
21.2
15.5
16.5
23
7
6
27
SPT
S&H
S&H
S&H
S&H
S&H
S&H
CL
SC
CL
SP-SM
SC
3-inch Asphalt Concrete (AC)CLAY (CL)dark brown, stiff, moist, ocassional subangularto angular gravel up to 1/2", green mottlingsoil/gravel interfaceCLAYEY SAND (SC)dark brown, loose, moist, fine-grained sand
with 3-inch gravelSANDY CLAY with GRAVEL (CL)red-brown, medium stiff, moist, with organicsand fine to coarse gravel
SAND with SILT (SP-SM)olive gray, medium dense, wet, fine- tocoarse-grained sand
ocassional subrounded to subangular gravel upto 1/2-inch
CLAYEY SAND (SC)yellow brown, medium dense, wet, fine- tocoarse-grained sand
LL = 32, PI = 16
dense
13
8
13
19
16
23
40
467
1158
89
13
91120
101214
141919
263036
FILL
Sam
pler
Type
Sam
ple
Blo
ws/
6"
SP
TN
-Val
ue1
LITH
OLO
GY
DE
PTH
(feet
)
Dry
Den
sity
Lbs/
Cu
Ft
Type
of
Stre
ngth
Test
She
ar S
treng
thLb
s/S
q Ft
Fine
s%
Con
finin
gP
ress
ure
Lbs/
Sq
Ft
Nat
ural
Moi
stur
eC
onte
nt, %
See Site Plan, Figure 2
10/13/08
Solid Stem Auger
Logged by:
Hammer type: Safety
Sprague & Henwood (S&H), Standard Penetration Test (SPT)
Ground Surface Elevation: 10.5 feet2
Date finished: 10/13/08
Hammer weight/drop: 140 lbs./30 inches
Sampler:
K. SchmidtBoring location:
Date started:
Drilling method:
1
2
3
4
5
6
7
8
9
10
11
12
13
14
15
16
17
18
19
20
21
22
23
24
25
26
27
28
29
30
MATERIAL DESCRIPTION
LABORATORY TEST DATA
SAMPLES
Figure:A-1
PROJECT:
Project No.:4594.01
COYOTE POINT RECREATION AREA PROMENADESan Mateo, California
PAGE 1 OF 1Log of Boring B-1
TES
T G
EO
TEC
H L
OG
459
401.
GP
J T
R.G
DT
1/2
7/09
Boring terminated at a depth of 25.5 feet below groundsurface.Boring backfilled with cement grout.Groundwater encountered at a depth of 8 feet duringdrilling.
1 S&H and SPT blow counts for the last two incrementswere converted to SPT N-Values using factors of 0.6and 1.0, respectively to account for sampler type andhammer energy.
2 Elevations based on drawing titled "Site Plan", by PWAdated 1 July 2008.
Project No. FigureDate 4594.0112/30/08 A-2
CLASSIFICATION CHART
Major Divisions Symbols Typical Names
GW
GP
GM
GC
SW
SP
SM
SC
ML
CL
OL
MH
CH
OH
PTHighly Organic Soils
UNIFIED SOIL CLASSIFICATION SYSTEM
Well-graded gravels or gravel-sand mixtures, little or no fines
Poorly-graded gravels or gravel-sand mixtures, little or no fines
Silty gravels, gravel-sand-silt mixtures
Clayey gravels, gravel-sand-clay mixtures
Well-graded sands or gravelly sands, little or no fines
Poorly-graded sands or gravelly sands, little or no fines
Silty sands, sand-silt mixtures
Inorganic silts and clayey silts of low plasticity, sandy silts, gravelly silts
Inorganic clays of low to medium plasticity, gravelly clays, sandy clays, lean clays
Organic silts and organic silt-clays of low plasticity
Inorganic silts of high plasticity
Inorganic clays of high plasticity, fat clays
Organic silts and clays of high plasticity
Peat and other highly organic soils
Clayey sands, sand-clay mixtures
Range of Grain Sizes
Grain Sizein Millimeters
U.S. Standard Sieve Size
Above 12"
12" to 3"
Classification
Boulders
Cobbles
Above 305
305 to 76.2
Silt and Clay Below No. 200 Below 0.075
GRAIN SIZE CHART
SAMPLER TYPE
Co
arse
-Gra
ined
So
ils(m
ore
than
hal
f of s
oil >
no.
200
siev
e si
ze
Fin
e -G
rain
ed S
oils
(mor
e th
an h
alf o
f soi
l<
no.
200
sie
ve s
ize)
Gravels(More than half ofcoarse fraction >no. 4 sieve size)
Sands(More than half ofcoarse fraction <no. 4 sieve size)
Silts and ClaysLL = < 50
Silts and ClaysLL = > 50
Gravel coarse fine
3" to No. 43" to 3/4"
3/4" to No. 4
No. 4 to No. 200No. 4 to No. 10No. 10 to No. 40No. 40 to No. 200
76.2 to 4.7676.2 to 19.119.1 to 4.76
4.76 to 0.0754.76 to 2.002.00 to 0.4200.420 to 0.075
Sand coarse medium fine
C Core barrel
CA California split-barrel sampler with 2.5-inch outside diameter and a 1.93-inch inside diameter
D&M Dames & Moore piston sampler using 2.5-inch outside diameter, thin-walled tube
O Osterberg piston sampler using 3.0-inch outside diameter, thin-walled Shelby tube
S&H Sprague & Henwood split-barrel sampler with a 3.0-inch outside diameter and a 2.43-inch inside diameter
SPT Standard Penetration Test (SPT) split-barrel sampler with a 2.0-inch outside diameter and a 1.5-inch inside diameter
ST Shelby Tube (3.0-inch outside diameter, thin-walled tube) advanced with hydraulic pressure
SAMPLE DESIGNATIONS/SYMBOLS
Sample taken with Sprague & Henwood split-barrel sampler with a 3.0-inch outside diameter and a 2.43-inch inside diameter. Darkened area indicates soil recovered
Classification sample taken with Standard Penetration Test sampler
Undisturbed sample taken with thin-walled tube
Disturbed sample
Sampling attempted with no recovery
Core sample
Analytical laboratory sample
Sample taken with Direct Push sampler
Sonic
Unstabilized groundwater level
Stabilized groundwater level
Treadwell&Rollo
COYOTE POINT RECREATION AREA PROMENADESan Mateo, California


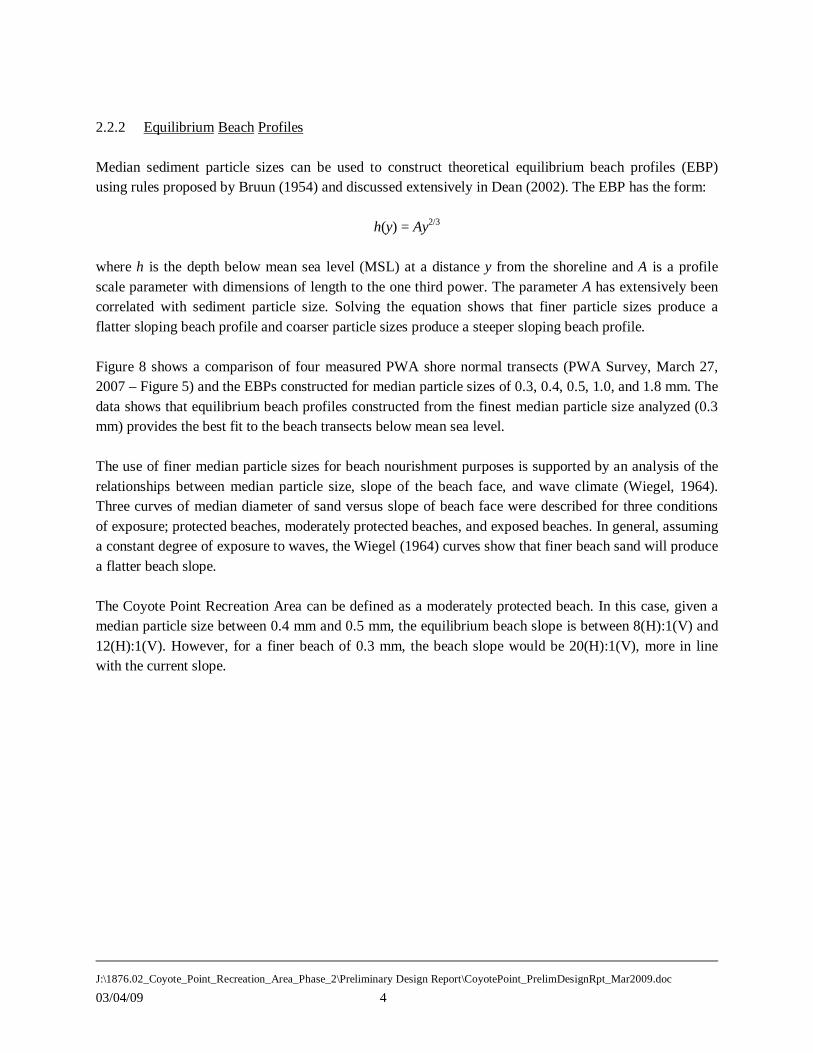
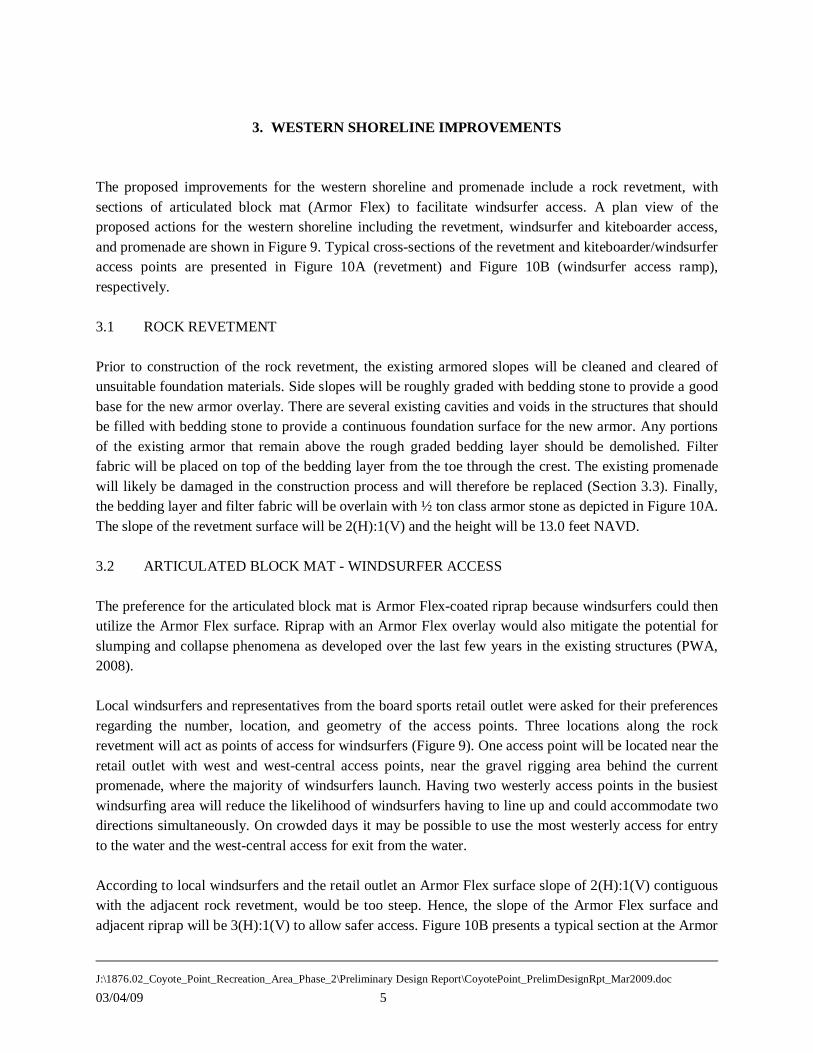
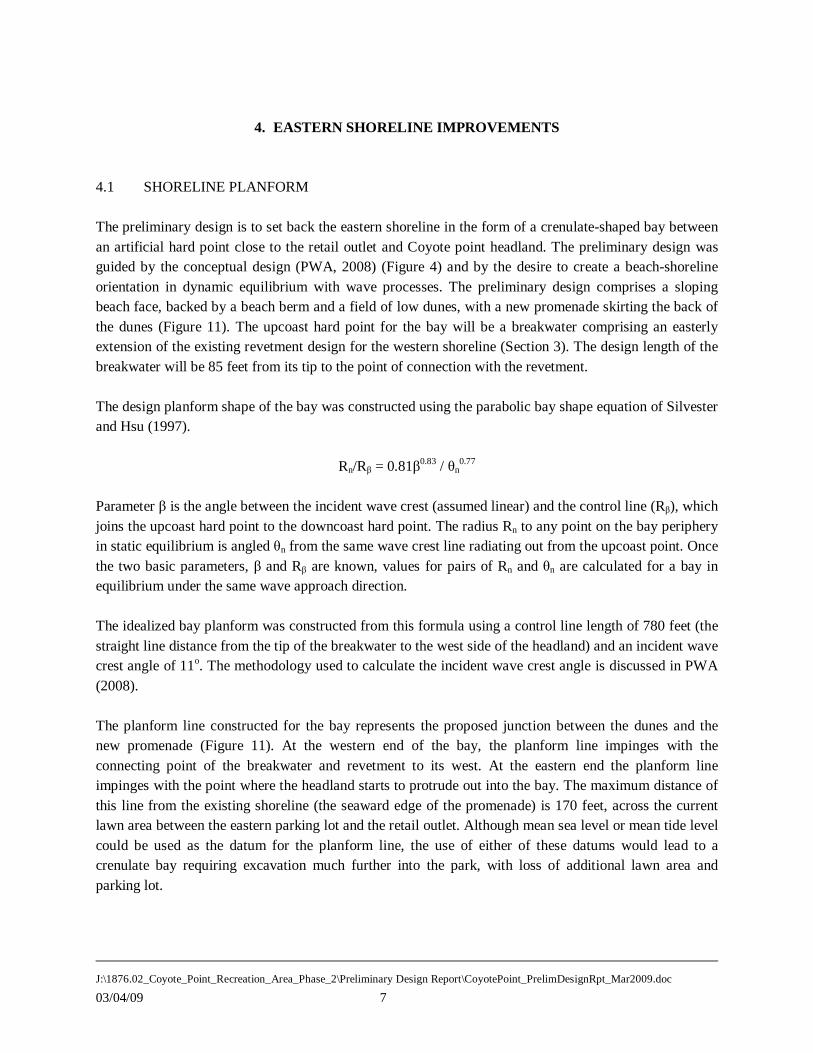
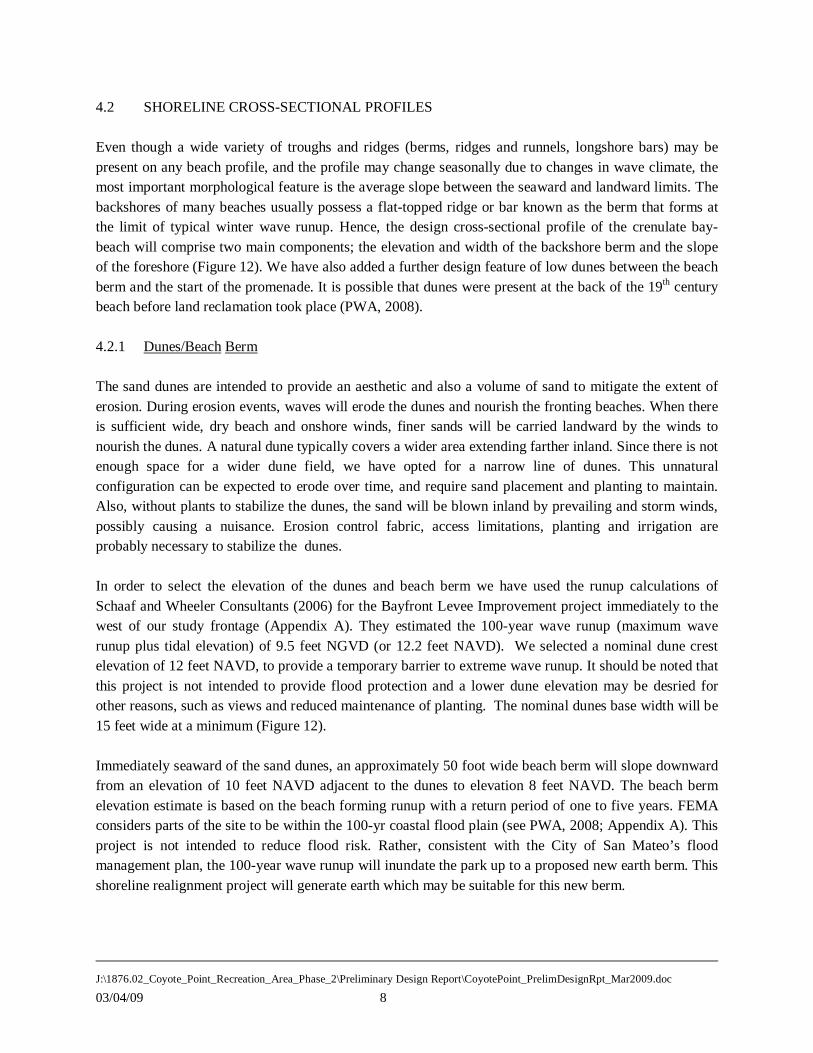


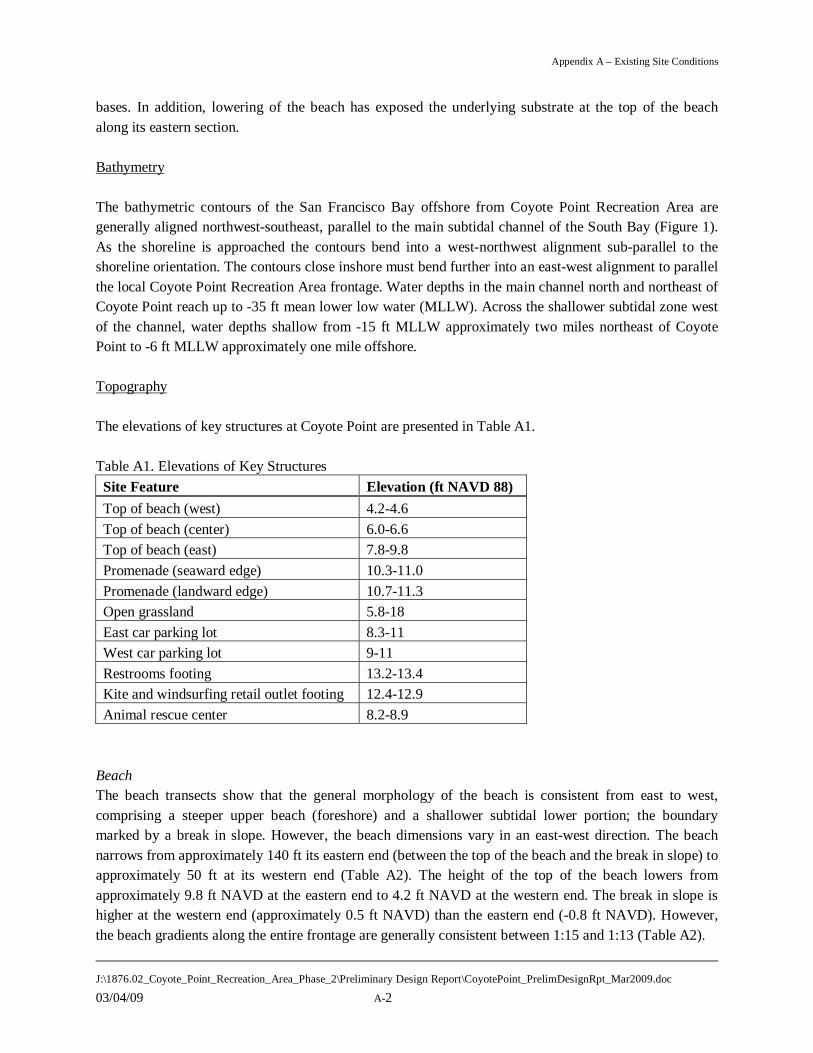
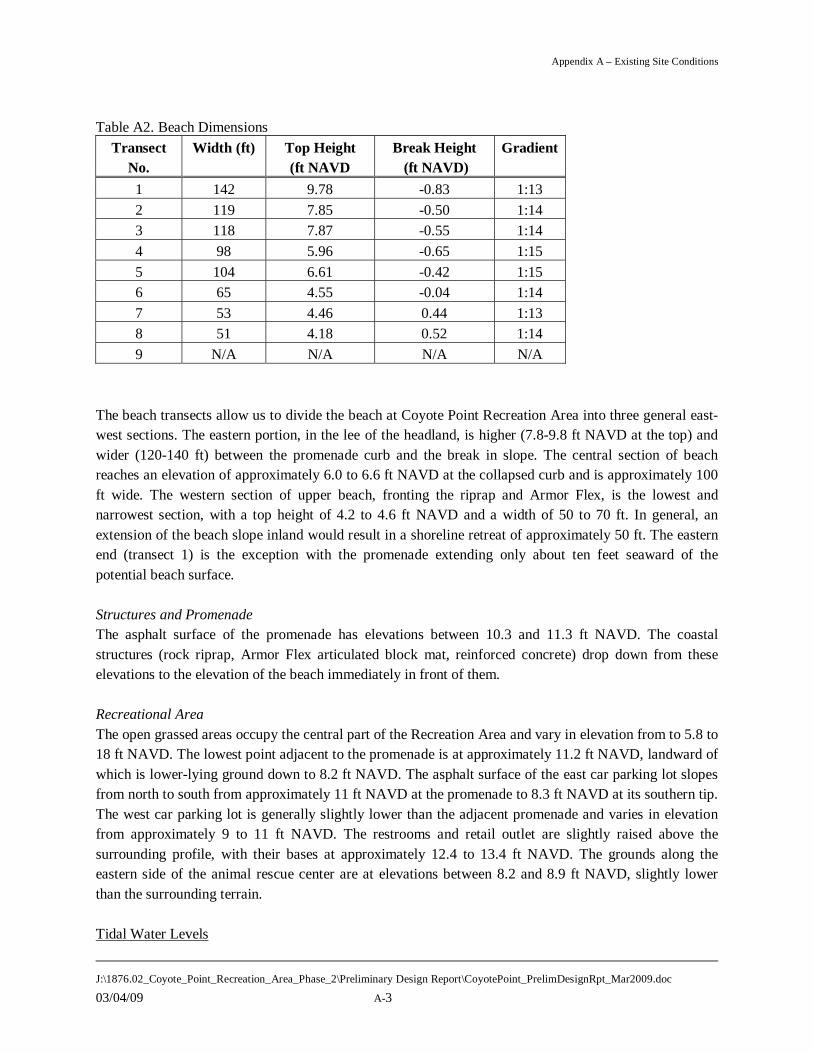


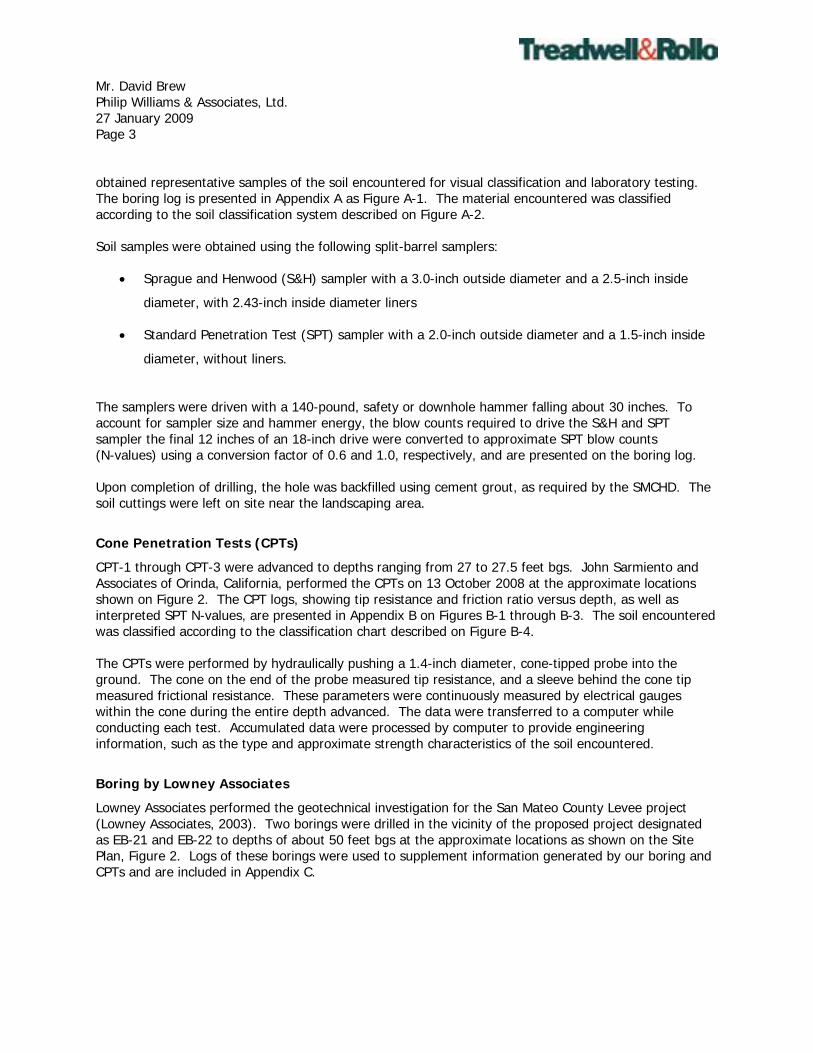


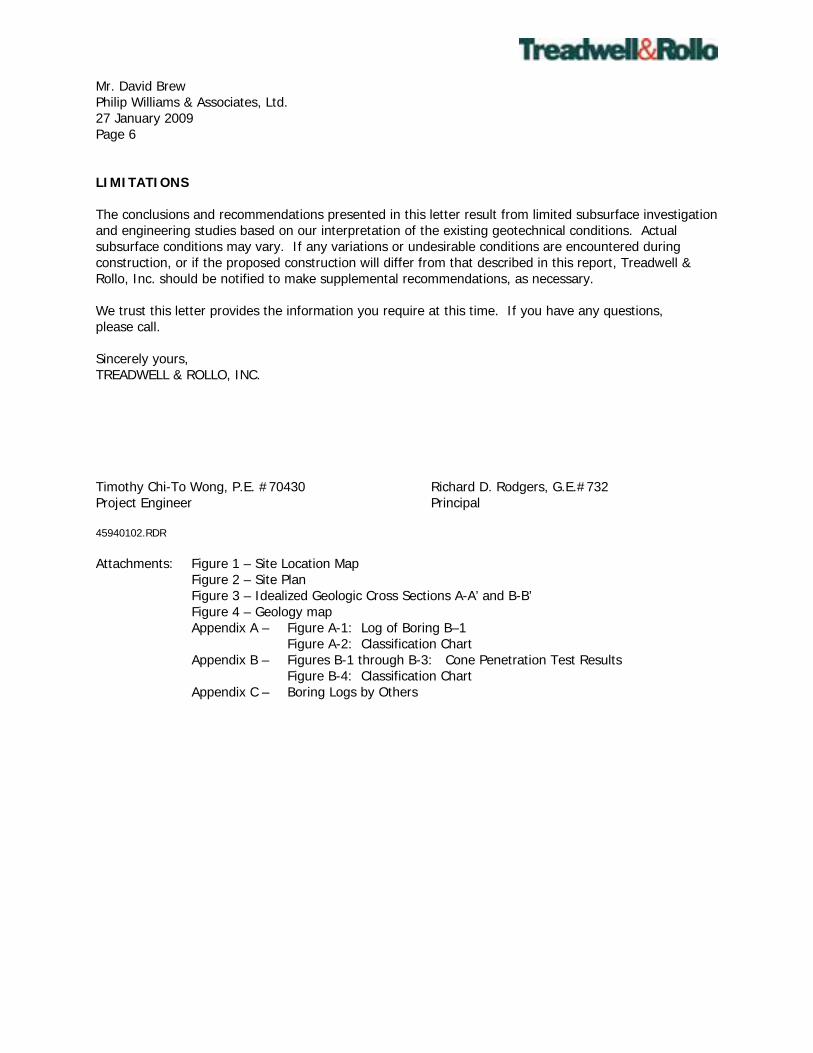


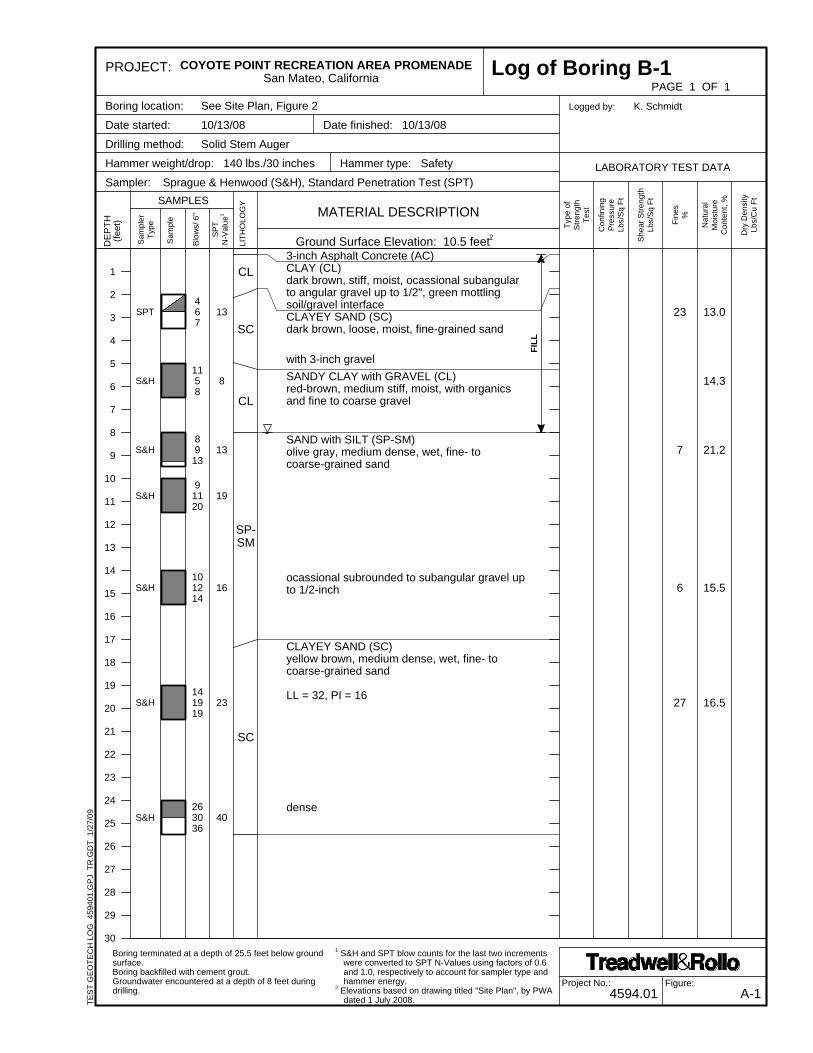


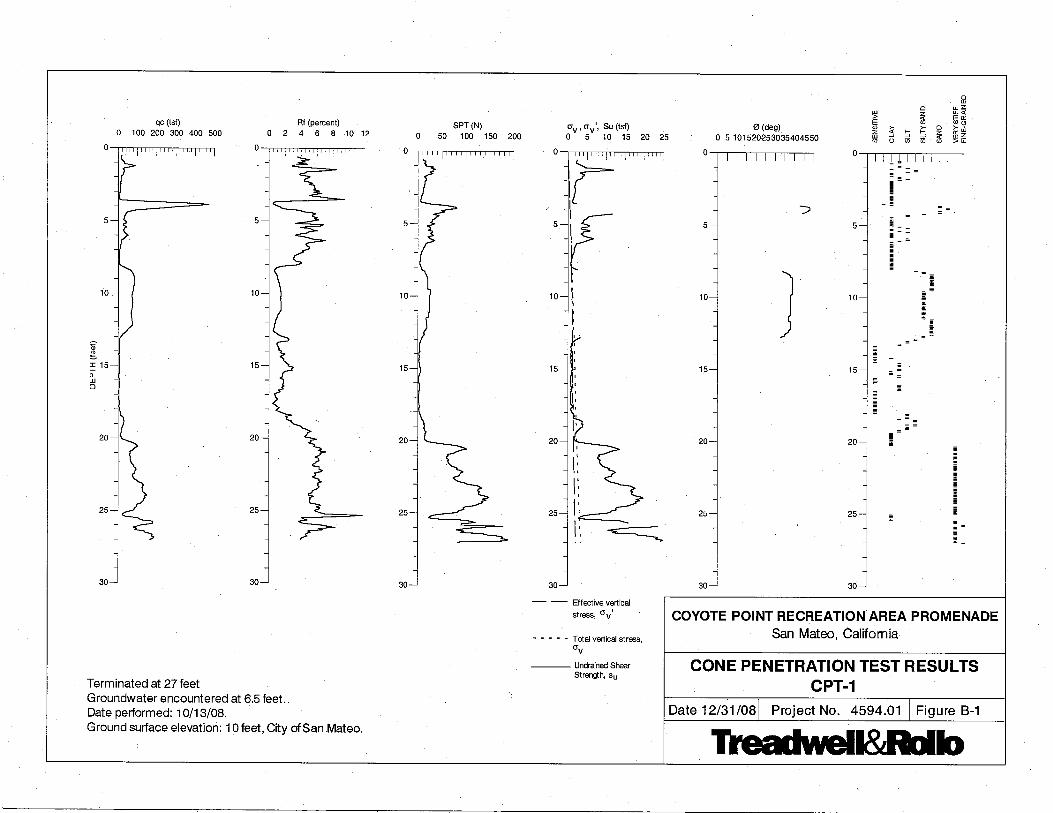


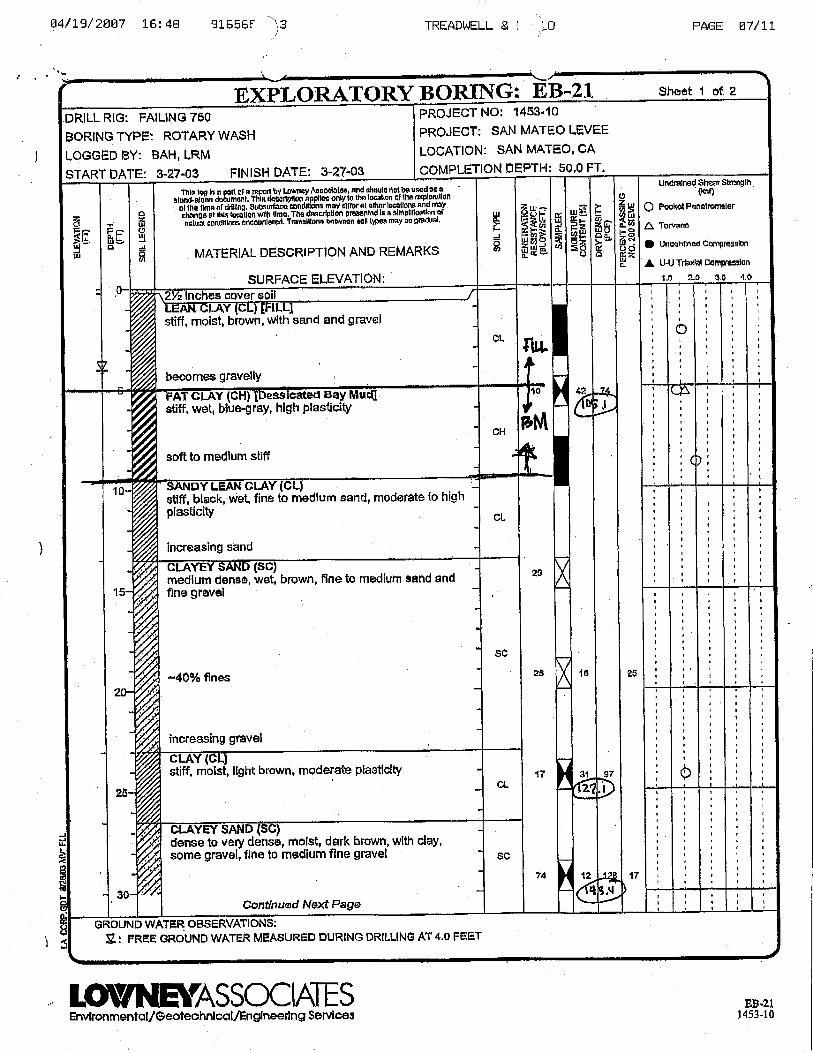


![PROMENADE)MATHÉMATIQUE):) · [Tapez’ici]’ Site’départemental’Maths50’ PROMENADE)MATHÉMATIQUE):) ’ OBJECTIFS’GÉNÉRAUX’DE’M@THSIENIVIE’:’ I!Ancrer’les’mathématiques](https://static.documents.pub/doc/80x56/61250c069a5e0e2fae4f74e4/promenademathmatique-tapezaicia-siteadpartementalamaths50a-promenademathmatique.jpg)


