12
The stalemate of cable digital switchover Yuntsai Chou Associate Professor of Information Management Big Data and Digital Convergence Innovation Center Yuan Ze University September 11, 2014
| Date post: | 14-Jul-2015 |
| Category: |
Internet |
| Upload: | ychoutotochu |
| View: | 40 times |
| Download: | 5 times |
The stalemate of cable digital switchover
Yuntsai Chou
Associate Professor of Information Management
Big Data and Digital Convergence Innovation Center
Yuan Ze University
September 11, 2014
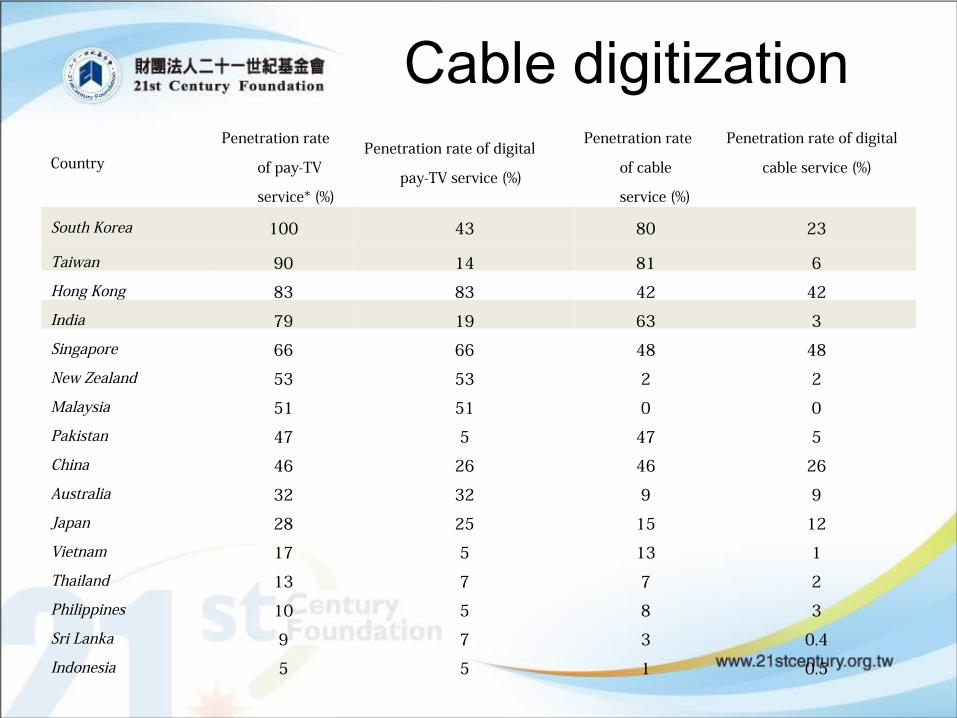
Cable digitization
Country
Penetration rate
of pay-TV
service* (%)
Penetration rate of digital
pay-TV service (%)
Penetration rate
of cable
service (%)
Penetration rate of digital
cable service (%)
South Korea 100 43 80 23
Taiwan 90 14 81 6
Hong Kong 83 83 42 42
India 79 19 63 3
Singapore 66 66 48 48
New Zealand 53 53 2 2
Malaysia 51 51 0 0
Pakistan 47 5 47 5
China 46 26 46 26
Australia 32 32 9 9
Japan 28 25 15 12
Vietnam 17 5 13 1
Thailand 13 7 7 2
Philippines 10 5 8 3
Sri Lanka 9 7 3 0.4
Indonesia 5 5 1 0.5
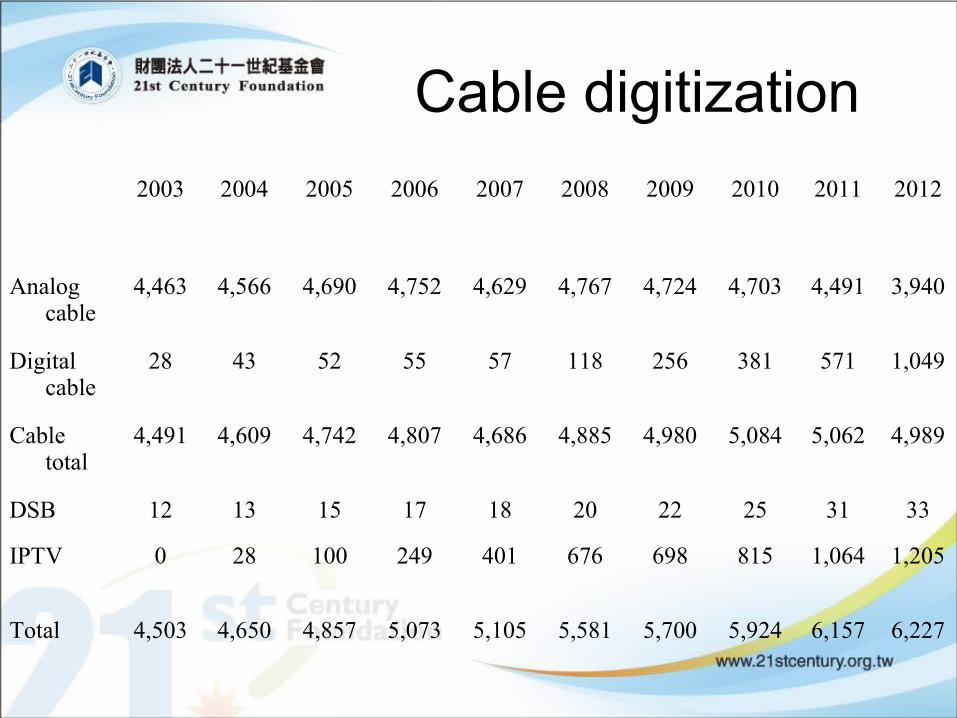
2003 2004 2005 2006 2007 2008 2009 2010 2011 2012
Analog cable
4,463 4,566 4,690 4,752 4,629 4,767 4,724 4,703 4,491 3,940
Digital cable
28 43 52 55 57 118 256 381 571 1,049
Cable total
4,491 4,609 4,742 4,807 4,686 4,885 4,980 5,084 5,062 4,989
DSB 12 13 15 17 18 20 22 25 31 33
IPTV 0 28 100 249 401 676 698 815 1,064 1,205
Total 4,503 4,650 4,857 5,073 5,105 5,581 5,700 5,924 6,157 6,227
Cable digitization
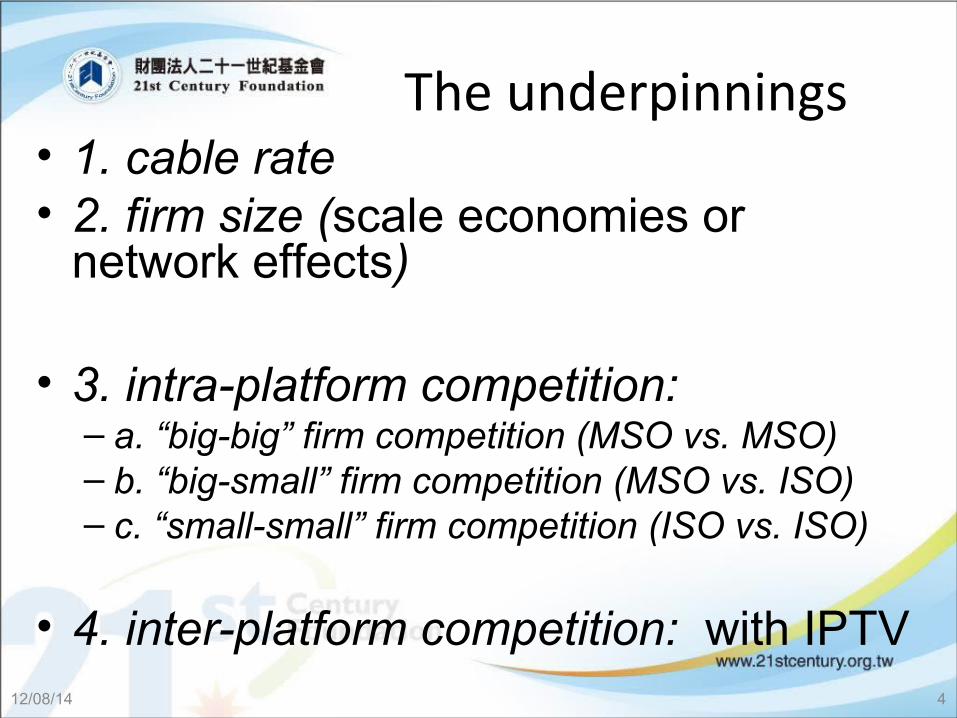
The underpinnings• 1. cable rate • 2. firm size (scale economies or
network effects)
• 3. intra-platform competition: – a. “big-big” firm competition (MSO vs. MSO)– b. “big-small” firm competition (MSO vs. ISO)– c. “small-small” firm competition (ISO vs. ISO)
• 4. inter-platform competition: with IPTV12/08/14 4
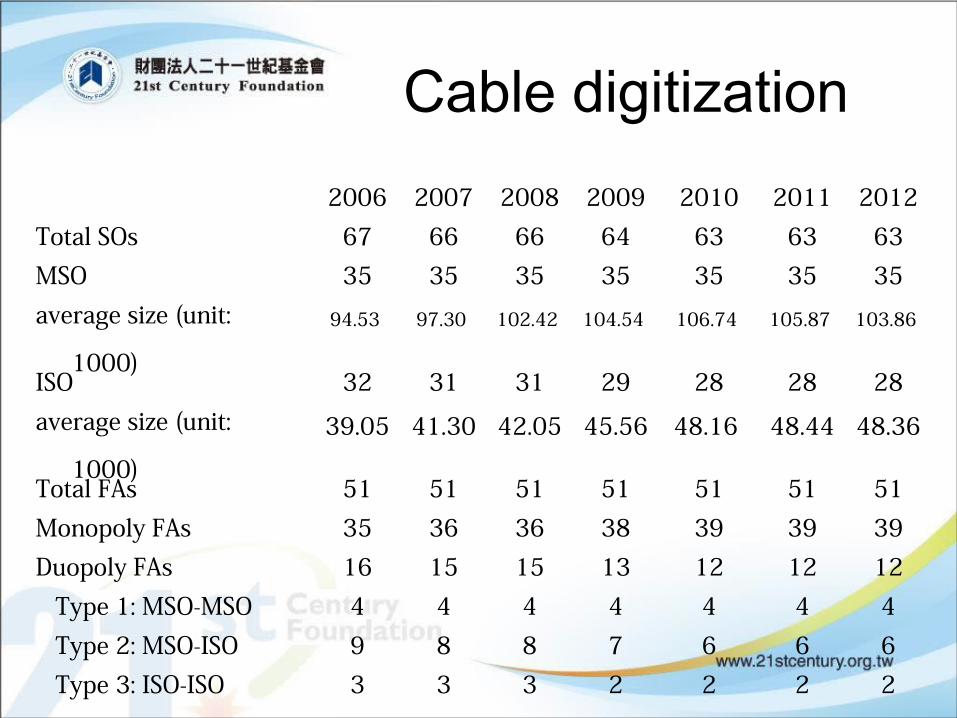
2006 2007 2008 2009 2010 2011 2012Total SOs 67 66 66 64 63 63 63MSO 35 35 35 35 35 35 35average size (unit:
1000)
94.53 97.30 102.42 104.54 106.74 105.87 103.86
ISO 32 31 31 29 28 28 28average size (unit:
1000)
39.05 41.30 42.05 45.56 48.16 48.44 48.36
Total FAs 51 51 51 51 51 51 51Monopoly FAs 35 36 36 38 39 39 39Duopoly FAs 16 15 15 13 12 12 12 Type 1: MSO-MSO 4 4 4 4 4 4 4 Type 2: MSO-ISO 9 8 8 7 6 6 6 Type 3: ISO-ISO 3 3 3 2 2 2 2
Cable digitization
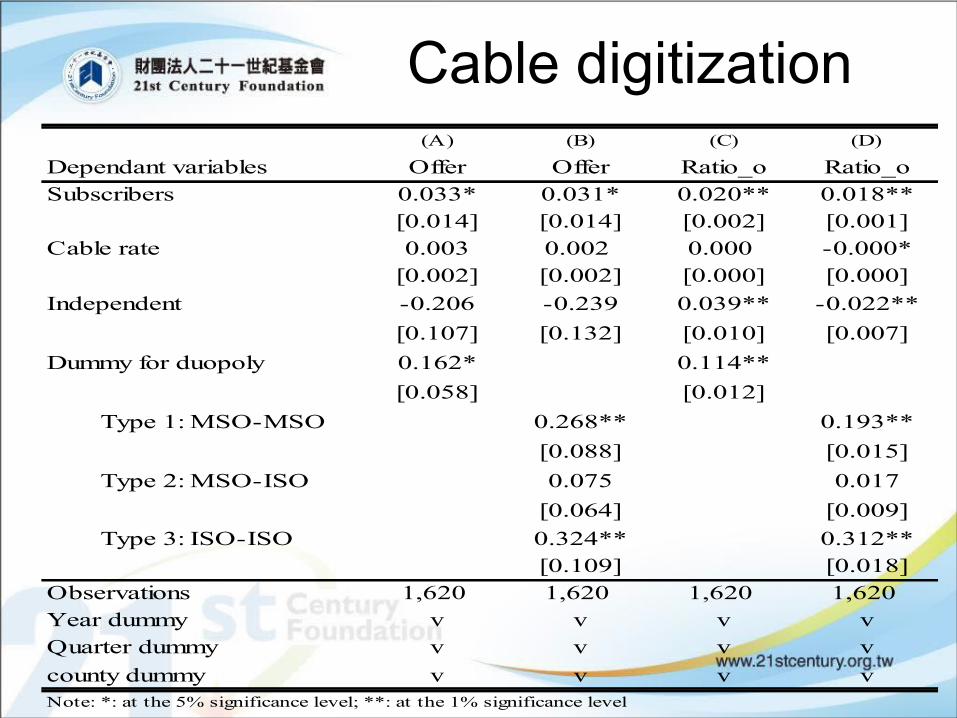
Cable digitization(A) (B) (C) (D)
Dependant variables Offer Offer Ratio_o Ratio_oSubscribers 0.033* 0.031* 0.020** 0.018**
[0.014] [0.014] [0.002] [0.001]Cable rate 0.003 0.002 0.000 -0.000*
[0.002] [0.002] [0.000] [0.000]
Independent -0.206 -0.239 0.039** -0.022**
[0.107] [0.132] [0.010] [0.007]
Dummy for duopoly 0.162* 0.114**
[0.058] [0.012]
Type 1: MSO-MSO 0.268** 0.193**
[0.088] [0.015]
Type 2: MSO-ISO 0.075 0.017
[0.064] [0.009]
Type 3: ISO-ISO 0.324** 0.312**[0.109] [0.018]
Observations 1,620 1,620 1,620 1,620Year dummy v v v vQuarter dummy v v v v
county dummy v v v vNote: *: at the 5% significance level; **: at the 1% significance level
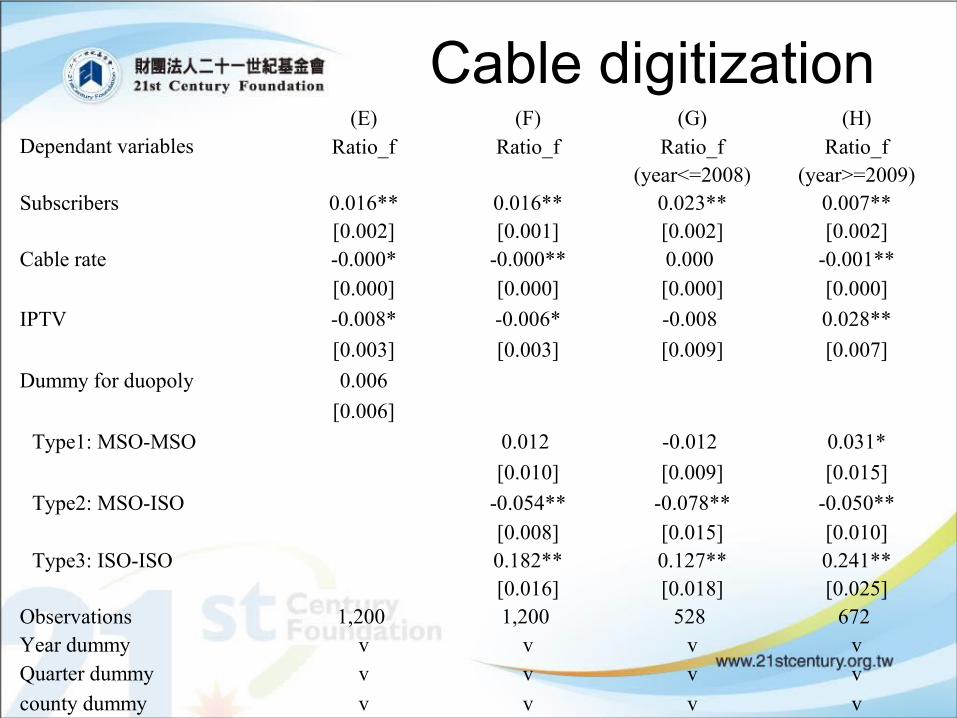
Cable digitizationDependant variables
(E) (F) (G) (H)Ratio_f Ratio_f Ratio_f Ratio_f
(year<=2008) (year>=2009)Subscribers 0.016** 0.016** 0.023** 0.007**
[0.002] [0.001] [0.002] [0.002]Cable rate -0.000* -0.000** 0.000 -0.001**
[0.000] [0.000] [0.000] [0.000]
IPTV -0.008* -0.006* -0.008 0.028**
[0.003] [0.003] [0.009] [0.007]
Dummy for duopoly 0.006
[0.006]
Type1: MSO-MSO 0.012 -0.012 0.031*
[0.010] [0.009] [0.015]
Type2: MSO-ISO -0.054** -0.078** -0.050**[0.008] [0.015] [0.010]
Type3: ISO-ISO 0.182** 0.127** 0.241**[0.016] [0.018] [0.025]
Observations 1,200 1,200 528 672 Year dummy v v v vQuarter dummy v v v v
county dummy v v v v

Econometric Results
1. IPTV generates the strong and positive impact on the digitization of cable service after it acquires sizeable customers (since 2009);
2. the cable installed base induces economies of scale that increase its digital penetration;
3. the overbuild of the equivalent-size rivalry can increase digital adoption while the unequal-sized competition might reversely decrease it; and
4. the monthly flat fee charged to customers does not influence the digital adoption.

Cable digitizationDeregulatory approaches
Open access/ open standards
Overbuilds over low-density areas
Horizontal integration cap lifted
(with caution)
Rate deregulation(not necessary)
Policy path of cable digitization
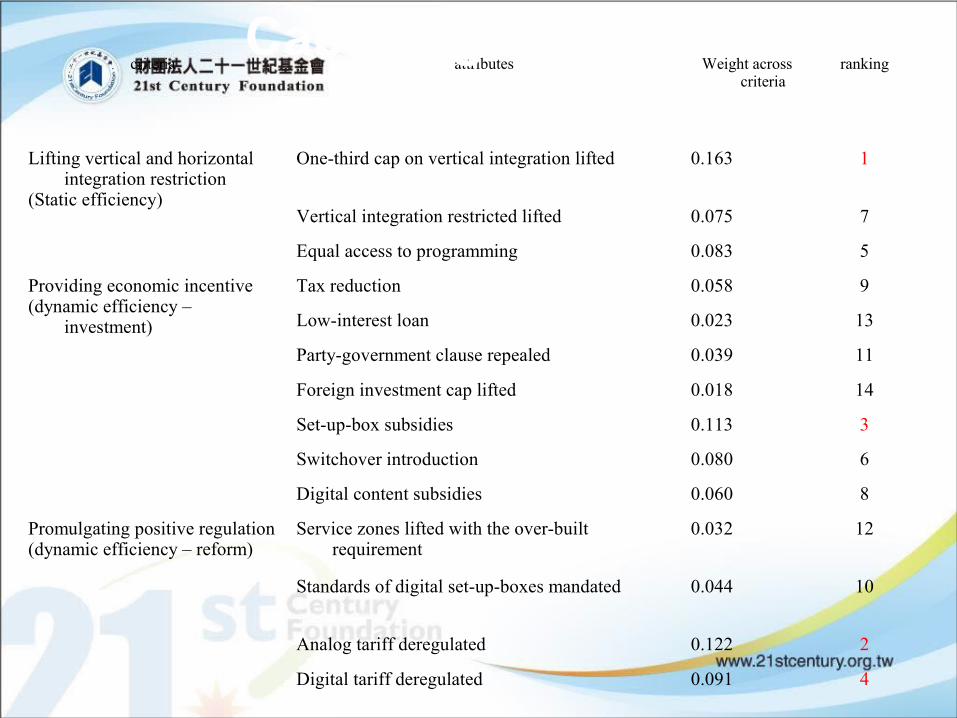
criteria attributes Weight across criteria
ranking
Lifting vertical and horizontal integration restriction
(Static efficiency)
One-third cap on vertical integration lifted 0.163 1
Vertical integration restricted lifted 0.075 7
Equal access to programming 0.083 5
Providing economic incentive(dynamic efficiency –
investment)
Tax reduction 0.058 9
Low-interest loan 0.023 13
Party-government clause repealed 0.039 11
Foreign investment cap lifted 0.018 14
Set-up-box subsidies 0.113 3
Switchover introduction 0.080 6
Digital content subsidies 0.060 8
Promulgating positive regulation(dynamic efficiency – reform)
Service zones lifted with the over-built requirement
0.032 12
Standards of digital set-up-boxes mandated 0.044 10
Analog tariff deregulated 0.122 2
Digital tariff deregulated 0.091 4
Cable digitization