Slide CPSE ETF Further Fund Offer (FFO) Managed by Reliance Nippon LifeAsset Management Limited (formerly Reliance CapitalAsset Management Limited) (An Open-ended Index Exchange Traded Scheme) (Rajiv Gandhi Equity Savings Scheme (RGESS) Qualified Scheme) For Anchor Investors For Non Anchor Investors FFO Opens on January 17, 2017 January 18, 2017 FFO Closes on January 17, 2017 January 20, 2017 Offer of Units of Rs. 10/- each (i.e. face value) for cash (on allotment, the value of each Unit would be approximately 1/100th of the value of Nifty CPSE Index) to be issued at a premium, if any, approximately equal to the difference between face value and FFO Allotment Price during the Further Fund Offer (“FFO”) and at NAV based prices thereafter. For the existing CPSE ETF the Ongoing Offer Period for the Scheme commenced on April 04, 2014. 1
Transcript
Slide
CPSE ETF Further Fund Offer (FFO) Managed by Reliance Nippon Life Asset Management Limited
(formerly Reliance Capital Asset Management Limited)
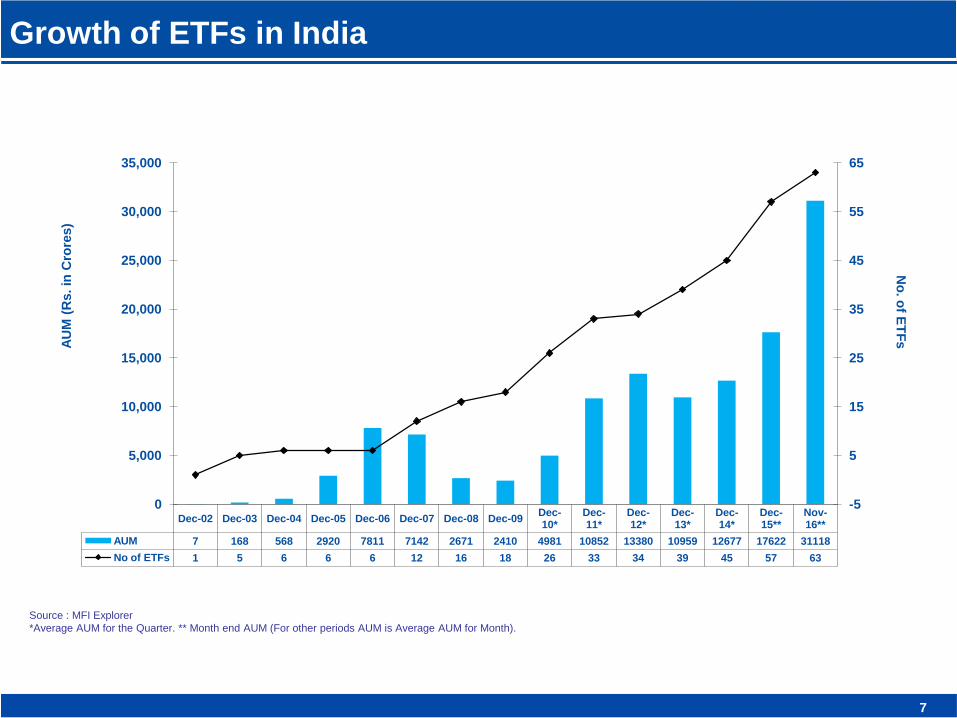
No of ETFs 1 5 6 6 6 12 16 18 26 33 34 39 45 57 63
-5
5
15
25
35
45
55
65
0
5,000
10,000
15,000
20,000
25,000
30,000
35,000
No
. of E
TF
s A
UM
(R
s. in
Cro
res)
Slide
Advantages of ETF
8
Slide
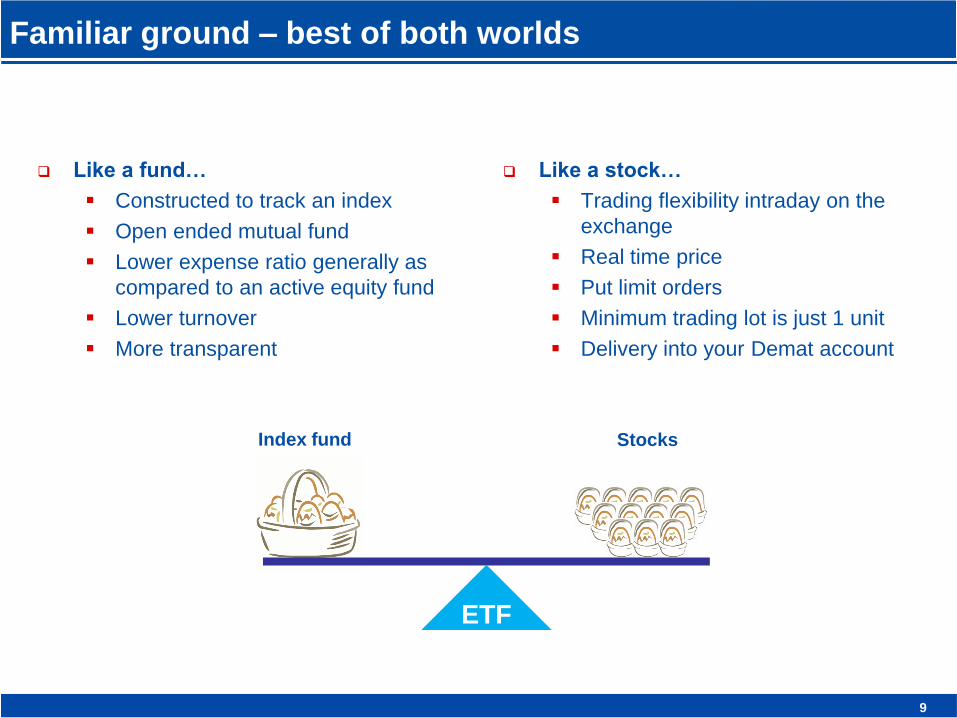
Familiar ground – best of both worlds
Like a stock…
Trading flexibility intraday on the
exchange
Real time price
Put limit orders
Minimum trading lot is just 1 unit
Delivery into your Demat account
ETF
Index fund Stocks
Like a fund…
Constructed to track an index
Open ended mutual fund
Lower expense ratio generally as
compared to an active equity fund
Lower turnover
More transparent
9
Slide
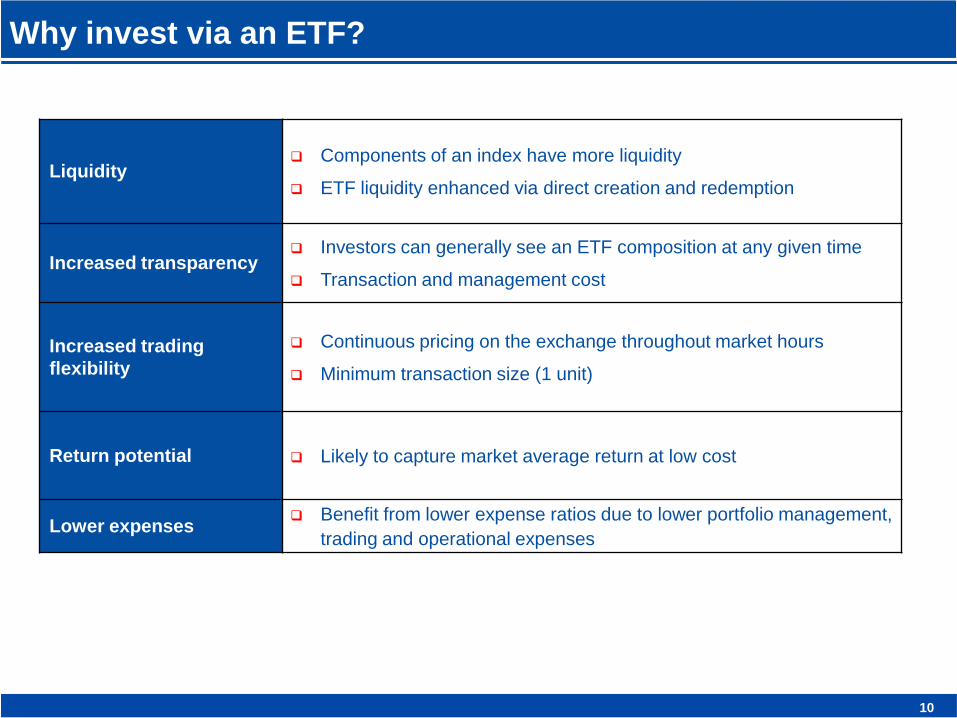
Why invest via an ETF?
Liquidity Components of an index have more liquidity
ETF liquidity enhanced via direct creation and redemption
Increased transparency Investors can generally see an ETF composition at any given time
Transaction and management cost
Increased trading
flexibility
Continuous pricing on the exchange throughout market hours
Minimum transaction size (1 unit)
Return potential Likely to capture market average return at low cost
Lower expenses Benefit from lower expense ratios due to lower portfolio management,
trading and operational expenses
10
Slide
Nifty CPSE Index
11
Slide 12 12
GAIL (India)
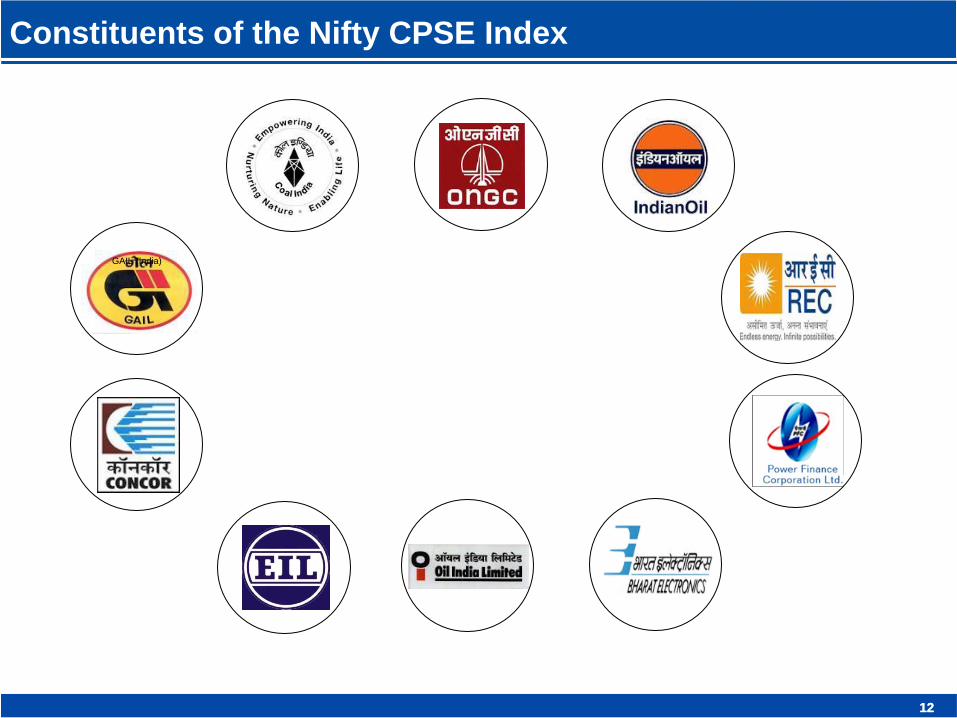
Constituents of the Nifty CPSE Index
Slide
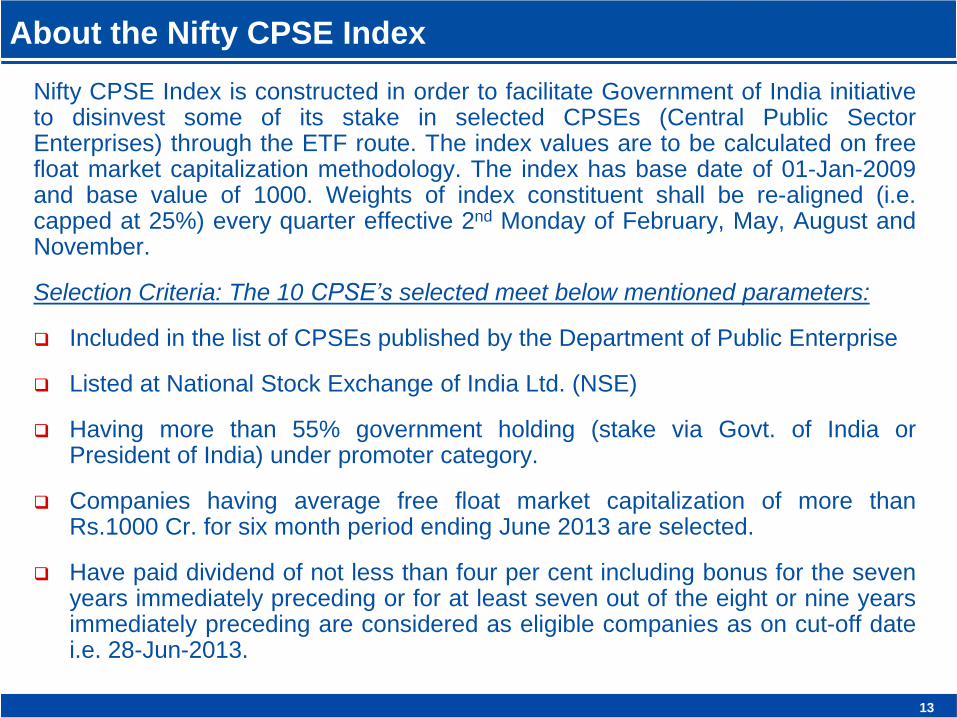
Nifty CPSE Index is constructed in order to facilitate Government of India initiative to disinvest some of its stake in selected CPSEs (Central Public Sector Enterprises) through the ETF route. The index values are to be calculated on free float market capitalization methodology. The index has base date of 01-Jan-2009 and base value of 1000. Weights of index constituent shall be re-aligned (i.e. capped at 25%) every quarter effective 2nd Monday of February, May, August and November.
Selection Criteria: The 10 CPSE’s selected meet below mentioned parameters:
Included in the list of CPSEs published by the Department of Public Enterprise
Listed at National Stock Exchange of India Ltd. (NSE)
Having more than 55% government holding (stake via Govt. of India or President of India) under promoter category.
Companies having average free float market capitalization of more than Rs.1000 Cr. for six month period ending June 2013 are selected.
Have paid dividend of not less than four per cent including bonus for the seven years immediately preceding or for at least seven out of the eight or nine years immediately preceding are considered as eligible companies as on cut-off date i.e. 28-Jun-2013.
About the Nifty CPSE Index
13
Slide
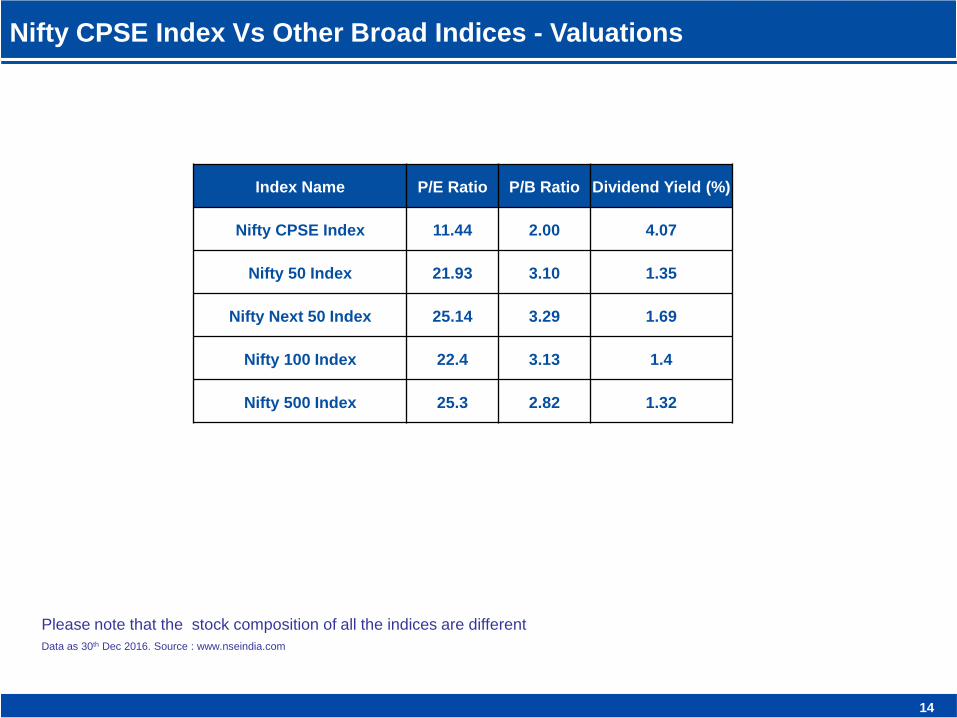
Nifty CPSE Index Vs Other Broad Indices - Valuations
Data as 30th Dec 2016. Source : www.nseindia.com
Index Name P/E Ratio P/B Ratio Dividend Yield (%)
Nifty CPSE Index 11.44 2.00 4.07
Nifty 50 Index 21.93 3.10 1.35
Nifty Next 50 Index 25.14 3.29 1.69
Nifty 100 Index 22.4 3.13 1.4
Nifty 500 Index 25.3 2.82 1.32
14
Please note that the stock composition of all the indices are different
Slide
CPSE ETF - Overview
15
Slide
Government of India (GOI) used innovative route to divest its holding in CPSEs
via ETF
New Fund Offer (NFO) was first launched in March 2014
NFO received overwhelming response; NFO collection was Rs.4,363 Crs, out of
which Rs.1,363 Crs was refund to investors due to limited issue size of
Rs.3,000 Crs
Participation across various categories of investors
Units of CPSE ETF were listed on 04th April 2014 on NSE & BSE
CPSE ETF - Background
16
Slide
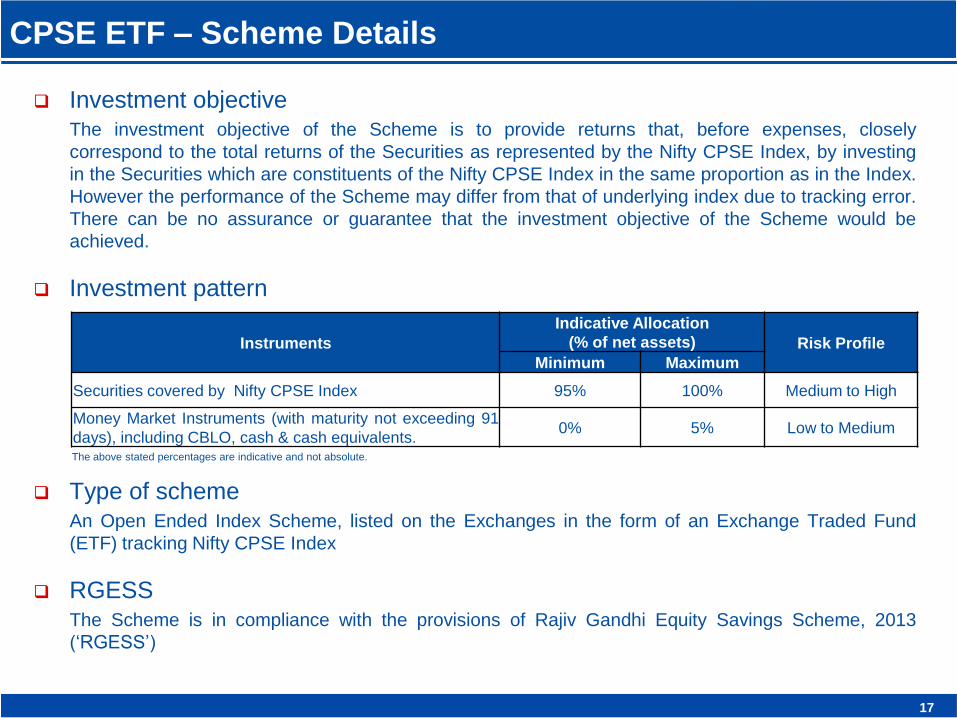
Investment objective The investment objective of the Scheme is to provide returns that, before expenses, closely
correspond to the total returns of the Securities as represented by the Nifty CPSE Index, by investing
in the Securities which are constituents of the Nifty CPSE Index in the same proportion as in the Index.
However the performance of the Scheme may differ from that of underlying index due to tracking error.
There can be no assurance or guarantee that the investment objective of the Scheme would be
achieved.
Investment pattern
Type of scheme An Open Ended Index Scheme, listed on the Exchanges in the form of an Exchange Traded Fund
(ETF) tracking Nifty CPSE Index
RGESS The Scheme is in compliance with the provisions of Rajiv Gandhi Equity Savings Scheme, 2013
(‘RGESS’)
CPSE ETF – Scheme Details
Instruments
Indicative Allocation
(% of net assets) Risk Profile
Minimum Maximum
Securities covered by Nifty CPSE Index 95% 100% Medium to High
Money Market Instruments (with maturity not exceeding 91
days), including CBLO, cash & cash equivalents. 0% 5% Low to Medium
The above stated percentages are indicative and not absolute.
17
Slide
CPSE ETF – Performance as on Dec 30, 2016
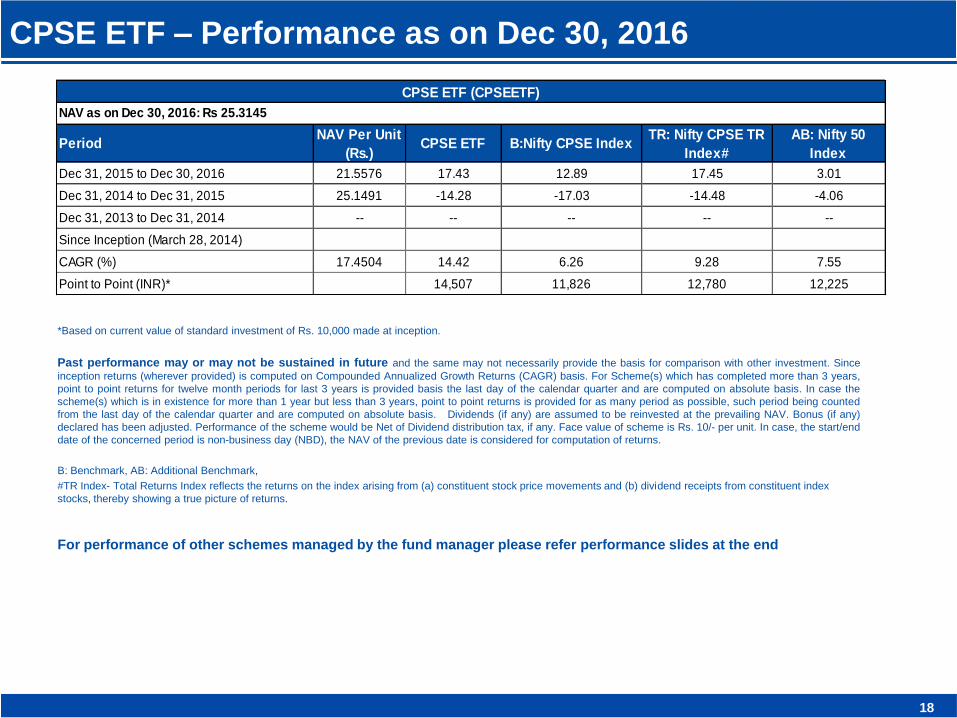
*Based on current value of standard investment of Rs. 10,000 made at inception.
Past performance may or may not be sustained in future and the same may not necessarily provide the basis for comparison with other investment. Since
inception returns (wherever provided) is computed on Compounded Annualized Growth Returns (CAGR) basis. For Scheme(s) which has completed more than 3 years,
point to point returns for twelve month periods for last 3 years is provided basis the last day of the calendar quarter and are computed on absolute basis. In case the
scheme(s) which is in existence for more than 1 year but less than 3 years, point to point returns is provided for as many period as possible, such period being counted
from the last day of the calendar quarter and are computed on absolute basis. Dividends (if any) are assumed to be reinvested at the prevailing NAV. Bonus (if any)
declared has been adjusted. Performance of the scheme would be Net of Dividend distribution tax, if any. Face value of scheme is Rs. 10/- per unit. In case, the start/end
date of the concerned period is non-business day (NBD), the NAV of the previous date is considered for computation of returns.
B: Benchmark, AB: Additional Benchmark,
#TR Index- Total Returns Index reflects the returns on the index arising from (a) constituent stock price movements and (b) dividend receipts from constituent index
stocks, thereby showing a true picture of returns.
For performance of other schemes managed by the fund manager please refer performance slides at the end
18
PeriodNAV Per Unit
(Rs.)CPSE ETF B:Nifty CPSE Index
TR: Nifty CPSE TR
Index#
AB: Nifty 50
Index
Dec 31, 2015 to Dec 30, 2016 21.5576 17.43 12.89 17.45 3.01
Dec 31, 2014 to Dec 31, 2015 25.1491 -14.28 -17.03 -14.48 -4.06
Dec 31, 2013 to Dec 31, 2014 -- -- -- -- --
Since Inception (March 28, 2014)
CAGR (%) 17.4504 14.42 6.26 9.28 7.55
Point to Point (INR)* 14,507 11,826 12,780 12,225
NAV as on Dec 30, 2016: Rs 25.3145
CPSE ETF (CPSEETF)
Slide
CPSE ETF – Portfolio & Industry Allocation
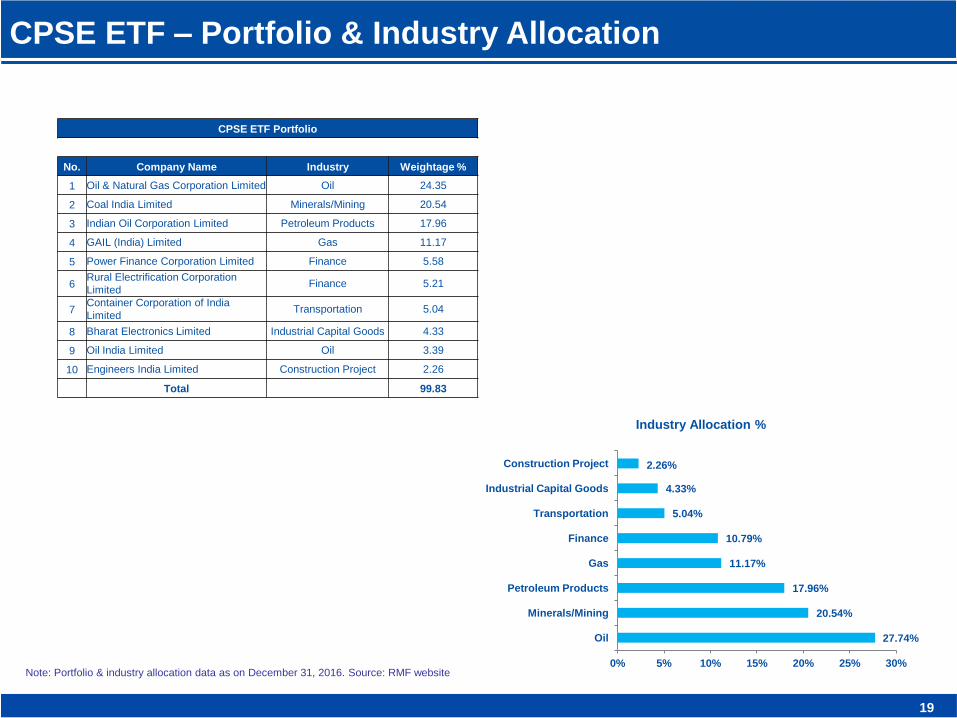
CPSE ETF Portfolio
No. Company Name Industry Weightage %
1 Oil & Natural Gas Corporation Limited Oil 24.35
2 Coal India Limited Minerals/Mining 20.54
3 Indian Oil Corporation Limited Petroleum Products 17.96
4 GAIL (India) Limited Gas 11.17
5 Power Finance Corporation Limited Finance 5.58
6 Rural Electrification Corporation
Limited Finance 5.21
7 Container Corporation of India
Limited Transportation 5.04
8 Bharat Electronics Limited Industrial Capital Goods 4.33
9 Oil India Limited Oil 3.39
10 Engineers India Limited Construction Project 2.26
Total 99.83
Note: Portfolio & industry allocation data as on December 31, 2016. Source: RMF website
19
27.74%
20.54%
17.96%
11.17%
10.79%
5.04%
4.33%
2.26%
0% 5% 10% 15% 20% 25% 30%
Oil
Minerals/Mining
Petroleum Products
Gas
Finance
Transportation
Industrial Capital Goods
Construction Project
Industry Allocation %
Slide
CPSE ETF FFO
20
Slide
Play on India growth story through investment in the large CPSE stocks at attractive valuations
Portfolio diversification through investment in blue-chip Maharatna and Navaratna CPSE stocks which are sector leaders
FFO price advantage – Upfront discount to all categories of investors
Attractive Valuation and Dividend Yields: P/E ratio and dividend yields better compared to broader market index (Refer Index Valuation slide)
Flexibility of trading on real time basis
Lower expense ratios and transaction costs
Investors will be able to diversify exposure across a number of Public Sector companies through a single instrument
CPSE ETF FFO – Investment Rationale
21
Slide
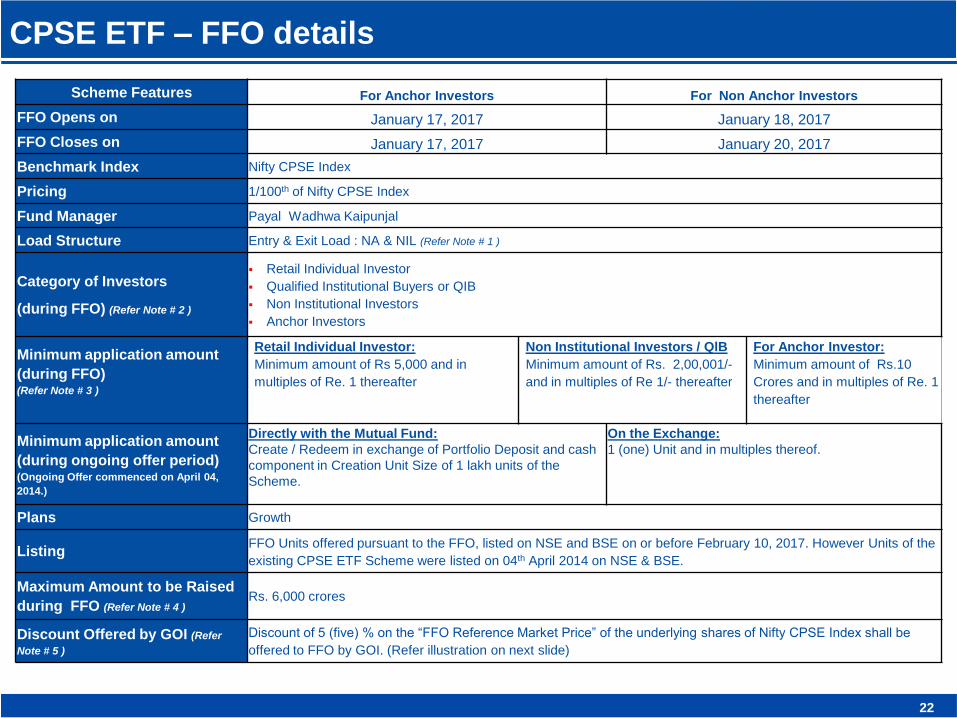
CPSE ETF – FFO details
Scheme Features For Anchor Investors For Non Anchor Investors
(during ongoing offer period) (Ongoing Offer commenced on April 04,
2014.)
Directly with the Mutual Fund:
Create / Redeem in exchange of Portfolio Deposit and cash
component in Creation Unit Size of 1 lakh units of the
Scheme.
On the Exchange:
1 (one) Unit and in multiples thereof.
Plans Growth
Listing FFO Units offered pursuant to the FFO, listed on NSE and BSE on or before February 10, 2017. However Units of the
existing CPSE ETF Scheme were listed on 04th April 2014 on NSE & BSE.
Maximum Amount to be Raised
during FFO (Refer Note # 4 ) Rs. 6,000 crores
Discount Offered by GOI (Refer
Note # 5 )
Discount of 5 (five) % on the “FFO Reference Market Price” of the underlying shares of Nifty CPSE Index shall be
offered to FFO by GOI. (Refer illustration on next slide)
22
Slide
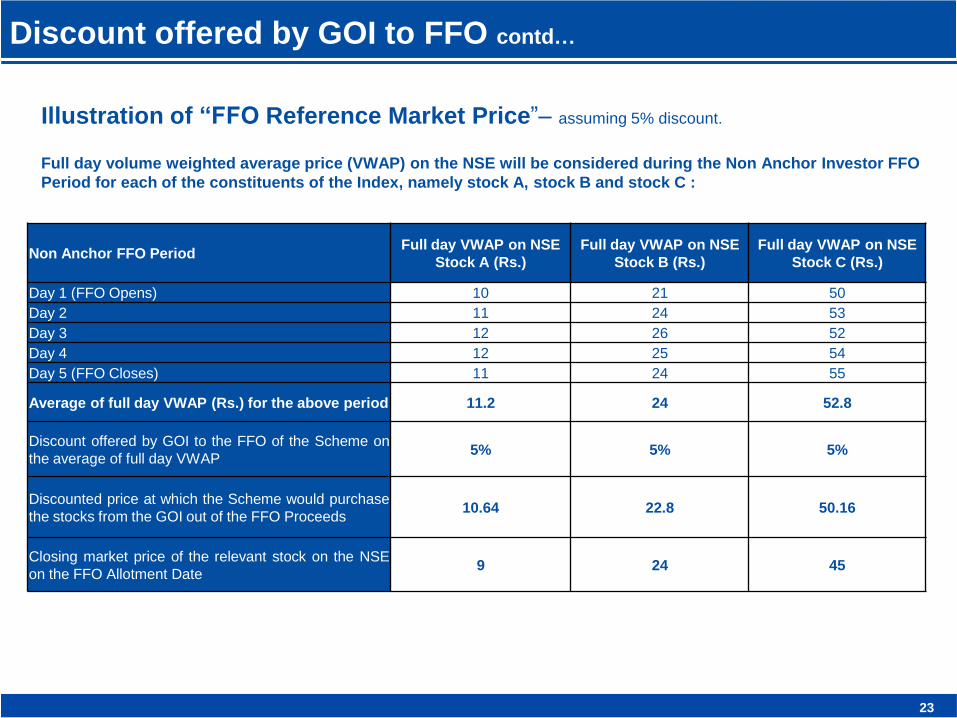
Discount offered by GOI to FFO contd…
Illustration of “FFO Reference Market Price”– assuming 5% discount.
Full day volume weighted average price (VWAP) on the NSE will be considered during the Non Anchor Investor FFO
Period for each of the constituents of the Index, namely stock A, stock B and stock C :
Non Anchor FFO Period Full day VWAP on NSE
Stock A (Rs.)
Full day VWAP on NSE
Stock B (Rs.)
Full day VWAP on NSE
Stock C (Rs.)
Day 1 (FFO Opens) 10 21 50
Day 2 11 24 53
Day 3 12 26 52
Day 4 12 25 54
Day 5 (FFO Closes) 11 24 55
Average of full day VWAP (Rs.) for the above period 11.2 24 52.8
Discount offered by GOI to the FFO of the Scheme on
the average of full day VWAP 5% 5% 5%
Discounted price at which the Scheme would purchase
the stocks from the GOI out of the FFO Proceeds 10.64 22.8 50.16
Closing market price of the relevant stock on the NSE
on the FFO Allotment Date 9 24 45
23
Slide
CPSE ETF – Mechanism
All Investors Reliance
Mutual Fund Government of India
Cash Cash
Basket of
Stocks CPSE ETF
Units
During Further Fund Offer
24
Slide
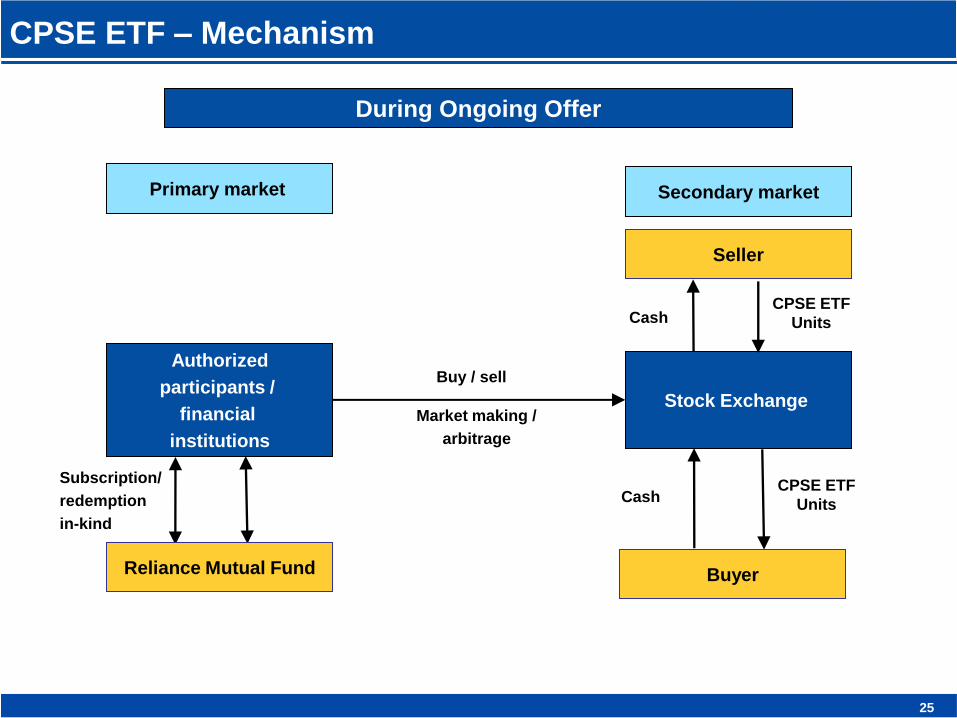
CPSE ETF – Mechanism
During Ongoing Offer
Secondary market
Seller
Stock Exchange
CPSE ETF
Units Cash
Cash CPSE ETF
Units
Primary market
Authorized
participants /
financial
institutions
Buy / sell
Market making /
arbitrage
Buyer Reliance Mutual Fund
25
Subscription/
redemption
in-kind
Slide
Notes
1. Payment of Transaction Charges – For applications received during the FFO Period, the AMC/ Mutual Fund may deduct
transaction charges of ₹ 150 (Rupees One Hundred and Fifty) (for first time investors across mutual funds) or ₹ 100 (Rupees One
Hundred) (for existing investors across mutual funds) from the Subscription amount, which would be paid to the empanelled AMFI
registered Distributor / agent of the Investor (in case the empanelled AMFI registered Distributor / agent has “opted in” to receive
the transaction charge for this type of product) and the balance amount shall be invested in the Scheme. Please refer to Section IV
(C) (Transaction Charges) of the Supplement to SID for further details.
2. Retail Individual Investors: Individual Investors (including HUFs applying through their Karta’s and NRIs) who have applied for
FFO Units for an amount not exceeding ₹ 2,00,000 (Rupees Two lakhs). Non Institutional Investor : All investors who are not
Qualified Institutional Buyers or Retail Individual Investors and who have applied for the Units for an amount more than ₹ 2,00,000
(Rupees Two Lakhs). Qualified Institutional Buyers: Qualified Institutional Buyers as defined under Regulation 2(1)(zd) of the
SEBI (Issue of Capital and Disclosure Requirements) Regulations, 2009, as amended. Anchor Investor - A Qualified Institutional
Buyers, applying under the Anchor Investor Portion, with a minimum application amount of ₹ 10 Crores (Rupees Ten Crores).
Refer to Multiple Applications by Same Investor under Section III (A) of Supplement to SID.
3. Anchor Investor Portion: The portion not exceeding 30% of the Maximum Amount to be Raised (if any) shall be available for
allocation to Anchor Investors on a proportionate basis.
In case of under Subscription in this category, the under subscribed portion will be available for spill-over from the Retail Individual
Investor Portion at the discretion of the AMC. If even after the spill-over from the Retail Individual Investor Portion, the Anchor
Investor Portion remains under subscribed, then the balance shall be met by spillover from the Qualified Institutional Buyers & Non
Institutional Investor Portion. But any under-Subscription in the Retail Individual Investor Portion and Qualified Institutional Buyers
& Non Institutional Investor Portion will not be allowed to be met by any spill-over from the Anchor Investor Portion.
Retail Individual Investor Portion: Atleast 70% of the Maximum Amount to be Raised (if any) plus any under subscribed portion
of Anchor Investor, shall be available for allocation to Retail Individual Investors on a proportionate basis in the manner set out in
the Supplement at the discretion of the AMC.
In case of under Subscription in this category, the under subscribed portion of this category as well as Anchor Investor category
will be available for allocation to Qualified Institutional Buyers & Non Institutional Investor Portion.
26
Slide
Notes
Qualified Institutional Buyers & Non Institutional Investor Portion: Upto 100% of the residuary portion available (if any) from
Maximum Amount to be Raised (if any) following any under-subscription of the Retail Individual Investor Portion (which includes any
under-subscription of the Anchor Investor Portion) shall be available for allocation to Qualified Institutional Buyers and Non
Institutional Investors on a proportionate basis in the manner set out in the Supplement.
Allocation will be made to this category only to the extent of any under subscription in the Retail Individual Investor Portion which
would also include any under subscription of Anchor Investor portion. If Retail Individual Investor Portion is oversubscribed, then no
allocation will be made to Qualified Institutional Buyers and Non Institutional Investors.
Under this category, the allocation will be first made to provident funds / superannuation funds / gratuity funds / pension funds who
have applied under QIBs on a proportionate basis in the manner set out in the Supplement at the discretion of the AMC & residuary
portion available (if any) post allocation to provident funds / superannuation funds / gratuity funds / pension funds will be available
for allocation to Qualified Institutional Buyers (other than provident funds / superannuation funds / gratuity funds / pension funds)
and Non Institutional Investors on a proportionate basis in the manner set out in the Supplement at the discretion of the AMC.
4. Maximum Amount to be Raised (if any):
Rs. 6,000 Crores [(“Initial Amount” – Rs. 4,500 Crores plus “Additional Amount” – Rs. 1,500 Crores which is in addition to the stated
“Initial Amount”) (“Initial Amount” plus “Additional Amount” to be collectively called as “Maximum Amount to be Raised”)].
Please note in accordance with the instructions of the GOI, the AMC may choose not to offer entire Additional Amount or part of the
Additional Amount to investors for subscription through FFO, even though the subscriptions received from all the categories of
investors to subscribe FFO units would be over and above the Initial Amount or even the Maximum Amount to be Raised as stated
above. For more details refer supplement to SID.
5. Discount Offered by GOI:
Discount of 5 (five) % on the “FFO Reference Market Price” of the underlying shares of Nifty CPSE Index shall be offered to FFO by
GOI.
FFO Reference Market Price:
The price determined based on the average of full day volume weighted average price (VWAP) on the NSE during the Non Anchor
Investor FFO Period (inclusive of Non Anchor Investor FFO Period open as well as close date) for each of the index constituents of
the Nifty CPSE Index.
Note - Discount on the ‘FFO Reference Market Price’ may not be a discount to the closing market price of the underlying shares of
Nifty CPSE Index on the FFO Allotment Date.
6. FFO Units will rank pari-passu to the existing Units of the CPSE ETF.
27
Slide
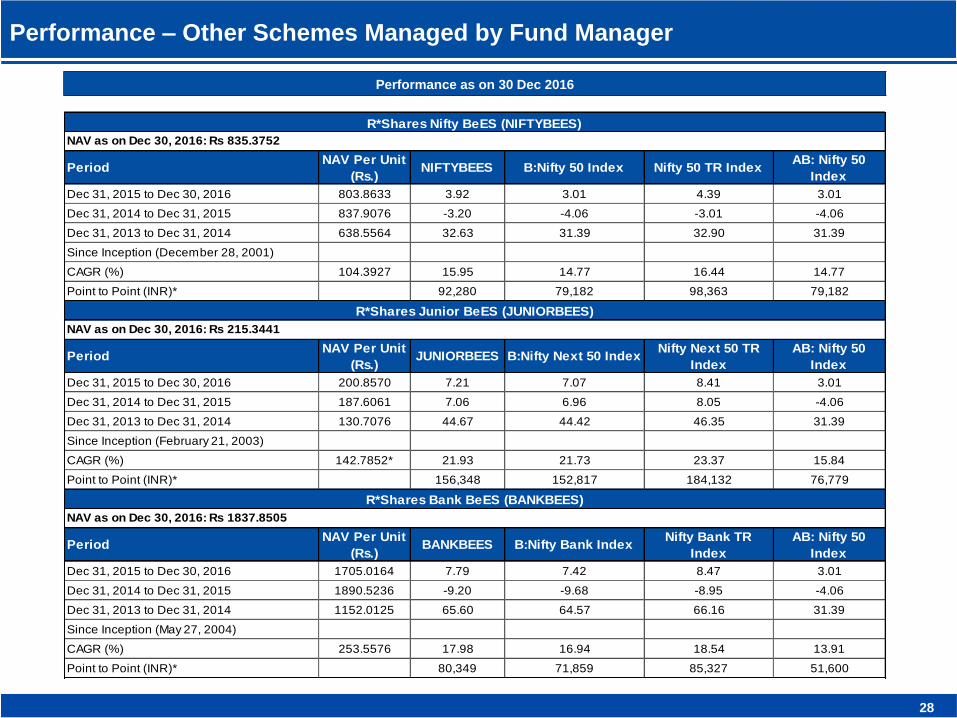
Performance – Other Schemes Managed by Fund Manager
Performance as on 30 Dec 2016
28
PeriodNAV Per Unit
(Rs.)NIFTYBEES B:Nifty 50 Index Nifty 50 TR Index
AB: Nifty 50
Index
Dec 31, 2015 to Dec 30, 2016 803.8633 3.92 3.01 4.39 3.01
Dec 31, 2014 to Dec 31, 2015 837.9076 -3.20 -4.06 -3.01 -4.06
Dec 31, 2013 to Dec 31, 2014 638.5564 32.63 31.39 32.90 31.39
Since Inception (December 28, 2001)
CAGR (%) 104.3927 15.95 14.77 16.44 14.77
Point to Point (INR)* 92,280 79,182 98,363 79,182
PeriodNAV Per Unit
(Rs.)JUNIORBEES B:Nifty Next 50 Index
Nifty Next 50 TR
Index
AB: Nifty 50
Index
Dec 31, 2015 to Dec 30, 2016 200.8570 7.21 7.07 8.41 3.01
Dec 31, 2014 to Dec 31, 2015 187.6061 7.06 6.96 8.05 -4.06
Dec 31, 2013 to Dec 31, 2014 130.7076 44.67 44.42 46.35 31.39
Since Inception (February 21, 2003)
CAGR (%) 142.7852* 21.93 21.73 23.37 15.84
Point to Point (INR)* 156,348 152,817 184,132 76,779
PeriodNAV Per Unit
(Rs.)BANKBEES B:Nifty Bank Index
Nifty Bank TR
Index
AB: Nifty 50
Index
Dec 31, 2015 to Dec 30, 2016 1705.0164 7.79 7.42 8.47 3.01
Dec 31, 2014 to Dec 31, 2015 1890.5236 -9.20 -9.68 -8.95 -4.06
Dec 31, 2013 to Dec 31, 2014 1152.0125 65.60 64.57 66.16 31.39
Since Inception (May 27, 2004)
CAGR (%) 253.5576 17.98 16.94 18.54 13.91
Point to Point (INR)* 80,349 71,859 85,327 51,600
NAV as on Dec 30, 2016: Rs 835.3752
R*Shares Nifty BeES (NIFTYBEES)
R*Shares Bank BeES (BANKBEES)
R*Shares Junior BeES (JUNIORBEES)
NAV as on Dec 30, 2016: Rs 1837.8505
NAV as on Dec 30, 2016: Rs 215.3441
Slide
Performance – Other Schemes Managed by Fund Manager contd.
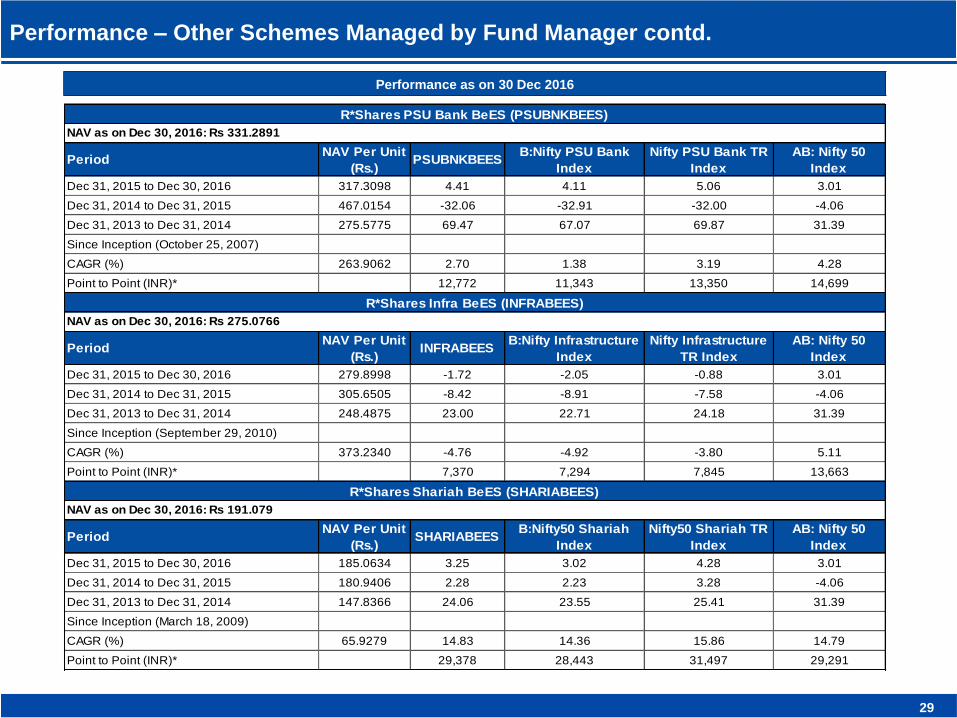
Performance as on 30 Dec 2016
29
PeriodNAV Per Unit
(Rs.)PSUBNKBEES
B:Nifty PSU Bank
Index
Nifty PSU Bank TR
Index
AB: Nifty 50
Index
Dec 31, 2015 to Dec 30, 2016 317.3098 4.41 4.11 5.06 3.01
Dec 31, 2014 to Dec 31, 2015 467.0154 -32.06 -32.91 -32.00 -4.06
Dec 31, 2013 to Dec 31, 2014 275.5775 69.47 67.07 69.87 31.39
Since Inception (October 25, 2007)
CAGR (%) 263.9062 2.70 1.38 3.19 4.28
Point to Point (INR)* 12,772 11,343 13,350 14,699
PeriodNAV Per Unit
(Rs.)INFRABEES
B:Nifty Infrastructure
Index
Nifty Infrastructure
TR Index
AB: Nifty 50
Index
Dec 31, 2015 to Dec 30, 2016 279.8998 -1.72 -2.05 -0.88 3.01
Dec 31, 2014 to Dec 31, 2015 305.6505 -8.42 -8.91 -7.58 -4.06
Dec 31, 2013 to Dec 31, 2014 248.4875 23.00 22.71 24.18 31.39
Since Inception (September 29, 2010)
CAGR (%) 373.2340 -4.76 -4.92 -3.80 5.11
Point to Point (INR)* 7,370 7,294 7,845 13,663
PeriodNAV Per Unit
(Rs.)SHARIABEES
B:Nifty50 Shariah
Index
Nifty50 Shariah TR
Index
AB: Nifty 50
Index
Dec 31, 2015 to Dec 30, 2016 185.0634 3.25 3.02 4.28 3.01
Dec 31, 2014 to Dec 31, 2015 180.9406 2.28 2.23 3.28 -4.06
Dec 31, 2013 to Dec 31, 2014 147.8366 24.06 23.55 25.41 31.39
Since Inception (March 18, 2009)
CAGR (%) 65.9279 14.83 14.36 15.86 14.79
Point to Point (INR)* 29,378 28,443 31,497 29,291
R*Shares Shariah BeES (SHARIABEES)
R*Shares PSU Bank BeES (PSUBNKBEES)
R*Shares Infra BeES (INFRABEES)
NAV as on Dec 30, 2016: Rs 191.079
NAV as on Dec 30, 2016: Rs 275.0766
NAV as on Dec 30, 2016: Rs 331.2891
Slide
Performance – Other Schemes Managed by Fund Manager contd.
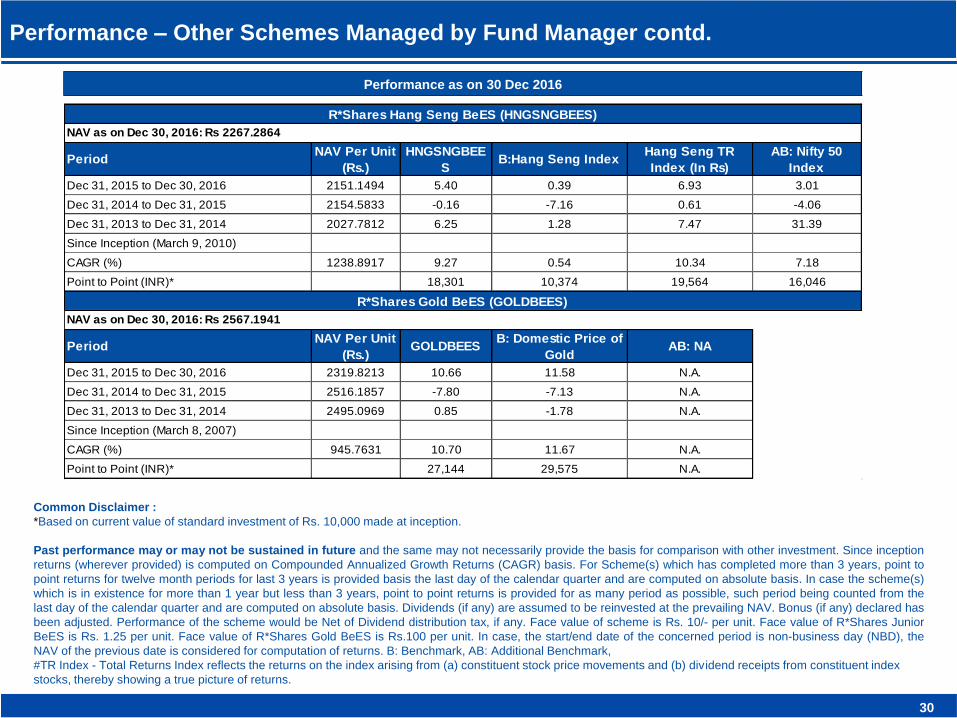
Performance as on 30 Dec 2016
30
Common Disclaimer :
*Based on current value of standard investment of Rs. 10,000 made at inception.
Past performance may or may not be sustained in future and the same may not necessarily provide the basis for comparison with other investment. Since inception
returns (wherever provided) is computed on Compounded Annualized Growth Returns (CAGR) basis. For Scheme(s) which has completed more than 3 years, point to
point returns for twelve month periods for last 3 years is provided basis the last day of the calendar quarter and are computed on absolute basis. In case the scheme(s)
which is in existence for more than 1 year but less than 3 years, point to point returns is provided for as many period as possible, such period being counted from the
last day of the calendar quarter and are computed on absolute basis. Dividends (if any) are assumed to be reinvested at the prevailing NAV. Bonus (if any) declared has
been adjusted. Performance of the scheme would be Net of Dividend distribution tax, if any. Face value of scheme is Rs. 10/- per unit. Face value of R*Shares Junior
BeES is Rs. 1.25 per unit. Face value of R*Shares Gold BeES is Rs.100 per unit. In case, the start/end date of the concerned period is non-business day (NBD), the
NAV of the previous date is considered for computation of returns. B: Benchmark, AB: Additional Benchmark,
#TR Index - Total Returns Index reflects the returns on the index arising from (a) constituent stock price movements and (b) dividend receipts from constituent index
stocks, thereby showing a true picture of returns.
PeriodNAV Per Unit
(Rs.)
HNGSNGBEE
SB:Hang Seng Index
Hang Seng TR
Index (In Rs)
AB: Nifty 50
Index
Dec 31, 2015 to Dec 30, 2016 2151.1494 5.40 0.39 6.93 3.01
Dec 31, 2014 to Dec 31, 2015 2154.5833 -0.16 -7.16 0.61 -4.06
Dec 31, 2013 to Dec 31, 2014 2027.7812 6.25 1.28 7.47 31.39
Since Inception (March 9, 2010)
CAGR (%) 1238.8917 9.27 0.54 10.34 7.18
Point to Point (INR)* 18,301 10,374 19,564 16,046
PeriodNAV Per Unit
(Rs.)GOLDBEES
B: Domestic Price of
GoldAB: NA
Dec 31, 2015 to Dec 30, 2016 2319.8213 10.66 11.58 N.A.
Dec 31, 2014 to Dec 31, 2015 2516.1857 -7.80 -7.13 N.A.
Dec 31, 2013 to Dec 31, 2014 2495.0969 0.85 -1.78 N.A.
Since Inception (March 8, 2007)
CAGR (%) 945.7631 10.70 11.67 N.A.
Point to Point (INR)* 27,144 29,575 N.A.
R*Shares Hang Seng BeES (HNGSNGBEES)
R*Shares Gold BeES (GOLDBEES)
NAV as on Dec 30, 2016: Rs 2567.1941
NAV as on Dec 30, 2016: Rs 2267.2864
Slide
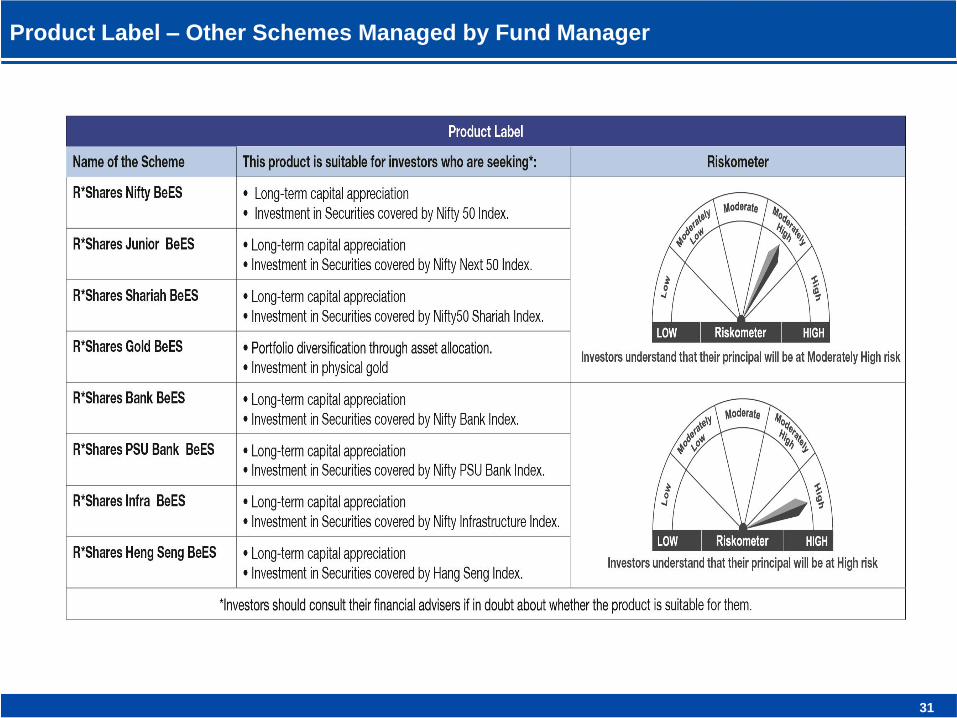
Product Label – Other Schemes Managed by Fund Manager
31
Slide
Disclaimers
Scheme Specific Risk Factors: Risk relating to CPSE Securities - Since the CPSE companies are substantially owned by the GOI, the
GOI may take actions with respect to the CPSE sector that may not be in the best interests of Unit holders. There can be no assurance
that such incidents would not result in a fall in price of the underlying securities constituting the Nifty CPSE Index and correspondingly the
NAV of the Scheme. Further trading volumes and settlement periods may restrict liquidity in equity and debt investments. Investment in
Debt is subject to price, credit, and interest rate risk. The NAV of the Scheme may be affected, inter alia, by changes in the market
conditions, interest rates, trading volumes, settlement periods and transfer procedures. The NAV may also be subjected to risk associated
with tracking error, investment in derivatives or script lending as may be permissible by the Scheme Information Document (SID). For
further details please refer SID
BSE Disclaimer: It is to be distinctly understood that the permission given by BSE Ltd. should not in any ways be deemed or construed
that the SID has been cleared or approved by BSE Ltd. nor does it certify the correctness or completeness of any of the contents of the
SID. The investors are advised to refer to the SID for the full text of the Disclaimer clause of the BSE Ltd.
NSE Disclaimer: It is to be distinctly understood that the permission given by NSE should not in any way be deemed or construed that
the SID has been cleared or approved by NSE nor does it certify the correctness or completeness of any of the contents of the SID. The
investors are advised to refer to the SID for the full text of the Disclaimer Clause of NSE
Disclaimer by Index Provider
a. The product i.e. CPSE ETF, is not sponsored, endorsed, sold or promoted by IISL. IISL does not make any representation or warranty,
express or implied to the Unit holders of any product or any member of the public regarding the advisability of investing in Securities
generally or in any product particularly or the ability of Nifty CPSE Index to track general stock market performance in India. The
relationship of IISL to Reliance Nippon Life Asset Management Limited (RNLAM) (formerly Reliance Capital Asset Management Limited)
is only in respect of the licensing of certain trademarks and trade-names of their index, which is determined, composed and calculated by
IISL without regard to RNLAM or any product. IISL has no obligation to take the needs of RNLAM or the Unit holders of the products into
consideration in determining, composing or calculating Nifty CPSE Index. IISL is not responsible for and has not participated in the
determination of the timing of, prices at, or quantities of the products to be issued or in the determination or calculation of the equation by
which the products are to be converted into cash. IISL has no obligation or liability in connection with the administration or marketing or
trading of the products.
b. IISL does not guarantee the accuracy and/or the completeness of the Nifty CPSE Index or any data included therein and they shall have
no liability for any errors, omissions, or interruptions therein. IISL makes no warranty, express or implied, as to the results to be obtained
by the RNLAM, Unit holders of the products or any other persons or entities from the use of the Nifty CPSE Index or any data included
therein. IISL makes no express or implied warranties and expressly disclaim all warranties of merchantability or fitness for a particular
purpose or use with respect to the index or any data included therein. Without limiting any of the foregoing, in no event shall IISL have any
liability for any special, punitive, indirect or consequential damages (including lost profits), even if notified of the possibility of such
damages.
32
Slide
Disclaimers
Disclaimers
The information herein is meant only for general reading purposes and the views being expressed only constitute opinions and
therefore cannot be considered as guidelines, recommendations or as a professional guide for the readers. Certain factual and
statistical information (historical as well as projected) pertaining to Industry and markets have been obtained from independent third-
party sources, which are deemed to be reliable. It may be noted that since RNLAM has not independently verified the accuracy or
authenticity of such information or data, or for that matter the reasonableness of the assumptions upon which such data and
information has been processed or arrived at; RNLAM does not in any manner assures the accuracy or authenticity of such data and
information. Some of the statements & assertions contained in these materials may reflect RNLAM’s views or opinions, which in turn
may have been formed on the basis of such data or information.
Before making any investments, the readers are advised to seek independent professional advice, verify the contents in order to
arrive at an informed investment decision. None of the Sponsor, the Investment Manager, the Trustee, their respective directors,
employees, affiliates or representatives shall be liable in any way for any direct, indirect, special, incidental, consequential, punitive
or exemplary damages, including on account of lost profits arising from the information contained in this material.
Mutual Fund investments are subject to market risks, read all scheme related documents carefully.