Crack growth in discontinuous glass fibre reinforced polypropylene under dynamic and static loading conditions A. Pegoretti * , T. Ricco 1 Department of Materials Engineering, University of Trento, via Mesiano 77-38050 Trento, Italy Received 5 January 2001; accepted 28 August 2002 Abstract Crack propagation in single edge notched tensile specimens of isotactic polypropylene reinforced with short E-glass fibres has been investigated under both fatigue and creep loading conditions. Fatigue crack propagation (FCP) experiments have been performed at three different frequencies (0.1, 1, 10 Hz) and at a mean applied tensile load of 1200 N. Isothermal creep crack propagation (CCP) tests have been conducted under a constant tensile applied load of 1200 N at various temperatures in the range from 32 to 60 8C. Analysis of FCP data allowed an estimation of the pure fatigue and pure creep components of the crack velocity under the adopted cyclic loading conditions. Crack growth at low frequencies (0.1 and 1 Hz) is mainly associated with a non-isothermal creep process. At higher frequency (10 Hz), the pure fatigue contribution appeared more pronounced. Finally, the comparison of FCP and CCP as a function of the mean applied stress intensity factor confirmed the major contribution of creep crack growth during FCP process at low frequencies. q 2002 Published by Elsevier Science Ltd. Keywords: A. Discontinuous reinforcement; A. Thermoplastic resin; B. Creep; B. Fatigue 1. Introduction Due to its outstanding cost-to-performance ratio, low density, and ease of processing, isotactic polypropylene (iPP) has become one of the fastest developing thermo- plastic polymers throughout the world [1]. A variety of performance characteristics can be achieved through modifications induced by molecular orientation [2], particulate filler addition [3], and reinforcement with short or long fibres [4]. In particular, short glass fibres are generally added into iPP in order to enhance its mechanical properties, such as stiffness and fracture resistance, without substantially impairing the good processability of the material. Moreover, the presence of short glass fibre in iPP reduces the propensity of this material to deform under fatigue and creep conditions, and hence helps to prevent failure in load-bearing applications. Fatigue and creep damage is generally associated with the initiation and propagation of cracks in the matrix and/or the destruction of the bonding at the fibre/matrix interface. For both neat polypropylene and its filled, short fibre and fibre mat reinforced composites, fractures mechanics approaches [5] have proven useful in providing a framework for characterization under service conditions and in defining safe operating conditions. Fatigue crack propagation (FCP) in short fibre reinforced iPP is generally characterised by the presence of a stable crack acceleration range [5–10] which can be well described by the following Paris- Erdogan relationship [11] da dN F ¼ ADK m ð1Þ where ðda=dNÞ F is the fatigue crack growth rate per cycle, and DK is the difference between the maximum and minimum mode I, or opening mode, stress intensity factors in the fatigue cycle. A and m are pre-exponential and exponential constants, respectively. Eq. (1) can also be written as da dt F ¼ A 0 DK m ð2Þ where ðda=dtÞ F is the fatigue crack growth velocity and A 0 ¼ Að1=f Þ; f being the frequency of the fatigue load. 1359-835X/02/$ - see front matter q 2002 Published by Elsevier Science Ltd. PII: S1359-835X(02)00112-4 Composites: Part A 33 (2002) 1539–1547 www.elsevier.com/locate/compositesa 1 Current address: Department of Chemistry and Physics for Engineering and Materials, University of Brescia, via Valotti 9-25123 Brescia, Italy. (J. Ricco). * Corresponding author. Tel.: þ 39-0461-882413; fax: þ 39-0461- 881977. E-mail address: [email protected] (A. Pegoretti).
Transcript
Crack growth in discontinuous glass fibre reinforced polypropylene
under dynamic and static loading conditions
A. Pegoretti*, T. Ricco1
Department of Materials Engineering, University of Trento, via Mesiano 77-38050 Trento, Italy
Received 5 January 2001; accepted 28 August 2002
Abstract
Crack propagation in single edge notched tensile specimens of isotactic polypropylene reinforced with short E-glass fibres has been
investigated under both fatigue and creep loading conditions. Fatigue crack propagation (FCP) experiments have been performed at three
different frequencies (0.1, 1, 10 Hz) and at a mean applied tensile load of 1200 N. Isothermal creep crack propagation (CCP) tests have been
conducted under a constant tensile applied load of 1200 N at various temperatures in the range from 32 to 60 8C. Analysis of FCP data allowed
an estimation of the pure fatigue and pure creep components of the crack velocity under the adopted cyclic loading conditions. Crack growth
at low frequencies (0.1 and 1 Hz) is mainly associated with a non-isothermal creep process. At higher frequency (10 Hz), the pure fatigue
contribution appeared more pronounced. Finally, the comparison of FCP and CCP as a function of the mean applied stress intensity factor
confirmed the major contribution of creep crack growth during FCP process at low frequencies.
q 2002 Published by Elsevier Science Ltd.
Keywords: A. Discontinuous reinforcement; A. Thermoplastic resin; B. Creep; B. Fatigue
1. Introduction
Due to its outstanding cost-to-performance ratio, low
density, and ease of processing, isotactic polypropylene
(iPP) has become one of the fastest developing thermo-
plastic polymers throughout the world [1]. A variety of
performance characteristics can be achieved through
modifications induced by molecular orientation [2],
particulate filler addition [3], and reinforcement with
short or long fibres [4]. In particular, short glass fibres
are generally added into iPP in order to enhance its
mechanical properties, such as stiffness and fracture
resistance, without substantially impairing the good
processability of the material. Moreover, the presence of
short glass fibre in iPP reduces the propensity of this
material to deform under fatigue and creep conditions, and
hence helps to prevent failure in load-bearing applications.
Fatigue and creep damage is generally associated with the
initiation and propagation of cracks in the matrix and/or the
destruction of the bonding at the fibre/matrix interface. For
both neat polypropylene and its filled, short fibre and fibre
mat reinforced composites, fractures mechanics approaches
[5] have proven useful in providing a framework for
characterization under service conditions and in defining
For the creep crack propagation (CCP), a description
similar to Eq. (2) is used [12]
da
dt
� �C¼ BKn ð3Þ
where ðda=dtÞC is the creep crack growth velocity, K is the
applied stress intensity factor under mode I loading
condition, B and n are pre-exponential and exponential
constants, respectively.
Under cycling loading at positive values of the mean
load, the crack propagation rate in polymers is recognised to
consist of the contributions of both fatigue and creep crack
growth [8–10,13–17]. The analysis of FCP data obtained in
a previous work on composites constituted by polypropy-
lene reinforced with short glass fibres, showed that the crack
propagation rate is determined mostly by viscoelastic creep
processes at the crack tip, the role of fatigue appearing quite
secondary [8–10]. However, during crack propagation the
energy dissipation due to the dynamic load produces a
temperature increase at the crack tip in these materials.
Although it is difficult to measure the real extent of this
temperature increase, experimental evidence of the non-
isothermal character of the crack growth was found [9].
In the present work the role of fatigue and non-isothermal
viscoelastic creep in the crack propagation within poly-
propylene/short-glass-fibre composites is investigated
further. To achieve this, experiments of two types were
conducted: FCP at a range of test frequencies and isothermal
CCP at different temperatures.
2. Experimental details
2.1. Materials
Injection moulded square plaques (dimensions
127 £ 127 £ 2.7 mm3) of iPP reinforced with 10 wt%
percent of short E-glass fibres were supplied by Montell
Polyolefins SpA (Ferrara, Italy). The matrix was a
commercial grade polypropylene with a melt flow index
equal to 3.5 dg/min. The short E-glass fibres (Owens
Coming R34B), with an average initial length of 4.5 mm
and a diameter of 14 mm, were treated with a polypropylene
compatible coating (Hercoprime HG 201). After compound-
ing and injection-moulding the manufacturer evaluated an
average fibre length of about 0.5–0.7 mm. Differential
scanning calorimetry measurements performed on the
composite indicated a melting temperature of 174 8C and
a crystallinity content of about 62% [9]. For FCP and CCP
tests, single edge notched tension (SENT) specimens, with
dimensions as reported in Fig. 1, were machined from the
injection-moulded plaques along the diagonal. An initial
sharp notch of about 3 mm in length was introduced in the
specimens by means of a razor blade attached to a CEAST
saw cutter.
2.2. Fatigue crack propagation tests
Fatigue tests were performed at room temperature
(normally 25 8C) under tension–tension sinusoidal load
control, using a closed loop servohydraulic MTS 858 Mini
Bionix testing machine. The mean load was 1200 N, the
minimum to maximum load ratio was 0.4, and the cyclic
frequencies were 0.1, 1, and 10 Hz. The crack length, a, was
measured as a function of time, t, by a video-camera, a
video-recorder, and an image analyser system. At least three
specimens were tested for each experimental situation, and
an average crack propagation rate, da/dt, was obtained as
the derivative of the best fitting third order polynomial
curve. Parameters of best fitting polynomial function,
aðtÞ ¼ At3 þ Bt2 þ Ct þ D; obtained by least squares
regression of data, and the associated correlation coefficient,
R, are reported in Table 1. Curves of da/dN, where N is the
number of cycles, were easily obtained by considering the
frequency of the oscillating load. The stress intensity factor,
K, at the crack tip was evaluated on the basis of the linear
elastic fracture mechanics approach which is often used also
to describe fracture and fatigue behaviour of non-linear and
heterogeneous materials [15]. The specific equation for the
stress intensity factor amplitude, DK, for SENT specimens
is [18]
DK ¼DP
BW
ffiffia
p1:9920:41
a
Wþ18:7
a
W
� �2"
238:48a
W
� �3
þ53:85a
W
� �4#
ð4Þ
where DP is the difference between the maximum and the
minimum applied loads, B and W are the thickness and
width of the specimens.
The temperature at the surface of the specimen near the
crack tip region during FCP tests was monitored by an
infrared sensing thermography camera (Hughes thermal
video system TVS-300 Series). Scanning electron
microscopy (SEM) was used to study the fracture surface
of failed specimens. The microscope was a Cambridge
Fig. 1. Dimensions of polypropylene/glass SENT specimen and position
with respect to the injection moulded plaque.
A. Pegoretti, T. Ricco / Composites: Part A 33 (2002) 1539–15471540
Stereoscan 200 and the acceleration voltage used was
20 kV. Prior to examination, the surfaces were sputtered
with gold.
2.3. Creep crack propagation tests
SENT specimens were tested under creep conditions by
applying a constant tensile load, P, of 1200 N using an
Instron 4502 test machine equipped with a thermostatic
chamber (Instron model 3119). Creep crack growth was
evaluated at various temperatures in the range between 32
and 60 8C. The crack length during creep tests was
monitored by using the same system (video-camera and
video-recorder) used for the FCP tests.
The applied stress intensity factor, K, was evaluated by
Eq. (4) where P instead of DP was considered. The crack
velocity da/dt was evaluated by interpolating the crack
length versus time curves with a best fitting third order
polynomial function (Table 1) [19].
2.4. Tensile tests
Uniaxial tensile tests were performed on rectangular
unnotched specimens of 27 £ 120 £ 2.7 mm3 at a cross-
head speed of 1 mm/min using an Instron 4502 test machine
equipped with a 10 kN load cell. Use of a thermostatic
chamber (Instron model 3119) enabled test to be carried out
over a range of temperature. The yield stress was evaluated
as the zero slope point on the stress–strain curves of at least
three specimens.
3. Results and discussion
3.1. Fatigue crack propagation
During FCP experiments the crack advance is charac-
terized by some damage and branching, but in any case a
‘prevalent crack’ can always be detected so that the failure
behaviour of the material is mainly governed by this
‘prevalent crack’, with all other damage processes (includ-
ing branching) of secondary importance. The appearance of
the fracture surfaces of specimens failed after FCP test are
similar and independent of the test frequency. A photograph
Table 1
Parameters of the best fitting third order polynomial function, aðtÞ ¼ At3 þ Bt2 þ Ct þ D; obtained by least squares regression of fatigue and creep crack
propagation data. Correlation coefficient, r, is also reported
Test conditions Specimen A (mm/s3) B (mm/s3) C (mm/s) D (mm) Correlation coefficient, r
Fatigue crack propagation (FCP)
f ¼ 0.1 Hz I 3.474 £ 10211 23.232 £ 1027 2.291 £ 1023 4.031 0.99498
Fig. 2. Scanning electron microscope (SEM) picture of the fatigue fracture
surface of iPP reinforced by 10 wt% of coupled glass fibers.
A. Pegoretti, T. Ricco / Composites: Part A 33 (2002) 1539–1547 1541
of the characteristic appearance of the fracture surface of a
fatigue cracked specimen is shown in Fig. 2. It is interesting
to observe that the fracture surface appears relatively
smooth, showing a number of debonded fibers.
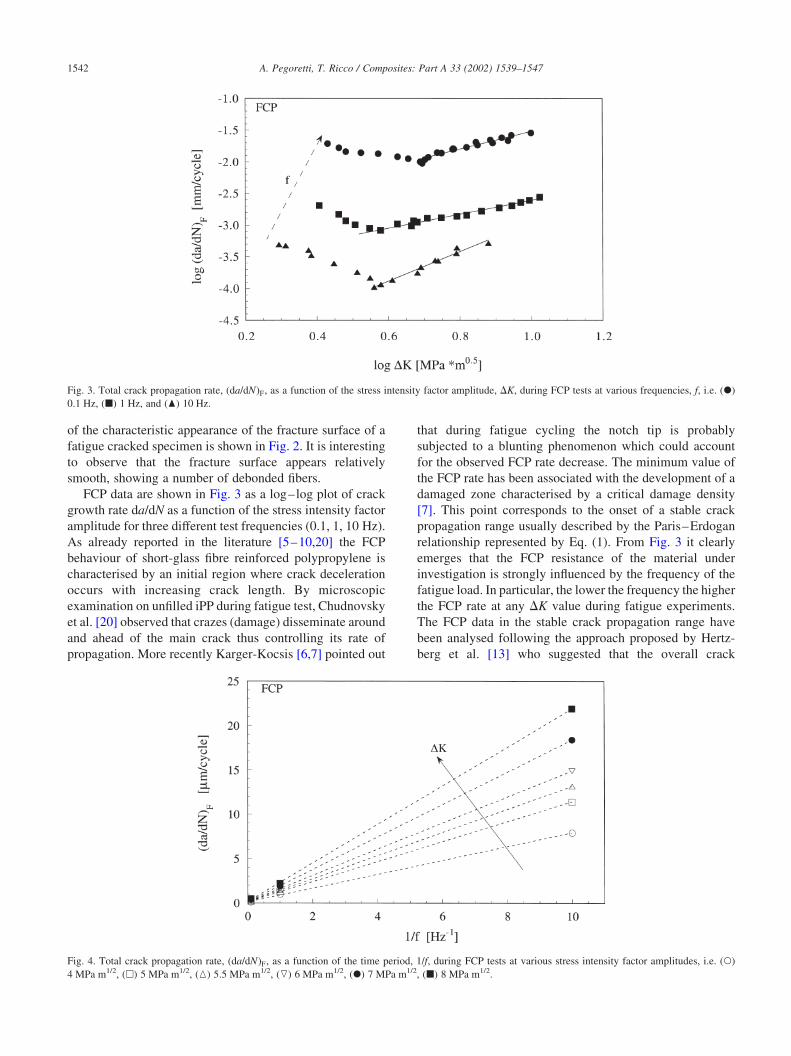
FCP data are shown in Fig. 3 as a log–log plot of crack
growth rate da/dN as a function of the stress intensity factor
amplitude for three different test frequencies (0.1, 1, 10 Hz).
As already reported in the literature [5–10,20] the FCP
behaviour of short-glass fibre reinforced polypropylene is
characterised by an initial region where crack deceleration
occurs with increasing crack length. By microscopic
examination on unfilled iPP during fatigue test, Chudnovsky
et al. [20] observed that crazes (damage) disseminate around
and ahead of the main crack thus controlling its rate of
propagation. More recently Karger-Kocsis [6,7] pointed out
that during fatigue cycling the notch tip is probably
subjected to a blunting phenomenon which could account
for the observed FCP rate decrease. The minimum value of
the FCP rate has been associated with the development of a
damaged zone characterised by a critical damage density
[7]. This point corresponds to the onset of a stable crack
propagation range usually described by the Paris–Erdogan
relationship represented by Eq. (1). From Fig. 3 it clearly
emerges that the FCP resistance of the material under
investigation is strongly influenced by the frequency of the
fatigue load. In particular, the lower the frequency the higher
the FCP rate at any DK value during fatigue experiments.
The FCP data in the stable crack propagation range have
been analysed following the approach proposed by Hertz-
berg et al. [13] who suggested that the overall crack
Fig. 3. Total crack propagation rate, ðda=dNÞF; as a function of the stress intensity factor amplitude, DK, during FCP tests at various frequencies, f, i.e. (X)
0.1 Hz, (B) 1 Hz, and (O) 10 Hz.
Fig. 4. Total crack propagation rate, ðda=dNÞF; as a function of the time period, 1/f, during FCP tests at various stress intensity factor amplitudes, i.e. (W)
A. Pegoretti, T. Ricco / Composites: Part A 33 (2002) 1539–15471542
extension rate during FCP, ðda=dNÞF; could be considered as
composed of two terms, i.e. pure fatigue component, ðda=
dNÞFf ; and a pure creep component ðda=dNÞFc; as indicated
in the following equation:
da
dN
� �F¼
da
dN
� �Ffþ
da
dN
� �Fc
ð5Þ
Wyzgoski et al. [14] proposed to rearrange Eq. (5) in the
following form:
da
dN
� �F¼
da
dN
� �Ffþ
da
dt
� �Fc
dt
dNð6Þ
By considering that dt=dN is the time period of the cyclic
oscillation, which is also equal to the inverse of
the frequency, Eq. (6) can also be written as
da
dN
� �F¼
da
dN
� �Ffþ
da
dt
� �Fc
1
fð7Þ
where f is the test frequency.
The linear relationship existing between the total FCP
rate per cycle and 1/f is evident in Fig. 4, for various levels
of stress intensity factor amplitude reached in the stable
crack acceleration region. It is worth nothing that according
to Eq. (7), for any given DK value, the slope of the linear
regression line in Fig. 4 represents the crack growth velocity
contribution due to viscoelastic creep while the intercept
with the axis of ordinates represents the crack growth rate
component related to pure fatigue. On a log–log plot this
latter component increases linearly with DK as shown in
Fig. 5, which can hence be considered as a Paris plot for
Fig. 5. Pure fatigue component, ðda=dNÞFf ; as a function of the stress intensity factor amplitude, DK, during FCP tests.
Fig. 6. Total crack velocity, ðda=dtÞF; during FCP tests at (W) 0.1 Hz, (A) 1 Hz, and (K) 10 Hz compared with the calculated (P) pure creep component,
ðda=dtÞFc; and pure fatigue components, ðda=dtÞFf ; at (X) 0.1 Hz, (B) 1 Hz, and (O) 10 Hz.
A. Pegoretti, T. Ricco / Composites: Part A 33 (2002) 1539–1547 1543
the pure FCP component. On the basis of the information
reported in Fig. 5 it is now possible to separate and estimate
the components of the fatigue and CCP velocities within the
data in Fig. 3. The separated data are shown in Fig. 6; the
pure creep crack velocity component is independent of
frequency while the pure fatigue crack growth depends
linearly on the test frequency, being ðda=dNÞFf ¼ ðda=dtÞFf �
ð1=f Þ: It is interesting to observe that during the FCP
experiments at low frequencies (0.1 and 1 Hz) crack
propagation mainly occurs by viscoelastic creep since the
pure fatigue crack velocity components are one to two
orders of magnitude lower than the pure creep crack
velocity. At higher frequency (10 Hz) the creep and fatigue
crack components are of similar magnitude.
The temperature measurements on the specimen surface
near the crack tip zone made by the infrared camera
indicated that a hysteretic heating occurs. As shown in Fig. 7
the crack tip temperature is characterised by a trend which
quite rapidly increases during the initial stages, steadily
increases during the stable FCP propagation, and abruptly
increases when the specimen is approaching fracture
instability. The intensity of this temperature increase is
more pronounced as the test frequency increases.
3.2. Creep crack propagation
Crack extension, Da, versus loading time during CCP
experiments at various temperatures are reported in Fig. 8.
The similarity of the fracture kinetics at different tempera-
tures clearly appears, the effect of increasing temperature
consisting substantially in a shortening of the whole fracture
process. The kinetics of crack propagation under creep
Fig. 7. Temperature measured on the specimen surface near the crack tip during FCP experiments at (W) 0.1 Hz, (A) 1 Hz, and (K) 10 Hz.
Fig. 8. Crack length increment, Da, versus time for CCP tests performed at various temperatures. Symbols refer to (X) 32 8C, (K) 35 8C, (W) 40 8C, (A) 45 8C,
( £ ) 50 8C, (L) 55 8C, and (S) 60 8C.
A. Pegoretti, T. Ricco / Composites: Part A 33 (2002) 1539–15471544
condition is extremely sensitive to test temperature. In fact it
is well known that for many different materials, including
plastics, the lifetime, t, depends on the absolute tempera-
ture, T, through a relationship in the form [21]
t ¼ t0 expðU0 2 gsÞ
kT
� �ð8Þ
where k is the Boltzman’s constant, s is the applied stress;
t0; U0 and g are material constants. In our case,
experimental data are in good accordance with Eq. (8) as
shown by the linear relationship between the logarithm of
the time to failure and the inverse of the absolute
temperature, Fig. 9. The model leading to Eq. (8) is based
on the gradual exhaustion of the load-bearing capability of
the polymer through time-dependent breakage of primary
bonds or polymer chains (molecular approach) [22].
In general, creep rupture of a polymer is a result of various
events like viscoelastic deformation, primary and secondary
bond failure, and yielding [23]. In the present case yielding
seems to play a major role, as the yield stress of the
composite is strongly dependent on temperature in the range
of interest, see Fig. 9.
Crack length versus time curves (Fig. 8) have been
interpolated with a best fitting third order polynomial
function in order to evaluate a CCP velocity, ðda=dtÞC;
which is plotted in Fig. 10 as a function of the applied stress
intensity factor on a log–log plot. It is interesting to observe
that CCP strongly resemble FCP behaviour, with the crack
velocity initially decreasing to a minimum value and then
steadily increasing up to final failure. The crack deceleration
observed during CCP experiments could be very likely due
to a blunting process localized at the crack tip, as discussed
Fig. 9. Temperature dependence of the time to failure, t, in CCP experiments (X), and of the yield stress, sy, in tensile tests (W).
Fig. 10. Crack velocity ðda=dtÞC versus the stress intensity factor for CCP tests performed at various temperatures. Symbols refer to (X) 32 8C, (K) 35 8C, (W)
40 8C, (A) 45 8C, ( £ ) 50 8C, (L) 55 8C, and (S) 60 8C.
A. Pegoretti, T. Ricco / Composites: Part A 33 (2002) 1539–1547 1545
for the FCP tests. In order to compare FCP and CCP data it
is convenient to define a mean applied stress intensity factor
for the FCP tests, Km, which is related to DK through the
following relationship
Km ¼1 þ R
2ð1 2 RÞDK ð9Þ
where R is the minimum to maximum load ratio.
Of course for CCP test Km is equal to the applied stress
intensity factor K. Fatigue and creep crack velocities in the
stable crack acceleration region can now be compared as
shown in Fig. 11. The results obtained for the exponential (m
and n ) and pre-exponential (A0 and B ) terms of Eqs. (2) and
(3) are summarized in Table 2. It is worth noting that FCP
lines at 0.1 and 1 Hz are characterised by a slopes of about 1.4
and 1.1, respectively, which are only slightly higher than the
average slope of the CCP lines (about 0.9 ^ 0.2). It can
observed that FCP at low frequencies (0.1 and 1 Hz) are
substantially equivalent to an isothermal CCP at 45 8C. It is
well known that temperature during FCP is not uniformly
distributed in the specimen cross-section and it has a peak at
the crack tip [14,15,24]. Consequently such a temperature
level cannot strictly be considered the actual temperature of
the specimen during FCP, but it can reasonably represents an
equivalent mean temperature at which FCP occurs at 0.1 and
1 Hz. Moreover, it is worthwhile to observe that this
temperature level is considerably higher than that measured
by the infrared analysis of the specimen surface during FCP
which spans from about 26 to 30 8C in the stable crack
acceleration region. At higher frequency (10 Hz) FCP data
line is characterised by a slope much steeper (about 2.3) than
the CCP line. This behaviour could be related to the presence
of a higher pure fatigue component, as already evidenced in
Section 3.1, as well as to a stronger non-isothermal character
of the crack propagation. It should be recognized that a
change in the test frequency alters the number of loading
cycles per unit time and the integrated time under load for
each load excursion. It is thus reasonable to suppose that the
higher creep component evidenced for low frequency tests
could be mostly attributed to the higher time under load
during FCP experiments. The existence of a creep crack
growth contribution during FCP tests markedly dependent on
the time-under-load has been confirmed by various
FCP experiment conducted with different loading
waveforms [15].
4. Conclusions
On the basis of the results obtained in the present work, it
can be concluded that in iPP reinforced with short E-glass
fibres under cyclic loading at a positive mean stress, creep
Fig. 11. Comparison between total crack velocity versus mean stress intensity factor in the stable acceleration range for FCP tests performed at (X) 0.1 Hz, (B)
1 Hz, and (O) 10 Hz, and CCP tests performed at various temperatures (K) 35 8C, (W) 40 8C, (A) 45 8C, ( £ ) 50 8C, (L) 55 8C, and (S) 60 8C.
Table 2
Pre-exponential (A0 and B ) and exponential (m and n ) terms of Eqs. (2) and
(3)
FCP datalog A0 mm=s
ðMPa m1=2Þm
� �m
f ¼ 0.1 Hz 24.0182 1.4059
f ¼ 1 Hz 23.7838 1.0996
f ¼ 10 Hz 24.4419 2.3330
CCP data log Bmm=s
MPa m1=2Þn
� �n
T ¼ 32 8C 25.1157 0.9553
T ¼ 35 8C 24.7667 0.9097
T ¼ 40 8C 23.8250 0.4897
T ¼ 45 8C 23.7074 1.0837
T ¼ 50 8C 23.0229 0.7162
T ¼ 55 8C 22.7699 0.9952
T ¼ 60 8C 22.1251 1.0058
A. Pegoretti, T. Ricco / Composites: Part A 33 (2002) 1539–15471546
crack growth contribution can be the governing effect in
material failure, depending on test frequency. This effect,
qualitatively reported by the authors in previous works
[8–10] has been quantitatively assessed here. In particular,
it has been found that at low frequencies (0. 1 and 1 Hz) the
role of creep is predominant, creep crack being at least one
order of magnitude higher than the pure fatigue component.
At these frequency levels, the crack growth process can be
considered as equivalent to an isothermal creep crack
growth at a temperature much higher (up to 20 8C) than the
test temperature (room temperature). At higher frequency
(10 Hz) creep and fatigue crack growth becomes compar-
able giving about the same contribution to the overall crack.
The higher creep component evidenced for low frequency
tests could be mostly attributed to the higher time under load
during FCP experiments.
Acknowledgements
This work was partially supported by Consiglio Nazio-
nale delle Ricerche, CNR, Rome. Montell Polyolefins SpA
(now Basell Poliolefine Italia S.p.A.), Ferrara, Italy, is
kindly acknowledged for the provision of the materials. The
authors would like to thank Mr A. Dimauro for his
contribution to the experimental work.
References
[1] Bernreiter K, Hammerschmid K. Designing properties of polypropy-
lene. In: Karger-Kocsis J, editor. Polypropylene: an A–Z reference.
London: Kluwer; 1999. p. 148–57.
[2] Song J, Prox M, Weber A, Ehrenstein GW. Self-reinforcement of