Page 1
CRANFIELD UNIVERSITY
Jaume Serramalera Guerin
A METHODOLOGY FOR SUPPLY CHAIN REALIGNEMENT TO
SUPPORT BUSINESS GROWTH IN FOOTWEAR INDUSTRY
TRHOUGH RETAIL MARKET
Cranfield University
Management & Information Systems
MSc
Academic Year: 2019 - 2020
Supervisor: Dr. Isidro Durazo Cardenas
Associate Supervisor: Dr. Emanuele Pagone
September 2020
Page 2
CRANFIELD UNIVERSITY
Cranfield University
Management & Information Systems
MSc
Academic Year: 2019 - 2020
Jaume Serramalera Guerin
A METHODOLOGY FOR SUPPLY CHAIN REALIGNEMENT TO
SUPPORT BUSINESS GROWTH IN FOOTWEAR INDUSTRY
TRHOUGH RETAIL MARKET
Supervisor: Dr. Isidro Durazo Cardenas
Associate Supervisor: Dr. Emanuele Pagone
September 2020
This thesis is submitted in partial fulfilment of the requirements for
the degree of MSc. M&IS
(NB. This section can be removed if the award of the degree is
based solely on examination of the thesis)
© Cranfield University 2020. All rights reserved. No part of this
publication may be reproduced without the written permission of the
copyright owner.
Page 3
i
ABSTRACT
The current study examined what factors have to be considered to realign the business
model of a footwear SME towards a growth plan through retail market. The study looked
to examine literature regarding all steps within the supply chain from procurement to
distribution activities, including warehouse management. It brings together methods and
best practices used to streamline supply and retail operations performance.
On the other hand, a business case has been exhaustively analysed, to identify the
weaknesses an barriers that may prevent a business expansion from being successfully
carried out. It includes a detailed description of the business activities, its organization
structure and its financial situation.
A demand forecasting method has been specially tailored to the case study based on
qualitative and quantitative techniques identified in the previous research.
The data obtained in the research, the business analysis and the demand estimation are
then put through the development of new logistic strategies, with the aim to meet new
B2B demand and ensure financial growth.
Retailers can use these results as a guideline or methodology to develop factors
contributing to supply chain realignment and to support business growth through retail
market.
Keywords:
Retail Market, Supply Chain, Business Growth, Demand Forecasting.
Page 4
ii
ACKNOWLEDGEMENTS
First, I would like to thank my thesis supervisors, Dr. Isidro Durazo Cardenas and Dr.
Emanuele Pagone for providing support and crucial knowledge for the development of
my thesis research. For their effort and dedication in these unprecedented times that we
are all living. Despite the difficulties that we have faced, they have managed to keep us
in constant contact and guided me at every moment.
On the other hand, I would like to thank SAYE team, for the material and information
provided regarding their business. It has been very useful to validate the outcomes of
the project within a real business case. Special thanks to Lizzie Sabin, for her support,
experience, patience and motivation which have been a great help to the research.
Finally. I would also like to thank Cranfield University for providing me with the
opportunity and the necessary means to carry out this thesis.
Page 5
iii
TABLE OF CONTENTS
ABSTRACT ......................................................................................................... i
ACKNOWLEDGEMENTS .................................................................................... ii
LIST OF FIGURES ............................................................................................. v
LIST OF TABLES ............................................................................................... vi
LIST OF EQUATIONS ....................................................................................... vii
LIST OF ABBREVIATIONS .............................................................................. viii
1 PROJECT DEFINITION .................................................................................. 1
1.1 Background ............................................................................................... 1
1.2 Aim ............................................................................................................ 1
1.3 Objectives ................................................................................................. 1
1.4 Project Approach ...................................................................................... 2
1.5 Methodology and Expected Outcomes ..................................................... 2
2 LITERATURE REVIEW ................................................................................... 3
3 RESEARCH MATERIALS AND METHODS .................................................... 4
3.1 Footwear Industry Trends and AS-IS ........................................................ 4
3.2 Retail market segments ............................................................................ 5
3.3 B2B Wholesaler Strategies ....................................................................... 7
3.3.1 Quick Response ................................................................................. 7
3.3.2 Wholesaler-Retailer Terms & Conditions ........................................... 8
3.3.3 Strategies to Boost B2B Wholesale Sales .......................................... 8
3.3.4 Market Entry Methods ........................................................................ 9
3.4 Demand Forecast Strategies & Best Practices ....................................... 10
3.4.1 Demand Forecast Impact ................................................................. 10
3.4.2 Demand Forecast Utilities ................................................................ 10
3.4.3 Demand Forecast Methods .............................................................. 11
3.5 Warehouse Management ........................................................................ 14
3.5.1 Purchase Planning ........................................................................... 14
3.5.2 Reverse Logistics ............................................................................. 15
3.5.3 Inventory Management ..................................................................... 15
3.6 Distribution Strategies ............................................................................. 19
3.6.1 Distribution Channel Level ............................................................... 19
3.6.2 Distributor Roles ............................................................................... 20
3.6.3 Distribution Methods & Best Practices ............................................. 20
3.7 Business Financial Status in Similar Scenarios ...................................... 21
4 BUSINESS CASE STUDY ............................................................................ 22
4.1 Business Activities .................................................................................. 22
4.1.1 Sales Channels ................................................................................ 22
4.1.2 Manufacturing Process ..................................................................... 23
4.1.3 Warehouse Management ................................................................. 23
4.1.4 Distribution Activities ........................................................................ 24
Page 6
iv
4.1.5 Packaging Activities ......................................................................... 25
4.2 Financial Situation................................................................................... 25
4.2.1 Sales Volume ................................................................................... 25
4.2.2 Profitability ........................................................................................ 28
4.2.3 Operating Costs ............................................................................... 30
4.2.4 Financial Activities ............................................................................ 32
4.3 Organizational Structure As-Is ................................................................ 32
4.4 SAYE Business Plan and Barriers .......................................................... 32
5 DEMAND FORECAST .................................................................................. 33
5.1 Quantitative Techniques Outcome .......................................................... 34
5.2 Maximum Expected Demand .................................................................. 37
5.3 Qualitative Techniques Outcome ............................................................ 39
6 Proposed Strategies for Retail Activities........................................................ 39
6.1 Business Integration ............................................................................... 40
6.2 Cost Reduction ....................................................................................... 43
6.2.1 Implementation of Reverse Logistics Plan ....................................... 44
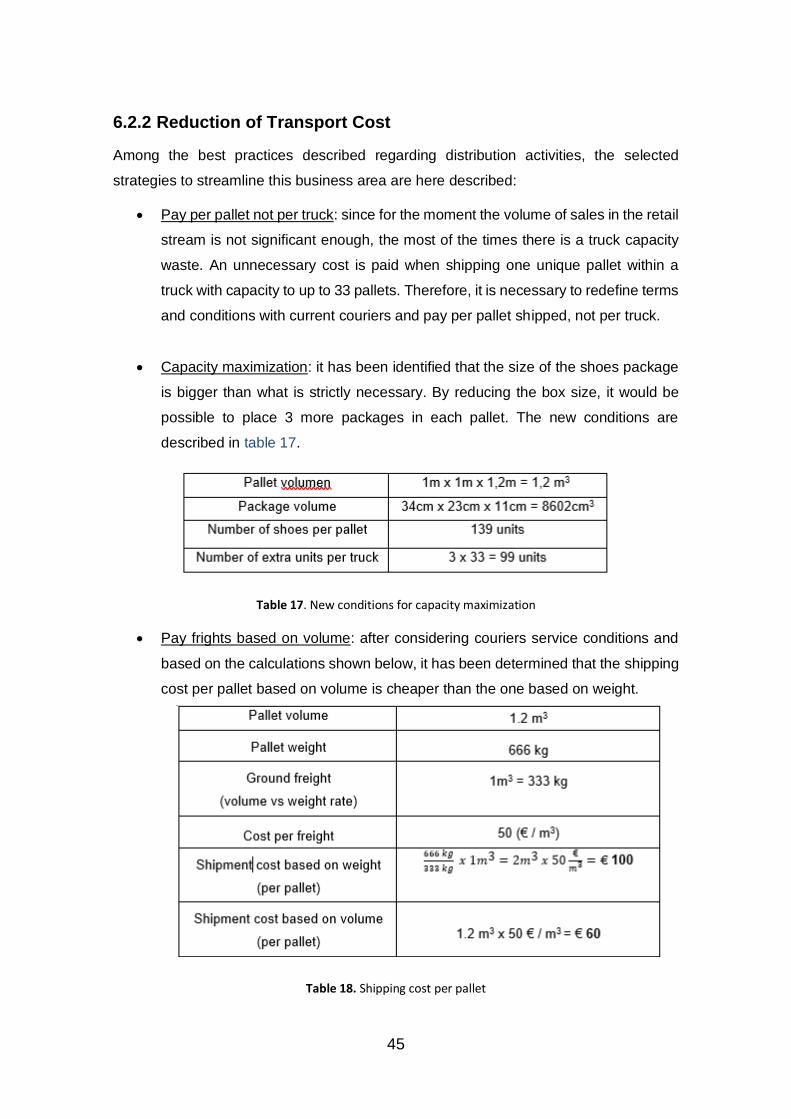
6.2.2 Reduction of Transport Cost............................................................. 45
6.3 Reduce Stock Inconsistencies ................................................................ 46
6.4 Information Systems Implementation ...................................................... 48
7 DISCUSSION & CONCLUSION .................................................................... 49
7.1 Research Overview and Outcomes ........................................................ 49
7.2 Objectives Met and Research Implications ............................................. 50
7.3 Research Limitations and Future Research ............................................ 51
REFERENCES ................................................................................................. 52
APPENDICES .................................................................................................. 55
Appendix A Interview Transcript ................................................................... 55
Appendix B Further Definitions ..................................................................... 60
Appendix C Project Gantt Chart .................................................................... 63
Page 7
v
LIST OF FIGURES
Figure 1. Literature Review areas .............................................................................................. 3
Figure 2. Distribution of UK footwear sales by retailer type, 2015. (Mintel Group Ltd., 2016) ...... 5
Figure 3. Online shares of retail trade. ....................................................................................... 6
Figure 4. Performance of linear vs non-linear techniques. ........................................................ 13
Figure 5. Comparison of the inventory management system with real data .............................. 18
Figure 6. Evolution of B2C customers...................................................................................... 25
Figure 7. Evolution of B2C Total Sales .................................................................................... 26
Figure 8. Evolution of Total B2C Revenue ............................................................................... 26
Figure 9. Evolution of revenues per company and number of active companies ....................... 27
Figure 10. Evolution of total units and average number of units sold per month and customer . 27
Figure 11. Evolution of total revenues and average price obtained per unit through B2B. ......... 28
Figure 12. Profitability and contribution of each concept to the total cost .................................. 29
Figure 13. Average B2B profitability per unit in year 2019 ........................................................ 30
Figure 14. Organizational structure of SAYE............................................................................ 32
Figure 15. Overview of current situation vs the business plan .................................................. 33
Figure 16. Moving average curve for different number of periods vs real demand. ................... 35
Figure 17. Average Time-Series Analysis vs SAYE historical demand ..................................... 35
Figure 18. Moving Average Time-Series Analysis (3 months) SAYE historical demand ............ 36
Figure 19. Moving Average Time-Series Analysis (6 months) SAYE historical demand ............ 36
Figure 20. Total and B2B vs B2C demand forecast outcome. .................................................. 37
Figure 21. Average units monthly bought per retailer during last 6 months (2019) .................... 38
Figure 22. Organizational Structure Process for Business Integration ...................................... 40
Figure 23. Demand vs Supply Workflow .................................................................................. 41
Figure 24. Breakdown of Variable Costs .................................................................................. 43
Figure 25. Inventory management planning ............................................................................. 48
Figure 26_Apx.C Project Gantt Chart (May to June) .................................................................. 1
Figure 27_ Apx.C Project Gantt Chart (June to July).................................................................. 1
Page 8
vi
LIST OF TABLES
Table 1. Total Online Retail Sales 2019 – 2021 . ....................................................................... 6
Table 2. Number of eShoppers as percentage of total population. ............................................. 7
Table 3. Most important aspects for defining the inventory management strategies ................. 17
Table 4. Data to decide purchase orders. ................................................................................ 23
Table 5. Breakdown of warehouse costs ................................................................................. 24
Table 6. Parameters to calculate profitability per unit and final value for years 2018 - 2019 ...... 29
Table 7. Profitability B2B year 2019 ......................................................................................... 30
Table 8. Basic monthly costs of SAYE ..................................................................................... 31
Table 9. Department costs ...................................................................................................... 31
Table 10. Variable costs .......................................................................................................... 31
Table 11. R&D costs ............................................................................................................... 31
Table 12. Administration costs................................................................................................. 31
Table 13. Sales & Marketing costs .......................................................................................... 31
Table 14. Identification of Integration Problems & Mitigation Strategies .................................... 42
Table 15. Breakdown of Variable Costs ................................................................................... 43
Table 16. Breakdown of Operating Costs ................................................................................ 43
Table 17. New conditions for capacity maximization ................................................................ 45
Table 18. Shipping cost per pallet............................................................................................ 45
Page 9
vii
LIST OF EQUATIONS
(5-1) .................................................................................................................. 34
(5-2) .................................................................................................................. 34
(6-1) .................................................................................................................. 46
(6-2) .................................................................................................................. 46
(6-3) .................................................................................................................. 46
(6-4) .................................................................................................................. 46
Page 10
viii
LIST OF ABBREVIATIONS
IT Information Technology
CAGR Compound Annual Growth Rate
QR Quick response
CRM Customer Relationship Management
FMS Forecasting Management System
FSS Forecasting Support System
POS Point of Sales
JIT Just in Time
TMS Transportation Management Systems
FMCG Fast Moving Consumer Goods
Page 11
1
1 PROJECT DEFINITION
1.1 Background
This project is focused on the challenges that a small niche company in the footwear
industry, named SAYE, must overcome in order to accomplish its business growth.
SAYE was, founded in 2018 and has headquarters in Barcelona. It is currently
outsourcing many of its business activities, as it does not have enough capacity for in-
house operations and its logistic planning is also constrained. More specifically, business
development aspirations currently consider the challenges of how to grow in-house
production capacity and the extent of their current (90% of sales volume) eCommerce
basis in order to expand through retail sales.
1.2 Aim
Define a “business realignment model to enable transition from direct e-commerce sales
to international retails sales for a footwear manufacturing SME”.
Although the priority is to reach the stated aim, other parameters such as the easiness
of the realignment plan implementation and its impact in company visibility will be also
taken into consideration to measure the project success.
1.3 Objectives
The following objectives need to be achieved in order to meet the stated aim:
• Analyse the baseline of a business expansion problem through a research of
most common challenges that can been encountered in similar scenarios and the
best practices used to face them.
• Identify and describe techniques to estimate sales volume growth due to
expansion through retail market. This is a key step since it will reduce uncertainty
and the subsequent logistic plan will be based on the result obtained from it.
• Design an approach to streamline distribution capacity to satisfy retailers’
demands, while reducing costs and increasing customer satisfaction.
• Build a methodology for retail business realignment, based on the research
outcomes and tailor it to a specific case study in footwear SME manufacturing.
• Discuss the project findings, outline the overall outcomes and conclude about the
viability and relevance of the project based on a cost vs benefit analysis.
Page 12
2
1.4 Project Approach
Before defining the methodology that will be used to meet the listed objectives, it is
necessary to describe the scope, exclusions, constraints and assumptions that define
the framework of the project.
The literature review is the part that needs to be framed with more detail, since
unnumbered business cases can be found regarding expansion strategies. This project
will tackle this business problem from the operational point of view, it means only
activities and common tools used in the process from procurement to distribution will be
included, regardless if they are thereafter used for the specific business case discussed
here.
On the other side, it will exclude other areas regarding brand visibility such as marketing
activities. Besides, the research of similar scenarios will be reduced to only small or
medium sized enterprises and the best practices they used to overcome growth problem.
Regarding the demand growth estimation, in case of uncertainty, the most extreme
situation will be considered, it means the maximum possible value.
Since the company wants to keep its current manufacturing process to ensure the quality
of its product and maintain its distinguished features, no changes will be made in this
process. Therefore, the definition of new strategies to cope with the new demand will
only consider changes regarding procurement, warehouse management and distribution
channels.
1.5 Methodology and Expected Outcomes
The business realignment will be based in the current business model, the literature
analysis and a cost vs benefit analysis of the proposal. The expected outcomes are:
• Literature analysis and identification of methods and materials of relevance
to the study.
• Case Study Analysis: analyze current business plan including all activities from
procurement to distribution (warehouse management, distribution network
capacity, number of orders, procurement frequency, batch volume, etc.)
• Demand forecast: study and implement methods and tools for demand forecast
and estimate the demand growth to be satisfied through the business expansion.
Page 13
3
• Design new logistic plan: proposal of new strategies to satisfy the increasing
demand when entering the retail market.
• Cost vs Benefits evaluation: to critically analyze return on investment and
produce recommendations for similar business cases based on financial
statement of the project.
• Final Thesis presentation and poster.
2 LITERATURE REVIEW
To ensure a comprehensive review, a few keywords have been selected to carry out the
literature research and to then browse the identified papers. Therefore, before getting
into our particular case study, different topics closely related with the project aim have
been identified. They will help to better understand the current situation and trends of
online and in-shop retailing and to identify some of the best strategies for business
expansion through retail market. These key areas are shown in figure 1:
Figure 1. Literature Review areas
The main themes included in those papers are explained in the next chapter, but only
some of the identified ideas have been developed.
Page 14
4
3 RESEARCH MATERIALS AND METHODS
Each one of the topics mentioned above have been thoroughly explored and best
practices or similar business cases exposed. This way, the results of the research can
be set in the context of related work previously published by others.
3.1 Footwear Industry Trends and AS-IS
The paper “The Business of Shoes” [I], highlights the economic, social and product
trends of this market. It also describes the types of retailer, key players and retail
channels in modern footwear industry.
Globally, the largest market in terms of pairs purchased per capita is the United States.
In 2019, footwear retail in the United States reached $60.53 billion, representing a value
CAGR of 3.1%
Regarding the consumers share by age and gender, it is estimated that women’s
products accounted for 48% of sales, while men’s and children accounted for 35% and
17%, respectively. The women’s category has shown the greatest revenue growth in the
last five years, at $3.2 billion. However, the fastest-growing category is children’s
footwear.
In the European region, UK is the biggest market, where footwear industry has grown
from £9.6 billion in 2014 to $10.3 billion in 2015 and is expected to grow to £13.4 billion
in 2020. In 2014, women’s shoes represented 55% of the market, with men’s and
children’s shoes at 35% and 10%, respectively.
This report also defines the different types of retailers, (i.e. independents, multiples, non-
specialist retailers, etc.) according to its product specialization, its sales size and its sales
channel. The figure below shows, the sales share of each retailer type.
Page 15
5
Figure 2. Distribution of UK footwear sales by retailer type, 2015. (Mintel Group Ltd., 2016)
The general trends in the footwear industry, regarding product type, are sports, casual,
and lifestyle brands, which own the highest market shares and can be found across all
retail channels.
Regarding retail channels, this paper explains that many successful retailers and brands
use a combination of approaches to maximize sales opportunities and attract new
consumers. What was known as a multichannel approach, i.e., selling product via a
variety of retail channels, such as brick-and-mortar stores as well as online, has evolved
into omni-channelling. Which is focused on creating a seamless consumer experience
across all available shopping channels, (e.g. mobile internet devices, computers, brick-
and-mortar, television, direct mail and catalogues)
3.2 Retail market segments
As it is explained in "The Centre for Retail Research Blog” [II], retail industry is
experiencing rapid developments in both online and retail sales structures, due to the
competitive environment that companies are facing.
Although, online retail is experiencing a general growth in all of Europe this is evolving
at different speed in each country. Figure 3 shows the share on total online sales for
various European countries along years 2014 to 2017 and the forecasted values for year
2018 to 2020. While absolute values are shown in table 1.
Page 16
6
Figure 3. Online shares of retail trade. Source for the 2014–2017 data: Center for Retail Research (CRR).
The results for 2018–2020 have been forecasted.
Table 1. Total Online Retail Sales 2019 – 2021 (estimate). Source: Center for Retail Research (CRR).
Currency values are sterling (£) billions. F = forecast results.
The fact that buying online rather from traditional stores is comparatively easy and
predictable, combined with an improvement of the legal protection for buyers has made
online retailing attractive for a wide range of products. As a result, the number of
eShoppers has drastically increased in the last years, as it is shown in the table below.
Page 17
7
Table 2. Number of eShoppers as percentage of total population.
Source: Center for Retail Research (CRR). e = estimated.
On the other hand, in-shop sales still offer great advantages that cannot be obtained
through eShopping. The customer experience is an important factor in all consumer
goods sales but especially crucial for footwear products. This is perfectly explained by
Mary Stuart [III], owner of “Mo Brog” an independent footwear store. Who defends that
since shoes need to be tried on, in-shop sales are the best way to ensure a good
customer experience and avoid returns. Therefore, she is skeptical about offering a
transactional website.
3.3 B2B Wholesaler Strategies
This chapter describes a list of strategies to enhance wholesaler activities for business
expansion.
3.3.1 Quick Response
The importance of offering a quick response service through manufacturer-retailer
channels is exposed in a wide set of papers [IV], [V]. It includes information from industry
sources that determine the pros and cons of offering a QR service. On one hand,
reducing lead time allows retailers to adjust orders based on demand and therefore their
interest to trade with wholesalers increases.
On the other hand, it has an impact on the manufacturer and wholesaler decision-making
flexibility, since they have to meet tighter production and distribution commitments.
Moreover, it suggests actions such as service level, wholesale price and volume
commitments that can make QR profitable for both members of the channel, i.e. pareto
improvement (economic concept named after Vilfredo Pareto, [VI])
Country 2019 2020 (e)
UK 75.8% 76.9%
France 68.5% 72.4%
Germany 70.2% 76.4%
Spain 42.1% 51.2%
Italy 37.7% 49.6%
Netherlands 72.2% 76.1%
Averages 61.1% 67.1%
Page 18
8
3.3.2 Wholesaler-Retailer Terms & Conditions
Gérard P. Cachon and Martin A. Lariviere [VII], study the key terms and conditions under
each wholesaler-retailer contract type.
Revenue-sharing contract type is commonly found in the literature. Under a revenue-
sharing contract, a retailer pays a supplier a wholesale price for each unit purchased,
plus a percentage of the revenue the retailer generates. The retailer chooses optimal
price and quantity. It can also be extracted that, despite its numerous strengths, revenue
sharing is not prevalent in all industries since, in some cases, it just provides a small
improvement over the cheaper wholesale price contract.
On the other hand, the mentioned paper compares the case of a supplier selling to fixed-
price vs a price-setting vendor. Further information regarding these concepts is provided
by Steven Symes [VIII]. It includes a benchmarking between supply chain contracts such
as buy-back, price-discount, quantity-flexibility, sales-rebate, franchise or quantity
discounts.
3.3.3 Strategies to Boost B2B Wholesale Sales
Ling Wong recommends, in his publication [IX], some key approaches to attract customer
sales:
- Make ordering, billing and shipping a seamless process.
- Offer fast shipping and on-time delivery.
It is extensively defended in the literature that information systems and business
integration are two main aspects to meet these conditions.
Systems allow to manage and speed up B2B transactions such as customer experience
or payment processes. Some examples are SAP, Pepperi, SalesForce, or Shippo.
Nevertheless, it is important to select the one that best matches the particular business
needs, to that end, key functionalities to take into consideration are:
- The server in which the platform is available (mobile, cloud, web based)
- CRM (Customer Relationship Management)
- Email Marketing
- Inventory Management
- Forecasting Management System (FMS)
- Returns Management
- Reviews Management
Page 19
9
These capabilities streamline the delivery process through the automation of fulfillment
activities, which results in fewer errors, delays or back orders. A retailer can lose revenue
if a product is out of stock, but by offering fast shipping to customers without additional
cost, they are more likely to order again. Some systems can carry out product demand
forecasting, so production can be adjusted to demand
Regarding the second point, as it is widely discussed in the book “Demand and Supply
Integration” [X], business integration is crucial to ensure an effective communication,
coordination and collaboration among company entities and avoid production disruptions
or stock inconsistencies.
For example, in many companies, the activities of the sales organization (retail partner
centered) are not well aligned with the activities of the marketing function (final consumer
centered). On the supply side, procurement is interested on chasing lowest-unit-cost raw
materials, which may be found in low-labor-cost areas of the globe, while logistics may
be striving to reduce transportation cost and maximize agility.
Business integration can be achieved through the utilization of the mentioned information
systems or through a proper organizational structure.
3.3.4 Market Entry Methods
As it is described by Dana, L.P.[XI], there are different business models that a retailer
entering a new market may adopt in order to build a presence in a new geographical
territory. It is not always practical or profitable for the same business model to be used
in the international market as the domestic market.
Therefore, retailers must investigate the most appropriate route for their international
expansion via some of the following methods.
- Joint venture
- Concession
- Franchise
- Flagship/own retail
- Wholesale-distributor
- Wholesale-agent
- Wholesale-subsidiary
- Licensing
Page 20
10
3.4 Demand Forecast Strategies & Best Practices
3.4.1 Demand Forecast Impact
Retailers’ future planning depends in part on demand forecasts. As it can be read at
“Estimating Demand Uncertainty” [XII], accurate demand estimations may result in a
large increase of profitability, especially in low-margin, high-volume retailing. Therefore,
a considerable amount of effort has been devoted to the development and improvement
of forecasting models over the past several decades, and retailing has seen a shift from
intuition to data-based decision making that can capitalize on this.
Forecasts are essential to support many decisions from the strategic to the operational
area, such as marketing, sales, production, purchasing and finance. Forecasts also
provide the basis for national, regional and local distribution and replenishment plans.
3.4.2 Demand Forecast Utilities
The book “Production and Operations Management” [XIII], describes how retailers can
use data about their customers and their business operations to explore and exploit
better. In many ecommerce and brick-and-mortar contexts, retailers can track not only
what is being sold at different locations and times through point-of-sale (POS) systems
but also who is buying these items.
This paper also explain how data can be used to tackle problems in retailing to improve
assortment and pricing, or to quantify the impact of stockouts on lost sales and the impact
of delivery time on revenue. Some of these utilities are:
• Optimizing store assortments: in response to changing demand patterns.
• Online dynamic pricing: software to track competitor’s prices and other valuable
data.
• Online order fulfillment speed: to shorten customer order fulfillment time.
• Estimating the impact of B2B service level on demand: Craig et al. (2016) uses
experimental data to find out the increase in retailer demand associated to
efficient customer service.
Page 21
11
3.4.3 Demand Forecast Methods
There is an exhaustive research about this area of study, evaluating every existent
forecasting technique. Robert Fildes, Shaohui Ma and Stephan Kolassa [XIV] study the
problems that retailers face to develop accurate demand forecasting and its impact in
retail business succeed. Furthermore, popular forecasting methods and practices are
also examined in papers [XV] - [XVIII].
Nowadays, this process is generally delivered through methods embedded in a
forecasting support system (FSS), as explained at [XIX] These systems are based in
mathematical models which are simultaneously based in historical data.
3.4.3.1 Data Collection
As it is explained in the paper [XXII], proper collection of reliable data is crucial since
basic product-level demand forecasting methods use only the past sales history. One of
the key factors is to have a data pool big enough able to represent the demand behavior
during a wide time window.
Regarding the existent methodologies to collect data, beyond the traditional and
rudimentary techniques such as manual inputting of sales data, nowadays, Location
Intelligence technology is used to identify variations in market conditions that are location
specific.
Seasonality is a noise factor which also must be taken into consideration since it may
affect data interpretation. Retail sales usually present strong seasonal variations, so
seasonal modeling techniques may have and important role on the forecasting accuracy.
Although seasonally adjusted data may produce more uncertainties, removing seasonal
variations is one of the most traditional approaches to handle seasonality.
3.4.3.2 Quantitative Forecasting Techniques
a) Univariate forecasting methods
The most remarkable findings of the research in [XXIII], [XXIV] show that traditional time
series techniques perform well for periods without focal product. Some examples are:
- Simple moving averages
Page 22
12
- Exponential smoothing (ARIMA)
- Fourier analysis
However, univariate forecasting methods should be adopted only for products with a low
promotional intensity or price elasticity of demand.
b) Linear causal methods
For periods with promotions, using methods with promotional drivers, such as linear
causal methods, improved the accuracy substantially. For instance, linear regression is
a simple and feasible causal method for large-scale forecasting problems. Examples of
this kind of models are:
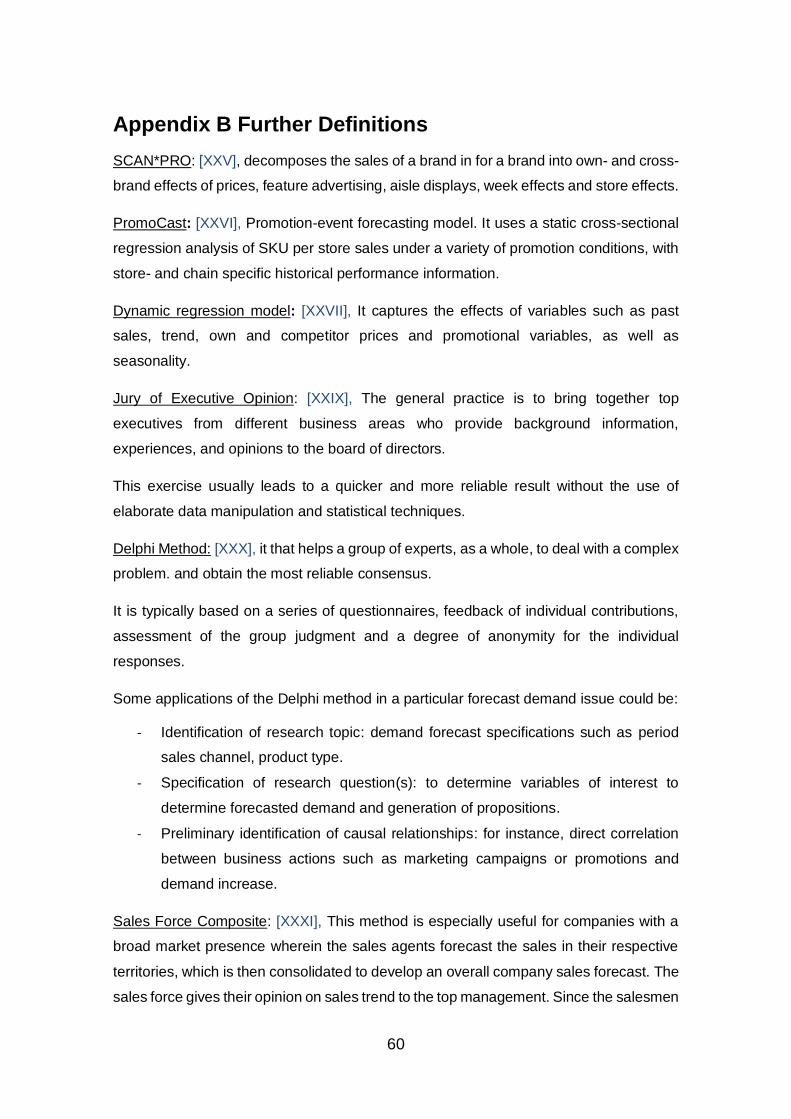
- SCAN*PRO [XXV]
- PromoCast [XXVI]
- Dynamic regression model [XXVII]
Further definitions of these models can be found in the indicated references and in
[Appendix B Further Definitions]
c) Non-linear and machine learning methods
Nonlinear methods include traditional nonlinear regressions, non-parametric regressions
and machine learning algorithms. They use different mathematical parameters, that
represent sales variations in response to promotional instruments.
- Multiplicative (log–log)
- Exponential (semi-log)
- Log-reciprocal functional forms
Linear vs Non-linear methods
As explained at [XIV], linear models with various driver variables are generally better
established than more complex methods and easy to implement. However, more
complex nonlinear models should be considered if linear models fail to perform well.
Page 23
13
Chu & Zhang [XXII], also examine in their study, several linear and nonlinear models that
have been commonly used in modelling and forecasting seasonal time series.
Specifically, it describes three classes of general modelling approaches.
- Box–Jenkins ARIMA → Seasonal univariate modeling
- Regression approach to seasonal modeling → Linear causal modeling
- Feedforward neural networks → Nonlinear modeling
The paper describes their mathematical models and how each one of them performs vs
the real demand, figure 4.
Figure 4. Performance of linear vs non-linear techniques.
This work also describes the types of errors commonly used to evaluate the performance
of forecasting models:
- Root mean squared error (RMSE)
- Mean absolute error (MAE)
- Mean absolute percentage error (MAPE)
Finally, all studies agree that no single forecasting model is the best for all situations
under all circumstances (Makridakis et al., 1982), [XXVIII].
Page 24
14
3.4.3.3 Qualitative Forecasting Techniques
Sometime quantitative forecasting techniques are not accurate enough or they just can
not be used due to the lack of historical demand data. In this case, qualitative techniques
can substitute or complement them. The methods most referred in the literature are:
a) Jury of executive opinion: [XXIX], method of combining and averaging views of
several executives regarding a specific decision or forecast.
b) Delphi Method: [XXX], tool for structuring a group communication process to
identify issues for managerial decision-making.
c) Sales Force Composite: [XXXI], the sales agents forecast the sales in their
respective territories and it is then consolidated to develop an overall company
sales forecast.
Further definitions of these methods can be found in the indicated references and in
[Appendix B Further Definitions]
3.5 Warehouse Management
Warehouse management is a key aspect of the supply chain management since it has
a direct impact in the customers experience and it can produce high over costs if not
handled properly.
3.5.1 Purchase Planning
The first step to ensure a correct warehouse management is the purchase planning since
it directly affects the amount of stock maintained in the warehouse. Daniel Fritsch,
[XXXII] defines the basics of purchase planning.
The order point is a critical parameter to maximize profits. It is essential to order enough
stock with each order to reduce carriage costs and take advantage of bulk discounts, but
at the same time, it is important to avoid overstock due to over-ordering. Depending on
how purchasing is handled, there are two kinds of approaches:
a) Reactive approach: or “just in time” (JIT) approach. In this scenario the business
only purchases stock when needed. It reduces working capital but can cause
delays that result in stock outages and reduced customer confidence.
b) Proactive approach: this procurement strategy ensures enough stock to always
meet demand, but it must be managed effectively to avoid overstocking.
Page 25
15
Some key considerations for purchase planning are:
- Customer needs
- Business needs
- Warehouse and storage capabilities
- Budget
- Number of orders and batch size
The report mentioned above, also highlights some best purchasing practices and the
advantages of using an ERP system with purchasing capabilities:
- Link customer orders with purchasing and enhance decision-making.
- Give real-time oversight of warehouse operations which enables stock to be
moved to where it is needed, preventing overstocking and obsolescence.
- Use historical data produced by the software to predict seasonal variations in
demand.
3.5.2 Reverse Logistics
Nowadays, the competitive advantage of retail enterprises depends on customer
experience, which has a big impact in loyalty rates and in maintaining low operating
costs. In addition, companies are more and more concerned about their reputation
regarding sustainability. Therefore, retailers must have an efficient reverse logistics
system, which plays a critical role in all the mentioned issues.
In his dissertation Dayong Xu, [XXXIII] probes into the existing strategic models to
achieve these goals through reverse logistics. It provides insights in the following
matters:
- Types of reverse logistics in retail industry.
- Main source of reverse logistic.
- Retail reverse logistics problems.
- Driving factors of reverse logistics in retail industry.
- Retail reverse logistics strategies and management solutions.
3.5.3 Inventory Management
Inventory management is a challenging problem for companies since inventories are a
frozen fund that can be lost and have holding costs. However, it can help to streamline
the quantity of inventories that will fulfil the demand, avoiding overstocks and stock-outs,
Page 26
16
It is also useful to smooth production requirements or take advantage of order cycles
and quantity discounts.
3.5.3.1 Inventory Management Dimensions
Evan L. Porteus [XXXIV], explains some of the most important aspects that must be
considered when defining the inventory management strategies. They are briefly
explained in table 3.
Page 27
17
Table 3. Most important aspects for defining the inventory management strategies
Page 28
18
3.5.3.2 Inventory Management Best Practices & Models
Darya Plinere and Arkady Borisov [XXXV], go into different methods to deal with the
management of stock levels and effectively meet demand. They use a real case study
to prove the efficiency of four inventory management best practices.
• ABC classification: this is a supply chain technique that allows assigning priorities
to different types of stock items in order to make time management and financial
resources more efficient. It is based on the Pareto analysis. [Appendix B Further
Definitions]
• Replenishment policies: this includes the determination of single or multi period
inventory system, the reorder point, lead time, demand behaviour, etc.
• Demand forecasting algorithms: (chapter 3.4.3)
• Data analysis: this include techniques to detect stock management issues, such
as inventories with no movements, inventories wasted due to expiration of time,
or demand deviation from the forecasted demand. Figure 5 shows an example of
the detectable deviation between the optimum stock level and the real stock
quantity.
Figure 5. Comparison of the inventory management system with real data
Finally, this study brings together various inventory management models, which common
goal is to define a proportional ordering cost function. Each of them has a unique
mathematical form that defines an ordering cost function suitable for a particular
business scenario. The models discussed are:
- Deterministic (EOQ) model
Page 29
19
- Single period model
- Dynamic linear model
- Dynamic convex model
- Dynamic concave model
3.6 Distribution Strategies
This chapter first describes the levels of distribution channels and types of distribution
role within a supply chain. Second, some methods and best practices to streamline the
distribution process.
3.6.1 Distribution Channel Level
Generally, the literature [XXXVI] defines four different levels of distribution channels
according to the number of intermediaries between the manufacturer and the final
consumer of the product.
Page 30
20
3.6.2 Distributor Roles
Most of the literature regarding this distributor roles coincide that there are four different
profiles according to its activities and relationships with the different supply chain players.
a) Distributor: a distributor is a wholesaler who, in addition to fulfilling retailer orders,
they actively sell products on behalf of the producers.
b) Wholesaler: a wholesaler fulfills orders of retailers, by reselling goods, often in
large quantities for manufacturers.
c) Retailer: retailers are the outlets where consumers can purchase products.
d) Broker and Agent: they handle the logistics of the sales, contracts, marketing,
and customer relationship management.
Further definitions of these roles can be found in [Appendix B Further Definitions]
3.6.3 Distribution Methods & Best Practices
Distribution strategies depend on the type of product being sold. According to an article
shared by Smriti Chand [XXXVII], there are three methods of distribution that outline how
manufacturers choose how they want their goods to be dispersed in the market.
a) Intensive: this type of distribution aims to provide saturation coverage of the
market by using all available outlets.
b) Selective: selective distribution involves a producer using a limited number of
outlets in a geographical area to sell products.
c) Exclusive: only one wholesaler, retailer or distributor is used in a specific
geographical area.
The article published by Lindsey Jenkins [XXXVIII] widely describes the key factors to
take into consideration when selecting the proper distribution strategy:
- Item Type
- Customer Base
- Warehouse Capabilities
She also defines some of the most useful technologies for distribution management:
- Automation
- Internet of Things
- Cloud-Based Systems
Page 31
21
Finally, the most common features that should be considered to select an appropriate
distribution software are also described in this study, together with a list of the top
customer relationship (CRM) and transportation management systems (TMS).
• Sales order management: it allows to input orders and transmit them to
manufacturing so that items can be produced to meet customer needs.
• CRM: it can assist users in looking at customer information in real time to see
historical purchasing information, such as products that are currently being
waited on or most used payment methods.
• Inventory Management: (chapter 3.5.3)
• Logistics Management: this software enables transportation management and
route planning. It also helps to select which items should be shipped together.
Another topic commonly found in the literature, is how to select a distribution partner and
the terms and conditions of the working relationship. Some of these factors are:
- Shipping cost based in freight weight vs freight volume
- Carrier capacity in terms of time and geographic area coverage
- Cost conditions, i.e. fix cost and variable component depending on distance
and quantity.
3.7 Business Financial Status in Similar Scenarios
Every business needs to have a continuous financial grow. However, according to their
scale they have different behaviours. Emergent businesses have much bigger growth
rates than those of established companies.
As it has been found in similar case studies [XXXIX], generally the growth of successful
startups goes through three stages of the so called S-curve:
- Childhood: stage in which the startup has a very slow growth.
- Expansion: period of fast growth in which the company is already well organized.
- Maturity: if the startup becomes a large company, growth begins to be slower.
According to the literature reviewed, the ideal growth rate for a startup is between 5%
and 7% per week. Trevor Blackwell has created a simple method to calculate whether a
startup's growth will cover costs and after how long will that happen.
The venture capital firm Institutional Venture Partners conducted an analysis of 70 start-
ups that grew and opened to the stock exchange. The idea was to determine the growth
Page 32
22
rates they had in the 4 years prior to the opening on the stock exchange. The outcomes
of the study were:
- Companies that had sales between less than $1 million and $25 million grew at
a rate of 133% per year.
- Those with sales between $150 and $500 million grew at annual rate of 38%
- 69 of the 70 companies analysed grew more than 20% per year.
- 54 of the 70 companies grew more than 30% per year.
4 BUSINESS CASE STUDY
In order to have a better understanding of the current company situation and with the
purpose of identifying the possible weaknesses that can be tackled and hopefully
mitigated, an analysis of the business case has been carried out.
It contains a description of its main business activities, and an analysis of the business
financial situation and the organization structure. The main information sources are:
• Business plan and company reports (confidential documentation)
• Interview to company Co-founders [Appendix A Interview Transcript]
4.1 Business Activities
This chapter provides a thorough overview of SAYE business activities.
4.1.1 Sales Channels
SAYE sells shoes through two different channels:
a) B2C (Business to Consumer)
This channel includes all sales where customers are directly reached with no
intermediate agents through ecommerce. Although the startup was initially built up with
the income obtained from sales through crowdfunding platforms such as Kikstarter, since
November 2019 SAYE has its own ecommerce platform.
b) B2B (Business to Business)
This channel includes all sales to retailers. Nowadays SAYE sales to an average of 11
retailers per month, but many others have shown real interest to commercialize their
products. The aim is to create a reliable structure to meet this new upcoming demand.
Page 33
23
4.1.2 Manufacturing Process
Since SAYE is for the moment a small startup with no capacity to own the manufacturing
activity, this service is outsourced to a Portuguese company named “YouShoes”.
However, they directly participate in supply process by managing the procurement
activities.
The price per unit is € 29 in average, which does not include the transport cost.
Regarding purchase orders, nowadays SAYE uses a simple method to decide when to
order and the quantity ordered. The following data is input in an excel sheet (table 4)
- Number of sales orders received through the e-commerce platform
- Available stock
- Expected in-bound units
- Estimated sales per month for each product type
Table 4. Data to decide purchase orders.
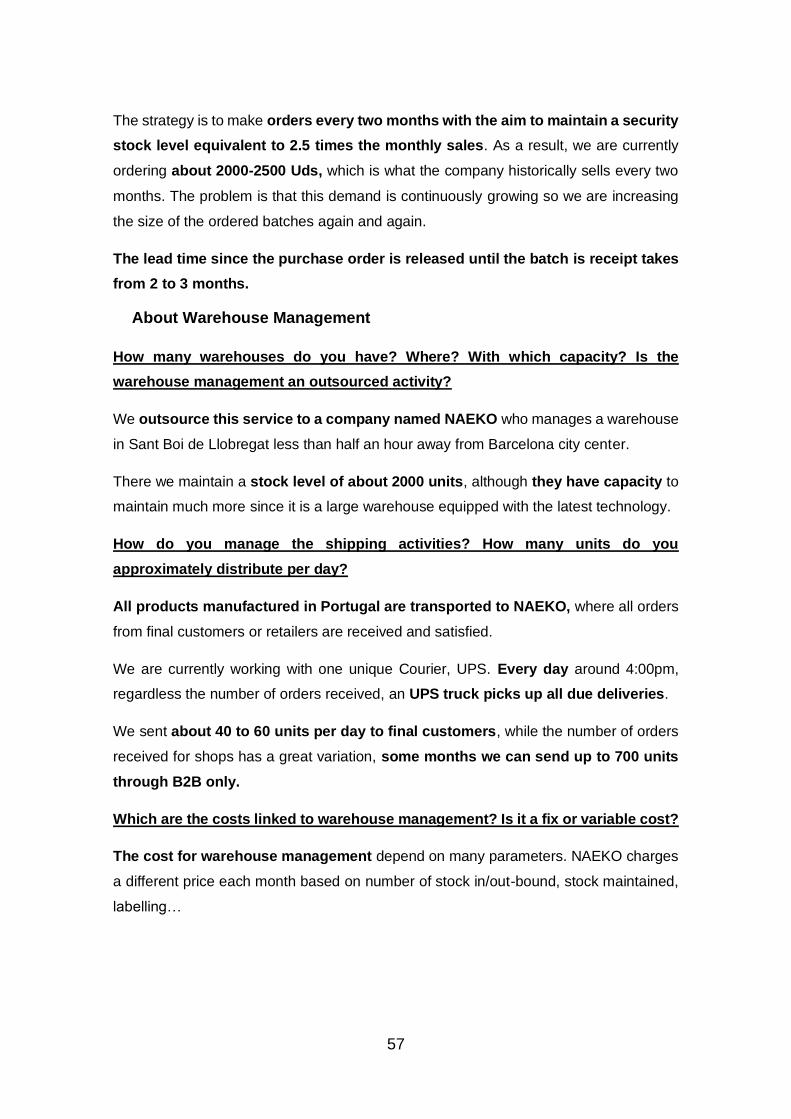
The strategy is to make orders every two months with the aim to maintain a security
stock level equivalent to 2.5 times the monthly sales. As a result, they are currently
ordering 2,000 to 2,500 units, which equals what the company historically sells every two
months. The lead time since the purchase order is released until the batch is receipt is 2
to 3 months.
4.1.3 Warehouse Management
The warehouse management is outsourced to a company named NAEKO, where SAYE
maintains a stock level of about 2000 units.
Product Type Total StockArriving
current Week
Arriving
current Month
Total Available
(pre-order)
Estimated Sales
per month
Month to
out of stock
To be
ordered
Total Available
(post-order)Ordered
M89-03-BEIGE-38 23 15 63 101 43 2,35 114 215 114
M89-03-BEIGE-39 36 9 12 57 34 1,68 113 170 113
M89-03-BEIGE-40 0 3 48 51 24 2,13 69 120 69
M89-03-BEIGE-41 6 15 27 48 23 2,09 67 115 67
M89-03-BEIGE-42 0 13 24 37 12 3,08 23 60 23
M89-03-BEIGE-43 1 18 19 38 15 2,53 37 75 37
M89-03-BEIGE-44 9 18 0 27 13 2,08 38 65 38
M89-03-BEIGE-45 0 11 21 32 12 2,67 28 60 28
M89-03-BEIGE-46 0 3 10 13 4 3,25 7 20 7
M89-03-BLACK-36 0 0 0 0 1 0,00 5 5 10
M89-03-BLACK-37 16 0 0 16 5 3,20 9 25 9
M89-03-BLACK-38 0 0 16 16 8 2,00 24 40 24
M89-03-BLACK-39 12 0 0 12 6 2,00 18 30 18
M89-03-BLACK-40 5 0 9 14 4 3,50 6 20 6
M89-03-BLACK-41 8 0 8 16 8 2,00 24 40 24
M89-03-BLACK-42 0 0 7 7 8 0,88 33 40 33
Page 34
24
All products manufactured in Portugal are transported to this warehouse, from where
customer orders are fulfilled.
About 40 to 60 units are shipped to final customers every day. Instead, the number of
orders received for B2B has a great variation, some months up to 600 units.
The cost for warehouse management depends on the parameters shown in table 5.
Table 5. Breakdown of warehouse costs
4.1.4 Distribution Activities
According to the different distribution channel levels defined in the literature (chapter
3.6.1), SAYE structure can be classified within level two.
Among all the possible distributor roles, described at chapter 3.6.2, SAYE has taken the
role of a wholesale-distributor. Nevertheless, they have the particularity of owning other
business areas such as product design, marketing and customer service.
Currently, the company has two different distribution partners. On one hand “CS
transitarios” is in charge of all product transport from the factory in Portugal to the
Warehouse in Barcelona. This service is used once every two months approximately.
On the other hand, they have a partnership with “UPS” for all distributions from NAEKO
warehouse to final customers and retailers. They pick up all due deliveries every day
around 4:00pm, regardless the number of orders received.
The cost charged by both partners varies according to the number of deliveries. While
the transport cost is included in the final price for final customer sales, it is charged
separately for retailers, unless they manage the procurement themselves.
Cost (€)
Pallet Unloading 3.0
Returns 1.5
Stock entries (per unit) 0.09
Insurance (per unit) 0.06
Maintenance (per unit & day) 0.01
Order preparation 1.6
Order preparation (additional pick) 0.2
Delivery Box Assembly 0.34
Output Labelling 0.12
Page 35
25
4.1.5 Packaging Activities
Regarding the packaging activities SAYE relies in two different companies:
• Enveseur: they manufacture three types of packages for 1, 2 or 4 pairs of shoes.
• Sheedo: they provide tomato seeds, which are included with each pair of shoes.
The costs vary according to the quantity ordered, which is normally of 5,000 units.
4.2 Financial Situation
4.2.1 Sales Volume
First, the sales volume of each distribution channel has been here studied. It includes
the number of customers reached, the total units sold, and the total revenues obtained
through B2C and B2B transactions.
a) B2C Sales
Nowadays, up to the 90% of the SAYE whole sales take place through e-commerce,
where the product is directly distributed from warehouses to the final customer.
The business performance in this area is summarized within the figures below:
Figure 6. Evolution of B2C customers
882
749 871
690
1,050 970
Jul-19 Aug-19 Sep-19 Oct-19 Nov-19 Dec-19
Customers
Customers
Page 36
26
Figure 7. Evolution of B2C Total Sales
Figure 8. Evolution of Total B2C Revenue
The average revenue is € 108,005 per month.
b) B2B Sales
Since SAYE B2B activities are in a starting stage, the following graphs are only based
on data collected during the second half of last year. They represent SAYE sales within
the retail market.
Figure 9 shows the revenues per customer and the number of transactions with active
companies, which are those with a continuous business relationship.
990
837
1,001
748
1,151 1,049
-
200
400
600
800
1,000
1,200
1,400
Jul-19 Aug-19 Sep-19 Oct-19 Nov-19 Dec-19
1.04
1.06
1.08
1.10
1.12
1.14
1.16
Un
its
Un
its
x C
ust
om
er
Total Units - Shoes
# Units Units x customer
109,231 € 93,953 €
115,546 €
92,667 €
132,626 €
104,004 €
99.1 €
- €
20,000 €
40,000 €
60,000 €
80,000 €
100,000 €
120,000 €
140,000 €
Jul-19 Aug-19 Sep-19 Oct-19 Nov-19 Dec-19
- €
20.0 €
40.0 €
60.0 €
80.0 €
100.0 €
120.0 €
140.0 €
Rev
en
ue
Pri
ce x
Un
it
Total Revenue - Shoes
Revenue Price per unit
Page 37
27
Similarly, figure 10 shows the total units and units per company sold each month.
Figure 10. Evolution of total units and average number of units sold per month and customer
616
123 64
244 215
-20 -
50
100
150
200
250
-100
-
100
200
300
400
500
600
700
Jul-19 Aug-19 Sep-19 Oct-19 Nov-19 Dec-19
Un
its
x co
mp
any
# U
nit
s
Units
# Units Units x company
12,099 €
3,541 €
1,457 €
3,306 €
7,343 €
-106 €
-
1
1
2
2
3
3
4
4
5
-2,000 €
- €
2,000 €
4,000 €
6,000 €
8,000 €
10,000 €
12,000 €
14,000 €
Jul-19 Aug-19 Sep-19 Oct-19 Nov-19 Dec-19
Act
ive
com
pan
ies
Rev
en
ue
x co
mp
any
Companies
Revenue x Company Active Companies
Figure 9. Evolution of revenues per company and number of active companies
Page 38
28
Figure 11. Evolution of total revenues and average price obtained per unit through B2B.
The average revenue is € 15,131 per month.
4.2.2 Profitability
The profitability obtained from each sale is also an important indicator. It has been
analyzed for each sales channel.
Although all products have common costs regarding the manufacturing and logistics,
the ones sold through B2C have additional costs related with sales campaigns,
marketing and financial commissions. However, these costs are not included in B2B
since the amount of sales made through retail market is still not significant. Therefore,
investments in marketing and other support activities are only focused in B2C.
The revenue per unit obtained through each sales channel is also different. Their
values are presented next, together with a detailed breakdown of the cost drivers used
to calculate profitability.
a) Profitability B2C
Page 39
29
Table 6. Parameters to calculate profitability per unit and final value for years 2018 - 2019
The average profitability of one pair of shoes directly sold to end customers was €
23.84 during year 2019. The percentage represented by this profitability and the
contribution of each concept to the total cost, can be observed in figure 12.
Figure 12. Profitability and contribution of each concept to the total cost
b) Profitability B2B
Due to the lack of historical data regarding B2B activities, the investment and costs linked
to this sales channel is far less significant than the ones focused in B2C activities.
€32.19 , 30%
€23.92 , 23%€9.38 ,
9%€3.23 , 3%
€11.78 , 11%
€0.89 , 1%
€23.84 , 23%
YTD 2019
COGS
Marketing
Crowdfunding
Financial Comission
Logistics
Sustainable Donations
Profitability
Page 40
30
Table 7. Profitability B2B year 2019
As it can be observed in figure 13, the average profitability of one pair of shoes directly
sold to end customers was € 22.60 during year 2019.
Figure 13. Average B2B profitability per unit in year 2019
The fact that profitability is very similar to the one obtained through ecommerce, together
with the brand visibility opportunities that retail channel offers, are incentives, which
make the entry to retail market interesting.
4.2.3 Operating Costs
The basic monthly costs of the company have been summarized in table 8. Variable
costs depend on the number of commercialized units.
€25.26 , 43%
€11.14 , 19%
€22.60 , 38%
YTD 2019
COGS
Logistics
Profitability
Page 41
31
Table 8. Basic monthly costs of SAYE
As it can be observed in the tables below, every cost area has been broken down in
more detailed cost concepts.
Operating Costs (€)
Variable Costs 63,345
Sales & Marketing 24,424
Department Costs 23,340
R&D 1,544
Administration 4,912
Total Operating Costs 117,566
Table 9. Department costs
Table 13. Sales & Marketing costs
Table 12. Administration costs
Table 10. Variable costs
Table 11. R&D costs
Page 42
32
4.2.4 Financial Activities
In order to control the company cash flow requirements and its financial health. The
finance team makes an estimation of the financial accounts (sales, revenues, costs)
before the beginning of each financial term and inputs the real final value at the end of
it. Estimations are based on the comparison between the expected and the real value
and on the historical growth of main financial indicators and the company roadmap.
4.3 Organizational Structure As-Is
The company structure and the responsibilities of their employees have been analyzed
in order to identify their weakness and decide on the necessity of a potential
restructuring.
Figure 14. Organizational structure of SAYE
As it can be observed in the figure above, every business area works independently, and
they are only linked by the board of managers. It also can be observed that some
employees have responsibilities within different departments.
4.4 SAYE Business Plan and Barriers
Nowadays, SAYE has a good financial stability with a cash in hand up to € 248k. It makes
possible to maintain the current infrastructure cost, estimated in about € 37k. So, the
company has the required financial stability to invest on growing the business.
The aim is to expand the business through the retail market, not especially to increase
sales and revenues, but to increase the brand visibility and scope. This way they would
Page 43
33
get the loyalty of a wider target of customers, which would give the needed stability to
expand their product portfolio.
One of the bigger issues that SAYE must face in order to achieve this goal is the logistics
infrastructure, which is not ready to satisfy this demand requirements. More specifically,
they often experiment stock outs as a result of an inefficient stock management system
and an inaccurate demand forecasting. Therefore, they are often forced to satisfy retail
orders with stock initially stored for ecommerce sales. To mitigate this risk, they end up
making bigger orders, of about 6,000 units, equivalent to the sales of three months. This
consequently causes a significant extra cost
In the graphs below, an overview of the current situation vs the future business plan can
be observed.
Figure 15. Overview of current situation vs the business plan
5 DEMAND FORECAST
A demand forecast process have been applied to our particular business case based on
some of the takeaways obtained from the literature review (chapter 3.4.3). Furthermore,
a new approach has been here developed and tailored to the particular business case.
The techniques implemented in the case study are described next.
Page 44
34
5.1 Quantitative Techniques Outcome
a) Average Time-Series Analysis: this is a simple method to estimate each month
demand as the average demand of all previous months:
Forecast t + 1 = 𝐴𝑣𝑒𝑟𝑎𝑔𝑒 𝐷𝑒𝑚𝑎𝑛𝑑 = ∑ 𝐷𝑡
𝑁
𝑡=1
/ 𝑁
(5-1)
As it has been concluded from the literature analysis, a simple average is a suitable
forecasting technique when there is a pattern of random data. However, it is not an
efficient method to estimate demand when there is a detectable pattern of trend or
seasonality. In addition, this technique works poorly with cases in which old data is
irrelevant and not reliable. This deficiency in the average can be overcome by using a
moving average.
b) Moving Average Time Series Analysis: this is a simple method to estimate each
month demand as the average demand of a determinate number of previous
months.
Forecast t + 1 = 𝑀𝑜𝑣𝑖𝑛𝑔 𝐴𝑣𝑒𝑟𝑎𝑔𝑒 𝐷𝑒𝑚𝑎𝑛𝑑 = ∑ 𝐷𝑡
𝑁
𝑡=1
/ 𝑁
(5-2)
The figure below shows the behavior of the estimation curves for each selected number
of periods vs the real demand curve.
Page 45
35
Figure 16. Moving average curve for different number of periods vs real demand.
In order to determine which moving average model would better approximate future
demand, three trend lines have been built and benchmarked with SAYE historical
demand data.
Figure 17. Average Time-Series Analysis vs SAYE historical demand
0
200
400
600
800
1000
1200
1400
1600
May
201
8
Jun
201
8
Jul 2
018
Aug
201
8
Sep
201
8
Oct
201
8
No
v 20
18
Dec
201
8
Jan
201
9
Feb
201
9
Mar
201
9
Apr
201
9
May
201
9
Jun
201
9
Jul 2
019
Aug
201
9
Sep
201
9
Oct
201
9
No
v 20
19
Dic
201
9
Ene
2020
Demand Historical Data
Total Average
Page 46
36
Figure 18. Moving Average Time-Series Analysis (3 months) SAYE historical demand
Figure 19. Moving Average Time-Series Analysis (6 months) SAYE historical demand
Judging by the results, it looks like the model that better imitates the historical demand
is the moving average with 3 months per moving average. Besides, as SAYE total
demand is following an upward trend, this technique is more suitable to estimate SAYE
retail demand.
This technique has been applied to forecast the first month with no demand records
(February 2020), resulting in 1,086 total sales. Since only the retail volume is relevant
for this study, it has been obtained as the 25% of the total sales. This assumption is
0
200
400
600
800
1000
1200
1400
1600
May
201
8
Jun
201
8
Jul 2
018
Aug
201
8
Sep
201
8
Oct
201
8
No
v 20
18
Dec
201
8
Jan
201
9
Feb
201
9
Mar
201
9
Apr
201
9
May
201
9
Jun
201
9
Jul 2
019
Aug
201
9
Sep
201
9
Oct
201
9
No
v 20
19
Dic
201
9
Ene
2020
Demand Historical Data
Total 3 per. Mov. Avg. (Total)
0
200
400
600
800
1000
1200
1400
1600
May
201
8
Jun
201
8
Jul 2
018
Aug
201
8
Sep
201
8
Oct
201
8
No
v 20
18
Dec
201
8
Jan
201
9
Feb
201
9
Mar
201
9
Apr
201
9
May
201
9
Jun
201
9
Jul 2
019
Aug
201
9
Sep
201
9
Oct
201
9
No
v 20
19
Dic
201
9
Ene
202
0
Demand Historical Data
Total 6 per. Mov. Avg. (Total)
Page 47
37
based on the company expectations, stated in the business case analysis and results in
250 sales carried out through this stream every month.
Since this technique is based in historical demand data, it does not take into
consideration the impact of new business strategies that aim to expand the company’s
visibility through retail commerce. In order to represent the expected demand increase,
a growth rate of 133% have been assumed, based on the literature review (chapter 3.7)
This would suppose 332 more sales per month and total retail sales would raise up to
582.
The graph below shows the final demand forecast outcome. It includes the historical
demand during year 2019, the total expected demand during year 2020 and the split of
this demand between retail and ecommerce channels.
Figure 20. Total and B2B vs B2C demand forecast outcome.
5.2 Maximum Expected Demand
An alternative method has been used in order to calculate the maximum expected
demand and to have an extra input against shortages. It consists of determining the
average demand of the retailers currently partnered with SAYE and then extrapolate this
number to the future number of retailers to which the company is willing to sell its product.
0
500
1000
1500
2000
2500
3000
3500
1 2 3 4 5 6 7 8 9 10 11 12
Units
Month
Historical Demand vs Forecasted
Total Expected Demand (2020) B2C Demand (2020)
B2B Demand (2020) Total Historical Demand (2019)
Page 48
38
To do so, the average units monthly bought per retailer, have been recorded during the
last 6 months of previous year, as it is shown in figure 21.
Figure 21. Average units monthly bought per retailer during last 6 months (2019)
The following information can be extracted from the graph above:
- SAYE sells to 6 fixed retailers and to an average of 5 additional sporadic retailers
every month.
- Sales volume is 500 to 700 units every 3 months.
- The third month of each trimester they must deal with sale reversals, that is why
December has negative values.
- The average sales per company is 76 units.
If a similar sales proportion is considered for each of the 15 retailers with which SAYE is
aiming to establish a new commercial relationship, the extrapolation results in a total
amount of 1,140 units per month (i.e. 76 units/retailer x 15 retailers)
In addition, a 10% reduction in total retail sales have been considered in order to
represent the cannibalization effect. Therefore, the maximum expected sales volume is
approximately 1000 units per month.
Considering all previous inputs leads us to forecast a demand interval, for the following
year, between 600 and 1000 units sold per month and an average of 800 units.
616
123 64
244 215
-20
Jul-19, 205
Aug-19, 62
Sep-19, 21
Oct-19, 61
Nov-19, 108
Dec-19, -
-
50
100
150
200
250
-100
-
100
200
300
400
500
600
700
Jul-19 Aug-19 Sep-19 Oct-19 Nov-19 Dec-19
Un
its
x co
mp
any
# U
nit
s
Units
# Units Units x company
Page 49
39
5.3 Qualitative Techniques Outcome
In order to reinforce the previous numerical estimations, the following qualitative
methods, described in chapter 3.4.3.3 have also been used.
- Jury of Executive Opinion
- Delphi Method
- Sales Force Composite
Once these methods have been applied with all company employees and external
experts having participated, it has been concluded that a monthly sales volume of up to
76 per retailer is an oversized amount. This is not a reliable representation of real future
demand because it is based in the data recorded during a short period of only 6 months.
Furthermore, since a significant part of this sales volume is executed by sporadic
retailers, it is not possible to know for sure that them will take place in a regular basis.
As a result, 40 sales per month and retailer has been established as a more adequate
amount. This reduces the total sales to 600 units (i.e. 40 units/retailer x 15 retailers),
which is much nearer to the amount previously estimated through mathematical methods
(582).
To sum up, the business plan is to sell an average of 40 units per month and retailer to
15 different retail companies for a total of 600 units.
Nevertheless, it is important to take into consideration that there is a grade of uncertainty
around any estimation and that the further into the future we are estimating, the more
uncertainty will exist. Hence, this result will have to be periodically reviewed.
6 Proposed Strategies for Retail Activities
In this chapter, after carefully reviewing the literature and analysing the business
situation, a set of strategies is presented based on the found materials and methods.
Page 50
40
6.1 Business Integration
As it is widely exposed in chapter 0, business integration is a key factor that may interfere
in achieving a seamless business process. Regarding SAYE business case, this solution
is especially relevant to ensure integration between demand forecast and supply chain
management. To that end, the following strategies have been carried out.
a) Organizational Structure Process
A new organization chart has been developed to strengthen the relations between the
company departments. Future SAYE business activities and the relationships between
them are shown in figure 22.
Figure 22. Organizational Structure Process for Business Integration
A workflow between the entities presented above has been designed in order to enhance
demand-supply integration.
Page 51
41
Figure 23. Demand vs Supply Workflow
Finally, other suggestions are made in order to carry out this restructuring efficiently.
• Hire a wholesale manager to work within the sales department, exclusively
focused on B2B activities.
• Implement and ERP system to establish a common database among all business
areas.
b) Identification of Integration Problems & Mitigation Strategies
In addition, the problems that may affect SAYE integration have been identified and a
mitigation strategy has been proposed.
Page 52
42
Table 14. Identification of Integration Problems & Mitigation Strategies
Page 53
43
6.2 Cost Reduction
The main business expenses have been identified based in the results presented in
chapter 4.2.3. The tables and figures below show a ranking of these costs.
Table 15. Breakdown of Variable Costs
Figure 24. Breakdown of Variable Costs
Since SAYE does not participate in the manufacturing process, for the moment COGS
expenses have very little opportunities to be reduced. A part of it, the main costs that
need to be tackled are the ones under the categories of client service and transport.
These issues and the strategies proposed to mitigate them are described next.
Operating Costs (€)
Variable Costs 63,345
Sales & Marketing 24,424
Department Costs 23,340
R&D 1,544
Administration 4,912
Total Operating Costs 117,566
Variable Costs
COGS Packaging Marketing
Client Service Financial Comission Transport
Warehouse Sustainable Donations
Variable Costs (€)
COGS 38,881
Packaging 800
Marketing 885
Client Service (2) 4,732
Financial Comission (3) 3,816
Transport (1) 10,039
Warehouse (4) 2,668
Sustainable Donations 1,523
Total Variable Costs 63,345
Table 16. Breakdown of Operating Costs
Page 54
44
6.2.1 Implementation of Reverse Logistics Plan
The expenses caused by client service activities represent almost the 8% of the total
company variable cost. Among the most common problems related to this issue, the one
especially concerning SAYE activities is the large quantity of returned goods. As a result,
goods cannot be well controlled and the rate of invalid deliveries increases.
The most common return causes that the company is facing are:
- Shortage of transportation.
- Repeated transportation.
- Product quality.
When the distribution center faces the goods returning from many stores, there is always
a heavy commodity sorting work in order to distinguish the goods that can be sold back
to the supplier from the ones that cannot. This activities cause an extra cost and time
invested in addition of the lost sale opportunity.
In order to tackle this problem, returns will be managed based on a reverse logistic plan
including the following measures:
• Minimum return amount: since the cost of returning every single issued item is
higher than replacing them by new products shipped from the warehouse, the
return will not be proceeded until a certain quantity to be returned is accumulated.
• Screening of returned goods: receive all the returned products from the retail
stores in the system.
• Goods Categorization: goods returned to warehouse will be divided according to
their condition refurbish to the sales price, wholesaler sales, return to the
manufacturer, use for charitable donations, use for waste utilization and no use
value.
• Make a comprehensive statistical analysis of the returned goods: identify the
causes and the trend of the returns from every store and submit relevant reports.
This plan will reduce costs and enhance company reputation through customer
satisfaction, while it will empower the commitment of the company with sustainability.
Page 55
45
6.2.2 Reduction of Transport Cost
Among the best practices described regarding distribution activities, the selected
strategies to streamline this business area are here described:
• Pay per pallet not per truck: since for the moment the volume of sales in the retail
stream is not significant enough, the most of the times there is a truck capacity
waste. An unnecessary cost is paid when shipping one unique pallet within a
truck with capacity to up to 33 pallets. Therefore, it is necessary to redefine terms
and conditions with current couriers and pay per pallet shipped, not per truck.
• Capacity maximization: it has been identified that the size of the shoes package
is bigger than what is strictly necessary. By reducing the box size, it would be
possible to place 3 more packages in each pallet. The new conditions are
described in table 17.
Table 17. New conditions for capacity maximization
• Pay frights based on volume: after considering couriers service conditions and
based on the calculations shown below, it has been determined that the shipping
cost per pallet based on volume is cheaper than the one based on weight.
Table 18. Shipping cost per pallet
Page 56
46
6.3 Reduce Stock Inconsistencies
As it has been described in the business case the current strategy for purchase orders
is based in a reactive approach. During last year, an order equivalent to approximately
5 times the monthly sale, was placed every two months in average. So, although they
experimented punctual shortages, most of the time they had excessive stock levels.
Here, some inventory management strategies are proposed to improve customer service
and reduce extra costs.
• Determination of optimal batch size:
Q = 𝐸𝑂𝑄 = √2 𝑥 𝐷 𝑥 𝐶𝑓
𝑃 𝑥 ℎ
(6-1)
Q = EOQ = √2∗7,200∗0,43∗𝑄
3,65
2 = 1,420.27 units
(6-2)
The most economic order quantity would be to order batches of 1,420 units.
• Assemble-to-order: since the demand forecast outcome reduces uncertainty
regarding the expected production needed, it is now possible to change the
orders strategy from make-to-order environment to assemble-to-order. This
allows the manufacturing process to start even before receiving the customer
orders and thus the lead time between the batch order and the batch receipt is
reduced. More specifically the lead time will be reduced in 6 weeks, which is the
time it takes for pre-assembling process. As a result, instead of 2.5 months,
YouShoes will only need 1 month to fulfil the purchase order. This way a quicker
response capacity is acquired to deal with unexpected demand requirements.
Page 57
47
• Order frequency: it has been calculated to reduce variability in placing orders and
avoid stock inconsistencies. The order frequency has been obtained based on
the annual demand and the economic ordered quantity.
1420 𝑢𝑛𝑖𝑡𝑠 ∗ 12
7200 𝑢𝑛𝑖𝑡𝑠= 2.4 𝑚𝑜𝑛𝑡ℎ𝑠
(6-2)
• Determination of Reorder Point Time (r): it is the minimum stock level (safety
stock) at which a new order needs to be placed in order to avoid shortages. It has
been calculated based on the result of the forecasted demand (600 units per
month), the security rate (1.25) and the new lead time (1 month).
600 𝑢𝑛𝑖𝑡𝑠
𝑚𝑜𝑛𝑡ℎ 𝑥 1 𝑚𝑜𝑛𝑡ℎ 𝑥 1.25 = 750 𝑢𝑛𝑖𝑡𝑠
(6-3)
1420 𝑢𝑛𝑖𝑡𝑠 ∗ 12
7200 𝑢𝑛𝑖𝑡𝑠= 2.4 𝑚𝑜𝑛𝑡ℎ𝑠
(6-4)
Figure 25 shows the inventory management planning based in the parameters calculated
above.
Page 58
48
Figure 25. Inventory management planning
6.4 Information Systems Implementation
Based on SAYE operational requirements, it has been determined that the
Implementation and Integration of an ERP system would be highly beneficial. An initial
benchmarking of possible ERP systems has been carried out in order to identify which
one better suit SAYE requirements according to its capabilities and accessibility.
The modules that are aimed to be acquired through the implementation of this system
are:
- Sales Orders Management
- Integration of available stock with website sales platform
- Purchase Orders Management
- Website platform & stock availability integration
Page 59
49
7 DISCUSSION & CONCLUSION
This section evaluates the outcomes of the thesis, analyses in which grade the initial
goals have been achieved, discusses the project limitations and states the further work
needed.
7.1 Research Overview and Outcomes
This thesis had looked to answer the research question:
The outcomes of this research can be divided between outcomes form which any
business within the retail or consumer goods industry could take advantage, and
outcomes which are specifically useful for SAYE business case.
On one hand, the literature review has allowed to identify most common challenges that
can been encountered in similar scenarios and it provides an overview of all relevant
areas for any company with supply chain activities.
Whether the aim is to enter a new market or to improve the supply chain performance of
a company within consumer goods industry, these methods and materials, can be used
as an efficient methodology to ensure every relevant activity is reviewed. This research
places in one unique report the most relevant findings of the work of others. Therefore,
it works as a guideline of interest to any business aiming to:
• Analyse the trends and state of the art of an industry.
• Identify wholesaler best practices.
• Select or know more about demand forecast quantitative or qualitative methods.
• Use warehouse management to avoid shortages and optimize costs.
• Design an appropriate distribution plan.
• Track the financial health of the business.
On the other hand, through the business case study and discussions with company
experts, this paper provides an example of how to audit the AS-IS situation of a business
in order to have an overview of its financial situation and business activities.
Page 60
50
Finally, it validates the efficiency of the research findings by tailoring them to the specific
SAYE case, a start up within footwear industry. The following solutions have been
proposed to help the company meet their growth goals through retail market expansion.
• Application of a quantitative and qualitative approach to estimate sales volume
growth. The expected monthly sales have been established in 600 units and the
demand distribution forecasted can be observed in figure 20.
• Restructuring of the company business areas and determination of relationships
between them to ensure business integration. The result is shown in figure 22
and 23.
• Implementation of reverse logistic and distribution strategies to reduce the main
costs previously identified in customer service and transport areas.
• Definition of an inventory management plan including an EOQ model and new
replenishment policies. Shown in figure 25.
• Specification of the ERP system capabilities that should be implemented.
7.2 Objectives Met and Research Implications
Based on the conducted study the objective of identifying methods and best practices
around retail and supply chain industry have been totally achieved. Furthermore, an
overview of every step within the supply chain have been here highlighted, from
procurement to product distribution and warehouse management.
Regarding the investigation of the business case the initial goals have been fully
achieved through the analysis of business historical data recorded and the outcomes of
interviews to company CEOs. Every business activity have been detailed, together with
the company organizational structure and its financial situation. This have made possible
to identify transport, client service and warehouse management as the main business
weaknesses.
The aim of realigning SAYE model to facilitate its business growth have been achieved
through a list of proposals (chapter 6) supported by the findings of the previous study.
Overall, the study has been successful in:
• Providing a methodology to evaluate business AS-IS and enhance its supply
chain activities.
• Providing an overview of a specific business case.
• Obtaining a demand forecast result which to reduce uncertainty.
Page 61
51
• Suggesting purchasing, warehouse and distribution management realignments
to meet demand requirements, reduce costs and adapt to new business scenario.
The findings of the current study have implications on any business looking to enhance
its supply chain activities. Specifically, it can have an impact on company owners by
providing an exhaustive research on supply chain industry, that can empower their
decision-making towards the business expansion through retail. Besides, the results of
the current study can also help retailers that are looking to increase their sales while
optimizing resources allocation.
7.3 Research Limitations and Future Research
Some challenges and limitations have been faced along the development of this thesis.
• Time: the initial project scope was defined according to a time availability that has
been reduced at some point along the project, due to a change in my professional
working conditions.
• Communication: communication with thesis supervisors and SAYE employees
has also been affected by the unprecedented situation caused by Covid19
pandemic.
• Word count limitation: the maximum word length (8,000 words).
• Restricted knowledge: the poor knowledge about the researched topics, together
with the narrow trajectory of SAYE and their employees.
As a result, the cost benefit analysis section, initially included in the project goals, has
not finally been included.
Finally, the following actions are recommended to be considered in future research.
It is recommended that studies in the future ensure the validation of the results obtained
in this report. Practical assessment is the best way to prove their feasibility. For instance,
in the future months the demand forecast result needs to be validated with actual
demand values. In addition, future studies should use more than one method to estimate
demand and compare their performance with the one developed in the demand forecast
chapter.
Finally, it is recommended that further studies indulge in further analysis of ERP systems.
Benchmark the systems listed and evaluate the key capabilities identified in the thesis
findings in order to select the most appropriate system for SAYE.
Page 62
52
REFERENCES
I. Armstrong-Gibbs, F. , & McLaren, T. (2017). The Retail and E-Tail Landscape. In
Marketing Fashion Footwear: The Business of Shoes (pp. 98–111).
London: Bloomsbury Visual Arts. Retrieved August 26, 2020
II. The Centre for Retail Research - Expert Analysis Services, n.d.
Web site: https://www.retailresearch.org/
III. Armstrong-Gibbs, F. , & McLaren, T. (2017). The Retail and E-Tail Landscape. In
Marketing Fashion Footwear: The Business of Shoes (pp. 112–115).
London: Bloomsbury Visual Arts. Retrieved August 26, 2020
IV. Retailers’ Order Timing Strategies under Competition and Demand Uncertainty
Ozgun Caliskan Demirag, Weili Xue , Jie Wang , 26 March, 2020
V. Ananth. V. Iyer, Mark E. Bergen (1997). Quick Response in Manufacturer-Retailer
Channel. Management Science.
VI. Pareto Efficiency Definition, n.d.
Web site: https://www.investopedia.com/terms/p/pareto-efficiency.asp
VII. Gérard P. Cachon, Martin A. (2005). Lariviere. Supply Chain Coordination with
Revenue-Sharing Contracts: Strengths and Limitations.
VIII. Advantages & Disadvantages of a Fixed-Price Contract | Small Business, n.d.
Web site: https://smallbusiness.chron.com/advantages-disadvantages-fixedprice-
contract-21066.html
IX. 7 Strategies To Increase B2B Wholesale Sales, n.d.
Web site: https://blog.apruve.com/7-strategies-to-increase-b2b-wholesale-sales
X. Moon, Mark A.. Demand and Supply Integration : The Key to World-Class Demand
Forecasting, Second Edition, DEG Press, 2018. ProQuest Ebook Central,
XI. Dana, L.P., et al. Handbook of Research on European Business and Entrepreneurship :
Towards a Theory of Internationalization, Edward Elgar Publishing Limited, 2008.
ProQuest Ebook Central.
XII. Vishal Gaur, Saravanan Kesavan, Ananth Raman, Marshall L. Fisher, (2007). Estimating
Demand Uncertainty Using Judgmental Forecasts. Manufacturing & Service Operations
Management.
XIII. Marshall Fisher Ananth Raman (January, 2018). Production and Operations
Management: Using Data and Big Data in Retailing
XIV. Ma, Shaohui, Kolassa, Stephan, Fildes, Robert (2018). Book: Retail forecasting:
research and practice
Page 63
53
XV. Rob J Hyndman and George Athanasopoulos. Forecasting: Principles and Practice.
Monash University, Australia. Web site: https://otexts.com/fpp2/#
XVI. Armstrong, J. S. (1984), “Forecasting by extrapolation: Conclusions from twenty-five
years of research”, Interfaces, 14 (Nov.-Dec.), 52-66.
XVII. Armstrong, J. S. (2001a), “Evaluating forecasting methods,” in J. S. Armstrong (ed.),
Principles of Forecasting. Norwell, MA: Kluwer Academic Publishers.
XVIII. Chambers, J. C., S. Mullick & D. D. Smith (1971), “How to choose the right forecasting
technique,” Harvard Business Review, 49, 45-71
XIX. Collopy, F., M. Adya & S. Armstrong (2001), “Expert systems for forecasting,” in J. S.
Armstrong (ed.), Principles of Forecasting.
XX. Makridakis, S., A. Andersen, R. Carbone, R. Fildes, M. Hibon, R. Lewandowski, J.
Newton, E. Parzen & R. Winkler (1982), “The accuracy of extrapolation (time series)
methods: Results of a forecasting competition,” Journal of Forecasting, 1, 111-153
XXI. Mentzer, J. T. & J. E. Cox, Jr. (1984), “Familiarity, application, and performance of
sales forecasting techniques,” Journal of Forecasting, 3, 27-36
XXII. Ching-Wu, Chu Guoqiang, Peter Zhang (2002), A comparative study of linear and
nonlinear models for aggregate retail sales forecasting.
XXIII. Fumi, A., Pepe, A., Scarabotti, L., & Schiraldi, M. M. (2013). Fourier analysis for
demand forecasting in a fashion company. International Journal of Engineering
Business Management, 5, 5-30.
XXIV. Ramos, P., Santos, N., & Rebelo, R. (2015). Performance of state space and ARIMA
models for consumer retail sales forecasting. Robotics and Computer-Integrated
Manufacturing, 34, 151-163
XXV. Andrews et al., 2008; Foekens et al., 1994; Van Heerde, Leeflang, & Wittink, 2000,
2001. Estimating the SCAN⁎PRO model of store sales.
XXVI. Lee G. Cooper, Penny Baron, Wayne Levy, Michael Swisher, Paris Gogos, (1999).
PromoCast: A New Forecasting Method for Promotion Planning
XXVII. Antoni Espasa y Ana Pérez Espartero, (2008). Forecasting with dynamic regression
models
XXVIII. S Makridakis, A Anderson, R Carbone, R Fildes, M Hibdon, R Lewandowski, J
Newton, E Parzen, R WinklerThe accuracy of extrapolation (time series) methods:
Results of a forecasting competition. Journal of Forecasting, 1 (1982), pp. 111-153
XXIX. Web site: http://www.businessdictionary.com/definition/jury-of-executive-opinion.html
XXX. Chitu Okoli, Suzanne D.Pawlowski . The Delphi method as a research tool: an example,
design considerations and applications. Volume 42, December 2004, Pages 15-29
Page 64
54
XXXI. Web site: https://businessjargons.com/sales-force-composite-method.html
XXXII. Purchase Planning: Basics, Considerations, & Best Practices
Web site: https://www.eazystock.com/blog/purchase-planning-basics-considerations-
best-practices/
XXXIII. Dayong Xu (2019). Research on strategic mode and development of reverse logistics in
retail industry. Malaysian E Commerce Journal (MECJ)
XXXIV. Evan L.Porteus, (2005). Chapter 12 Stochastic inventory theory. Handbooks in
Operations Research and Management Science. Volume 2, Pages 605-652
XXXV. Plinere, Darya, Borisov, Arkady (2015). Case Study on Inventory Management
Improvement. Information Technology and Management Science. Pages 91-95
XXXVI. AvatarBY Aashish Pahwa (2019). Distribution Channels – Definition, Types, &
Functions.
XXXVII. Smriti Chand. Types of Distribution: Intensive, Selective and Exclusive Distribution.
Web site: https://www.yourarticlelibrary.com/distribution/types-of-distribution-
intensive-selective-and-exclusive-distribution/5780
XXXVIII. Lindsey Jenkins. Distribution Strategy: Choosing Among the Cutting Edge Distribution
Strategies. Web site: https://www.selecthub.com/enterprise-resource-planning/cutting-
edge-distribution-strategies/
XXXIX. Carlos Eduardo Álvarez Castro, (2015) Startup Risk Analysis: Pompeii Brand case.
Page 65
55
APPENDICES
Appendix A Interview Transcript
All the collected information in the Interview to Co-founders Lizzie Sabin, Pablo Marín
and Damian is here presented. The main information obtained is highlighted in bold.
About SAYE Finance
How do you control the company financial activities?
We make an estimation of the financial accounts (sales, revenues, costs) before the
beginning of each financial term and input the real final value at the end of each terms.
New estimations are made based on the comparison between the expected and the
real value, every time a new value is input the estimations are updated. The estimations
are also calculated based on the historical growth of main financial indicators and
the company roadmap.
Despite the methodologies used, this is an environment with a big grade of uncertainty,
therefore sometimes it is complex to accurately estimate the cashflow requirements or
to identify when is it possible to approach the company break-even point, etc.
Which are the monthly costs of the company?
The basic monthly costs of the company can be observed in the tables below. They are
divided in Variable Costs (which depend on the number of commercialized units),
R&D, Sales & Marketing activities, Administration (which represents costs linked to the
company human resources)
About Sales Channels
Which are the current SAYE Sales Channels?
We currently sell shoes through two different channels:
B2C (Business to Consumer) which includes all sales where customers are directly
reached with no intermediate agents. It means units sold through ecommerce. Although
the startup was initially built up with the income obtained from sales through
Crowdfunding platforms such as Indiegogo and Kikstarter, from November 2019 SAYE
has its own ecommerce platform.
Page 66
56
B2B (Business to Business) which includes all sales to retailers. Nowadays SAYE has
only 11 retail partners, but many others have shown real interest to commercialize our
products. The aim is to create a reliable structure to meet this new upcoming demand.
Which are the differences between the profitability of these two sales channels?
The cost drivers and its value used to calculate profitability vary depending on each one
of these channels.
Although all products have common costs regarding the manufacturing and logistics,
products sold through B2C have additional costs related with sales campaigns,
marketing and financial commissions. The reason why these costs are not included in
B2B is that the amount of sales made through retail market is still not significant in
comparison with ecommerce. Therefore, all investment in marketing and the services
outsourced for financial support are only focused in B2C.
The revenue x unit sold through each channel is also quite different. The price per unit
is about 105€ in B2C while in B2B sales it is less than 60€.
The mentioned revenue as well as a detailed breakdown of cost drivers together with its
average value used to calculate the profitability per unit in each one of this sales
channels, can be observed in chapter 3.2.
About the Manufacturing Process
How is the manufacturing process managed?
Since SAYE is for the moment a small startup with no capacity to own the manufacturing
activity, this service is outsourced to a Portuguese company named “YouShoes” that
manufactures SAYE shoes in its factory in Portugal.
The price per unit is about los 29€ in average, which does not include the transport
cost.
How do you manage the Purchase Orders?
Every day we review and update in an excel sheet the number of sales orders
received through the e-commerce platform, the present stock, the expected in-
bound units and the estimated sales per month for each product type. Based on
this data and with the aim to avoid stockouts, we decide when and how many units
should be ordered.
Page 67
57
The strategy is to make orders every two months with the aim to maintain a security
stock level equivalent to 2.5 times the monthly sales. As a result, we are currently
ordering about 2000-2500 Uds, which is what the company historically sells every two
months. The problem is that this demand is continuously growing so we are increasing
the size of the ordered batches again and again.
The lead time since the purchase order is released until the batch is receipt takes
from 2 to 3 months.
About Warehouse Management
How many warehouses do you have? Where? With which capacity? Is the
warehouse management an outsourced activity?
We outsource this service to a company named NAEKO who manages a warehouse
in Sant Boi de Llobregat less than half an hour away from Barcelona city center.
There we maintain a stock level of about 2000 units, although they have capacity to
maintain much more since it is a large warehouse equipped with the latest technology.
How do you manage the shipping activities? How many units do you
approximately distribute per day?
All products manufactured in Portugal are transported to NAEKO, where all orders
from final customers or retailers are received and satisfied.
We are currently working with one unique Courier, UPS. Every day around 4:00pm,
regardless the number of orders received, an UPS truck picks up all due deliveries.
We sent about 40 to 60 units per day to final customers, while the number of orders
received for shops has a great variation, some months we can send up to 700 units
through B2B only.
Which are the costs linked to warehouse management? Is it a fix or variable cost?
The cost for warehouse management depend on many parameters. NAEKO charges
a different price each month based on number of stock in/out-bound, stock maintained,
labelling…
Page 68
58
About Distribution Channels
Who are your distribution partners? Which services do they offer and with which
frequency? Which are the cost drivers?
On one hand we have partnered with “CS transitorios” for all product transport from
the factory in Portugal to the Warehouse in Barcelona. We use their service
occasionally, once every two months approximately.
On the other hand, we have hired the services of “UPS” for all distributions from
NAEKO warehouse to final customers and retailers. As it has been explained before,
UPS makes one pick up per day.
The cost charged by both partners varies according to the number of deliveries.
The transport cost is included in the final price to final customers, while for retail
sales this cost is charged separately, unless they manage the procurement
themselves through their own distribution services, but this is an exceptional situation.
Who are your packaging partners? Which services do they offer? Which are the
cost drivers?
We have two partners in charge of packaging activities:
“Enveseur”: they manufacture three types of packages for 1, 2 or 4 pairs of shoes and
send them to NAEKO warehouse for the packaging process.
“Sheedo”: they provide us with tomato seeds that we include in the box of each pair of
shoes. The costs vary according to the quantity ordered which is normally of 5.000
units.
About SAYE Business Strategy
Which is the growth strategy of the company in the short and long term and why?
Nowadays SAYE has reached a good financial stability with a cash in hand up to 248k
€ which makes it possible to maintain the current infrastructure with an estimated
average cost of about 37k €. So there is no urgent need to increase revenues and
we have the required financial stability to invest on growing the business.
The problem is that a significant part of the total company revenues depends on sales to
final customers made through ecommerce. Although the margin profit in online sales
Page 69
59
is higher than retail sales, the aim is to expand the business through the retail
market not to increase sales and revenues in this channel but to increase the
brand visibility and scope. This would result in reaching a higher number of customers
worldwide and in an increase of benefits ultimately.
One of the bigger issues that we must face in order to achieve this goal is our logistics
infrastructure, which is not ready to satisfy this demand requirements. More specifically,
we have an inefficient stock management. As a result of the inaccuracy in demand
and stock estimations, we are often forced to satisfy retail orders with stock initially
stored for ecommerce sales, which results in stockouts. To mitigate this risk, we
end up making bigger orders, with badges of about 6.000 units that represents the
sales of three months, but it consequently causes a significant extra cost.
Many shops have shown interest on acquiring our products, last month we sold up
to 1.300 units in B2B. However, until we get an efficient logistic strategy, we have to
reject many requests and therefore nowadays SAYE only sells shoes to 11 shops.
The business plan for next two years is to increase a 50% the number of units sold
in the retail market which means roughly 1,200 more than last year up to a total of about
3,640 units sold per year through this channel. It would represent an increase of
almost a 60% in the revenues currently obtained from this source. Nevertheless, as
it can be observed in the graphs above, B2C market will still suppose about the 84%
of the total revenues in the short term.
Which are the most significant parameters for the validation of new strategies?
Based on what has been explained before, the main goal is to enter the retail market
with the best strategy to produce the greater possible impact in the total annual
demand. We expect to obtain a growth in the total number of sales (not necessarily
in revenues) both online and shop sales, by empowering the visibility and the
strength of the brand trough the retail market. This way we would get the loyalty of a
wider target of customers, which would give us the needed stability to expand our
product portfolio.
Page 70
60
Appendix B Further Definitions
SCAN*PRO: [XXV], decomposes the sales of a brand in for a brand into own- and cross-
brand effects of prices, feature advertising, aisle displays, week effects and store effects.
PromoCast: [XXVI], Promotion-event forecasting model. It uses a static cross-sectional
regression analysis of SKU per store sales under a variety of promotion conditions, with
store- and chain specific historical performance information.
Dynamic regression model: [XXVII], It captures the effects of variables such as past
sales, trend, own and competitor prices and promotional variables, as well as
seasonality.
Jury of Executive Opinion: [XXIX], The general practice is to bring together top
executives from different business areas who provide background information,
experiences, and opinions to the board of directors.
This exercise usually leads to a quicker and more reliable result without the use of
elaborate data manipulation and statistical techniques.
Delphi Method: [XXX], it that helps a group of experts, as a whole, to deal with a complex
problem. and obtain the most reliable consensus.
It is typically based on a series of questionnaires, feedback of individual contributions,
assessment of the group judgment and a degree of anonymity for the individual
responses.
Some applications of the Delphi method in a particular forecast demand issue could be:
- Identification of research topic: demand forecast specifications such as period
sales channel, product type.
- Specification of research question(s): to determine variables of interest to
determine forecasted demand and generation of propositions.
- Preliminary identification of causal relationships: for instance, direct correlation
between business actions such as marketing campaigns or promotions and
demand increase.
Sales Force Composite: [XXXI], This method is especially useful for companies with a
broad market presence wherein the sales agents forecast the sales in their respective
territories, which is then consolidated to develop an overall company sales forecast. The
sales force gives their opinion on sales trend to the top management. Since the salesmen
Page 71
61
are very close to the market, can give a more accurate sales prediction on the basis of
their experience with the direct customers.
This method is again based on the judgments but is different from the jury and survey of
expert’s opinions method. The difference is while both the methods depend on the
judgments made by a few top executives, the sales force composite methods
encompasses the aggregate judgments of the entire sales force. Furthermore, this
method is more reliable because of a large population sample and moreover, it can be
readily broken down into product-wise, month-wise, area-wise forecast.
Distributors: A distributor is a wholesaler who, in addition to fulfilling retailer orders, they
actively sell products on behalf of the producers. Their responsibilities include from
managing orders and returns to acting as a sales representative. They perform market
analysis and search for new opportunities to achieve peak sales performance. A
distributor focuses on a particular market in order to cultivate strong relationships with
manufacturers.
They have the option to sell to retailers and other sellers, or directly to consumers and
businesses.
Wholesalers: A wholesaler fulfills orders of retailers, by reselling goods, often in large
quantities for manufacturers. Wholesalers purchase in bulk, typically, which lowers the
price, from either distributors or manufacturers. This allows wholesalers to make a profit
because they are able to sell to retailers in smaller packages obtaining a profit margin.
Unlike distributors, wholesalers only deal with the storage and delivery of goods.
Retailers: Retailers are the outlets where consumers can purchase products. This is local
grocery store or walmart down the street. They can sell through storefront locations or
through online channels. Retailers purchase products from distributors or wholesalers.
Brokers and Agents: Make way for agents. They handle the logistics of the sales. Agents
handle contracts, marketing, and pulling together specialized shipments. A part of their
job is customer relationship management. On behalf of manufacturers, they take
ownership of products through the distribution process. They represent the producer in
the sales process.
Intensive: this type of distribution aims to provide saturation coverage of the market by
using all available outlets. For many products, total sales are directly linked to the number
Page 72
62
of outlets used (e.g., cigarettes, beer). Intensive distribution is usually required where
customers have a range of acceptable brands to choose from.
Selective: selective distribution involves a producer using a limited number of outlets in
a geographical area to sell products. An advantage of this approach is that the producer
can choose the best-performing outlets and focus effort on them. Selective distribution
is appropriate when consumers have a preference for a particular brand or price and will
search out the outlets that supply. It also enables the firm to establish a good working
relationship with channel members.
Exclusive: The firm distributes its brand through just one or two major outlets in the
market, who exclusively deal in it and not all competing brands. This form of distribution
obtains a high prestigious image. Through this strategy, the manufacturer hopes to have
control over the intermediaries price, promotion, credit inventory and service policies.
Page 73
63
Appendix C Project Gantt Chart
Figure 26_Apx. Project Gantt Chart (May to June)
Figure 27_ Apx. Project Gantt Chart (June to July)
MONTH
WEEK
ACTIVITY / DAY 10 11 12 13 14 15 16 17 18 19 20 21 22 23 24 25 26 27 28 29 30 31 1 2 3 4 5 6 7 8 9 10 11 12 13 14 15 16 17 18 19 20 21 22 23 24 25 26 27 28 29 30 1 2 3 4 5 6 7 8 9 10 11 12 13 14 15 16 17 18 19 20 21 22 23 24 25 26 27 28 29 30 31 1 2 3 4 5 6 7 8 9 10 11 12 13 14 15 16 17 18 19 20 21 22 23 24 25 26 27 28 29 30 31 1 2 3 4 5 6 7 8 9 10 11
Mid Term Project Review
Report Presentation
Report Submission
Project DefinitionSubject Breakdown & Scope Definition
Literature Review
Case Study AnalysisModel Development
Demand Forecast
Design new logistic StrategiesCost vs Benefit evaluation
Reporting
Weekly Review
Report Writing
Project Presentation
Presentation Support Resources
Presentation Rehersal
JULY
1 2
MAY JUNE
3
AUGUST
4
PROJECT GANTT CHART
10 11 12 13 145 6 7 8 9 15 16 17 18
SEPTEMBER