CRANFIELD UNIVERSITY RASHID ALI AL-SAADI EFFECTIVENESS OF TECHNOLOGY TRANSFER IN THE SEARCH FOR SUSTAINABLE DEVELOPMENT: THE CASE OF QATAR DEFENCE COLLEGE OF MANAGEMENT AND TECHNOLOGY PhD THESIS
Transcript
CRANFIELD UNIVERSITY
RASHID ALI AL-SAADI
EFFECTIVENESS OF TECHNOLOGY TRANSFER IN THE SEARCH FOR SUSTAINABLE DEVELOPMENT: THE CASE OF QATAR
DEFENCE COLLEGE OF MANAGEMENT AND TECHNOLOGY
PhD THESIS
CRANFIELD UNIVERSITY
DEFENCE COLLEGE OF MANAGEMENT AND TECHNOLOGY
DEPARTMENT OF DEFENCE MANAGEMENT AND SECURITY ANALYSIS
PhD DISSERTATION
Academic Year 2006-2007
RASHID ALI MOHD AL-SAADI
Effectiveness of Technology Transfer in the Search for Sustainable Development: the Case of Qatar
collaboration, and enforcing contracts. Specifically, governments can enforce the
Agreement on Trade-Related Aspects of Intellectual Property Rights (TRIP). TRIP
promote international trade and IPR, and ensures that IPR laws do not hinder
legitimate trade.
Governments can also apply the set of measures established under the Montreal
Protocol. This protocol has facilitated technology transfer of ozone friendly
technologies. The Kyoto Protocol presents additional important opportunities for
capacity building and technology transfer.
The United Nations’ Agenda 21 also provided some recommendations for
governmental public policies that would promote technology transfer.70 These
recommendations included: "(a) information networks and institutions that
disseminate information and provide advice and training; (b) government policies
creating favorable conditions for both public-sector and private-sector transfers; (c)
institutional support and training for assessing, developing, and managing new
technologies; (d) collaborative networks of technology research and demonstration
centres; (e) international programmes for cooperation and assistance in R&D and
capacity building; (f) technology-assessment capabilities among international
organisations; and (g) long-term collaborative arrangements between private
businesses for foreign direct investment and joint ventures."71
2-17
In addition to this, manufacturing efforts must be directed towards national priorities.
Therefore, investments in research and design must address such fields. This will
require cooperation and coordination between universities and industries. The
government can intervene and increase these partnerships through grants that motivate
them to focus on its goals. This can be achieved through a science and technology
policy.
In sum, there is a need for macroeconomic and environmental policies that make the
public administration system transparent, encourage the private sector to invest in new
technologies, provide adequate infrastructure and human resources, facilitate
education and training, and maintain and develop people in the country. Hence,
government and the external environment are two important issues that need to be
studied when analyzing a country’s technology transfer effectiveness. This study will
assess good governance with respect to accountability, participation, transparency,
globalization, national priorities, international cooperation, and leadership capacity. It
will also measure government performance to its system of innovation, social
infrastructure, economy, legal institutions, and standards. Together, these measures
will assess government policies and the external environment.
National Systems of Innovation
National Systems of Innovation (NSI) infrastructure are institutional networks that
modify, import and diffuse new technologies.72 National systems of innovation reflect
the interaction between private firms, public firms, universities, government agencies,
policies and social relationships. Lundvall stresses the importance of a strong social
organization that binds these units in order to build the capability needed to master
new technologies.73
This mandates policy intervention to address any weakness in the
social cohesion. Also, the policy should facilitate the process of technological
innovation by modifying the network through such means as financing, marketing,
training and competitive positioning.
National wealth (GDP per capita) and research and development intensity (global
gross expenditure on R&D (GERD)/GDP) are used to compare innovation systems.74
The GDP per capita can be extracted from government statistics or the United
2-18
Nation’s Human Resource Index. The R&D Intensity is a measure of the Global
Gross Expenditure on R&D as percentage of GDP. These will be used as measures of
the innovation system in Qatar for this study.
It should be noted that innovation systems are complex and that measures like R&D
intensity may not sufficiently reflect real innovation systems behaviour. In addition to
such indicators, it is important to measure the practices of the innovation systems,
such as the extent to which a particular system has secured appropriate framework
conditions, built an innovation culture, enhanced technology diffusion, promoted
networking and clustering, and responded to globalization. This will be done in
subsequent sections since these factors resemble independent dimensions. For
example, although enhancing technology diffusion is part of building an innovation
system, it is also a main part of absorptive capacity.
Social Infrastructure
The Human Development Index (HDI) is a composite indicator representing three
dimensions of social development: a long life in good health, level of education, and
access to resources necessary for a decent standard of living. The index is in no way a
comprehensive measure of human development, but it provides a glimpse at the trends
in human progress and the relationship between income and well-being.75
This
measure will be used in the study to reflect the external social environment that
affects technology transfer. Furthermore, it will be correlated with the Index of
Sustainable Economic Welfare (ISEW) to evaluate certain hypotheses in this
dissertation.
Increased community participation has been demonstrated to lead to improvements in
the quality, effectiveness and sustainability of development programs. Participation
also strengthens government and stakeholders’ commitments.76 It also prevents
corruption.77
Agenda 21 advocates social partnership to build environmental and
economic security.
Unfortunately, there are a number of barriers to the promotion of participation. First,
building the social infrastructure necessary to increase participation requires
considerable time and resources that may not be available. At the policy level, it is
2-19
possible that bureaucracies may resist working in an innovative way. Finally,
sustaining participation mandates extending frameworks, methods and procedures.78
Finally, participation is a complex process with costs and benefits that are difficult to
measure.79
Still, this study will attempt to measure participation.
It can be summarized that the most important measures of social infrastructures can be
HDI and the degree of participation. The Human Development Index is calculated by
the United Nation Development Programme. Participation can be measured through
international freedom of association policy, freedom of access to public policies and
information, and the number of science and technology seminars.
Macroeconomic policy is another player in creating a transfer-enabling environment.
Macroeconomic Policy
Traditionally, governments have dominated investments in large-scale technology
where returns are likely to be very long term.80 They have also been heavily involved
in fields where economic development is perceived to be central to national security,
such as the energy sector. Most modern investment comprises a mixture of
government and private investments. Private investment is normally directed towards
business that involves returns within a shorter span of time.81
Faced with the inadequate performance of state-funded programmes, as in the energy
sector, and the associated high cost of operation, many governments have privatized
these programmes.82
Relationships between private and public sectors can create
barriers to technology transfer that need to be investigated and addressed. These
obstacles include lack of access to capital, lack of available capital, high inflation or
interest rates, uncertainty or instability surrounding tax policies, and risk of
expropriation.
The most important macroeconomic policies that encourage public-private or foreign
direct investments have been found to include: 83
• Low inflation
• Stable currency
2-20
• Free movement of private capital and profits
• Reduction of risk of expropriation
• Reduction of the role of the public sector in directly productive sectors
through privatization
• Removal of mandated local ownership requirements
• Reduction of domestic fears about excessive foreign presence
• Low tax rates
Legal Institutions
Besides the macroeconomic indicators above, a range of legal institutions are needed
to protect intellectual property rights (IPR), reduce regulatory risks, promote good
governance, and eliminate corruption. Strong IPR protection encourages research and
development by allowing innovators to a dividend of the benefits of their innovation.
This, in turn, leads to innovation and higher long-term growth. The absence of an IPR
policy or IPR enforcement represents a serious barrier to technology transfer. Actors
will not transfer their leading technologies into countries with weak IPR regulations,
though they may transfer old technologies.
IPR policies can be supplemented through international treaties like TRIPS,84 but this
alone is not enough. Governments need to mitigate risks in order to reduce costs and
extensive delays associated with technology investment.85 When IPR regulations are
not enforced, obsolescing technologies will be more prevalent. Furthermore, when the
law does not function properly, there are incentives to engage in corruption,86 and to
retain monopoly power. The solution to this, Johnston argues, is empowering people
through education and participation.87
This supports the notion that stakeholder
participation increases the possibility of successful technology transfer.
In sum, the absence of strong legal institutions will discourage rapid international
diffusion of technology. Based on the above, the related measures to be included in
this study are mostly qualitative, such as clear property rights policies, clear IPRs, and
the existence of anti-corruption law.
2-21
Codes, Standards and Certifications
Transaction costs and technology risks can increase when the buyer becomes
responsible for evaluating the quality and performance of the technology. Here, codes
and standards become important because they represent the interests of end users.
Standards alleviate the need to comprehensive knowledge a customer must possess
before purchasing; therefore, they can overcome information barriers. Further,
Certification reasserts that the processes, products or technologies meet the specific
standards that were designed at the performance audit phase.
Governments can cooperate with the private sector to establish codes, standards and
certifications. To analyze this, the number of codes and standards for different
categories can be measured. At the same time, qualitative measures can be used to
look at international accreditation, like the ISO standards.
2.4.2 External Technology and Resources
While resources are only one dimension of performance,88
they are an important one.
Where do organizations look for resources and technology? Sources of technology
can include private firms, government agencies, government laboratories, universities,
nonprofit research organizations, and even entire country.
These sources sometimes serve different functions. For example, universities can not
only help organizations access new technology, but they can also update organizations
on new development and can teach skills. There are also certain problems unique to
each source. One disadvantage of universities as technology transfer partners relates
to timing. Universities do not appreciate the urgency within which industry functions.
There are also different practices with respect to intellectual property rights.
Universities often emphasize the production of research publications over innovations
for patents. Each potential partner, then, will require careful analysis. A useful
measure of research effectiveness at the university level would be the percentage of
research that is classified as having some degree of commercial viability.
The government can act as a catalyst to encourage new companies to apply public
research. This will create jobs, profits and wealth for the country. Forming links with
2-22
universities can be done through graduate employment, industry-university research
units, and forums for the exchange of information.
Where technology already exists, transfer might begin with the identification of a
particular technology’s existence, evaluation of its general appropriateness, and
adjustments to make it suitable for a particular field or environment. The technology
can then be available for use in places where it was verified that such technology will
succeed.89
However, technology sourcing might impede technology transfer efforts
because of a lack of expertise needed to evaluate it, public reluctance to participate in
the transfer process, a lack of availability of transfer mechanisms, anomalies in
commercial regulation, or an inability to identify the appropriate source of
technology. All of these challenges must be addressed.
There are three important measures related to external sources of technology that will
be included in this study: policy related to technology needs, information access to
policy (networks), and plans for sustainable resource development.
Methods and Means of Technology Transfer
Why are certain technology transfer strategies more effective for some countries than
others?90
Foreign direct investment worked well in China, whereas licensing was the
best strategy in Malaysia. This makes it difficult to conclude that there are causal links
between strategy type and technology transfer success, but it is certainly worth
examining each strategy’s relationship with effectiveness measures.
Technology sale or acquisition is a strategy that works best if there are problems of
licensing to third parties or if the owner is unable to convert the patent to a
commercial product. Once technology is transferred, comprehensive control and
management is handed over to the buyer who typically pays a very high price.
Usually, a buyer will only purchase technology if he is absolutely certain that the
technology will be of economic value.
Licensing is another strategy that gives execution rights to the holder for a certain
time period through a contract. After the period is over, rights of execution and usage
return to the patent holder. Since the technology provider retains possession rights and
2-23
only gives license for execution rights, execution permits can be given to other
parties.
For highly advanced technologies, sales and acquisition or licensing cannot guarantee
commercial success. Joint venture is a way to solve this problem. This entails
technology transfer using others’ management capital and know-how, equipment and
competencies.
Purchase of corporations possessing technological capabilities is seen as a technology
transfer as well. This kind of technology transfer strategy is chosen if the speed of
technology development is very fast or the life cycle of related technology is very
short. However, evaluating companies subject to acquisition is very difficult.
Other technology transfer methods include the sale of technology data, where an
organization acquires a part of the particular technology information. This can be used
as a method to find simple technological solutions for small projects. Technical
personnel can be a medium for transferring technology as well. If the technology
provider is not needed to execute the technology transfer activity, and if technology
has been documented, then the in-house technical personnel can be utilized in the
process. This method can be used in combination with the above mentioned methods
as well.
Other strategies have been adapted from the United Nation Conference on Trade and
Development (UNCTAD)91 and Patel.92
1. Total project contracting
Methods of technology transfer can range
from most to least complex as follows:
2. Total process contracting
3. Major process contracting
4. Know-how contracts
5. Patent contracts
6. Trademark agreements
7. Franchise agreement
8. Engineering services contracts
9. Technical consultancy contracts
2-24
10. Purchasing machinery supplies
11. Employment of experts
12. Use of technical publications
13. Use of personal contacts
Barry Bozeman93
states that strategy does make a difference. He finds that
participation in a research center is the most effective strategy for technology transfer,
followed by sales of patents, copyrights, and licenses, and R&D cooperation for
technology transfer. He situates these strategies among others:
1. On-site seminars and conferences (seminars)
2. Fliers, newsletters, or other mailed correspondence (mail)
3. Person-to-person contacts of our scientific and technical personnel with
persons in technology-recipient organizations (contacts)
4. Presentations at scientific meetings sponsored by professional organizations
(professional conferences)
5. Presentations at scientific meetings sponsored by government organizations
(government conferences)
6. Membership in research consortia, university, or government centers
(consortium)
7. A central office with responsibility for technology transfer (office)
8. Encouraging informal, on-site visits (visits)
9. Personnel exchanges (exchange)
10. Cooperative R&D (as a technology transfer strategy, rather than other possible
purposes)
11. Contractual relations for direct R&D funding between a lab and the
organization receiving the technology (contract)
12. Permitting persons from other organizations access to a laboratory's equipment
and facilities (equipment access)
13. Sales or gifts of patents, copyrights, or licenses (license)
Foreign Direct Investment (FDI) by multinational companies is important for
international technology transfer. Through technology spillover, a country enhances
its productivity and economic welfare.94 In a study by Nakamura, it was demonstrated
that if the elasticity of the foreign firm’s marginal quasi-rent is positive, then the
2-25
spillover and efficiency of learning or imitation is large.95
In the same study, it was
found that an increase in spillover does not always lead to an improvement into the
host country’s welfare. This is in opposition with the previous findings. It can be
concluded that the foreign subsidies are beneficial and can lead to a reduction in the
technological gap.
Another method for international technology transfer is direct and indirect offset
programmes.96
Direct offset includes:
1. Co-production
2. Overseas production based on government-to-government or producer
agreements that permit a foreign government to acquire the technical
information and tooling to manufacture all or part of a contract
3. Directed sub-contracting
4. Procurement of domestic-made components for incorporating or installing in
items sold to that same nation under direct commercial contracts
5. Concessions of commercial compensation practices whereby capabilities and
items are given free to the buyer
6. Technology transfers/licensed production
7. Assistance in establishing industry capabilities by providing valuable
technology and manufacturing know-how
8. Investments in directly related firms
9. Capital invested to establish or expand a company in the purchasing country
Indirect offsets include:
1. Procurements of parts/components from the purchasing country that are
unrelated to the system being purchased
2. Investments in indirectly related firms
3. Establishing corporations in the purchasing countries to invest capital in the
nation’s companies
4. Trading of commodities
Based on the above, it is clear that there are many strategies for technology transfer. It
is difficult to single out the best strategy. Furthermore, strategies can be combined to
2-26
facilitate successful transfer. A country at the stage of selecting a method must decide
the best strategy or combination of strategies for the particular initiative at hand.
However, it appears that cooperative R&D and licensing are two very effective
methods of transferring technology. International transfer of technology is also quite
popular and effective. FDI and direct or indirect offsets are used by host countries to
develop their industrial base. Any measures of the means of technology transfer must
at least take these strategies into account.
As countries are forced to compete in the global economy, foreign direct investment
can depend on R&D activities of other countries. A great deal of the literature has
tried to explain the effects of in-house R&D capital formation and international
technological spillovers on a country’s productivity. Researchers reach the same
conclusion that domestic R&D expenditure is important for output and productivity
growth and there exists a channel through which R&D capital formation in one
country affects the productivity in another.97
2.4.3 Research and Development
Research and development is both an investment and a major drive of value. The
importance of R&D stems from its objective to position the country among the
leading research and innovation countries by promoting collaboration among public
and private agents and enhancing knowledge and entrepreneurship. Ultimately,
research and development has the potential to help countries achieve sustainable
economic development and to ensure social wellbeing and cohesion.
Too often, R&D institutes face financial constraints because they produce intangible
benefits that are both more risky and more difficult to secure than physical assets.
Bond et al. (1999) attribute these financial constraints to the fact that R&D programs
involve significant sunk costs, mostly for the wages of R&D staff. Still, industrial
expenditures on research and development are forecasted to increase of 3.5% in 2006
over the previous year. 97F
98
What causes R&D spending to vary from country to country and how much should a
country spend? Boston Consulting Group poses three questions that may guide a
2-27
company to determine the adequate amount of investment for research and
development:99
1. What are the company's objectives?
2. How much can it invest in this area on a consistent basis?
3. How much is needed to attract internationally recognised research talent,
encourage collaboration between research organisations, and leverage research
strengths into market opportunities and social benefits?
Boeing's Vice President advises companies to keep a strict focus on product strategies
by asking, “Is there a strategy here? Is there a capability that the strategy demands,
and is there an R&D project that can provide that capability?”
Another area of importance that is related to R&D is technology protection. Various
methods of technology protection are available, and understanding each one is
important to this study. Intellectual property rights protect new ideas and their owners
from exploitation. Patents, trademarks, copyrights, confidential information, licensing
and franchising – the tools of intellectual property protection - play an important role
in the innovation process.
Patents are monopoly rights that normally last twenty years. The invention must be
new and capable of industrial application. The owner has the right and duty to
discover whether or not someone is infringing on the patent. Therefore, it is advisable
for patent holders to look at potential markets locally or abroad for infringement, and
if infringement is discovered abroad, a protection file should be obtained in that
country.
Trade secrets can be another means to protect innovative ideas from industrial
espionage. Trade secrets are typically protected through confidentiality agreements.
This means that anyone who can access the information must sign a written agreement
to keep the information confidential. These are often included in employee contracts.
The disadvantage here is that an innovation can disappear overnight if someone else
develops the same idea or if the secret is leaked. Because employees resign or leave
2-28
organizations holding the secrets, organizations must also use non-disclosure
agreements.
Anti-competitive or anti-trust practices sometimes work against the preservation of
intellectual property rights. These laws operate on the principle that preventing
competition is against the public interest. They prevent large companies from
lowering their prices to drive small business out of the market.
Copyright, trademarks and design registration are all intended to control exploitation
of original literacy, dramatic, musical, artistic work, films, video, and computer
programmes. If an enterprise does not have the finances or skills to produce its
innovative idea, it can sell the idea, sell it with royalties included, or license it to
someone capable. If it sells, then the enterprise gives up its right to the innovation, but
if it licenses an innovation, it can keep its right. There are four types of licensing:
exclusive licensing, where the licensee can defend his right; sole licensing, where the
licenser can control the right; non-exclusive licensing, where only the owner can
defend the right; and a sub-licensing, where the licensee can grant license.
Joint venture is another form of information protection where two or more
independent organizations with complementary skills and expertise join together to
exploit their shared opportunity. Their article of association clarifies their governance,
mutual costs, profit sharing, and termination. Agreements, consortiums and
disclosures are related methods of technology protection.
The theory of resource dependence points out that no organization is self-sufficient.
To develop, organizations depend on external sources.100 The triple helix regime
posits that a network of resources exists that has universities, governments and
industries as actors.101 Knowledge is one resource that moves through this network.
Link et al confirmed the concept of knowledge spillover, demonstrating that
innovative business practices tend to occur in the proximity of research institutes.102
Governments can encourage university-industry cooperative projects.103
Unfortunately, the wealth created through such cooperatives could be exploited for
private interests. In other words, commercializing knowledge could deteriorate the
2-29
university knowledge base. Baaken, Hoppe and Macure, and Davies believe that
outsourcing research should not be approached solely from a financial and operational
perspective, but that marketing principles should be considered as well.104 Benefits of
this approach include a higher number of patents, lower R&D spending per employee
and increased access to knowledge. Moreover, as a result of increased competition,
research institutions are encouraged to find alternatives to generate income.105
The resource-based view of firms suggests that a firm's competitiveness is based on
its distinctive internal resources.106 The aggregate of these resources represents the
firm's capabilities. Miller and Shamsie (1996) find that knowledge-based resources
contribute most to performance in a dynamic setting. Therefore, to compete and
survive, Deed et al note that "firms must rely on a steady stream of innovative
products."107
This indicates that competitive advantage is mainly based on
organizational and technological resources and capabilities.
Resources also include distinctive competencies.108 There are other organizational
assets such as management of information systems, trust between management and
labor, accumulated knowledge, and technological or physical assets. Knowledge is
considered "the most strategically significant resource of the firm."109 Barney
emphasizes that organization resources must be valuable, rare and imperfectly
imitable to sustain competitive advantage.110
The literature in the field of university technology transfer is rich. Bercovitz and
Feldman show that differences in structure may be connected to effectiveness.111
Jensen and Thursby illustrate that faculty involvement university licensing increases
the prospects of its success.112 Thursby et al believe that inventions tend to be
disclosed at an early stage of development. They also note that the elasticity of
licenses related to invention disclosures is less than one and that faculty members are
expected to uncover inventions.113 In another study, Thursby and Kemp conclude that
faculty quality and the number of technology transfer staff have a positive impact on
licensing. They also note that private universities show more competence than public
universities.114
2-30
Chapple et al. state that “organizational and environmental factors have considerable
explanatory power” with regard to the low level of effectiveness of technology
transfer offices.115
115
In another study, their findings affirmed that technology transfer
offices exhibit decreasing or constant returns to scale. Link and Seigel claim that
land grants to universities are more efficient in increasing university technology
licensing and garnering more royalties for faculty members.116
Based on this literature, measures such as R&D expenditure, number of staff in R&D,
number of invention disclosures, number of licenses, the ratio of public to private
universities, return on R&D investment, land grants, and royalties paid to R&D staff
should be used to assess the effectiveness of university technology transfer activities.
Seigel et al. argue that science parks are more efficient in generating new products,
services, and patents.117 Link and Scott also add that when located near a university
and given enough venture capital, science parks enable universities to easily place
graduates, hire top researchers and publish more patents and publications.118 In a
recent study, Link and Scott showed that there are positive associations between the
numbers of university start-ups, the age of the park, the quality of the research
environment at the university, and proximity to the university. In the same study, they
said that factors associated with science park growth are proximity to the university,
management through private companies, and emphasis on information technology.119
These studies provide measures of the effects of science parks on technology transfer,
including number of science parks, number of patents generated in science parks as
compared to the total number of patents, scholar distribution and qualifications,
number of scientific and technical publications, number of startups, focus of parks,
proximity to universities, type of management (private/public), and the information
and communication technology intensity.
Zucker et al. say that collaboration between university scientists and industry
scientists improves research performance. This is measured using number of patents
granted, number of products in development, and number of products on the
market.120 If universities desire to begin successful startups, they should employ a
combination of academic and “surrogate entrepreneurship.”121 Normally, universities
2-31
with most startups tend to have clear, well-defined spinout strategies, strong
marketing capabilities, and vast social networks.122 In areas where technology is not
widely available, technology transfer offices often focus on local economic
development and the commercialization of university research.123
Powers and McDougal say that universities with most licenses and entrepreneurial
policies have better technology transfer performance.124
With respect to such
entrepreneurial activity, additional measures can be included in this study, such as
number of products in development, number of products in the market, the level of
cooperation between scientists at universities and firms, the number of entrepreneurial
surrogates in the university, and the availability of supportive licensing policy.
Technology and knowledge are intangibles and this means that measuring them is not
easy. In particular, capturing the return on investment of innovative efforts is difficult.
R&D expenditure can be considered a measure of the input into technology transfer
activities, while patent applications are an output measure because patents are known
to be the best form of protection for industrial innovations. Although R&D
expenditure and patent registrations have strengths and drawbacks, patent applications
have more advantages over R&D expenditure in terms of time. Developing countries
benefit from the extended period of time of patent availability and reliability. The
weaknesses of this measure include the considerable variation in the value of patents
and the fact that many innovations are not patented.
R&D expenditure figures are often used as a measure in the literature as well, because
R&D expenditures are the key input towards innovative activity. Unfortunately, this
measure cannot take into account the R&D projects that are not successful or the
possibility of discovering new technology by accident.
On a macro level, measures of the changes in a country’s or firm’s Total Factor
Production (TFP) can be used as an indicator of technology change. To measure TFP,
changes in major factor inputs are subtracted from changes in outputs and assigning
the difference to changes in technology. Thus TFP is a derived measure of
technology.125
2-32
2.4.4 Competition’s Impact on Technology Transfer
Michael Porter identified five forces - relations with suppliers, relations with buyers,
new entrants, substitute products, and rivalry among established firms - that drive
industry competition and generate opportunities as well as threats. Technological
change can influence all five forces.126
36
Threats to new entrants can be increased
through reduced economies of scale and substitute products. They can be decreased
through patents and other legal protection. The power of suppliers can be increased by
innovations that are more critical to the enterprise’s input. They can be decreased by
innovations that reduce technological reliance on suppliers. Through innovations,
competitor enterprises can establish a monopoly position; and through imitation, they
can destroy a monopoly position. These are just a few examples of the impact of
technology on industry competition.
According to Porter, firms compete by choosing from among four generic marketing
strategies: overall cost leadership, product differentiation, cost focus, or
differentiation focus. 36 According to him, the choice of strategy has implications for
technology strategies. For example, choosing one strategy over another may lead a
firm to prioritize product creation over process development. Though he asserts that
firms must decide between leading the field or and imitating the leader, in practice,
the distinction between the two is less clear.127
Competition provides the essential incentive for innovation. Technology can provide
distinctive capabilities, allowing the firm to provide better goods and services than
competitors. However, it is difficult to prevent knowledge from leaking to
competitors. Also, competencies can be imitated unless they are constantly replaced
with new ones. Competitive competencies can be sustainable only if an organization
carefully analyzes competitors and market conditions.128
Martin Fransman thinks that Porter's model devalues the power of technological
change to transform industry. He also posits that Porter overvalues the power of
managers to direct innovation strategies.129 He illustrates this through the example of
mainframe and semiconductor changes. Large mainframe computer firms could not
2-33
control the semiconductor’s trajectory. The organizational skills were directed to
promote expensive products in a focused market.
In short, several judgements can be reached relating to technology and competition.
First, large firms have broad front strategies and small firms are focused. Firm-
established competencies decide the range of technological fields of future
competition. The nature of products and customers will influence both quality and
cost. Finally, the competitive significance of a particular technology is the most
important factor influencing a company decision about acquisition of that technology.
In order to understand such decisions, then, research on technology acquisition must
take into account the ways in which firms evaluate their competitors. Information for
these comparisons can be obtained from a variety of sources, including annual reports,
reports on science and technology indicators, patent offices and sites, private
consultants, conferences, trade press, and product catalogues. A large scale study of
R&D managers in US firms conducted in the 1980s lists what it found to be the most
effective methods of learning about competitive innovation.
Table 2.1: Methods of Learning Effectiveness about Competitors’ Innovations in Large US Firms
Method of Learning Overall sample means
Processes Products
Independent R&D 4.76 5.00
Reverse engineering 4.07 4.83
Licensing 4.58 4.62
Hiring employees from innovation firms 4.02 4.08
Publications or open technical meetings 4.07 4.07
Patent disclosures 3.88 4.01
Consultation with employees of the innovative firm 3.64 3.64
Range: 1 = not at all effective; 7 = very effective
Source: Levin, R et al . “Appropriating the Returns from Industrial Research and Development. ”
Brookings Papers on Economic Activity. 1987 ; (3): 783-820.
The above table demonstrates the importance firms place on both products and
processes. Based on the above table, this study can measure competition effectiveness
through the use of independent R&D, the intensity of reverse engineering, the number
2-34
of licenses, the number of employees hired from competitive firms, the number of
open technical meetings, the number of technical publications, the number of patent
disclosures, and the level of consultation with employees of innovative firms, such as
technical assistance consultation.
Developing Sustainable Competencies
Richard Hall distinguishes between intangible assets, such as IPR and reputation, and
intangible competencies, including employee skills and know-how, suppliers and
distributors, and organizational culture.130
His empirical work suggested that the most
important intangible resources are company reputation and employee knowledge; both
are a function of organizational culture.
Sidney Winter links the idea of competencies to dynamic capabilities, which involves
both the utilisation of existing competencies and the development of new ones.131
Research suggests that variation in the performance of firms is due to differences in
the ability of managers to build, integrate and reconfigure organizational
competencies and resources.132
These "dynamic marginal capabilities" are subjective
to managerial decisions and actions, human and social capitals.
Dynamic performance and management capabilities are subjects of absorptive
capacity that will be discussed later. It is clear that competitiveness directly correlates
with absorptive capacity. This relation will be analyzed once absorptive capacity is
described. In addition, dynamic marginal capabilities of managerial cognition, human
capital and social capital could be used as indicators of sustainable competencies.
Reputation will be measured in the “Value Chain” section. Employee know-how
indicators will be illustrated in the section titled “Absorptive Capacity.”
Looking outside the firms themselves, an important mechanism for creating
competition among local firms is legislation that protects local start-ups for some
period of time without retarding the healthy growth of local firms. Therefore, import
liberalisation and fair trade legislation may also be good indicators of
competitiveness.
2-35
2.4.5 Absorptive Capacity
“The ability to exploit external knowledge is a critical component of a firm’s
capabilities.”133 This ability is often called “absorptive capacity.” Prior studies have
divided absorptive capacity into four dimensions: acquisition,134 assimilation,135
conversion,136 and exploitation.137
A broad definition of absorptive capacity, then,
should represent these four dimensions. For the purpose of this study, absorptive
capacity will be defined as the capabilities required to managing knowledge in order
to create value. This definition integrates the views offered in the literature and also
emphasizes value creation as the dependent variable of absorptive capacity.
Several terms are used to explain firms’ attempts to increase absorptive capacity:
capacity building, capacity development and capacity strengthening. Use of the term
“capacity building” has been criticized as implying an engineering approach to the
creation of new capacity.138
The link between absorptive capacity and R&D is in knowledge accumulation. R&D
generates knowledge that accumulates over time and contributes to the enterprise’s
absorptive capability. Absorptive capacity is decreased in environments where it is
difficult to learn as a result of either cost or availability of knowledge. These two
factors resemble learning incentives. Therefore, R&D response to change can be used
as an indicator to measure absorptive capacity. Learning can also be determined by
the characteristics of the knowledge; therefore, complexity and relevance are also
important. Less targeted knowledge requires more work from R&D. The pace at
which knowledge expands in a field and the quantity of prior knowledge in that field
also affects the role and efficacy of R&D.
A typical firm begins by producing its own R&D and adds knowledge from other
sources. A firm’s ability to capitalize on competitor spillover, then, is realized through
the firm’s absorptive capacity. Looking at other dimensions besides ability-based
concept, Bosch et al. analyzed absorptive capacity using the dimensions of efficiency,
scope and flexibility. This supplements ability-based definitions. Efficiency is defined
as “the costs and economies of scale associated with a certain level of identification,
assimilation, and exploitation of external knowledge.”139 Hence, absorptive capacity
2-36
is a strategically valuable capability specific to each firm that is culturally oriented
and lowers the costs of contracting knowledge for innovative products and services.
Cohen and Levinthal concluded that an organization's absorptive capacity has the
tendency to develop cumulatively and be path dependent. They also suggested that
demand, ability to capture profit from innovation, and technological opportunity are
three motivators for investing in absorptive capacity. Through experimentation, they
proved that R&D spending can be used as a measure of enterprise motivation to invest
in absorptive capacity.133
Enterprises can learn from other enterprises if they share similar knowledge,
organization structure, compensation policies and dominant logics Lane and Lubatkin
find that the similarity in basic knowledge between partners, compensation policies,
unified research centre, formal interactions, and research culture improve learning
between organizations. Szulanski found that absorptive capacity is important at all
stages of the adoption process.140
The above measures are more efficient in
diagnosing absorptive capacity than established measures.
Technology transfer can fail if there is no absorptive capacity within an institution,
i.e. lack of capabilities in searching, selecting and negotiating for new technologies.
Lack of learning and implementation capabilities may lead to failures in joint ventures
or deployments of new technological systems. Moreover, at the end of equipment life,
replacing a technology may need market search capabilities. Therefore, capacity is
essential in all phases of the transfer technology or smart procurement cycles.141
In a recent study, Datta and Mohtadi concluded that a government must vigorously
develop human capacity; otherwise, it will never reach a role of an innovator.142 In
discussing capacity building, the literature mainly focuses on enhancing developing
countries technical capabilities as a prerequisite to a successful technical transfer.143
This is a shortsighted vision to the greater need for skills and capabilities in
marketing, finance, service, information, policy development and other fields.
However, there is an agreement that capacity building may differ from one country to
another and acknowledge that particular studies needed in every case.144 Several
methods of developing capabilities for the different stages of technology transfer are
2-37
suggested through experience which includes formal training, knowledge and
technology management and learning-by-doing. The OECD spoke to a need for
diverse capacity-building policies when it stated that "technology policy has
traditionally focused on the innovation end of the process ... this approach has slowly
been complemented by a parallel concern for an economic environment conducive to
the diffusion of innovations ... Policy needs to move towards recognizing that, rather
than two distinct activities, innovation and diffusion are two facets of the same
process. Developing firms' ability to absorb and use new technology effectively also
improves their ability to develop innovations themselves."145
Acquiring innovation capacity or even skills to innovate is not easy. Generic and
specific high quality training are required to infuse knowledge and experience.
146 In
this context, quality training must focus on specific know-how and relate to systemic
knowledge. This is an important consideration to cumulate learning and experience in
order to remain competitive in the market. 147
If existing capabilities are weak in
certain areas, fundamental training in technology and assessment is needed.
Many capacity building initiatives have failed.148 The causes of failures are numerous
but mostly are attributed to the lack of understanding of policy makers that the
process is slow and to their inability to identify needed capacities and how to develop
them. Compounding to this, advanced countries are hesitant to sell un-codified
knowledge in order to preserve competitiveness.149
These donors must deveop their
understanding to the requirement of global sustainable development. Moreover, long
term commitment is needed to ultimately achieve technology transfer objectives.
Governments should develop independent capacities to innovate. They must select
appropriate technologies aligned to their national vision, develop indigenous
capacities, and strengthen institutional expertise of public and private sectors.
The resource-based view of the firm theory (RBV) may be an answer to selecting
resources to develop competitive advantage. However, dynamic capability advocated
criticize the RBV theory for its presumptions that factors such as surrounding
resources simply exit. It does not consider the development aspect. Dynamic
capability, on the other hand, is defined as “the ability to integrate, build, and
reconfigure internal and external competencies to address rapidly-changing
2-38
environments.”150 It deals with the development, integration and release of enterprise
resources. It maintains enterprise competitive advantage through resource mix. A
crucial success factor to dynamic capability is information system. Although
information systems may not lead in a short-term to competitive advantage, they are
crucial in a rapidly development environments and lead to long-term competitiveness
providing they are configured to respond quickly to dynamic capability
requirements.151
Measuring social capital is based on the relational links. Kaplan indicates that
theorization in social capital and absorptive capacity, and the developments of their
measures are related. Therefore, it is not surprising that research significantly stresses
on improvement of theorization and measures at the same time.152
Kim brings up another concept of technological capability that he convincingly
declares is interchangeable with absorptive capacity in the areas of knowledge
absorption, assimilation and generation.153 Technological capability has been defined
as “the capability to make effective use of the technical knowledge and skills not only
in an effort to improve and develop products and processes but also to improve the
existing technology and to generate new technology and skills in response to the
competitive business environment.”154 Lall states that technological capability has a
strong role in the development of a country.155
Because of its layered dimensions, absorptive capacity may be the most difficult
component of technology transfer to measure. This dissertation will use four types of
measures in order to capture the intricate dimensions of absorptive capacity. These
measures are marketing capability, breadth of knowledge, learning-by-doing and
return on investment.
To estimate marketing capability, Katsikeas (1994) identified four capabilities in a
firm’s marketing competency. They are production capability, marketing and
promotion capability, product superiority and competitive pricing.156 The dissertation
will attempt to evaluate these capabilities by placing industrial products on Ansoff’s
matrix, evaluating its marketing plans, and calculating the amount of sales by product.
Through assessing the firm’s growth strategy, whether it follows market penetration,
2-39
market development, product development, or diversification growth strategy, its
marketing capabilities can be evaluated as well. Market penetration occurs when a
company penetrates a market with its current products to increase its market share.
This is an indication to the ability of the firm’s to increase its market share and
marketing promotional capabilities that secure loyalty of its customers. Product
development occurs when a company develops new products for the same market.
This is an indication of the firm’s ability to innovate and develop new competencies
to develop successful products in new markets. Market development is the ability of
the firm to sell its products in new markets. Lastly, diversification strategy is a high-
risk growth strategy as it involves marketing new products in new markets.
The breadth of experience of a firm will be measured by looking at the broadness of
past patenting, ICT budget, qualifications, and training expenditure. Learning by
doing will be evaluated through inspecting the degree of internet access, firm’s site on
the internet, rating successful team working, rating internal communication, rating
staff morale and training relevance to employees’ jobs.
ROI is a standard accounting measure, and is defined as net operating income divided
by net assets.
2.4.6 Value Chain and Technology Transfer
For the purposes of this study, technology includes the entire set of technologies
employed in the sequence of activities that constitutes a firm's value chain.128 Any of
the technologies listed in Figure 2.2 can affect an industry's competitive advantage.
The creation of a technology strategy, then, requires a firm to answer two questions:
(1): How technology can be used to gain competitive advantage at each step? and (2):
Should the technology be procured or developed in-house? Five important categories
influence the innovation strategies of a business:157
1. Availability of resources for innovation
2. Capacity to understand competitor's strategies and industry evolution
3. Capacity to understand technological development relevant to the business
unit
4. Structural and cultural context of the business unit
2-40
5. Strategic management capacity to deal with internal business initiatives
Figure 2.2: Representative Technologies in a Firm's Value Chain
Transportation technology Material handling technology Storage and preservation technology Communication system technology Testing technology Information system technology
Basic product technology Material technology Machine tools technology Material handling technology Packaging technology Maintenance methods Testing technology Building design operation technology Information system technology
Transportation technology Material handling technology Packaging technology Communication system technology Information system technology
Media technology Audio and video recording technology Communication system technology Information system technology
Diagnostic and testing technology Communication system technology Information system technology
Source: Burgelman, R., Christensen, C. and Wheelwright, S. Strategic Management of Technology and Innovation. (4th Ed.). NY: McGraw-Hill. 2004. P. 8.
Value chain analysis assesses the value of a firm from its input suppliers to final
buyers, their relationships, industry performance, and the level and quality of support
services. Because of this, value chain is a very important framework for the analysis
of factors related to business innovative strategies. Performance metrics of value
chain can be traced to Gopal and Cypress’s customer service time and cost158,
Rolstadas’s financial and efficiency metrics159, Kaplan and Nortron’s Balanced
scorecards160
, and others. None was found suitable for this study that focused on
sustainable value chain technologies. What this study recommends is the use of a set
of KPIs indicators that can assess accurately the status of a sustainable value chain
and remedies to correct any flaw in the chain.
After a thorough search, the author created the following table that summarizes
measures of the values gained throughout the activities and operations of the chain.
Inbound Logistics Operations Outbound Logistics Marketing Sales Service
2-41
Table 2.2: A Summary of Approaches for Measuring Value Gain from Technology Transfer
Analysis Value Chain Metrics Environmental analysis Assessment of tendering regulations Contribution analysis Contribution made towards GDP Product/service analysis Cost of production Market assumptions Competitiveness and marketing capabilities
Financial management Financial ratios related to profit and return on
investment Customer satisfaction Benchmark comparison of variety of surveys
towards the value chain Sales Sales Performance Performance management KPIs in-place IT management IT policies and infrastructure New product development management Measure innovation using Ansoff’s Matrix Source: Author
2.4.7 Value Network and Technology Transfer
Davidow and Malone indicated the presence of the virtual corporation in 1992, where
a provisional “network of independent companies linked by information technology
share skills, costs, and access to one another's markets.”161 However, employment
statistics reveal that corporations are still alive. The nature of outsourcing and
partnering relationships are changing so much that the center of a corporation can be
anywhere. Outsourcing and alliances are being used to drive enterprise
transformation. In 2002, an Accenture study found that 90% of alliance negotiations
fail and only 2% survive more than four years.162 The foundation of good business
relationships is trust that is overlooked from the network.163
Operationally, businesses need to understand how digital technologies shape the
business value chain. Tactically, businesses need to understand how social networks
help technology transfer. Strategically, businesses need to understand that intangibles
are important for building relationships. Finally, business leaders need to understand
that ethics are important to the construction of successful networks.
The intangibles and intellectual capital in businesses need to be treated as true
strategic assets. Measuring the value added from the network is not straightforward. It
needs to be done at three levels: the operational, tactical and strategic levels. On the
operational level, the key question is how to share knowledge of routine order. This
can be done through the internet, databases and portal systems. Tools like e-learning,
2-42
workflow, knowledge repositories, best practice databases, and search engines are all
supporting technologies to transfer and exchange knowledge.
A firm’s success depends on how it acquires knowledge and applies it more
effectively than its competitor. On the tactical level, then, leaders and managers need
to know how to better create, use and apply knowledge. The best methods are through
knowledge networks and communities of practice utilizing collaborative tools, after-
action reviews, knowledge mapping, project histories, social network analysis,
storytelling, personalization tools, and group processes. It is important to build
collaborative groups working towards communal learning that encompasses the whole
enterprise.
The strategic level is concerned with the purpose and the creation of value. The
strategic level is also concerned with both monetary and intangible value. Although
thinking of intellectual capital and other intangibles of non-financial form as business
assets surfaced only a decade ago, this area has garnered interest all over the world.164
Strategic-level practices apply intangibles, scorecards, and business modeling. The
supporting technology ranges from business modeling, systems mapping, values
From another perspective, the value network concept can be expanded through a
whole system view of value. Along with the economic and business models, this
perspective includes social and environmental intangibles in addition to internal
structures, business relationships, and human competence. See Table 2.3.
Another intangible that is entering the business literature is the social capital. The
World Bank defines social capital as ″the norms and social relations embedded in
social structures that enable people to coordinate action to achieve desired goals.″
Robert Putnam describes it as ″features of social organizations such as networks,
norms and social trust that facilitate coordination and cooperation for mutual benefit.″
Recently, Don Cohen and Larry Prusak suggested that social capital is a useful
concept for understanding behaviors that support or impede knowledge creation and
sharing. In their view ″social capital consists of the stock of active connections among
2-43
people; the trust, mutual understanding, and shared values and behaviors that bind the
members of human networks, communities and make cooperative action possible.″ 161
This description of social capital certainly encompass all of the discussions about
value networks. All of the expanded definitions within the value network must
become measures whose sum total resembles social capital.
Table 2.3 : An Emerging Perspective of Wealth and Value
Business relationships Internal structures Human competence
Alliances and relationships with
customers, strategic partners,
suppliers, investors, regulatory
bodies and government groups
Systems and work processes that
leverage competitiveness
including IT, communication
technologies, systems and
software, databases, documents,
images, concepts and models of
how the business operates,
patents, copyrights, and other
codified knowledge
Individual capabilities,
knowledge, skills, experience
and problem solving abilities
Social citizenship Environmental health Corporate identity
Quality and value of the
relationship with the larger
society through the exercise of
corporate citizenship as a
member of local, regional and
global communities
The value of a firm’s
relationship with the earth and
its resources, as understood
through calculation of the true
costs of resources consumed by
an enterprise or economy, and
by determination of equitable
exchange or contribution to the
health and sustainability of the
environment
The value of the firm’s vision,
purpose, values, ethical stance,
and leadership, as it contributes
to brand equity and economic
success in business and
employee relationships
Source: Extracted from Allee V. The future of knowledge, increasing prosperity through value network. Burlington, Massachusetts: Elsevier; 2003.
Measuring Value Networks
Form the above; this study will measure asset utilization to reflect the tangible aspect
while value creation, conversion and enhancement capabilities along with social
capital will reflect the intangible side. Asset utilization assess the efficiency of
leveraging financial and non-financial assets in generating valuable output and is an
element in the analysis of value creation. The indicator may be subjective or an in-
depth quantitative method that measures financial, logistics and operation output.
2-44
The second indicator looks at the value generated from a conversion process.
Converting value is achieved by:
• Converting a value input to a value output.
• Adding intangible value from own insight to another business partner.
• Extending value to be available for access by other partners.
• Converting competitive intelligence into tangible value.
The third indicator considers value enhancements or value features that make a value
output distinctive. This can be done in several ways including:
• Enhancing basic input to add value.
• Extending a value gain to others.
The fourth indicator of value is perceived value from customers’ point of view. It
measures how the customers perceive the importance of enterprise’s products or
services. This value can be a subjective measure like “high, average, and low”
assessment. Business value creation and investment strategies can enhance
substantially once this measure is evaluated against utilization and cost results.
Business vision should focus on achieving maximum perceived values.
Social value is the fifth indicator that assesses the indirect impact to receiving ends in
the value network. It evaluates both qualitative and quantitative measures that impact
the environment, industry and society.
2.5 Summary: Technology Transfer Measures
There are many mechanisms for transferring technology, each of which will influence
the effectiveness of the technology sought. There are also many measures that can be
employed to assess the performance of technology transfer. The applicability of each
measure depends upon how an organization defines its goals and the outputs it uses to
measure these.
Because technology transfer involves so many stakeholders and organizations with
different needs, it is difficult to find universal measures of technology effectiveness.
The literature reveals sets of measures related to various aspects of technology
transfer effectiveness, generally focusing on external and internal measures, quality
2-45
and production cost measures, and characteristics of research and development,
absorption capacity, innovation and training effectiveness, knowledge transfer,
reputation, culture, human resource management, and corporate strategies. Most
indicators are created in accordance with a particular context and the researcher's
philosophy, beliefs and approach. The literature evaluation in this dissertation has
confirmed a gap in the scholarship regarding this study on measuring the performance
of technology transfer in Qatar.
To develop sound measures, the most significant output must be identified. The
debate on good measures for technology transfer continues with new models entering
the literature from various economic settings. It is important to remember that these
measures are evidence of activity in the field, but are not necessarily a sign of success.
Using secondary research, chapter three will discuss current practices of sustainable
development and technology transfer before tackling the issues of developing an
appropriate survey approach, planning its implementation, and designing the
analytical method through which the data will be evaluated.
2-46
References and Notes
1 The World Commission on Environment and Development. “Introduction.”
In: Our Common Future, editor. Oxford: Oxford University Press. Brundtland
Report; 1987. 2 Repetto R. World Enough and Time. New Haven: Yale University Press;
1986. 3 Munsasinghe M, Ernst L. “Environmental Economic Evaluation Project and
Policies for Sustainable Development.” World Bank Environment Working
Paper, 42. 1991.
4 Elkington J. The triple bottom line: sustainability’s accountants. Elkington J,
editor. Cannibals with forks: the triple bottom line in 21st Century businesses.
Gabriola Island, Canada: New Society Publishers; 1998.
5 Strong M. “Foreword.” In: Earth summit agenda 21. Rio: United Nations
Department of Public Information; 1993. 6 Moffatt I, Hanley N, Wilson M. Measuring and modeling sustainable
development. NY: Parthenon Publishing Group Inc.; 2001. 7 Ditor M, O’Farrell D, Bond W, Engeland J. Guidelines for the Development of
Sustainability Indicators. [online]. August 2001 [cited 12 March 2007].
Available at: http://ec.gc.ca/soer-ree/English/scip/guidelines.cfm 8 Liverman D, Hanson ME, Brown BJ, Meredith RW. Global sustainability:
toward measurement. Environmental Management. 1988; 12(2): 133-143. 9 Gosselin P, Belanger D, Bibeault JF, Webster A. Feasibility study on the
development of indicators for a sustainable society. Ottawa: Prepared for
Health and Welfare Canada; 1991. 10 The World Commission on Environment and Development. 1987.
11 Miller GA, Nicely PE. An analysis of perceptual confusions among some
English consonants. Journal of the Acoustical Society of America. 1955; 27:
338-352.
12 Moffatt I et al. p.67 13 Wikipedia the Free Encyclopedia. Primary production. [online].[cited 10 April
2007]. Available At: http://en.wikipedia.org/wiki/Primary_production
2-47
14 Organisation for Economic Co-operation and Development. Environmental
indicators. Paris: OECD Publishing; 1994. 15 Grossman GM. “Pollution and growth: what do we know?” In: Goldin I,
Winters LA, editors. The economics of sustainable development. Cambridge:
Cambridge University Press; 1995. 16 Pezzy J, Withagen C. The rise and fall and sustainability of capital-resource
economies. Scandinavian Journal of Economics. 1997; 100(2): 513-27. 17 Berkhout F, Leach M, Scoones I. Negotiating Environmental Change.
Cheltenham, UK: Edward Edgar Publishing Limited; 2003. p.86 18 Dasgupta P. Optimal development and the idea of net national product.
Cambridge: Cambridge University Press; 1995. 19 Aronsson T, Johansson P, Lofgren K. Welfare measurement, sustainability
and green national accounting. Cheltenham: Edward Elgar; 1997. 20 Pemberton M, Ulph D. On the measurement of national income. London:
University College London; 1998. 21 Hamilton K, Hartwick J. Investing exhaustible resource rents and the path of
consumption. Canadian Journal of Economics. 2005; 38(2): 615–621. 22 Berkhout F, p. 88 23 Gutes M. The concept of weak sustainability. Ecological Economics. 1996;
17: 147-56. 24 Moffatt I, 2001, p. 96 25 Bishop R. Economic Efficiency, Sustainability and Biodiversity. Ambio. 1993;
22(2-3): 69-73 26 Moffatt I, et al, 2001 p. 98 27 McKinley T. “Linking sustainability to human deprivation.” In: Moldan B,
Billharz S, Matravers R, editors. Sustainability indicators: report on project
on indicators of sustainable development. Chichester: John Wiley; 1997. 28 Daly HE, Cobb Jr. JB. For the common good: redirecting the economy toward
community, the environment, and a sustainable future. Boston: Beacon Press;
1990. 29 McKinley T. Linking sustainability to human deprivation; 1997. 30 Mckelvey M. Evolutionary innovations: the business of biotechnology. NY:
Oxford University Press; 1996.
2-48
31 Entry 1. The American heritage dictionary. Lexico Publishing Group; 2007.
http://dictionary.reference.com/browse/transfer.
32 Lee Y. Technology transfer and public policy. Westport, CT: Quorum Books;
1997. 33 Cooke I, Mayes P. Introduction to innovation and technology transfer.
Norwood, MA: Artech House, Inc.; 1996. 34 National Science Board. Science and engineering indicators-1996.
Washington DC: US Government Printing Office; 1996. 35 Wilkins G. Technology transfer for renewable energy: overcoming barriers in
109 Grant R. Prospering in dynamically competitive environments: organizational
capability as knowledge integration. Organization Science..1996; (7)4: 375-
387.
110 Barney J. Strategic factor markets: expectations, luck and business strategy.
Manage Science. 1986; 32 :1231-1241. 111 Bercovitz J, Feldman M. Academic entrepreneurs: social learning and
participation in university technology transfer. Mimeo: University of Toronto;
2004. 112 Jensen R, Thursby M. Proofs and prototypes for sale: the licensing of
university inventions. American Economic Review. 2001; 91(1): 240-259. 113 Thursby JG, Jensen R, Thursby MC. Objectives, characteristics and outcomes
of university licensing: a survey of major U.S. universities. Journal of
Technology Transfer. 2001; 26(1-2): 59-72.
114 Thursby JG, Kemp S. Growth and productive efficiency of university
intellectual property licensing. Research Policy. 2002; 31:109-124.
115 Chapple W, Lockett A, Siegel DS, Wright M. Assessing the relative
performance of university technology transfer offices in the U.K.: parametric
and non-parametric evidence. Research Policy. 2005; 34(3): 369-384. 116 Link AN, Siegel DS. Generating science-based growth: an econometric
analysis of the impact of organizational incentives on university-industry
technology transfer. European Journal of Finance.2005; 11(3): 169-182. 117 Seigel DS, Westhead P, Wright M. Assessing the impact of science parks on
the research productivity of firms: exploratory evidence from the United
Kingdom. International Journal of Industrial Organization. 2003; 21(9):
1357-1369. 118 Link AN, Scott JT. The growth of research triangle park. Small Business
Economics. 2003; 20:167-175. 119 Link AN, Scott JT. U.S. university research parks. Journal of Product
Analysis. 2006; 25(1): 43-55. 120 Zucker LG, Darby MR, Armstrong J. University science, venture capital, and
the performance of U.S. biotechnology firms. Mimeo: UCLA; 2000.
2-56
121 Franklin S, Wright M, Lockett A. Academic and surrogate entrepreneurs in
university spin-out companies. Journal of Technology Transfer. 2001; 26(1-2):
127-141. 122 Lockett A, Wright M, Franklin S. Technology transfer and universities’ spin-
out strategies. Small Business Economics. 2003; 20(2): 185-201. 123 Leitcj CM, Harrison RT. Maximising the potential of university spin-outs: the
development of second-order commercialization activities. R&D Management
2005; 35(3): 257-272. 124 Powers JB, McDougall P. Policy orientation effects on performance with
licensing to start-ups and small companies. Research Policy. 2005; 34(7):
1028-1042. 125 Falvy R, Foster N. The role of intellectual property rights in technology
transfer and economic growth: theory and evidence. Vienna: United Nations
Industrial Development Organization; 2006. 126 Porter M. Competitive strategy. New York: Free Press; 1980. 127 Robinson W, Chiang T. Product development strategies for establishing
market pioneers, early followers and late entrants. Strategic Management
Journal. 2002; 23(IS): 855-866. 128 Porter M. The competitive advantage of nations. London: McMillan; 1990. 129 Fransman M. Information, knowledge, vision, and theories of the firm.
Industrial and Corporate Change. 1994; 3(5): 713-757. 130 Hall R. “A framework for identifying the intangible sources of sustainable
competitive advantage.” In: Hamel G, Heene A, editors. Competence-based
competition. Chichester: John Wiley and Sons Ltd; 1994. p. 149-169. 131 Winter S. Understanding dynamic capabilities. Strategic Management Journal
2003; 24(10): 991-995. 132 Adner R, Helfat C. Corporate effects and dynamic managerial capabilities.
Strategic Management Journal. 2003; 24(10): 1011-1025. 133 Cohen WM, Levinthal D. Absorptive capacity: a new perspective on learning
and innovation. Administrative Science Quarterly. 1990; 35(1): 128-152. 134 Kim L. Crisis construction and organizational learning: capability building in
catching-up at Hyundai Motor. Organization Science. 1998; 9(4): 506-521.
2-57
135 Dodgson M. Organizational learning: a review of some literature.
Organization Studies. 1993; 14(3): 375-394. 136 Nonaka I. A dynamic theory of organizational knowledge creation.
Organization Science. 1994; 5(1) :14-37. 137 Leonard-Barton D. Wellsprings of knowledge. Boston, Massachusetts: Harvard
Business School Press; 1995. 138 Organization for Economic Cooperation and Development (OECD).
Developing environmental capacity – a framework for donor involvement.
Paris: OECD Publications; 1995. 139 Van den Bosch FAJ, Volberda HW, de Boer M. Coevolution of firm
absorptive capacity and knowledge environment: organizational forms and
combinative capabilities. Organization Science. 1999; 10(5): 551-568. 140 Szulanski G. Exploring internal stickiness: impediments to the transfer of best
practice within the firm. Strategic Manage J. 1996; 17(Winter) :27-43. 141 Hoffman K, Garvin N. Managing international technology transfer: a
strategic approach for developing countries. Ottawa: International Developing
Research Center; 1990. 142 Datta A, Mohtadi H. “Endogenous imitation and technology absorption in a
model of north-south trade.” Proceedings of the Annual Meeting of the
American Economic Association. New York; 2005. 143 United Nations Conference on Trade and Development (UNCTAD).
“Technological capacity-building and technology partnership: field findings,
country experiences and program.” Proceedings of the United Nations
Conference on Trade and Development. New York and Geneva; 1995.
144 Van Berkel R, Westra C, Verspeek F, Lasschuit P, Pietersen L. National needs
assessment for environmentally sound technologies for developing countries:
methodologies and comparative evaluation. Amsterdam: University of
Amsterdam; 1996. Also, Mugabe J. “Technology and sustainable development
in Africa – building policy and institutional capacities for needs assessment.”
Background paper prepared for the UN Division for Policy Coordination and
Sustainable Development. New York; 1996.
2-58
145 Organization for Economic Cooperation and Development (OECD).
“Effective technology transfer, cooperation and capacity building for
sustainable development.” Common reference paper. Paris: OECD; 1994. n.
75. 146 Imai M. Kaizen: The key to Japan's competitive success. New York: McGraw-
Hill. 1986. p. 374 147 Brooks H. “What we know and do not know about technology transfer: linking
knowledge to action.” Proceedings of the Marshalling Technology for
Development Symposium; 1995; Washington DC.
148 UNDP/HIID. Building sustainable capacity: challenges for the public sector.
UNCTAD, Geneva; 1996. Also, ODA. A synthesis study of institutional
capacity development projects for overseas development administration.
Brighton, UK: Policy Practice Limited; 1994.
149 Barnett A. Do environmental imperatives present novel problems and
opportunities for the international transfer of technology? New York: United
Nations; 1995.
150 Teece DJ, Pisano G, Shuen A. Dynamic capabilities and strategic
151 Wade M, Hulland J. The resource-based view and information systems
research: review, extension, and suggestions for future research. MIS
Quarterly. 2004; 28(1): 107-138.
152 Kaplan A. Conduct of inquiry: methodology for behavioral sciences. San
Francisco: Chandler; 1964.
153 Kim L. Imitation to innovation: the dynamics of Korea’s technological
learning. Boston:Harvard Business School Press; 1997.
154 Zedwitz M, Jin J. “Process of technological capability development: case from
China’s mobile phone industry.” In: Sherif M, Khalil T. New directions in
technology management. Amsterdam: Elsevier; 2007. p. 243.
155 Lall S. Building industrial competitiveness in developing countries. Paris:
OECD; 1990.
2-59
156 Katsikeas, C. S. 1994. Export competitive advantages: the relevance of firm
characteristics. International Marketing Review, 11(3), 33-54. 157 Burgelman, R., Christensen, C. and Wheelwright, S. Strategic Management of
Technology and Innovation. (4th Ed.). NY: McGraw-Hill. 2004. P. 8. 158 Gopal, C. and Cypress, H. Distribution Management: competing on customer
service, time and cost. Chicago, IL: Irwin Publishers; 1993. 159 Rolstadas, A. Performance Management: A Business Process Benchmarking
Approach. London: Chapman and Hall; 1995. 160 Kaplan, R.S. and Norton, D.P. The Balanced Scorecard: Translating Strategy
Into Action. Boston, Massachusetts: Harvard Business School Press; 1996. 161 Davidow W, Malone M. The virtual corporation: structuring and revitalizing
the corporation for the 21st Century. New York: Harper Business; 1992. 162 Accenture. Grasping the capability: executive summary. [online]. 11 March
2002 [cited 15April 2007]. Available at: http://www.accenture.com. 163 Allee V. The future of knowledge: increasing prosperity through value
networks. Amsterdam: Elsevier; 2003. 164 Cohen D, Prusak L. In good company: how social capital makes organizations
work. Boston: Harvard Business School Press; 2001.
Source: in alignment with Author's Study Methodology in chapter one Figure 1.1.
3.2 The Urgent Need to Develop a Technology Transfer Strategy
Poised to become the world's leading producer and exporter of liquefied natural gas and
in the midst of an unprecedented period of development, Qatar requires the technology
and capability of the developed countries to sustain its growth. Besides its strong
production capacities and high income returns, Qatar needs the ability to effectively and
equitably distribute and manage resources in order to build sound sustainable policies. Its
dependence on oil and gas makes it vulnerable to shifts in revenues and will create
complex challenges to policy makers. Hence, the present economic development is not
External Technology and Resources
•Multinational Companies and Joint Ventures•FDI•International Technology Trade Agreements
Sustainable Development
• Sustainable Development Strategy, Policy, Initiatives and Indicators
Government Policies•Institutional Policies•Investment Policies•Intellectual Property Rights•ICT Law•Labour Law
Qatar’s Internal Environment •Peace and Security•Legal Policies•Economic Indicators•Scheme To Implement Sustain. Dev. Initiatives•Resource Management•Education & Health Policies and Initiatives•Consumption and Production
Competitiveness•International Reports: IMF, Standards & Poors, UN HDI, Global Competitiveness Report
Research & Development•Universities, Science Park, Energy Companies R&D•Government Funds
•Energy Sector and Industry•Universities•Government Institutions
Assessment•Overall Technology Transfer Effectiveness
Absorptive Capacity
Value Network
Value Chain
Core Antecedents to Technology
Transfer
3-3
enough to sustain a long-term development. The need to technology is crucial in
achieving a sustainable level of diversification to the current economy.
In chapter one, it was shown that Qatar has no meaningful national development plans,
and that the country needs to increase its economic resilience and competitiveness,
diversify its economy, and integrate with the global economy. Sustainable development
and technology transfer activities are necessary to the development of Qatar’s political,
economic, social, technological, environmental and legal realms. Qatar could benefit
immensely from joint ventures and other cooperative agreements to facilitate technology
transfer; such arrangements have benefited countries like Malaysia, Brazil, India, and
several others in Southeast Asia. The urgent subject that needs to be addressed is
technology transfer and how to achieve it?
Unfortunately, Qatar has not been able to learn the process of technology transfer yet.
This is true for a number of reasons. First, the lack of a comprehensive strategy to build a
knowledge base has attributed to the deficiencies in technology transfer management.
Second, the lack of professional skills prevented efficient use and exploitation of new
advanced technology, in particular, information technology. Third, the lack of R&D
institutions was a barrier to the absorption of new technology. Finally, the lack of
awareness and commitment to acknowledge the importance of or to apply technology
transfer resembled an obstacle to the integration of the concept into the development
process of industry and education.
According to the literature presented in chapters one and two, there are nine key
measures to judge the effectiveness of technology transfer within the context of
developing sustainability: the external technology and resources, sustainable
development, government policies, environmental policies, competitiveness, research and
development, absorptive capacity, value chain, and value network. For Qatar, all of these
measures are essential and will be explored in the following sections.
3-4
3.3 Sustainable Development in Qatar
Qatar has adopted Brundtland's definition of sustainable development, but has also added
the political dimension that allows for fair economic options to all generations.1 The Emir
of Qatar, Sheikh Hamad, genuinely believes that "security without development is not
sustainable in the long run."2 This belief led to the formation of the Permanent
Committee for the Protection of the Environment in 1981, which stands as a testament to
the country's interest in environmental issues. Following this, several decrees and laws
were promulgated for the further protection of the environment, including the formation
of the Supreme Council for the Environment and Natural Reserves (SCENR).
In 2005, the Arab League Summit recommended the adoption of the 2002 Johannesburg
sustainable development initiative. However, it was not until 2006 that Qatar convened
its Planning Council, the SCENR and other government and non-government institutions
in order to examine its achievements in this area and to build efforts to implement the
initiative. Since effective sustainable development cannot be achieved without a
legislative framework, instruments, and a measurable implementation plan, this section
will discuss the legal, implementation and international conventions and agreements
adopted by the state of Qatar.
On the legal front, the Qatari constitution has given executive powers to international
conventions, including environmental agreements (Article 68).3 The constitution
delegated the authority for the protection of the environment to the state in order to
achieve sustainable development (Article 33). Furthermore, decree No (30) of 2002 was
aimed at protecting the environment and maintaining its balance, combating various
forms of pollutions, developing the country's natural resources, safeguarding its
biological diversity, protecting living creatures, and protecting the country from outside
harm.4 In addition, a number of new decrees or amendments to older decrees have been
enacted to achieve sustainable development in Qatar. A summary of these decrees is
shown in Table 3.1.
3-5
Table 3.1 Sustainable Development Laws
No Decree/ Law Year Purpose
1 Decree (55) 1992
Ratification of the Protocol to Protect the Marine
Environment from Pollution Resulting from
Land-based Sources
2 Law (1) 1993 Prohibition of Arable Land Removal
3 Law (32) 1995
Prohibition of Deterioration of Plant Life and its
Components
4 Law (11) 2002
Establishment of the Supreme Council for the
Environment and Natural Reserves
5 Amendment of Law
(4) 1983
Utilization and Protection of Biological Marine
Resources in the State of Qatar
6 Law (4) 2002
Regulation of Hunting Animals, Birds and Wild
Reptiles
7 Law (30) 2002 Protection of the Environment
8 Law (31) 2002 Protection from Radiation
9 Decree (19) 2003 Utilization of Water Resources
10 Law (19) 2004 Protection of Wild Life
Source: The Planning Council. Sustainable Development in the State of Qatar. February 2006.
On the implementation front, many institutions have been established to implement
various integrated programmes to attain sustainable development. One of the more
reputable of these institutions is the SCENR. This council, established in 2002 and
headed by the Heir Apparent, was set up to implement environmental policies and to
enlist all ministries’ and government institutions' resources to provide statistical data and
reports relevant to Qatar’s environment and natural reserves.
The Planning Council is another important institution, which was established in 1989 to
draw up the state's economic and social policies and plans. The Planning Council’s
projects and studies are shown in Table 3.2.
3-6
Table 3.2: Planning Council Projects
No The Study / Project Objectives
1 National Project for the
Development of Public Services
-develop public services with high efficiency and
minimal cost
-enable individuals and companies to have access to
such services
2 The National Human Development
Report for the State of Qatar 2005
-review human development accomplishments and
the major challenges facing the State of Qatar
3 The Labor Market Strategy Project -review all issues and problems of the labor market
-make appropriate recommendations
4 The Future Vision Project of the
State of Qatar: Qatar 2025
-address various sustainable development issues such
as the environment, human resources and the oil and
gas sector
5
The National Report on the Follow-
up of the Implementation of the
Copenhagen Summit Declaration
1995
-study social development and make relevant
recommendations
6
The First Directory of Researches
and Studies Conducted in the State
of Qatar from Independence to Mid-
2004
-develop and maintain a registry database of research
issues in Qatar
7
A Study on Development Assistance
Provided by the State of Qatar to
Arab and Islamic Countries and
Organizations
-demonstrate Qatar’s commitment to the
implementation of the World Summit’s resolutions on
development
8
Surveys on Family Expenditures and
Income, Employment, Wages and
ICT
Source: The Planning Council. Sustainable Development in the State of Qatar. February 2006.
In 2003, the State of Qatar’s Public Prosecutor established the Environmental Prosecution
Circle to investigate offences and crimes related to the environment, and the Higher
Judicial Council set up a specialized office to see into crimes of encroachment on the
environment in accordance with current laws and regulations.
Recognizing the importance of the international and regional dimensions of the
environment, the State of Qatar ratified numerous international and regional conventions
and protocols. It is important to recognize, though, that many of these protocols serve to
protect the environment from specific problems, such as oil pollution or the depletion of
the ozone layer. It is therefore essential to evaluate the extent to which Qatar has
implemented these plans and policies and, in turn, to determine whether or not their
implementation has put Qatar on the path to sustainable development. Parallel to this, the
study asks whether or not there will be sufficient human capacity to absorb and infuse the
technologies associated with Qatar’s development plans. The following section will
3-7
evaluate these questions by looking at social, economical and environmental indicators of
sustainable development.
3.3.1 Analysis of Qatar's Sustainable Development Indicators
Qatar has paid increasing attention to sustainable development, demonstrating efforts to
achieve integration between social and economic development, and to protect the
environment. Consequently, the Planning Council (PC) has selected and classified
indicators of sustainable development calculated by the Johannesburg Plan of Action and
the resolution of the UN Commission on Sustainable Development for use in the
evaluation of Qatar’s progress. The first PC national report emphasized the progress
achieved from 2000-2005. It also discussed the strengths and weaknesses of the
indicators themselves.
It is possible to categorize the indicators developed by the PC and those calculated by the
UNDP human development index into three broad groups: social, economic and
environmental. The next section will present and analyze those social indicators that are
most likely to influence technology transfer effectiveness.
3.3.2 Social Indicators
For a community to be sustainable, both individual and community resources need to be
developed within an adaptable environment that is equitable, secure and socially
inclusive.5 These resources include education, skills, health, values and leadership. In
addition, the social capacity (relationships and networks) that facilitates collective action
toward improved quality of life must be sustained.
This study will examine the available social indicators for Qatar, including its population,
social organizations, health data, education-related statistics, information and
communication technology structures, and current social initiatives. Table 3.3 represents
a summary of available social indicators. The table shows that the population, according
to the Planning Council's official figures, increased 5.6% in 2005. The PC expects this
rate decrease to 5.4% in 2006. The UN human development index figures and
3-8
expectations for Qatar are similar. However, according to Qatar's General Housing and
Population Census, Qatar's population reached 744,000 in 2004.6 This figure indicates an
annual increase at the rate of 5.2% over the last seven years. Because of population size
concerns, the Permanent Population Committee was set up in 2004 as part of the PC with
the aim of proposing a population policy and then implementing its recommendations.
Four years later, Qatar's population doubled and grew to 1.5 million.7 The economic
development has contained the social aspirations and created an imbalanced
development. Furthermore, in a study published in 2008, the Permanent Population
Committee estimated that Qatar's population will reach 2.3 million by 2015.8
The above population statistics demonstrate a strong need in Qatar for an entity to
formulate and pursue a national population strategy. The Population Committee, which is
part of the PC, is only reacting to what appears to be happening in Qatar. There is also
some question as to whether the population data that the PC is producing is valid or
reliable.
Even so, it is evident that the population in Qatar is exploding unexpectedly. The effects
of this can be seen in day-to-day life, the inflation rates, housing shortages, rising housing
prices, reduced Qatarization and increased unemployment. The population increase is a
huge challenge to handle. Qatar is likely to face overcrowding that will place a huge
burden on its resources. Resources like arable land and fresh water may diminish while
energy consumption increases, leading to increases in Qatar’s contribution to global
warming.
It might be assumed that a natural solution would be make policies that reduce birth rates
and increase education. However, the population increase in Qatar is a result of a sudden
influx of expatriate labour needed to assist with economic development projects.9 Since
the development in Qatar is likely to continue in the next ten years, this influx is certainly
going to continue to increase. However, it is difficult to accurately predict this rate of
increase due to the absence of a sound national development strategy. This suggests that
the solution may be to increase the native Qatari population to reclaim the jobs currently
3-9
performed by expatriates. Here, technology transfer could play a major role in building
the capacity of the local citizens to undertake the tasks needed for developing their
country.
Table 3.3: Qatar Social Indicators
Measure Planning
Council PC Expectation UN HDI UN Expectation
Population growth 5.6% in 2005 Decrease to 5.4% in
2015
5.1% in
2005
Decrease to 1.9% in
2015
Fertility rate 4.2% in 2005 Decrease slightly 2.9% -
Dependency rate 30.8% Decrease 23% 22.7% in 2015
Life expectancy at birth 76 years Increase 75 years -
Spread of HIV 0.001% Remain low Less than
0.2 -
Adult literacy 90.6% Increase 89% -
Rate of adults with
secondary education 58% Increase - -
University graduates 34% Increase - -
Fixed telephone lines 26% Remain constant 25.3% -
Mobile telephones 90% Increase 88% -
Internet users 28% Increase 27% -
Source: Planning Council. Sustainable Development Indicators. [online]. [cited 2 March 2008]; Available
Table 3.10: Qatar Industrial Manufacturing Company Group Companies
No Company QIMC's %
1 Qatar Jet Fuel Company (QatJet) 40
2 National Paper Industries Company (NAPICO) 100
3 Qatar Metal Coating Company (QMCCO) 50
4 Qatar Sand Treatment Plant (QSTP) 100
5 Qatari-Saudi Gypsum Industries Company (QSG) 33
6 Gulf Ferro Alloys Company (SABAYEK) 10
7 Qatar Clay Bricks Company (QCBC) 39
8 Qatar Nitrogen Company (QAN) 50
9 National Food Company (NAFCO) 50
10 Qatar Plastic Products Company (QPPC) 33.3
11 Qatar Acids Company (Q-Acids) 100
12 Gulf Formaldehyde Company (GFC) 15
No Company NAFCO’s %
13 Qatar Tunisian Food Company (Q-T Food) 51
Source: Ministry of Energy and Industry. Industrial Development in Qatar. [online]. [sited 5 April 2008];
Available at: http://www.mei.gov.qa/portal/page?_pageid=36,249751&_dad=portal&_schema=PORTAL Table 3.11: Foreign Direct Investment in Qatar (1999-2003) in Million USD
1999 2000 2001 2002 2003
FDI inflows 113 252 296 631 400
FDI inward stock 1668 1920 2216 2847 3247
FDI inward stock % of GDP 13.5 10.8 12.5 14.4 15.9
FDI outflows 30 41 112 61 71
FDI outward stock 104 181 293 353 424
FDI outward stock % of GDP 1.1 1 1.7 1.8 2.1
Source: UNCTAD. World Investment Report and WTO Secretariat Estimates. UNCTAD; 2004.
The Department also indicated that in 2006, around 36 FDI projects started, totaling US$
282.5 million all together. According to the Department of State data, the United States is
the main source of FDI in Qatar, followed by the United Kingdom, the United Arab
Emirates, India and the Netherlands. Of 109 FDI projects, industry attracted only 25
projects. Nevertheless, QP and its foreign partners invested an estimated US$ 100 billion
in upstream and downstream technologies. Also, the development of the North Gas Field
will attract FDI and dominate all other sectors. ExxonMobil alone has invested about
Measuring Technology Transfer in Qatar: Fieldwork and Findings
4.1 Introduction
This chapter will discuss research methodology and empirical findings from the investigation
of industrial enterprises, universities, and government bodies involved in the process of
technology transfer. It builds on the research methodology discussed in chapter one and
focuses on the application of this methodology during the field survey. It will measure
technology transfer effectiveness among industrial enterprises, research and development
(R&D) establishments, and government organizations. Through field survey and empirical
findings, this chapter will complement the findings at the macro-level in chapter three that
used secondary sources to present past and current sustainable development and technology
transfer initiatives in Qatar. It will provide a satisfactory explanation of the reasons why some
local enterprises benefit from sustainable development initiatives and others do not, and will
offer and sometimes lead to suggestions that improve sustainable development and
technology transfer. Thus, this chapter heeds Fransman’s (1986) advice: if the goal is to yield
more precise information about the process of technology transfer, it is necessary to
investigate the firm's level. 1
Figure 4.1: Fieldwork Structure Themes; Assessing Technology Transfer Effectiveness in Qatar
Source: Chapter One, Figure 1.1.
Environment & Government Policies: Assessed in Chapters 3&5
6. Research & Development
7. Competitiveness
1. External
Technology
&
Resources
Sustainable
Development:
Assessed in Chapters 3&5
2. Internal Technology Transfer Measures
4-2
Following a description and discussion of the data collection and analysis, this chapter will
present the findings in accordance with the same study methodology structure found in
chapter one (Figure 1.1 page 1-17). Chapter four will start by presenting fieldwork
methodology, and then ensue with measuring and evaluating external technology and
resources, enterprise internal technology transfer measures, absorptive capacity, value chain,
value network, research and development and competitiveness, and end with a summary.
Figure 4.1 clarifies that the field work is structured around seven themes. Note that only
seven themes will be discussed in chapter four as numbered in the figure.
4.2 Data Collection
To achieve the aims of the study, the researcher chose both a structured questionnaire and
semi-structured interviews as methods of data collection. While the questionnaire
investigated and assessed the general practice of technology transfer, including
competitiveness, absorptive capacity, value chain, value networks, cultures, and research and
development, the interviews served to validate the questionnaire answers and elicit
information that strengthened the questionnaire in the categories of absorptive capacity, value
chain, and value network.
To select participants for the study, the researcher deliberately chose 23 entities, covering all
major industries, government bodies and R&D centers involved in technology transfer. The
industries chosen were selected based on the high value they added to the GDP. According to
the General Secretary for Development Planning, the oil and gas sectors accounted for 90%
of the net industry revenue in Qatar (around US$ 13 billion) in 2005.2 Also, the contribution
to Qatar's GDP from these energy industries was 60%, while the rest of the small non-oil-
and-gas manufacturing enterprises contributed only 7%.3 According to Emerging Qatar, a
report by the Oxford Business Group, this trend will not change in the short term. Since this
dissertation is involved in the study of other enterprises as well, such as the R&D
establishments that contribute commercially to the industries and the government ministries
that influence technology transfer effectiveness, it can be assumed that the entities
investigated herein represent over 90% of the value added to Qatar's industries. Because all of
these enterprises were surveyed, the complete enumeration of the population is considered a
census rather than a sample and thus there is no requirement for sample theory. As a result,
the data is more likely to be accurate. Table 4.1 shows the number of participants chosen in
4-3
each sector. Initially there were around 31 participants that were reduced to 23 as will be
clarified later.
Table 4.1: Number of Participants Selected for Field Survey Participants Number
Gov. & Semi-Gov. 8
Industries 18
R&D 5
TOTAL 31
Source: Qatar Fieldwork, 2008
To achieve the goals of this study, it was important to account adequately for all of the
technology transfer practices in Qatar. If only a sample were surveyed, then the information
gained might not allow generalization or analysis of the most productive industrial
enterprises. Moreover, the population of 23 enterprises and organizations surveyed is small
when considering that only a single person from each enterprise needed to be given an
opportunity to respond to the questionnaire. In most cases, the selected respondents were
specialists who represented their organizations on technological matters. According to Yin,
replication logic dictates that this kind of purposive sampling should be used because of the
nature and specificity of the questions.4 McMillan defines purposive sampling as “a method
in which the researcher chooses participants because of their specific knowledge of the
research topic.”5
To further ensure the quality of the questionnaire, it was decided that each
industrial enterprise would be studied so that subsequent sites could be used to either confirm
or extend previous findings.
At the time the questionnaire was administered, there were only 23 participants because many
of the enterprises originally selected for investigation had merged or been acquired by other
enterprises (which were also surveyed). This has not changed the fact that the study covers
the entire population, but it did reduce the number of institutions involved with the study.
Initially, the researcher sought assistance from the Planning Council and the Emiri Diwan
(the Ruler's Office) to legitimize the study and to encourage respondents to release important
information. Specifically, the researcher requested that the Emiri Diwan issue a letter to the
industrial enterprises selected for the study in order to facilitate the researcher's work. While
this did not occur, the Planning Council (now named the General Secretary for Development
Planning or GSDP) did contribute data from many earlier studies, and this data was used to
verify the research results.
4-4
Table 4.2: Participants Surveyed by Sector Sector Number Participants
Gov. & Semi-Gov 8
ictQatar Qatar Armed Forces Ministry of Interior General Secretariat for Development Planning Ministry of Energy Supreme Education Council Ministry of Economy and Commerce Ministry of Municipality and Urban Planning
Industries 11
Qatar Petroleum (QP) Qatar Fertilizers Company Limited (QAFCO) Qatar Petrochemical Company Limited (QAPCO) Industries Qatar (IQ) RasGas Company Limited Qatar Gas Company Limited Qatar Steel Company Limited(QSC) Qatar Chemical Company Limited (QChem) Qatar Vinyl Company Ltd Qatar Fuel Additive Company (QAFAC) Qatar Electricity & Water Co
R&D 4 Texas A&M University Carnegie Mellon University Qatar University Qatar Science and Technology Park
TOTAL 23
Source: Qatar Fieldwork, 2008
The researcher spent eleven months (from March 2008 to January 2009) collecting data.
First, the researcher selected and called five respondents for a pilot study to test the
questionnaire. He explained the purpose of the survey and sought the respondents' approval
to participate in the survey. The survey was loaded online through QuestionPro, 5F
6 an online
survey tool that is user friendly and capable of generating research statistics.
After testing 64 questions on the five respondents in the pilot study, 42 questions were
selected for use in the questionnaire. The main issues leading to the removal of 22 questions
were unavailability of particular types of financial information, confidentiality of
information, and/or the participants’ lack of understanding of the technology transfer process.
Almost all industries investigated were unwilling to respond to questions that pertained to
their internal financial, logistical, and human capital performance. Appendices A & B show
the original and revised questionnaires, respectively.
After the pilot testing phase, the researcher emailed all of the remaining selected participants.
Some respondents required an in-person follow-up meeting to further explain the research
study or to provide assistance with the survey.
4-5
Data collection was difficult. There were many bureaucratic procedures to work through in
order to receive approval for the study. In addition, the researcher struggled to combat the
prevailing cultural belief regarding the unimportance of research studies, statistics, and data
collection. Locating appropriate participants, for example, often involved many explanations,
meetings, referrals, calls and approval processes. Because the study involved a census rather
than a sample, obtaining participants from each institution was important; therefore, the
researcher had to either negotiate with and persuade unwilling participants or compromise on
the number of questions posed to them.
Ultimately, because of participants’ hesitation, it was agreed that enterprises would not be
evaluated individually and that neither the respondents’ names nor the names of the
enterprises they represented would be published if doing so could expose them to criticism.
In short, the researcher agreed to only critique technology transfer effectiveness from a
general standpoint. In accordance with this agreement, no respondent names have been
reported in the results of this study and each enterprise name was replaced with an encoded
number wherever negative performance is discussed.
Heidegger7 once stated that the researcher is “part of the social world of his participants and
as such, he must necessarily use his own experiences in order to interpret those of the
research participants.” In addition, Kellett,8 Van der Zalm, and Bergum9
4.2.1 Assessment of Appropriate Indicators
agreed that the role
of the researcher was to work with the participants in order to shape a meaningful
phenomenon mutually. Technology transfer, acquisition, training, consultancy, research and
development, and sustainability were the phenomena of interest in this study. For this study,
the researcher’s role was to capture the respondents’ accounts of these processes without
influencing the findings. To prevent any bias, the researcher tested the questionnaire with five
respondents and made sure they understood each set of instructions and every question.
Furthermore, a semi-structured interview enabled the construction of a shared researcher-
participant understanding of technology transfer and related processes and augmented the
questionnaire by reflecting the phenomenological part of the research.
In chapter two, the researcher constructed a set of indicators that measures technology
transfer effectiveness and sustainable development. Using government publications,
published articles, statistical abstracts, studies, and annual reports, chapter three reflected on
4-6
many useful measures related to the economy, the environment, government policies, foreign
direct investment, the legal arena, and the field of education. Many measures did not need
any triangulation as they were available and evident. For example, one need not confirm the
availability of intellectual property rights regulation through a different source; the rights
exist or they do not. However, measures of absorptive capacity, value chain, value networks
and R&D needed further research. While some data relevant to the assessment of these areas
is in the public domain, all of the available literature did not answer the question of whether
or not there is an effective system for technology transfer within Qatari enterprises and
whether or not they are sustainable.
Therefore, the questionnaire initially sought to gather information on the sources of
technology transfer, the value added by particular technology projects, research and
development activities, and common barriers to technology transfer. It also sought to
differentiate various organizations’ competitiveness, marketing strategies, absorptive
capacity, and organizational cultures and attitudes. Finally, it was intended to address
concepts like value chain and value networks. See Appendix B for further information on the
levels and types of questions.
The pilot test on five respondents revealed that many changes needed to be made to the
questionnaire. The bases for these changes were a lack of understanding of many technology
transfer concepts. Other organizational/cultural issues also influenced participants'
willingness to respond to certain questions related to performance evaluation (Questions 10 to
14, 50-53 and 55 in Appendix A). Specifically, surveying the effectiveness of methods for
learning about competitors' innovations, asking about financial ratios, and requesting that
participants rate products and services on Ansoff's market growth mix proved to be very
difficult for several reasons. First, as mentioned earlier, respondents lacked awareness of
technology transfer terms or did not implement certain practices and marketing strategies
concepts. Second, financial ratios were either considered confidential or were not present in
financial statements. After discussing these issues with respondents, the researcher removed
some of the questions that might influence the reliability of the survey.
To meet participants' expectations, and, at the same time, to compensate for the loss of
information, the researcher deleted particular questions or parts of questions and
simultaneously looked for alternative sources to collect the same information due to their
4-7
significance in evaluating the dissertation's indicators. The performance evaluation questions
were omitted and the original questionnaire adjusted into its final form as shown in Appendix
B. The researcher decided to fill in the gaps left by the deleted technology transfer and
financial ratio questions through publications released by the organizations or from credible
international sources.
The questionnaire was designed to collect a wide array of technology transfer indicators. It
was also designed in such a way to accommodate enterprises with and without research and
development centers. Given the accommodations made after the pilot test, the duration of the
questionnaire was reduced from 45 minutes to 30 minutes.
4.2.2 Research Reliability and Validity
In this study, triangulation was achieved through the collection of different types of data from
various data sources and the use of different methods of data analysis. Questionnaire data was
evaluated against interview data and other questionnaire data. Also, diverse sources provided
data, including many industrial enterprises and government offices. Finally, the analysis
included comparisons of findings from the various primary sources as well as an
interrogation of the research process itself.
For data, the researcher focused on questionnaire results, interviews and credible government
statistics and studies. Using multiple data collection methods enabled the researcher to test
the reliability and validity of the research results. The mix of methods was also intended to
build a more in-depth understanding of the circumstances surrounding technology transfer in
Qatar; qualitative research methods traditionally favor multiple means of data collection, such
as augmenting survey data with interviews, particularly when the main research objective is
to build an understanding of a particular phenomenon. More precisely, because technology
transfer effectiveness has not been systematically studied, this approach met the researcher's
specific need to validate the respondents' answers to certain questions in the questionnaire
and to develop an in-depth understanding of technology transfer management practices.
Criticism may be lodged against the definition of effectiveness because of the lack of
agreement in the field about what makes technology transfer effective. This subject has
already been treated in chapter one (pages 1-31&32) where reliable and consistent indicators
of technology transfer effectiveness were presented and discussed. In addition, the extent to
4-8
which the results of this study will present an accurate portrait of technology transfer over
time is an issue because unprecedented change is currently taking place in Qatar. Qatar's
investments in the development of its gas reserves and its focus on increasing its revenues
mandate continuous production growth in the oil and gas industries. Looking at the planned
long-term production capacity development projects, agreements with other countries, and
joint ventures with multinational oil and gas companies, it appears that this trend is going to
continue into the next decade. Also, it is likely that the results accurately predict the trends in
technology transfer because the country’s vision, mission and policies are likely to remain
stable; they are even outlined in Qatar’s National Vision 2030 statement. This researcher
suggests that the stability of the results is likely to hold for approximately 18 months, as this
is the time required for new programmes and projects to be implemented. The inaccuracy of
long-term predictions is not a new problem in the field; most previous economic,
demographic and industrial predictions – even those made by many international and world
class institutions, such as the UN Human Development Index, Standards & Poor's, Moody's,
the World Bank, Qatar Planning Council and others – have been sometimes inaccurate by
more than 50%, even on the best attempts. In 2004, for example, the Planning Council
predicted that the population (it was then 744,000)10 would reach 1.3 million by 2010. The
population reached 1.5 million in 2008.11
However, reliability can be assured within a shorter
time period, particularly when measurements are taken repeatedly through empirical research
or objective questionnaires.
Validity, on the other hand, can be checked through triangulation within the research project
itself or through cross-checking with other research data. The main categories requiring
verification were the challenges to technology transfer, dependency on foreign technology,
competitiveness of the environment, significant accomplishments, impact of agreements,
supply chain effectiveness and legislative barriers to technology transfer. Several features
within the design of the questionnaire and the interview process made verification possible.
These were multiple sources of data collection (questionnaire and interview), the use of many
respondents within a similar sector, and the selection of the right officials to respond to the
questions in both data collection methods.
During the analysis, some questions were used to provide data for multiple categories. For
example, questions related to intellectual property protection could be used to assess
4-9
government policies, competitiveness, and research and development. In addition, some
indicators could be augmented with other data or blended together.
Table 4.3: Operationalizing and Addressing Research Questions
RESEARCH QUESTIONS (ENTERPRISE LEVEL)
Que
stio
nnai
re
Inte
rvie
w
Oth
er
Res
earc
h*
Principal Research Question
First Level Operationalization
Second Level Operationalization
How
eff
ectiv
e is
tech
nolo
gy tr
ansf
er in
Qat
ar's
sear
ch fo
r su
stai
nabl
e de
velo
pmen
t?
Assessing the External Technology and Resources
Sources of technology transfer √ √
Current number of technology transfer projects √ √ √
Number of licenses for external technology √ √
Rating of new technology success √ √
Rating of organization’s information scanning systems √ √
Percentage of new products using foreign technology √ √
Sales due to products using foreign technology √ √
Profitability of products using foreign technology √ √
Degree of understanding of technology transfer √ √
Barriers to technology transfer √ √
Assessing Environment and Government Policies
Environment: laws and regulations √ √ Environment: international conventions √
Government policies related to industry and technology √ √
Assessing Sustainable Development
Social indicators √ Economic indicators √ Environmental indicators √
Assessing Competitiveness
Marketing strategies √ √
Effectiveness of methods for learning about competitors √ √
Major activity fields under focus √ √
Organization's type of management √ √
Assessing Research and Development
Allocation of resources to research and development √ √
Percentage of research that is commercially viable √ √
Investments in manufacturing and national priorities √ √
Government grants as a percentage of total R&D expenditure √
Ratio of global gross expenditure on R&D to total
√
Proximity to other universities or R&D centers √
Science parks’ R&D indicators √ √
Assessing Value Chain Success of the organization at producing successful projects √ √
Efficiency of tendering systems √ √
Assessing Value Networks
Level of R&D institution agreements √ √
Number of cooperative agreements related to technology √ √ √ Variables, properties, or constraints affecting value √ √
Plotting of products on Ansoff's product market growth mix √
Recommendations to drive market plans to success √ √
Rate and return on investment and liquidity ratio √
Number of employees, categorized by their qualifications √ √
Average of training expenditures per employee √
Return on human investment ratio √
International quality standards √
Access to the internet √
Organization’s internet presence √ √
Maximum capacity compared to actual output √
Surveys conducted to elicit customer satisfactions √
Rating of successful teamwork √
Rating of internal communication √
Rating of staff morale √
Training relevance to employee job and level of expertise √
* Other research is drawn from secondary research, official publications and government statistics . Source: Author
4-10
Questions within the questionnaire were structured in a manner befitting descriptive and
explanatory research. In fact, many questions were adapted or adopted from other
questionnaires, enhancing reliability. A few brief questions were developed originally in
order to fully address the research question. See Table 4.3.
The researcher carefully designed each form with attention to both content and layout, pilot
tested the forms, and then carefully planned and executed the questionnaire. The pilot test
involved a group of five diverse respondents; each was asked to give feedback about the
content and format of the questionnaire. The survey was put online along with an opening
cover letter that explained its purpose. At the end of the survey, a note from the researcher
thanked the respondent and presented an email address for further communication if
necessary. See sample screen shots, Appendix C.
Using an online questionnaire provided many advantages. To fill out the questionnaire, the
respondent had only to click on a link in the email request and begin selecting from the
choices in front of him; therefore, it negated the need for overly computer literate individuals.
Furthermore, since the survey was emailed directly to the selected respondent, the researcher
had confidence that the appropriate person was filling out the survey. In addition, the
probability that the answers were contaminated was low. The response rate was high, most
likely because the questionnaire design – including forced choice or short open-ended
questions - made answering easy and quick. Also, respondents who did not respond to the
email invitation were sent reminder emails every three weeks. Using QuestionPro, an online
survey creator, was advantageous in that it eliminated reproduction costs and the need for
clerical support. In addition, the program automatically provided data entry and enabled fast
and easy analysis of the close-ended questions.
The survey was online for ten months and cost a total of US$ 1490 to create and maintain.
4.2.3 Interviews
The interviews’ phenomenological approach enabled it to build on the questionnaire. It
facilitated greater understanding of concepts and of the relationships between variables. It
also allowed the researcher to probe areas that could not be fully accounted for in the
4-11
questionnaire, such as absorptive capacity. Finally, it was also an opportunity for the
interviewees to ponder questions they may not have thought about thoroughly during the
questionnaire. Because the interviews required the researcher to meet face-to-face with the
interviewees, they elicited more honest, in-depth responses than the questionnaire, where
participants felt it was not appropriate to provide confidential information to someone they
had not met. Respondents were generous with their time and the response rate was high. The
interview data provided multiple perspectives on the issues of concern.
In total, the researcher conducted eleven interviews. Interviews were conducted face-to-face
at the interviewees' workplaces. However, in one case, the interview was conducted by
telephone due to the interviewee's time limitations. At the end of each interview, interviewees
were asked whether or not they wanted a transcript of the interview, and transcripts were
emailed to a few participants. Only one interviewee sent revisions to the transcript; the
remaining participants did not comment.
The aim of the interviews was to explore participants’ experiences with and expectations
regarding the subjects under scrutiny. The interview protocol was semi-structured to guide
discussion without limiting participants’ responses. Key questions had been delivered to
participants in advance through fax or email in order to allow them to prepare. This proved
helpful in that some interviewees provided documentation to support their answers; this
documentation was used to triangulate the data.
Three issues impacted the quality of the interview data: confidentiality, generalizability and
bias. First, some respondents were not empowered to reveal information that was perceived
to be confidential (the definition of what is confidential information was not defined by the
participant or his employer). It is likely that, at least in part, interviewees’ refusal to respond
to certain questions stemmed from fear of reprimand or even of prosecution; local
newspapers have carried stories of court cases involving the leaking of secure information
related to civil aviation and the energy sector. Because confidentiality was such a prominent
concern for many interviewees, the researcher had to redesign the survey invitation letter,
reword certain questions, and take other measures to ensure his respondents’ privacy. While
the invitation and questions stressed that the information requested was in the public domain
and the words “confidential” and “secret” were removed from the questionnaire, it was not
4-12
until the researcher verbally convinced respondents that neither their organization’s nor their
own names would be used in the dissertation that they consented to be interviewed.
The interview data alone does not allow generalizations about the entire population.
However, because every question in the interview explored the subject of technology transfer
effectiveness and expanded on survey questions, it is more likely to offer significant insights
of interest to the entire population.
Finally, the researcher took several measures to reduce bias. The researcher always prepared
for the interview by reading company reports and other publications related to the
organization. This enhanced the researcher’s credibility perceived by the interviewee and
encouraged the interviewee to give more input. It also helped to ensure the accuracy of some
of the information offered in the interview.12
Also, the interview questions themselves were
designed to reduce bias. The interview contained seven thematic questions, each designed
and phrased clearly so that the interviewee would understand it. These open-ended questions
helped to avoid bias. During the interview, the researcher followed every thematic question
with probing questions in order to produce a fuller account, as illustrated in Appendix D.
During the interview, the researcher controlled his posture, tone and gestures and offered
neutral responses to reduce bias. He summarized the interviewees’ explanations to avoid
incomplete interpretations. The researcher opened each interview by thanking the interviewee
for agreeing to the meeting and stating the purpose of the research and its progress to date.
The researcher then informed the respondent that he had the right to decline to answer, let
him know what would happen to the data collected, and reassured him that the researcher was
not after confidential information.
The researcher allowed a full day for each interview. After each interview, which normally
took between one to two hours, the researcher transcribed the interview on the same day so as
not to mix up the data with other interviews or forget what was said. To increase reliability,
the interview was not tape recorded as advised by Easterby-Smith et al13 and Ghauri and
Gronhang14
. By not taping, respondents feel freer to express their ideas without fear that the
tape will later be used as evidence against them.
4-13
There were no cultural differences between the researcher and most of the interviewees since
most interviewees were Qataris who had achieved similar educational levels from Western
universities, and who had similar backgrounds in technology. The mutual understanding
enhanced reliability and offered a rich exchange of information.
4.3 Data Analysis
QuestionPro’s statistical tools provided a thorough summary of the close-ended questionnaire
data. The summary consisted of frequency analysis charts, mean values, confidence intervals
at 95%, standard deviations and standard errors. The QuestionPro statistical tools also
provided key facts, including the highest and lowest values of some questions. Although this
significantly reduced the amount of analysis required, it was not sufficient to
comprehensively analyze some of the close-ended questions. This statistical tool was also
unable to integrate the open-ended answers. For example, questions that provided an option
to "list other variables" had to be analyzed separately, even though some parts of the question
could be analyzed using the statistical tools provided. Hence, the researcher had to analyze
these close-ended questions and/or compare them with other open-ended answers in order to
fully account for the data given. Also, the researcher analyzed individual open-ended answers
and attempted to integrate questions in order to create a more holistic set of findings. To
analyze the qualitative data gathered in the interviews, it was crucial to identify the unit of
analysis in each question, generalize, and make inferences.
Themes and patterns were compared or matched between the questionnaire data and the
interview data in order to confirm or disconfirm hypotheses, cross-validate themes, and gain
a more in-depth understanding. The findings were then compared with other studies.
4.4 General Survey Results
The questionnaire was viewed by 27 participants and completed by 23, a completion rate of
88.89%. Most of the commercial enterprises surveyed were limited liability companies
(LLC), an ownership type typically suitable for smaller companies with a single owner. Out
of the twelve industrial enterprises surveyed, seven were LLCs, two were partnerships, one
was a limited partnership, one a cooperative, one a corporation, and one a sole proprietorship.
4-14
4.4.1 Organizations Surveyed
A total of 23 organizations were surveyed. Table 4.2 shows that this number is less than the
original planned population of 31 organizations. Once the survey started in March 2008, it
was found that the industry population decreased due to mergers, but the scope of the study
did not change; it simply analyzed the merged companies under their parent organizations.
Finally, the survey encompassed eleven major industries, nine energy and petrochemical
industries, one steel industry and one power industry.
Within the government sector, eight organizations were selected. Four of the eight
organizations regulate technology; they include the Ministry of Economy and Commerce, the
General Secretariat for Development Planning (GSDP), the Ministry of Energy and the
Supreme Council of Information and Communication Technology (ictQatar). These were
analyzed with respect to their contribution to, support of, and regulation of technology
transfer. The remaining four organizations are public non-profit organizations and users of
technology. They were assessed with respect to technology transfer effectiveness, along with
another organization, ictQatar, which not only regulates information and communication
technology, but also manages a commercial enterprise that delivers ICT solutions.
Research and development organizations surveyed included two local establishments (QSTP
and Qatar University) and two foreign universities with branches in Qatar (Carnegie Mellon
and Texas A&M Universities).
4.4.2 General Survey Results
The survey showed that technology regulation bodies did not exist before the year 2000. In
fact, technology regulation was acknowledged only recently, in 2005, when ictQatar was
established and started regulating the information and telecommunication technologies. Prior
to this, in 2003, Industries Qatar was established, a company whose sole purpose is to
develop certain industries commercially. In 2006, the GSDP in Qatar initiated a focus on
sustainable development and planning. Lastly, in the year 2009, the Qatari government
established the Ministry of the Environment to achieve a balance between the protection of
the environment and its natural resources, and the requirements of development for a better
life for present and future generations.
4-15
Parallel to the development of technology regulations, industry became focused on gas
development beginning in 2001. The focus was and still is on gas-to-liquids (GTL) advanced
technologies. When QSTP was established, research and development became a strong
initiative in Qatar as QSTP encouraged research in areas that would serve local economic
priorities.
4.5 Focused Results Aligned with Technology Transfer Effectiveness Model
The following sections will now highlight the survey findings in accordance with the
Technology Transfer Effectiveness Study Model, Figure 1.1, p. 1-17. It is important to
mention here that assessment of the "Qatari Environment and Government," which is part of
the model, along with analysis of sustainable development, are not part of this micro-level
assessment since chapter three has analyzed them at the macro-level. In fact, the indicators
used to analyze these can only be measured at the national level. Therefore, the scope of the
enterprise survey will focus on external technology and resources, internal technology
transfer measures, R&D, and competition.
To date, there are very few measures available that would enable an analysis of policies to
promote technology transfer – either for commercial gains or for social benefits. It would be
particularly difficult to analyze short and medium term gains. The reason for this is the
difficulty in finding a relevant denominator to normalize various outputs. Thus, this
dissertation fills a gap in the literature through its attempt to design a framework and a set of
indicators that would allow for the assessment of the overall technology transfer within a
developing country such as Qatar.
4.5.1 External Technology and Resources
This section will present the findings on current practices related to external resources and
how these practices have influenced the effectiveness of the technology sought.
Around (40.26%) respondents indicated that their organizations chose to employ experts and
technical consultants as their main means of transferring technology. Table 4.4 ranks the
sources of technology transfer sought by local enterprises. As shown, foreign direct
investment was the least popular; only 2.6% of organizations selected it as a means for
technology transfer. However, purchasing machinery and supplies, forming joint ventures,
and initiating total process contracting were also popular sources of technology transfer. In
4-16
addition, procurement of hardware and services accounted for 35% of the preferred practices
for acquiring technology. This indicates that Qatari enterprises rely on various channels for
technology transfer.
Four respondents added other sources of technology transfer; these included turnkey projects
(one case), collaboration with QSTP (one case), and internal capability (two cases selected by
the two foreign universities surveyed).
Table 4.4: External Sources of Technology Transfer No Source of Technology Transfer Rank Number %
1 Employment of experts 1 16 20.78% 2 Technical consultancy contracts 2 15 19.48% 3 Purchase of machinery supplies 3 14 18.18% 4 Joint venture 4 13 16.88% 5 Total process contracting 4 13 16.88% 6 Others 5 4 5.19% 7 Foreign direct investment 6 2 2.60%
N=77, mean= 4.026, confidence interval= 95%, standard deviation= 1.821, standard error= 0.207
Source: Results of questionnaires calculated using QuestionPro Software
4.5.2 Enterprise Internal Technology Transfer Measures
At the heart of the technology transfer effectiveness model (Figure 1.1) are the internal
technology transfer measures. In general, this study will evaluate broad measures of
technology transfer within enterprises, such as technology diffusion, licenses, and factors that
hinder technology transfer. Following this, the study will present the assessment of findings
related to absorptive capacity, value chain and value network. To simplify the internal
technology transfer measures of an enterprise, the study will determine the extent to which
the enterprise’s initiatives have been successful in transferring technology domestically. For
this, the current number of projects, products and licenses is determined, then assessed.
Finally, factors that hinder technology transfer are evaluated.
This study surveyed three types of organizations: 45% public, 45% private, and 10% national.
The study did not define technology transfer so that managers and staff were free to use their
own interpretation. Based on the data, it was clear that the participants’ interpretations of the
concept could be categorized into equipment transfer, knowledge transfer, or both. Along
with this general finding, the researcher noted that enterprises found the transfer of equipment
and knowledge to be very important because of their unavailability in the domestic market.
4-17
Economy and efficiency in the use of limited skills and material resources is essential to
continued growth and productivity. Developing modern technology will yield efficiencies
and socioeconomic benefits to host regions. Thus, embarking upon projects that build skills
and assist in the acquisition of modern resources is essential to Qatar, which has limited
human resources and skills.
Figure 4.2: Number of Technology Transfer Projects that Should Diffuse Unavailable Technology
Source: Using Questionnaires results in QuestionPro
When asked about technology projects already underway, almost 75% of all respondents
revealed that their organizations had at least one ongoing project that would diffuse
technology within the enterprise. About 29% respondents replied that they currently have
three to four projects underway. Six respondents had no projects at the time of the survey.
IctQatar had the greatest number of projects to develop the ICT infrastructure, applications
and skills (a stake of 13% of all projects surveyed). Carnegie Mellon University followed
immediately behind it with seven projects (10%). Taken all together, is this a sufficient
number of projects to promote technology growth in Qatar? This question will be evaluated
in the next chapter.
To maintain a competitive edge in today’s international markets, commercial enterprises
often collaborate with the public research sector to innovate, acquire technology licensing
agreements, and promote further technology development. The strength and management of
0
1
2
3
4
5
6
7
8
Number of Technology Transfer Projects
Number of Respondents
4-18
these technology licenses is important to the enterprises’ interests and their workforce
growth.
Through licenses, the government can easily transfer national laboratory technologies to the
private sector. This study has shown that the only substantial activity in this regard was
conducted through Carnegie Mellon University, a branch of an American university located
in Qatar, with 23 licenses signed in the last year. See Figure 4.3.
Figure 4.3: Number of Enterprise Licenses
Average = one license
Source: Using Questionnaires results in QuestionPro
The remaining enterprises’ initiatives were lower than the researcher's expectations. Figure
4.3 shows that one institute, the Ministry of Economy, listed 7 licenses. This number only
accounts for licenses that the Ministry kept track of in its statistics. These seven licenses
included two industrial and five software licenses. The Ministry of Economy did not provide
data on the licenses of some independent organizations such as the Armed Forces, the
Ministry of Interior, and ictQatar, all of which have software licenses as well (a total of nine
licenses). Cross-checking this data with the interview results, it was revealed that these
software licenses are mandated by companies like Oracle, Microsoft or IBM to operate and
use their developed software, but do not enable the enterprise to transfer source codes.
The questionnaire also asked whether or not new technologies met the needs of the
organizations. Around 52% of respondents declared that they had partial success in using the
0 1 2
5 6 7
23
0
5
10
15
20
25
13 3 2 1 1 1 1
Num
ber
of L
icen
ses
Number of Enterprises
Number of Licenses
4-19
new technology to meet their needs. Additionally, 48% of the respondents thought the new
technology was a success. No respondent believed the new technology was a total failure.
This was reinforced with another survey question intended to evaluate organizations’
scanning systems. Around 95% of the respondents thought that the information scanning
system used by their organization was either useful or advantageous.
The survey sought to ascertain whether or not the enterprises’ products were developed using
local technology. Thirteen out of 20 respondents reported developing 100% of their products
using external technology. Four respondents answered that they developed 20 to 40% of their
products using local technologies. These four respondents were ictQatar, MOI, and Qatar
University. IctQatar develops customized software for the education, health and service
sectors. This is done through external companies involved in the design, implementation and
management of imported technology. IctQatar has signed contracts with consultants and
agglomerate IT companies and annually spends a great deal to support its initiatives. MOI
sells its services online. These online services, such as driving license renewal, traffic
violation settlement, visa application, and so on, have been programmed internally by MOI
staff. Qatar University, on the other hand, does manufacture certain products (it claims 20%)
using its research center. Figure 4.4: Percentage of Products Created Utilising Foreign Technology
Note: 100%, 13, 65% reads: 13 respondents said they use 100% foreign technologies. This is 65% of all
respondents to this question.
Source: Using Questionnaires results in QuestionPro
Below 50%, 3, 15%
60-80%, 4, 20%
100%, 13, 65%
Percentage of Products Using Foreign Technology
4-20
The only interesting case was the Armed Forces, which claimed to have 50% of its services
and maintenance done locally without external help. Although 100% of its weapon systems is
manufactured abroad, its support is not. The remaining 50% of its services and maintenance
are comprised of third and fourth line maintenance sought from manufacturers. Finally, the
American Universities in Qatar claimed that they generate about 25% to 50% of their
products from external resources.
In light of the above, the percentage of sales and profits due to products using technology
developed outside the organization followed a similar trend. The only difference that should
be highlighted is that the respondents who indicated that they used locally made technology
used only old technologies, like agricultural tools and equipment.
Barriers to Technology Transfer
There are several factors that hinder the process of technology transfer or cause projects to
fail. The survey produced the following results, found in Table 4.5. Table 4.5: Barriers to Technology Transfer in Qatar No Reasons Rank
1 Lack of knowledge: If an organization is short of skills and knowledge, it may be unable to use the technology offered. First
2 R&D effectiveness Second 3 Lack of awareness: Many organizations are not aware of available technology. Third 4 Management attitudes Fourth 5 Lack of funds: Organizations may be unable to purchase or develop technology.
Fifth
6 Lack of common interest: Organizations may exhibit a lack of motivation to reach agreement or settle differences of opinions about available options.
7 Poor coordination: Individuals within an organization or within collaborating organizations fail to effectively coordinate and find common ground on the activities, processes, goals and directions of the venture.
8 Lack of resources: Organizations may require more physical resources or may lose a key member.
9 Organizational problems 10 Conflict of interest: Competing organizations may be unwilling to collaborate. Sixth 11 Lack of time
Eighth 15 Weak links between customers and suppliers 16 Poor information flow 17 Changes in the project structure 18 Lack of trust 19 Resistance to change Ninth 20 Cultural differences 21 Geographic differences Tenth 22 Dependency on public R&D institutions 23 Short-term pressure Eleventh Source: Using Questionnaires results in QuestionPro
4-21
It is worth restating that 24.11% of respondents chose the following two options:
• Lack of knowledge: If an organization is short of skills and knowledge, it may be
unable to use the technology offered .
• R&D effectiveness
The top inhibiting factors also included management attitudes and lack of funds. It is
noteworthy that attitudes could have a strong impact on research and technology transfer; if
management believes the project to be of little consequence, moving projects from research
to development becomes more complex. The least chosen option was short-term pressure
(1.42%).
4.5.3 Absorptive Capacity
Chapter two identified four types of indicators to measure absorptive capacity; these included
marketing capabilities, breadth of knowledge, learning by doing, and return on investment. In
this chapter, marketing capabilities are assessed at the firm level through three joined
and its sales by product. Breadth of knowledge is measured through past patents and
assessments of the ICT budget, employees’ qualifications, and training expenditures. To
evaluate learning by doing, the study will look at five indicators: access to the internet, firm
sites, teamwork, internal communication, staff morale, and the relevance of training to
employees’ jobs.
For an overall assessment of absorptive capacity, a unified index could have been calculated.
However, such an index would not serve the objectives of the study because of the many
paradoxes inherent in the local environment. For example, while the rate of investment may
be high, the ability of indigenous workers to absorb technology may be low. In an overall
measure, these would counterbalance each other, revealing little. Also, there may be no
patents or productive training investment, yet the marketing and sales rates are growing
substantially. Therefore, each factor is examined independently and the study then offers an
overall assessment of absorptive capacity in Qatar.
Marketing Capabilities and Absorptive Capacity
Based on the literature review in chapter two, this dissertation was set to calculate marketing
capability as one element out of four to measure and evaluate absorptive capacity. This
4-22
capability depends on an understanding of the marketplace and is an important source of
competitive advantage for firms that can enhance financial and market performance.15
Overall, the Global Competitive Index ranks Qatar 67 out of 117 countries on the production
index, which measures its production of new and different products. Qatar’s score on
efficiency of production practices is also low (45). Ansoff’s Matrix supports this assessment;
the local industry is focusing on existing products in existing markets only, which is a market
penetration strategy. The absence of products in the product development area indicates that
there is little initiative to undertake new ventures (lack of innovation). This trend can be seen
across the energy industry and reflects the effects of conservative government policy in the
area of innovation.
Figure 4.5: Ansoff’s Matrix of Qatar’s Industry Existing Products New Products
Existing Market
Market Penetration
Oil, LNG, Urea, LDPE, Ethylene, Sulphur,
Water, Electricity, Vinyl Chloride Monomer,
Ethylene Dichloride, Caustic Soda, 1-Hexene
Product Development
Nil
New Market
Market Development
Urea (direct to farmers), LNG Offshore
Terminals
Diversification
Nil
Source: Using Questionnaires results in QuestionPro
Marketing Plans and Absorptive Capacity
Marketing strategy can be defined as a firm’s efforts to gain a competitive advantage in the
marketplace.16
A marketing strategy allows enterprises to position a product accurately in the
right market and to develop its competitive advantage. When respondents were asked for
three recommendations to increase their marketing success, they came up with a variety of
answers. The researcher categorized these responses and displayed the results in Figure 4.6.
Respondents felt that the most important marketing plan is to decrease the cost of the product
or service. This was followed by higher production capacity. Higher production capacity aims
at reducing cost through volume of scale. Clearly, then, the single most important marketing
strategy is cost reduction and increased sales. The relationship of this strategy to
sustainability will be addressed in chapter five.
4-23
The second recommendation type focused on quality. The interviews revealed that many
organizations are seeking to implement ISO 9001-based quality management systems (QMS).
One interviewee stated, “Quality improves economics by making it more efficient and
competitive.” Another interviewee said that the local industry could benefit from
international industry experiences, new technology, and better managerial and organizational
practices. This indicates an awareness of the benefits of increased quality.
Figure 4.6: Recommendations to Drive Market Plans to Success
Source: Using Questionnaires results in QuestionPro
The third marketing plan included workshops, seminars, conferences and forums. These
strategies aimed at promoting industrial products to international clients.
It is worth mentioning that enterprises also saw the legal environment as an important aspect
of product promotion. This means that government legislation is important to organizations’
abilities to promote their products.
Sales by Product
Technology transfer has the potential to lead to new products, creating a positive economic
impact. When the number of products a country develops increases, sales revenues, spinoffs,
0
2
4
6
8
10
12
Gov
ernm
ent p
rior
ities
Adve
rtis
ing
sms
Spot
sal
es
Mon
opol
y or
enf
orce
men
t
Use
of j
oint
ven
ture
net
wor
ks
Use
r ben
efits
Dir
ect w
orks
hops
and
aw
aren
ess
Relia
bilit
y
Envi
ronm
enta
l fri
endl
y pr
oduc
ts
Safe
ty
Div
ersi
ficat
ion
Qua
lity
Hig
her p
rodu
ctio
n ca
paci
ty
Impr
oved
coo
rdin
atio
n
Prop
er g
over
nanc
e
Relia
ble
infr
astr
uctu
re
Avai
labi
lity
of ra
w m
ater
ial
Off
shor
e po
rts
Ship
ping
ves
sels
Mar
ketin
g ca
paci
ty
Impr
oved
lega
l con
stra
ints
Spot
sal
es
Cost
redu
ctio
n
12151011
PromotionProductProcess, policy & ProceduresPrice
No. ofResponses
Marketing Plans
4-24
jobs, government gains and spin-backs increase. Table 4.8 projects annual growth of
Industries Qatar as an example to be used in a perception assessment to the spinoffs created.
Earlier studies focused on input-output approaches, where output was the immediate or
intermediate product of technology transfer. Later on, the focus shifted to final impact. The
major focus of Qatar’s industry is to leverage its comparative advantage in terms of
availability of petrochemical resources. By chemical conversion, primary petrochemical are
transformed into more complex intermediate products.
Table 4.8: Annual Sale Growth of IQ Products 2007-2008 (in 1000 tons)
Industry Product 2007 2008 %Growth QAPCO Ethylene 207 296 43
Sulphur 55 53 -4
LDPE 308 410 33
QAFCO Ammonia 402 434 8
Urea 2939 2923 -1
QAFAC Methanol 650 807 24
MTBE 608 673 11
Qatar Steel Steel Bars 1376 1440 5
Average 15
Note : Due to unavailability of data, the author used quantity sale in tones. The best projection is to use sales revenue by product. Source: Using Questionnaires results in QuestionPro
Table 4.9: Percentage of Sales by Product 2008
INDUSTRY PRODUCT 1 PRODUCT 2 PRODUCT 3 PRODUCT 4 Qatar Petroleum Oil Gas - -
57% 43% - - QAFCO Ammonia Urea - -
13% 87% - - QAPCO Ethylene Sulphur LDPE -
58% 3% 38% - Ministry of Energy Water Electricity -
25% 75% - - Industries Qatar QAFCO QAPCO Qatar Steel QAFAC Sales by companies 38% 28% 27% 7% RasGas Company Limited Ras Laffan I Ras Laffan II Ras Laffan III
24% 17% 59% Source: Using Questionnaires results in QuestionPro
4-25
Table 4.9 clearly demonstrates that Qatari industries focus on producing intermediary raw
materials or products that are later used to develop other final products. These intermediary
materials include ethylene dichloride, ethylene, high-density polyethylene and vinyl chloride
monomer. However, it is also worth noting that some final products are being developed,
such as lubricants and other oil refined products like steel and fertilizers. Thus, diversification
is focused only on a small segment of energy and related petrochemical products.
Globally, petrochemical sales have fallen in the past years by 10% and are characterized with
overcapacity. Many petrochemical companies are affected. With the present overproduction
by Iranian and Gulf State countries and the planned production expansion by these countries,
Qatar will be less fortunate to enjoy a lower feedstock cost and must focus on other plans to
offset this situation. Why Qatar does not change its focus to final products is a question to be
discussed in the next chapter.
Breadth of Knowledge
One element of measuring breadth of knowledge is calculating the number of patents held by
a particular entity. According to a recent study by the General Secretariat of Qatar’s
Ministerial Council, the number of patents filed in the fields of engineering, science or
technology during the years 2005 and 2007 did not exceed one. Therefore, the rate of patents
per million in populations is very low when compared to advanced countries.17
Another measure of the breadth of knowledge within an entity is information and
communication investment. The information and communication technologies have
contributed considerably to the social and economic development of nations attempting to
bridge the digital divide in the current global, knowledge-based economy. Integrating
globally presents profound socio-economic and cultural challenges and opportunities.
Unfortunately, Qatar’s annual ICT budget is not accessible as an isolated data point.
However, this study is able to shed some light on this through its survey of many major
enterprises.
ICT access, use and skills can indicate the level of absorption of technologies within an
entity. These indicators are being calculated regularly by the International
Telecommunication Union (ITU). Access indicators include infrastructure, affordability,
knowledge, quality and actual usage. The ITU has developed a unified development index
4-26
(ICT Development Index) that integrates three indicators: access, use, and skills. In 2009,
Qatar ranked 44th in the world on the ICT Development Index.18 Looking further at the three
sub-indicators reveals that Qatar ranked highest in access (39), followed by use (44) and
skills (79).19
Figure 4.7: Qatar Information Development Index Web Chart
Source: International Telecommunication Union. Measuring the Information Society: The ICT Development Index. ITU, Geneva Switzerland. 2009. p. 25.
IctQatar has the biggest ICT budget, with spending reaching around QR 200 million (US$ 55
million) in 2007. Following ictQatar is the Ministry of Interior, which spent a substantial
(8%) share of its annual budget. The American universities - Texas A&M and Carnegie
Mellon - scored third and fourth respectively. The Supreme Education Council allocated
2.5% of its annual budget to ICT in 2007. The remaining enterprises varied in their
expenditures, but all came in below 1%. QSTP did not answer this question, although it is
believed that they rely on ICT to a great extent.
The third measure of breadth of knowledge is qualifications. Through the qualifications
portion of the survey, this study found that the majority of staff at Qatari enterprises and
institutions has a diploma, a higher diploma or a Bachelor of Science degree. It was
surprising to discover that QP recruits candidates with bachelor's degrees more often than
4-27
candidates with diplomas. Employers do not prefer higher diploma levels. The industrial
enterprises and agencies involved in managing their technologies are staffed appropriately
with qualified personnel.
Figure 4.8: Number of Employees and their Qualifications
Source: Results of Questionnaires calculated using QuestionPro Software
Figure 4.9: Training Expenditure
Note: The enterprises have been coded automatically using the statistical tool “QuestionPro.” IctQatar spends the most on training. Source: Results of Questionnaires calculated using QuestionPro Software
A fourth measure of breadth of knowledge is amount of training expenditures. In response to
survey questions regarding training, seventeen entities provided data on their training
expenditures. On average, organizations allocate around QR 8,800 (US$ 2,400) per employee
0500010000150002000025000300003500040000
PhD Degree
Masters Degree
Bachelors Degree
Higher Diploma
Diploma
Secondary Level
Below Secondary
No Qualifications
Number of Employees
Qua
lific
atio
n
0.00
20,000.00
40,000.00
60,000.00
80,000.00
100,000.00
120,000.00
2709
390
2718
254
2718
385
2740
149
2740
183
2761
699
2820
503
2820
527
2820
664
2835
486
2836
013
2862
275
2862
370
2862
458
2923
089
2923
147
2923
383
Ave
rage
Tra
inin
g In
vest
men
t
The Enterprises
4-28
annually on training. The minimum expenditure was QR 150 (US$ 40) per trainee annually,
and the maximum was QR 100,000 (US$ 27,400) per trainee annually. See the distribution of
training expenditures in Figure 4.9.
Learning by Doing
As indicated earlier, the percentage of employees that have access to the internet from their
desks is part of the assessment of learning by doing. Twenty-one respondents replied to this
question. More than 50% of the respondents indicated that fewer than 50% of their
employees had access to the internet. The least chosen option was “100%” access (9.5%).
Figure 4.10 illustrates a frequency analysis of employee access to the internet from their desk. Figure 4.10: Internet Access Frequency Analysis Do you access the internet from your desk?
Count Percent 20% 40% 60% 80% 100%
100% 2 9.52%
75%- 99% 2 9.52%
50%-74% 3 14.29%
25%-49% 4 19.05%
10%-24% 7 33.33%
Less than
10% 3 14.29%
Total 21 100%
Source: Results of Questionnaires calculated using QuestionPro Software
In response to the survey question regarding the purpose of internet access, 64% said they use
it mainly for emailing, 18% for email and research and 18% for email, research and sales. All
who were surveyed indicated that their organization has a homepage on the internet.
Teamwork, staff morale, and internal communication ratings formed a third element of this
assessment. These were evaluated during the interview in Question (2) (see Appendix D) and
answers to these questions were also used to assess dependency on foreign technology. All
respondents answered favorably, rating the teamwork, staff morale and internal
communications within their enterprise as good, very good, or excellent.
The final element used to assess learning by doing was the rating of training relevance to
employees’ jobs. When asked whether an employee’s performance review is the basis for
selecting a training program for the employee, 67% said “yes.” It is therefore inferred that
67% of training programmes are relevant to employee’s jobs.
Figure 4.11: Training Relevance to Job Is your training relevant
to your job? Count Percent 20% 40% 60% 80% 100%
Yes 14 66.67%
No 7 33.33%
Total 21 100%
Source: Results of Questionnaires calculated using QuestionPro Software
Return on Investment
Return on investment (ROI) assesses the company’s ability to earn an adequate rate of return
and provides information about the effectiveness of its management. To calculate ROI, this
study divided net profit by total assets. The simplicity of this formula facilitated comparison,
particularly as some enterprises had little financial data available. In combination with other
measures, it reflects the enterprise’s success in building capacity and transferring technology.
During this survey, it was noted that a few enterprises - particularly those registered with the
stock market - publish annual reports and have external financial auditors like Ernst & Young
or KPMG to audit their performance. However, the auditors do not present financial analysis.
Also, many other enterprises, including those that are state-owned, do not publish their
financial data online. Table 4.10 provides a comparison between a few industries in Qatar and
also compares these figures with multinational companies in the same industrial sector.
It is noted that almost all the energy sector enterprises have very high returns on their
investments. QP posts the highest ROI (61%), particularly when compared with Exxon Mobil
(17%) or Shell (9%). On the other hand, a company like Electricity and Water Co. has only a
6% return on investment. Table 4.10: Return on Investment
No Industry Net Income USDx1000,000
Equity Capital USDx1000,000 ROI Year
1 QAFCO (Fertilizer) 698 2,181 32% 2007
2 QP (Qatar Petroleum) 5,992 9,858 61% 2005
3 QAPCO (Petrochemical) 386 1,795 22% 2007
4 Industries Qatar 1,993 7,520 27% 2008 5 Electricity and Water 207 3,723 6% 2008 6 Shell 26,277 282,401 9% 2008 7 Exxon Mobil 40,610 242,082 17% 2007 Sources: Extracted from enterprises’ Annual Reports. ROI is calculated using net profit over net assets.
Source: Calculated using market prices and product sales in enterprise annual reports
Following oil and LNG, steel bars came in as the third highest income producer. However,
this should not be confused with the return on investment generated from the product,
because steel raw material is imported from other countries; therefore, its production cost is
substantially higher than that of petrochemical products.
4-32
Market Assumptions
Market assumptions make businesses monitor changes in key areas so that plans can be
adjusted. The global oil, gas and consumable fuels industry has a market share of 97.6% of
the energy industry and reached a value of US$ 10,026 billion in 2008, a compound annual
growth rate of 25.5% for the period spanning 2004-2008.21
Qatar energy shared 0.61% of the
$10,026 billion, or US$ 62 billion, a growth of 88% from the previous year. Despite concerns
about overdependence on the hydrocarbon sector, Qatar’s nominal GDP growth remains
strong. The growth in the hydrocarbon sector is attributed to higher energy prices and a
continued increase in output volumes. Because many large products got off the ground, gas
production increased by 40% in 2008. This demonstrates that Qatar’s market assumption that
the LNG sector would grow at a rapid pace is fairly accurate; it also explains Qatar’s strong
focus on this area.
However, interviews revealed that the quality of Qatar’s business environment is significantly
ahead of its companies’ sophistication. With respect to innovation, which is fundamental to
competitiveness in high-income economies, Qatari businesses will undoubtedly fall behind;
they lack the trained staff necessary for research activities and they do not utilize
opportunities to build skills and knowledge through collaboration. Furthermore, when
combined, the previous section’s findings and the findings in this section indicate that while
marketing capabilities and effectiveness are achieving a high return on investment, there is a
lack of focus on innovation and business sophistication.
Financial Management
Financial management analysis could not be conducted because many enterprises do not
publish or disclose their financial performance.
Customer Satisfaction Surveys
Table 4.12 reflects all responses to the survey question eliciting information about the types
of customer satisfaction surveys the organizations conduct and the frequency with which they
distribute such surveys. The table is further analyzed to find the percentage of organizations
that conduct each particular type of survey and, among those organizations, the average
number of surveys conducted. It is clear from the table that product and service quality
surveys are distributed most frequently (48% of organizations) and organizations who seek
such information do so an average of four times per year. Staff service surveys came in
4-33
second (33% of organizations) with an average of three surveys per year among organizations
that conduct them. Following this, reputation surveys were distributed by 26% of the
organizations, with conducting organizations delivering an average of two surveys per year.
The least covered survey areas were delivery and value for the money (22%). Table 4.12: Type and Number of Surveys the Organization Conducts Each Year
Product / Service Quality
Delivery Staff Service
Organization’s Reputation
Value for the Money
Total Surveys 52 20 29 15 11 No Response 14 21 18 20 21 Response 13 6 9 7 6 Total Surveyed 27 27 27 27 27 Percent Conducting Survey Type
48% 22% 33% 26% 22%
Surveys / Yr 4 3 3 2 2 Source: Results of Questionnaires calculated using QuestionPro Software
Sales Performance
This topic has been covered earlier in this chapter within the absorptive capacity section, but
here the analysis will be broadened. Qatar’s industries focus on selling products with high
market values and low production costs, such as gasoline-blending stock and chemical plant
raw feedstock. To further illustrate, methane (natural gas) can be a very important source of
petrochemical feedstock for the production of intermediate and finished goods. It can also be
used as a source of hydrocarbons (e.g. ethane and propane) that are higher in molecular
weight than methane and are also important chemical intermediates. Qatar needs to develop
its downstream industries by setting up more diverse industries that could utilize a portion of
the abundant gas resources, such as petrochemical and fertilizer plants, instead of only
exporting the gas as LNG to developed countries. In the long run, this would create job
opportunities for local citizens. In sum, the government and private sector should invest in
gas–based industries. The sale of LNG to other countries is good, but the money earned from
it should be invested in gas–based industries to create job opportunities for Qataris.
Performance Management
Performance management is also interrelated with absorptive capacity and marketing
capability. With respect to value chain, individual enterprises must develop their key
performance indicators (KPI) through an action plan in order to benefit from their
productivity and supply chain management. The study did not find a roadmap plan to
4-34
evaluate the logistics KPIs. However, based on the previous analysis, it is clear that skill gaps
need to be addressed. In particular, it is important to solve the problem of importing skills
rather than generating them within Qatari institutions. Also, although the ICT infrastructure is
promising, there is a need to build an integrated network that connects businesses with
government and education. The interview findings also highlighted the need for vocational
training in order to respond to businesses’ growing demands for a skilled labour force.
Cost of Production
While surveying production costs, the researcher found that most of the energy industries
depend on natural gas as a raw material and that they contract with QP for the natural gas at
competitive rates. This enables the local industries to produce goods at a low cost. QAFCO, a
fertilizer company, relies on natural gas as a raw material and this material comprises 80% of
the cost of production. Compared with other producers, QAFCO is considered to be a low
cost producer of ammonia and urea. In addition to natural gas, the petrochemical company
QAPCO requires utilities and production chemicals to produce its goods. QAPCO signed a
long-term agreement with QP to deliver feedstock with a yearly set price to reduce the price
fluctuation. QAPCO is self-sufficient in producing needed electricity, water, steam and air.
The primary raw materials for QAFAC, a fuel additive producer, are methane and butane.
Methane is contracted from QP on a fixed price, while butane is acquired from QP at open
market prices and therefore is sensitive to price fluctuations. Unlike these producers of
petrochemicals, QASCO, a steel company, has higher costs of production. It buys raw
materials from international markets through suppliers. It also consumes electricity, water
and natural gas, which are supplied by Qatar Electricity and Water and QP respectively. In
short, the production costs within Qatar’s energy industry are much cheaper than in other
countries due to the government support in reducing the intermediary feedstock.
IT Management
Qatar made its first serious foray into the information technology domain in 2005. IctQatar
established a master plan, as shown in Figure 4.12, for an integrated approach to achieve
Qatar’s long-term vision. Each of the components plays a complementary and indispensable
role. This vision integrates all substantial contributors to the development of the information
technology in Qatar and extends to eight national programmes. IctQatar has also deregulated
the communication sector, as mandated by the World Trade Organization. These initiatives
allowed Qatar to rank 32nd in the 2008 Networked Readiness Index (NRI). This rapid success
4-35
has been attributed to singular government leadership. However, this initiative is still in its
infancy. The real success will be the effective utilization of ICT to produce value in terms of
both social growth and prosperity, which has yet to be seen.
Figure 4.12: Qatar’s ICT Master Plan
Source: Qatar ICT Master Plan 2005, ictQatar.
The above summarization is in agreement with earlier findings; technology has been
imported, but use of this technology in business and daily life is still lagging behind. It has
been four years since ictQatar implemented its vision but to date, the initiatives designed to
build human skills are deficient and need immediate attention. At the same time, this study
found that most enterprises lack an ICT strategic plan to synchronize with ictQatar’s master
plan.
New Product Management Development
New product management was covered within the section on marketing capabilities and
absorptive capacity. However, this section will analyze the effect of new product
management on the value chain.
Organizational innovation is the basis for the management of complex processes. It is also the
base for new product development. A well established, innovative infrastructure will add
value along the value chain and create a competitive advantage. Although Qatar’s innovation
system has shown progress in international reports, this study did not confirm this finding.
4-36
This is because the international bodies base their calculations on the way the measure is
defined for the innovation pillar and not on the real progress. Demonstrating real progress
requires one to measure the output, whereas some international reports are satisfied with
measuring only symbolic gestures, such as the presence of policies and not their
implementation.
In this researcher’s view, Qatar’s innovation system started when QSTP, QNRF and the
Supreme Education Council were established in 2004. At the same time, the government,
through the Ministry of Finance and Commerce, issued a policy encouraging FDI and
permitted 100% foreign ownership in ventures in the health, education and tourism sectors.
Through Qatar Development Bank, the Ministry of Finance encouraged small to medium
businesses by providing financial support and technical assistance. This has spurred a few
projects.
The study surveyed the technology transfer projects that are currently underway to diffuse
unavailable technology within a particular organization. The first finding was that such
projects are limited in number; they average 2.72 per organization. See Figure 4.13. Figure 4.13: Number of Projects to Diffuse Technology
Source: Results of Questionnaires calculated using QuestionPro Software In the interviews, respondents spoke gravely about Qatar’s shortage of skilled human
resources in the field of science and technology, which puts more limitations on absorptive
capacity. The main reason for this shortage is the limited amount of available tertiary
0.001.002.003.004.005.006.007.008.009.0010.00
2709
175
2709
390
2718
254
2718
385
2740
149
2740
183
2746
824
2761
699
2819
993
2820
488
2820
503
2820
527
2820
664
2835
486
2836
013
2862
275
2862
370
2862
458
2862
477
2862
500
2866
351
2866
419
2923
089
2923
147
2923
383
Projects
4-37
education in science and technology. To illustrate, only 22% of the 2007 graduates from
Qatar University earned degrees in science and technology.
To summarize, the absence of a few important KPIs makes it difficult to assess the value
chain. The study found some KPIs for a few industries and managed to measure almost all of
the value chain indicators, including environmental analysis (through tendering regulations),
contribution analysis (through contribution towards GDP), market assumptions (through
competitiveness and marketing capabilities), financial management (through profit
calculations), customers satisfaction surveys (through benchmark comparison of variety of
customer surveys), sales performance (through the number of contracts signed), peformance
management (through KPI in-place), cost of production (through a scale of 0-1, with 0 as
high cost), IT management (through IT policies and infrastructure), and finally, new product
management (through innovation measured on a scale of 0-1, with 1 as innovative). Figure
4.14 illustrates a web chart that assigns an overall value to the chain. Figure 4.14: Qatar Industrial Enterprises Value Chain Web
Source: Appendix E
Also, Figure 4.15 compares the overall value chain assessment.
0.00
0.10
0.20
0.30
0.40
0.50
0.60
0.70
0.80
0.90Environment Analysis
Product and Contribution Analysis
Market Assumptions
Financial Management
Customer Satisfaction Surveys
Sales Performance
Personnel Management
Cost of Production
IT Management
New Product Management Development
Value Chain Spider Web
2740149
2740183
2761699
2836013
2862275
2862477
4-38
This study found that the comparative advantage for Qatar industries is marketing LNG
products. The supply chain is characterized by excellent procurement processes, competitive
product prices, high quality, and fast delivery times. Adequate management systems are in
place to plan, organize, monitor and control the supply chain cycle. The sales performance is
excellent due to the utilization of available natural resources. The infrastructure is excellent
because of state-of-the-art technologies. However, with volatile products, there is risk of
underperforming and there is a need to diversify beyond related energy products. Of the
major concern, then, are the inadequate skills of the workforce, which have slowed the
success rates of many projects and have decreased the innovation index. Figure 4.15: Qatar Industrial Enterprises Overall Value Chain Index
Maximum Index Value = 10.
Source: Appendix E
4.5.5 Value Networks
Value networks address both financial and non-financial values. Financial value addresses
financial investments, operating capital, time, materials, facilities, and equipment. Non-
financial value deals with human skills and competence, internal structures and systems, and
business relationships and agreements. These intangibles also cover value conversion
processes, value enhancements, perceived value and social value. It is difficult to measure
these values because of insufficient metrics.
To assess financial value, the study will measure asset utilization. For non-financial value, the
study will not attempt a value network analysis but will measure network value through
0.00
1.00
2.00
3.00
4.00
5.00
6.00
7.00
274014927401832761699283601328622752862477
Overall Value Chain Index
4-39
number of agreements, human skills, intermediary products (value conversion), customer
satisfaction (perceived value), and social capital.
Financial Values
The financial value has been shown in Tables 4.8 & 4.9 by calculating growths and
investment. This analysis showed that all the energy sector enterprises had very high returns
on investment, but non-energy sector businesses recorded much lower ROIs. It is important
to note that this figure does not necessarily indicate the energy sector’s enterprise
effectiveness, but may simply reflect the gains from the supply of abundant cheap feedstock.
Non-Financial Values
The number of active technology transfer or science and technology agreements between
enterprises and R&D centers can be used as a simple measure of value networks. However,
comparable data are not widely available at this time for such an indicator. For an alternative
assessment of the performance of and value gained from such agreements, the study ranked
the types of agreements from least to most effective in the areas of networking, cooperation,
coordination, coalition and collaboration.
Figure 4.16: Number and Types of Technology Transfer Agreements
Source: Results of Questionnaires calculated using QuestionPro Software Value networks involve a larger number of firms with a more complex set of relationships
between them than do value chains. This is expected to be reflected in the number of
89
51
31
97
0
10
20
30
40
50
60
70
80
90
100
Networking: little communication
Cooperation: formal communication and exchange
of information
Coordination: shared information and decision
making
Coalition: shared resources and frequent, prioritized
communication
Collaboration: members belong to one system and
consensus is reached on all decisions
Numb
e
r
of
Agr
e
e
m
e
n
t
s
4-40
agreements between corporations. By looking at Figure 4.16, it is noted that ten entities
responded that they had some sort of agreement (42% of the population surveyed). When it
came to types of agreements, networking agreements topped the list (89 agreements in total),
followed by cooperation (51 agreements), coordination (31 agreements), coalitions (9) and
collaboration (7). It is logical that the more complex the type of agreement, the lower the
number of agreements made. It is important to note that the number of agreements is not a
good indication of the value of the type of network established. However, it can be concluded
that networking agreements are a simple but powerful means for developing team and
community collaboration.
The extent of human skills is another indicator that contributes to the assessment of value
networks and has already been analyzed earlier in this chapter. The findings indicated that the
industrial enterprises are staffed appropriately with qualified personnel, though these are
mostly expatriates.
With respect to intermediary products, a third measure of value networks, it was shown
earlier in this chapter that Qatari industries focus on high market value products, such as
gasoline-blending stock and chemical plant raw feedstock, because such products have lower
production costs. However, it would be beneficial to develop the downstream industries by
setting up more industrial enterprises that could utilize some part of the abundant gas
resources.
A fourth measure of value networks used in this study is use of customer satisfaction surveys.
Customer satisfaction surveys are regularly conducted and mostly focus on the quality of
products and services. Recent studies have shown that customers generally place a great deal
of trust in Qatar's local products. However, this study did not establish the mechanisms to
follow up on these surveys.
Social Capital
Within an organization, the study of social capital is not necessarily vital to organizational
success, but it does offer many benefits. High social capital within an organization can lead to
lower transaction costs due to a high level of trust. It can also lower turnover rates, thereby
maintaining valuable organizational knowledge and creating greater organizational bonding
and stability.22 Across organizations, social capital is important to the establishment of strong
4-41
networks and communication, which facilitates the transfer of knowledge. Quantitative
measures of social capital have proved to be complex and problematic. Therefore, this study
measured social capital through qualitative data that was then distilled into a measure of the
level of relationships. This will shape the perceptions of the value network between
enterprises.
“Institutions are composed of cultural-cognitive, normative and regulative elements that,
together with associated activities and resources, provide meaning to social life.”23 Thus,
understanding the social life of the organization entails understanding its cultural-cognitive,
normative, and regulative elements. Understanding norms and the cultural-cognitive
structures would facilitate an assessment of successful interactions between universities and
practitioners, as well as suggest how to increase networking between collaborative bodies.24
The regulative element consists of rules and sanctions that are embedded in any institutional
system. The regulative element emphasizes regulative changes to improve collaborations
between universities and business.25
The social relationship between the government of Qatar and its people has evolved to
emulate that of care-giver to needy children. The care-giver strives to freely educate, socially
care for and regulate its citizens. The impact of this relationship or "social contract" has led to
a trust issue. Interviews indicated that organizations have difficulty trusting a “cared-for”
citizen to lead or be part of the elite working force in a complex venture, such as an energy
complex. At the same time, the government perception is that citizens are “not helping
themselves.” However, the citizens' perceptions are that there should be a mutual
responsibility between the government and its people; this can be maintained through
competitive institutions and the promotion of trust and accountability. Although there is a
trend toward creating competitive and learning organizations, the perception of government
as “care-giver,” as one interviewee said, "lingers in the media." Interviews supported the
finding that the focus in Qatar is to quickly increase the country’s wealth at the expense of
technology transfer and sustainable development.
In chapter three, Figure 3.2 focuses on the stakeholders in the national innovation system.
The main players in the system are the public sector (the Council of Ministers), the policy
makers (Ministry of Energy and Industry, Supreme Education Council, Planning Council, and
Qatar Foundation), the financers (Qatar Petroleum, Qatar National Research Fund, and Qatar
4-42
Science and Technology Park), the operators (Education City campuses, College of North
Atlantic, and QSTP), and the private sector (business enterprises, research institutes,
insurance companies and industry and academic societies). According to this study, the
collaboration and coordination between universities, private companies, research centers, and
government agencies on science and technology issues is either non-existent or existent only
at the networking level (weak communication). Also, human capital and the skills to innovate
do not exist in the private sector for incentives reasons. Businessmen in Qatar claim that the
private sector cannot compete with the public sector in funding R&D initiatives. However, in
Qatar University and the public sectors, improvements meant to limit dependence on
imported technologies have been noted.
Overall, there is still much to be done to build social capital through improved relationships.
This is achieved through improved communication channels that employ knowledge in order
to improve products and services. It is also necessary to create shared goals that build trust in
relationships and provide better knowledge-sharing for decision makers.
4.5.6 Research and Development
In chapter three, secondary research indicated that there is a scarcity of R&D centers in Qatar
and that researchers and related development programmes do not exist in Qatari industry.
Furthermore, there is no statistical data on R&D in Qatar. To contribute to this field, then, the
researcher conducted a field survey using a questionnaire and interviews to gather
information on essential R&D indicators that will enable a comparison with international
benchmarks.
The R&D indicators selected earlier included the number of government grants, the ratio of
global gross expenditure on R&D to total expenditures, measures of the intensity of R&D, the
proximity of universities to industry and to each other, the number of patents granted by the
country, and the expenditures on human development in R&D. However, the availability of
information made it necessary to be selective in choosing indicators. The study will start with
government grants.
Expenditures on research and development (R&D) are a key indicator of government and
private sector efforts to obtain a competitive advantage in science and technology.26 Table
4.13 shows government grants as a percentage of total R&D expenditure. QSTP and Qatar
4-43
University are the two entities that receive 100% of their research grants from the
government. The foreign universities, Texas A&M University and Carnegie Mellon
University, each receive a substantial grant from Qatar Foundation (Qatar National Research
Fund) and these make up exactly 90% and 85% of their R&D budgets respectively.
Surprisingly ictQatar, which is charged with the task of influencing ICT legislation and of
testing and recommending IT solutions, receives the fewest government grant dollars (30% of
its budget) in comparison to its other funding sources.
Table 4.13: Government Grants as Percentage of Total R&D Expenditure
Entity % Grants ictQATAR 30% Qatar Science and Technology Park 100% Texas A&M University 90% Carnegie Mellon University 85% Qatar University 100% Source: Qatar Fieldwork, 2008. Note: the above are all the independent sources of R&D centers surveyed
Another indicator measured was the ratio of global gross expenditure on R&D to total
expenditures. This is an important indicator of nations’ performance in the high-tech race.27
Only six respondents answered this question.
QSTP came in with the highest level of expenditure as it considers 100% of its expenditures
to be contributing to R&D in Qatar. Qatar University spends 2.8% on R&D, which is
considered competitive according to international standards, while Texas A&M University
and Carnegie Mellon University spend a slightly lower percentage of their total expenditures
(2.5% each). Looking at industrial R&D, the study found that energy enterprises, the most
financially able and independent, registered very low ratios (less than 0.5%).
Table 4.14: Ratios of Global Gross Expenditure on R&D to Total Expenditures Entity Ratio of R&D Expenditure Energy Enterprise Number 2740149 0.03% Qatar Science and Technology Park 100% Energy Enterprise Number 2835486 0.30% Texas A&M University 2.50% Carnegie Mellon University 2.50% Qatar University 2.80% Source: Results of Questionnaires calculated using QuestionPro Software
4-44
R&D intensity is often defined as the ratio of a firm’s expenditures on research and
development to its sales. This indicator is a means to measure competitive advantage and
future market returns. Since many industrial enterprises do not spend on R&D, it can be
concluded that the R&D intensity within Qatari industries is very low.
Most industrial respondents did not respond to the question soliciting information about their
relationships with universities or R&D centers. Through interviews, the study found that
there is no real cooperation between the industries and R&D centers. When asked, only a
couple of interviewees answered that R&D centers were located more than 10 kilometers
away. However, Qatar Science and Technology Park regulates six universities’ R&D centers
along with other original equipment manufacturers who conduct research, and all are located
next door to each other except one which is within ten kilometers. In other words, QSTP is
considered the heart of Qatar’s R&D. Three foreign universities’ R&D centers in Qatar are
located next to each other, creating an environment of collaboration among them. Qatar
University, the only national university in Qatar, is located within ten kilometers of QSTP.
Calculating the number of patents a country produces can be used to measure a country’s
progress in or developments in R&D, though it does have its limitations. The study found that
no patents were registered in science and technology. Therefore, the number of patents
generated in science parks as compared to the total number of patents is almost nonexistent.
The American university, Carnegie Mellon, registered 33 patents; however, these were not
registered locally and they were mostly in the field of robotics. In addition, Carnegie Mellon
has already started up 18 ventures and has seven products in development. Again, though,
this is likely due to the experience of personnel brought in by the university and to the fact
that much of this work is an extension of activities done on its main campuses in America,
therefore these patents are not counted in this study. The study did count two startups from
QSTP.
To reach a better understanding of the depth of R&D conducted by local and offshore centers,
the study asked respondents to identify the percentage of research that is classified as having
some degree of commercial viability. Qatar Petroleum responded that its research is 100%
that 75% of their research is commercially viable. IctQatar (30%) and Qatar University (20%)
are involved in developing commercially viable research to a lesser degree.
4-45
Other R&D Indicators
The questionnaire attempted to gather data on some additional R&D indicators, but only three
entities responded: ictQatar, QSTP and Carnegie Mellon University. Table 4.15 shows the
results.
Even those who responded to the R&D indicators question did not complete the table. Only
Carnegie Mellon University mentioned how much of its budget is allocated to R&D. No
respondent recorded the average faculty salary or the royalties paid to R&D staff. The return
on R&D investment was also left blank. Offering minimal input indicates that QSTP needs to
design and update its R&D information database. QSTP only responded to two indicators: the
number of start-ups and the land grant from the government. IctQatar, a telecommunication
legislator in the country, mentioned that it has 5 staff assigned to R&D, made two invention
disclosures, and supports fifty jobs through technology transfer from academic institutions.
Carnegie Mellon mentioned that it has started 18 companies as a result of its R&D. Table 4.15: R&D Technology Transfer Indicators
R&D Indicator ictQATAR QSTP Carnegie Mellon University
R&D Expenditures - - US$ 4.18m Number of R&D Staff 5 - 13 Number of Invention Disclosures 2 - 132 Number of New Patent Applications - - 75 Number of Licenses - - 23 Ratio of Public to Private Universities - - - Return on R&D Investment - - - Number of Start-up Companies - 2 18 Land Grants - 100 - Royalties Paid to R&D Staff - - - Average Faculty Salary - - - Number of Jobs Supported by Technology Transfer from Academic Institutions 50 - -
Source: Results of Questionnaires calculated using QuestionPro Software
Interviews revealed that the government recently started to allocate around 2.8% of its
revenues to research and development. This has taken place following the establishment of
Qatar foundation, QSTP, and the QNRF. In addition, two awards have been established to
encourage researchers in the fields of Islamic studies, humanities, economics, science,
4-46
applied science, and art and literature. In 2007, the expenditure on research and development
was US$ 213 million (0.33% of GDP versus 2.4% average worldwide).
The survey on human development in R&D shows that there are 953 researchers (431 Qatari,
or 45%) or 500 for every million citizens (a mere one tenth of the world's benchmark). The
public sector allocates 96.5% of research funds, while the private sector contributes 3.5%.
This ratio is in contrast to international benchmarks, where the opposite is true. The ratio of
research assistants to researchers is one to one, whereas internationally it is three to one. On
an average, every researcher is allocated US$ 223,000, which is considered a reasonable
amount by international standards. Although the task of developing sustainable scientific and
technological advancements lies with researchers, only 16% of the research conducted in
Qatar is carried out in the field of science and technology with only 11.5% of the researchers
involved. Most researchers are in universities and the public sector. Researchers'
qualifications are distributed as follows: PhDs: 541 (38.3% are Qataris); Masters: 116 (29.3%
Qatari); Bachelors: 296 (64.2% Qatari). This is in contrast to other countries where most
researchers hold PhDs or masters degrees. 28
Table 4.16: Qualifications of Researchers
Qualification Qatari Non-Qatari Total PhDs 190 106 296 Masters 34 82 116 Bachelors 207 334 541 Total 431 522 953
953 Source: Results of Questionnaires calculated using QuestionPro Software Research is absent in the fields of environment engineering, medical engineering, industrial
biotechnology, nanotechnology, and animal science. Most research is focused on
administration, economy, geography, social sciences and the humanities, including
languages, art, literature, history, philosophy and Islamic studies. Comparing this to the
private sectors in Japan and Korea, where 70% of research is in the field of science and
technology, Qatar’s figures pale in comparison.
The general findings on R&D are in line with the secondary research conducted in chapter
three and reveal the fact that Qatar still has a shortage of skilled workers in the R&D field,
which puts limitations on developing the country’s R&D capabilities. These findings also
conform to the data provided by the GCI in Table 4.17, discussed in the next section.
4-47
4.5.7 Competitiveness
A country’s competitiveness rests on its ability to prosper and provide social benefits to its
citizens. Competitiveness is defined as “the set of institutions, policies, and factors that
determine the level of productivity of a country.”29
Competitive economies produce higher
incomes and determine the rates of investment returns. A more competitive country will grow
faster in the medium and long terms. Economists from the Adam Smith era to today have
tried to determine what makes a country competitive and they have all found that it is a
complex issue; there are multiple measurements of competitiveness that must be taken into
account. The World Economic Forum (WEF) bases its competitiveness analysis on the
Global Competitiveness Index (GCI), an index that measures national competitiveness at the
national and institutional levels.
Since the WEF measures are at the national level and compared globally, this chapter will
make use of available data from the WEF report as benchmarks to assist in the analysis of the
results presented here, which are at the level of individual enterprises. Therefore, some WEF
measures related to competitiveness will be used for comparison in this section, and other
WEF benchmarks will be used for the findings related to absorptive capacity, R&D, value
chain and value networks.
According to the GCI, Qatar’s competitiveness has been showing a robust upward trend. It
ranked 26th overall in 2008-09 (a rank of 1 means the best country), which represented a
move upward of 5 places compared to the previous year’s ranking. This gain is most likely
due to the development of the financial markets and the educational system. However, the
2008-09 report also criticized the low tertiary enrollment and the low rate of female
participation in the labour market. It also warned against the rising inflation: the inflation rate
in Qatar reached 14% in 2007, causing Qatar to rank 129th out of 134 countries on this
indicator.
This study drew a selection of measures related to technology transfer from the WEF report
and tabulated them in Table 4.17. In short, the data in the table suggests that technology has
been imported but not absorbed. In fact, these measures reveal many positive signs of
importation, such as the procurement of advanced technology products, FDI and technology
4-48
transfer, and the quality of the education system, particularly in math and science. The data
also suggest that there are quality R&D institutions and university-industry research
connections in Qatar, but on the other side, there is an inadequate number of scientists and
engineers and the capacity for innovation is lagging. The government laws and regulations
encourage science and technology transfer, but the business rules inhibit FDI and thus,
foreign footprints in this field are scarce. Table 4.17: Measures Related to Technology Transfer in Qatar No. Measure Rank out of 134
1 Property rights 31 2 Intellectual property protection 35 3 Quality of overall infrastructure 40 4 Quality of the educational system 16 5 Quality of math and science education 12 6 Local availability of research and training services 45 7 Intensity of local competition 53 8 Effectiveness of anti-monopoly policy 47 9 Prevalence of foreign ownership 97
10 Impact of business rules on FDI 71 11 Female participation in labour force 125 12 Availability of latest technologies 32 13 Firm-level technology absorption 40 14 Laws relating to ICT 33 15 FDI and technology transfer 11 16 Local supplier quality 72 17 State of cluster development 33 18 Nature of competitive advantage 36 19 Value chain breadth 43 20 Production process sophistication 29 21 Capacity for innovation 60 22 Quality of scientific research institutions 30 23 Company spending on R&D 35 24 University-industry research collaboration 25 25 Gov’t procurement of advanced tech products 9 26 Availability of scientists and engineers 53
Source: World Economic Forum. Global Competitiveness Index. 2008-2009. Edited by Porter M., Schwab K. Geneva, Switzerland, 2008. p 285
Rather than rely solely on the GCI index, it makes more sense to assign two indexes to
measure competitiveness here: one that accounts for technology supply and another that
measures technology absorption. According to the above, technology supply ranks with the
developed countries and technology absorption ranks with the countries under development.
4-49
Next, the study will assess the findings related to marketing competitiveness and major firm
activities in an attempt to add more elements to the measures within the GCI index and then
will compare these with related measures.
Marketing Strategy
The marketing strategy portion of the survey revealed some interesting practices. The most
frequently used strategy among commercial enterprises surveyed - particularly those in the
energy sector and those offering oil and gas related products - focuses on increasing capacity
to reduce costs and compete globally (24%), see Table 4.18. Around 12% of the companies
selected “supply chain management” and “agreements and joint ventures” as strategies
employed. Supply chain management involves enhancing logistics efficiency and
effectiveness through improving warehousing, building offshore terminals for degasification,
or improving shipping methods for LNG transportation. The “agreements and joint ventures”
category covers practices like establishing networks and encouraging FDI, development,
sharing, and shipping agreements. “Quality” and “building human capacity” both ranked
third, each with a 9% rating.
Table 4.18: Marketing Strategies of Qatar's Major Industries
Marketing Strategy percentage Economy of Scale 24% Supply Chain Management 12% Agreements and Joint Ventures 12% Quality 9% Human Capacity 9% Improved Regulation 5.5% Ads 5.5% Monopoly 5.5% Nationalism 5.5% Diversification 5.5% Spot Markets 5.5% Source: Calculated using results in Questionnaires
Participants were offered the opportunity to write in strategies that were not represented on
the survey, and these write-in answers proved interesting. The most interesting marketing
strategies listed were “focus on nationalism,” “spot markets” and “monopoly.” Nationalism
was reflected in reforms like "Education for a New Era," "the Promise of e" of ictQatar, and
also in “satisfying citizens’ needs.” “Spot market” refers to a place where goods are sold for
cash and delivered immediately. Some enterprises, such as the communication service sector
4-50
and parts of the industry sector were sole players in the local market and therefore, have no
competitors. Thus, maintaining their monopoly bolstered their sales.
Responses to the question regarding major marketing focus are displayed in Figure 4.17. It is
evident that the majority of enterprises focus on increasing sales by increasing production or
using other means (41%). The respondents in this category indicated that their industries
focus on increasing production capacity, reducing production costs, expanding the market or
using long-term marketing efforts in order to maximize their returns.
The second most important focus was on legal issues, safety and security. Some respondents
stressed attention to the regulation of their industries, while others discussed the need for
security, and still others focused on the economic environment and sustainability.
The third most important area of focus, at 11%, was building human capacity. Businesses
indicated that they targeted enhancing local skills, increasing competency, promoting
Qatarization, and building leadership capacity.
Figure 4.17: Major Three Activities Attracting Enterprise Focus
Source: Qatar Fieldwork, 2008
The fourth most important domain was building infrastructure and networking. Respondents
focused on network-centric operations, IT infrastructure projects, cooperation with other local
12
55
77
9
25
Service QualityEffieicent Supply Chain Management
Research and Development
Developing Process
Efficiency
Infrastructure & Integration
Building Human
Capacity
Legal, Safety and Security
Sales & Production
Increase
Major Activities
4-51
enterprises, FDI, SMEs, and global market integration. A few respondents focused on
developing process efficiency (8.2%) and R&D (8.2%). Supply chain management and
service quality scored the least, at 3.3% and 1.6% respectively.
From the above, it is apparent that the energy market in Qatar is very competitive and uses
economy of scale strategies to reduce cost and increase sales. This strategy is supported by
government regulations that protect industrial products. Other strategies are used far less
frequently, such as building human capacity and R&D.
4.6 Chapter Four Summary
The gathering and analysis of data in this chapter is more accurate than that done by
international bodies tasked with similar assignments, such as the WEF’s Global
Competitiveness Index, ITU’s Information Development Index or the UN’s Human
Development Index, for two reasons. First, when analyzing the workforce, these international
organizations do not differentiate between permanent citizens and temporary immigrants.
Second, international reports treat the subject technology transfer abstractly, without the
depth presented in this chapter.
With regard to the first point, the Qatari population is much smaller than the current
population; in fact, it is as low as 15% of the total population. This difference is readily
apparent in Qatar’s labour market, where foreign workers dominate every sector. One can
imagine that when the aggregate population is surveyed, the results will be skewed.
Moreover, international reports do not assess whether or not development plans will improve
the local human capital.
With regard to the depth of analysis, international organizations do analyze the environment,
innovation, technology, and human development, but the indicators used do not cover
absorptive capacity indicators, value chain, and value networks, which are important because
they allow an overall visualization of the current situation and present enough information for
the decision maker to plan a sound development strategy.
The findings in this dissertation have been in harmony with all of the findings in international
reports and have added much more depth to them using simpler methods. To some extent,
this has increased the researcher’s confidence in the methods used and has allowed for
4-52
generalization of the findings. Chapter five will conduct an in-depth analysis in order to
establish a framework for technology transfer effectiveness indicators.
4-53
References and Notes
1 Fransman M. Technology and economic development. Brighton: Wheatsheaf; 1986. 2 Petroleum and Industrial Statistics 2006. Annual statistics abstract. The Planning
Council. September 2006. p. 272. 3 Oxford Business Group. The report: Qatar 2008. London: OBG; 2008.
4 Yin R. Case study research: design and methods. 2nd edition. Thousand Oaks, California: Sage; 1994.
5 McMillan J. Educational research: fundamentals for the consumer. 4th edition. New York: Allyn and Bacon; 2004.
7 Heidegger M. Being and time. Oxford: Blackwell; 1962. 8 Heideggerian K. Phenomenology: an approach to understanding family caring for an
older relative. Nursing Inquiry. 1997; (4): 57-65. 9 Van der Zalm J, Bergum V. Hemeneutic phenomenology: providing living
knowledge for nursing practice. Journal of Advanced Nursing. 2000; 31(3): 211-218. 10 The Planning Council. Annual Abstract 2006: Population. [online]. [cited 30 March
2008]. Available at: http://www.planning.gov.qa/Pup_Statistics_chap_2006.htm 11 Al-Ibrahim I. Inflation . Al-Watan. Issue 4530; 29 Jan 2008. 12
Healey M, Rawlinson M. Interviewing techniques in business and management research. In Saunders M, Lewis P, Thornhill A. Research methods for business students. Harlow: Pearson Education; 2003.
13 Easterby-Smith M. et al. Management Research. 2nd edition. London: Sage; 2002. p.
274. 14
Ghauri P, Gronhaug K. Research methods in business studies: a practical guide. 2nd edition. London: Prentice Hall Europe; 2002.
15 Tsai M, Shih C. The impact of marketing knowledge among managers on marketing
capabilities and business performance. International Journal of Management. 2004; 21(4): 524.
16 Teece, David J, Pisano G, Shuen A. Dynamic capabilities and strategic management. Strategic Management Journal. 1997; 18(7): 509-33. Also see, Juga J. Generic capabilities: combining positional and resource-based views for strategic advantage. Journal of Strategic Marketing.1999; 7: 3-18.
17 Al-Rabea’a M. “Cultural issues.” Al-Watan Newspaper. Issue 4897; 29th Jan 2009. p. 1.
18 International Telecommunication Union. Measuring the information society: the ICY
development index. Geneva, Switzerland: ITU; 2009. p 22. 19
20 General Secretary for Development Planning. Gross domestic product. GSDP.
[online].[cited 13 June 2009]. Available at: http://www.qsa.gov.qa/Eng/gdp.htm 21 Data Monitor. Global energy: industry profile. Reference Code: 0199-2051. London:
Charles House; March 2009. 22
Cohen D, Prusak L. In good company, how social capital makes organizations work. Boston: Harvard Business School Press; 2001. p. 10.
23 Scott W. Institutions and organizations. 2nd edition. Thousand Oaks, California: Sage
Publications; 2001. 24
Douglas M. How institutions think. New York: Syracuse University Press; 1986. 25
North D. Institutional change and economic performance. Cambridge: Cambridge University Press; 1990.
26 OECD Factbook 2009. Economical, environmental and social statistics. Paris: OECD
Publishing; 2009. p. 164. 27 Gannon F. Government rhetoric and their R&D expenditure. EMBO reports 4, 2,
117–120 (2003). [online].[cited 11 June 2009]; Available at: http://www.nature.com/embor/index.html
28 Since the survey scope did not cover all public sectors, this portion of the survey was extracted from another research. Source: Ref 17 above.
29 World Economic Forum. Global competitiveness index, 2008-2009. Porter M, Schwab K, editors. Geneva, Switzerland: WEF; 2008. p 3.
Al-Sheikh T. “Qatar celebrates its ISO 9001:2008.” Economic section, Al-Raya
Newspapre, 9992, 15 September 2009.
SURVEY
A-1
Appendix A:
TECHNOLOGY TRANSFER EFFECTIVENESS IN QATAR
QUESTIONNAIRE (Original)
TECHNOLOGY TRANSFER EFFECTIVENESS IN QATAR Dear Respondent, The aim of this research of the dissertation is confined to an analysis of government agencies involved in technology transfer such as industries, universities and the Government sector. The ultimate objectives of the study are to: • Establish measures of technology transfer • Provide an up-to-date assessment of technology transfer in Qatar • Suggest policies for implementation in industries, government sectors, and R&D laboratories in Qatar related to technology transfer and sustainable development You have experience of considerable value to this study and I need to know your views on what it takes to manage change. I am aware of the need to treat the findings with the utmost confidentiality. No source, individual or organizational will be identified or comment attributed without the express permission of the originator. I hope you are able to contribute your help and should be pleased to receive any information or clarifications requests. Please do not hesitate to get in touch. Sincerely, Rashid Ali Mohammed Al-Saadi S. Brig Engg DIS, QAF PO Box 11711 Doha – Qatar +974 5509123 +974 4650915 Email: [email protected]
General Information
Respondent Name =
Position =
Department=
Organization=
Mobile=
email=
Office Tel=
Fax=
Year Established
SURVEY
A-2
Type of Ownership
sole proprietorship
partnership
limited partnership
limited liability company
corporation
nonprofit corporation
cooperative
Local or Foreign Establishment
Local Foreign Mixed
SURVEY
A-3
Section 1: External Resources Q.1 What are your sources of technology transfer?
Technology acquisition
Licensing
Joint venture
Foreign Direct Investment
Purchase of corporations
Sale of technology data
Technical personnel
offset programmes
Total project contracting
Total process contracting
Major process contracting
Know-how contracts
Patent contracts
Trademark agreements
Franchise agreement
Engineering services contracts
Technical consultancy contracts
Purchasing machinery supplies
Employment of experts
Use of technical publications
Use of personal contacts
Others, (Please indicate strategy):
SURVEY
A-4
If you market products or services, what is the strategy/ies followed?
Participation in Research Centers
Sales of Patents
Sales of Copyrights
Sales of Licenses
On-site seminars and conferences (seminars)
Fliers, newsletters, or other mailed correspondence (mail)
Person-to-person contacts of our scientific and technical personnel with persons in technology-recipient organizations (contacts)
Presentations at scientific meetings sponsored by professional organizations (professional conferences)
Presentations at scientific meetings sponsored by government organizations (government conferences)
Membership in research consortia, university, or government centers (consortium)
A central office with responsibility for technology transfer (office)
Encouraging informal, on-site visits (visits)
Personnel exchanges (exchange)
Cooperative R&D (as a technology transfer strategy, rather than other possible purposes)
Contractual relations for direct R&D funding between a lab and the organization receiving the technology (contract)
Permitting persons from other organizations access to a laboratory's equipment and facilities (equipment access)
Others, (Please indicate strategy):
Section 2: Your Organization
Q.3 What is the number of technology transfer projects currently underway that should diffuse unavailable technology in the organization?
Q.4 What is the number of licenses signed for external technology in the last year?
Q.5 Rate the success of the new technology at meeting its intended requirements.
Success
Partial success
Failure
Q.6 How do you rate the efficiency of the organization information scanning systems?
Optimal
Advantageous
Useful
Not useful
SURVEY
A-5
Q.7 What is the percentage of new products using technology developed outside the organization?
Q.8 What is the percentage of sales due to products using technology developed outside the organization?
Q.9 What is the profitability of products (as percentage of all profits) due to products using technology developed outside the organization?
Q.10 Rate the degree of understanding within the organization of the technology-transfer process.
Novice
Intermediate
Advance
Q.11 Rate the success of the organization at producing ultimately successful projects (i.e. on time, within budget, meeting specified requirements, accompanied by full documentation.
Successful
Partially successful
Failure
Q.12 Rate the of successful team-working.
Successful
Partially successful
Failure
Q.13 Rate the internal communication
Successful
Partially successful
Failure
Q.14 Rate the staff morale.
Highly motivated
Motivated extrinsically
Complacent
SURVEY
A-6
Q.15 There are several factors that hinder the process of technology transfer or cause projects to fail. Please select those that you think are a barrier to your business and rank them top- down.
Lack of awareness: many organizations are not aware of available technology.
Lack of knowledge: if an organization is short of skills and knowledge, it may be unable to use the technology offered.
Lack of funds: organizations may be unable to purchase or develop technology.
Lack of common interest: organizations may exhibit a lack of motivation to reach agreement or settle differences of opinions about available options.
Conflict of interest: competing organizations may be unwilling to collaborate.
Poor coordination: individuals within an organization or collaborating organizations fail to effectively coordinate about activities, processes, goals and directions of the venture.
Lack of resources: this can include both physical resources and loss of a key member.
Lack of time.
Lack of trust.
Technical problems
Changes in the project structure
Organizational problems
Management attitudes
R&d effectiveness
Short-term pressure
Resistance to change
Poor information flow
Weak links between customers and suppliers
Dependency on public r&d institutions
Cultural differences
Geographic difference
Legal constraints
Administrative burdens
SURVEY
A-7
Section 3: Competitiveness
Q.16 Please evaluate from your perspective the effectiveness of methods for learning about competitors’ innovations by indicating a value from 1, not at all effective to 7, very effective)
Processes Products
Consultation with employees of the innovative organization
Independent R&D
Patent disclosures
Reverse engineering
Licensing
Hiring employees from innovation organizations
Publications or open technical meetings
Q.17 What are the major three activity fields this institution is focusing on?
Q.18 What is the organization's type of management?
Public
Private
Other
Section 4: Absorptive Capacity
Q.19 What is the information and communication technology budget as a percent to the organization annual budget?
Q.20 What is the amount of Sales by product?
Annual sale volume (in 000 USD)
Product (A)
Product (B)
Product (C)
Product (D)
SURVEY
A-8
Q.21 Refering to Ansoff's product market growth mix, Where do you place your products? for more information on the Matrix see: http://en.wikipedia.org/wiki/Product-Market_Growth_Matrix
Market Penetration Market development Product development Diversification
Product (A)
Product (B)
Product (C)
Product (D)
Q.22 What is the amount of annual sales by service?
Annual sale volume (in 000 USD)
Service (A)
Service (B)
Service (C)
Service (D)
Q.23 If you deal with Services, where do you place your services on Ansoff Matrix?
Market Penetration Market development Service development Diversification
Service (A)
Service (B)
Service (C)
Service (D)
Q.24 What are your three recommendations to drive market plans to success?
Q.25 What is your organization's Rate of Investment? Use this formula:ROI=((Gain from Investment - Cost of Investment))/(Cost of Investment)
Q.26 What is the organization's Liquidity Ratio (if applicable)? Use the formula of current assets / current liabilities
SURVEY
A-9
Q.27 What is the Return on Marketing Investment ROMI? Use ROMI=(Annual Revenues)/(Annual Marketing Expenditure)
Q.28 List the number of employee with respect to their qualifications in the grid below.
Number of employees
PhD degree
Masters Degree
Bachelor Degree
Higher Diploma
Diploma
Secondary Level
Below secondary
No qualifications
Q.29 What is the employee turnover rate?
Q.30 What is the average training expenditure per employee?
Q.31 What is the return on human investment ratio? Use the formula HIR= Revenue – (cost-total remunerations)/ total remuneration
Q.32 Does the organization apply International Quality standards?
Yes
No
If Yes, please list the Accreditation body
SURVEY
A-10
Q.33 What percentage of your employees has access to the internet from their desks?
100%
75%- 99%
50%-74%
25%-49%
10%-24%
Less than 10%
Q.34 If your organization uses the internet, do you use it for
Yes No
Email
Research
Selling
Q.35 Does your organization have a homepage site on the internet?
Yes
No
Q.36 What is your maximum capacity compared to your actual output? Maximum Capacity =
Actual Output =
Q.37 Does the tendering regulation enhance the internal business operation of our organization?
Yes
No
Q.38 For the past one year, how many surveys were conducted to elicit customer satisfactions on…
Number of surveys
Product / service quality?
Delivery?
Staff service?
Organization's reputation?
Price value for money?
SURVEY
A-11
Section 5: Value Networks
Q.39 If your organization engages in cooperative agreements, please indicate the level reached with each agreement between your organization and the overseas or local R&D institution.
Number of R&D institutions
Networking: little communication
Cooperation: formal communication and exchange of information
Coordination: shared information and decision making
Coalition: shared resources and frequent prioritized communication
Collaboration: members belong to one system and census is reached on all decisions
Q.40 How many cooperative agreements do you have with
Number of cooperative agreements
Small and Medium Enterprises
Larger Organizations
Other R&D institutions
Q.41 How well is the organization leveraging the followings?
High value Medium value Low value
The financial and non-financial assets
Converting a competitors ideas into value added
Contribute ideas to other business partners
Access to ideas for other partners
Convert competitors intelligence into tangible value
Value output perceived by the recipient
Q.42 What variables, properties, or constraints might be affecting a participant’s ability to create or add value?
SURVEY
A-12
Section 6: Organizational Culture
Q.43 Our organizational Culture is:
Innovative
Supportive
Bureaucratic
Effective
Q.44 Our organization runs its business through a culture of:
Managing
Leading
Performance oriented
Success oriented
Q.45 Technology diffusion channel here is:
Formal
Informal
Q.46 The interaction mechanism is:
Intra-organization
Inter-organization
Q.47 The technology transfer source is mainly:
Assets (Hardware, Software)
Capability
Q.48 The R&D sources here is:
Human resources
Ambitious of R&D staff
Experience
Staff
Administrative support
Q.49 Technology absorptive ability adopted is:
Adaptation
Application
Production
SURVEY
A-13
Q.50 Our organization has a leadership development programme
Yes
No
Q.51 The training is relevant to employee job and his level of expertise.
Yes
No
Q.52 After such training, employees immediately put what they learned into action
Yes
No
Q.53 After each training programme, trainees evaluate officially the programme then the training department takes action based on such feedback.
Yes
No
Q.54 Employee performance review is the base for selecting a training program for the employee.
Yes
No
SURVEY
A-14
Q.55 Rate the atitude of your organization. 1=Strongly disagree 7=Strongly Agree
1 2 3 4 5 6 7
The trainee expects that the skills, knowledge and competencies acquired will be relevant for his/her job performance and career development.
The trainees receive the rewards as a result of their applying on their jobs the skills, knowledge, and competencies acquired in the programs.
Trainees are motivated to learn in a program.
The employees have the Opportunity to transfer their skills on their jobs
Our employees discuss new practices with their colleagues to promote the adoption of new ways to do our jobs
Our employees are always happy to tell their colleagues of their involvement in finding new ways to do things.
We check on the reputation of others providing us with information before we try to adopt new ways of doing things
To protect our reputation, we share information cautiously with others regarding new ways of doing things.
There is significant cooperation and collaboration among employees across functional roles
The number of years an employee worked in an organization and in a department
When we adopt new ways of doing things, we are in constant contact with workers in other areas.
Before we adopt new ways of doing things, we retrain our employees in the necessary skills
Section 7: Research & Development Q.56 Does your organization allocate any resources (funds, time or effort) to research and development (R&D)?
Yes
No
Q.57 What Percentage of Research is classified as having some degree of commercial viability?
Q.58 Generally, investment in manufacturing is directed towards national priorities.
Yes
No
Q.59 What is the Government grants as percentage of total R&D expenditure?
Q.60 What is the ratio of global gross expenditure on R&D to total expenditure?
SURVEY
A-15
Q.61 Please indicate the proximity to other universities or R&D centers
Number of Universities/ R&D centers
Next door
Within5 kilometers
Within 10 kilometers
More than 10 kilometers
Q.62 This question is only for Science Parks or independent R&D institutions: please fill in the table below:
Number
Number of patents generated in science parks as compared to the total number of patents
Number of scientific and technical publications
Number of startups
Number of products in development
Number of products in the market
Q.63 Fill in the Technology Transfer Indicators below:
Number/ value
R&D Expenditure
Number of Staff In R&D
Number of Invention Disclosures
Number of new patent application
Number of Licenses
License income
The Ratio of Public To Private Universities
Return On R&D Investment
Number of start-up companies
Land Grants
Royalties Paid To R&D Staff
Average Faculty Salary
Number of jobs, supported by technology transfer from academic institutions
Number of technology licenses to small companies
SURVEY
A-16
Q.64 The number of faculty staff in this institution is:
Number
Professor
Assistant Professor
Lecturer
Teaching Assistant
Associate Professor
SURVEY
B-1
Appendix B:
TECHNOLOGY TRANSFER EFFECTIVENESS IN QATAR
QUESTIONNAIRE (Revised After Pilot Test)
Text of the Letter
TECHNOLOGY TRANSFER EFFECTIVENESS IN QATAR
Dear Respondent,
The aim of this research of the dissertation is confined to an analysis of government agencies involved in technology
transfer such as industries, universities and the Government sector. The ultimate objectives of the study are to:
• Establish measures of technology transfer
• Provide an up-to-date assessment of technology transfer in Qatar
• Suggest policies for implementation in industries, government sectors, and R&D laboratories in Qatar related to
technology transfer and sustainable development
You have experience of considerable value to this study and I need to know your views on what it takes to manage
change.
I am aware of the need to treat the findings with the utmost responsibility. No source, individual or organizational will be
identified or comment attributed without the express permission of the originator.
I hope you are able to contribute your help and should be pleased to receive any information or clarifications requests.
Q.2 If you market products or services, what is the strategy/ies followed?
Others, (Please indicate strategy):
Section 2: Your Organization
Q.3 What is the number of technology transfer projects currently underway that should diffuse unavailable technology in the organization?
Q.4 What is the number of licenses signed for external technology in the last year?
Q.5 Rate the success of the new technology at meeting its intended requirements.
Success
Partial success
Failure
Q.6 How do you rate the efficiency of the organization information scanning systems?
Optimal
Advantageous
Useful
Not useful
Q.7 What is the percentage of new products using technology developed outside the organization?
Q.8 What is the percentage of sales due to products using technology developed outside the organization?
Q.9 What is the profitability of products (as percentage of all profits) due to products using technology developed outside the organization?
SURVEY
B-4
Q.10 There are several factors that hinder the process of technology transfer or cause projects to fail. Please select those that you think are a barrier to your business and rank them top- down.
Lack of awareness: many organizations are not aware of available technology.
Lack of knowledge: if an organization is short of skills and knowledge, it may be unable to use the technology offered.
Lack of funds: organizations may be unable to purchase or develop technology.
Lack of common interest: organizations may exhibit a lack of motivation to reach agreement or settle differences of opinions about available options.
Conflict of interest: competing organizations may be unwilling to collaborate.
Poor coordination: individuals within an organization or collaborating organizations fail to effectively coordinate about activities, processes, goals and directions of the venture.
Lack of resources: this can include both physical resources and loss of a key member.
Lack of time.
Lack of trust.
Technical problems
Changes in the project structure
Organizational problems
Management attitudes
R&d effectiveness
Short-term pressure
Resistance to change
Poor information flow
Weak links between customers and suppliers
Dependency on public r&d institutions
Cultural differences
Geographic difference
Legal constraints
Administrative burdens
Section 3: Competitiveness
Q.11 What are the major three activity fields this institution is focusing on?
SURVEY
B-5
Q.12 What is the organization's type of management?
Public
Private
Other
Section 4: Absorptive Capacity
Q.13 What is the information and communication technology budget as a percent to the organization annual budget?
Q.14 What is the amount of Sales by product?
Annual sale volume (in 000 USD)
Product (A)
Product (B)
Product (C)
Product (D)
Q.15 What are your three recommendations to drive market plans to success?
Q.16 List the number of employee with respect to their qualifications in the grid below.
Number of employees
PhD degree
Masters Degree
Bachelor Degree
Higher Diploma
Diploma
Secondary Level
Below secondary
No qualifications
SURVEY
B-6
Q.17 What is the average training expenditure per employee?
Q.18 What percentage of your employees has access to the internet from their desks?
100%
75%- 99%
50%-74%
25%-49%
10%-24%
Less than 10%
Q.19 If your organization uses the internet, do you use it for
Yes No
Email
Research
Selling
Q.20 Does your organization have a homepage site on the internet?
Yes
No
Q.21 Does the tendering regulation enhance the internal business operation of our organization?
Yes
No
Q.22 For the past one year, how many surveys were conducted to elicit customer satisfactions on…
Number of surveys
Product / service quality?
Delivery?
Staff service?
Organization's reputation?
Price value for money?
SURVEY
B-7
Section 5: Value Networks
Q.23 If your organization engages in cooperative agreements, please indicate the level reached with each agreement between your organization and the overseas or local R&D institution.
Number of R&D institutions
Networking: little communication
Cooperation: formal communication and exchange of information
Coordination: shared information and decision making
Coalition: shared resources and frequent prioritized communication
Collaboration: members belong to one system and census is reached on all decisions
Q.24 How many cooperative agreements do you have with
Number of cooperative agreements
Small and Medium Enterprises
Larger Organizations
Other R&D institutions
Q.25 What variables, properties, or constraints might be affecting a participant’s ability to create or add value?
Section 6: Organizational Culture
Q.26 Our organizational Culture is:
Innovative
Supportive
Bureaucratic
Effective
Q.27 Our organization runs its business through a culture of:
Managing
Leading
Performance oriented
Success oriented
SURVEY
B-8
Q.28 Technology diffusion channel here is:
Formal
Informal
Q.29 The interaction mechanism is:
Intra-organization
Inter-organization
Q.30 The technology transfer source is mainly:
Assets (Hardware, Software)
Capability
Q.31 The R&D sources here is:
Human resources
Ambitious of R&D staff
Experience
Staff
Administrative support
Q.32 Technology absorptive ability adopted is:
Adaptation
Application
Production
Q.33 Employee performance review is the base for selecting a training program for the employee.
Yes
No
Section 7: Research & Development
Q.34 Does your organization allocate any resources (funds, time or effort) to research and development (R&D)?
Yes
No
Q.35 What Percentage of Research is classified as having some degree of commercial viability?
SURVEY
B-9
Q.36 Generally, investment in manufacturing is directed towards national priorities.
Yes
No
Q.37 What is the Government grants as percentage of total R&D expenditure?
Q.38 What is the ratio of global gross expenditure on R&D to total expenditure?
Q.39 Please indicate the proximity to other universities or R&D centers
Number of Universities/ R&D centers
Next door
Within5 kilometers
Within 10 kilometers
More than 10 kilometers
Q.40 This question is only for Science Parks or independent R&D institutions: please fill in the table below:
Number
Number of patents generated in science parks as compared to the total number of patents
Number of scientific and technical publications
Number of startups
Number of products in development
Number of products in the market
Q.41 Fill in the Technology Transfer Indicators below:
Number/ value
R&D Expenditure
Number of Staff In R&D
Number of Invention Disclosures
Number of new patent application
Number of Licenses
License income
The Ratio of Public To Private Universities
Return On R&D Investment
Number of start-up companies
Land Grants
Royalties Paid To R&D Staff
SURVEY
B-10
Average Faculty Salary
Number of jobs, supported by technology transfer from academic institutions
Number of technology licenses to small companies
Q.42 The number of faculty staff in this institution is:
Number
Professor
Assistant Professor
Lecturer
Teaching Assistant
Associate Professor
THANK YOU FOR YOUR COOPERATION IN COMPLETING THE QUESTIONNAIRE
C-1
Appendix C:
QUESTIONPRO SCREENSHOTS OF THE QUESTIONNAIRE
First Screen
C-2
A Sample of Question Types
INTERVIEW
D-1
Appendix D:
TECHNOLOGY TRANSFER EFFECTIVENESS IN QATAR
INTERVIEW QUESTIONS
General Information
Respondent Name =
Position =
Department=
Organization=
Mobile=
email=
Office Tel=
Fax=
Year Established =
Type of Ownership =
Local or Foreign Establishment =
INTERVIEW
D-2
Interview Questions
Q1. What are the challenges facing your organization that influences technology transfer?
Guide the interviewee to sources of technology transfer: rating new technology success, rating organization
information scanning systems, percentage of new products using foreign technology sales due to products
using foreign technology, profitability of products using foreign technology degree of understanding of the
technology-transfer, barriers to technology transfer and current number of technology transfer projects.
Q2. How dependent is your production on foreign technology? What are you doing about it?
Guide the interviewee to assess allocation of resources to research and development, percentage of
commercially viable research, Recommendations to drive market plans to success, return on human investment


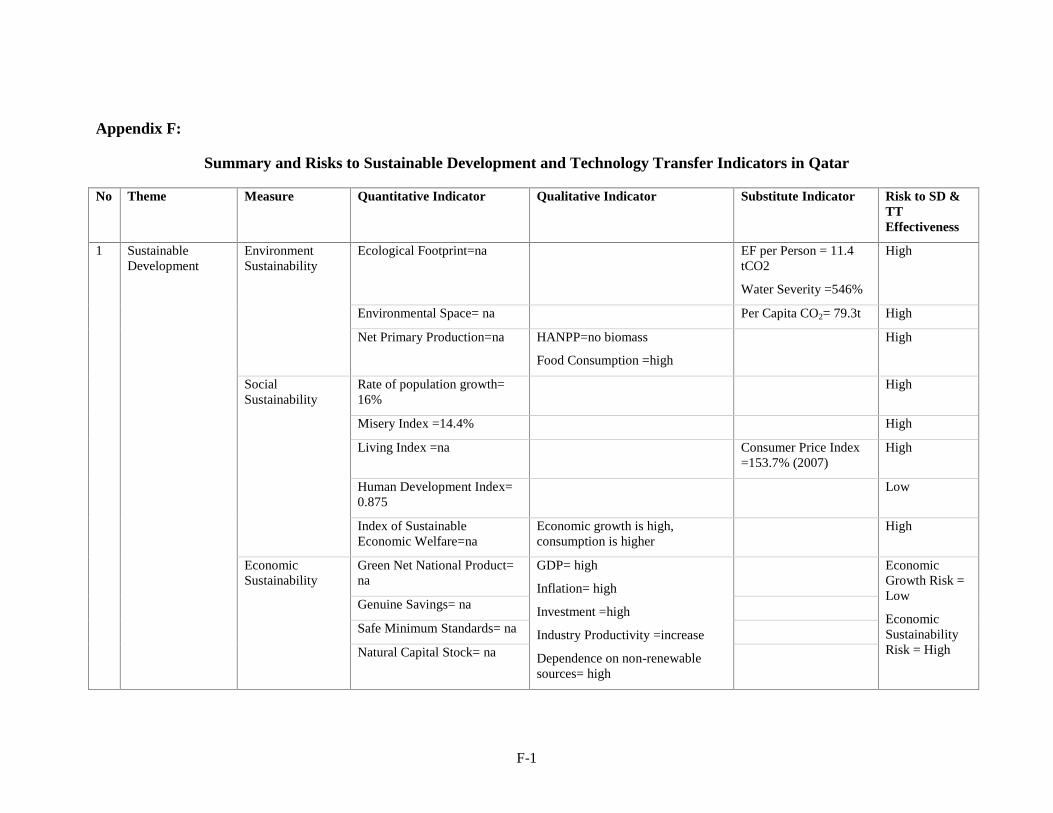


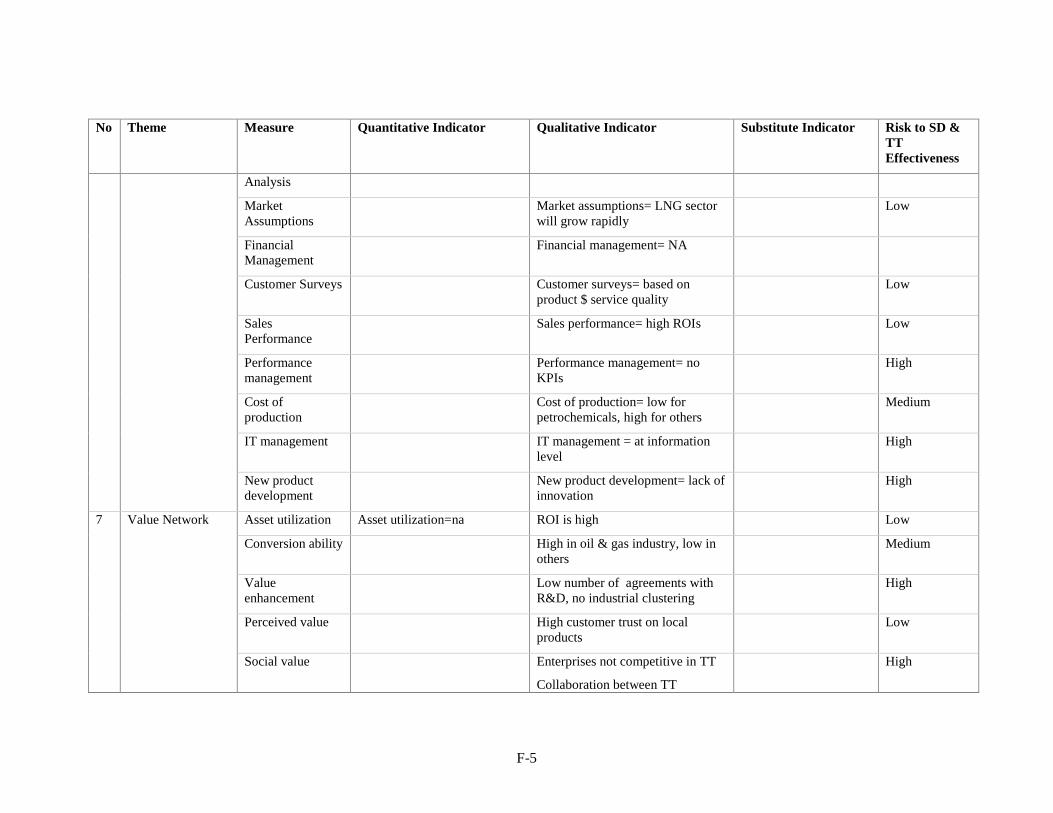


![Bostan'e Saadi [Urdu]](https://static.documents.pub/doc/80x56/577c7a831a28abe05495724e/bostane-saadi-urdu.jpg)


