Lake, Oregon -589 m deep and possibly the clearest lake in the worl rency up to 90 m. line very deep for its size ed plants. sn’t accumulate on the bottom till > 90 m depth the most spectacular tectonic lakes are formed in volcanic craters Why is this lake so different from most lakes?
Transcript
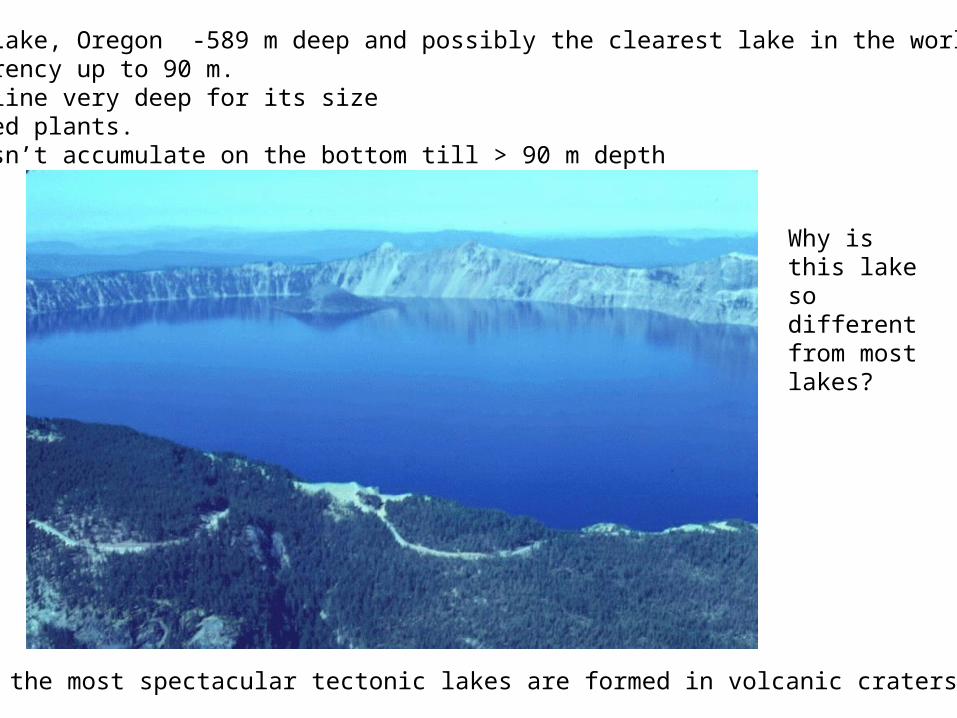
Crater Lake, Oregon -589 m deep and possibly the clearest lake in the world, Transparency up to 90 m.Thermocline very deep for its size No rooted plants. Mud doesn’t accumulate on the bottom till > 90 m depth
Some of the most spectacular tectonic lakes are formed in volcanic craters.
Why is this lake so different from most lakes?
Physical features of lakes that determine habitat characteristics
•inflow from the watershed/Catchment
•Water residence time
•Morphometry, Mean depth and volume
•Thermal stratification and physical mixing
•wind./currents/wave action
•Sediment deposition
•Light extinction
Assume runoff coefficient of 0.15 m
Drainage area=7.9 km2
Lake area=0.9 km2
How much waterwould you expect flows into this lake /yr?
How much water flows into lake Beauvais lake in a year from its watershed?
Evaporation from lake surface exceeds precipitation by0.085 mm/yr
How much water flows out of the lake?
Assume runoff coefficient of 0.15 m
Drainage area=7.9 km2
Lakearea=0.9 km2
How much water would you expect flows into this lake /yr?
P─ E on lake surface= ─ 0.085 m/yr
Qi = r * DA = 0.15 m/yr * 7 x 10⁶ m2 = 1.05 x 10⁶m3/yr
What is the net evaporation in a year?(P-E)*A = ─ 0.085 m * lake area = ─ 0.085m/yr * 9 x 10⁵ m2 = -7.65 x 10⁴ m3/yr
How much water flows out of the lake in a year?
Qo = Qi + (P-E)*A = 1.05 x 10⁶m3/yr + (─ 7.65 x 10⁴ m3/yr) = 9.75 x 10⁵ m3/yr
tL
tL
V
Qh
AEPQQ
Q
Q
Q
Vt
tL
L
Q
V
i
io
i
o
iow
w
1/ units,
lake thefill inflow can theyear a many times How
rate, renewalor flushing is inverse eapproximat The
lake theinto watershedfrom dischargemean
lake theofout dischargemean
timerenewal ,/
units ,
it. entering e water wernew no if
lake theofout drain to volumeentire for the it take wouldlong How
units) (time timeresidenceWater
3
3
3
3
Definition of water residence time and flushing rateChapter 4
Lake Area = 0.9 km2
Mean depth= 4.3 m
Lake Volume = 3.8 x 10⁶ m3
Water residence time=Mean renewal rate=
yryrm
m
Q
V
ow 9.3
107.9
108.3135
36
136
136
28.0108.3
1005.1
yr
m
yrm
V
Qh
i
Water residence time
Mean flushing rate
Lake Area = 0.9 km2
Mean depth= 4.3 m
Lake Volume = 3.8 x 10⁶ m3
Water residence time=Mean renewal rate=
How much of the water flowing into this lake from its watershed could you allocate for irrigation before the lake would gradually begin to disappear?
Answer Over 92%
Lake management—the water inflow budgetor what happens when you over allocate?
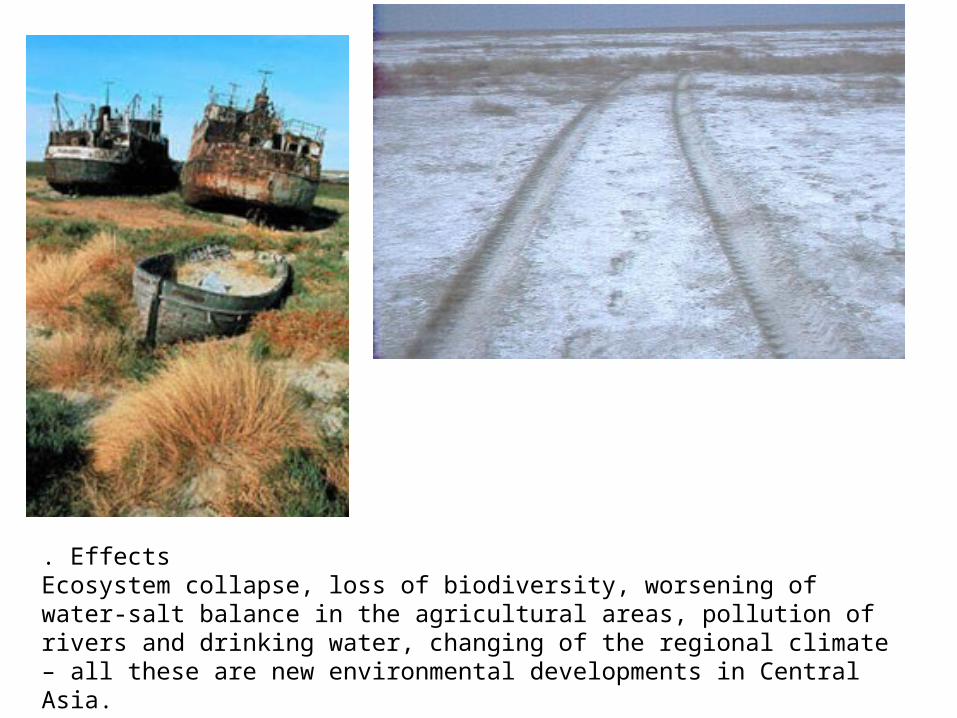
The Aral Sea in the former Soviet Union—mismanaging the river water inflow
Allocation to desert irrigation > inflow minus evaporationFig. 5.19
. Effects Ecosystem collapse, loss of biodiversity, worsening of water-salt balance in the agricultural areas, pollution of rivers and drinking water, changing of the regional climate – all these are new environmental developments in Central Asia.
Calculating volume and mean depth
Mean depth = Volume/surface area
The hypsographic curve
Area under the curve = volume
Fig. 7.1 in text
•The thermocline occurs deeper in large lakes because wind energy is transmitted to greater depths
•Wind energy increases with fetch
•In small lakes convection also plays a role in determining thermocline depth
•In deep lakes only the surface layers are well mixed and quite warm, whereas the deeper parts remain cold.
Lakes partition themselves into temperature zonesThermal stratification in lakes