CRC Report No. 657 INVESTIGATION OF REDUCED TEL CONTENT IN COMMERCIAL100LL AVGAS REPORT CRC PROJECT NO. CA-67-2010 OCTOBER 14, 2010 VERSION 4.0 COORDINATING RESEARCH COUNCIL, INC. 3650 MANSELL ROAD·SUITE 140·ALPHARETTA, GA 30022
Transcript
CRC Report No 657
INVESTIGATION OF REDUCED TEL CONTENT
IN COMMERCIAL100LL AVGAS
REPORT CRC PROJECT NO CA-67-2010
OCTOBER 14 2010 VERSION 40
COORDINATING RESEARCH COUNCIL INC 3650 MANSELL ROADSUITE 140ALPHARETTA GA 30022
The Coordinating Research Council Inc (CRC) is a non-profit corporation supported by the petroleum and automotive equipment industries CRC operates through the committees made up of technical experts from industry and government who voluntarily participate The four main areas of research within CRC are air pollution (atmospheric and engineering studies) aviation fuels lubricants and equipment performance heavy-duty vehicle fuels lubricants and equipment performance (eg diesel trucks) and light-duty vehicle fuels lubricants and equipment performance (eg passenger cars) CRCrsquos function is to provide the mechanism for joint research conducted by the two industries that will help in determining the optimum combination of petroleum products and automotive equipment CRCrsquos work is limited to research that is mutually beneficial to the two industries involved and all information is available to the public CRC makes no warranty expressed or implied on the application of information contained in this report In formulating and approving reports the appropriate committee of the Coordinating Research Council Inc has not investigated or considered patents which may apply to the subject matter Prospective users of the report are responsible for protecting themselves against liability for infringement of patents
Page 2 of 50 Version 40 Oct 14 2010
COORDINATING RESEARCH COUNCIL INC
3650 MANSELL ROAD SUITE 140 ALPHARETTA GA 30022
TEL 678795-0506 FAX 678795-0509 WWWCRCAOORG
INVESTIGATION OF REDUCED TEL CONTENT
IN COMMERCIAL 100LL AVGAS
(CRC Project No CA-67-2010)
In formulating and approving reports the appropriate committee of the Coordinating Research Council Inc has not investigated or considered patents which may apply to the subject matter Prospective users of the report are responsible for protecting themselves against liability for infringement of patents
Prepared by
R E Wilkinson for the CRC UL AVGAS Development Group
OCTOBER 14 2010
CRC Aviation Fuel Lubricant amp Equipment Research Committee of the
Coordinating Research Council Inc
Page 3 of 50 Version 40 Oct 14 2010
TABLE OF CONTENTS
List of Figureshelliphelliphelliphelliphelliphelliphelliphelliphelliphelliphelliphelliphelliphelliphelliphelliphelliphelliphelliphelliphelliphelliphelliphelliphelliphellip 5 List of Tableshelliphelliphelliphelliphelliphelliphelliphelliphelliphelliphelliphelliphelliphelliphelliphelliphelliphelliphelliphelliphelliphelliphelliphelliphelliphellip 5 List of Abbreviations amp Symbolshelliphelliphelliphelliphelliphelliphelliphelliphelliphelliphelliphelliphelliphelliphelliphelliphelliphellip 6 Forewordhelliphelliphelliphelliphelliphelliphelliphelliphelliphelliphelliphelliphelliphelliphelliphelliphelliphelliphelliphelliphelliphelliphelliphelliphelliphelliphelliphellip 8 1 Introductionhelliphelliphelliphelliphelliphelliphelliphelliphelliphelliphelliphelliphelliphelliphelliphelliphelliphelliphelliphelliphelliphelliphelliphelliphelliphelliphelliphellip 9
IMEP Indicated Mean Effective Pressure = [792000 X IHP] [CID X RPM]
ISFC Indicated Specific Fuel Consumption
JASC Joint Aircraft SystemComponent Code (FAA)
Page 6 of 50 Version 40 Oct 14 2010
LOP Lean of Peak [ Refers to fuel flow setting lean of peak EGT]
MAP Manifold Pressure typically inches Hg absolute
mLgal Milliliters per gallon
mmHg Millimeters of mercury
MON Motor Octane Number (ASTM D 2700)
NAAQS National Ambient Air Quality Standard
NACA National Advisory Committee for Aeronautics
NATA National Air Transportation Association
OEM Original Equipment Manufacturer
PN Performance Number (ASTM D 909)
POH Pilot Operating Handbook
PRF Primary Reference Fuel
PSIG Pounds per square inch gage
RPM Revolutions Per Minute
RGL Regulatory and Guidance Library (FAA)
ROP Rich of Peak [Refers to fuel flow setting rich of peak EGT]
RVP Reid Vapor Pressure
SAE Society Automotive Engineering (SAE International)
SC Supercharge Rating (ASTM D 909)
SDR Service Difficulty Report (FAA)
TCDS Type Certificate Data Sheet (FAA)
TDC Top Dead Center (piston position)
TEL Tetraethyl Lead
UL Unleaded
ULL Ultra Low Lead
VLL Very Low Lead
WOT Wide Open Throttle (same as full throttle)
100LL 100 Octane Low Lead AVGAS
Page 7 of 50 Version 40 Oct 14 2010
FOREWORD The source for the 100LL AVGAS survey data presented within this CRC report is a technical report prepared under contract by Crown Consulting Inc for the FAA William J Hughes Technical Center The contents of this CRC report are intended to document the results of the survey of TEL content in commercial AVGAS as commissioned by the FAA Technical Center working as a member of the CRC Unleaded AVGAS Development Group and the CRC VLL Task Group and to provide additional supporting technical data analysis and discussion where applicable
The work product of CRC research is technical data which is made available to industry as a means of enabling the industry decision process It is not the intent of this report to provide a recommendation for a specific reduction in TEL content but rather the objective is to provide technical data and analysis sufficient to enable and facilitate industryrsquos decision making process regarding a reduction in 100LL AVGAS lead emissions
Where applicable throughout this report the source of information or data is identified as a numbered reference A numerical listing of these references is included at the end of this report The author of this report has attempted to objectively document results in a summary manner using the FAA survey results and engine test results there are no changes to data or conclusions
The objective of the CRC UL AVGAS Dev Group is to conduct research and testing that will facilitate development of the next generation aviation gasoline with the goal of ensuring the availability of the required technical information for the development of an unleaded aviation gasoline that meets the requirements of both the existing and future general aviation fleet Working as a subcommittee of the CRC UL AVGAS Dev Group is the CRC VLL AVGAS Task Group which was tasked by industry to conduct research into options for reducing the lead emissions of 100LL AVGAS
A future technical report to be published by the FAA Technical Center will document the details of the engine testing conducted on a group of candidate reduced TEL AVGAS blends furnished by the fuel producers
Note that although the term ULL (ultra low lead) had been previously used to describe a reduced TEL content AVGAS the descriptor VLL (very low lead) has been recommended as the preferred suffix ie 100VLL and is the term of reference applied within this report for a reduced TEL content AVGAS This also avoids confusion with unleaded AVGAS development where the suffix ldquoULrdquo has been proposed for unleaded grades
Page 8 of 50 Version 40 Oct 14 2010
1 INTRODUCTION Aviation gasoline is produced pursuant to ASTM D 910 Standard Specification for Aviation Gasolines and DEF STAN 91-90 (British Ministry of Defense) where the maximum allowable tetraethyl lead (TEL) content for Grade 100130LL (hereafter referred to as Grade 100LL in this report) is restricted to a maximum level of 056 gPbL (053 mL TELL 200 mL TELgal) Grade 100LL was introduced during the 1970rsquos as a reduced TEL content AVGAS replacing the previous Grade 100130 which was limited to 084 gPbL ( 08 mL TELL 300 mL TELgal) Grade 100LL offered a significant reduction in TEL content from the prior Grade 100130(1) Although ASTM D 910 includes provisions for AVGAS Grades 8087 9198 and 100130 the 100LL AVGAS product is the predominant AVGAS produced world-wide and used by the general aviation piston fleet The octane quality and associated knock resistance of aviation grade gasoline has relied almost exclusively on the octane enhancing additive TEL which has been used as a knock suppressant in aviation gasoline since the late 1920rsquos The compound TEL is the primary fuel additive enabling the high octane quality fuel required by high performance high compression ratio aviation engines As domestic environmental measures have continued to reduce the use of lead in manufactured products aviation gasoline today remains the only domestically produced gasoline containing TEL The general aviation industry has accordingly committed to pursue options for unleaded aviation gasoline including both near term and long term strategies for reduction of TEL content The AVGAS Stakeholder Group is a broad based coalition which represents the general aviation industry today relative to future unleaded aviation gasoline The Stakeholder Group is working collaboratively with the industry manufacturers the FAA and the EPA to formulate and implement plans providing for reductions in lead emissions as associated with the 100LL AVGAS product A major tenant of the Stakeholderrsquos Group near term plan includes research into options for a reduced TEL content 100LL AVGAS In August 2009 the AVGAS Stakeholder Group petitioned the CRC Unleaded AVGAS Development Group to investigate and conduct research into options for a reduced TEL content AVGAS Since that time the CRC VLL Task Group working as a subset of the CRC Unleaded AVGAS Development Group has conducted test and evaluation of reduced TEL content AVGAS and has provided input and support to the FAA Technical Centerrsquos investigations into TEL production levels for commercial FBO AVGAS Working as a member of the CRC VLL AVGAS Task Group the FAA William J Hughes Technical Center has completed a survey of FBO 100LL AVGAS for TEL content and associated ASTM D 910 properties for the specific purpose of documenting TEL content for commercial 100LL AVGAS as used by the active fleet Complementing the TEL study a review of FAA Service Difficulty Reports (SDR) was performed for the purpose of searching for reports of detonation related service incidents for the piston powered fleet The objective of this report is to document the findings and observations associated with the survey of FBO AVGAS TEL content and associated properties including search results of the FAA SDR database for detonation incidents Also documented within the survey report are 100LL AVGAS production TEL levels for a major AVGAS producer and the TEL content for AVGAS used in official FAA certification testing by the OEM engine manufacturers Test results for a series of full scale engine tests performed with a group of partially leaded fuels to assess the ldquolead responserdquo of a representative high output worst case conventional reciprocating engine are included as complementary data It is not the intent of this report to provide a recommendation for a specific reduction in TEL content but rather the objective is to provide technical data and analysis sufficient to enable industryrsquos decision making process regarding a reduction in TEL content
Page 9 of 50 Version 40 Oct 14 2010
2 BACKGROUND 21 GENERAL AVIATION LEAD REDUCTION INITIATIVE
The National Ambient Air Quality Standards (NAAQS) were updated by the EPA in 2008 to reduce allowable levels of lead by 90 The revised standard requires measurement of lead levels in the vicinity of general aviation airports For each location found to be in a non-attainment status with the NAAQS the State must develop a plan approved by the EPA to reduce lead emissions to bring these areas into attainment by 2017 As a result of this regulatory action there is an urgent emphasis on addressing measures for reducing lead emissions from general aviation aircraft The Aircraft Owners and Pilots Association (AOPA) the Experimental Aircraft Association (EAA) the General Aviation Manufacturers Association (GAMA) the National Air Transportation Association (NATA) the National Business Aviation Association (NBAA) the American Petroleum Institute (API) and the National Petrochemical and Refiners Association (NPRA) comprise the AVGAS Stakeholders Group which represents the General Aviation aircraft owners operators and manufacturers and the oil and natural gas industry producers refiners and distributors of aviation grade gasoline (AVGAS) This AVGAS Stakeholder Group is actively engaged in working with the manufacturers the FAA and the EPA to achieve significant reductions in lead emissions for the General Aviation piston powered fleet which requires a minimum grade 100LL AVGAS(2) The stated purpose of this Group is to collaborate coordinate and provide leadership leading to the development and implementation of the process by which an unleaded AVGAS solution will be identified(3)
The AVGAS Stakeholder Group has identified both near term and long term strategies leading to the eventual transition to an unleaded AVGAS which are extracted from reference (3) as follows(3) The Stakeholder Group Near Term Strategy provides for a near-term reduction of lead emissions from General Aviation aircraft based upon the following criteria Note that the suffix VLL is used within this report to indicate a reduced TEL content AVGAS the final determination and selection of a suitable suffix may well differ from the modifier VLL the suffix ULL had previously been used to indicate a reduced TEL content AVGAS
AVGAS STAKEHOLDER GROUP NEAR TERM STRATEGY (3)
A drop-in 100VLL as a replacement for 100LL
Requires no action from manufacturers or operators
No impact on engine or aircraft FAA certification
The use of 100VLL lowers total lead emissions in airport areas where
monitoring may determine the current NAAQS standard is not being met
Page 10 of 50 Version 40 Oct 14 2010
Although not the subject of this report the AVGAS Stakeholder Long Term Strategy is structured around five major phases which are extracted from reference (3) and repeated as follows
AVGAS STAKEHOLDER GROUP LONG TERM STRATEGY (3)
Phase I ndash Establish FAA-led public-private partnership
Develop and implement an integrated FAA program to provide the
information necessary for the marketplace to identify the best unleaded solution which is technically feasible
Phase II ndash Identify viable unleaded AVGAS specification
Evaluate current D910 fuel specification to determine which
parameters can be adjusted Identify and support research needs for development of an
unleaded AVGAS specification Define all criteria for a viable unleaded AVGAS Develop engine and aircraft certification processes to transition
existing fleet to a new fuel
Phase III ndash Develop and approve an ASTM fuel specification
Phase IV ndash Certify new production aircraft to new fuel specification
Only affects new production engines and aircraft Would require dual certification for unleaded and 100LL AVGAS
Phase V ndash EPAFAA regulate transition to unleaded AVGAS (includes
FAA approvals amp certifications necessary for safety) Transition timeline dependent upon level of impact
FAA approvals amp certifications necessary for safety AVGAS production amp distribution infrastructure
Regulation may need to consider special provisions if there are portions of the fleet that cannot transition within the timeframe
Page 11 of 50 Version 40 Oct 14 2010
22 ASTM D 910 SPECFICATION ldquoASTM D 910 Standard Specification for Aviation Gasoline and DEF STAN 9190 (British Ministry of Defense) are recognized throughout the world as primary specifications for the production and quality control of AVGASrdquo(1) ASTM D 910 which was first introduced in 1947 currently provides for four different aviation grade gasolines Current aviation grade gasolines are summarized in Table 1 of ASTM D 910 which is repeated below as Table 10 for the purpose of identifying TEL limits and associated octane ratings As shown the maximum allowable TEL content for Grade 100LL is 056 gPbL (053 mLL) which is equivalent to 200 mLgal There is no minimum limit specified for current TEL content Aviation grade 100LL has gradually become the predominant fuel used by the general aviation piston fleet both domestically and globally where the 100LL AVGAS is approved for use on those aircraft and engines originally certified for lower grades 8087 and 9198 For information on international specifications by country of origin for aviation gasoline refer to reference (1)
Table 10 Detailed Requirements for Aviation Gasolines (4)
Extracted from ASTM D 910-04a Specification Grade
80 Grade
91 Grade 100LL
Grade 100
ASTM Test Method
Knock Value lean mixture
Octane Number Min
800
910
995
995
D 2700
Knock Value rich mixture Octane Number Performance No
Min Min
870
980
1300
1300
D 909 D 909
Tetraethyl lead mL TELL gPbL
Max Max
013 014
053 056
053 056
106 112
D 3341 or D 5059
Color red brown blue green D 2392
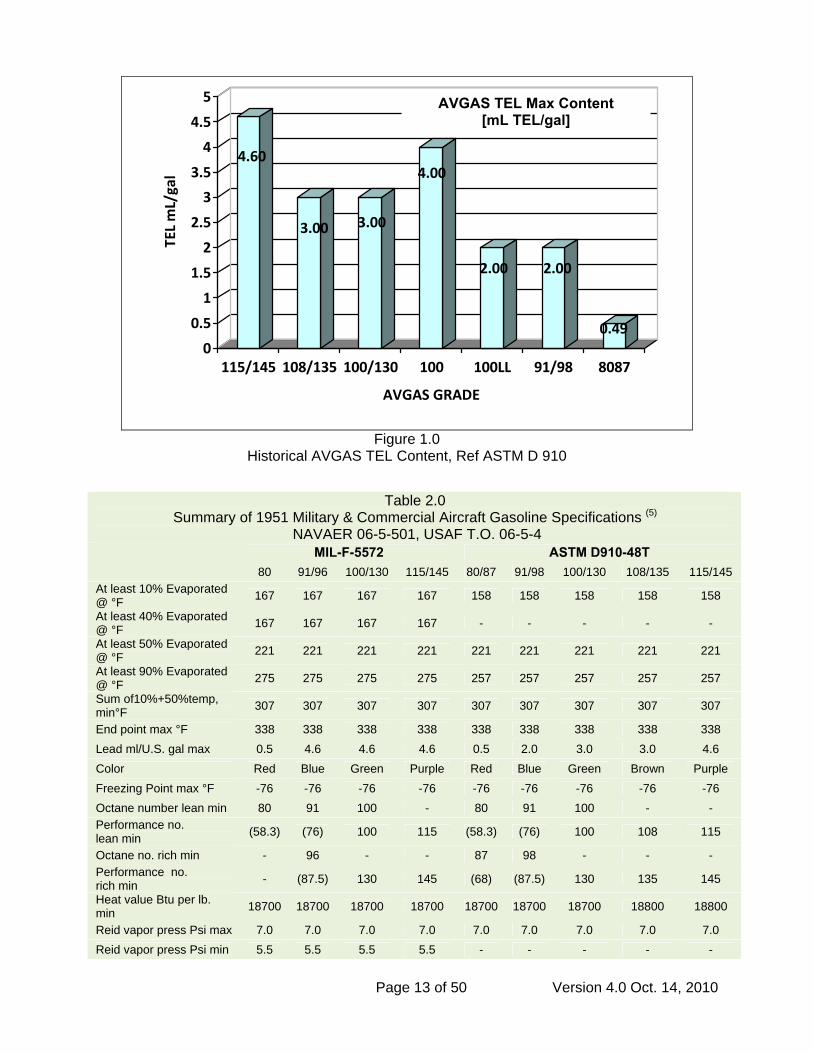
23 AVGAS HISTORICAL TEL CONTENT Historically the TEL content in aviation gasoline has continued a downward trend from the high levels of 460 mLgal (max) allowed in the early Grade 115145 aviation gasoline to the current 200 mLgal (max) specified for the Grade 100LL AVGAS Grade 100130 which was the predecessor to 100LL had a maximum TEL content of 300 mLgal Grade 100 is listed today as containing a maximum 400 mLgal TEL although Grade 100 is not currently a production fuel As precipitated by a growing environmental awareness in the 1970rsquos Grade 100LL AVGAS was introduced during the 1970rsquos which provided a significant reduction in TEL content and associated lead emissions Grade 100LL AVGAS gradually became the predominant global aviation gasoline for piston powered aircraft Table 20 which is extracted from a 1951 document reference (5) provides further insight into historical aviation gasoline grades and their associated critical properties including TEL content Reference 5 indicates the MIL-F-5572 specification allowed a higher TEL content for the 9196 and 100130 grades than specified in the D910-48T specification Reference (12) provides additional insight and data on the development and characteristics of aviation gasoline
Page 12 of 50 Version 40 Oct 14 2010
460
300 300
400
200 200
0490
05
1
15
2
25
3
35
4
45
5
TEL mLgal
115145 108135 100130 100 100LL 9198 8087
AVGAS GRADE
AVGAS TEL Max Content [mL TELgal]
Figure 10 Historical AVGAS TEL Content Ref ASTM D 910
Table 20 Summary of 1951 Military amp Commercial Aircraft Gasoline Specifications (5)
End point max degF 338 338 338 338 338 338 338 338 338 Lead mlUS gal max 05 46 46 46 05 20 30 30 46 Color Red Blue Green Purple Red Blue Green Brown Purple Freezing Point max degF -76 -76 -76 -76 -76 -76 -76 -76 -76 Octane number lean min 80 91 100 - 80 91 100 - - Performance no lean min (583) (76) 100 115 (583) (76) 100 108 115
Octane no rich min - 96 - - 87 98 - - - Performance no rich min - (875) 130 145 (68) (875) 130 135 145
Heat value Btu per lb min 18700 18700 18700 18700 18700 18700 18700 18800 18800
3 TEL EFFECT ON ENGINE PERFORMANCE The compound tetraethyl lead (TEL) has a powerful effect on engine performance specifically as an anti-knock agent when used as an additive in aviation grade gasoline The fuel octane rating needed to ensure that an engine will operate knock free is considered to be a first order requirement for an aviation spark ignition piston engine fuel Refiners add TEL to meet the octane requirements for AVGAS As documented in reference (11) the CRC Unleaded AVGAS Development Group determined that engine octane requirement is the most demanding and challenging criteria for an unleaded AVGAS Accordingly research into options for unleaded AVGAS and reduced lead content AVGAS has been driven by engine octane requirements
As background considerations for a reduced TEL content AVGAS it is important to recognize those AVGAS components which influence and establish the MON quality of the resulting 100LL product The addition of TEL certainly has a significant impact on knock response and resulting fuel MON quality but the base alkylate and aromatic content are other significant contributing variables Refiners balance these three components (base alkylate aromatics and TEL) to achieve the desired MON rating of the fuel There is a limit to which the effect of reduction in TEL may be offset by adjustment to the aromatic content while maintaining MON performance
The following indicates the significance of the effect of TEL on engine knock performance using both historical data for a typical high output radial engine and recent data generated as part of a CRC-FAA Technical Center research program to evaluate effect of TEL in conventional horizontally opposed high output worst case reciprocating aircraft engine The following provides insight into the sensitivity of engine knock performance to TEL content in the range of 10 ndash 20 mLgal
31 LEAD RESPONSE RADIAL AIRCRAFT ENGINE The effect of TEL on aircraft engine performance has been the subject of extensive research since the early days of aviation Research conducted on radial spark ignition reciprocating engines during the height of radial engine production years probed the ldquolead responserdquo of engine operation using leaded aviation gasoline A number of technical reports in the NACA archives document research results for explorations into leaded aviation gasoline in addition to investigations into other octane and performance enhancing additives
NACA Report No E4I28 was found to include test results described as ldquoLead Responserdquo for a typical radial engine power section The results are included within this report as an indication of effect of TEL on radial engine knock performance The following Figure 20 which is extracted from NACA Report No E4I28 indicates the ldquolead responserdquo for a Pratt amp Whitney R2800 radial engine (based upon single cylinder tests) in terms of knock limited IMEP for fuelair ratios of 0075 and 0100 The test fuel was an S-3 Aviation Reference fuel with TEL content varied from 000 to 600 mLgal (6)
Figure 20 provides an indication of the sensitivity of knock limited IMEP to TEL content for the configuration and test conditions documented in E4I28
Based upon the actual data points within the range of 15-22 mLgal a change of 04 mLgal results in a 49-37 impact on knock limited IMEP for a fuelair ratio of 075 FA The sensitivity may also be expressed as 01 mLgal is equivalent to 12 - 9 impact on knock limited IMEP
Based upon the actual data points within the range of 106 ndash 200 mLgal a change of 04 mLgal results in a 41 impact on knock limited IMEP for a fuelair ratio of 100 FA which indicates sensitivity of 1 change in knock limited IMEP per 01 mLgal TEL
Page 14 of 50 Version 40 Oct 14 2010
Figure 20 further indicates that for the configuration and test conditions documented in E4I28 a change in TEL content from 30 mLgal to 20 mLgal resulted in an impact of approximately 96 on knock limited IMEP
Insp10 to comme show that a distinct irregularity in the susceptability curve exists in the region of 08 to 14 ml tetraethyl lead per gallon It is also
ection of Figure 20 indicates an inflection or shift in the lead response curve in the area of 15 mLgal TEL The NACA researchers noted this observation with the following nt ndash ldquoThe results plotted in figure 18(b)
questionable whether this characteristic would be found under all test conditions and if it should whether this irregularity would always appear at the same tetraethyl-lead concentrations and would be of the same magnituderdquo (6)
R-2800 Engine Single Cylinder Ref NACA E4I28Lead Response C urve L IMEP vs TEL ContentK
160
180
200
220
240
260
280
300
320
340
0 05 1 15 2 25 3 35 4 45 5 55 6
Kno
ck L
imite
d IM
EP lb
sq
in
mL TELgal in S-3 Reference Fuel
Notes1) Data extracted from Figure
18 NACA Report No E4I282) R-2800 Single Cylinder3) KL IMEP = knock limited
32 LEAD RESPONSE CONVENTIONAL AIRCRAFT ENGINE Aviation industry re last 15 years has essentially followed in the footsteps of yesterdayrsquos engine engineers and fuel chemists
atives for reducing and line In consideration of
search into unleaded avgas alternatives during the
however the objectives and focus of research has shifted to alternultimately eliminating lead emissions as associated with aviation gasothe Aviation Stakeholder Grouprsquos near term strategy to pursue a reduction in lead emissions using a ldquodrop inrdquo replacement reduced lead content 100 min grade AVGAS the Aviation Stakeholder Group requested the CRC Unleaded AVGAS Development Group working in conjunction with the FAA Technical Center to investigate and conduct research into options for a reduced TEL content AVGAS In response to the Stakeholder request dual initiatives were launched by the CRC and FAA including full scale engine testing of manufacturerrsquos reduced
Page 15 of 50 Version 40 Oct 14 2010
TEL content AVGAS blends in addition to an effort to assess and identify typical TEL content in 100LL AVGAS consumed by the fleet The CRC VLL Task Group working as a subset of the CRC Unleaded AVGAS Development Group has conducted test and evaluation of reduced TEL content AVGAS samples and has
rovided support and input to the FAA Technical Centerrsquos investigation into TEL production
response to the Stakeholder request the CRC VLL Task Group defined and implemented a d for full scale engine testing of a group of e fuel producers Although the requirement
which was the primary test engine used for prior RC Unleaded AVGAS research projects(11) was also used for the test investigations into the
lead response of the fuels identified in Table 30 The IO-540-K engine is rated at 300 BHP at 2700 RPM and features a 5125 inch bore with 871 CR the engine is six cylinder air-cooled horizontally opposed fuel injected engine and has been determined to be one of the worst case naturally aspirated engines relative to octane requirement(11) The IO-540-K is representative of the large bore six cylinder naturally aspirated engines rated on minimum grade 100LL AVGAS which power a large segment of the general aviation fleet The combination of large cylinder bore high compression ratio and high output are primary design features contributing to the high octane requirement
plevels for commercial FBO AVGAS The following describes the preliminary results of CRC research investigations into full scale engine tests of a group of partially leaded fuels The following data are provided in advance of a formal FAA Technical Center report which will document the full scale engine tests of a group of manufacturerrsquos reduced lead content fuels
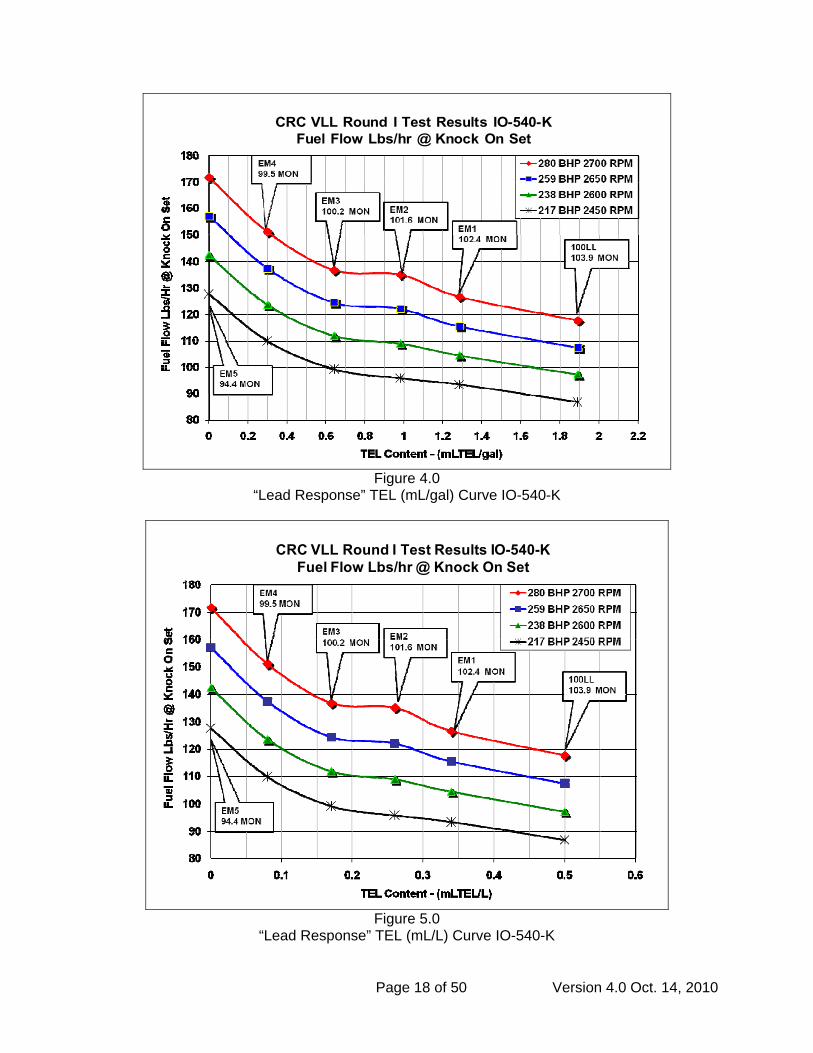
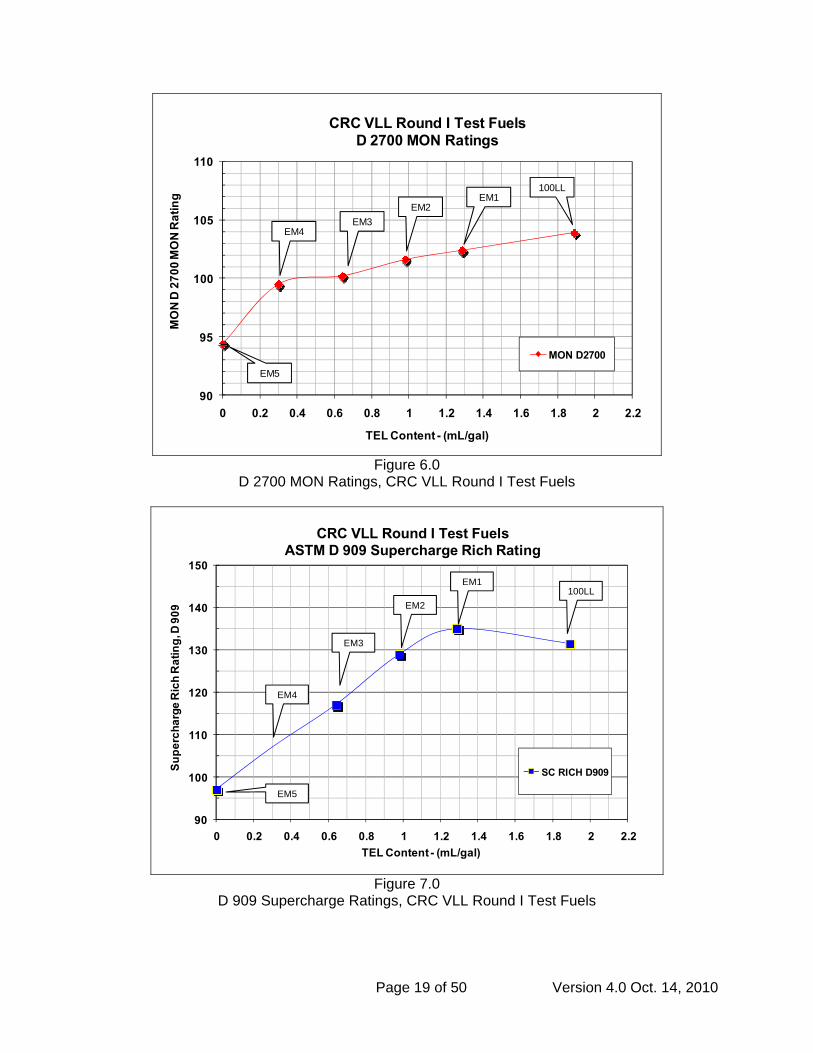
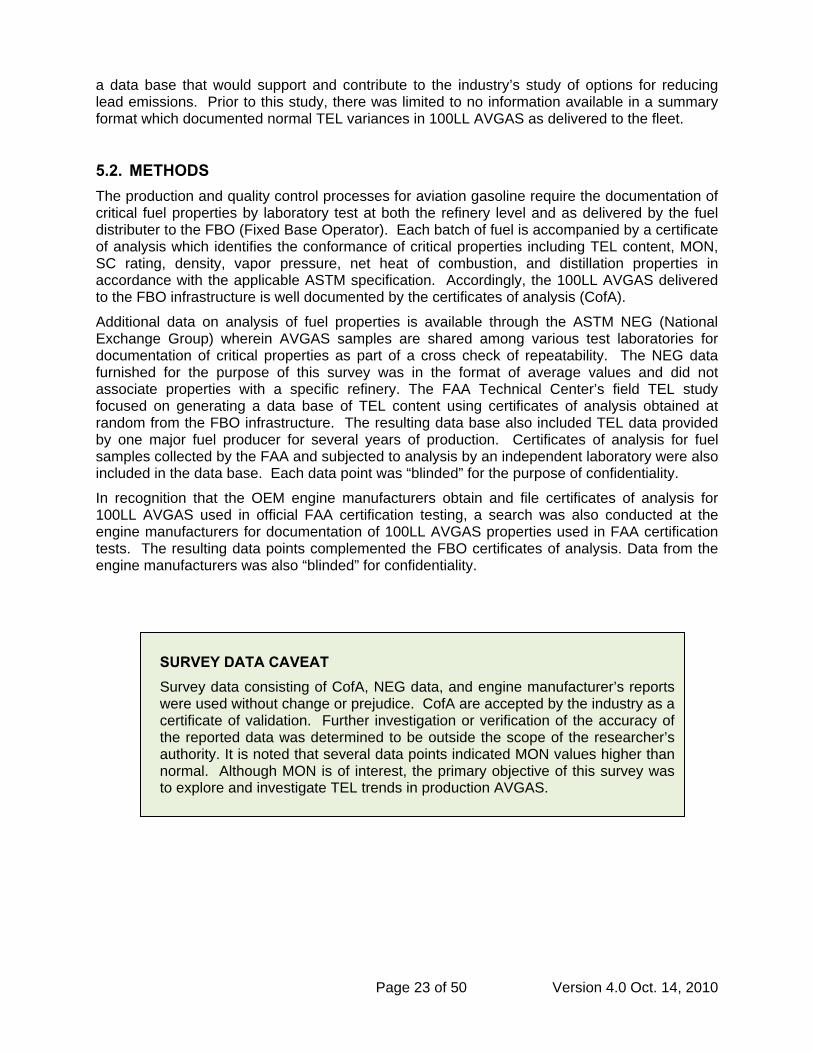
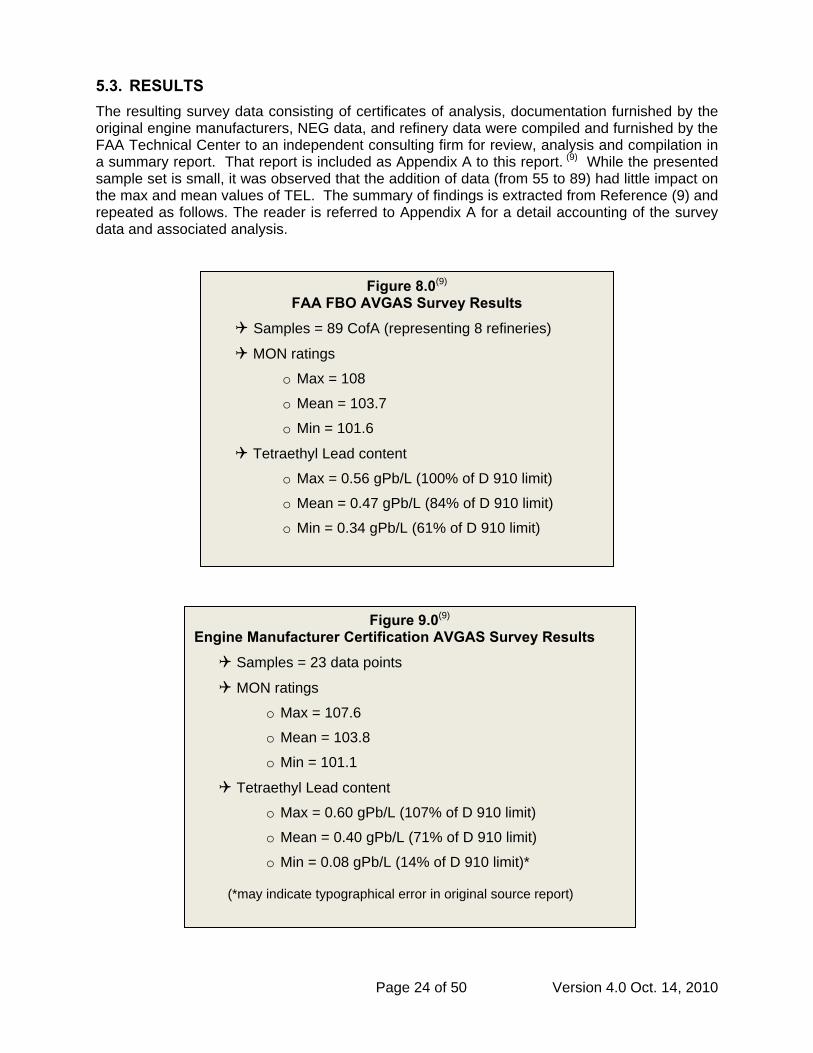
33 CRC-FAA AFETF ROUND I VLL TESTS Inresearch program during early 2010 which providereduced TEL content AVGAS blends furnished by thwas that the test blends meet D 910 specification one of the fuel groups consisted of batch of 5 blends which were prepared using a production AVGAS the TEL content was varied from 0 to 64 of max allowable TEL with toluene content maintained at approximately 11 EM1 was a D 910 compliant fuel This latter group of reduced TEL content fuel blends which are summarized in Table 30 offered the opportunity to investigate the lead response of similar fuels with varying TEL content in a full scale engine The 100LL fuel noted in Table 30 represented a baseline FBO AVGAS with TEL content at 943 of D 910 limits See Figures 60 and 70 for test fuel MON and Supercharge Rich trends
A Textron Lycoming model IO-540-K engine
Table 30 (7)
CRC FAA Tech Center VLL Fuels Matrix Round I Tests 2010
ULL Blend
TEL (mLL)
TEL (mLgal)
Max TEL D 910
Toluene (vv)
MON (D2700)
SC Rich (D909)
100LL 050 189 09434 lt05 1039 1315
EM1 034 1287 06415 118 1024 135
EM2 026 098 04906 116 1016 129
EM3 017 064 03208 115 1002 117
EM4 008 030 01509 113 995 107
EM5 000 000 00000 111 944 97
C
Page 16 of 50 Version 40 Oct 14 2010
ull scale e d June 20 the Tec Cent tion F nd E Test F y (AFETF) cated in conducting ixture le cur t po ttings [27 M WO 5 [2 PM] 75 450 RPM 65 50 R Eac six cy s was itored cdications ead concept described in reference (11)
esults of the FAA AFETF detonation tests using the Table 30 fuels are shown graphically in igure 30(7) The diagonal lines which intersect the BHP curves for each power setting indicate e fuel flow corresponding to onset of combustion knock for each of the fuel blends shown he RPM indications correspond to the power settings of 100 85 75 and 65 Although igure 30 illustrates the relative knock performance of the Table 30 fuels it does not establish quantifiable relationship between TEL content and engine knock but rather only indicates ose fuels with higher TEL provide an increasingly positive effect on engine knock
erformance
F ngine detonation testing of the reduced TEL fuels shown in Table 30 was completein 10 at FAA hnical errsquos Avia uels a ngine acilitlo Atlantic City
an outNew Jersey Engine det
ves aonation test
of 100procedure consisted of
00 RP
600 Rm wer se T] 8[2 ] and
of detonatio [23
n as indicatPM]
ed by comh of the
bustion pressure using thlinder mon
e instrumented cylinder ontinuously for
inh RFthTFathp
240
250
260
270
280
290
300
epow
er
150
160
708090100110120130140150160170FUEL FLOW (lbhr)
170
180
190
200
210
220
230
Bra
ke H
ors
2700 RPM
2600 RPMRICH
100LL
EM1
EM2
2450 RPM
2350 RPMEM4
EM3
ULL AVGAS TESTS RESULTSEM1-EM5100LL
IO-540-K Knock On Set
LEAN EM5
Figure 30 Knock Limited Fuel Flow ULL Test Matrix IO-540-K(7)
With the objec
erformance Ftive of quantifying the relationship between TEL content and engine knock igures 40 and 50 are derived from the Figure 30 data by plotting knock limited
s a function of TEL content for lines of constant BHP The resulting data sets provide an indication of the effect of change in TEL content on engine knock performance as manifested by knock limited fuel flow The MON rating for each test fuel is noted for reference since there was a gradual reduction in MON as TEL content was reduced with the drop in MON becoming more aggressive beginning at 030 mLgal TEL as shown in Figure 60 Figure 70 shows the supercharge rich ratings for the Table 30 test fuels where the difference in the rich rating between EM1 and 100LL is likely the result of the difference in toluene content
pfuel flow a
Page 17 of 50 Version 40 Oct 14 2010
CRC VLL Round I Test Results IO-540-KFuel Flow Lbshr Knock On Set
Figure 40
ldquoLead Responserdquo TEL (mLgal) Curve IO-540-K
CRC VLL Round I Test Results IO-540-KFuel Flow Lbshr Knock On Set
Figure 50
ldquoLead Responserdquo TEL (mLL) Curve IO-540-K
Page 18 of 50 Version 40 Oct 14 2010
CRC VLL Round I Test FuelsD 2700 MON Ratings
90
95
100
105
110
0 02 04 06 08 1 12 14 16 18 2 22
MO
N D
270
0 M
ON
Rat
ing
TEL Content - (mLgal)
MON D2700
100LLEM1
EM2EM3
EM4
EM5
Figure 60
D s
2700 MON Ratings CRC VLL Round I Test Fuel
CRC VLL Round I Test FuelsASTM D 909 Supercharge Rich Rating
90
100
110
120
130
140
150
0 02 04 06 08 1 12 14 16 18 2 22
Supe
rcha
rge
Ric
h R
atin
g D
909
TEL Content - (mLgal)
SC RICH D909
EM3
EM4
EM2
EM1100LL
EM5
Figure 70
D 909 Supercharge Ratings CRC VLL Round I Test Fuels
Page 19 of 50 Version 40 Oct 14 2010
34 Figures 40 described
approaches
ock limited
TEL values ranging fro
content for t mented
CONCLUSIONS ROUND I VLL TESTS and 50 indicate the ldquolead responserdquo for the IO-540-K test engine using the fuels
in Table 30 The data indicates the ldquolead responserdquo in terms of knock limited fuel flow for TEL content in the 150 to 200 mLgal range is linear There is a ldquokneerdquo in the curvearound 060 mLgal below which the ldquolead responserdquo becomes non-linear as the TEL content
zero
The utility of Figures 40 and 50 is that they indicate the relative change in engine knfuel flow as a function of TEL content in the 150 ndash 20 mLgal range of interest and beyondwhich provides for correlation with the fleet service experience with AVGAS at
m 122 ndash 200 mLgal as discussed in Section 5 of this report
Figures 40 and 50 provide an indication of the sensitivity of knock limited fuel flow to TELhe conventional IO-540-K engine configuration and test conditions docu
ge of wn in
Assuming a linear response in the 13 ndash 20 mLgal range the data indicate a chan04 mLgal results in a 49 impact on knock limited fuel flow for the BHP shoFigures 40 and 50
Alternately a change of 05 mLgal results in a 6 impact on knock limited fuel flow for the BHP shown in Figures 40 and 50
A change in TEL content from 200 mLgal to 122 mLgal (39 reduction) is equivalent to a 94 chan d 50 ge in knock limited fuel flow reference Figures 40 an
ay be ote
d in
he size of the general avia
piston powe total ion
comprising 453 aircraft which is estdefined as he General Aviation Ma
Piston powe
arrangements manufactured by original eq nufacturers (OEM) Teledyne Continental Motors and Textro CAR 13 Civil Air Regulations or 14 CFR 33 Federal Aviation regulations
Many older GA engine models are approved to operate with a minimum grade 8087 AVGAS but are also approved to operate with the more readily available higher grade 100LL AVGAS A
Based upon Figures 40 and 50 the sensitivity of engine knock to TEL content mexpressed as 01 mLgal is equivalent to 12 impact on knock limited fuel flow Nthat this is in agreement with the radial engine lead response at 075 FA discusseSection 31 Although the metrics are expressed in different terms knock limited IMEP for a radial engine and knock limited fuel flow for a conventional engine they arecomplementary and indicate the relative change in knock on-set as a function of TEL
4 GENERAL AVIATION PISTON POWERED FLEET Of interest relative to the use of 100LL AVGAS and the associated TEL content is t
tion piston powered fleet which requires use of a minimum grade 100LL AVGASBased upon the results of a recent study which researched the FAA Registry for registered
red aircraft and the associated FAA TCDS for a listing of approved fuels theUS GA fleet in 2010 consists of 228078 aircraft with the piston powered fleet port
83 of the total(8) The US piston fleet in YR2010 consists of 189imated to be 60 - 70 of the total worldwide piston fleet General Aviation is all aviation other than military and commercial airlines according to tnufacturers Association(11)
red GA aircraft (less than 12000 lbs gross weight) are almost exclusively poweredby horizontally opposed spark ignition reciprocating engines configured in 4 6 and 8 cylinder
uipment man Lycoming as FAA approved products conforming to either
Page 20 of 50 Version 40 Oct 14 2010
small percentage of the fleet is approved to operawith a few aircraft listing 9198 as the approved fu
te on an older minimum grade 9196 AVGAS el GA engine models produced since the mid
GA engines are both naturally aspirated and turbocharged with ratings from
1970rsquos are mostly high output high performance high compression ratio (85 ndash 87CR) engines which require a minimum grade 100LL AVGAS for adequate knock protection The minimum grade fuel approved for operation with an aircraftengine is specified in the engine FAA TCDS the aircraft FAA TCDS and the aircraft POH (Pilot Operating Handbook)
he FAA approved T100 BHP to in excess of 400 BHP Fuels approved for operation in GA engines are specified in the FAA approved OEM continuous airworthiness data and the associated FAA TCDS (type certificate data sheet which may be accessed at httprglfaagov) The approved fuel is typically specified in the FAA TCDS as aviation gasoline conforming to ASTM D 910 pecification either minimum grade 8087 9196 9198 100LL or 10013s 0 FAA certification of
41A stud ssioned by the FAA Technical Centerrsquos Aviation Fuels and Engine Test Facility (AFETF) to quantify the piston powered fleet composition based upon the approved minwhich are based upon data contained in the FAA Registry and the FAA TCDS establish a baseline data base for the active piston powered aircraft by make and model along with a listing of t Based upon the results of this study reference (8) 433 of the GA fleet requires a minimum Gragasolinof the accounthe gen80 87 er grade 100LL Engine manufacturer service bulletins specify that engines are approved to
perate with the next higher grade AVGAS but are not approved to operate with a lower grade e eligible for operation with 100LL oved for use with an unleaded min
each engine model required that adequate detonation (knock) margins be demonstrated by test using a certified fuel of minimum quality while operating at worst case conditions for knock
FLEET APPROVED MINIMUM GRADE FUEL y was recently commi
imum grade fuel as listed in the FAA TCDS for each aircraft(8) The results of this study
he approved minimum grade fuel
de 100LL AVGAS and is therefore dependent upon the leaded aviation grade 100LL e for both performance and knock protection Industry specialists believe it is this 433 fleet representing later model aircraft used for business and utility purposes which ts for the majority of the general aviation flight time Although there is a large segment of eral aviation fleet (84429 aircraft representing 446 of fleet) rated on minimum grade
90 or 91 AVGAS this group of aircraft is also approved to operate with the next high
oTherefore 166492 aircraft representing 879 of the fleet arAVGAS FAA TCDS data show 04 of the aircraft are apprgrade 9196 In the absence of a domestic min Grade 91 production AVGAS and minimal availability of min Grade 80 AVGAS min Grade 100LL is the predominantly available AVGAS today A 9196UL AVGAS is available within Europe
Page 21 of 50 Version 40 Oct 14 2010
Table 40 (8)
General Aviation Fleet Approved Min Fuel Grade Based Upon FAA Registry amp TCDS
Fuel Grade Number of Aircraft
Percent of 189453 Aircraft
100LL Minimum 82063 433
80 Minimum 69402 366
Other Fuel 17508 92
91 Minimum 13387 71
Unknown 5306 28
Unleaded 9196 825 04
87 Minimum 802 04
Jet A 147 01
90 Minimum 13 00068
Total Aircraft 189453 100 Notes
Minimum fuel grades extracted from FAA TCDS for aircraft Category ldquoother fuelrdquo includes TCDS fuel designations of 65
70 73 108135 amp 115145
wing describes the results of the FAA echnical Centerrsquos survey to quantity FBO AVGAS TEL levels as dispensed to the fleet
1 OBJECTIVES STM D 910 specifies a maximum content for TEL in 100LL AVGAS but no minimum With the cognition that there are normal production variances in TEL content of AVGAS as the result of
rocess variables including basic alkylate and refining process the FAA Technical Centerrsquos FETF commissioned a study to investigate the actual variation of TEL content in 100LL VGAS The primary objective of this study was to quantify the normal variances in TEL ontent as encountered by the fleet at the FBO level with a secondary objective of documenting
s in TEL content The purpose of this study was to develop
5 SURVEY 100LL AVGAS TEL CONTENT Whereas 100LL AVGAS is the predominantly available aviation gasoline today and in consideration of the AVGAS Stakeholder Grouprsquos near term strategy to pursue a reduction in lead emissions using a ldquodrop inrdquo replacement reduced lead content 100 min grade AVGAS the AVGAS Stakeholder Group requested the CRC Unleaded AVGAS Development Group working in conjunction with the FAA Technical Center to explore options and viability for a reduced TEL content 100 min grade AVGAS In response to the Stakeholder request dual VLL initiatives were launched by the CRC and FAA including full scale engine testing of manufacturerrsquos reduced TEL content AVGAS in addition to an effort to assess and identify typical TEL content in 100LL AVGAS consumed by the fleet The folloT
5ArepAAcfleet operating exposure to variance
Page 22 of 50 Version 40 Oct 14 2010
a data base that would support and contribute to the industryrsquos study of options for reducing lead emissions Prior to this study there o no information available in a summary format which document vered to the fleet
52 METHODS The production and quality control processes for aviation gasoline require the documentation of critical fuel properties b at bot finery leve delivered by the fuel distributer to the FBO (Fixed Base Operator) Each batch of fuel is panied by a certificate of analysis which identifies nce o erties g TEL content MON SC rating density vapor pressure net heat of combustion and distillation properties in accordance with the applicable ASTM specification Accordingly the 100LL AVGAS delivered to the FBO infrastructure is ted by tificates of analysis (CofA)
Additional data on analysis of fuel properties is available through the ASTM NEG (National Exchange Group) wherein AVGAS samples are shared among various test laboratories for documentation of critic part of a s check of r bility The NEG data furnished for the purpose y was e format of average values and did not associate properties with a specific refinery The FAA Technical Centerrsquos field TEL study focused on generating a data base of TEL co using certific f analysis obtained at random from the FBO infrastructure The resulting data base also included TEL data provided by one major fuel produce years o oduction C of analysis for fuel samples collected by the F cted to by an inde included in the data base int wa rdquo for the pu f confidentiality
In recognition tha ates of analysis for 100LL AVGAS us conducted at the engine manufactu in FAA certification tests The resulti ed the FBO certificates of analysis Data from the
ngine manufacturers was also ldquoblindedrdquo for confidentiality
was limited ted normal TEL variances in 100LL AVGAS as deli
y laboratory test h the re l and as accom
includin the conforma f critical prop
well documen the cer
al properties as cros epeataof this surve in th
ntent ates o
r for several f pr ertificatesAA and subjeEach data po
analysiss ldquoblinded
pendent laboratory were alsorpose o
t the OEM engine manufacturers obtain and file certificed in official FAA certification testing a search was alsorers for documentation of 100LL AVGAS properties used ng data points complement
e
SURVEY DATA CAVEAT Survey data consisting of CofA NEG data and engine manufacturerrsquos reports were used without change or prejudice CofA are accepted by the industry as a certificate of validation Further investigation or verification of the accuracy of the reported data was determined to be outside the scope of the researcherrsquos authority It is noted that several data points indicated MON values higher than normal Although MON is of interest the primary objective of this survey was to explore and investigate TEL trends in production AVGAS
Page 23 of 50 Version 40 Oct 14 2010
53 RESULTS The resulting survey data consisting of certificates of analysis documentation furnished by the original engine manufacturers NEG data and refinery data were compiled and furnished by the FAA Technical Center to an independent consulting firm for review analysis and compilation in
summary report That report is included as Appendix A to this report (9) While the presented it was observed that the addition of data (from 55 to 89) had little impact on values of TEL The summary of findings is extracted from Reference (9) and
asample set is smallthe max and mean repeated as follows The reader is referred to Appendix A for a detail accounting of the survey data and associated analysis
(may indicate typographical error in original source report)
MON ratings
o Max = 1076
o Mean = 1038
o Min = 1011
Tetraethyl Lead content
o Max = 060 gPbL (107 of D 910 limit)
Page 24 of 50 Version 40 Oct 14 2010
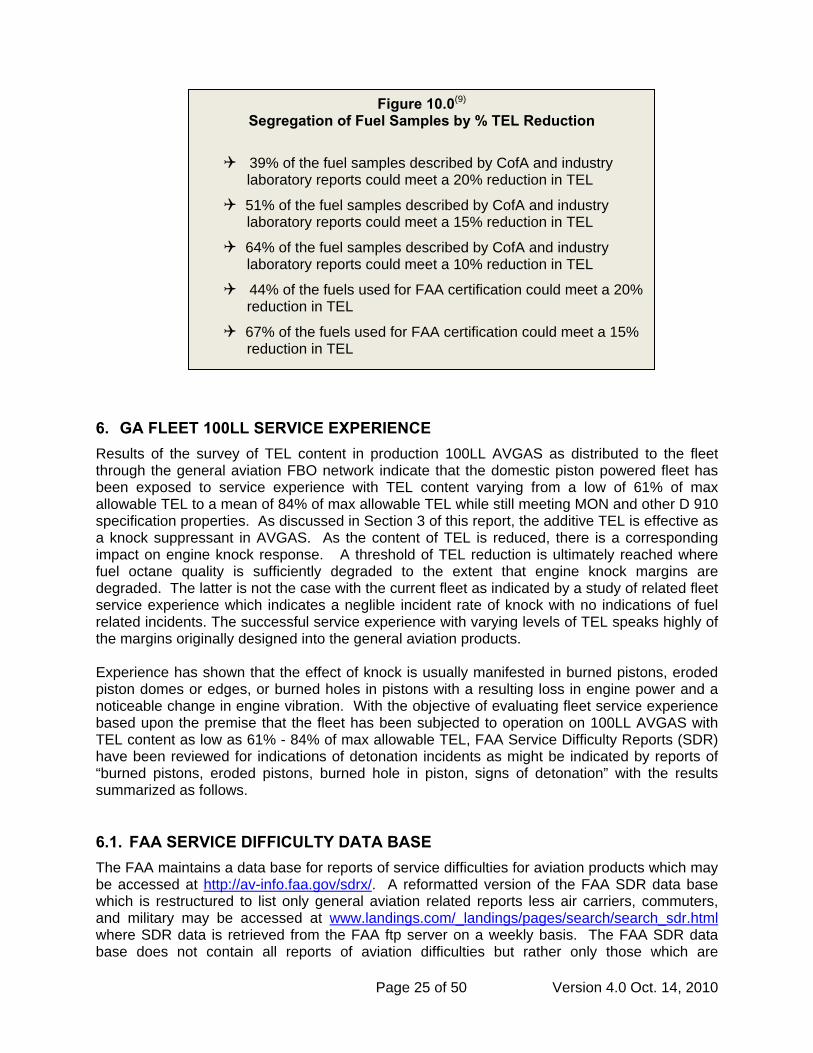
Figure 100(9)
Segregation of Fuel Samples by TEL Reduction
39 of the fuel samples described by CofA and industry laboratory reports could meet a 20 reduction in TEL
51 of the fuel samples described by CofA and industry laboratory reports could meet a 15 reduction in TEL
64 of the fuel samples described by CofA and industry
laboratory reports could meet a 10 reduction in TEL
44 of the fuels u ertification could meet a 20 reduct
L
sed for FAA c
ion in TEL
67 of the fuels used for FAA certification could meet a 15 reduction in TE
6 GA FLEET 100LL SERVICE EXPERIENCE
he surve tion 100LL AVGAS as distributed to the fleet rough the general aviation iston powered fleet has
een exposed to service e a low of 61 of max mean of 8 g MON and other D 910
pecification properties As dditive TEL is effective as knock suppressant in AVG there is a corresponding pact on engine knock response A threshold of TEL reduction is ultimately reached where el octane quality is sufficiently degraded to the extent that engine knock margins are
egraded The latter is not the case with the current fleet as indicated by a study of related fleet ervice experience which indicates a neglible incident rate of knock with no indications of fuel lated incidents The successful service experience with varying levels of TEL speaks highly of e margins or
xperience has sh s usually manifested in burned pistons eroded iston domes or e holes in pistons with a resulting loss in engine power and a oticeable change in engine vibration With the objective of evaluating fleet service experience ased upon the premise that the fleet has been subjected to operation on 100LL AVGAS with EL content as low as 61 llowable TEL FAA Service Difficulty Reports (SDR) ave been reviewed for i tonation incidents as might be indicated by reports of urned pistons eroded pistons bu signs of detonationrdquo with the results
ummarized as fol
1 FAA SERVICE DIFhe FAA maintains a data viation products which may e accessed at http
Results of tth
y of TEL content in produc FBO network indicate that the domestic pxperience with TEL content varying fromb
allowable TEL to a s
4 of max allowable TEL while still meetindiscussed in Section 3 of this report the a
AS As the content of TEL is reducedaimfudsreth
iginally designed into the general aviation products
E own that the effect of knock ipn
dges or burned
bT - 84 of max ah ndications of de
rned hole in pistonldquobs lows
6 FICULTY DATA BASE T base for reports of service difficulties for ab av-infofaagovsdrx A reformatted version of the
d to list only general aviation related reports less air FAA SDR data base
hich is restructure carriers commuters nd military may be accessed at wwwlandingscom_landingspagessearchsearch_sdrhtml
wa
here SDR data is retrieved from the FAA ftp server on a weekly basis The FAA SDR data ase does not contain all reports of aviation difficulties but rather only those which are
wb
Page 25 of 50 Version 40 Oct 14 2010
voluntarily submitted to the FAA where each is based upon the submitterrsquos assessment of the ervice difficulty However the FAA SDR s provide useful information providing sight into specific ser ported difficulties rovide an indic tion of relative incident rates as compared to other difficulty categories or the
f all reports f ircraft models r engine models iation contains 500000 entries 1975
sin
data base doevice difficulties when viewed in the context that the re
p aaggregate oo
or a specified aircraft model engine model or groups of a The entire FAA SDR data base reflecting all elements of av
to present ref 1 httpwwwaviationdbcom
62 SDR REPOR
search of the FAA S ed for reports of etonation incident raft series hich represent t nce high ompression ratio engi aspirated and turbocharged Rather than searching all mall aircraft manu ral aviation ircraft models which a 5 aircraft or 817 of the total FAA registry of piston owered aircraft The search was facilitated by searching under the FAA JASC code ldquo8530rdquo(10)
nd key word ldquopistonrdquo FAA JASC code 8530 is defined as ldquoFor reports of engine cylinders and ssociated partshelliptypical parts are piston piston pin exhaust valve intake valve valve guide
s of the SDR data search are r each of the 31 ldquoburned pistonrdquo listings is
TS DETONATION INCIDENTS DR data base for the general aviation fleet was performA
d s by searching for reports of piston difficulties for the following airche manufacturers of those aircraft powered by high performa
nes both naturally wcs facturers the search targeted the following representative gene
ccount for 15482apaarocker arm valve cover cylinder pushrodhelliprdquo Resultsummarized as follows A copy of the SDR report foon file and available upon request The SDR reports surveyed covered a time period of 17 years 1993 to present
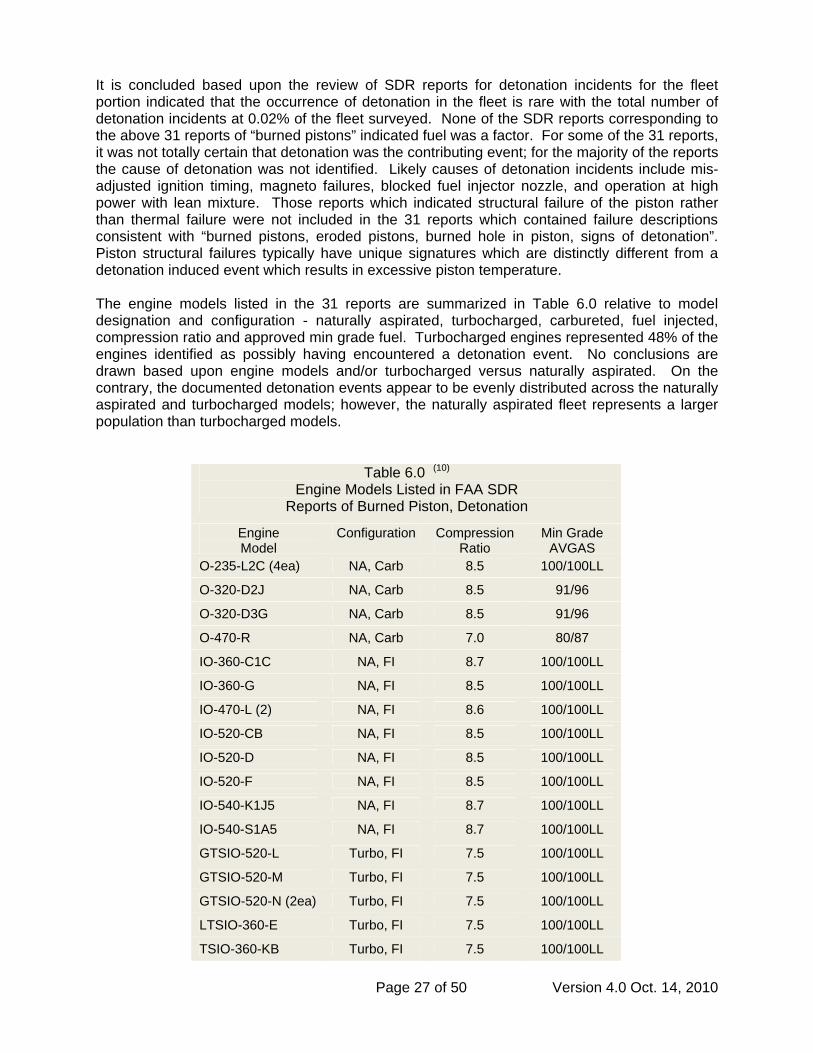
Table 50 FAA SDR Reports for Burned Pistons (10)
Representative Manufacturers ndash General Aviation Fleet FAA SDR Reports Aircraft
It is concluded based upon the review of SDR reports for detonation incidents for the fleet portion indicated that the occurrence of detonation in the fleet is rare with the total number of detonation incidents at 002 of the fleet surveyed None of the SDR reports corresponding to the above 31 reports of ldquoburned pistonsrdquo indicated fuel was a factor For some of the 31 reports it was not totally certain that detonation was the contributing event for the majority of the reports the cause of detonation was not identified Likely causes of detonation incidents include mis-adjusted ignition timing magneto failures blocked fuel injector nozzle and operation at high
ower with lean mixture Those reports which indicated structural failure of the piston rather an thermal failure were not included in the 31 reports which contained failure descriptions
ed hole in piston signs of detonationrdquo
pthconsistent with ldquoburned pistons eroded pistons burnPiston structural failures typically have unique signatures which are distinctly different from a detonation induced event which results in excessive piston temperature The engine models listed in the 31 reports are summarized in Table 60 relative to model designation and configuration - naturally aspirated turbocharged carbureted fuel injected compression ratio and approved min grade fuel Turbocharged engines represented 48 of the engines identified as possibly having encountered a detonation event No conclusions are drawn based upon engine models andor turbocharged versus naturally aspirated On the contrary the documented detonation events appear to be evenly distributed across the naturally aspirated and turbocharged models however the naturally aspirated fleet represents a larger population than turbocharged models
Table 60 (10)
Engine Models Listed in FAA SDR Reports of Bu Detonation rned Piston
Engine Model
Configuration Compression Ratio
Min Grade AVGAS
O-2 85 1035-L2 ) C (4ea NA Carb 0100LL
O-320-D2J NA Carb 85 9196
3G NA CaO-320-D rb 85 9196
O-470-R NA Carb 70 8087
IO-360-C1C NA FI 87 100100LL IO-360-G NA FI 85 100100LL IO-470-L (2) NA FI 86 100100LL
CB NAIO-520- FI 85 100100LL IO-520-D NA FI 85 100100LL IO-520-F NA FI 85 100100LL IO-540-K1J5 NA FI 87 100100LL IO-540-S1A5 NA FI 87 100100LL GTSIO-520-L Turbo FI 75 100100LL GTSIO-520-M Turbo FI 75 100100LL
100100LL GTSIO-520-N (2ea) Turbo FI 75
75 100100LL LTSIO-360-E Turbo FI
75 100100LL TSIO-360-KB Turbo FI
Page 27 of 50 Version 40 Oct 14 2010
TSIO-520-(Unkn) Turbo FI 75 100100LL
TSIO-520-NB (2ea) Turbo FI 75 100100LL TSIO-520-R (2ea) Turbo FI 75 100100LL TSIO-520-VB Turbo FI 75 100100LL
TSIO-520-WB Turbo FI 75 100100LL TIO-540-J2BD (2) Turbo FI 73 100100LL Notes
1) NA = naturally aspirated Turbo = turbocharged Carb = carbureted FI = fuel injected
7 CONCLUSIONS The purpose of the CRC research documented within this report was not to specify or recommend a specific reduced TEL level for AVGAS but rather to conduct research and investigations with the objective of generating technical data which would enable and facilitate the industryrsquos decision process for a reduced TEL AVGAS The results of the tests and investigations documented within this report fulfill this objective Significant findings and
bservations are summarized as follows
71 TEST RESULTS ENGINFigures 40 and 50 provide an indication of the sensitivit content for the conve -540-K g e t ns documented The following observations and conclusions are based the 15 gal TEL range of interest unless n
o
E LEAD RESPONSE y of knock limited fuel flow to TEL
uration and thupon
n IOtional engine confi est conditio 20 mL ndash
oted otherwise
Test res s a change Lgal (2 eduction ) results in a 49 impact on knock limited fuel flow
ults indicate of 04 m
0 r in TEL
Alternately a change of 05 mLgal (25 reduction in TEL) knock limited fuel flow
results in a 6 impact on
A chang ntent from Lgal to 1 mLgal ction in TEL) is equivalent to a 94 change in knock limited fuel flow Note that the survey results indicate minimum field FBO fuel ntent was umente 122 mLgal
e in TEL co 200 m 22 (39 redu
TEL co doc d as being
The sensitivity mLgal is equivalent to 12 impact on knock limited fuel flow over the 15 ndash 20 mLgal range of inter
may also be expressed as 01 est
Analysis conventio ine lead response is nt with the radial engine l of 10 -12 ge in kno mited IM 1 mLgal TEL as discussed in Section 31 Altho nock metrics are expressed in different terms knock lim radial en knock limited fuel flow for conventional engine these indice ementary a function
indicates theead response
nal eng chan
in agreemeEP per 0ck li
ugh the kited IMEP for
s are complgine and
nd indicate the relative change in knock on-set as a of TEL
Page 28 of 50 Version 40 Oct 14 2010
72 SURVEY R 00LL Figures 80 through 100 present a summary of the findings and observations documented within the Appe nifica and ob tions a ized as follows
ESULTS FBO 1 AVGAS
ndix A report Sig nt findings serva re summar
Survey r content i GAS (8 ta poinTEL content in AVGAS is 84 L allowe ASTM d upon the data examine
esults of TEL n FBO AV 9 da ts) indicate mean (average) of max TE d by D 910 base
d
Survey r tent i GAS in te the fleet has service experience with TEL content as low as 61 of the max TEL allowed by ASTM D 910 for fuels of 1016 MON
esults of TEL con n FBO AV dica
or higher
Mean MON for FBO AVGAS was observed to be 1037 MON with minimum MON documented at 1016 MON The maximum MON for AVGAS as indicated by the CofA data was 108 MON
Examination of engine manufacturer certification data (23 data points) indicates 100LL AVGAS used for official FAA engine certification testing had TEL content varying from minimum of 14 of max allowable to a mean of 71 of max allowed Associated minimum MON was 1011 with mean MON being 1038 The maximum MON for the 15 certification data samples was 1076 MON (Note that 14 may indicate a typographical error in the original source data)
39 of the fuel samples described by CofA and industry laboratory reports could meet a 20 reduction in TEL
51 of the fuel samples described by CofA a15 reduction in TEL
nd industry laboratory reports could meet a
64 of the fuel samples described by CofA and industry laboratory reports could meet a 10 reduction in TEL
44 of the fuels used for FAA certification could meet a 20 reduction in TEL
67 of the fuels used for FAA certification could meet a 15 reduction in TEL
73 FLEET SERVICE EXPERIENCE Withhas be n on 100LL AVGAS with TEL content as low as 61 - 84 of maDiffindicatedetona
the objective of evaluating fleet service experience based upon the premise that the fleet en subjected to operatio
ximum allowable TEL as documented by the Appendix A survey results FAA Service iculty Reports (SDR) were reviewed for indications of detonation incidents as might be
d by reports of ldquoburned pistons eroded pistons burned hole in piston signs of tionrdquo Significant findings and observations are summarized as follows
It is concluded based upon the review of FAA SDR reports for detonation incidents that the occurrence of detonation in the fleet is rare with the total number of detonation incidents at 002 of the fleet surveyed None of the SDR reports indicated fuel was a factor Qualifications regarding SDR reports are discussed in Section 61
r speaks highly of the margins originally designed into the general aviation powerplants in consideration that service experience indicates knock is a rare occurrence within the fleet
Analysis of survey results and engine lead response data indicates the fleet service experience with TEL content at 61 - 84 of max allowable TEL is equivalent to a 94 -38 variance in engine knock margin respectively from the baseline 20 mLgal TEL level The latte
Page 29 of 50 Version 40 Oct 14 2010
8 RECOMMENDATIONS The test results and findings documented within this report indicate the general aviation fleet hasAVGlead codocumented within this report Althtechnicthe aviation industry which are outside the jurisdiction of CRC research In tthe gemainte rovided with the necessary informational training
9 RE
f D02J02
GAS Coalition Briefing EAA AirVenture 2010 July 27 2010
ffects on Engine Performance NAVAER 06-5-501 USAF TO
I28 ldquoExperimental Studies of the Knock-Limited Blending d
inson
(8) Herbert W Schlickenmaier Crown Consulting Inc ldquoAviation Fuels Research Fleet Database 10 (prepared by Crown Consulting Inc under Purchase Order artin NISC II Bridge Contract DTFAWA-08-C-00009 with the
successful service experience with a TEL content of 122 ndash 200 mL TELgal (100LL AS) having a MON of 1016 or greater Technical considerations for specifying a maximum
ntent less than 200 mLgal should obviously be guided by the fleet service experience
ough a reduced TEL content within the range of experience documented within this report is ally feasible there are other non-technical considerations which must be addressed by
he advent of implementation of a reduced TEL AVGAS it is recommended that the FAA and neral aviation industry give consideration to ensuring aircraft owners pilots and nance personnel are p
FERENCES
(1) The History Specification Production Use and Evaluation of Unleaded Aviation Gasoline Report by the D 910 Task Force o
(2) Letter AVGAS Stakeholder Group to EPA dated June 10 2010
(3) Presentation GA AV
(4) ASTM D 910 ldquoStandard Specification for Aviation Gasolinesrdquo
(5) Aviation Fuels and Their ENo 06-5-4 dated 1951 by Ethyl Corporation
(6) NACA Report No E4Characteristics of Aviation Fuelsrdquo N D Sanders R V Hensley R Breitwieser dateOctober 1944
(7) FAA Technical Center Test Results Email dated July 25 2010 D Atwood to R Wilk
Reportrdquo dated October 13 207200006107 from Lockheed MFederal Aviation Administration)
(9) Melanie Thom Baere Aerospace Consulting Inc ldquoReview of Certificates of Analysis and Test Data of Aviation Gasoline for Current Ranges of Lead Additiverdquo dated Sept 9 2010 (prepared for Crown Consulting Inc under Purchase Order 7200006107 from Lockheed Martin NISC II Bridge Contract DTFAWA-08-C-00009 with the Federal Aviation Administration)
(10) FAA Flight Standards Service Aviation Data Systems Branch AFS-620 ldquoFederal Aviation Administration Joint Aircraft SystemComponent Code Table and Definitionsrdquo October 27 2008
(11) CRC Report AV-7-07 ldquoResearch Results Unleaded High Octane Aviation Gasolinerdquo June 17 2010
(12) Alisdair Q Clark BSc PhD ldquoAviation Gasoline History and Futurerdquo IASH 2007 October 2007
Page 30 of 50 Version 40 Oct 14 2010
izations specialized consulting firms the FAA and the CRC
nd Engine Test acility was crucial to the outcome Most importantly it was the foresight of the FAA AFETF
oject to survey FBO AVGAS with the goal of better understanding the mercial AVGAS
Lastly Developme report on their behalf
10 ACKNOWLEDGEMENTS The information contained within this report reflects the participation and commitment of industry specialists representing a broad segment of general aviation including fuel producers test laboratories FBO fuel distributors aviation engine and aircraft manufacturers aviation trade organizations fuel trade organexecutive office The successful completion of the survey of AVGAS properties followed by the compilation and analysis of survey data as complemented by engine testing to investigate engine lead response were made possible in no small part by the actions of those committed to the future of general aviation
The leadership and guidance provided by the Aviation Stakeholders was instrumental in establishing goals and objectives Typical of previous CRC aviation gasoline research projects the participation and contribution of the FAA Technical Centerrsquos Aviation Fuels aFwhich launched the prariance of TEL in comv
the author would like to express his humble appreciation to the CRC Unleaded AVGASnt Group for the opportunity to compile this
- END OF TEXT ndash
Page 31 of 50 Version 40 Oct 14 2010
Page 32 of 50 Version 40 Oct 14 2010
APPENDIX A
ldquoREVIEW OF CERTIFICA OF ANALYSIS AND TEST DATA OF AVIATION GASOLINE FOR CURRENT RANGES OF LEAD ADDITIVErdquo
VER 60 DATED S 9 2010
TES
EPTEMBER
REVIEW OF CERTIFICATES OF ANALYSIS AND TEST DATA OF AVIATION GASOLINE FOR CURRENT RANGES OF LEAD ADDITIVE AssesCurre In an attemptaviation gasoadded to current aviation gasoline This endeavor was to evaluate on a very small sample sASTM D-910 lower lead containing fuels This was done y reviewing the Certificates of Analysis procured for contemporary loads of aviation fuels from a variety of FBOrsquos and test labs as well as fuels used by engine manufacturers for engine certification The result was a sample set of 89 individual data points which were reviewed for the lead content all conver grams of lead per liter of fuel The samples were also segregated by gions using time zones of the manufacturer location and by refinery (blinded for this report) in an attempt to identify if any relationships of lead usage by region or by refiner This report used the data as provided by the manufacturers whose sole responsibility it is to the correctness of the data No assessment of the MON ldquocushionrdquo or evaluation of formulation should be made from this data
sing the Viability of Lowering Lead Levels in nt A iation Gasoline Production v
to demonstrate a commitment to the global community by the line user community it is desirou to reduce the amount of lead s
et the current lead additive levels in fuels currently meeting the specification to assess the industryrsquos current ability to produce
b
ted tore
Prepared by Melanie Thom 992010 Report Prepared for Crown Consulting
Page 33 of 50 Version 40 Oct 14 2010
REVIEW OF CERTIFICATES OF AND TEST DATA OF AVIATION GASOLINE
OR CURRENT RANGES OF LEAD ADDITIVE Aviation Gasoline
rrsquos reports was used t change or prejudi CoArsquos are accepted e industry as a certificate of validation
determined to be veral data points indicated MON
ctive of this survey was
garding the relationship between formulas MON cushion or how the he MON values can be made This analysis should only be used to uels currently meeting ASTM D910 with less than maximum allowable
d content Furthermore the production of VLL 100 requires more than just the reduction in to produce a lower lead ignificant research and
ulations that still meet all the specification uirements
While this is ve of the East resentative of
ions was also ch 21 had a
6 were blends sis This data
3 After reviewing the data it was determined that approximately 39 of the fuel described by the Certificates of Analysis (COA) and industry laboratory reports could meet a 20 reduction in the TEL additive 51 could meet a 15 reduction in TEL and 64 could meet a 10 reduction in TEL as indicated by current production lots
tion fuels with lead contents indicated 44 could meet the 20 reduction and 67 could meet the 15 reduction This is in line with the fielded data
NALYSIS
A
FAssessing the Viability of Lowering Lead Levels in Current
roduction
OTE Survey data consisting of CoA NEG data and engine manufactureithou ce by thurther investigation or verification of the accuracy of the reported data was tside the scope of the researcherrsquos authority It is noted that selues higher than normal Although MON is of interest the primary obje explore and investigate TEL trends in production AvGas
s such no conclusions read reduction will affect t
luate the existence of f
P
NwFouvato Aleeva
alelead The data in this report is only demonstration of the ability of refiners
el not an analysis of how to produce fuel with lower lead Svelopment will be required by refiners to develop form
fudere
q
S
ummary
1 The sample set excluding the ULL study included 89 individual data pointsa small sample set analysis of this data suggests that it is representatiCoast and Midwest There are no obvious indications that it is not repCentral and West Coasts
2 An additional set of Certificates for fuel used during engine certificatsupplied and reviewed This data set included 23 individual entries for whimotor octane value entry and 9 had a lead content Of the 23 samplesprepared from 100LL and iso-octane and were not included in the analywas analyzed separate from the field sample entries
o Of the nine certifica
Page 34 of 50 Version 40 Oct 14 2010
4 Sixteen (16) of the data was from the National Exchange Group (NEG) database and all location and refinery information was previously purged for these samples
5 When separated by refineries 25 of the fuel in the sample set was provided by a single refinery H Another 224 was provided by refinery C When the fuels from the individual refineries were analyzed it was determined that refinery H only produced 5that contained less than 20 TEL additive (1 of 19 samples) At a reduction of 15 and
uction (same of the
10 only 11 of the prod would be in spec 2 fuels 19) This is far
versa This is likely due to the influence of the third component the base alkylate for
o A question was raised that 108 as an MON seemed unlikely With this data point removed the mean was still 1037 and the new maximum was 1076
tent was 040gL and the median was 043 The maximum
10
11 d had a reported MON of greater than 102 sixty percent had an MON greater than 103 and thirty-two percent were
This res search Program at the William J Hughes Technical Center in Atlantic City New Jersey by Baere Aerospace Consulting IMartin NISC B
below the group percentages and indicates that this refinery would likely be unable to meet a lead reduction with current production
6 A review of the data by region and by refinery showed no relationship with the amounts of lead used with the exception of refinery H
7 While there was limited aromatic information available there did not appear to be any relationship between the amount of lead used and the amount of aromatics used Said another way there did not appear to be high lead required with low aromatics or vice
which there is no information
8 The mean MON value was 1037 The maximum was 108 and the minimum excluding a sample set made for the ULL study was 1016
o Of the 15 certification fuel samples the mean MON value was 1038 The maximum value was 1076 and the minimum was1011
9 The mean elemental lead content was 047gL and the median was 048gL The maximum was 056gL and the minimum excluding the ULL study set was 034 gL
o Of the 15 certification samples excluding the blended test samples the mean elemental lead conlead content was 060 gL and the minimum was 008gL
The mean elemental lead content of all analyzed samples excluding blend samples was 046gL This value is 82 of the maximum lead level permitted (046 056)
Eighty-seven percent (87) of the samples reviewe
greater than 104 Only five percent were higher than 105
earch was funded by the Federal Aviation Administrations Fuels Re
nc for Crown Consulting Inc under Purchase Order 7200006107 from Lockheed II ridge Contract DTFAWA-08-C-00009 with the Federal Aviation Administration
Page 35 of 50 Version 40 Oct 14 2010
ConteSummar
Discussio
Backg
Sa
Reg 37
Lead
Oth
Develo ion Levels 39
Analysis
Combined Data 40
By Region
By Refinery
From Engine C 42
Conc
Annex ndash 44
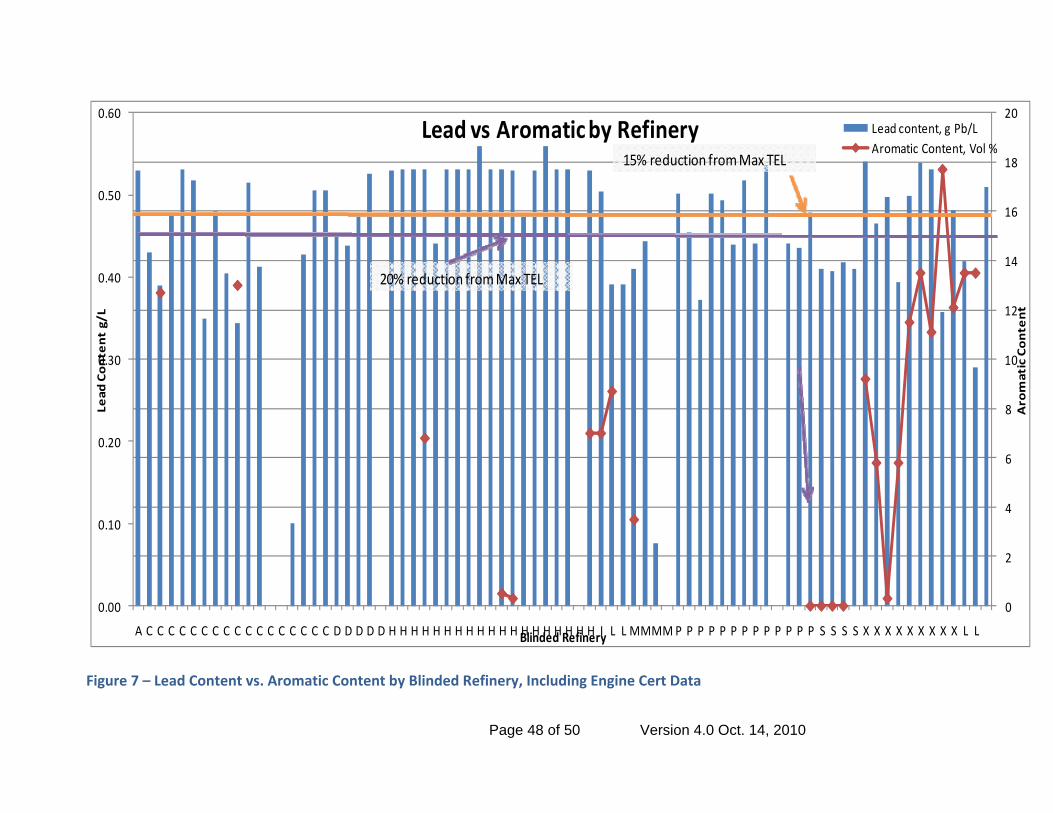
Figure 1 ndash US TiFigure 2 ndash Table 38 Figu 44 Figure 4 ndash Lead Content vs Aromatic Content Including Engine Cert 45 FiguFigure 6Fuels 47 igure 7 ndash Lead Content vs Aromatic Content by Blinded Refinery Including Engine Cert Data 48
nts y 34
n 37
round 37
mple Handling 37
ion Identifier
MON Values from Aviation Lean Ratings 38
Content 39
er Data Sources 39
pment of Max Lead for Reduct
39
40
401
ertification Fuels
lusions 43
Graphical Representations of the Data
me Zones 38 9 from ASTM D‐2700
re 3 ndash Supercharge rating vs Motor Octane Number vs Lead content Including Engine Cert
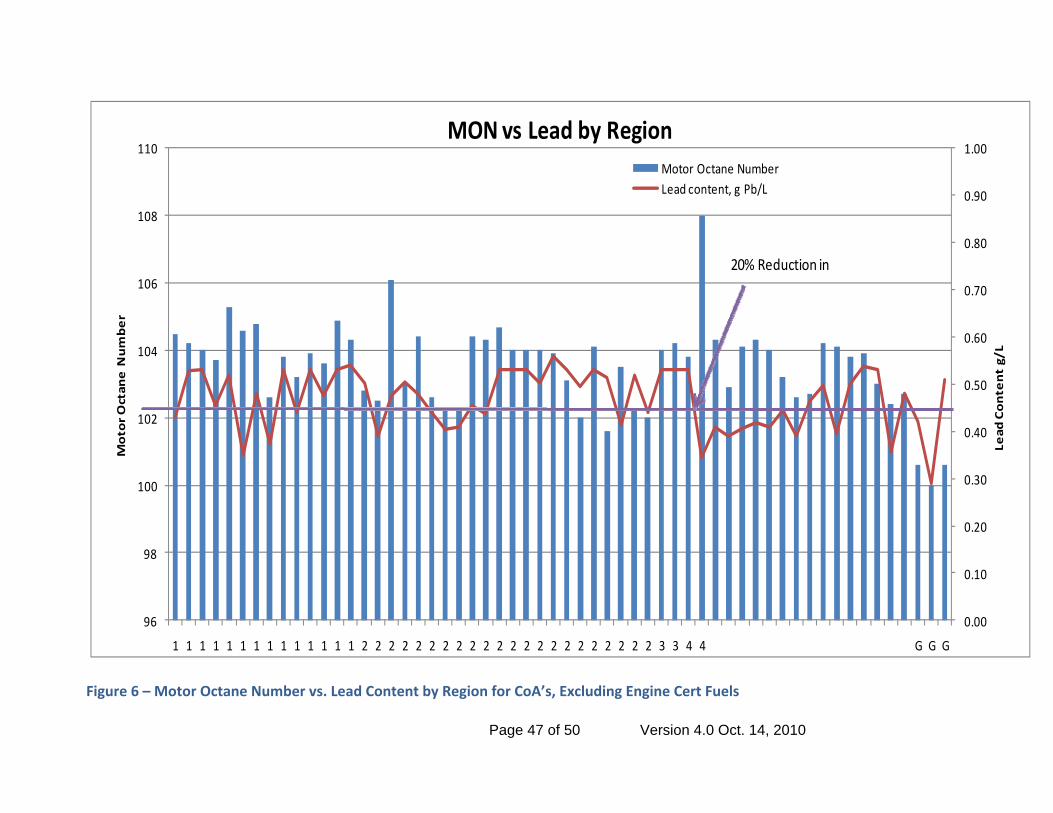
re 5 ndash Lead Content vs Aromatic Content by Region for CoArsquos Excluding Engine Cert Fuels46 ndash Motor Octane Number vs Lead Content by Region for CoArsquos Excluding Engine Cert
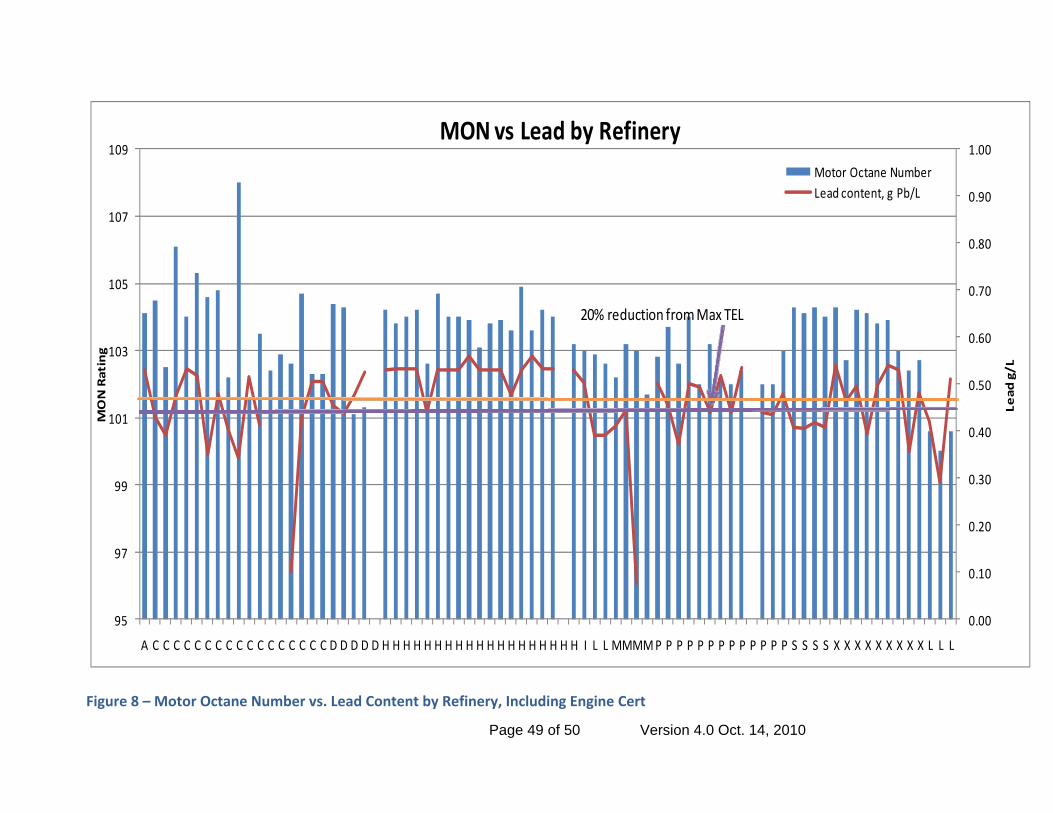
FFigure 8 ndash Motor Octane Number vs Lead Content by Refinery Including Engine Cert 49 Figure 9 ndash Motor Octane Number vs Lead Content Specific to the Engine Certification Fuel 50
Page 36 of 50 Version 40 Oct 14 2010
Discussion
Background
PA issued an advanced notice of proposed rulemaking and requested input on data
reducing the amount of lead used in current compliant fuel formulations was considered as a
opadspaviation com The refiners seemed uncomfortable providing an assessment of their formulas and their current leaddiscouleadthe actu The third activity was a review of the CoArsquos for currently supplied fuel The hypothesis was that
ability to produce fuel with lower than maximum lead This collection was accomplished by resethfromanufath
nalysis were collected as copies from the FBOrsquos where fuel was purchased he FBOrsquos were selected randomly The data from the certificates were entered into a
In 2010 the Egaps As part of the Industry Stakeholders FAST plan to respond to the EPA the possibility of
near-term means of responding In the short time available several options for evaluating this tion were proposed 1) having the refiners report on their current ability to reduce their lead ditive levels and meet specification 2) having refiners blend very low lead (VLL) fuel meeting ecification and have it tested and 3) review current Certificates of Analysis available in the
munity and assess the actual lead content of current compliant fuels
additive levels Several of the refiners did agree to blend VLL formulas but there was rse over time regarding whether the refiners should take current formulas and just add less
and see what resulted or whether they should adjust the rest of the formula to maintain all of specified properties The activity was further complicated by the length of time necessary to ally blend the fuel and then test it
this was fuel that was currently produced If it had lower than maximum lead it indicated the
presentatives from the FAA Technical Center requesting and collecting CoArsquos from a random lection of Fixed Based Operations (FBOrsquos) In some cases fuel samples were collected from e FBO and specifically analyzed by an independent laboratory In addition to the data collected m FBO fuels the laboratory analyses from the certification fuels used by the engine
cturers and data from the NEG analyses were collected This data was compiled and en analyzed and is the topic of this report
Sample Handling The certificates of aTspreadsheet For those fuels collected from the FBOrsquos the laboratory data sheets were used as the source of the data The data was entered as provided no entries being made where data was not provided The only exception was for the values of MON and lead content as indicated below Each sample also had its refinery identity blinded such that the data could be sorted based on the refinery but so the refinersrsquo identification was not included in the data set
Region Identifier Each refinery listed was given a regional ID by using the US time zones based on the location of the refinery In some cases the location of the refinery was overtly provided In other cases it was inferred based on the primary location of a companyrsquos refinery For example one company had two locations at which they produced aviation gasoline both in the same time zone Thus any sample from this company could reasonably be placed in a time zone Each location was given a number based on the zones as shown in Figure 1 The small numbers of global aviation gasoline samples were just coded as ldquoglobalrdquo
Page 37 of 50 Version 40 Oct 14 2010
(MON) using Table 9 found in ASTM D-2700-09 and produced in
Figure 1 ndash US Time Zones
MON Values from Aviation Lean Ratings Some of the CoArsquos provided the octane performance as aviation lean ratings These were converted to motor octane numbers reFigure 2 The aviation lean rating was found on the table and the equivalent MON read off of the axes Where necessary the value was interpolated An example is shown in Figure 2 for a lean rating of 11228 being converted to a MON of 1042 Note that a MON of 100 is equivalent to a performance number of 1017 A performance number of 100 results in a MON value of 998
123
4
Figure 2 ndash Table 9 from ASTM D‐2700
Page 38 of 50 Version 40 Oct 14 2010
Page 39 of 50 Version 40 Oct 14 2010
For the were converted to a uniform unit of grams milliliters of TEL the conversion factor as lead in gallons these values were co
Other DataIn additio was included as a separate entry These data ed to confirm inter-laboratory
as average values with the
Data were also provided from engine manufacturers from their engine certification trials These d fuels blended specifically as test fuels
analysis
idual fuels that would have met the maximum levels was counted and reported It s meeting specification it was an indication that
with the indicated levels that met specification he larger population within an acceptable level
located in the Annex located at the end of the ction levels the 20 reduction is indicated by a
nge line
is analysis the analyst has only the values as of Analysis from which to perform the analysis The sole purpose of
this analysis was to determine whether there are currently fuels in the distribution network meeting minimum D910 cation with a lower than maximum permitted lead content It is not intended to be an analysis of the cushion in MON The values used in this analysis including MON are as provided For MON the values are either directly repo N or have been converted from values provided as Aviation Number Ratings (lean ratings) to MON The analyst has in good faith assumed the refiner providing the data via a CoA has provided correct data The analyst is not in a position to second guess correct reporting from incorrect reporting With respect to MONperformance number if 108 is assumed to be wrong what about 106 Or 105 Or 102 If part of the data is assumed to be incorrect then all of the data should be assumed to be incorrect
Lead Content
purpose of analysis all of the provided lead contents of lead per liter (gPbL) For lead contents provided as
of 1mL TEL = 10589 g Pb was used For those providednverted to liters 1 US gallon = 3785 liters
Sources n to the data from CoArsquos data from the NEG data
are averaged values from a set of samples usrepeatability of specification testing These data were providedrefinery information purged prior to receipt
data included both generic fuel procured for the test anOnly the actual aviation gasoline data were used for the
Development of Max Lead for Reduction Levels In order to assess the maximum reduction level that might be achieved the maximum lead content for each of three reduction levels was computed The reductions considered were 20 15 and 10 reduction from current maximum lead content permitted by specification This correlated to maximum elemental lead levels of 045 gPbL 048 and 051 For the analysis the
umber of indivnwas assumed that a) because these were fuelindividual refiners could currently produce fuels and b) that the small sample set would replicate t
Analysis For the following evaluations all of the charts are document For charts indicating the lead redupurple line and the 15 reduction indicated by an ora
Caveat on MON data With respect to the MON values reported in thprovided by the Certificates
specifi
rted as MO
Furthermore because the values of MON and rating numbers converge around 100 and 100 ne considered for compliance to specification the conclusions in this report are
by using incorrect MON data around or above 100 The extent of the
on may be warranted within the aviation gasoline producing industry
results of this analysis to make any assessments garding the formulation of aviation gasoline the relationships between lead and MON or the
aluate whether there was any bservable correlation between the supercharge rating the motor octane number and the lead
alues showed observable variations
s indicating the 20 reduction (purple) and the 15 reduction (orange) m TEL level are included on the graph This visually indicates the observation that
t This is not a weighted average atches of fuel is available
ecause it is known that refiners have basically three major building blocks with which to achieve
ount of lead used In some cases the
region of the country at which e fuel was produced the data were separated by regions based on time zones and then sorted
MON is the baseliot significantly impactedn
exceedance of MON to specification minimum is neither the purpose of this effort nor has any impact on the analysis towards the actual purpose a survey of how much lead is being used in currently delivered 100LL Reporting the MON serves only to confirm the fuels did meet specification independent of the amount of lead additive used and the MON data serves no other purpose in this analysis Therefore while discussiregarding the accuracy of the CoA sheets the actual status of the MON values has no substantive impact on the conclusions drawn for this report Readers are discouraged from using the recushion in MON for production
Combined Data The first exercise after completion of the datasets was to evocontent of the fuel Figure 3 ndash Supercharge rating and Motor Octane Number vs Lead content Including Engine Cert Figure 3 ndash Supercharge rating and Motor Octane Number vs Lead content Including Engine Cert contains all of the data from the CoArsquos the NEG data and the engine certification data excluding blended experimental samples This analysis was done to see if there was any indication of a correlation between observable variations in the supercharge rating and the motor octane number with changes in lead content No correlations were observed All of the MON values were reasonably consistent while the leadv In addition to the data line
the maximuinwas mathematically calculated that between 33 and 40 of the samples would meet the 20 reduction in maximum TEL content About 50 of the samples would meet 15 reduction in maximum TEL and 64 would meet 10 reduction in maximum TEL These values remained relatively constant as additional data was included in the dataseas no data on the size of the individual b Bthe desired MON and supercharge rating ie the alkylate the lead and the aromatic content it was desirous to evaluate any relationships between the building blocks No information was available for the alkylate type or quality so the relationship between aromatic content and lead content was evaluated This is shown graphically in Figure 4 Unfortunately few of the datasheets included a value for aromatic content For those samples that did there appeared to
e no correlation between the aromatic content and the amblead and aromatic were relatively higher together as compared to other samples and in other cases samples with high lead had low aromatics This was most likely due to differences in the type of alkylate used No correlation could be drawn from these data By Region
an attempt to determine if there were any trends based on theInth
Page 40 of 50 Version 40 Oct 14 2010
based on these regions The data were again graphed to evaluate lead content versus aromatic content by region excluding the engine certification data Because of the method for procuring the data the majority of the samples that could have a region attributed to them were from region one and two An attempt to identify whether aromatics were used more prevalently in a specific region was also made The data was graphed comparing aromatic content to lead content by region and is shown in Figure 5 Again the analysis was hampered by a lack of aromatic content data Those amples having aromatic content were primarily in data that could not be attributed to a region
he MON vs Lead was graphed and is shown in Figure 6 In general there was just as much
d to a specific region had similar variability in the data The samples attributed to non-US manufacturers ldquoglobalrdquo did have nearly exactly 100 MON values
ng prepared specifically for an ULL test
ould not continue to produce fuel could account for the
20 reduction 47 of the me and a 15 reduction about 53 of the time Further analysis of the use of lead by refinery
wo of the refineries with two and four samples respectively could meet the
sThe three global samples did show higher aromatic content but these were fuel samples blended specifically to be ULL samples Tvariability in both the MON and the lead content in regions one and two Regions three and four had similar sample values however with only two data points no conclusion can be reasonably drawn The data not attribute
but this was due to bei Again no trends in the data by region for either the MON vs Lead or the Aromatics vs Lead were observed with one possible exception There did appear to be slightly higher lead used in region two This however is likely explained by a review of the data by refinery presented in the next section
By Refinery There is a concern that a decision to reduce the maximum lead content may result in single refineries being unable or unwilling to continue to produce aviation gasoline Even if 40 of the refineries sampled are capable of producing spec fuel with lower lead there is a concern that it is
ossible that one of the 60 that wpmajority of the aviation gasoline produced Unfortunately it is beyond the scope of the data and this report to comment on that risk It was possible however to evaluate the currently produced fuel by the refiner of record on the CoA This gives no information on the refinerrsquos abilities to produce fuel of a lower lead content over time but it does give information on the existence of fuel produced by a refiner with lower lead contents at individual points in time There is also no data available on the sizes of the individual batches meaning no assessment of the impact of losing one refinery would have on the overall fuel production levels A review of the aromatic content by refiner shown in Figure 7 again showed too little aromatic data to be of value drawing conclusions However a review of the MON vs Lead data showed graphically in Figure 8 indicates there is a strong correlation in lead content for one of the blinded refineries The refinery indicated by ldquoHrdquo showed the routine use of nearly maximum TEL In only one instance was less than 045gPbL used and that instance correlated to a lower MON content at the same time For the dataset reviewed this refinery accounted for nearly one quarter of the fuel samples considered It is not known if this relationship is comparable to the industry position for the refinery Two of the refineries accounted for just under half of the samples reviewed One was refinery ldquoHrdquo
lready discussed The second was refinery ldquoCrdquo which could meet theatiindicated that t
Page 41 of 50 Version 40 Oct 14 2010
045gPbL limit with all their samples These two refineries only accounted for 8 of the samples reviewed and accounted for only six samples Refinery D with four samples could meet the 15 reduction with all the provided samples The breakdown of the remaining refineries is shown below in Table 1 Refinery Number
Table 1 ndash Refinery versus ability to produce lower lead in spec aviation gasoline
From Engine Certification Fuels
content was 040gPbL which was lightly lower than the general data
In addition to reviewing the fuels as an agglomeration the fuels were also reviewed specific to the dataset provided on the fuels used for engine certifications It was noted that not all of this data included any lead content data however all of the data including the blended test fuels provided MON values or Aviation Lean Rating values that were converted to MON Of the 15 samples provided 9 of them included a lead content This data is provided graphically in Figure 9 The maximum elemental lead content indicated for the engine certification fuels was 060gL which is out of specification high The minimum value indicated was 008gL This may have been a typographical error as it was reported to be 029gPbgal which would have been more in line with other data as 029gPbL As entered the mean leads This dataset like the industry dataset indicated a similar breakdown of approximately 40 being able to meet the 20 reduction 67 meeting the 15 reduction and 67 meeting the 10 reduction
Page 42 of 50 Version 40 Oct 14 2010
Page 43 of 50 Version 40 Oct 14 2010
ased on the review of the provided data five basic conclusions can be drawn
1 Ba n t 13 s cuproduced are l n ctspecification lead levels At a 15 reduction approximately frac12 would meet spec
2 The primary supplier of repre nting 24 of the dreduction of t lead level his supplier met axi adreduction in 11 of the sa
3 There doe ar t be a relation p between r s an co xcthe impact of the single i ry on th r gion da
4 No obvious relationship e drawn based on the le arlack of lead data and no information on alkylates There were instances of high lead with
a Similarly no relationship was found between the lead level and the motor octane number or the supercharge rating
had motor octane values higher than 102 and 60 er than 105
Conclusions B
sed on a agglomeration of the sampbelow the
le dataead conte
about at a 20
of the sampleredu
rrently current maximum ion over
fuel se ataset could not meet a 20 he maximum T the m mum le level at a 15
mples
s not appe o shi egion d lead ntent e luding ref ne e e ta
can b ad and omatics data due to the
high aromatics and low lead with high aromatics
5 Of the samples reviewed over 87were over 103 Only 5 were high
Annex ndash Graphical Representations of the Data
000
010
020
030
040
050
060
070
M ne berotor Octa Num
0
20
40
60
80
100
120
140008
034
036
039
039
041
041
041
041
042
043
044
044
044
045
047
048
048
048
049
050
050
051
052
053
053
053
053
053
054
056
MON and Supercharge
Lead content gL
Motor Octane and upercharg s d
052
S
053
053
e v
053
LeaSuperNumb
c e Performance ehargr
Rating
Lead co t Lnten g Pb
Linear or Octane Number)(Mot
053
060
gPbL
20 reduction from Max TEL (M045 gL)
ax 15 re(Max
duction fro48 gL)
m EL0
Max T
Figure 3 ndash Supercharge rating and Motor Octane Number vs Lead con ng tent Includi Engine Cert
Page 44 of 50 Version 40 Oct 14 2010
000
010
020
030
040
050
060
070
0
2
4
6
8
10
12
14
16
18
20008
034
036
039
039
041
041
041
041
042
043
044
044
044
045
047
048
048
048
049
050
050
051
052
052
053
053
053
053
053
053
053
053
053
054
056
060
Lead
Content gL
Aromatic Content Vol
gPbL
Aromatic Content vs LeadAromatic Content Vol Lead content g PbL
igure 4 ndash Lead Content vs Aromatic Content Including Engine Cert F
MON vs Lead by RegionMotor Octane NumberLead content g PbL
20 Reduction in
Figure 6 ndash Motor Octane Number vs Lead Content by Region for CoArsquos Excluding Engine Cert Fuels
Page 47 of 50 Version 40 Oct 14 2010
000
010
020
030
040
050
060
A C C C C C C C C C C C C C C C C C D D D D D H H H H H H H H H H H H H H H H H H H I L L MMMMP P P P P P P P P P P P P S S S S X X X X X X X X X L L
0
2
4
6
8
10
12
14
16
18
20Lead
Content gL
Blinded Refinery
Aromatic Content
Lead vs Aromatic by Refinery Lead content g PbLAromatic Content Vol
20 reduction from Max TEL
15 reduction from Max TEL
Figure 7 ndash Lead Content vs Aromatic Content by Blinded Refinery Including Engine Cert Data
Page 48 of 50 Version 40 Oct 14 2010
000
010
020
030
040
050
060
070
080
090
100
95
97
99
101
103
105
107
109
A C C C C C C C C C C C C C C C C C D D D D D H H H H H H H H H H H H H H H H H H H I L L MMMMP P P P P P P P P P P P P S S S S X X X X X X X X X L L L
Lead
gL
MON Rating
MON vs Lead by RefineryMotor Octane NumberLead content g PbL
20 reduction from Max TEL
Figure 8 ndash Motor Octane Number vs Lead Content by Refinery Including Engine Cert
Figure 9 ndash Motor Octane Number vs Lead Content Specific to the Engine Certification Fuel
Page 50 of 50 Version 40 Oct 14 2010
INVESTIGATION OF
REDUCED TEL CONTENT
IN COMMERCIAL100LL AVGAS
Summary
Discussion
Background
Sample Handling
Region Identifier
MON Values from Aviation Lean Ratings
Lead Content
Other Data Sources
Development of Max Lead for Reduction Levels
Analysis
Caveat on MON data
Combined Data
By Region
By Refinery
From Engine Certification Fuels
Conclusions
Annex ndash Graphical Representations of the Data
The Coordinating Research Council Inc (CRC) is a non-profit corporation supported by the petroleum and automotive equipment industries CRC operates through the committees made up of technical experts from industry and government who voluntarily participate The four main areas of research within CRC are air pollution (atmospheric and engineering studies) aviation fuels lubricants and equipment performance heavy-duty vehicle fuels lubricants and equipment performance (eg diesel trucks) and light-duty vehicle fuels lubricants and equipment performance (eg passenger cars) CRCrsquos function is to provide the mechanism for joint research conducted by the two industries that will help in determining the optimum combination of petroleum products and automotive equipment CRCrsquos work is limited to research that is mutually beneficial to the two industries involved and all information is available to the public CRC makes no warranty expressed or implied on the application of information contained in this report In formulating and approving reports the appropriate committee of the Coordinating Research Council Inc has not investigated or considered patents which may apply to the subject matter Prospective users of the report are responsible for protecting themselves against liability for infringement of patents
Page 2 of 50 Version 40 Oct 14 2010
COORDINATING RESEARCH COUNCIL INC
3650 MANSELL ROAD SUITE 140 ALPHARETTA GA 30022
TEL 678795-0506 FAX 678795-0509 WWWCRCAOORG
INVESTIGATION OF REDUCED TEL CONTENT
IN COMMERCIAL 100LL AVGAS
(CRC Project No CA-67-2010)
In formulating and approving reports the appropriate committee of the Coordinating Research Council Inc has not investigated or considered patents which may apply to the subject matter Prospective users of the report are responsible for protecting themselves against liability for infringement of patents
Prepared by
R E Wilkinson for the CRC UL AVGAS Development Group
OCTOBER 14 2010
CRC Aviation Fuel Lubricant amp Equipment Research Committee of the
Coordinating Research Council Inc
Page 3 of 50 Version 40 Oct 14 2010
TABLE OF CONTENTS
List of Figureshelliphelliphelliphelliphelliphelliphelliphelliphelliphelliphelliphelliphelliphelliphelliphelliphelliphelliphelliphelliphelliphelliphelliphelliphelliphellip 5 List of Tableshelliphelliphelliphelliphelliphelliphelliphelliphelliphelliphelliphelliphelliphelliphelliphelliphelliphelliphelliphelliphelliphelliphelliphelliphelliphellip 5 List of Abbreviations amp Symbolshelliphelliphelliphelliphelliphelliphelliphelliphelliphelliphelliphelliphelliphelliphelliphelliphelliphellip 6 Forewordhelliphelliphelliphelliphelliphelliphelliphelliphelliphelliphelliphelliphelliphelliphelliphelliphelliphelliphelliphelliphelliphelliphelliphelliphelliphelliphelliphellip 8 1 Introductionhelliphelliphelliphelliphelliphelliphelliphelliphelliphelliphelliphelliphelliphelliphelliphelliphelliphelliphelliphelliphelliphelliphelliphelliphelliphelliphelliphellip 9
IMEP Indicated Mean Effective Pressure = [792000 X IHP] [CID X RPM]
ISFC Indicated Specific Fuel Consumption
JASC Joint Aircraft SystemComponent Code (FAA)
Page 6 of 50 Version 40 Oct 14 2010
LOP Lean of Peak [ Refers to fuel flow setting lean of peak EGT]
MAP Manifold Pressure typically inches Hg absolute
mLgal Milliliters per gallon
mmHg Millimeters of mercury
MON Motor Octane Number (ASTM D 2700)
NAAQS National Ambient Air Quality Standard
NACA National Advisory Committee for Aeronautics
NATA National Air Transportation Association
OEM Original Equipment Manufacturer
PN Performance Number (ASTM D 909)
POH Pilot Operating Handbook
PRF Primary Reference Fuel
PSIG Pounds per square inch gage
RPM Revolutions Per Minute
RGL Regulatory and Guidance Library (FAA)
ROP Rich of Peak [Refers to fuel flow setting rich of peak EGT]
RVP Reid Vapor Pressure
SAE Society Automotive Engineering (SAE International)
SC Supercharge Rating (ASTM D 909)
SDR Service Difficulty Report (FAA)
TCDS Type Certificate Data Sheet (FAA)
TDC Top Dead Center (piston position)
TEL Tetraethyl Lead
UL Unleaded
ULL Ultra Low Lead
VLL Very Low Lead
WOT Wide Open Throttle (same as full throttle)
100LL 100 Octane Low Lead AVGAS
Page 7 of 50 Version 40 Oct 14 2010
FOREWORD The source for the 100LL AVGAS survey data presented within this CRC report is a technical report prepared under contract by Crown Consulting Inc for the FAA William J Hughes Technical Center The contents of this CRC report are intended to document the results of the survey of TEL content in commercial AVGAS as commissioned by the FAA Technical Center working as a member of the CRC Unleaded AVGAS Development Group and the CRC VLL Task Group and to provide additional supporting technical data analysis and discussion where applicable
The work product of CRC research is technical data which is made available to industry as a means of enabling the industry decision process It is not the intent of this report to provide a recommendation for a specific reduction in TEL content but rather the objective is to provide technical data and analysis sufficient to enable and facilitate industryrsquos decision making process regarding a reduction in 100LL AVGAS lead emissions
Where applicable throughout this report the source of information or data is identified as a numbered reference A numerical listing of these references is included at the end of this report The author of this report has attempted to objectively document results in a summary manner using the FAA survey results and engine test results there are no changes to data or conclusions
The objective of the CRC UL AVGAS Dev Group is to conduct research and testing that will facilitate development of the next generation aviation gasoline with the goal of ensuring the availability of the required technical information for the development of an unleaded aviation gasoline that meets the requirements of both the existing and future general aviation fleet Working as a subcommittee of the CRC UL AVGAS Dev Group is the CRC VLL AVGAS Task Group which was tasked by industry to conduct research into options for reducing the lead emissions of 100LL AVGAS
A future technical report to be published by the FAA Technical Center will document the details of the engine testing conducted on a group of candidate reduced TEL AVGAS blends furnished by the fuel producers
Note that although the term ULL (ultra low lead) had been previously used to describe a reduced TEL content AVGAS the descriptor VLL (very low lead) has been recommended as the preferred suffix ie 100VLL and is the term of reference applied within this report for a reduced TEL content AVGAS This also avoids confusion with unleaded AVGAS development where the suffix ldquoULrdquo has been proposed for unleaded grades
Page 8 of 50 Version 40 Oct 14 2010
1 INTRODUCTION Aviation gasoline is produced pursuant to ASTM D 910 Standard Specification for Aviation Gasolines and DEF STAN 91-90 (British Ministry of Defense) where the maximum allowable tetraethyl lead (TEL) content for Grade 100130LL (hereafter referred to as Grade 100LL in this report) is restricted to a maximum level of 056 gPbL (053 mL TELL 200 mL TELgal) Grade 100LL was introduced during the 1970rsquos as a reduced TEL content AVGAS replacing the previous Grade 100130 which was limited to 084 gPbL ( 08 mL TELL 300 mL TELgal) Grade 100LL offered a significant reduction in TEL content from the prior Grade 100130(1) Although ASTM D 910 includes provisions for AVGAS Grades 8087 9198 and 100130 the 100LL AVGAS product is the predominant AVGAS produced world-wide and used by the general aviation piston fleet The octane quality and associated knock resistance of aviation grade gasoline has relied almost exclusively on the octane enhancing additive TEL which has been used as a knock suppressant in aviation gasoline since the late 1920rsquos The compound TEL is the primary fuel additive enabling the high octane quality fuel required by high performance high compression ratio aviation engines As domestic environmental measures have continued to reduce the use of lead in manufactured products aviation gasoline today remains the only domestically produced gasoline containing TEL The general aviation industry has accordingly committed to pursue options for unleaded aviation gasoline including both near term and long term strategies for reduction of TEL content The AVGAS Stakeholder Group is a broad based coalition which represents the general aviation industry today relative to future unleaded aviation gasoline The Stakeholder Group is working collaboratively with the industry manufacturers the FAA and the EPA to formulate and implement plans providing for reductions in lead emissions as associated with the 100LL AVGAS product A major tenant of the Stakeholderrsquos Group near term plan includes research into options for a reduced TEL content 100LL AVGAS In August 2009 the AVGAS Stakeholder Group petitioned the CRC Unleaded AVGAS Development Group to investigate and conduct research into options for a reduced TEL content AVGAS Since that time the CRC VLL Task Group working as a subset of the CRC Unleaded AVGAS Development Group has conducted test and evaluation of reduced TEL content AVGAS and has provided input and support to the FAA Technical Centerrsquos investigations into TEL production levels for commercial FBO AVGAS Working as a member of the CRC VLL AVGAS Task Group the FAA William J Hughes Technical Center has completed a survey of FBO 100LL AVGAS for TEL content and associated ASTM D 910 properties for the specific purpose of documenting TEL content for commercial 100LL AVGAS as used by the active fleet Complementing the TEL study a review of FAA Service Difficulty Reports (SDR) was performed for the purpose of searching for reports of detonation related service incidents for the piston powered fleet The objective of this report is to document the findings and observations associated with the survey of FBO AVGAS TEL content and associated properties including search results of the FAA SDR database for detonation incidents Also documented within the survey report are 100LL AVGAS production TEL levels for a major AVGAS producer and the TEL content for AVGAS used in official FAA certification testing by the OEM engine manufacturers Test results for a series of full scale engine tests performed with a group of partially leaded fuels to assess the ldquolead responserdquo of a representative high output worst case conventional reciprocating engine are included as complementary data It is not the intent of this report to provide a recommendation for a specific reduction in TEL content but rather the objective is to provide technical data and analysis sufficient to enable industryrsquos decision making process regarding a reduction in TEL content
Page 9 of 50 Version 40 Oct 14 2010
2 BACKGROUND 21 GENERAL AVIATION LEAD REDUCTION INITIATIVE
The National Ambient Air Quality Standards (NAAQS) were updated by the EPA in 2008 to reduce allowable levels of lead by 90 The revised standard requires measurement of lead levels in the vicinity of general aviation airports For each location found to be in a non-attainment status with the NAAQS the State must develop a plan approved by the EPA to reduce lead emissions to bring these areas into attainment by 2017 As a result of this regulatory action there is an urgent emphasis on addressing measures for reducing lead emissions from general aviation aircraft The Aircraft Owners and Pilots Association (AOPA) the Experimental Aircraft Association (EAA) the General Aviation Manufacturers Association (GAMA) the National Air Transportation Association (NATA) the National Business Aviation Association (NBAA) the American Petroleum Institute (API) and the National Petrochemical and Refiners Association (NPRA) comprise the AVGAS Stakeholders Group which represents the General Aviation aircraft owners operators and manufacturers and the oil and natural gas industry producers refiners and distributors of aviation grade gasoline (AVGAS) This AVGAS Stakeholder Group is actively engaged in working with the manufacturers the FAA and the EPA to achieve significant reductions in lead emissions for the General Aviation piston powered fleet which requires a minimum grade 100LL AVGAS(2) The stated purpose of this Group is to collaborate coordinate and provide leadership leading to the development and implementation of the process by which an unleaded AVGAS solution will be identified(3)
The AVGAS Stakeholder Group has identified both near term and long term strategies leading to the eventual transition to an unleaded AVGAS which are extracted from reference (3) as follows(3) The Stakeholder Group Near Term Strategy provides for a near-term reduction of lead emissions from General Aviation aircraft based upon the following criteria Note that the suffix VLL is used within this report to indicate a reduced TEL content AVGAS the final determination and selection of a suitable suffix may well differ from the modifier VLL the suffix ULL had previously been used to indicate a reduced TEL content AVGAS
AVGAS STAKEHOLDER GROUP NEAR TERM STRATEGY (3)
A drop-in 100VLL as a replacement for 100LL
Requires no action from manufacturers or operators
No impact on engine or aircraft FAA certification
The use of 100VLL lowers total lead emissions in airport areas where
monitoring may determine the current NAAQS standard is not being met
Page 10 of 50 Version 40 Oct 14 2010
Although not the subject of this report the AVGAS Stakeholder Long Term Strategy is structured around five major phases which are extracted from reference (3) and repeated as follows
AVGAS STAKEHOLDER GROUP LONG TERM STRATEGY (3)
Phase I ndash Establish FAA-led public-private partnership
Develop and implement an integrated FAA program to provide the
information necessary for the marketplace to identify the best unleaded solution which is technically feasible
Phase II ndash Identify viable unleaded AVGAS specification
Evaluate current D910 fuel specification to determine which
parameters can be adjusted Identify and support research needs for development of an
unleaded AVGAS specification Define all criteria for a viable unleaded AVGAS Develop engine and aircraft certification processes to transition
existing fleet to a new fuel
Phase III ndash Develop and approve an ASTM fuel specification
Phase IV ndash Certify new production aircraft to new fuel specification
Only affects new production engines and aircraft Would require dual certification for unleaded and 100LL AVGAS
Phase V ndash EPAFAA regulate transition to unleaded AVGAS (includes
FAA approvals amp certifications necessary for safety) Transition timeline dependent upon level of impact
FAA approvals amp certifications necessary for safety AVGAS production amp distribution infrastructure
Regulation may need to consider special provisions if there are portions of the fleet that cannot transition within the timeframe
Page 11 of 50 Version 40 Oct 14 2010
22 ASTM D 910 SPECFICATION ldquoASTM D 910 Standard Specification for Aviation Gasoline and DEF STAN 9190 (British Ministry of Defense) are recognized throughout the world as primary specifications for the production and quality control of AVGASrdquo(1) ASTM D 910 which was first introduced in 1947 currently provides for four different aviation grade gasolines Current aviation grade gasolines are summarized in Table 1 of ASTM D 910 which is repeated below as Table 10 for the purpose of identifying TEL limits and associated octane ratings As shown the maximum allowable TEL content for Grade 100LL is 056 gPbL (053 mLL) which is equivalent to 200 mLgal There is no minimum limit specified for current TEL content Aviation grade 100LL has gradually become the predominant fuel used by the general aviation piston fleet both domestically and globally where the 100LL AVGAS is approved for use on those aircraft and engines originally certified for lower grades 8087 and 9198 For information on international specifications by country of origin for aviation gasoline refer to reference (1)
Table 10 Detailed Requirements for Aviation Gasolines (4)
Extracted from ASTM D 910-04a Specification Grade
80 Grade
91 Grade 100LL
Grade 100
ASTM Test Method
Knock Value lean mixture
Octane Number Min
800
910
995
995
D 2700
Knock Value rich mixture Octane Number Performance No
Min Min
870
980
1300
1300
D 909 D 909
Tetraethyl lead mL TELL gPbL
Max Max
013 014
053 056
053 056
106 112
D 3341 or D 5059
Color red brown blue green D 2392
23 AVGAS HISTORICAL TEL CONTENT Historically the TEL content in aviation gasoline has continued a downward trend from the high levels of 460 mLgal (max) allowed in the early Grade 115145 aviation gasoline to the current 200 mLgal (max) specified for the Grade 100LL AVGAS Grade 100130 which was the predecessor to 100LL had a maximum TEL content of 300 mLgal Grade 100 is listed today as containing a maximum 400 mLgal TEL although Grade 100 is not currently a production fuel As precipitated by a growing environmental awareness in the 1970rsquos Grade 100LL AVGAS was introduced during the 1970rsquos which provided a significant reduction in TEL content and associated lead emissions Grade 100LL AVGAS gradually became the predominant global aviation gasoline for piston powered aircraft Table 20 which is extracted from a 1951 document reference (5) provides further insight into historical aviation gasoline grades and their associated critical properties including TEL content Reference 5 indicates the MIL-F-5572 specification allowed a higher TEL content for the 9196 and 100130 grades than specified in the D910-48T specification Reference (12) provides additional insight and data on the development and characteristics of aviation gasoline
Page 12 of 50 Version 40 Oct 14 2010
460
300 300
400
200 200
0490
05
1
15
2
25
3
35
4
45
5
TEL mLgal
115145 108135 100130 100 100LL 9198 8087
AVGAS GRADE
AVGAS TEL Max Content [mL TELgal]
Figure 10 Historical AVGAS TEL Content Ref ASTM D 910
Table 20 Summary of 1951 Military amp Commercial Aircraft Gasoline Specifications (5)
End point max degF 338 338 338 338 338 338 338 338 338 Lead mlUS gal max 05 46 46 46 05 20 30 30 46 Color Red Blue Green Purple Red Blue Green Brown Purple Freezing Point max degF -76 -76 -76 -76 -76 -76 -76 -76 -76 Octane number lean min 80 91 100 - 80 91 100 - - Performance no lean min (583) (76) 100 115 (583) (76) 100 108 115
Octane no rich min - 96 - - 87 98 - - - Performance no rich min - (875) 130 145 (68) (875) 130 135 145
Heat value Btu per lb min 18700 18700 18700 18700 18700 18700 18700 18800 18800
3 TEL EFFECT ON ENGINE PERFORMANCE The compound tetraethyl lead (TEL) has a powerful effect on engine performance specifically as an anti-knock agent when used as an additive in aviation grade gasoline The fuel octane rating needed to ensure that an engine will operate knock free is considered to be a first order requirement for an aviation spark ignition piston engine fuel Refiners add TEL to meet the octane requirements for AVGAS As documented in reference (11) the CRC Unleaded AVGAS Development Group determined that engine octane requirement is the most demanding and challenging criteria for an unleaded AVGAS Accordingly research into options for unleaded AVGAS and reduced lead content AVGAS has been driven by engine octane requirements
As background considerations for a reduced TEL content AVGAS it is important to recognize those AVGAS components which influence and establish the MON quality of the resulting 100LL product The addition of TEL certainly has a significant impact on knock response and resulting fuel MON quality but the base alkylate and aromatic content are other significant contributing variables Refiners balance these three components (base alkylate aromatics and TEL) to achieve the desired MON rating of the fuel There is a limit to which the effect of reduction in TEL may be offset by adjustment to the aromatic content while maintaining MON performance
The following indicates the significance of the effect of TEL on engine knock performance using both historical data for a typical high output radial engine and recent data generated as part of a CRC-FAA Technical Center research program to evaluate effect of TEL in conventional horizontally opposed high output worst case reciprocating aircraft engine The following provides insight into the sensitivity of engine knock performance to TEL content in the range of 10 ndash 20 mLgal
31 LEAD RESPONSE RADIAL AIRCRAFT ENGINE The effect of TEL on aircraft engine performance has been the subject of extensive research since the early days of aviation Research conducted on radial spark ignition reciprocating engines during the height of radial engine production years probed the ldquolead responserdquo of engine operation using leaded aviation gasoline A number of technical reports in the NACA archives document research results for explorations into leaded aviation gasoline in addition to investigations into other octane and performance enhancing additives
NACA Report No E4I28 was found to include test results described as ldquoLead Responserdquo for a typical radial engine power section The results are included within this report as an indication of effect of TEL on radial engine knock performance The following Figure 20 which is extracted from NACA Report No E4I28 indicates the ldquolead responserdquo for a Pratt amp Whitney R2800 radial engine (based upon single cylinder tests) in terms of knock limited IMEP for fuelair ratios of 0075 and 0100 The test fuel was an S-3 Aviation Reference fuel with TEL content varied from 000 to 600 mLgal (6)
Figure 20 provides an indication of the sensitivity of knock limited IMEP to TEL content for the configuration and test conditions documented in E4I28
Based upon the actual data points within the range of 15-22 mLgal a change of 04 mLgal results in a 49-37 impact on knock limited IMEP for a fuelair ratio of 075 FA The sensitivity may also be expressed as 01 mLgal is equivalent to 12 - 9 impact on knock limited IMEP
Based upon the actual data points within the range of 106 ndash 200 mLgal a change of 04 mLgal results in a 41 impact on knock limited IMEP for a fuelair ratio of 100 FA which indicates sensitivity of 1 change in knock limited IMEP per 01 mLgal TEL
Page 14 of 50 Version 40 Oct 14 2010
Figure 20 further indicates that for the configuration and test conditions documented in E4I28 a change in TEL content from 30 mLgal to 20 mLgal resulted in an impact of approximately 96 on knock limited IMEP
Insp10 to comme show that a distinct irregularity in the susceptability curve exists in the region of 08 to 14 ml tetraethyl lead per gallon It is also
ection of Figure 20 indicates an inflection or shift in the lead response curve in the area of 15 mLgal TEL The NACA researchers noted this observation with the following nt ndash ldquoThe results plotted in figure 18(b)
questionable whether this characteristic would be found under all test conditions and if it should whether this irregularity would always appear at the same tetraethyl-lead concentrations and would be of the same magnituderdquo (6)
R-2800 Engine Single Cylinder Ref NACA E4I28Lead Response C urve L IMEP vs TEL ContentK
160
180
200
220
240
260
280
300
320
340
0 05 1 15 2 25 3 35 4 45 5 55 6
Kno
ck L
imite
d IM
EP lb
sq
in
mL TELgal in S-3 Reference Fuel
Notes1) Data extracted from Figure
18 NACA Report No E4I282) R-2800 Single Cylinder3) KL IMEP = knock limited
32 LEAD RESPONSE CONVENTIONAL AIRCRAFT ENGINE Aviation industry re last 15 years has essentially followed in the footsteps of yesterdayrsquos engine engineers and fuel chemists
atives for reducing and line In consideration of
search into unleaded avgas alternatives during the
however the objectives and focus of research has shifted to alternultimately eliminating lead emissions as associated with aviation gasothe Aviation Stakeholder Grouprsquos near term strategy to pursue a reduction in lead emissions using a ldquodrop inrdquo replacement reduced lead content 100 min grade AVGAS the Aviation Stakeholder Group requested the CRC Unleaded AVGAS Development Group working in conjunction with the FAA Technical Center to investigate and conduct research into options for a reduced TEL content AVGAS In response to the Stakeholder request dual initiatives were launched by the CRC and FAA including full scale engine testing of manufacturerrsquos reduced
Page 15 of 50 Version 40 Oct 14 2010
TEL content AVGAS blends in addition to an effort to assess and identify typical TEL content in 100LL AVGAS consumed by the fleet The CRC VLL Task Group working as a subset of the CRC Unleaded AVGAS Development Group has conducted test and evaluation of reduced TEL content AVGAS samples and has
rovided support and input to the FAA Technical Centerrsquos investigation into TEL production
response to the Stakeholder request the CRC VLL Task Group defined and implemented a d for full scale engine testing of a group of e fuel producers Although the requirement
which was the primary test engine used for prior RC Unleaded AVGAS research projects(11) was also used for the test investigations into the
lead response of the fuels identified in Table 30 The IO-540-K engine is rated at 300 BHP at 2700 RPM and features a 5125 inch bore with 871 CR the engine is six cylinder air-cooled horizontally opposed fuel injected engine and has been determined to be one of the worst case naturally aspirated engines relative to octane requirement(11) The IO-540-K is representative of the large bore six cylinder naturally aspirated engines rated on minimum grade 100LL AVGAS which power a large segment of the general aviation fleet The combination of large cylinder bore high compression ratio and high output are primary design features contributing to the high octane requirement
plevels for commercial FBO AVGAS The following describes the preliminary results of CRC research investigations into full scale engine tests of a group of partially leaded fuels The following data are provided in advance of a formal FAA Technical Center report which will document the full scale engine tests of a group of manufacturerrsquos reduced lead content fuels
33 CRC-FAA AFETF ROUND I VLL TESTS Inresearch program during early 2010 which providereduced TEL content AVGAS blends furnished by thwas that the test blends meet D 910 specification one of the fuel groups consisted of batch of 5 blends which were prepared using a production AVGAS the TEL content was varied from 0 to 64 of max allowable TEL with toluene content maintained at approximately 11 EM1 was a D 910 compliant fuel This latter group of reduced TEL content fuel blends which are summarized in Table 30 offered the opportunity to investigate the lead response of similar fuels with varying TEL content in a full scale engine The 100LL fuel noted in Table 30 represented a baseline FBO AVGAS with TEL content at 943 of D 910 limits See Figures 60 and 70 for test fuel MON and Supercharge Rich trends
A Textron Lycoming model IO-540-K engine
Table 30 (7)
CRC FAA Tech Center VLL Fuels Matrix Round I Tests 2010
ULL Blend
TEL (mLL)
TEL (mLgal)
Max TEL D 910
Toluene (vv)
MON (D2700)
SC Rich (D909)
100LL 050 189 09434 lt05 1039 1315
EM1 034 1287 06415 118 1024 135
EM2 026 098 04906 116 1016 129
EM3 017 064 03208 115 1002 117
EM4 008 030 01509 113 995 107
EM5 000 000 00000 111 944 97
C
Page 16 of 50 Version 40 Oct 14 2010
ull scale e d June 20 the Tec Cent tion F nd E Test F y (AFETF) cated in conducting ixture le cur t po ttings [27 M WO 5 [2 PM] 75 450 RPM 65 50 R Eac six cy s was itored cdications ead concept described in reference (11)
esults of the FAA AFETF detonation tests using the Table 30 fuels are shown graphically in igure 30(7) The diagonal lines which intersect the BHP curves for each power setting indicate e fuel flow corresponding to onset of combustion knock for each of the fuel blends shown he RPM indications correspond to the power settings of 100 85 75 and 65 Although igure 30 illustrates the relative knock performance of the Table 30 fuels it does not establish quantifiable relationship between TEL content and engine knock but rather only indicates ose fuels with higher TEL provide an increasingly positive effect on engine knock
erformance
F ngine detonation testing of the reduced TEL fuels shown in Table 30 was completein 10 at FAA hnical errsquos Avia uels a ngine acilitlo Atlantic City
an outNew Jersey Engine det
ves aonation test
of 100procedure consisted of
00 RP
600 Rm wer se T] 8[2 ] and
of detonatio [23
n as indicatPM]
ed by comh of the
bustion pressure using thlinder mon
e instrumented cylinder ontinuously for
inh RFthTFathp
240
250
260
270
280
290
300
epow
er
150
160
708090100110120130140150160170FUEL FLOW (lbhr)
170
180
190
200
210
220
230
Bra
ke H
ors
2700 RPM
2600 RPMRICH
100LL
EM1
EM2
2450 RPM
2350 RPMEM4
EM3
ULL AVGAS TESTS RESULTSEM1-EM5100LL
IO-540-K Knock On Set
LEAN EM5
Figure 30 Knock Limited Fuel Flow ULL Test Matrix IO-540-K(7)
With the objec
erformance Ftive of quantifying the relationship between TEL content and engine knock igures 40 and 50 are derived from the Figure 30 data by plotting knock limited
s a function of TEL content for lines of constant BHP The resulting data sets provide an indication of the effect of change in TEL content on engine knock performance as manifested by knock limited fuel flow The MON rating for each test fuel is noted for reference since there was a gradual reduction in MON as TEL content was reduced with the drop in MON becoming more aggressive beginning at 030 mLgal TEL as shown in Figure 60 Figure 70 shows the supercharge rich ratings for the Table 30 test fuels where the difference in the rich rating between EM1 and 100LL is likely the result of the difference in toluene content
pfuel flow a
Page 17 of 50 Version 40 Oct 14 2010
CRC VLL Round I Test Results IO-540-KFuel Flow Lbshr Knock On Set
Figure 40
ldquoLead Responserdquo TEL (mLgal) Curve IO-540-K
CRC VLL Round I Test Results IO-540-KFuel Flow Lbshr Knock On Set
Figure 50
ldquoLead Responserdquo TEL (mLL) Curve IO-540-K
Page 18 of 50 Version 40 Oct 14 2010
CRC VLL Round I Test FuelsD 2700 MON Ratings
90
95
100
105
110
0 02 04 06 08 1 12 14 16 18 2 22
MO
N D
270
0 M
ON
Rat
ing
TEL Content - (mLgal)
MON D2700
100LLEM1
EM2EM3
EM4
EM5
Figure 60
D s
2700 MON Ratings CRC VLL Round I Test Fuel
CRC VLL Round I Test FuelsASTM D 909 Supercharge Rich Rating
90
100
110
120
130
140
150
0 02 04 06 08 1 12 14 16 18 2 22
Supe
rcha
rge
Ric
h R
atin
g D
909
TEL Content - (mLgal)
SC RICH D909
EM3
EM4
EM2
EM1100LL
EM5
Figure 70
D 909 Supercharge Ratings CRC VLL Round I Test Fuels
Page 19 of 50 Version 40 Oct 14 2010
34 Figures 40 described
approaches
ock limited
TEL values ranging fro
content for t mented
CONCLUSIONS ROUND I VLL TESTS and 50 indicate the ldquolead responserdquo for the IO-540-K test engine using the fuels
in Table 30 The data indicates the ldquolead responserdquo in terms of knock limited fuel flow for TEL content in the 150 to 200 mLgal range is linear There is a ldquokneerdquo in the curvearound 060 mLgal below which the ldquolead responserdquo becomes non-linear as the TEL content
zero
The utility of Figures 40 and 50 is that they indicate the relative change in engine knfuel flow as a function of TEL content in the 150 ndash 20 mLgal range of interest and beyondwhich provides for correlation with the fleet service experience with AVGAS at
m 122 ndash 200 mLgal as discussed in Section 5 of this report
Figures 40 and 50 provide an indication of the sensitivity of knock limited fuel flow to TELhe conventional IO-540-K engine configuration and test conditions docu
ge of wn in
Assuming a linear response in the 13 ndash 20 mLgal range the data indicate a chan04 mLgal results in a 49 impact on knock limited fuel flow for the BHP shoFigures 40 and 50
Alternately a change of 05 mLgal results in a 6 impact on knock limited fuel flow for the BHP shown in Figures 40 and 50
A change in TEL content from 200 mLgal to 122 mLgal (39 reduction) is equivalent to a 94 chan d 50 ge in knock limited fuel flow reference Figures 40 an
ay be ote
d in
he size of the general avia
piston powe total ion
comprising 453 aircraft which is estdefined as he General Aviation Ma
Piston powe
arrangements manufactured by original eq nufacturers (OEM) Teledyne Continental Motors and Textro CAR 13 Civil Air Regulations or 14 CFR 33 Federal Aviation regulations
Many older GA engine models are approved to operate with a minimum grade 8087 AVGAS but are also approved to operate with the more readily available higher grade 100LL AVGAS A
Based upon Figures 40 and 50 the sensitivity of engine knock to TEL content mexpressed as 01 mLgal is equivalent to 12 impact on knock limited fuel flow Nthat this is in agreement with the radial engine lead response at 075 FA discusseSection 31 Although the metrics are expressed in different terms knock limited IMEP for a radial engine and knock limited fuel flow for a conventional engine they arecomplementary and indicate the relative change in knock on-set as a function of TEL
4 GENERAL AVIATION PISTON POWERED FLEET Of interest relative to the use of 100LL AVGAS and the associated TEL content is t
tion piston powered fleet which requires use of a minimum grade 100LL AVGASBased upon the results of a recent study which researched the FAA Registry for registered
red aircraft and the associated FAA TCDS for a listing of approved fuels theUS GA fleet in 2010 consists of 228078 aircraft with the piston powered fleet port
83 of the total(8) The US piston fleet in YR2010 consists of 189imated to be 60 - 70 of the total worldwide piston fleet General Aviation is all aviation other than military and commercial airlines according to tnufacturers Association(11)
red GA aircraft (less than 12000 lbs gross weight) are almost exclusively poweredby horizontally opposed spark ignition reciprocating engines configured in 4 6 and 8 cylinder
uipment man Lycoming as FAA approved products conforming to either
Page 20 of 50 Version 40 Oct 14 2010
small percentage of the fleet is approved to operawith a few aircraft listing 9198 as the approved fu
te on an older minimum grade 9196 AVGAS el GA engine models produced since the mid
GA engines are both naturally aspirated and turbocharged with ratings from
1970rsquos are mostly high output high performance high compression ratio (85 ndash 87CR) engines which require a minimum grade 100LL AVGAS for adequate knock protection The minimum grade fuel approved for operation with an aircraftengine is specified in the engine FAA TCDS the aircraft FAA TCDS and the aircraft POH (Pilot Operating Handbook)
he FAA approved T100 BHP to in excess of 400 BHP Fuels approved for operation in GA engines are specified in the FAA approved OEM continuous airworthiness data and the associated FAA TCDS (type certificate data sheet which may be accessed at httprglfaagov) The approved fuel is typically specified in the FAA TCDS as aviation gasoline conforming to ASTM D 910 pecification either minimum grade 8087 9196 9198 100LL or 10013s 0 FAA certification of
41A stud ssioned by the FAA Technical Centerrsquos Aviation Fuels and Engine Test Facility (AFETF) to quantify the piston powered fleet composition based upon the approved minwhich are based upon data contained in the FAA Registry and the FAA TCDS establish a baseline data base for the active piston powered aircraft by make and model along with a listing of t Based upon the results of this study reference (8) 433 of the GA fleet requires a minimum Gragasolinof the accounthe gen80 87 er grade 100LL Engine manufacturer service bulletins specify that engines are approved to
perate with the next higher grade AVGAS but are not approved to operate with a lower grade e eligible for operation with 100LL oved for use with an unleaded min
each engine model required that adequate detonation (knock) margins be demonstrated by test using a certified fuel of minimum quality while operating at worst case conditions for knock
FLEET APPROVED MINIMUM GRADE FUEL y was recently commi
imum grade fuel as listed in the FAA TCDS for each aircraft(8) The results of this study
he approved minimum grade fuel
de 100LL AVGAS and is therefore dependent upon the leaded aviation grade 100LL e for both performance and knock protection Industry specialists believe it is this 433 fleet representing later model aircraft used for business and utility purposes which ts for the majority of the general aviation flight time Although there is a large segment of eral aviation fleet (84429 aircraft representing 446 of fleet) rated on minimum grade
90 or 91 AVGAS this group of aircraft is also approved to operate with the next high
oTherefore 166492 aircraft representing 879 of the fleet arAVGAS FAA TCDS data show 04 of the aircraft are apprgrade 9196 In the absence of a domestic min Grade 91 production AVGAS and minimal availability of min Grade 80 AVGAS min Grade 100LL is the predominantly available AVGAS today A 9196UL AVGAS is available within Europe
Page 21 of 50 Version 40 Oct 14 2010
Table 40 (8)
General Aviation Fleet Approved Min Fuel Grade Based Upon FAA Registry amp TCDS
Fuel Grade Number of Aircraft
Percent of 189453 Aircraft
100LL Minimum 82063 433
80 Minimum 69402 366
Other Fuel 17508 92
91 Minimum 13387 71
Unknown 5306 28
Unleaded 9196 825 04
87 Minimum 802 04
Jet A 147 01
90 Minimum 13 00068
Total Aircraft 189453 100 Notes
Minimum fuel grades extracted from FAA TCDS for aircraft Category ldquoother fuelrdquo includes TCDS fuel designations of 65
70 73 108135 amp 115145
wing describes the results of the FAA echnical Centerrsquos survey to quantity FBO AVGAS TEL levels as dispensed to the fleet
1 OBJECTIVES STM D 910 specifies a maximum content for TEL in 100LL AVGAS but no minimum With the cognition that there are normal production variances in TEL content of AVGAS as the result of
rocess variables including basic alkylate and refining process the FAA Technical Centerrsquos FETF commissioned a study to investigate the actual variation of TEL content in 100LL VGAS The primary objective of this study was to quantify the normal variances in TEL ontent as encountered by the fleet at the FBO level with a secondary objective of documenting
s in TEL content The purpose of this study was to develop
5 SURVEY 100LL AVGAS TEL CONTENT Whereas 100LL AVGAS is the predominantly available aviation gasoline today and in consideration of the AVGAS Stakeholder Grouprsquos near term strategy to pursue a reduction in lead emissions using a ldquodrop inrdquo replacement reduced lead content 100 min grade AVGAS the AVGAS Stakeholder Group requested the CRC Unleaded AVGAS Development Group working in conjunction with the FAA Technical Center to explore options and viability for a reduced TEL content 100 min grade AVGAS In response to the Stakeholder request dual VLL initiatives were launched by the CRC and FAA including full scale engine testing of manufacturerrsquos reduced TEL content AVGAS in addition to an effort to assess and identify typical TEL content in 100LL AVGAS consumed by the fleet The folloT
5ArepAAcfleet operating exposure to variance
Page 22 of 50 Version 40 Oct 14 2010
a data base that would support and contribute to the industryrsquos study of options for reducing lead emissions Prior to this study there o no information available in a summary format which document vered to the fleet
52 METHODS The production and quality control processes for aviation gasoline require the documentation of critical fuel properties b at bot finery leve delivered by the fuel distributer to the FBO (Fixed Base Operator) Each batch of fuel is panied by a certificate of analysis which identifies nce o erties g TEL content MON SC rating density vapor pressure net heat of combustion and distillation properties in accordance with the applicable ASTM specification Accordingly the 100LL AVGAS delivered to the FBO infrastructure is ted by tificates of analysis (CofA)
Additional data on analysis of fuel properties is available through the ASTM NEG (National Exchange Group) wherein AVGAS samples are shared among various test laboratories for documentation of critic part of a s check of r bility The NEG data furnished for the purpose y was e format of average values and did not associate properties with a specific refinery The FAA Technical Centerrsquos field TEL study focused on generating a data base of TEL co using certific f analysis obtained at random from the FBO infrastructure The resulting data base also included TEL data provided by one major fuel produce years o oduction C of analysis for fuel samples collected by the F cted to by an inde included in the data base int wa rdquo for the pu f confidentiality
In recognition tha ates of analysis for 100LL AVGAS us conducted at the engine manufactu in FAA certification tests The resulti ed the FBO certificates of analysis Data from the
ngine manufacturers was also ldquoblindedrdquo for confidentiality
was limited ted normal TEL variances in 100LL AVGAS as deli
y laboratory test h the re l and as accom
includin the conforma f critical prop
well documen the cer
al properties as cros epeataof this surve in th
ntent ates o
r for several f pr ertificatesAA and subjeEach data po
analysiss ldquoblinded
pendent laboratory were alsorpose o
t the OEM engine manufacturers obtain and file certificed in official FAA certification testing a search was alsorers for documentation of 100LL AVGAS properties used ng data points complement
e
SURVEY DATA CAVEAT Survey data consisting of CofA NEG data and engine manufacturerrsquos reports were used without change or prejudice CofA are accepted by the industry as a certificate of validation Further investigation or verification of the accuracy of the reported data was determined to be outside the scope of the researcherrsquos authority It is noted that several data points indicated MON values higher than normal Although MON is of interest the primary objective of this survey was to explore and investigate TEL trends in production AVGAS
Page 23 of 50 Version 40 Oct 14 2010
53 RESULTS The resulting survey data consisting of certificates of analysis documentation furnished by the original engine manufacturers NEG data and refinery data were compiled and furnished by the FAA Technical Center to an independent consulting firm for review analysis and compilation in
summary report That report is included as Appendix A to this report (9) While the presented it was observed that the addition of data (from 55 to 89) had little impact on values of TEL The summary of findings is extracted from Reference (9) and
asample set is smallthe max and mean repeated as follows The reader is referred to Appendix A for a detail accounting of the survey data and associated analysis
(may indicate typographical error in original source report)
MON ratings
o Max = 1076
o Mean = 1038
o Min = 1011
Tetraethyl Lead content
o Max = 060 gPbL (107 of D 910 limit)
Page 24 of 50 Version 40 Oct 14 2010
Figure 100(9)
Segregation of Fuel Samples by TEL Reduction
39 of the fuel samples described by CofA and industry laboratory reports could meet a 20 reduction in TEL
51 of the fuel samples described by CofA and industry laboratory reports could meet a 15 reduction in TEL
64 of the fuel samples described by CofA and industry
laboratory reports could meet a 10 reduction in TEL
44 of the fuels u ertification could meet a 20 reduct
L
sed for FAA c
ion in TEL
67 of the fuels used for FAA certification could meet a 15 reduction in TE
6 GA FLEET 100LL SERVICE EXPERIENCE
he surve tion 100LL AVGAS as distributed to the fleet rough the general aviation iston powered fleet has
een exposed to service e a low of 61 of max mean of 8 g MON and other D 910
pecification properties As dditive TEL is effective as knock suppressant in AVG there is a corresponding pact on engine knock response A threshold of TEL reduction is ultimately reached where el octane quality is sufficiently degraded to the extent that engine knock margins are
egraded The latter is not the case with the current fleet as indicated by a study of related fleet ervice experience which indicates a neglible incident rate of knock with no indications of fuel lated incidents The successful service experience with varying levels of TEL speaks highly of e margins or
xperience has sh s usually manifested in burned pistons eroded iston domes or e holes in pistons with a resulting loss in engine power and a oticeable change in engine vibration With the objective of evaluating fleet service experience ased upon the premise that the fleet has been subjected to operation on 100LL AVGAS with EL content as low as 61 llowable TEL FAA Service Difficulty Reports (SDR) ave been reviewed for i tonation incidents as might be indicated by reports of urned pistons eroded pistons bu signs of detonationrdquo with the results
ummarized as fol
1 FAA SERVICE DIFhe FAA maintains a data viation products which may e accessed at http
Results of tth
y of TEL content in produc FBO network indicate that the domestic pxperience with TEL content varying fromb
allowable TEL to a s
4 of max allowable TEL while still meetindiscussed in Section 3 of this report the a
AS As the content of TEL is reducedaimfudsreth
iginally designed into the general aviation products
E own that the effect of knock ipn
dges or burned
bT - 84 of max ah ndications of de
rned hole in pistonldquobs lows
6 FICULTY DATA BASE T base for reports of service difficulties for ab av-infofaagovsdrx A reformatted version of the
d to list only general aviation related reports less air FAA SDR data base
hich is restructure carriers commuters nd military may be accessed at wwwlandingscom_landingspagessearchsearch_sdrhtml
wa
here SDR data is retrieved from the FAA ftp server on a weekly basis The FAA SDR data ase does not contain all reports of aviation difficulties but rather only those which are
wb
Page 25 of 50 Version 40 Oct 14 2010
voluntarily submitted to the FAA where each is based upon the submitterrsquos assessment of the ervice difficulty However the FAA SDR s provide useful information providing sight into specific ser ported difficulties rovide an indic tion of relative incident rates as compared to other difficulty categories or the
f all reports f ircraft models r engine models iation contains 500000 entries 1975
sin
data base doevice difficulties when viewed in the context that the re
p aaggregate oo
or a specified aircraft model engine model or groups of a The entire FAA SDR data base reflecting all elements of av
to present ref 1 httpwwwaviationdbcom
62 SDR REPOR
search of the FAA S ed for reports of etonation incident raft series hich represent t nce high ompression ratio engi aspirated and turbocharged Rather than searching all mall aircraft manu ral aviation ircraft models which a 5 aircraft or 817 of the total FAA registry of piston owered aircraft The search was facilitated by searching under the FAA JASC code ldquo8530rdquo(10)
nd key word ldquopistonrdquo FAA JASC code 8530 is defined as ldquoFor reports of engine cylinders and ssociated partshelliptypical parts are piston piston pin exhaust valve intake valve valve guide
s of the SDR data search are r each of the 31 ldquoburned pistonrdquo listings is
TS DETONATION INCIDENTS DR data base for the general aviation fleet was performA
d s by searching for reports of piston difficulties for the following airche manufacturers of those aircraft powered by high performa
nes both naturally wcs facturers the search targeted the following representative gene
ccount for 15482apaarocker arm valve cover cylinder pushrodhelliprdquo Resultsummarized as follows A copy of the SDR report foon file and available upon request The SDR reports surveyed covered a time period of 17 years 1993 to present
Table 50 FAA SDR Reports for Burned Pistons (10)
Representative Manufacturers ndash General Aviation Fleet FAA SDR Reports Aircraft
It is concluded based upon the review of SDR reports for detonation incidents for the fleet portion indicated that the occurrence of detonation in the fleet is rare with the total number of detonation incidents at 002 of the fleet surveyed None of the SDR reports corresponding to the above 31 reports of ldquoburned pistonsrdquo indicated fuel was a factor For some of the 31 reports it was not totally certain that detonation was the contributing event for the majority of the reports the cause of detonation was not identified Likely causes of detonation incidents include mis-adjusted ignition timing magneto failures blocked fuel injector nozzle and operation at high
ower with lean mixture Those reports which indicated structural failure of the piston rather an thermal failure were not included in the 31 reports which contained failure descriptions
ed hole in piston signs of detonationrdquo
pthconsistent with ldquoburned pistons eroded pistons burnPiston structural failures typically have unique signatures which are distinctly different from a detonation induced event which results in excessive piston temperature The engine models listed in the 31 reports are summarized in Table 60 relative to model designation and configuration - naturally aspirated turbocharged carbureted fuel injected compression ratio and approved min grade fuel Turbocharged engines represented 48 of the engines identified as possibly having encountered a detonation event No conclusions are drawn based upon engine models andor turbocharged versus naturally aspirated On the contrary the documented detonation events appear to be evenly distributed across the naturally aspirated and turbocharged models however the naturally aspirated fleet represents a larger population than turbocharged models
Table 60 (10)
Engine Models Listed in FAA SDR Reports of Bu Detonation rned Piston
Engine Model
Configuration Compression Ratio
Min Grade AVGAS
O-2 85 1035-L2 ) C (4ea NA Carb 0100LL
O-320-D2J NA Carb 85 9196
3G NA CaO-320-D rb 85 9196
O-470-R NA Carb 70 8087
IO-360-C1C NA FI 87 100100LL IO-360-G NA FI 85 100100LL IO-470-L (2) NA FI 86 100100LL
CB NAIO-520- FI 85 100100LL IO-520-D NA FI 85 100100LL IO-520-F NA FI 85 100100LL IO-540-K1J5 NA FI 87 100100LL IO-540-S1A5 NA FI 87 100100LL GTSIO-520-L Turbo FI 75 100100LL GTSIO-520-M Turbo FI 75 100100LL
100100LL GTSIO-520-N (2ea) Turbo FI 75
75 100100LL LTSIO-360-E Turbo FI
75 100100LL TSIO-360-KB Turbo FI
Page 27 of 50 Version 40 Oct 14 2010
TSIO-520-(Unkn) Turbo FI 75 100100LL
TSIO-520-NB (2ea) Turbo FI 75 100100LL TSIO-520-R (2ea) Turbo FI 75 100100LL TSIO-520-VB Turbo FI 75 100100LL
TSIO-520-WB Turbo FI 75 100100LL TIO-540-J2BD (2) Turbo FI 73 100100LL Notes
1) NA = naturally aspirated Turbo = turbocharged Carb = carbureted FI = fuel injected
7 CONCLUSIONS The purpose of the CRC research documented within this report was not to specify or recommend a specific reduced TEL level for AVGAS but rather to conduct research and investigations with the objective of generating technical data which would enable and facilitate the industryrsquos decision process for a reduced TEL AVGAS The results of the tests and investigations documented within this report fulfill this objective Significant findings and
bservations are summarized as follows
71 TEST RESULTS ENGINFigures 40 and 50 provide an indication of the sensitivit content for the conve -540-K g e t ns documented The following observations and conclusions are based the 15 gal TEL range of interest unless n
o
E LEAD RESPONSE y of knock limited fuel flow to TEL
uration and thupon
n IOtional engine confi est conditio 20 mL ndash
oted otherwise
Test res s a change Lgal (2 eduction ) results in a 49 impact on knock limited fuel flow
ults indicate of 04 m
0 r in TEL
Alternately a change of 05 mLgal (25 reduction in TEL) knock limited fuel flow
results in a 6 impact on
A chang ntent from Lgal to 1 mLgal ction in TEL) is equivalent to a 94 change in knock limited fuel flow Note that the survey results indicate minimum field FBO fuel ntent was umente 122 mLgal
e in TEL co 200 m 22 (39 redu
TEL co doc d as being
The sensitivity mLgal is equivalent to 12 impact on knock limited fuel flow over the 15 ndash 20 mLgal range of inter
may also be expressed as 01 est
Analysis conventio ine lead response is nt with the radial engine l of 10 -12 ge in kno mited IM 1 mLgal TEL as discussed in Section 31 Altho nock metrics are expressed in different terms knock lim radial en knock limited fuel flow for conventional engine these indice ementary a function
indicates theead response
nal eng chan
in agreemeEP per 0ck li
ugh the kited IMEP for
s are complgine and
nd indicate the relative change in knock on-set as a of TEL
Page 28 of 50 Version 40 Oct 14 2010
72 SURVEY R 00LL Figures 80 through 100 present a summary of the findings and observations documented within the Appe nifica and ob tions a ized as follows
ESULTS FBO 1 AVGAS
ndix A report Sig nt findings serva re summar
Survey r content i GAS (8 ta poinTEL content in AVGAS is 84 L allowe ASTM d upon the data examine
esults of TEL n FBO AV 9 da ts) indicate mean (average) of max TE d by D 910 base
d
Survey r tent i GAS in te the fleet has service experience with TEL content as low as 61 of the max TEL allowed by ASTM D 910 for fuels of 1016 MON
esults of TEL con n FBO AV dica
or higher
Mean MON for FBO AVGAS was observed to be 1037 MON with minimum MON documented at 1016 MON The maximum MON for AVGAS as indicated by the CofA data was 108 MON
Examination of engine manufacturer certification data (23 data points) indicates 100LL AVGAS used for official FAA engine certification testing had TEL content varying from minimum of 14 of max allowable to a mean of 71 of max allowed Associated minimum MON was 1011 with mean MON being 1038 The maximum MON for the 15 certification data samples was 1076 MON (Note that 14 may indicate a typographical error in the original source data)
39 of the fuel samples described by CofA and industry laboratory reports could meet a 20 reduction in TEL
51 of the fuel samples described by CofA a15 reduction in TEL
nd industry laboratory reports could meet a
64 of the fuel samples described by CofA and industry laboratory reports could meet a 10 reduction in TEL
44 of the fuels used for FAA certification could meet a 20 reduction in TEL
67 of the fuels used for FAA certification could meet a 15 reduction in TEL
73 FLEET SERVICE EXPERIENCE Withhas be n on 100LL AVGAS with TEL content as low as 61 - 84 of maDiffindicatedetona
the objective of evaluating fleet service experience based upon the premise that the fleet en subjected to operatio
ximum allowable TEL as documented by the Appendix A survey results FAA Service iculty Reports (SDR) were reviewed for indications of detonation incidents as might be
d by reports of ldquoburned pistons eroded pistons burned hole in piston signs of tionrdquo Significant findings and observations are summarized as follows
It is concluded based upon the review of FAA SDR reports for detonation incidents that the occurrence of detonation in the fleet is rare with the total number of detonation incidents at 002 of the fleet surveyed None of the SDR reports indicated fuel was a factor Qualifications regarding SDR reports are discussed in Section 61
r speaks highly of the margins originally designed into the general aviation powerplants in consideration that service experience indicates knock is a rare occurrence within the fleet
Analysis of survey results and engine lead response data indicates the fleet service experience with TEL content at 61 - 84 of max allowable TEL is equivalent to a 94 -38 variance in engine knock margin respectively from the baseline 20 mLgal TEL level The latte
Page 29 of 50 Version 40 Oct 14 2010
8 RECOMMENDATIONS The test results and findings documented within this report indicate the general aviation fleet hasAVGlead codocumented within this report Althtechnicthe aviation industry which are outside the jurisdiction of CRC research In tthe gemainte rovided with the necessary informational training
9 RE
f D02J02
GAS Coalition Briefing EAA AirVenture 2010 July 27 2010
ffects on Engine Performance NAVAER 06-5-501 USAF TO
I28 ldquoExperimental Studies of the Knock-Limited Blending d
inson
(8) Herbert W Schlickenmaier Crown Consulting Inc ldquoAviation Fuels Research Fleet Database 10 (prepared by Crown Consulting Inc under Purchase Order artin NISC II Bridge Contract DTFAWA-08-C-00009 with the
successful service experience with a TEL content of 122 ndash 200 mL TELgal (100LL AS) having a MON of 1016 or greater Technical considerations for specifying a maximum
ntent less than 200 mLgal should obviously be guided by the fleet service experience
ough a reduced TEL content within the range of experience documented within this report is ally feasible there are other non-technical considerations which must be addressed by
he advent of implementation of a reduced TEL AVGAS it is recommended that the FAA and neral aviation industry give consideration to ensuring aircraft owners pilots and nance personnel are p
FERENCES
(1) The History Specification Production Use and Evaluation of Unleaded Aviation Gasoline Report by the D 910 Task Force o
(2) Letter AVGAS Stakeholder Group to EPA dated June 10 2010
(3) Presentation GA AV
(4) ASTM D 910 ldquoStandard Specification for Aviation Gasolinesrdquo
(5) Aviation Fuels and Their ENo 06-5-4 dated 1951 by Ethyl Corporation
(6) NACA Report No E4Characteristics of Aviation Fuelsrdquo N D Sanders R V Hensley R Breitwieser dateOctober 1944
(7) FAA Technical Center Test Results Email dated July 25 2010 D Atwood to R Wilk
Reportrdquo dated October 13 207200006107 from Lockheed MFederal Aviation Administration)
(9) Melanie Thom Baere Aerospace Consulting Inc ldquoReview of Certificates of Analysis and Test Data of Aviation Gasoline for Current Ranges of Lead Additiverdquo dated Sept 9 2010 (prepared for Crown Consulting Inc under Purchase Order 7200006107 from Lockheed Martin NISC II Bridge Contract DTFAWA-08-C-00009 with the Federal Aviation Administration)
(10) FAA Flight Standards Service Aviation Data Systems Branch AFS-620 ldquoFederal Aviation Administration Joint Aircraft SystemComponent Code Table and Definitionsrdquo October 27 2008
(11) CRC Report AV-7-07 ldquoResearch Results Unleaded High Octane Aviation Gasolinerdquo June 17 2010
(12) Alisdair Q Clark BSc PhD ldquoAviation Gasoline History and Futurerdquo IASH 2007 October 2007
Page 30 of 50 Version 40 Oct 14 2010
izations specialized consulting firms the FAA and the CRC
nd Engine Test acility was crucial to the outcome Most importantly it was the foresight of the FAA AFETF
oject to survey FBO AVGAS with the goal of better understanding the mercial AVGAS
Lastly Developme report on their behalf
10 ACKNOWLEDGEMENTS The information contained within this report reflects the participation and commitment of industry specialists representing a broad segment of general aviation including fuel producers test laboratories FBO fuel distributors aviation engine and aircraft manufacturers aviation trade organizations fuel trade organexecutive office The successful completion of the survey of AVGAS properties followed by the compilation and analysis of survey data as complemented by engine testing to investigate engine lead response were made possible in no small part by the actions of those committed to the future of general aviation
The leadership and guidance provided by the Aviation Stakeholders was instrumental in establishing goals and objectives Typical of previous CRC aviation gasoline research projects the participation and contribution of the FAA Technical Centerrsquos Aviation Fuels aFwhich launched the prariance of TEL in comv
the author would like to express his humble appreciation to the CRC Unleaded AVGASnt Group for the opportunity to compile this
- END OF TEXT ndash
Page 31 of 50 Version 40 Oct 14 2010
Page 32 of 50 Version 40 Oct 14 2010
APPENDIX A
ldquoREVIEW OF CERTIFICA OF ANALYSIS AND TEST DATA OF AVIATION GASOLINE FOR CURRENT RANGES OF LEAD ADDITIVErdquo
VER 60 DATED S 9 2010
TES
EPTEMBER
REVIEW OF CERTIFICATES OF ANALYSIS AND TEST DATA OF AVIATION GASOLINE FOR CURRENT RANGES OF LEAD ADDITIVE AssesCurre In an attemptaviation gasoadded to current aviation gasoline This endeavor was to evaluate on a very small sample sASTM D-910 lower lead containing fuels This was done y reviewing the Certificates of Analysis procured for contemporary loads of aviation fuels from a variety of FBOrsquos and test labs as well as fuels used by engine manufacturers for engine certification The result was a sample set of 89 individual data points which were reviewed for the lead content all conver grams of lead per liter of fuel The samples were also segregated by gions using time zones of the manufacturer location and by refinery (blinded for this report) in an attempt to identify if any relationships of lead usage by region or by refiner This report used the data as provided by the manufacturers whose sole responsibility it is to the correctness of the data No assessment of the MON ldquocushionrdquo or evaluation of formulation should be made from this data
sing the Viability of Lowering Lead Levels in nt A iation Gasoline Production v
to demonstrate a commitment to the global community by the line user community it is desirou to reduce the amount of lead s
et the current lead additive levels in fuels currently meeting the specification to assess the industryrsquos current ability to produce
b
ted tore
Prepared by Melanie Thom 992010 Report Prepared for Crown Consulting
Page 33 of 50 Version 40 Oct 14 2010
REVIEW OF CERTIFICATES OF AND TEST DATA OF AVIATION GASOLINE
OR CURRENT RANGES OF LEAD ADDITIVE Aviation Gasoline
rrsquos reports was used t change or prejudi CoArsquos are accepted e industry as a certificate of validation
determined to be veral data points indicated MON
ctive of this survey was
garding the relationship between formulas MON cushion or how the he MON values can be made This analysis should only be used to uels currently meeting ASTM D910 with less than maximum allowable
d content Furthermore the production of VLL 100 requires more than just the reduction in to produce a lower lead ignificant research and
ulations that still meet all the specification uirements
While this is ve of the East resentative of
ions was also ch 21 had a
6 were blends sis This data
3 After reviewing the data it was determined that approximately 39 of the fuel described by the Certificates of Analysis (COA) and industry laboratory reports could meet a 20 reduction in the TEL additive 51 could meet a 15 reduction in TEL and 64 could meet a 10 reduction in TEL as indicated by current production lots
tion fuels with lead contents indicated 44 could meet the 20 reduction and 67 could meet the 15 reduction This is in line with the fielded data
NALYSIS
A
FAssessing the Viability of Lowering Lead Levels in Current
roduction
OTE Survey data consisting of CoA NEG data and engine manufactureithou ce by thurther investigation or verification of the accuracy of the reported data was tside the scope of the researcherrsquos authority It is noted that selues higher than normal Although MON is of interest the primary obje explore and investigate TEL trends in production AvGas
s such no conclusions read reduction will affect t
luate the existence of f
P
NwFouvato Aleeva
alelead The data in this report is only demonstration of the ability of refiners
el not an analysis of how to produce fuel with lower lead Svelopment will be required by refiners to develop form
fudere
q
S
ummary
1 The sample set excluding the ULL study included 89 individual data pointsa small sample set analysis of this data suggests that it is representatiCoast and Midwest There are no obvious indications that it is not repCentral and West Coasts
2 An additional set of Certificates for fuel used during engine certificatsupplied and reviewed This data set included 23 individual entries for whimotor octane value entry and 9 had a lead content Of the 23 samplesprepared from 100LL and iso-octane and were not included in the analywas analyzed separate from the field sample entries
o Of the nine certifica
Page 34 of 50 Version 40 Oct 14 2010
4 Sixteen (16) of the data was from the National Exchange Group (NEG) database and all location and refinery information was previously purged for these samples
5 When separated by refineries 25 of the fuel in the sample set was provided by a single refinery H Another 224 was provided by refinery C When the fuels from the individual refineries were analyzed it was determined that refinery H only produced 5that contained less than 20 TEL additive (1 of 19 samples) At a reduction of 15 and
uction (same of the
10 only 11 of the prod would be in spec 2 fuels 19) This is far
versa This is likely due to the influence of the third component the base alkylate for
o A question was raised that 108 as an MON seemed unlikely With this data point removed the mean was still 1037 and the new maximum was 1076
tent was 040gL and the median was 043 The maximum
10
11 d had a reported MON of greater than 102 sixty percent had an MON greater than 103 and thirty-two percent were
This res search Program at the William J Hughes Technical Center in Atlantic City New Jersey by Baere Aerospace Consulting IMartin NISC B
below the group percentages and indicates that this refinery would likely be unable to meet a lead reduction with current production
6 A review of the data by region and by refinery showed no relationship with the amounts of lead used with the exception of refinery H
7 While there was limited aromatic information available there did not appear to be any relationship between the amount of lead used and the amount of aromatics used Said another way there did not appear to be high lead required with low aromatics or vice
which there is no information
8 The mean MON value was 1037 The maximum was 108 and the minimum excluding a sample set made for the ULL study was 1016
o Of the 15 certification fuel samples the mean MON value was 1038 The maximum value was 1076 and the minimum was1011
9 The mean elemental lead content was 047gL and the median was 048gL The maximum was 056gL and the minimum excluding the ULL study set was 034 gL
o Of the 15 certification samples excluding the blended test samples the mean elemental lead conlead content was 060 gL and the minimum was 008gL
The mean elemental lead content of all analyzed samples excluding blend samples was 046gL This value is 82 of the maximum lead level permitted (046 056)
Eighty-seven percent (87) of the samples reviewe
greater than 104 Only five percent were higher than 105
earch was funded by the Federal Aviation Administrations Fuels Re
nc for Crown Consulting Inc under Purchase Order 7200006107 from Lockheed II ridge Contract DTFAWA-08-C-00009 with the Federal Aviation Administration
Page 35 of 50 Version 40 Oct 14 2010
ConteSummar
Discussio
Backg
Sa
Reg 37
Lead
Oth
Develo ion Levels 39
Analysis
Combined Data 40
By Region
By Refinery
From Engine C 42
Conc
Annex ndash 44
Figure 1 ndash US TiFigure 2 ndash Table 38 Figu 44 Figure 4 ndash Lead Content vs Aromatic Content Including Engine Cert 45 FiguFigure 6Fuels 47 igure 7 ndash Lead Content vs Aromatic Content by Blinded Refinery Including Engine Cert Data 48
nts y 34
n 37
round 37
mple Handling 37
ion Identifier
MON Values from Aviation Lean Ratings 38
Content 39
er Data Sources 39
pment of Max Lead for Reduct
39
40
401
ertification Fuels
lusions 43
Graphical Representations of the Data
me Zones 38 9 from ASTM D‐2700
re 3 ndash Supercharge rating vs Motor Octane Number vs Lead content Including Engine Cert
re 5 ndash Lead Content vs Aromatic Content by Region for CoArsquos Excluding Engine Cert Fuels46 ndash Motor Octane Number vs Lead Content by Region for CoArsquos Excluding Engine Cert
FFigure 8 ndash Motor Octane Number vs Lead Content by Refinery Including Engine Cert 49 Figure 9 ndash Motor Octane Number vs Lead Content Specific to the Engine Certification Fuel 50
Page 36 of 50 Version 40 Oct 14 2010
Discussion
Background
PA issued an advanced notice of proposed rulemaking and requested input on data
reducing the amount of lead used in current compliant fuel formulations was considered as a
opadspaviation com The refiners seemed uncomfortable providing an assessment of their formulas and their current leaddiscouleadthe actu The third activity was a review of the CoArsquos for currently supplied fuel The hypothesis was that
ability to produce fuel with lower than maximum lead This collection was accomplished by resethfromanufath
nalysis were collected as copies from the FBOrsquos where fuel was purchased he FBOrsquos were selected randomly The data from the certificates were entered into a
In 2010 the Egaps As part of the Industry Stakeholders FAST plan to respond to the EPA the possibility of
near-term means of responding In the short time available several options for evaluating this tion were proposed 1) having the refiners report on their current ability to reduce their lead ditive levels and meet specification 2) having refiners blend very low lead (VLL) fuel meeting ecification and have it tested and 3) review current Certificates of Analysis available in the
munity and assess the actual lead content of current compliant fuels
additive levels Several of the refiners did agree to blend VLL formulas but there was rse over time regarding whether the refiners should take current formulas and just add less
and see what resulted or whether they should adjust the rest of the formula to maintain all of specified properties The activity was further complicated by the length of time necessary to ally blend the fuel and then test it
this was fuel that was currently produced If it had lower than maximum lead it indicated the
presentatives from the FAA Technical Center requesting and collecting CoArsquos from a random lection of Fixed Based Operations (FBOrsquos) In some cases fuel samples were collected from e FBO and specifically analyzed by an independent laboratory In addition to the data collected m FBO fuels the laboratory analyses from the certification fuels used by the engine
cturers and data from the NEG analyses were collected This data was compiled and en analyzed and is the topic of this report
Sample Handling The certificates of aTspreadsheet For those fuels collected from the FBOrsquos the laboratory data sheets were used as the source of the data The data was entered as provided no entries being made where data was not provided The only exception was for the values of MON and lead content as indicated below Each sample also had its refinery identity blinded such that the data could be sorted based on the refinery but so the refinersrsquo identification was not included in the data set
Region Identifier Each refinery listed was given a regional ID by using the US time zones based on the location of the refinery In some cases the location of the refinery was overtly provided In other cases it was inferred based on the primary location of a companyrsquos refinery For example one company had two locations at which they produced aviation gasoline both in the same time zone Thus any sample from this company could reasonably be placed in a time zone Each location was given a number based on the zones as shown in Figure 1 The small numbers of global aviation gasoline samples were just coded as ldquoglobalrdquo
Page 37 of 50 Version 40 Oct 14 2010
(MON) using Table 9 found in ASTM D-2700-09 and produced in
Figure 1 ndash US Time Zones
MON Values from Aviation Lean Ratings Some of the CoArsquos provided the octane performance as aviation lean ratings These were converted to motor octane numbers reFigure 2 The aviation lean rating was found on the table and the equivalent MON read off of the axes Where necessary the value was interpolated An example is shown in Figure 2 for a lean rating of 11228 being converted to a MON of 1042 Note that a MON of 100 is equivalent to a performance number of 1017 A performance number of 100 results in a MON value of 998
123
4
Figure 2 ndash Table 9 from ASTM D‐2700
Page 38 of 50 Version 40 Oct 14 2010
Page 39 of 50 Version 40 Oct 14 2010
For the were converted to a uniform unit of grams milliliters of TEL the conversion factor as lead in gallons these values were co
Other DataIn additio was included as a separate entry These data ed to confirm inter-laboratory
as average values with the
Data were also provided from engine manufacturers from their engine certification trials These d fuels blended specifically as test fuels
analysis
idual fuels that would have met the maximum levels was counted and reported It s meeting specification it was an indication that
with the indicated levels that met specification he larger population within an acceptable level
located in the Annex located at the end of the ction levels the 20 reduction is indicated by a
nge line
is analysis the analyst has only the values as of Analysis from which to perform the analysis The sole purpose of
this analysis was to determine whether there are currently fuels in the distribution network meeting minimum D910 cation with a lower than maximum permitted lead content It is not intended to be an analysis of the cushion in MON The values used in this analysis including MON are as provided For MON the values are either directly repo N or have been converted from values provided as Aviation Number Ratings (lean ratings) to MON The analyst has in good faith assumed the refiner providing the data via a CoA has provided correct data The analyst is not in a position to second guess correct reporting from incorrect reporting With respect to MONperformance number if 108 is assumed to be wrong what about 106 Or 105 Or 102 If part of the data is assumed to be incorrect then all of the data should be assumed to be incorrect
Lead Content
purpose of analysis all of the provided lead contents of lead per liter (gPbL) For lead contents provided as
of 1mL TEL = 10589 g Pb was used For those providednverted to liters 1 US gallon = 3785 liters
Sources n to the data from CoArsquos data from the NEG data
are averaged values from a set of samples usrepeatability of specification testing These data were providedrefinery information purged prior to receipt
data included both generic fuel procured for the test anOnly the actual aviation gasoline data were used for the
Development of Max Lead for Reduction Levels In order to assess the maximum reduction level that might be achieved the maximum lead content for each of three reduction levels was computed The reductions considered were 20 15 and 10 reduction from current maximum lead content permitted by specification This correlated to maximum elemental lead levels of 045 gPbL 048 and 051 For the analysis the
umber of indivnwas assumed that a) because these were fuelindividual refiners could currently produce fuels and b) that the small sample set would replicate t
Analysis For the following evaluations all of the charts are document For charts indicating the lead redupurple line and the 15 reduction indicated by an ora
Caveat on MON data With respect to the MON values reported in thprovided by the Certificates
specifi
rted as MO
Furthermore because the values of MON and rating numbers converge around 100 and 100 ne considered for compliance to specification the conclusions in this report are
by using incorrect MON data around or above 100 The extent of the
on may be warranted within the aviation gasoline producing industry
results of this analysis to make any assessments garding the formulation of aviation gasoline the relationships between lead and MON or the
aluate whether there was any bservable correlation between the supercharge rating the motor octane number and the lead
alues showed observable variations
s indicating the 20 reduction (purple) and the 15 reduction (orange) m TEL level are included on the graph This visually indicates the observation that
t This is not a weighted average atches of fuel is available
ecause it is known that refiners have basically three major building blocks with which to achieve
ount of lead used In some cases the
region of the country at which e fuel was produced the data were separated by regions based on time zones and then sorted
MON is the baseliot significantly impactedn
exceedance of MON to specification minimum is neither the purpose of this effort nor has any impact on the analysis towards the actual purpose a survey of how much lead is being used in currently delivered 100LL Reporting the MON serves only to confirm the fuels did meet specification independent of the amount of lead additive used and the MON data serves no other purpose in this analysis Therefore while discussiregarding the accuracy of the CoA sheets the actual status of the MON values has no substantive impact on the conclusions drawn for this report Readers are discouraged from using the recushion in MON for production
Combined Data The first exercise after completion of the datasets was to evocontent of the fuel Figure 3 ndash Supercharge rating and Motor Octane Number vs Lead content Including Engine Cert Figure 3 ndash Supercharge rating and Motor Octane Number vs Lead content Including Engine Cert contains all of the data from the CoArsquos the NEG data and the engine certification data excluding blended experimental samples This analysis was done to see if there was any indication of a correlation between observable variations in the supercharge rating and the motor octane number with changes in lead content No correlations were observed All of the MON values were reasonably consistent while the leadv In addition to the data line
the maximuinwas mathematically calculated that between 33 and 40 of the samples would meet the 20 reduction in maximum TEL content About 50 of the samples would meet 15 reduction in maximum TEL and 64 would meet 10 reduction in maximum TEL These values remained relatively constant as additional data was included in the dataseas no data on the size of the individual b Bthe desired MON and supercharge rating ie the alkylate the lead and the aromatic content it was desirous to evaluate any relationships between the building blocks No information was available for the alkylate type or quality so the relationship between aromatic content and lead content was evaluated This is shown graphically in Figure 4 Unfortunately few of the datasheets included a value for aromatic content For those samples that did there appeared to
e no correlation between the aromatic content and the amblead and aromatic were relatively higher together as compared to other samples and in other cases samples with high lead had low aromatics This was most likely due to differences in the type of alkylate used No correlation could be drawn from these data By Region
an attempt to determine if there were any trends based on theInth
Page 40 of 50 Version 40 Oct 14 2010
based on these regions The data were again graphed to evaluate lead content versus aromatic content by region excluding the engine certification data Because of the method for procuring the data the majority of the samples that could have a region attributed to them were from region one and two An attempt to identify whether aromatics were used more prevalently in a specific region was also made The data was graphed comparing aromatic content to lead content by region and is shown in Figure 5 Again the analysis was hampered by a lack of aromatic content data Those amples having aromatic content were primarily in data that could not be attributed to a region
he MON vs Lead was graphed and is shown in Figure 6 In general there was just as much
d to a specific region had similar variability in the data The samples attributed to non-US manufacturers ldquoglobalrdquo did have nearly exactly 100 MON values
ng prepared specifically for an ULL test
ould not continue to produce fuel could account for the
20 reduction 47 of the me and a 15 reduction about 53 of the time Further analysis of the use of lead by refinery
wo of the refineries with two and four samples respectively could meet the
sThe three global samples did show higher aromatic content but these were fuel samples blended specifically to be ULL samples Tvariability in both the MON and the lead content in regions one and two Regions three and four had similar sample values however with only two data points no conclusion can be reasonably drawn The data not attribute
but this was due to bei Again no trends in the data by region for either the MON vs Lead or the Aromatics vs Lead were observed with one possible exception There did appear to be slightly higher lead used in region two This however is likely explained by a review of the data by refinery presented in the next section
By Refinery There is a concern that a decision to reduce the maximum lead content may result in single refineries being unable or unwilling to continue to produce aviation gasoline Even if 40 of the refineries sampled are capable of producing spec fuel with lower lead there is a concern that it is
ossible that one of the 60 that wpmajority of the aviation gasoline produced Unfortunately it is beyond the scope of the data and this report to comment on that risk It was possible however to evaluate the currently produced fuel by the refiner of record on the CoA This gives no information on the refinerrsquos abilities to produce fuel of a lower lead content over time but it does give information on the existence of fuel produced by a refiner with lower lead contents at individual points in time There is also no data available on the sizes of the individual batches meaning no assessment of the impact of losing one refinery would have on the overall fuel production levels A review of the aromatic content by refiner shown in Figure 7 again showed too little aromatic data to be of value drawing conclusions However a review of the MON vs Lead data showed graphically in Figure 8 indicates there is a strong correlation in lead content for one of the blinded refineries The refinery indicated by ldquoHrdquo showed the routine use of nearly maximum TEL In only one instance was less than 045gPbL used and that instance correlated to a lower MON content at the same time For the dataset reviewed this refinery accounted for nearly one quarter of the fuel samples considered It is not known if this relationship is comparable to the industry position for the refinery Two of the refineries accounted for just under half of the samples reviewed One was refinery ldquoHrdquo
lready discussed The second was refinery ldquoCrdquo which could meet theatiindicated that t
Page 41 of 50 Version 40 Oct 14 2010
045gPbL limit with all their samples These two refineries only accounted for 8 of the samples reviewed and accounted for only six samples Refinery D with four samples could meet the 15 reduction with all the provided samples The breakdown of the remaining refineries is shown below in Table 1 Refinery Number
Table 1 ndash Refinery versus ability to produce lower lead in spec aviation gasoline
From Engine Certification Fuels
content was 040gPbL which was lightly lower than the general data
In addition to reviewing the fuels as an agglomeration the fuels were also reviewed specific to the dataset provided on the fuels used for engine certifications It was noted that not all of this data included any lead content data however all of the data including the blended test fuels provided MON values or Aviation Lean Rating values that were converted to MON Of the 15 samples provided 9 of them included a lead content This data is provided graphically in Figure 9 The maximum elemental lead content indicated for the engine certification fuels was 060gL which is out of specification high The minimum value indicated was 008gL This may have been a typographical error as it was reported to be 029gPbgal which would have been more in line with other data as 029gPbL As entered the mean leads This dataset like the industry dataset indicated a similar breakdown of approximately 40 being able to meet the 20 reduction 67 meeting the 15 reduction and 67 meeting the 10 reduction
Page 42 of 50 Version 40 Oct 14 2010
Page 43 of 50 Version 40 Oct 14 2010
ased on the review of the provided data five basic conclusions can be drawn
1 Ba n t 13 s cuproduced are l n ctspecification lead levels At a 15 reduction approximately frac12 would meet spec
2 The primary supplier of repre nting 24 of the dreduction of t lead level his supplier met axi adreduction in 11 of the sa
3 There doe ar t be a relation p between r s an co xcthe impact of the single i ry on th r gion da
4 No obvious relationship e drawn based on the le arlack of lead data and no information on alkylates There were instances of high lead with
a Similarly no relationship was found between the lead level and the motor octane number or the supercharge rating
had motor octane values higher than 102 and 60 er than 105
Conclusions B
sed on a agglomeration of the sampbelow the
le dataead conte
about at a 20
of the sampleredu
rrently current maximum ion over
fuel se ataset could not meet a 20 he maximum T the m mum le level at a 15
mples
s not appe o shi egion d lead ntent e luding ref ne e e ta
can b ad and omatics data due to the
high aromatics and low lead with high aromatics
5 Of the samples reviewed over 87were over 103 Only 5 were high
Annex ndash Graphical Representations of the Data
000
010
020
030
040
050
060
070
M ne berotor Octa Num
0
20
40
60
80
100
120
140008
034
036
039
039
041
041
041
041
042
043
044
044
044
045
047
048
048
048
049
050
050
051
052
053
053
053
053
053
054
056
MON and Supercharge
Lead content gL
Motor Octane and upercharg s d
052
S
053
053
e v
053
LeaSuperNumb
c e Performance ehargr
Rating
Lead co t Lnten g Pb
Linear or Octane Number)(Mot
053
060
gPbL
20 reduction from Max TEL (M045 gL)
ax 15 re(Max
duction fro48 gL)
m EL0
Max T
Figure 3 ndash Supercharge rating and Motor Octane Number vs Lead con ng tent Includi Engine Cert
Page 44 of 50 Version 40 Oct 14 2010
000
010
020
030
040
050
060
070
0
2
4
6
8
10
12
14
16
18
20008
034
036
039
039
041
041
041
041
042
043
044
044
044
045
047
048
048
048
049
050
050
051
052
052
053
053
053
053
053
053
053
053
053
054
056
060
Lead
Content gL
Aromatic Content Vol
gPbL
Aromatic Content vs LeadAromatic Content Vol Lead content g PbL
igure 4 ndash Lead Content vs Aromatic Content Including Engine Cert F
MON vs Lead by RegionMotor Octane NumberLead content g PbL
20 Reduction in
Figure 6 ndash Motor Octane Number vs Lead Content by Region for CoArsquos Excluding Engine Cert Fuels
Page 47 of 50 Version 40 Oct 14 2010
000
010
020
030
040
050
060
A C C C C C C C C C C C C C C C C C D D D D D H H H H H H H H H H H H H H H H H H H I L L MMMMP P P P P P P P P P P P P S S S S X X X X X X X X X L L
0
2
4
6
8
10
12
14
16
18
20Lead
Content gL
Blinded Refinery
Aromatic Content
Lead vs Aromatic by Refinery Lead content g PbLAromatic Content Vol
20 reduction from Max TEL
15 reduction from Max TEL
Figure 7 ndash Lead Content vs Aromatic Content by Blinded Refinery Including Engine Cert Data
Page 48 of 50 Version 40 Oct 14 2010
000
010
020
030
040
050
060
070
080
090
100
95
97
99
101
103
105
107
109
A C C C C C C C C C C C C C C C C C D D D D D H H H H H H H H H H H H H H H H H H H I L L MMMMP P P P P P P P P P P P P S S S S X X X X X X X X X L L L
Lead
gL
MON Rating
MON vs Lead by RefineryMotor Octane NumberLead content g PbL
20 reduction from Max TEL
Figure 8 ndash Motor Octane Number vs Lead Content by Refinery Including Engine Cert
Figure 9 ndash Motor Octane Number vs Lead Content Specific to the Engine Certification Fuel
Page 50 of 50 Version 40 Oct 14 2010
INVESTIGATION OF
REDUCED TEL CONTENT
IN COMMERCIAL100LL AVGAS
Summary
Discussion
Background
Sample Handling
Region Identifier
MON Values from Aviation Lean Ratings
Lead Content
Other Data Sources
Development of Max Lead for Reduction Levels
Analysis
Caveat on MON data
Combined Data
By Region
By Refinery
From Engine Certification Fuels
Conclusions
Annex ndash Graphical Representations of the Data
TABLE OF CONTENTS
List of Figureshelliphelliphelliphelliphelliphelliphelliphelliphelliphelliphelliphelliphelliphelliphelliphelliphelliphelliphelliphelliphelliphelliphelliphelliphelliphellip 5 List of Tableshelliphelliphelliphelliphelliphelliphelliphelliphelliphelliphelliphelliphelliphelliphelliphelliphelliphelliphelliphelliphelliphelliphelliphelliphelliphellip 5 List of Abbreviations amp Symbolshelliphelliphelliphelliphelliphelliphelliphelliphelliphelliphelliphelliphelliphelliphelliphelliphelliphellip 6 Forewordhelliphelliphelliphelliphelliphelliphelliphelliphelliphelliphelliphelliphelliphelliphelliphelliphelliphelliphelliphelliphelliphelliphelliphelliphelliphelliphelliphellip 8 1 Introductionhelliphelliphelliphelliphelliphelliphelliphelliphelliphelliphelliphelliphelliphelliphelliphelliphelliphelliphelliphelliphelliphelliphelliphelliphelliphelliphelliphellip 9
IMEP Indicated Mean Effective Pressure = [792000 X IHP] [CID X RPM]
ISFC Indicated Specific Fuel Consumption
JASC Joint Aircraft SystemComponent Code (FAA)
Page 6 of 50 Version 40 Oct 14 2010
LOP Lean of Peak [ Refers to fuel flow setting lean of peak EGT]
MAP Manifold Pressure typically inches Hg absolute
mLgal Milliliters per gallon
mmHg Millimeters of mercury
MON Motor Octane Number (ASTM D 2700)
NAAQS National Ambient Air Quality Standard
NACA National Advisory Committee for Aeronautics
NATA National Air Transportation Association
OEM Original Equipment Manufacturer
PN Performance Number (ASTM D 909)
POH Pilot Operating Handbook
PRF Primary Reference Fuel
PSIG Pounds per square inch gage
RPM Revolutions Per Minute
RGL Regulatory and Guidance Library (FAA)
ROP Rich of Peak [Refers to fuel flow setting rich of peak EGT]
RVP Reid Vapor Pressure
SAE Society Automotive Engineering (SAE International)
SC Supercharge Rating (ASTM D 909)
SDR Service Difficulty Report (FAA)
TCDS Type Certificate Data Sheet (FAA)
TDC Top Dead Center (piston position)
TEL Tetraethyl Lead
UL Unleaded
ULL Ultra Low Lead
VLL Very Low Lead
WOT Wide Open Throttle (same as full throttle)
100LL 100 Octane Low Lead AVGAS
Page 7 of 50 Version 40 Oct 14 2010
FOREWORD The source for the 100LL AVGAS survey data presented within this CRC report is a technical report prepared under contract by Crown Consulting Inc for the FAA William J Hughes Technical Center The contents of this CRC report are intended to document the results of the survey of TEL content in commercial AVGAS as commissioned by the FAA Technical Center working as a member of the CRC Unleaded AVGAS Development Group and the CRC VLL Task Group and to provide additional supporting technical data analysis and discussion where applicable
The work product of CRC research is technical data which is made available to industry as a means of enabling the industry decision process It is not the intent of this report to provide a recommendation for a specific reduction in TEL content but rather the objective is to provide technical data and analysis sufficient to enable and facilitate industryrsquos decision making process regarding a reduction in 100LL AVGAS lead emissions
Where applicable throughout this report the source of information or data is identified as a numbered reference A numerical listing of these references is included at the end of this report The author of this report has attempted to objectively document results in a summary manner using the FAA survey results and engine test results there are no changes to data or conclusions
The objective of the CRC UL AVGAS Dev Group is to conduct research and testing that will facilitate development of the next generation aviation gasoline with the goal of ensuring the availability of the required technical information for the development of an unleaded aviation gasoline that meets the requirements of both the existing and future general aviation fleet Working as a subcommittee of the CRC UL AVGAS Dev Group is the CRC VLL AVGAS Task Group which was tasked by industry to conduct research into options for reducing the lead emissions of 100LL AVGAS
A future technical report to be published by the FAA Technical Center will document the details of the engine testing conducted on a group of candidate reduced TEL AVGAS blends furnished by the fuel producers
Note that although the term ULL (ultra low lead) had been previously used to describe a reduced TEL content AVGAS the descriptor VLL (very low lead) has been recommended as the preferred suffix ie 100VLL and is the term of reference applied within this report for a reduced TEL content AVGAS This also avoids confusion with unleaded AVGAS development where the suffix ldquoULrdquo has been proposed for unleaded grades
Page 8 of 50 Version 40 Oct 14 2010
1 INTRODUCTION Aviation gasoline is produced pursuant to ASTM D 910 Standard Specification for Aviation Gasolines and DEF STAN 91-90 (British Ministry of Defense) where the maximum allowable tetraethyl lead (TEL) content for Grade 100130LL (hereafter referred to as Grade 100LL in this report) is restricted to a maximum level of 056 gPbL (053 mL TELL 200 mL TELgal) Grade 100LL was introduced during the 1970rsquos as a reduced TEL content AVGAS replacing the previous Grade 100130 which was limited to 084 gPbL ( 08 mL TELL 300 mL TELgal) Grade 100LL offered a significant reduction in TEL content from the prior Grade 100130(1) Although ASTM D 910 includes provisions for AVGAS Grades 8087 9198 and 100130 the 100LL AVGAS product is the predominant AVGAS produced world-wide and used by the general aviation piston fleet The octane quality and associated knock resistance of aviation grade gasoline has relied almost exclusively on the octane enhancing additive TEL which has been used as a knock suppressant in aviation gasoline since the late 1920rsquos The compound TEL is the primary fuel additive enabling the high octane quality fuel required by high performance high compression ratio aviation engines As domestic environmental measures have continued to reduce the use of lead in manufactured products aviation gasoline today remains the only domestically produced gasoline containing TEL The general aviation industry has accordingly committed to pursue options for unleaded aviation gasoline including both near term and long term strategies for reduction of TEL content The AVGAS Stakeholder Group is a broad based coalition which represents the general aviation industry today relative to future unleaded aviation gasoline The Stakeholder Group is working collaboratively with the industry manufacturers the FAA and the EPA to formulate and implement plans providing for reductions in lead emissions as associated with the 100LL AVGAS product A major tenant of the Stakeholderrsquos Group near term plan includes research into options for a reduced TEL content 100LL AVGAS In August 2009 the AVGAS Stakeholder Group petitioned the CRC Unleaded AVGAS Development Group to investigate and conduct research into options for a reduced TEL content AVGAS Since that time the CRC VLL Task Group working as a subset of the CRC Unleaded AVGAS Development Group has conducted test and evaluation of reduced TEL content AVGAS and has provided input and support to the FAA Technical Centerrsquos investigations into TEL production levels for commercial FBO AVGAS Working as a member of the CRC VLL AVGAS Task Group the FAA William J Hughes Technical Center has completed a survey of FBO 100LL AVGAS for TEL content and associated ASTM D 910 properties for the specific purpose of documenting TEL content for commercial 100LL AVGAS as used by the active fleet Complementing the TEL study a review of FAA Service Difficulty Reports (SDR) was performed for the purpose of searching for reports of detonation related service incidents for the piston powered fleet The objective of this report is to document the findings and observations associated with the survey of FBO AVGAS TEL content and associated properties including search results of the FAA SDR database for detonation incidents Also documented within the survey report are 100LL AVGAS production TEL levels for a major AVGAS producer and the TEL content for AVGAS used in official FAA certification testing by the OEM engine manufacturers Test results for a series of full scale engine tests performed with a group of partially leaded fuels to assess the ldquolead responserdquo of a representative high output worst case conventional reciprocating engine are included as complementary data It is not the intent of this report to provide a recommendation for a specific reduction in TEL content but rather the objective is to provide technical data and analysis sufficient to enable industryrsquos decision making process regarding a reduction in TEL content
Page 9 of 50 Version 40 Oct 14 2010
2 BACKGROUND 21 GENERAL AVIATION LEAD REDUCTION INITIATIVE
The National Ambient Air Quality Standards (NAAQS) were updated by the EPA in 2008 to reduce allowable levels of lead by 90 The revised standard requires measurement of lead levels in the vicinity of general aviation airports For each location found to be in a non-attainment status with the NAAQS the State must develop a plan approved by the EPA to reduce lead emissions to bring these areas into attainment by 2017 As a result of this regulatory action there is an urgent emphasis on addressing measures for reducing lead emissions from general aviation aircraft The Aircraft Owners and Pilots Association (AOPA) the Experimental Aircraft Association (EAA) the General Aviation Manufacturers Association (GAMA) the National Air Transportation Association (NATA) the National Business Aviation Association (NBAA) the American Petroleum Institute (API) and the National Petrochemical and Refiners Association (NPRA) comprise the AVGAS Stakeholders Group which represents the General Aviation aircraft owners operators and manufacturers and the oil and natural gas industry producers refiners and distributors of aviation grade gasoline (AVGAS) This AVGAS Stakeholder Group is actively engaged in working with the manufacturers the FAA and the EPA to achieve significant reductions in lead emissions for the General Aviation piston powered fleet which requires a minimum grade 100LL AVGAS(2) The stated purpose of this Group is to collaborate coordinate and provide leadership leading to the development and implementation of the process by which an unleaded AVGAS solution will be identified(3)
The AVGAS Stakeholder Group has identified both near term and long term strategies leading to the eventual transition to an unleaded AVGAS which are extracted from reference (3) as follows(3) The Stakeholder Group Near Term Strategy provides for a near-term reduction of lead emissions from General Aviation aircraft based upon the following criteria Note that the suffix VLL is used within this report to indicate a reduced TEL content AVGAS the final determination and selection of a suitable suffix may well differ from the modifier VLL the suffix ULL had previously been used to indicate a reduced TEL content AVGAS
AVGAS STAKEHOLDER GROUP NEAR TERM STRATEGY (3)
A drop-in 100VLL as a replacement for 100LL
Requires no action from manufacturers or operators
No impact on engine or aircraft FAA certification
The use of 100VLL lowers total lead emissions in airport areas where
monitoring may determine the current NAAQS standard is not being met
Page 10 of 50 Version 40 Oct 14 2010
Although not the subject of this report the AVGAS Stakeholder Long Term Strategy is structured around five major phases which are extracted from reference (3) and repeated as follows
AVGAS STAKEHOLDER GROUP LONG TERM STRATEGY (3)
Phase I ndash Establish FAA-led public-private partnership
Develop and implement an integrated FAA program to provide the
information necessary for the marketplace to identify the best unleaded solution which is technically feasible
Phase II ndash Identify viable unleaded AVGAS specification
Evaluate current D910 fuel specification to determine which
parameters can be adjusted Identify and support research needs for development of an
unleaded AVGAS specification Define all criteria for a viable unleaded AVGAS Develop engine and aircraft certification processes to transition
existing fleet to a new fuel
Phase III ndash Develop and approve an ASTM fuel specification
Phase IV ndash Certify new production aircraft to new fuel specification
Only affects new production engines and aircraft Would require dual certification for unleaded and 100LL AVGAS
Phase V ndash EPAFAA regulate transition to unleaded AVGAS (includes
FAA approvals amp certifications necessary for safety) Transition timeline dependent upon level of impact
FAA approvals amp certifications necessary for safety AVGAS production amp distribution infrastructure
Regulation may need to consider special provisions if there are portions of the fleet that cannot transition within the timeframe
Page 11 of 50 Version 40 Oct 14 2010
22 ASTM D 910 SPECFICATION ldquoASTM D 910 Standard Specification for Aviation Gasoline and DEF STAN 9190 (British Ministry of Defense) are recognized throughout the world as primary specifications for the production and quality control of AVGASrdquo(1) ASTM D 910 which was first introduced in 1947 currently provides for four different aviation grade gasolines Current aviation grade gasolines are summarized in Table 1 of ASTM D 910 which is repeated below as Table 10 for the purpose of identifying TEL limits and associated octane ratings As shown the maximum allowable TEL content for Grade 100LL is 056 gPbL (053 mLL) which is equivalent to 200 mLgal There is no minimum limit specified for current TEL content Aviation grade 100LL has gradually become the predominant fuel used by the general aviation piston fleet both domestically and globally where the 100LL AVGAS is approved for use on those aircraft and engines originally certified for lower grades 8087 and 9198 For information on international specifications by country of origin for aviation gasoline refer to reference (1)
Table 10 Detailed Requirements for Aviation Gasolines (4)
Extracted from ASTM D 910-04a Specification Grade
80 Grade
91 Grade 100LL
Grade 100
ASTM Test Method
Knock Value lean mixture
Octane Number Min
800
910
995
995
D 2700
Knock Value rich mixture Octane Number Performance No
Min Min
870
980
1300
1300
D 909 D 909
Tetraethyl lead mL TELL gPbL
Max Max
013 014
053 056
053 056
106 112
D 3341 or D 5059
Color red brown blue green D 2392
23 AVGAS HISTORICAL TEL CONTENT Historically the TEL content in aviation gasoline has continued a downward trend from the high levels of 460 mLgal (max) allowed in the early Grade 115145 aviation gasoline to the current 200 mLgal (max) specified for the Grade 100LL AVGAS Grade 100130 which was the predecessor to 100LL had a maximum TEL content of 300 mLgal Grade 100 is listed today as containing a maximum 400 mLgal TEL although Grade 100 is not currently a production fuel As precipitated by a growing environmental awareness in the 1970rsquos Grade 100LL AVGAS was introduced during the 1970rsquos which provided a significant reduction in TEL content and associated lead emissions Grade 100LL AVGAS gradually became the predominant global aviation gasoline for piston powered aircraft Table 20 which is extracted from a 1951 document reference (5) provides further insight into historical aviation gasoline grades and their associated critical properties including TEL content Reference 5 indicates the MIL-F-5572 specification allowed a higher TEL content for the 9196 and 100130 grades than specified in the D910-48T specification Reference (12) provides additional insight and data on the development and characteristics of aviation gasoline
Page 12 of 50 Version 40 Oct 14 2010
460
300 300
400
200 200
0490
05
1
15
2
25
3
35
4
45
5
TEL mLgal
115145 108135 100130 100 100LL 9198 8087
AVGAS GRADE
AVGAS TEL Max Content [mL TELgal]
Figure 10 Historical AVGAS TEL Content Ref ASTM D 910
Table 20 Summary of 1951 Military amp Commercial Aircraft Gasoline Specifications (5)
End point max degF 338 338 338 338 338 338 338 338 338 Lead mlUS gal max 05 46 46 46 05 20 30 30 46 Color Red Blue Green Purple Red Blue Green Brown Purple Freezing Point max degF -76 -76 -76 -76 -76 -76 -76 -76 -76 Octane number lean min 80 91 100 - 80 91 100 - - Performance no lean min (583) (76) 100 115 (583) (76) 100 108 115
Octane no rich min - 96 - - 87 98 - - - Performance no rich min - (875) 130 145 (68) (875) 130 135 145
Heat value Btu per lb min 18700 18700 18700 18700 18700 18700 18700 18800 18800
3 TEL EFFECT ON ENGINE PERFORMANCE The compound tetraethyl lead (TEL) has a powerful effect on engine performance specifically as an anti-knock agent when used as an additive in aviation grade gasoline The fuel octane rating needed to ensure that an engine will operate knock free is considered to be a first order requirement for an aviation spark ignition piston engine fuel Refiners add TEL to meet the octane requirements for AVGAS As documented in reference (11) the CRC Unleaded AVGAS Development Group determined that engine octane requirement is the most demanding and challenging criteria for an unleaded AVGAS Accordingly research into options for unleaded AVGAS and reduced lead content AVGAS has been driven by engine octane requirements
As background considerations for a reduced TEL content AVGAS it is important to recognize those AVGAS components which influence and establish the MON quality of the resulting 100LL product The addition of TEL certainly has a significant impact on knock response and resulting fuel MON quality but the base alkylate and aromatic content are other significant contributing variables Refiners balance these three components (base alkylate aromatics and TEL) to achieve the desired MON rating of the fuel There is a limit to which the effect of reduction in TEL may be offset by adjustment to the aromatic content while maintaining MON performance
The following indicates the significance of the effect of TEL on engine knock performance using both historical data for a typical high output radial engine and recent data generated as part of a CRC-FAA Technical Center research program to evaluate effect of TEL in conventional horizontally opposed high output worst case reciprocating aircraft engine The following provides insight into the sensitivity of engine knock performance to TEL content in the range of 10 ndash 20 mLgal
31 LEAD RESPONSE RADIAL AIRCRAFT ENGINE The effect of TEL on aircraft engine performance has been the subject of extensive research since the early days of aviation Research conducted on radial spark ignition reciprocating engines during the height of radial engine production years probed the ldquolead responserdquo of engine operation using leaded aviation gasoline A number of technical reports in the NACA archives document research results for explorations into leaded aviation gasoline in addition to investigations into other octane and performance enhancing additives
NACA Report No E4I28 was found to include test results described as ldquoLead Responserdquo for a typical radial engine power section The results are included within this report as an indication of effect of TEL on radial engine knock performance The following Figure 20 which is extracted from NACA Report No E4I28 indicates the ldquolead responserdquo for a Pratt amp Whitney R2800 radial engine (based upon single cylinder tests) in terms of knock limited IMEP for fuelair ratios of 0075 and 0100 The test fuel was an S-3 Aviation Reference fuel with TEL content varied from 000 to 600 mLgal (6)
Figure 20 provides an indication of the sensitivity of knock limited IMEP to TEL content for the configuration and test conditions documented in E4I28
Based upon the actual data points within the range of 15-22 mLgal a change of 04 mLgal results in a 49-37 impact on knock limited IMEP for a fuelair ratio of 075 FA The sensitivity may also be expressed as 01 mLgal is equivalent to 12 - 9 impact on knock limited IMEP
Based upon the actual data points within the range of 106 ndash 200 mLgal a change of 04 mLgal results in a 41 impact on knock limited IMEP for a fuelair ratio of 100 FA which indicates sensitivity of 1 change in knock limited IMEP per 01 mLgal TEL
Page 14 of 50 Version 40 Oct 14 2010
Figure 20 further indicates that for the configuration and test conditions documented in E4I28 a change in TEL content from 30 mLgal to 20 mLgal resulted in an impact of approximately 96 on knock limited IMEP
Insp10 to comme show that a distinct irregularity in the susceptability curve exists in the region of 08 to 14 ml tetraethyl lead per gallon It is also
ection of Figure 20 indicates an inflection or shift in the lead response curve in the area of 15 mLgal TEL The NACA researchers noted this observation with the following nt ndash ldquoThe results plotted in figure 18(b)
questionable whether this characteristic would be found under all test conditions and if it should whether this irregularity would always appear at the same tetraethyl-lead concentrations and would be of the same magnituderdquo (6)
R-2800 Engine Single Cylinder Ref NACA E4I28Lead Response C urve L IMEP vs TEL ContentK
160
180
200
220
240
260
280
300
320
340
0 05 1 15 2 25 3 35 4 45 5 55 6
Kno
ck L
imite
d IM
EP lb
sq
in
mL TELgal in S-3 Reference Fuel
Notes1) Data extracted from Figure
18 NACA Report No E4I282) R-2800 Single Cylinder3) KL IMEP = knock limited
32 LEAD RESPONSE CONVENTIONAL AIRCRAFT ENGINE Aviation industry re last 15 years has essentially followed in the footsteps of yesterdayrsquos engine engineers and fuel chemists
atives for reducing and line In consideration of
search into unleaded avgas alternatives during the
however the objectives and focus of research has shifted to alternultimately eliminating lead emissions as associated with aviation gasothe Aviation Stakeholder Grouprsquos near term strategy to pursue a reduction in lead emissions using a ldquodrop inrdquo replacement reduced lead content 100 min grade AVGAS the Aviation Stakeholder Group requested the CRC Unleaded AVGAS Development Group working in conjunction with the FAA Technical Center to investigate and conduct research into options for a reduced TEL content AVGAS In response to the Stakeholder request dual initiatives were launched by the CRC and FAA including full scale engine testing of manufacturerrsquos reduced
Page 15 of 50 Version 40 Oct 14 2010
TEL content AVGAS blends in addition to an effort to assess and identify typical TEL content in 100LL AVGAS consumed by the fleet The CRC VLL Task Group working as a subset of the CRC Unleaded AVGAS Development Group has conducted test and evaluation of reduced TEL content AVGAS samples and has
rovided support and input to the FAA Technical Centerrsquos investigation into TEL production
response to the Stakeholder request the CRC VLL Task Group defined and implemented a d for full scale engine testing of a group of e fuel producers Although the requirement
which was the primary test engine used for prior RC Unleaded AVGAS research projects(11) was also used for the test investigations into the
lead response of the fuels identified in Table 30 The IO-540-K engine is rated at 300 BHP at 2700 RPM and features a 5125 inch bore with 871 CR the engine is six cylinder air-cooled horizontally opposed fuel injected engine and has been determined to be one of the worst case naturally aspirated engines relative to octane requirement(11) The IO-540-K is representative of the large bore six cylinder naturally aspirated engines rated on minimum grade 100LL AVGAS which power a large segment of the general aviation fleet The combination of large cylinder bore high compression ratio and high output are primary design features contributing to the high octane requirement
plevels for commercial FBO AVGAS The following describes the preliminary results of CRC research investigations into full scale engine tests of a group of partially leaded fuels The following data are provided in advance of a formal FAA Technical Center report which will document the full scale engine tests of a group of manufacturerrsquos reduced lead content fuels
33 CRC-FAA AFETF ROUND I VLL TESTS Inresearch program during early 2010 which providereduced TEL content AVGAS blends furnished by thwas that the test blends meet D 910 specification one of the fuel groups consisted of batch of 5 blends which were prepared using a production AVGAS the TEL content was varied from 0 to 64 of max allowable TEL with toluene content maintained at approximately 11 EM1 was a D 910 compliant fuel This latter group of reduced TEL content fuel blends which are summarized in Table 30 offered the opportunity to investigate the lead response of similar fuels with varying TEL content in a full scale engine The 100LL fuel noted in Table 30 represented a baseline FBO AVGAS with TEL content at 943 of D 910 limits See Figures 60 and 70 for test fuel MON and Supercharge Rich trends
A Textron Lycoming model IO-540-K engine
Table 30 (7)
CRC FAA Tech Center VLL Fuels Matrix Round I Tests 2010
ULL Blend
TEL (mLL)
TEL (mLgal)
Max TEL D 910
Toluene (vv)
MON (D2700)
SC Rich (D909)
100LL 050 189 09434 lt05 1039 1315
EM1 034 1287 06415 118 1024 135
EM2 026 098 04906 116 1016 129
EM3 017 064 03208 115 1002 117
EM4 008 030 01509 113 995 107
EM5 000 000 00000 111 944 97
C
Page 16 of 50 Version 40 Oct 14 2010
ull scale e d June 20 the Tec Cent tion F nd E Test F y (AFETF) cated in conducting ixture le cur t po ttings [27 M WO 5 [2 PM] 75 450 RPM 65 50 R Eac six cy s was itored cdications ead concept described in reference (11)
esults of the FAA AFETF detonation tests using the Table 30 fuels are shown graphically in igure 30(7) The diagonal lines which intersect the BHP curves for each power setting indicate e fuel flow corresponding to onset of combustion knock for each of the fuel blends shown he RPM indications correspond to the power settings of 100 85 75 and 65 Although igure 30 illustrates the relative knock performance of the Table 30 fuels it does not establish quantifiable relationship between TEL content and engine knock but rather only indicates ose fuels with higher TEL provide an increasingly positive effect on engine knock
erformance
F ngine detonation testing of the reduced TEL fuels shown in Table 30 was completein 10 at FAA hnical errsquos Avia uels a ngine acilitlo Atlantic City
an outNew Jersey Engine det
ves aonation test
of 100procedure consisted of
00 RP
600 Rm wer se T] 8[2 ] and
of detonatio [23
n as indicatPM]
ed by comh of the
bustion pressure using thlinder mon
e instrumented cylinder ontinuously for
inh RFthTFathp
240
250
260
270
280
290
300
epow
er
150
160
708090100110120130140150160170FUEL FLOW (lbhr)
170
180
190
200
210
220
230
Bra
ke H
ors
2700 RPM
2600 RPMRICH
100LL
EM1
EM2
2450 RPM
2350 RPMEM4
EM3
ULL AVGAS TESTS RESULTSEM1-EM5100LL
IO-540-K Knock On Set
LEAN EM5
Figure 30 Knock Limited Fuel Flow ULL Test Matrix IO-540-K(7)
With the objec
erformance Ftive of quantifying the relationship between TEL content and engine knock igures 40 and 50 are derived from the Figure 30 data by plotting knock limited
s a function of TEL content for lines of constant BHP The resulting data sets provide an indication of the effect of change in TEL content on engine knock performance as manifested by knock limited fuel flow The MON rating for each test fuel is noted for reference since there was a gradual reduction in MON as TEL content was reduced with the drop in MON becoming more aggressive beginning at 030 mLgal TEL as shown in Figure 60 Figure 70 shows the supercharge rich ratings for the Table 30 test fuels where the difference in the rich rating between EM1 and 100LL is likely the result of the difference in toluene content
pfuel flow a
Page 17 of 50 Version 40 Oct 14 2010
CRC VLL Round I Test Results IO-540-KFuel Flow Lbshr Knock On Set
Figure 40
ldquoLead Responserdquo TEL (mLgal) Curve IO-540-K
CRC VLL Round I Test Results IO-540-KFuel Flow Lbshr Knock On Set
Figure 50
ldquoLead Responserdquo TEL (mLL) Curve IO-540-K
Page 18 of 50 Version 40 Oct 14 2010
CRC VLL Round I Test FuelsD 2700 MON Ratings
90
95
100
105
110
0 02 04 06 08 1 12 14 16 18 2 22
MO
N D
270
0 M
ON
Rat
ing
TEL Content - (mLgal)
MON D2700
100LLEM1
EM2EM3
EM4
EM5
Figure 60
D s
2700 MON Ratings CRC VLL Round I Test Fuel
CRC VLL Round I Test FuelsASTM D 909 Supercharge Rich Rating
90
100
110
120
130
140
150
0 02 04 06 08 1 12 14 16 18 2 22
Supe
rcha
rge
Ric
h R
atin
g D
909
TEL Content - (mLgal)
SC RICH D909
EM3
EM4
EM2
EM1100LL
EM5
Figure 70
D 909 Supercharge Ratings CRC VLL Round I Test Fuels
Page 19 of 50 Version 40 Oct 14 2010
34 Figures 40 described
approaches
ock limited
TEL values ranging fro
content for t mented
CONCLUSIONS ROUND I VLL TESTS and 50 indicate the ldquolead responserdquo for the IO-540-K test engine using the fuels
in Table 30 The data indicates the ldquolead responserdquo in terms of knock limited fuel flow for TEL content in the 150 to 200 mLgal range is linear There is a ldquokneerdquo in the curvearound 060 mLgal below which the ldquolead responserdquo becomes non-linear as the TEL content
zero
The utility of Figures 40 and 50 is that they indicate the relative change in engine knfuel flow as a function of TEL content in the 150 ndash 20 mLgal range of interest and beyondwhich provides for correlation with the fleet service experience with AVGAS at
m 122 ndash 200 mLgal as discussed in Section 5 of this report
Figures 40 and 50 provide an indication of the sensitivity of knock limited fuel flow to TELhe conventional IO-540-K engine configuration and test conditions docu
ge of wn in
Assuming a linear response in the 13 ndash 20 mLgal range the data indicate a chan04 mLgal results in a 49 impact on knock limited fuel flow for the BHP shoFigures 40 and 50
Alternately a change of 05 mLgal results in a 6 impact on knock limited fuel flow for the BHP shown in Figures 40 and 50
A change in TEL content from 200 mLgal to 122 mLgal (39 reduction) is equivalent to a 94 chan d 50 ge in knock limited fuel flow reference Figures 40 an
ay be ote
d in
he size of the general avia
piston powe total ion
comprising 453 aircraft which is estdefined as he General Aviation Ma
Piston powe
arrangements manufactured by original eq nufacturers (OEM) Teledyne Continental Motors and Textro CAR 13 Civil Air Regulations or 14 CFR 33 Federal Aviation regulations
Many older GA engine models are approved to operate with a minimum grade 8087 AVGAS but are also approved to operate with the more readily available higher grade 100LL AVGAS A
Based upon Figures 40 and 50 the sensitivity of engine knock to TEL content mexpressed as 01 mLgal is equivalent to 12 impact on knock limited fuel flow Nthat this is in agreement with the radial engine lead response at 075 FA discusseSection 31 Although the metrics are expressed in different terms knock limited IMEP for a radial engine and knock limited fuel flow for a conventional engine they arecomplementary and indicate the relative change in knock on-set as a function of TEL
4 GENERAL AVIATION PISTON POWERED FLEET Of interest relative to the use of 100LL AVGAS and the associated TEL content is t
tion piston powered fleet which requires use of a minimum grade 100LL AVGASBased upon the results of a recent study which researched the FAA Registry for registered
red aircraft and the associated FAA TCDS for a listing of approved fuels theUS GA fleet in 2010 consists of 228078 aircraft with the piston powered fleet port
83 of the total(8) The US piston fleet in YR2010 consists of 189imated to be 60 - 70 of the total worldwide piston fleet General Aviation is all aviation other than military and commercial airlines according to tnufacturers Association(11)
red GA aircraft (less than 12000 lbs gross weight) are almost exclusively poweredby horizontally opposed spark ignition reciprocating engines configured in 4 6 and 8 cylinder
uipment man Lycoming as FAA approved products conforming to either
Page 20 of 50 Version 40 Oct 14 2010
small percentage of the fleet is approved to operawith a few aircraft listing 9198 as the approved fu
te on an older minimum grade 9196 AVGAS el GA engine models produced since the mid
GA engines are both naturally aspirated and turbocharged with ratings from
1970rsquos are mostly high output high performance high compression ratio (85 ndash 87CR) engines which require a minimum grade 100LL AVGAS for adequate knock protection The minimum grade fuel approved for operation with an aircraftengine is specified in the engine FAA TCDS the aircraft FAA TCDS and the aircraft POH (Pilot Operating Handbook)
he FAA approved T100 BHP to in excess of 400 BHP Fuels approved for operation in GA engines are specified in the FAA approved OEM continuous airworthiness data and the associated FAA TCDS (type certificate data sheet which may be accessed at httprglfaagov) The approved fuel is typically specified in the FAA TCDS as aviation gasoline conforming to ASTM D 910 pecification either minimum grade 8087 9196 9198 100LL or 10013s 0 FAA certification of
41A stud ssioned by the FAA Technical Centerrsquos Aviation Fuels and Engine Test Facility (AFETF) to quantify the piston powered fleet composition based upon the approved minwhich are based upon data contained in the FAA Registry and the FAA TCDS establish a baseline data base for the active piston powered aircraft by make and model along with a listing of t Based upon the results of this study reference (8) 433 of the GA fleet requires a minimum Gragasolinof the accounthe gen80 87 er grade 100LL Engine manufacturer service bulletins specify that engines are approved to
perate with the next higher grade AVGAS but are not approved to operate with a lower grade e eligible for operation with 100LL oved for use with an unleaded min
each engine model required that adequate detonation (knock) margins be demonstrated by test using a certified fuel of minimum quality while operating at worst case conditions for knock
FLEET APPROVED MINIMUM GRADE FUEL y was recently commi
imum grade fuel as listed in the FAA TCDS for each aircraft(8) The results of this study
he approved minimum grade fuel
de 100LL AVGAS and is therefore dependent upon the leaded aviation grade 100LL e for both performance and knock protection Industry specialists believe it is this 433 fleet representing later model aircraft used for business and utility purposes which ts for the majority of the general aviation flight time Although there is a large segment of eral aviation fleet (84429 aircraft representing 446 of fleet) rated on minimum grade
90 or 91 AVGAS this group of aircraft is also approved to operate with the next high
oTherefore 166492 aircraft representing 879 of the fleet arAVGAS FAA TCDS data show 04 of the aircraft are apprgrade 9196 In the absence of a domestic min Grade 91 production AVGAS and minimal availability of min Grade 80 AVGAS min Grade 100LL is the predominantly available AVGAS today A 9196UL AVGAS is available within Europe
Page 21 of 50 Version 40 Oct 14 2010
Table 40 (8)
General Aviation Fleet Approved Min Fuel Grade Based Upon FAA Registry amp TCDS
Fuel Grade Number of Aircraft
Percent of 189453 Aircraft
100LL Minimum 82063 433
80 Minimum 69402 366
Other Fuel 17508 92
91 Minimum 13387 71
Unknown 5306 28
Unleaded 9196 825 04
87 Minimum 802 04
Jet A 147 01
90 Minimum 13 00068
Total Aircraft 189453 100 Notes
Minimum fuel grades extracted from FAA TCDS for aircraft Category ldquoother fuelrdquo includes TCDS fuel designations of 65
70 73 108135 amp 115145
wing describes the results of the FAA echnical Centerrsquos survey to quantity FBO AVGAS TEL levels as dispensed to the fleet
1 OBJECTIVES STM D 910 specifies a maximum content for TEL in 100LL AVGAS but no minimum With the cognition that there are normal production variances in TEL content of AVGAS as the result of
rocess variables including basic alkylate and refining process the FAA Technical Centerrsquos FETF commissioned a study to investigate the actual variation of TEL content in 100LL VGAS The primary objective of this study was to quantify the normal variances in TEL ontent as encountered by the fleet at the FBO level with a secondary objective of documenting
s in TEL content The purpose of this study was to develop
5 SURVEY 100LL AVGAS TEL CONTENT Whereas 100LL AVGAS is the predominantly available aviation gasoline today and in consideration of the AVGAS Stakeholder Grouprsquos near term strategy to pursue a reduction in lead emissions using a ldquodrop inrdquo replacement reduced lead content 100 min grade AVGAS the AVGAS Stakeholder Group requested the CRC Unleaded AVGAS Development Group working in conjunction with the FAA Technical Center to explore options and viability for a reduced TEL content 100 min grade AVGAS In response to the Stakeholder request dual VLL initiatives were launched by the CRC and FAA including full scale engine testing of manufacturerrsquos reduced TEL content AVGAS in addition to an effort to assess and identify typical TEL content in 100LL AVGAS consumed by the fleet The folloT
5ArepAAcfleet operating exposure to variance
Page 22 of 50 Version 40 Oct 14 2010
a data base that would support and contribute to the industryrsquos study of options for reducing lead emissions Prior to this study there o no information available in a summary format which document vered to the fleet
52 METHODS The production and quality control processes for aviation gasoline require the documentation of critical fuel properties b at bot finery leve delivered by the fuel distributer to the FBO (Fixed Base Operator) Each batch of fuel is panied by a certificate of analysis which identifies nce o erties g TEL content MON SC rating density vapor pressure net heat of combustion and distillation properties in accordance with the applicable ASTM specification Accordingly the 100LL AVGAS delivered to the FBO infrastructure is ted by tificates of analysis (CofA)
Additional data on analysis of fuel properties is available through the ASTM NEG (National Exchange Group) wherein AVGAS samples are shared among various test laboratories for documentation of critic part of a s check of r bility The NEG data furnished for the purpose y was e format of average values and did not associate properties with a specific refinery The FAA Technical Centerrsquos field TEL study focused on generating a data base of TEL co using certific f analysis obtained at random from the FBO infrastructure The resulting data base also included TEL data provided by one major fuel produce years o oduction C of analysis for fuel samples collected by the F cted to by an inde included in the data base int wa rdquo for the pu f confidentiality
In recognition tha ates of analysis for 100LL AVGAS us conducted at the engine manufactu in FAA certification tests The resulti ed the FBO certificates of analysis Data from the
ngine manufacturers was also ldquoblindedrdquo for confidentiality
was limited ted normal TEL variances in 100LL AVGAS as deli
y laboratory test h the re l and as accom
includin the conforma f critical prop
well documen the cer
al properties as cros epeataof this surve in th
ntent ates o
r for several f pr ertificatesAA and subjeEach data po
analysiss ldquoblinded
pendent laboratory were alsorpose o
t the OEM engine manufacturers obtain and file certificed in official FAA certification testing a search was alsorers for documentation of 100LL AVGAS properties used ng data points complement
e
SURVEY DATA CAVEAT Survey data consisting of CofA NEG data and engine manufacturerrsquos reports were used without change or prejudice CofA are accepted by the industry as a certificate of validation Further investigation or verification of the accuracy of the reported data was determined to be outside the scope of the researcherrsquos authority It is noted that several data points indicated MON values higher than normal Although MON is of interest the primary objective of this survey was to explore and investigate TEL trends in production AVGAS
Page 23 of 50 Version 40 Oct 14 2010
53 RESULTS The resulting survey data consisting of certificates of analysis documentation furnished by the original engine manufacturers NEG data and refinery data were compiled and furnished by the FAA Technical Center to an independent consulting firm for review analysis and compilation in
summary report That report is included as Appendix A to this report (9) While the presented it was observed that the addition of data (from 55 to 89) had little impact on values of TEL The summary of findings is extracted from Reference (9) and
asample set is smallthe max and mean repeated as follows The reader is referred to Appendix A for a detail accounting of the survey data and associated analysis
(may indicate typographical error in original source report)
MON ratings
o Max = 1076
o Mean = 1038
o Min = 1011
Tetraethyl Lead content
o Max = 060 gPbL (107 of D 910 limit)
Page 24 of 50 Version 40 Oct 14 2010
Figure 100(9)
Segregation of Fuel Samples by TEL Reduction
39 of the fuel samples described by CofA and industry laboratory reports could meet a 20 reduction in TEL
51 of the fuel samples described by CofA and industry laboratory reports could meet a 15 reduction in TEL
64 of the fuel samples described by CofA and industry
laboratory reports could meet a 10 reduction in TEL
44 of the fuels u ertification could meet a 20 reduct
L
sed for FAA c
ion in TEL
67 of the fuels used for FAA certification could meet a 15 reduction in TE
6 GA FLEET 100LL SERVICE EXPERIENCE
he surve tion 100LL AVGAS as distributed to the fleet rough the general aviation iston powered fleet has
een exposed to service e a low of 61 of max mean of 8 g MON and other D 910
pecification properties As dditive TEL is effective as knock suppressant in AVG there is a corresponding pact on engine knock response A threshold of TEL reduction is ultimately reached where el octane quality is sufficiently degraded to the extent that engine knock margins are
egraded The latter is not the case with the current fleet as indicated by a study of related fleet ervice experience which indicates a neglible incident rate of knock with no indications of fuel lated incidents The successful service experience with varying levels of TEL speaks highly of e margins or
xperience has sh s usually manifested in burned pistons eroded iston domes or e holes in pistons with a resulting loss in engine power and a oticeable change in engine vibration With the objective of evaluating fleet service experience ased upon the premise that the fleet has been subjected to operation on 100LL AVGAS with EL content as low as 61 llowable TEL FAA Service Difficulty Reports (SDR) ave been reviewed for i tonation incidents as might be indicated by reports of urned pistons eroded pistons bu signs of detonationrdquo with the results
ummarized as fol
1 FAA SERVICE DIFhe FAA maintains a data viation products which may e accessed at http
Results of tth
y of TEL content in produc FBO network indicate that the domestic pxperience with TEL content varying fromb
allowable TEL to a s
4 of max allowable TEL while still meetindiscussed in Section 3 of this report the a
AS As the content of TEL is reducedaimfudsreth
iginally designed into the general aviation products
E own that the effect of knock ipn
dges or burned
bT - 84 of max ah ndications of de
rned hole in pistonldquobs lows
6 FICULTY DATA BASE T base for reports of service difficulties for ab av-infofaagovsdrx A reformatted version of the
d to list only general aviation related reports less air FAA SDR data base
hich is restructure carriers commuters nd military may be accessed at wwwlandingscom_landingspagessearchsearch_sdrhtml
wa
here SDR data is retrieved from the FAA ftp server on a weekly basis The FAA SDR data ase does not contain all reports of aviation difficulties but rather only those which are
wb
Page 25 of 50 Version 40 Oct 14 2010
voluntarily submitted to the FAA where each is based upon the submitterrsquos assessment of the ervice difficulty However the FAA SDR s provide useful information providing sight into specific ser ported difficulties rovide an indic tion of relative incident rates as compared to other difficulty categories or the
f all reports f ircraft models r engine models iation contains 500000 entries 1975
sin
data base doevice difficulties when viewed in the context that the re
p aaggregate oo
or a specified aircraft model engine model or groups of a The entire FAA SDR data base reflecting all elements of av
to present ref 1 httpwwwaviationdbcom
62 SDR REPOR
search of the FAA S ed for reports of etonation incident raft series hich represent t nce high ompression ratio engi aspirated and turbocharged Rather than searching all mall aircraft manu ral aviation ircraft models which a 5 aircraft or 817 of the total FAA registry of piston owered aircraft The search was facilitated by searching under the FAA JASC code ldquo8530rdquo(10)
nd key word ldquopistonrdquo FAA JASC code 8530 is defined as ldquoFor reports of engine cylinders and ssociated partshelliptypical parts are piston piston pin exhaust valve intake valve valve guide
s of the SDR data search are r each of the 31 ldquoburned pistonrdquo listings is
TS DETONATION INCIDENTS DR data base for the general aviation fleet was performA
d s by searching for reports of piston difficulties for the following airche manufacturers of those aircraft powered by high performa
nes both naturally wcs facturers the search targeted the following representative gene
ccount for 15482apaarocker arm valve cover cylinder pushrodhelliprdquo Resultsummarized as follows A copy of the SDR report foon file and available upon request The SDR reports surveyed covered a time period of 17 years 1993 to present
Table 50 FAA SDR Reports for Burned Pistons (10)
Representative Manufacturers ndash General Aviation Fleet FAA SDR Reports Aircraft
It is concluded based upon the review of SDR reports for detonation incidents for the fleet portion indicated that the occurrence of detonation in the fleet is rare with the total number of detonation incidents at 002 of the fleet surveyed None of the SDR reports corresponding to the above 31 reports of ldquoburned pistonsrdquo indicated fuel was a factor For some of the 31 reports it was not totally certain that detonation was the contributing event for the majority of the reports the cause of detonation was not identified Likely causes of detonation incidents include mis-adjusted ignition timing magneto failures blocked fuel injector nozzle and operation at high
ower with lean mixture Those reports which indicated structural failure of the piston rather an thermal failure were not included in the 31 reports which contained failure descriptions
ed hole in piston signs of detonationrdquo
pthconsistent with ldquoburned pistons eroded pistons burnPiston structural failures typically have unique signatures which are distinctly different from a detonation induced event which results in excessive piston temperature The engine models listed in the 31 reports are summarized in Table 60 relative to model designation and configuration - naturally aspirated turbocharged carbureted fuel injected compression ratio and approved min grade fuel Turbocharged engines represented 48 of the engines identified as possibly having encountered a detonation event No conclusions are drawn based upon engine models andor turbocharged versus naturally aspirated On the contrary the documented detonation events appear to be evenly distributed across the naturally aspirated and turbocharged models however the naturally aspirated fleet represents a larger population than turbocharged models
Table 60 (10)
Engine Models Listed in FAA SDR Reports of Bu Detonation rned Piston
Engine Model
Configuration Compression Ratio
Min Grade AVGAS
O-2 85 1035-L2 ) C (4ea NA Carb 0100LL
O-320-D2J NA Carb 85 9196
3G NA CaO-320-D rb 85 9196
O-470-R NA Carb 70 8087
IO-360-C1C NA FI 87 100100LL IO-360-G NA FI 85 100100LL IO-470-L (2) NA FI 86 100100LL
CB NAIO-520- FI 85 100100LL IO-520-D NA FI 85 100100LL IO-520-F NA FI 85 100100LL IO-540-K1J5 NA FI 87 100100LL IO-540-S1A5 NA FI 87 100100LL GTSIO-520-L Turbo FI 75 100100LL GTSIO-520-M Turbo FI 75 100100LL
100100LL GTSIO-520-N (2ea) Turbo FI 75
75 100100LL LTSIO-360-E Turbo FI
75 100100LL TSIO-360-KB Turbo FI
Page 27 of 50 Version 40 Oct 14 2010
TSIO-520-(Unkn) Turbo FI 75 100100LL
TSIO-520-NB (2ea) Turbo FI 75 100100LL TSIO-520-R (2ea) Turbo FI 75 100100LL TSIO-520-VB Turbo FI 75 100100LL
TSIO-520-WB Turbo FI 75 100100LL TIO-540-J2BD (2) Turbo FI 73 100100LL Notes
1) NA = naturally aspirated Turbo = turbocharged Carb = carbureted FI = fuel injected
7 CONCLUSIONS The purpose of the CRC research documented within this report was not to specify or recommend a specific reduced TEL level for AVGAS but rather to conduct research and investigations with the objective of generating technical data which would enable and facilitate the industryrsquos decision process for a reduced TEL AVGAS The results of the tests and investigations documented within this report fulfill this objective Significant findings and
bservations are summarized as follows
71 TEST RESULTS ENGINFigures 40 and 50 provide an indication of the sensitivit content for the conve -540-K g e t ns documented The following observations and conclusions are based the 15 gal TEL range of interest unless n
o
E LEAD RESPONSE y of knock limited fuel flow to TEL
uration and thupon
n IOtional engine confi est conditio 20 mL ndash
oted otherwise
Test res s a change Lgal (2 eduction ) results in a 49 impact on knock limited fuel flow
ults indicate of 04 m
0 r in TEL
Alternately a change of 05 mLgal (25 reduction in TEL) knock limited fuel flow
results in a 6 impact on
A chang ntent from Lgal to 1 mLgal ction in TEL) is equivalent to a 94 change in knock limited fuel flow Note that the survey results indicate minimum field FBO fuel ntent was umente 122 mLgal
e in TEL co 200 m 22 (39 redu
TEL co doc d as being
The sensitivity mLgal is equivalent to 12 impact on knock limited fuel flow over the 15 ndash 20 mLgal range of inter
may also be expressed as 01 est
Analysis conventio ine lead response is nt with the radial engine l of 10 -12 ge in kno mited IM 1 mLgal TEL as discussed in Section 31 Altho nock metrics are expressed in different terms knock lim radial en knock limited fuel flow for conventional engine these indice ementary a function
indicates theead response
nal eng chan
in agreemeEP per 0ck li
ugh the kited IMEP for
s are complgine and
nd indicate the relative change in knock on-set as a of TEL
Page 28 of 50 Version 40 Oct 14 2010
72 SURVEY R 00LL Figures 80 through 100 present a summary of the findings and observations documented within the Appe nifica and ob tions a ized as follows
ESULTS FBO 1 AVGAS
ndix A report Sig nt findings serva re summar
Survey r content i GAS (8 ta poinTEL content in AVGAS is 84 L allowe ASTM d upon the data examine
esults of TEL n FBO AV 9 da ts) indicate mean (average) of max TE d by D 910 base
d
Survey r tent i GAS in te the fleet has service experience with TEL content as low as 61 of the max TEL allowed by ASTM D 910 for fuels of 1016 MON
esults of TEL con n FBO AV dica
or higher
Mean MON for FBO AVGAS was observed to be 1037 MON with minimum MON documented at 1016 MON The maximum MON for AVGAS as indicated by the CofA data was 108 MON
Examination of engine manufacturer certification data (23 data points) indicates 100LL AVGAS used for official FAA engine certification testing had TEL content varying from minimum of 14 of max allowable to a mean of 71 of max allowed Associated minimum MON was 1011 with mean MON being 1038 The maximum MON for the 15 certification data samples was 1076 MON (Note that 14 may indicate a typographical error in the original source data)
39 of the fuel samples described by CofA and industry laboratory reports could meet a 20 reduction in TEL
51 of the fuel samples described by CofA a15 reduction in TEL
nd industry laboratory reports could meet a
64 of the fuel samples described by CofA and industry laboratory reports could meet a 10 reduction in TEL
44 of the fuels used for FAA certification could meet a 20 reduction in TEL
67 of the fuels used for FAA certification could meet a 15 reduction in TEL
73 FLEET SERVICE EXPERIENCE Withhas be n on 100LL AVGAS with TEL content as low as 61 - 84 of maDiffindicatedetona
the objective of evaluating fleet service experience based upon the premise that the fleet en subjected to operatio
ximum allowable TEL as documented by the Appendix A survey results FAA Service iculty Reports (SDR) were reviewed for indications of detonation incidents as might be
d by reports of ldquoburned pistons eroded pistons burned hole in piston signs of tionrdquo Significant findings and observations are summarized as follows
It is concluded based upon the review of FAA SDR reports for detonation incidents that the occurrence of detonation in the fleet is rare with the total number of detonation incidents at 002 of the fleet surveyed None of the SDR reports indicated fuel was a factor Qualifications regarding SDR reports are discussed in Section 61
r speaks highly of the margins originally designed into the general aviation powerplants in consideration that service experience indicates knock is a rare occurrence within the fleet
Analysis of survey results and engine lead response data indicates the fleet service experience with TEL content at 61 - 84 of max allowable TEL is equivalent to a 94 -38 variance in engine knock margin respectively from the baseline 20 mLgal TEL level The latte
Page 29 of 50 Version 40 Oct 14 2010
8 RECOMMENDATIONS The test results and findings documented within this report indicate the general aviation fleet hasAVGlead codocumented within this report Althtechnicthe aviation industry which are outside the jurisdiction of CRC research In tthe gemainte rovided with the necessary informational training
9 RE
f D02J02
GAS Coalition Briefing EAA AirVenture 2010 July 27 2010
ffects on Engine Performance NAVAER 06-5-501 USAF TO
I28 ldquoExperimental Studies of the Knock-Limited Blending d
inson
(8) Herbert W Schlickenmaier Crown Consulting Inc ldquoAviation Fuels Research Fleet Database 10 (prepared by Crown Consulting Inc under Purchase Order artin NISC II Bridge Contract DTFAWA-08-C-00009 with the
successful service experience with a TEL content of 122 ndash 200 mL TELgal (100LL AS) having a MON of 1016 or greater Technical considerations for specifying a maximum
ntent less than 200 mLgal should obviously be guided by the fleet service experience
ough a reduced TEL content within the range of experience documented within this report is ally feasible there are other non-technical considerations which must be addressed by
he advent of implementation of a reduced TEL AVGAS it is recommended that the FAA and neral aviation industry give consideration to ensuring aircraft owners pilots and nance personnel are p
FERENCES
(1) The History Specification Production Use and Evaluation of Unleaded Aviation Gasoline Report by the D 910 Task Force o
(2) Letter AVGAS Stakeholder Group to EPA dated June 10 2010
(3) Presentation GA AV
(4) ASTM D 910 ldquoStandard Specification for Aviation Gasolinesrdquo
(5) Aviation Fuels and Their ENo 06-5-4 dated 1951 by Ethyl Corporation
(6) NACA Report No E4Characteristics of Aviation Fuelsrdquo N D Sanders R V Hensley R Breitwieser dateOctober 1944
(7) FAA Technical Center Test Results Email dated July 25 2010 D Atwood to R Wilk
Reportrdquo dated October 13 207200006107 from Lockheed MFederal Aviation Administration)
(9) Melanie Thom Baere Aerospace Consulting Inc ldquoReview of Certificates of Analysis and Test Data of Aviation Gasoline for Current Ranges of Lead Additiverdquo dated Sept 9 2010 (prepared for Crown Consulting Inc under Purchase Order 7200006107 from Lockheed Martin NISC II Bridge Contract DTFAWA-08-C-00009 with the Federal Aviation Administration)
(10) FAA Flight Standards Service Aviation Data Systems Branch AFS-620 ldquoFederal Aviation Administration Joint Aircraft SystemComponent Code Table and Definitionsrdquo October 27 2008
(11) CRC Report AV-7-07 ldquoResearch Results Unleaded High Octane Aviation Gasolinerdquo June 17 2010
(12) Alisdair Q Clark BSc PhD ldquoAviation Gasoline History and Futurerdquo IASH 2007 October 2007
Page 30 of 50 Version 40 Oct 14 2010
izations specialized consulting firms the FAA and the CRC
nd Engine Test acility was crucial to the outcome Most importantly it was the foresight of the FAA AFETF
oject to survey FBO AVGAS with the goal of better understanding the mercial AVGAS
Lastly Developme report on their behalf
10 ACKNOWLEDGEMENTS The information contained within this report reflects the participation and commitment of industry specialists representing a broad segment of general aviation including fuel producers test laboratories FBO fuel distributors aviation engine and aircraft manufacturers aviation trade organizations fuel trade organexecutive office The successful completion of the survey of AVGAS properties followed by the compilation and analysis of survey data as complemented by engine testing to investigate engine lead response were made possible in no small part by the actions of those committed to the future of general aviation
The leadership and guidance provided by the Aviation Stakeholders was instrumental in establishing goals and objectives Typical of previous CRC aviation gasoline research projects the participation and contribution of the FAA Technical Centerrsquos Aviation Fuels aFwhich launched the prariance of TEL in comv
the author would like to express his humble appreciation to the CRC Unleaded AVGASnt Group for the opportunity to compile this
- END OF TEXT ndash
Page 31 of 50 Version 40 Oct 14 2010
Page 32 of 50 Version 40 Oct 14 2010
APPENDIX A
ldquoREVIEW OF CERTIFICA OF ANALYSIS AND TEST DATA OF AVIATION GASOLINE FOR CURRENT RANGES OF LEAD ADDITIVErdquo
VER 60 DATED S 9 2010
TES
EPTEMBER
REVIEW OF CERTIFICATES OF ANALYSIS AND TEST DATA OF AVIATION GASOLINE FOR CURRENT RANGES OF LEAD ADDITIVE AssesCurre In an attemptaviation gasoadded to current aviation gasoline This endeavor was to evaluate on a very small sample sASTM D-910 lower lead containing fuels This was done y reviewing the Certificates of Analysis procured for contemporary loads of aviation fuels from a variety of FBOrsquos and test labs as well as fuels used by engine manufacturers for engine certification The result was a sample set of 89 individual data points which were reviewed for the lead content all conver grams of lead per liter of fuel The samples were also segregated by gions using time zones of the manufacturer location and by refinery (blinded for this report) in an attempt to identify if any relationships of lead usage by region or by refiner This report used the data as provided by the manufacturers whose sole responsibility it is to the correctness of the data No assessment of the MON ldquocushionrdquo or evaluation of formulation should be made from this data
sing the Viability of Lowering Lead Levels in nt A iation Gasoline Production v
to demonstrate a commitment to the global community by the line user community it is desirou to reduce the amount of lead s
et the current lead additive levels in fuels currently meeting the specification to assess the industryrsquos current ability to produce
b
ted tore
Prepared by Melanie Thom 992010 Report Prepared for Crown Consulting
Page 33 of 50 Version 40 Oct 14 2010
REVIEW OF CERTIFICATES OF AND TEST DATA OF AVIATION GASOLINE
OR CURRENT RANGES OF LEAD ADDITIVE Aviation Gasoline
rrsquos reports was used t change or prejudi CoArsquos are accepted e industry as a certificate of validation
determined to be veral data points indicated MON
ctive of this survey was
garding the relationship between formulas MON cushion or how the he MON values can be made This analysis should only be used to uels currently meeting ASTM D910 with less than maximum allowable
d content Furthermore the production of VLL 100 requires more than just the reduction in to produce a lower lead ignificant research and
ulations that still meet all the specification uirements
While this is ve of the East resentative of
ions was also ch 21 had a
6 were blends sis This data
3 After reviewing the data it was determined that approximately 39 of the fuel described by the Certificates of Analysis (COA) and industry laboratory reports could meet a 20 reduction in the TEL additive 51 could meet a 15 reduction in TEL and 64 could meet a 10 reduction in TEL as indicated by current production lots
tion fuels with lead contents indicated 44 could meet the 20 reduction and 67 could meet the 15 reduction This is in line with the fielded data
NALYSIS
A
FAssessing the Viability of Lowering Lead Levels in Current
roduction
OTE Survey data consisting of CoA NEG data and engine manufactureithou ce by thurther investigation or verification of the accuracy of the reported data was tside the scope of the researcherrsquos authority It is noted that selues higher than normal Although MON is of interest the primary obje explore and investigate TEL trends in production AvGas
s such no conclusions read reduction will affect t
luate the existence of f
P
NwFouvato Aleeva
alelead The data in this report is only demonstration of the ability of refiners
el not an analysis of how to produce fuel with lower lead Svelopment will be required by refiners to develop form
fudere
q
S
ummary
1 The sample set excluding the ULL study included 89 individual data pointsa small sample set analysis of this data suggests that it is representatiCoast and Midwest There are no obvious indications that it is not repCentral and West Coasts
2 An additional set of Certificates for fuel used during engine certificatsupplied and reviewed This data set included 23 individual entries for whimotor octane value entry and 9 had a lead content Of the 23 samplesprepared from 100LL and iso-octane and were not included in the analywas analyzed separate from the field sample entries
o Of the nine certifica
Page 34 of 50 Version 40 Oct 14 2010
4 Sixteen (16) of the data was from the National Exchange Group (NEG) database and all location and refinery information was previously purged for these samples
5 When separated by refineries 25 of the fuel in the sample set was provided by a single refinery H Another 224 was provided by refinery C When the fuels from the individual refineries were analyzed it was determined that refinery H only produced 5that contained less than 20 TEL additive (1 of 19 samples) At a reduction of 15 and
uction (same of the
10 only 11 of the prod would be in spec 2 fuels 19) This is far
versa This is likely due to the influence of the third component the base alkylate for
o A question was raised that 108 as an MON seemed unlikely With this data point removed the mean was still 1037 and the new maximum was 1076
tent was 040gL and the median was 043 The maximum
10
11 d had a reported MON of greater than 102 sixty percent had an MON greater than 103 and thirty-two percent were
This res search Program at the William J Hughes Technical Center in Atlantic City New Jersey by Baere Aerospace Consulting IMartin NISC B
below the group percentages and indicates that this refinery would likely be unable to meet a lead reduction with current production
6 A review of the data by region and by refinery showed no relationship with the amounts of lead used with the exception of refinery H
7 While there was limited aromatic information available there did not appear to be any relationship between the amount of lead used and the amount of aromatics used Said another way there did not appear to be high lead required with low aromatics or vice
which there is no information
8 The mean MON value was 1037 The maximum was 108 and the minimum excluding a sample set made for the ULL study was 1016
o Of the 15 certification fuel samples the mean MON value was 1038 The maximum value was 1076 and the minimum was1011
9 The mean elemental lead content was 047gL and the median was 048gL The maximum was 056gL and the minimum excluding the ULL study set was 034 gL
o Of the 15 certification samples excluding the blended test samples the mean elemental lead conlead content was 060 gL and the minimum was 008gL
The mean elemental lead content of all analyzed samples excluding blend samples was 046gL This value is 82 of the maximum lead level permitted (046 056)
Eighty-seven percent (87) of the samples reviewe
greater than 104 Only five percent were higher than 105
earch was funded by the Federal Aviation Administrations Fuels Re
nc for Crown Consulting Inc under Purchase Order 7200006107 from Lockheed II ridge Contract DTFAWA-08-C-00009 with the Federal Aviation Administration
Page 35 of 50 Version 40 Oct 14 2010
ConteSummar
Discussio
Backg
Sa
Reg 37
Lead
Oth
Develo ion Levels 39
Analysis
Combined Data 40
By Region
By Refinery
From Engine C 42
Conc
Annex ndash 44
Figure 1 ndash US TiFigure 2 ndash Table 38 Figu 44 Figure 4 ndash Lead Content vs Aromatic Content Including Engine Cert 45 FiguFigure 6Fuels 47 igure 7 ndash Lead Content vs Aromatic Content by Blinded Refinery Including Engine Cert Data 48
nts y 34
n 37
round 37
mple Handling 37
ion Identifier
MON Values from Aviation Lean Ratings 38
Content 39
er Data Sources 39
pment of Max Lead for Reduct
39
40
401
ertification Fuels
lusions 43
Graphical Representations of the Data
me Zones 38 9 from ASTM D‐2700
re 3 ndash Supercharge rating vs Motor Octane Number vs Lead content Including Engine Cert
re 5 ndash Lead Content vs Aromatic Content by Region for CoArsquos Excluding Engine Cert Fuels46 ndash Motor Octane Number vs Lead Content by Region for CoArsquos Excluding Engine Cert
FFigure 8 ndash Motor Octane Number vs Lead Content by Refinery Including Engine Cert 49 Figure 9 ndash Motor Octane Number vs Lead Content Specific to the Engine Certification Fuel 50
Page 36 of 50 Version 40 Oct 14 2010
Discussion
Background
PA issued an advanced notice of proposed rulemaking and requested input on data
reducing the amount of lead used in current compliant fuel formulations was considered as a
opadspaviation com The refiners seemed uncomfortable providing an assessment of their formulas and their current leaddiscouleadthe actu The third activity was a review of the CoArsquos for currently supplied fuel The hypothesis was that
ability to produce fuel with lower than maximum lead This collection was accomplished by resethfromanufath
nalysis were collected as copies from the FBOrsquos where fuel was purchased he FBOrsquos were selected randomly The data from the certificates were entered into a
In 2010 the Egaps As part of the Industry Stakeholders FAST plan to respond to the EPA the possibility of
near-term means of responding In the short time available several options for evaluating this tion were proposed 1) having the refiners report on their current ability to reduce their lead ditive levels and meet specification 2) having refiners blend very low lead (VLL) fuel meeting ecification and have it tested and 3) review current Certificates of Analysis available in the
munity and assess the actual lead content of current compliant fuels
additive levels Several of the refiners did agree to blend VLL formulas but there was rse over time regarding whether the refiners should take current formulas and just add less
and see what resulted or whether they should adjust the rest of the formula to maintain all of specified properties The activity was further complicated by the length of time necessary to ally blend the fuel and then test it
this was fuel that was currently produced If it had lower than maximum lead it indicated the
presentatives from the FAA Technical Center requesting and collecting CoArsquos from a random lection of Fixed Based Operations (FBOrsquos) In some cases fuel samples were collected from e FBO and specifically analyzed by an independent laboratory In addition to the data collected m FBO fuels the laboratory analyses from the certification fuels used by the engine
cturers and data from the NEG analyses were collected This data was compiled and en analyzed and is the topic of this report
Sample Handling The certificates of aTspreadsheet For those fuels collected from the FBOrsquos the laboratory data sheets were used as the source of the data The data was entered as provided no entries being made where data was not provided The only exception was for the values of MON and lead content as indicated below Each sample also had its refinery identity blinded such that the data could be sorted based on the refinery but so the refinersrsquo identification was not included in the data set
Region Identifier Each refinery listed was given a regional ID by using the US time zones based on the location of the refinery In some cases the location of the refinery was overtly provided In other cases it was inferred based on the primary location of a companyrsquos refinery For example one company had two locations at which they produced aviation gasoline both in the same time zone Thus any sample from this company could reasonably be placed in a time zone Each location was given a number based on the zones as shown in Figure 1 The small numbers of global aviation gasoline samples were just coded as ldquoglobalrdquo
Page 37 of 50 Version 40 Oct 14 2010
(MON) using Table 9 found in ASTM D-2700-09 and produced in
Figure 1 ndash US Time Zones
MON Values from Aviation Lean Ratings Some of the CoArsquos provided the octane performance as aviation lean ratings These were converted to motor octane numbers reFigure 2 The aviation lean rating was found on the table and the equivalent MON read off of the axes Where necessary the value was interpolated An example is shown in Figure 2 for a lean rating of 11228 being converted to a MON of 1042 Note that a MON of 100 is equivalent to a performance number of 1017 A performance number of 100 results in a MON value of 998
123
4
Figure 2 ndash Table 9 from ASTM D‐2700
Page 38 of 50 Version 40 Oct 14 2010
Page 39 of 50 Version 40 Oct 14 2010
For the were converted to a uniform unit of grams milliliters of TEL the conversion factor as lead in gallons these values were co
Other DataIn additio was included as a separate entry These data ed to confirm inter-laboratory
as average values with the
Data were also provided from engine manufacturers from their engine certification trials These d fuels blended specifically as test fuels
analysis
idual fuels that would have met the maximum levels was counted and reported It s meeting specification it was an indication that
with the indicated levels that met specification he larger population within an acceptable level
located in the Annex located at the end of the ction levels the 20 reduction is indicated by a
nge line
is analysis the analyst has only the values as of Analysis from which to perform the analysis The sole purpose of
this analysis was to determine whether there are currently fuels in the distribution network meeting minimum D910 cation with a lower than maximum permitted lead content It is not intended to be an analysis of the cushion in MON The values used in this analysis including MON are as provided For MON the values are either directly repo N or have been converted from values provided as Aviation Number Ratings (lean ratings) to MON The analyst has in good faith assumed the refiner providing the data via a CoA has provided correct data The analyst is not in a position to second guess correct reporting from incorrect reporting With respect to MONperformance number if 108 is assumed to be wrong what about 106 Or 105 Or 102 If part of the data is assumed to be incorrect then all of the data should be assumed to be incorrect
Lead Content
purpose of analysis all of the provided lead contents of lead per liter (gPbL) For lead contents provided as
of 1mL TEL = 10589 g Pb was used For those providednverted to liters 1 US gallon = 3785 liters
Sources n to the data from CoArsquos data from the NEG data
are averaged values from a set of samples usrepeatability of specification testing These data were providedrefinery information purged prior to receipt
data included both generic fuel procured for the test anOnly the actual aviation gasoline data were used for the
Development of Max Lead for Reduction Levels In order to assess the maximum reduction level that might be achieved the maximum lead content for each of three reduction levels was computed The reductions considered were 20 15 and 10 reduction from current maximum lead content permitted by specification This correlated to maximum elemental lead levels of 045 gPbL 048 and 051 For the analysis the
umber of indivnwas assumed that a) because these were fuelindividual refiners could currently produce fuels and b) that the small sample set would replicate t
Analysis For the following evaluations all of the charts are document For charts indicating the lead redupurple line and the 15 reduction indicated by an ora
Caveat on MON data With respect to the MON values reported in thprovided by the Certificates
specifi
rted as MO
Furthermore because the values of MON and rating numbers converge around 100 and 100 ne considered for compliance to specification the conclusions in this report are
by using incorrect MON data around or above 100 The extent of the
on may be warranted within the aviation gasoline producing industry
results of this analysis to make any assessments garding the formulation of aviation gasoline the relationships between lead and MON or the
aluate whether there was any bservable correlation between the supercharge rating the motor octane number and the lead
alues showed observable variations
s indicating the 20 reduction (purple) and the 15 reduction (orange) m TEL level are included on the graph This visually indicates the observation that
t This is not a weighted average atches of fuel is available
ecause it is known that refiners have basically three major building blocks with which to achieve
ount of lead used In some cases the
region of the country at which e fuel was produced the data were separated by regions based on time zones and then sorted
MON is the baseliot significantly impactedn
exceedance of MON to specification minimum is neither the purpose of this effort nor has any impact on the analysis towards the actual purpose a survey of how much lead is being used in currently delivered 100LL Reporting the MON serves only to confirm the fuels did meet specification independent of the amount of lead additive used and the MON data serves no other purpose in this analysis Therefore while discussiregarding the accuracy of the CoA sheets the actual status of the MON values has no substantive impact on the conclusions drawn for this report Readers are discouraged from using the recushion in MON for production
Combined Data The first exercise after completion of the datasets was to evocontent of the fuel Figure 3 ndash Supercharge rating and Motor Octane Number vs Lead content Including Engine Cert Figure 3 ndash Supercharge rating and Motor Octane Number vs Lead content Including Engine Cert contains all of the data from the CoArsquos the NEG data and the engine certification data excluding blended experimental samples This analysis was done to see if there was any indication of a correlation between observable variations in the supercharge rating and the motor octane number with changes in lead content No correlations were observed All of the MON values were reasonably consistent while the leadv In addition to the data line
the maximuinwas mathematically calculated that between 33 and 40 of the samples would meet the 20 reduction in maximum TEL content About 50 of the samples would meet 15 reduction in maximum TEL and 64 would meet 10 reduction in maximum TEL These values remained relatively constant as additional data was included in the dataseas no data on the size of the individual b Bthe desired MON and supercharge rating ie the alkylate the lead and the aromatic content it was desirous to evaluate any relationships between the building blocks No information was available for the alkylate type or quality so the relationship between aromatic content and lead content was evaluated This is shown graphically in Figure 4 Unfortunately few of the datasheets included a value for aromatic content For those samples that did there appeared to
e no correlation between the aromatic content and the amblead and aromatic were relatively higher together as compared to other samples and in other cases samples with high lead had low aromatics This was most likely due to differences in the type of alkylate used No correlation could be drawn from these data By Region
an attempt to determine if there were any trends based on theInth
Page 40 of 50 Version 40 Oct 14 2010
based on these regions The data were again graphed to evaluate lead content versus aromatic content by region excluding the engine certification data Because of the method for procuring the data the majority of the samples that could have a region attributed to them were from region one and two An attempt to identify whether aromatics were used more prevalently in a specific region was also made The data was graphed comparing aromatic content to lead content by region and is shown in Figure 5 Again the analysis was hampered by a lack of aromatic content data Those amples having aromatic content were primarily in data that could not be attributed to a region
he MON vs Lead was graphed and is shown in Figure 6 In general there was just as much
d to a specific region had similar variability in the data The samples attributed to non-US manufacturers ldquoglobalrdquo did have nearly exactly 100 MON values
ng prepared specifically for an ULL test
ould not continue to produce fuel could account for the
20 reduction 47 of the me and a 15 reduction about 53 of the time Further analysis of the use of lead by refinery
wo of the refineries with two and four samples respectively could meet the
sThe three global samples did show higher aromatic content but these were fuel samples blended specifically to be ULL samples Tvariability in both the MON and the lead content in regions one and two Regions three and four had similar sample values however with only two data points no conclusion can be reasonably drawn The data not attribute
but this was due to bei Again no trends in the data by region for either the MON vs Lead or the Aromatics vs Lead were observed with one possible exception There did appear to be slightly higher lead used in region two This however is likely explained by a review of the data by refinery presented in the next section
By Refinery There is a concern that a decision to reduce the maximum lead content may result in single refineries being unable or unwilling to continue to produce aviation gasoline Even if 40 of the refineries sampled are capable of producing spec fuel with lower lead there is a concern that it is
ossible that one of the 60 that wpmajority of the aviation gasoline produced Unfortunately it is beyond the scope of the data and this report to comment on that risk It was possible however to evaluate the currently produced fuel by the refiner of record on the CoA This gives no information on the refinerrsquos abilities to produce fuel of a lower lead content over time but it does give information on the existence of fuel produced by a refiner with lower lead contents at individual points in time There is also no data available on the sizes of the individual batches meaning no assessment of the impact of losing one refinery would have on the overall fuel production levels A review of the aromatic content by refiner shown in Figure 7 again showed too little aromatic data to be of value drawing conclusions However a review of the MON vs Lead data showed graphically in Figure 8 indicates there is a strong correlation in lead content for one of the blinded refineries The refinery indicated by ldquoHrdquo showed the routine use of nearly maximum TEL In only one instance was less than 045gPbL used and that instance correlated to a lower MON content at the same time For the dataset reviewed this refinery accounted for nearly one quarter of the fuel samples considered It is not known if this relationship is comparable to the industry position for the refinery Two of the refineries accounted for just under half of the samples reviewed One was refinery ldquoHrdquo
lready discussed The second was refinery ldquoCrdquo which could meet theatiindicated that t
Page 41 of 50 Version 40 Oct 14 2010
045gPbL limit with all their samples These two refineries only accounted for 8 of the samples reviewed and accounted for only six samples Refinery D with four samples could meet the 15 reduction with all the provided samples The breakdown of the remaining refineries is shown below in Table 1 Refinery Number
Table 1 ndash Refinery versus ability to produce lower lead in spec aviation gasoline
From Engine Certification Fuels
content was 040gPbL which was lightly lower than the general data
In addition to reviewing the fuels as an agglomeration the fuels were also reviewed specific to the dataset provided on the fuels used for engine certifications It was noted that not all of this data included any lead content data however all of the data including the blended test fuels provided MON values or Aviation Lean Rating values that were converted to MON Of the 15 samples provided 9 of them included a lead content This data is provided graphically in Figure 9 The maximum elemental lead content indicated for the engine certification fuels was 060gL which is out of specification high The minimum value indicated was 008gL This may have been a typographical error as it was reported to be 029gPbgal which would have been more in line with other data as 029gPbL As entered the mean leads This dataset like the industry dataset indicated a similar breakdown of approximately 40 being able to meet the 20 reduction 67 meeting the 15 reduction and 67 meeting the 10 reduction
Page 42 of 50 Version 40 Oct 14 2010
Page 43 of 50 Version 40 Oct 14 2010
ased on the review of the provided data five basic conclusions can be drawn
1 Ba n t 13 s cuproduced are l n ctspecification lead levels At a 15 reduction approximately frac12 would meet spec
2 The primary supplier of repre nting 24 of the dreduction of t lead level his supplier met axi adreduction in 11 of the sa
3 There doe ar t be a relation p between r s an co xcthe impact of the single i ry on th r gion da
4 No obvious relationship e drawn based on the le arlack of lead data and no information on alkylates There were instances of high lead with
a Similarly no relationship was found between the lead level and the motor octane number or the supercharge rating
had motor octane values higher than 102 and 60 er than 105
Conclusions B
sed on a agglomeration of the sampbelow the
le dataead conte
about at a 20
of the sampleredu
rrently current maximum ion over
fuel se ataset could not meet a 20 he maximum T the m mum le level at a 15
mples
s not appe o shi egion d lead ntent e luding ref ne e e ta
can b ad and omatics data due to the
high aromatics and low lead with high aromatics
5 Of the samples reviewed over 87were over 103 Only 5 were high
Annex ndash Graphical Representations of the Data
000
010
020
030
040
050
060
070
M ne berotor Octa Num
0
20
40
60
80
100
120
140008
034
036
039
039
041
041
041
041
042
043
044
044
044
045
047
048
048
048
049
050
050
051
052
053
053
053
053
053
054
056
MON and Supercharge
Lead content gL
Motor Octane and upercharg s d
052
S
053
053
e v
053
LeaSuperNumb
c e Performance ehargr
Rating
Lead co t Lnten g Pb
Linear or Octane Number)(Mot
053
060
gPbL
20 reduction from Max TEL (M045 gL)
ax 15 re(Max
duction fro48 gL)
m EL0
Max T
Figure 3 ndash Supercharge rating and Motor Octane Number vs Lead con ng tent Includi Engine Cert
Page 44 of 50 Version 40 Oct 14 2010
000
010
020
030
040
050
060
070
0
2
4
6
8
10
12
14
16
18
20008
034
036
039
039
041
041
041
041
042
043
044
044
044
045
047
048
048
048
049
050
050
051
052
052
053
053
053
053
053
053
053
053
053
054
056
060
Lead
Content gL
Aromatic Content Vol
gPbL
Aromatic Content vs LeadAromatic Content Vol Lead content g PbL
igure 4 ndash Lead Content vs Aromatic Content Including Engine Cert F
MON vs Lead by RegionMotor Octane NumberLead content g PbL
20 Reduction in
Figure 6 ndash Motor Octane Number vs Lead Content by Region for CoArsquos Excluding Engine Cert Fuels
Page 47 of 50 Version 40 Oct 14 2010
000
010
020
030
040
050
060
A C C C C C C C C C C C C C C C C C D D D D D H H H H H H H H H H H H H H H H H H H I L L MMMMP P P P P P P P P P P P P S S S S X X X X X X X X X L L
0
2
4
6
8
10
12
14
16
18
20Lead
Content gL
Blinded Refinery
Aromatic Content
Lead vs Aromatic by Refinery Lead content g PbLAromatic Content Vol
20 reduction from Max TEL
15 reduction from Max TEL
Figure 7 ndash Lead Content vs Aromatic Content by Blinded Refinery Including Engine Cert Data
Page 48 of 50 Version 40 Oct 14 2010
000
010
020
030
040
050
060
070
080
090
100
95
97
99
101
103
105
107
109
A C C C C C C C C C C C C C C C C C D D D D D H H H H H H H H H H H H H H H H H H H I L L MMMMP P P P P P P P P P P P P S S S S X X X X X X X X X L L L
Lead
gL
MON Rating
MON vs Lead by RefineryMotor Octane NumberLead content g PbL
20 reduction from Max TEL
Figure 8 ndash Motor Octane Number vs Lead Content by Refinery Including Engine Cert
Figure 9 ndash Motor Octane Number vs Lead Content Specific to the Engine Certification Fuel
Page 50 of 50 Version 40 Oct 14 2010
INVESTIGATION OF
REDUCED TEL CONTENT
IN COMMERCIAL100LL AVGAS
Summary
Discussion
Background
Sample Handling
Region Identifier
MON Values from Aviation Lean Ratings
Lead Content
Other Data Sources
Development of Max Lead for Reduction Levels
Analysis
Caveat on MON data
Combined Data
By Region
By Refinery
From Engine Certification Fuels
Conclusions
Annex ndash Graphical Representations of the Data
22 ASTM D 910 SPECFICATION ldquoASTM D 910 Standard Specification for Aviation Gasoline and DEF STAN 9190 (British Ministry of Defense) are recognized throughout the world as primary specifications for the production and quality control of AVGASrdquo(1) ASTM D 910 which was first introduced in 1947 currently provides for four different aviation grade gasolines Current aviation grade gasolines are summarized in Table 1 of ASTM D 910 which is repeated below as Table 10 for the purpose of identifying TEL limits and associated octane ratings As shown the maximum allowable TEL content for Grade 100LL is 056 gPbL (053 mLL) which is equivalent to 200 mLgal There is no minimum limit specified for current TEL content Aviation grade 100LL has gradually become the predominant fuel used by the general aviation piston fleet both domestically and globally where the 100LL AVGAS is approved for use on those aircraft and engines originally certified for lower grades 8087 and 9198 For information on international specifications by country of origin for aviation gasoline refer to reference (1)
Table 10 Detailed Requirements for Aviation Gasolines (4)
Extracted from ASTM D 910-04a Specification Grade
80 Grade
91 Grade 100LL
Grade 100
ASTM Test Method
Knock Value lean mixture
Octane Number Min
800
910
995
995
D 2700
Knock Value rich mixture Octane Number Performance No
Min Min
870
980
1300
1300
D 909 D 909
Tetraethyl lead mL TELL gPbL
Max Max
013 014
053 056
053 056
106 112
D 3341 or D 5059
Color red brown blue green D 2392
23 AVGAS HISTORICAL TEL CONTENT Historically the TEL content in aviation gasoline has continued a downward trend from the high levels of 460 mLgal (max) allowed in the early Grade 115145 aviation gasoline to the current 200 mLgal (max) specified for the Grade 100LL AVGAS Grade 100130 which was the predecessor to 100LL had a maximum TEL content of 300 mLgal Grade 100 is listed today as containing a maximum 400 mLgal TEL although Grade 100 is not currently a production fuel As precipitated by a growing environmental awareness in the 1970rsquos Grade 100LL AVGAS was introduced during the 1970rsquos which provided a significant reduction in TEL content and associated lead emissions Grade 100LL AVGAS gradually became the predominant global aviation gasoline for piston powered aircraft Table 20 which is extracted from a 1951 document reference (5) provides further insight into historical aviation gasoline grades and their associated critical properties including TEL content Reference 5 indicates the MIL-F-5572 specification allowed a higher TEL content for the 9196 and 100130 grades than specified in the D910-48T specification Reference (12) provides additional insight and data on the development and characteristics of aviation gasoline
Page 12 of 50 Version 40 Oct 14 2010
460
300 300
400
200 200
0490
05
1
15
2
25
3
35
4
45
5
TEL mLgal
115145 108135 100130 100 100LL 9198 8087
AVGAS GRADE
AVGAS TEL Max Content [mL TELgal]
Figure 10 Historical AVGAS TEL Content Ref ASTM D 910
Table 20 Summary of 1951 Military amp Commercial Aircraft Gasoline Specifications (5)
End point max degF 338 338 338 338 338 338 338 338 338 Lead mlUS gal max 05 46 46 46 05 20 30 30 46 Color Red Blue Green Purple Red Blue Green Brown Purple Freezing Point max degF -76 -76 -76 -76 -76 -76 -76 -76 -76 Octane number lean min 80 91 100 - 80 91 100 - - Performance no lean min (583) (76) 100 115 (583) (76) 100 108 115
Octane no rich min - 96 - - 87 98 - - - Performance no rich min - (875) 130 145 (68) (875) 130 135 145
Heat value Btu per lb min 18700 18700 18700 18700 18700 18700 18700 18800 18800
3 TEL EFFECT ON ENGINE PERFORMANCE The compound tetraethyl lead (TEL) has a powerful effect on engine performance specifically as an anti-knock agent when used as an additive in aviation grade gasoline The fuel octane rating needed to ensure that an engine will operate knock free is considered to be a first order requirement for an aviation spark ignition piston engine fuel Refiners add TEL to meet the octane requirements for AVGAS As documented in reference (11) the CRC Unleaded AVGAS Development Group determined that engine octane requirement is the most demanding and challenging criteria for an unleaded AVGAS Accordingly research into options for unleaded AVGAS and reduced lead content AVGAS has been driven by engine octane requirements
As background considerations for a reduced TEL content AVGAS it is important to recognize those AVGAS components which influence and establish the MON quality of the resulting 100LL product The addition of TEL certainly has a significant impact on knock response and resulting fuel MON quality but the base alkylate and aromatic content are other significant contributing variables Refiners balance these three components (base alkylate aromatics and TEL) to achieve the desired MON rating of the fuel There is a limit to which the effect of reduction in TEL may be offset by adjustment to the aromatic content while maintaining MON performance
The following indicates the significance of the effect of TEL on engine knock performance using both historical data for a typical high output radial engine and recent data generated as part of a CRC-FAA Technical Center research program to evaluate effect of TEL in conventional horizontally opposed high output worst case reciprocating aircraft engine The following provides insight into the sensitivity of engine knock performance to TEL content in the range of 10 ndash 20 mLgal
31 LEAD RESPONSE RADIAL AIRCRAFT ENGINE The effect of TEL on aircraft engine performance has been the subject of extensive research since the early days of aviation Research conducted on radial spark ignition reciprocating engines during the height of radial engine production years probed the ldquolead responserdquo of engine operation using leaded aviation gasoline A number of technical reports in the NACA archives document research results for explorations into leaded aviation gasoline in addition to investigations into other octane and performance enhancing additives
NACA Report No E4I28 was found to include test results described as ldquoLead Responserdquo for a typical radial engine power section The results are included within this report as an indication of effect of TEL on radial engine knock performance The following Figure 20 which is extracted from NACA Report No E4I28 indicates the ldquolead responserdquo for a Pratt amp Whitney R2800 radial engine (based upon single cylinder tests) in terms of knock limited IMEP for fuelair ratios of 0075 and 0100 The test fuel was an S-3 Aviation Reference fuel with TEL content varied from 000 to 600 mLgal (6)
Figure 20 provides an indication of the sensitivity of knock limited IMEP to TEL content for the configuration and test conditions documented in E4I28
Based upon the actual data points within the range of 15-22 mLgal a change of 04 mLgal results in a 49-37 impact on knock limited IMEP for a fuelair ratio of 075 FA The sensitivity may also be expressed as 01 mLgal is equivalent to 12 - 9 impact on knock limited IMEP
Based upon the actual data points within the range of 106 ndash 200 mLgal a change of 04 mLgal results in a 41 impact on knock limited IMEP for a fuelair ratio of 100 FA which indicates sensitivity of 1 change in knock limited IMEP per 01 mLgal TEL
Page 14 of 50 Version 40 Oct 14 2010
Figure 20 further indicates that for the configuration and test conditions documented in E4I28 a change in TEL content from 30 mLgal to 20 mLgal resulted in an impact of approximately 96 on knock limited IMEP
Insp10 to comme show that a distinct irregularity in the susceptability curve exists in the region of 08 to 14 ml tetraethyl lead per gallon It is also
ection of Figure 20 indicates an inflection or shift in the lead response curve in the area of 15 mLgal TEL The NACA researchers noted this observation with the following nt ndash ldquoThe results plotted in figure 18(b)
questionable whether this characteristic would be found under all test conditions and if it should whether this irregularity would always appear at the same tetraethyl-lead concentrations and would be of the same magnituderdquo (6)
R-2800 Engine Single Cylinder Ref NACA E4I28Lead Response C urve L IMEP vs TEL ContentK
160
180
200
220
240
260
280
300
320
340
0 05 1 15 2 25 3 35 4 45 5 55 6
Kno
ck L
imite
d IM
EP lb
sq
in
mL TELgal in S-3 Reference Fuel
Notes1) Data extracted from Figure
18 NACA Report No E4I282) R-2800 Single Cylinder3) KL IMEP = knock limited
32 LEAD RESPONSE CONVENTIONAL AIRCRAFT ENGINE Aviation industry re last 15 years has essentially followed in the footsteps of yesterdayrsquos engine engineers and fuel chemists
atives for reducing and line In consideration of
search into unleaded avgas alternatives during the
however the objectives and focus of research has shifted to alternultimately eliminating lead emissions as associated with aviation gasothe Aviation Stakeholder Grouprsquos near term strategy to pursue a reduction in lead emissions using a ldquodrop inrdquo replacement reduced lead content 100 min grade AVGAS the Aviation Stakeholder Group requested the CRC Unleaded AVGAS Development Group working in conjunction with the FAA Technical Center to investigate and conduct research into options for a reduced TEL content AVGAS In response to the Stakeholder request dual initiatives were launched by the CRC and FAA including full scale engine testing of manufacturerrsquos reduced
Page 15 of 50 Version 40 Oct 14 2010
TEL content AVGAS blends in addition to an effort to assess and identify typical TEL content in 100LL AVGAS consumed by the fleet The CRC VLL Task Group working as a subset of the CRC Unleaded AVGAS Development Group has conducted test and evaluation of reduced TEL content AVGAS samples and has
rovided support and input to the FAA Technical Centerrsquos investigation into TEL production
response to the Stakeholder request the CRC VLL Task Group defined and implemented a d for full scale engine testing of a group of e fuel producers Although the requirement
which was the primary test engine used for prior RC Unleaded AVGAS research projects(11) was also used for the test investigations into the
lead response of the fuels identified in Table 30 The IO-540-K engine is rated at 300 BHP at 2700 RPM and features a 5125 inch bore with 871 CR the engine is six cylinder air-cooled horizontally opposed fuel injected engine and has been determined to be one of the worst case naturally aspirated engines relative to octane requirement(11) The IO-540-K is representative of the large bore six cylinder naturally aspirated engines rated on minimum grade 100LL AVGAS which power a large segment of the general aviation fleet The combination of large cylinder bore high compression ratio and high output are primary design features contributing to the high octane requirement
plevels for commercial FBO AVGAS The following describes the preliminary results of CRC research investigations into full scale engine tests of a group of partially leaded fuels The following data are provided in advance of a formal FAA Technical Center report which will document the full scale engine tests of a group of manufacturerrsquos reduced lead content fuels
33 CRC-FAA AFETF ROUND I VLL TESTS Inresearch program during early 2010 which providereduced TEL content AVGAS blends furnished by thwas that the test blends meet D 910 specification one of the fuel groups consisted of batch of 5 blends which were prepared using a production AVGAS the TEL content was varied from 0 to 64 of max allowable TEL with toluene content maintained at approximately 11 EM1 was a D 910 compliant fuel This latter group of reduced TEL content fuel blends which are summarized in Table 30 offered the opportunity to investigate the lead response of similar fuels with varying TEL content in a full scale engine The 100LL fuel noted in Table 30 represented a baseline FBO AVGAS with TEL content at 943 of D 910 limits See Figures 60 and 70 for test fuel MON and Supercharge Rich trends
A Textron Lycoming model IO-540-K engine
Table 30 (7)
CRC FAA Tech Center VLL Fuels Matrix Round I Tests 2010
ULL Blend
TEL (mLL)
TEL (mLgal)
Max TEL D 910
Toluene (vv)
MON (D2700)
SC Rich (D909)
100LL 050 189 09434 lt05 1039 1315
EM1 034 1287 06415 118 1024 135
EM2 026 098 04906 116 1016 129
EM3 017 064 03208 115 1002 117
EM4 008 030 01509 113 995 107
EM5 000 000 00000 111 944 97
C
Page 16 of 50 Version 40 Oct 14 2010
ull scale e d June 20 the Tec Cent tion F nd E Test F y (AFETF) cated in conducting ixture le cur t po ttings [27 M WO 5 [2 PM] 75 450 RPM 65 50 R Eac six cy s was itored cdications ead concept described in reference (11)
esults of the FAA AFETF detonation tests using the Table 30 fuels are shown graphically in igure 30(7) The diagonal lines which intersect the BHP curves for each power setting indicate e fuel flow corresponding to onset of combustion knock for each of the fuel blends shown he RPM indications correspond to the power settings of 100 85 75 and 65 Although igure 30 illustrates the relative knock performance of the Table 30 fuels it does not establish quantifiable relationship between TEL content and engine knock but rather only indicates ose fuels with higher TEL provide an increasingly positive effect on engine knock
erformance
F ngine detonation testing of the reduced TEL fuels shown in Table 30 was completein 10 at FAA hnical errsquos Avia uels a ngine acilitlo Atlantic City
an outNew Jersey Engine det
ves aonation test
of 100procedure consisted of
00 RP
600 Rm wer se T] 8[2 ] and
of detonatio [23
n as indicatPM]
ed by comh of the
bustion pressure using thlinder mon
e instrumented cylinder ontinuously for
inh RFthTFathp
240
250
260
270
280
290
300
epow
er
150
160
708090100110120130140150160170FUEL FLOW (lbhr)
170
180
190
200
210
220
230
Bra
ke H
ors
2700 RPM
2600 RPMRICH
100LL
EM1
EM2
2450 RPM
2350 RPMEM4
EM3
ULL AVGAS TESTS RESULTSEM1-EM5100LL
IO-540-K Knock On Set
LEAN EM5
Figure 30 Knock Limited Fuel Flow ULL Test Matrix IO-540-K(7)
With the objec
erformance Ftive of quantifying the relationship between TEL content and engine knock igures 40 and 50 are derived from the Figure 30 data by plotting knock limited
s a function of TEL content for lines of constant BHP The resulting data sets provide an indication of the effect of change in TEL content on engine knock performance as manifested by knock limited fuel flow The MON rating for each test fuel is noted for reference since there was a gradual reduction in MON as TEL content was reduced with the drop in MON becoming more aggressive beginning at 030 mLgal TEL as shown in Figure 60 Figure 70 shows the supercharge rich ratings for the Table 30 test fuels where the difference in the rich rating between EM1 and 100LL is likely the result of the difference in toluene content
pfuel flow a
Page 17 of 50 Version 40 Oct 14 2010
CRC VLL Round I Test Results IO-540-KFuel Flow Lbshr Knock On Set
Figure 40
ldquoLead Responserdquo TEL (mLgal) Curve IO-540-K
CRC VLL Round I Test Results IO-540-KFuel Flow Lbshr Knock On Set
Figure 50
ldquoLead Responserdquo TEL (mLL) Curve IO-540-K
Page 18 of 50 Version 40 Oct 14 2010
CRC VLL Round I Test FuelsD 2700 MON Ratings
90
95
100
105
110
0 02 04 06 08 1 12 14 16 18 2 22
MO
N D
270
0 M
ON
Rat
ing
TEL Content - (mLgal)
MON D2700
100LLEM1
EM2EM3
EM4
EM5
Figure 60
D s
2700 MON Ratings CRC VLL Round I Test Fuel
CRC VLL Round I Test FuelsASTM D 909 Supercharge Rich Rating
90
100
110
120
130
140
150
0 02 04 06 08 1 12 14 16 18 2 22
Supe
rcha
rge
Ric
h R
atin
g D
909
TEL Content - (mLgal)
SC RICH D909
EM3
EM4
EM2
EM1100LL
EM5
Figure 70
D 909 Supercharge Ratings CRC VLL Round I Test Fuels
Page 19 of 50 Version 40 Oct 14 2010
34 Figures 40 described
approaches
ock limited
TEL values ranging fro
content for t mented
CONCLUSIONS ROUND I VLL TESTS and 50 indicate the ldquolead responserdquo for the IO-540-K test engine using the fuels
in Table 30 The data indicates the ldquolead responserdquo in terms of knock limited fuel flow for TEL content in the 150 to 200 mLgal range is linear There is a ldquokneerdquo in the curvearound 060 mLgal below which the ldquolead responserdquo becomes non-linear as the TEL content
zero
The utility of Figures 40 and 50 is that they indicate the relative change in engine knfuel flow as a function of TEL content in the 150 ndash 20 mLgal range of interest and beyondwhich provides for correlation with the fleet service experience with AVGAS at
m 122 ndash 200 mLgal as discussed in Section 5 of this report
Figures 40 and 50 provide an indication of the sensitivity of knock limited fuel flow to TELhe conventional IO-540-K engine configuration and test conditions docu
ge of wn in
Assuming a linear response in the 13 ndash 20 mLgal range the data indicate a chan04 mLgal results in a 49 impact on knock limited fuel flow for the BHP shoFigures 40 and 50
Alternately a change of 05 mLgal results in a 6 impact on knock limited fuel flow for the BHP shown in Figures 40 and 50
A change in TEL content from 200 mLgal to 122 mLgal (39 reduction) is equivalent to a 94 chan d 50 ge in knock limited fuel flow reference Figures 40 an
ay be ote
d in
he size of the general avia
piston powe total ion
comprising 453 aircraft which is estdefined as he General Aviation Ma
Piston powe
arrangements manufactured by original eq nufacturers (OEM) Teledyne Continental Motors and Textro CAR 13 Civil Air Regulations or 14 CFR 33 Federal Aviation regulations
Many older GA engine models are approved to operate with a minimum grade 8087 AVGAS but are also approved to operate with the more readily available higher grade 100LL AVGAS A
Based upon Figures 40 and 50 the sensitivity of engine knock to TEL content mexpressed as 01 mLgal is equivalent to 12 impact on knock limited fuel flow Nthat this is in agreement with the radial engine lead response at 075 FA discusseSection 31 Although the metrics are expressed in different terms knock limited IMEP for a radial engine and knock limited fuel flow for a conventional engine they arecomplementary and indicate the relative change in knock on-set as a function of TEL
4 GENERAL AVIATION PISTON POWERED FLEET Of interest relative to the use of 100LL AVGAS and the associated TEL content is t
tion piston powered fleet which requires use of a minimum grade 100LL AVGASBased upon the results of a recent study which researched the FAA Registry for registered
red aircraft and the associated FAA TCDS for a listing of approved fuels theUS GA fleet in 2010 consists of 228078 aircraft with the piston powered fleet port
83 of the total(8) The US piston fleet in YR2010 consists of 189imated to be 60 - 70 of the total worldwide piston fleet General Aviation is all aviation other than military and commercial airlines according to tnufacturers Association(11)
red GA aircraft (less than 12000 lbs gross weight) are almost exclusively poweredby horizontally opposed spark ignition reciprocating engines configured in 4 6 and 8 cylinder
uipment man Lycoming as FAA approved products conforming to either
Page 20 of 50 Version 40 Oct 14 2010
small percentage of the fleet is approved to operawith a few aircraft listing 9198 as the approved fu
te on an older minimum grade 9196 AVGAS el GA engine models produced since the mid
GA engines are both naturally aspirated and turbocharged with ratings from
1970rsquos are mostly high output high performance high compression ratio (85 ndash 87CR) engines which require a minimum grade 100LL AVGAS for adequate knock protection The minimum grade fuel approved for operation with an aircraftengine is specified in the engine FAA TCDS the aircraft FAA TCDS and the aircraft POH (Pilot Operating Handbook)
he FAA approved T100 BHP to in excess of 400 BHP Fuels approved for operation in GA engines are specified in the FAA approved OEM continuous airworthiness data and the associated FAA TCDS (type certificate data sheet which may be accessed at httprglfaagov) The approved fuel is typically specified in the FAA TCDS as aviation gasoline conforming to ASTM D 910 pecification either minimum grade 8087 9196 9198 100LL or 10013s 0 FAA certification of
41A stud ssioned by the FAA Technical Centerrsquos Aviation Fuels and Engine Test Facility (AFETF) to quantify the piston powered fleet composition based upon the approved minwhich are based upon data contained in the FAA Registry and the FAA TCDS establish a baseline data base for the active piston powered aircraft by make and model along with a listing of t Based upon the results of this study reference (8) 433 of the GA fleet requires a minimum Gragasolinof the accounthe gen80 87 er grade 100LL Engine manufacturer service bulletins specify that engines are approved to
perate with the next higher grade AVGAS but are not approved to operate with a lower grade e eligible for operation with 100LL oved for use with an unleaded min
each engine model required that adequate detonation (knock) margins be demonstrated by test using a certified fuel of minimum quality while operating at worst case conditions for knock
FLEET APPROVED MINIMUM GRADE FUEL y was recently commi
imum grade fuel as listed in the FAA TCDS for each aircraft(8) The results of this study
he approved minimum grade fuel
de 100LL AVGAS and is therefore dependent upon the leaded aviation grade 100LL e for both performance and knock protection Industry specialists believe it is this 433 fleet representing later model aircraft used for business and utility purposes which ts for the majority of the general aviation flight time Although there is a large segment of eral aviation fleet (84429 aircraft representing 446 of fleet) rated on minimum grade
90 or 91 AVGAS this group of aircraft is also approved to operate with the next high
oTherefore 166492 aircraft representing 879 of the fleet arAVGAS FAA TCDS data show 04 of the aircraft are apprgrade 9196 In the absence of a domestic min Grade 91 production AVGAS and minimal availability of min Grade 80 AVGAS min Grade 100LL is the predominantly available AVGAS today A 9196UL AVGAS is available within Europe
Page 21 of 50 Version 40 Oct 14 2010
Table 40 (8)
General Aviation Fleet Approved Min Fuel Grade Based Upon FAA Registry amp TCDS
Fuel Grade Number of Aircraft
Percent of 189453 Aircraft
100LL Minimum 82063 433
80 Minimum 69402 366
Other Fuel 17508 92
91 Minimum 13387 71
Unknown 5306 28
Unleaded 9196 825 04
87 Minimum 802 04
Jet A 147 01
90 Minimum 13 00068
Total Aircraft 189453 100 Notes
Minimum fuel grades extracted from FAA TCDS for aircraft Category ldquoother fuelrdquo includes TCDS fuel designations of 65
70 73 108135 amp 115145
wing describes the results of the FAA echnical Centerrsquos survey to quantity FBO AVGAS TEL levels as dispensed to the fleet
1 OBJECTIVES STM D 910 specifies a maximum content for TEL in 100LL AVGAS but no minimum With the cognition that there are normal production variances in TEL content of AVGAS as the result of
rocess variables including basic alkylate and refining process the FAA Technical Centerrsquos FETF commissioned a study to investigate the actual variation of TEL content in 100LL VGAS The primary objective of this study was to quantify the normal variances in TEL ontent as encountered by the fleet at the FBO level with a secondary objective of documenting
s in TEL content The purpose of this study was to develop
5 SURVEY 100LL AVGAS TEL CONTENT Whereas 100LL AVGAS is the predominantly available aviation gasoline today and in consideration of the AVGAS Stakeholder Grouprsquos near term strategy to pursue a reduction in lead emissions using a ldquodrop inrdquo replacement reduced lead content 100 min grade AVGAS the AVGAS Stakeholder Group requested the CRC Unleaded AVGAS Development Group working in conjunction with the FAA Technical Center to explore options and viability for a reduced TEL content 100 min grade AVGAS In response to the Stakeholder request dual VLL initiatives were launched by the CRC and FAA including full scale engine testing of manufacturerrsquos reduced TEL content AVGAS in addition to an effort to assess and identify typical TEL content in 100LL AVGAS consumed by the fleet The folloT
5ArepAAcfleet operating exposure to variance
Page 22 of 50 Version 40 Oct 14 2010
a data base that would support and contribute to the industryrsquos study of options for reducing lead emissions Prior to this study there o no information available in a summary format which document vered to the fleet
52 METHODS The production and quality control processes for aviation gasoline require the documentation of critical fuel properties b at bot finery leve delivered by the fuel distributer to the FBO (Fixed Base Operator) Each batch of fuel is panied by a certificate of analysis which identifies nce o erties g TEL content MON SC rating density vapor pressure net heat of combustion and distillation properties in accordance with the applicable ASTM specification Accordingly the 100LL AVGAS delivered to the FBO infrastructure is ted by tificates of analysis (CofA)
Additional data on analysis of fuel properties is available through the ASTM NEG (National Exchange Group) wherein AVGAS samples are shared among various test laboratories for documentation of critic part of a s check of r bility The NEG data furnished for the purpose y was e format of average values and did not associate properties with a specific refinery The FAA Technical Centerrsquos field TEL study focused on generating a data base of TEL co using certific f analysis obtained at random from the FBO infrastructure The resulting data base also included TEL data provided by one major fuel produce years o oduction C of analysis for fuel samples collected by the F cted to by an inde included in the data base int wa rdquo for the pu f confidentiality
In recognition tha ates of analysis for 100LL AVGAS us conducted at the engine manufactu in FAA certification tests The resulti ed the FBO certificates of analysis Data from the
ngine manufacturers was also ldquoblindedrdquo for confidentiality
was limited ted normal TEL variances in 100LL AVGAS as deli
y laboratory test h the re l and as accom
includin the conforma f critical prop
well documen the cer
al properties as cros epeataof this surve in th
ntent ates o
r for several f pr ertificatesAA and subjeEach data po
analysiss ldquoblinded
pendent laboratory were alsorpose o
t the OEM engine manufacturers obtain and file certificed in official FAA certification testing a search was alsorers for documentation of 100LL AVGAS properties used ng data points complement
e
SURVEY DATA CAVEAT Survey data consisting of CofA NEG data and engine manufacturerrsquos reports were used without change or prejudice CofA are accepted by the industry as a certificate of validation Further investigation or verification of the accuracy of the reported data was determined to be outside the scope of the researcherrsquos authority It is noted that several data points indicated MON values higher than normal Although MON is of interest the primary objective of this survey was to explore and investigate TEL trends in production AVGAS
Page 23 of 50 Version 40 Oct 14 2010
53 RESULTS The resulting survey data consisting of certificates of analysis documentation furnished by the original engine manufacturers NEG data and refinery data were compiled and furnished by the FAA Technical Center to an independent consulting firm for review analysis and compilation in
summary report That report is included as Appendix A to this report (9) While the presented it was observed that the addition of data (from 55 to 89) had little impact on values of TEL The summary of findings is extracted from Reference (9) and
asample set is smallthe max and mean repeated as follows The reader is referred to Appendix A for a detail accounting of the survey data and associated analysis
(may indicate typographical error in original source report)
MON ratings
o Max = 1076
o Mean = 1038
o Min = 1011
Tetraethyl Lead content
o Max = 060 gPbL (107 of D 910 limit)
Page 24 of 50 Version 40 Oct 14 2010
Figure 100(9)
Segregation of Fuel Samples by TEL Reduction
39 of the fuel samples described by CofA and industry laboratory reports could meet a 20 reduction in TEL
51 of the fuel samples described by CofA and industry laboratory reports could meet a 15 reduction in TEL
64 of the fuel samples described by CofA and industry
laboratory reports could meet a 10 reduction in TEL
44 of the fuels u ertification could meet a 20 reduct
L
sed for FAA c
ion in TEL
67 of the fuels used for FAA certification could meet a 15 reduction in TE
6 GA FLEET 100LL SERVICE EXPERIENCE
he surve tion 100LL AVGAS as distributed to the fleet rough the general aviation iston powered fleet has
een exposed to service e a low of 61 of max mean of 8 g MON and other D 910
pecification properties As dditive TEL is effective as knock suppressant in AVG there is a corresponding pact on engine knock response A threshold of TEL reduction is ultimately reached where el octane quality is sufficiently degraded to the extent that engine knock margins are
egraded The latter is not the case with the current fleet as indicated by a study of related fleet ervice experience which indicates a neglible incident rate of knock with no indications of fuel lated incidents The successful service experience with varying levels of TEL speaks highly of e margins or
xperience has sh s usually manifested in burned pistons eroded iston domes or e holes in pistons with a resulting loss in engine power and a oticeable change in engine vibration With the objective of evaluating fleet service experience ased upon the premise that the fleet has been subjected to operation on 100LL AVGAS with EL content as low as 61 llowable TEL FAA Service Difficulty Reports (SDR) ave been reviewed for i tonation incidents as might be indicated by reports of urned pistons eroded pistons bu signs of detonationrdquo with the results
ummarized as fol
1 FAA SERVICE DIFhe FAA maintains a data viation products which may e accessed at http
Results of tth
y of TEL content in produc FBO network indicate that the domestic pxperience with TEL content varying fromb
allowable TEL to a s
4 of max allowable TEL while still meetindiscussed in Section 3 of this report the a
AS As the content of TEL is reducedaimfudsreth
iginally designed into the general aviation products
E own that the effect of knock ipn
dges or burned
bT - 84 of max ah ndications of de
rned hole in pistonldquobs lows
6 FICULTY DATA BASE T base for reports of service difficulties for ab av-infofaagovsdrx A reformatted version of the
d to list only general aviation related reports less air FAA SDR data base
hich is restructure carriers commuters nd military may be accessed at wwwlandingscom_landingspagessearchsearch_sdrhtml
wa
here SDR data is retrieved from the FAA ftp server on a weekly basis The FAA SDR data ase does not contain all reports of aviation difficulties but rather only those which are
wb
Page 25 of 50 Version 40 Oct 14 2010
voluntarily submitted to the FAA where each is based upon the submitterrsquos assessment of the ervice difficulty However the FAA SDR s provide useful information providing sight into specific ser ported difficulties rovide an indic tion of relative incident rates as compared to other difficulty categories or the
f all reports f ircraft models r engine models iation contains 500000 entries 1975
sin
data base doevice difficulties when viewed in the context that the re
p aaggregate oo
or a specified aircraft model engine model or groups of a The entire FAA SDR data base reflecting all elements of av
to present ref 1 httpwwwaviationdbcom
62 SDR REPOR
search of the FAA S ed for reports of etonation incident raft series hich represent t nce high ompression ratio engi aspirated and turbocharged Rather than searching all mall aircraft manu ral aviation ircraft models which a 5 aircraft or 817 of the total FAA registry of piston owered aircraft The search was facilitated by searching under the FAA JASC code ldquo8530rdquo(10)
nd key word ldquopistonrdquo FAA JASC code 8530 is defined as ldquoFor reports of engine cylinders and ssociated partshelliptypical parts are piston piston pin exhaust valve intake valve valve guide
s of the SDR data search are r each of the 31 ldquoburned pistonrdquo listings is
TS DETONATION INCIDENTS DR data base for the general aviation fleet was performA
d s by searching for reports of piston difficulties for the following airche manufacturers of those aircraft powered by high performa
nes both naturally wcs facturers the search targeted the following representative gene
ccount for 15482apaarocker arm valve cover cylinder pushrodhelliprdquo Resultsummarized as follows A copy of the SDR report foon file and available upon request The SDR reports surveyed covered a time period of 17 years 1993 to present
Table 50 FAA SDR Reports for Burned Pistons (10)
Representative Manufacturers ndash General Aviation Fleet FAA SDR Reports Aircraft
It is concluded based upon the review of SDR reports for detonation incidents for the fleet portion indicated that the occurrence of detonation in the fleet is rare with the total number of detonation incidents at 002 of the fleet surveyed None of the SDR reports corresponding to the above 31 reports of ldquoburned pistonsrdquo indicated fuel was a factor For some of the 31 reports it was not totally certain that detonation was the contributing event for the majority of the reports the cause of detonation was not identified Likely causes of detonation incidents include mis-adjusted ignition timing magneto failures blocked fuel injector nozzle and operation at high
ower with lean mixture Those reports which indicated structural failure of the piston rather an thermal failure were not included in the 31 reports which contained failure descriptions
ed hole in piston signs of detonationrdquo
pthconsistent with ldquoburned pistons eroded pistons burnPiston structural failures typically have unique signatures which are distinctly different from a detonation induced event which results in excessive piston temperature The engine models listed in the 31 reports are summarized in Table 60 relative to model designation and configuration - naturally aspirated turbocharged carbureted fuel injected compression ratio and approved min grade fuel Turbocharged engines represented 48 of the engines identified as possibly having encountered a detonation event No conclusions are drawn based upon engine models andor turbocharged versus naturally aspirated On the contrary the documented detonation events appear to be evenly distributed across the naturally aspirated and turbocharged models however the naturally aspirated fleet represents a larger population than turbocharged models
Table 60 (10)
Engine Models Listed in FAA SDR Reports of Bu Detonation rned Piston
Engine Model
Configuration Compression Ratio
Min Grade AVGAS
O-2 85 1035-L2 ) C (4ea NA Carb 0100LL
O-320-D2J NA Carb 85 9196
3G NA CaO-320-D rb 85 9196
O-470-R NA Carb 70 8087
IO-360-C1C NA FI 87 100100LL IO-360-G NA FI 85 100100LL IO-470-L (2) NA FI 86 100100LL
CB NAIO-520- FI 85 100100LL IO-520-D NA FI 85 100100LL IO-520-F NA FI 85 100100LL IO-540-K1J5 NA FI 87 100100LL IO-540-S1A5 NA FI 87 100100LL GTSIO-520-L Turbo FI 75 100100LL GTSIO-520-M Turbo FI 75 100100LL
100100LL GTSIO-520-N (2ea) Turbo FI 75
75 100100LL LTSIO-360-E Turbo FI
75 100100LL TSIO-360-KB Turbo FI
Page 27 of 50 Version 40 Oct 14 2010
TSIO-520-(Unkn) Turbo FI 75 100100LL
TSIO-520-NB (2ea) Turbo FI 75 100100LL TSIO-520-R (2ea) Turbo FI 75 100100LL TSIO-520-VB Turbo FI 75 100100LL
TSIO-520-WB Turbo FI 75 100100LL TIO-540-J2BD (2) Turbo FI 73 100100LL Notes
1) NA = naturally aspirated Turbo = turbocharged Carb = carbureted FI = fuel injected
7 CONCLUSIONS The purpose of the CRC research documented within this report was not to specify or recommend a specific reduced TEL level for AVGAS but rather to conduct research and investigations with the objective of generating technical data which would enable and facilitate the industryrsquos decision process for a reduced TEL AVGAS The results of the tests and investigations documented within this report fulfill this objective Significant findings and
bservations are summarized as follows
71 TEST RESULTS ENGINFigures 40 and 50 provide an indication of the sensitivit content for the conve -540-K g e t ns documented The following observations and conclusions are based the 15 gal TEL range of interest unless n
o
E LEAD RESPONSE y of knock limited fuel flow to TEL
uration and thupon
n IOtional engine confi est conditio 20 mL ndash
oted otherwise
Test res s a change Lgal (2 eduction ) results in a 49 impact on knock limited fuel flow
ults indicate of 04 m
0 r in TEL
Alternately a change of 05 mLgal (25 reduction in TEL) knock limited fuel flow
results in a 6 impact on
A chang ntent from Lgal to 1 mLgal ction in TEL) is equivalent to a 94 change in knock limited fuel flow Note that the survey results indicate minimum field FBO fuel ntent was umente 122 mLgal
e in TEL co 200 m 22 (39 redu
TEL co doc d as being
The sensitivity mLgal is equivalent to 12 impact on knock limited fuel flow over the 15 ndash 20 mLgal range of inter
may also be expressed as 01 est
Analysis conventio ine lead response is nt with the radial engine l of 10 -12 ge in kno mited IM 1 mLgal TEL as discussed in Section 31 Altho nock metrics are expressed in different terms knock lim radial en knock limited fuel flow for conventional engine these indice ementary a function
indicates theead response
nal eng chan
in agreemeEP per 0ck li
ugh the kited IMEP for
s are complgine and
nd indicate the relative change in knock on-set as a of TEL
Page 28 of 50 Version 40 Oct 14 2010
72 SURVEY R 00LL Figures 80 through 100 present a summary of the findings and observations documented within the Appe nifica and ob tions a ized as follows
ESULTS FBO 1 AVGAS
ndix A report Sig nt findings serva re summar
Survey r content i GAS (8 ta poinTEL content in AVGAS is 84 L allowe ASTM d upon the data examine
esults of TEL n FBO AV 9 da ts) indicate mean (average) of max TE d by D 910 base
d
Survey r tent i GAS in te the fleet has service experience with TEL content as low as 61 of the max TEL allowed by ASTM D 910 for fuels of 1016 MON
esults of TEL con n FBO AV dica
or higher
Mean MON for FBO AVGAS was observed to be 1037 MON with minimum MON documented at 1016 MON The maximum MON for AVGAS as indicated by the CofA data was 108 MON
Examination of engine manufacturer certification data (23 data points) indicates 100LL AVGAS used for official FAA engine certification testing had TEL content varying from minimum of 14 of max allowable to a mean of 71 of max allowed Associated minimum MON was 1011 with mean MON being 1038 The maximum MON for the 15 certification data samples was 1076 MON (Note that 14 may indicate a typographical error in the original source data)
39 of the fuel samples described by CofA and industry laboratory reports could meet a 20 reduction in TEL
51 of the fuel samples described by CofA a15 reduction in TEL
nd industry laboratory reports could meet a
64 of the fuel samples described by CofA and industry laboratory reports could meet a 10 reduction in TEL
44 of the fuels used for FAA certification could meet a 20 reduction in TEL
67 of the fuels used for FAA certification could meet a 15 reduction in TEL
73 FLEET SERVICE EXPERIENCE Withhas be n on 100LL AVGAS with TEL content as low as 61 - 84 of maDiffindicatedetona
the objective of evaluating fleet service experience based upon the premise that the fleet en subjected to operatio
ximum allowable TEL as documented by the Appendix A survey results FAA Service iculty Reports (SDR) were reviewed for indications of detonation incidents as might be
d by reports of ldquoburned pistons eroded pistons burned hole in piston signs of tionrdquo Significant findings and observations are summarized as follows
It is concluded based upon the review of FAA SDR reports for detonation incidents that the occurrence of detonation in the fleet is rare with the total number of detonation incidents at 002 of the fleet surveyed None of the SDR reports indicated fuel was a factor Qualifications regarding SDR reports are discussed in Section 61
r speaks highly of the margins originally designed into the general aviation powerplants in consideration that service experience indicates knock is a rare occurrence within the fleet
Analysis of survey results and engine lead response data indicates the fleet service experience with TEL content at 61 - 84 of max allowable TEL is equivalent to a 94 -38 variance in engine knock margin respectively from the baseline 20 mLgal TEL level The latte
Page 29 of 50 Version 40 Oct 14 2010
8 RECOMMENDATIONS The test results and findings documented within this report indicate the general aviation fleet hasAVGlead codocumented within this report Althtechnicthe aviation industry which are outside the jurisdiction of CRC research In tthe gemainte rovided with the necessary informational training
9 RE
f D02J02
GAS Coalition Briefing EAA AirVenture 2010 July 27 2010
ffects on Engine Performance NAVAER 06-5-501 USAF TO
I28 ldquoExperimental Studies of the Knock-Limited Blending d
inson
(8) Herbert W Schlickenmaier Crown Consulting Inc ldquoAviation Fuels Research Fleet Database 10 (prepared by Crown Consulting Inc under Purchase Order artin NISC II Bridge Contract DTFAWA-08-C-00009 with the
successful service experience with a TEL content of 122 ndash 200 mL TELgal (100LL AS) having a MON of 1016 or greater Technical considerations for specifying a maximum
ntent less than 200 mLgal should obviously be guided by the fleet service experience
ough a reduced TEL content within the range of experience documented within this report is ally feasible there are other non-technical considerations which must be addressed by
he advent of implementation of a reduced TEL AVGAS it is recommended that the FAA and neral aviation industry give consideration to ensuring aircraft owners pilots and nance personnel are p
FERENCES
(1) The History Specification Production Use and Evaluation of Unleaded Aviation Gasoline Report by the D 910 Task Force o
(2) Letter AVGAS Stakeholder Group to EPA dated June 10 2010
(3) Presentation GA AV
(4) ASTM D 910 ldquoStandard Specification for Aviation Gasolinesrdquo
(5) Aviation Fuels and Their ENo 06-5-4 dated 1951 by Ethyl Corporation
(6) NACA Report No E4Characteristics of Aviation Fuelsrdquo N D Sanders R V Hensley R Breitwieser dateOctober 1944
(7) FAA Technical Center Test Results Email dated July 25 2010 D Atwood to R Wilk
Reportrdquo dated October 13 207200006107 from Lockheed MFederal Aviation Administration)
(9) Melanie Thom Baere Aerospace Consulting Inc ldquoReview of Certificates of Analysis and Test Data of Aviation Gasoline for Current Ranges of Lead Additiverdquo dated Sept 9 2010 (prepared for Crown Consulting Inc under Purchase Order 7200006107 from Lockheed Martin NISC II Bridge Contract DTFAWA-08-C-00009 with the Federal Aviation Administration)
(10) FAA Flight Standards Service Aviation Data Systems Branch AFS-620 ldquoFederal Aviation Administration Joint Aircraft SystemComponent Code Table and Definitionsrdquo October 27 2008
(11) CRC Report AV-7-07 ldquoResearch Results Unleaded High Octane Aviation Gasolinerdquo June 17 2010
(12) Alisdair Q Clark BSc PhD ldquoAviation Gasoline History and Futurerdquo IASH 2007 October 2007
Page 30 of 50 Version 40 Oct 14 2010
izations specialized consulting firms the FAA and the CRC
nd Engine Test acility was crucial to the outcome Most importantly it was the foresight of the FAA AFETF
oject to survey FBO AVGAS with the goal of better understanding the mercial AVGAS
Lastly Developme report on their behalf
10 ACKNOWLEDGEMENTS The information contained within this report reflects the participation and commitment of industry specialists representing a broad segment of general aviation including fuel producers test laboratories FBO fuel distributors aviation engine and aircraft manufacturers aviation trade organizations fuel trade organexecutive office The successful completion of the survey of AVGAS properties followed by the compilation and analysis of survey data as complemented by engine testing to investigate engine lead response were made possible in no small part by the actions of those committed to the future of general aviation
The leadership and guidance provided by the Aviation Stakeholders was instrumental in establishing goals and objectives Typical of previous CRC aviation gasoline research projects the participation and contribution of the FAA Technical Centerrsquos Aviation Fuels aFwhich launched the prariance of TEL in comv
the author would like to express his humble appreciation to the CRC Unleaded AVGASnt Group for the opportunity to compile this
- END OF TEXT ndash
Page 31 of 50 Version 40 Oct 14 2010
Page 32 of 50 Version 40 Oct 14 2010
APPENDIX A
ldquoREVIEW OF CERTIFICA OF ANALYSIS AND TEST DATA OF AVIATION GASOLINE FOR CURRENT RANGES OF LEAD ADDITIVErdquo
VER 60 DATED S 9 2010
TES
EPTEMBER
REVIEW OF CERTIFICATES OF ANALYSIS AND TEST DATA OF AVIATION GASOLINE FOR CURRENT RANGES OF LEAD ADDITIVE AssesCurre In an attemptaviation gasoadded to current aviation gasoline This endeavor was to evaluate on a very small sample sASTM D-910 lower lead containing fuels This was done y reviewing the Certificates of Analysis procured for contemporary loads of aviation fuels from a variety of FBOrsquos and test labs as well as fuels used by engine manufacturers for engine certification The result was a sample set of 89 individual data points which were reviewed for the lead content all conver grams of lead per liter of fuel The samples were also segregated by gions using time zones of the manufacturer location and by refinery (blinded for this report) in an attempt to identify if any relationships of lead usage by region or by refiner This report used the data as provided by the manufacturers whose sole responsibility it is to the correctness of the data No assessment of the MON ldquocushionrdquo or evaluation of formulation should be made from this data
sing the Viability of Lowering Lead Levels in nt A iation Gasoline Production v
to demonstrate a commitment to the global community by the line user community it is desirou to reduce the amount of lead s
et the current lead additive levels in fuels currently meeting the specification to assess the industryrsquos current ability to produce
b
ted tore
Prepared by Melanie Thom 992010 Report Prepared for Crown Consulting
Page 33 of 50 Version 40 Oct 14 2010
REVIEW OF CERTIFICATES OF AND TEST DATA OF AVIATION GASOLINE
OR CURRENT RANGES OF LEAD ADDITIVE Aviation Gasoline
rrsquos reports was used t change or prejudi CoArsquos are accepted e industry as a certificate of validation
determined to be veral data points indicated MON
ctive of this survey was
garding the relationship between formulas MON cushion or how the he MON values can be made This analysis should only be used to uels currently meeting ASTM D910 with less than maximum allowable
d content Furthermore the production of VLL 100 requires more than just the reduction in to produce a lower lead ignificant research and
ulations that still meet all the specification uirements
While this is ve of the East resentative of
ions was also ch 21 had a
6 were blends sis This data
3 After reviewing the data it was determined that approximately 39 of the fuel described by the Certificates of Analysis (COA) and industry laboratory reports could meet a 20 reduction in the TEL additive 51 could meet a 15 reduction in TEL and 64 could meet a 10 reduction in TEL as indicated by current production lots
tion fuels with lead contents indicated 44 could meet the 20 reduction and 67 could meet the 15 reduction This is in line with the fielded data
NALYSIS
A
FAssessing the Viability of Lowering Lead Levels in Current
roduction
OTE Survey data consisting of CoA NEG data and engine manufactureithou ce by thurther investigation or verification of the accuracy of the reported data was tside the scope of the researcherrsquos authority It is noted that selues higher than normal Although MON is of interest the primary obje explore and investigate TEL trends in production AvGas
s such no conclusions read reduction will affect t
luate the existence of f
P
NwFouvato Aleeva
alelead The data in this report is only demonstration of the ability of refiners
el not an analysis of how to produce fuel with lower lead Svelopment will be required by refiners to develop form
fudere
q
S
ummary
1 The sample set excluding the ULL study included 89 individual data pointsa small sample set analysis of this data suggests that it is representatiCoast and Midwest There are no obvious indications that it is not repCentral and West Coasts
2 An additional set of Certificates for fuel used during engine certificatsupplied and reviewed This data set included 23 individual entries for whimotor octane value entry and 9 had a lead content Of the 23 samplesprepared from 100LL and iso-octane and were not included in the analywas analyzed separate from the field sample entries
o Of the nine certifica
Page 34 of 50 Version 40 Oct 14 2010
4 Sixteen (16) of the data was from the National Exchange Group (NEG) database and all location and refinery information was previously purged for these samples
5 When separated by refineries 25 of the fuel in the sample set was provided by a single refinery H Another 224 was provided by refinery C When the fuels from the individual refineries were analyzed it was determined that refinery H only produced 5that contained less than 20 TEL additive (1 of 19 samples) At a reduction of 15 and
uction (same of the
10 only 11 of the prod would be in spec 2 fuels 19) This is far
versa This is likely due to the influence of the third component the base alkylate for
o A question was raised that 108 as an MON seemed unlikely With this data point removed the mean was still 1037 and the new maximum was 1076
tent was 040gL and the median was 043 The maximum
10
11 d had a reported MON of greater than 102 sixty percent had an MON greater than 103 and thirty-two percent were
This res search Program at the William J Hughes Technical Center in Atlantic City New Jersey by Baere Aerospace Consulting IMartin NISC B
below the group percentages and indicates that this refinery would likely be unable to meet a lead reduction with current production
6 A review of the data by region and by refinery showed no relationship with the amounts of lead used with the exception of refinery H
7 While there was limited aromatic information available there did not appear to be any relationship between the amount of lead used and the amount of aromatics used Said another way there did not appear to be high lead required with low aromatics or vice
which there is no information
8 The mean MON value was 1037 The maximum was 108 and the minimum excluding a sample set made for the ULL study was 1016
o Of the 15 certification fuel samples the mean MON value was 1038 The maximum value was 1076 and the minimum was1011
9 The mean elemental lead content was 047gL and the median was 048gL The maximum was 056gL and the minimum excluding the ULL study set was 034 gL
o Of the 15 certification samples excluding the blended test samples the mean elemental lead conlead content was 060 gL and the minimum was 008gL
The mean elemental lead content of all analyzed samples excluding blend samples was 046gL This value is 82 of the maximum lead level permitted (046 056)
Eighty-seven percent (87) of the samples reviewe
greater than 104 Only five percent were higher than 105
earch was funded by the Federal Aviation Administrations Fuels Re
nc for Crown Consulting Inc under Purchase Order 7200006107 from Lockheed II ridge Contract DTFAWA-08-C-00009 with the Federal Aviation Administration
Page 35 of 50 Version 40 Oct 14 2010
ConteSummar
Discussio
Backg
Sa
Reg 37
Lead
Oth
Develo ion Levels 39
Analysis
Combined Data 40
By Region
By Refinery
From Engine C 42
Conc
Annex ndash 44
Figure 1 ndash US TiFigure 2 ndash Table 38 Figu 44 Figure 4 ndash Lead Content vs Aromatic Content Including Engine Cert 45 FiguFigure 6Fuels 47 igure 7 ndash Lead Content vs Aromatic Content by Blinded Refinery Including Engine Cert Data 48
nts y 34
n 37
round 37
mple Handling 37
ion Identifier
MON Values from Aviation Lean Ratings 38
Content 39
er Data Sources 39
pment of Max Lead for Reduct
39
40
401
ertification Fuels
lusions 43
Graphical Representations of the Data
me Zones 38 9 from ASTM D‐2700
re 3 ndash Supercharge rating vs Motor Octane Number vs Lead content Including Engine Cert
re 5 ndash Lead Content vs Aromatic Content by Region for CoArsquos Excluding Engine Cert Fuels46 ndash Motor Octane Number vs Lead Content by Region for CoArsquos Excluding Engine Cert
FFigure 8 ndash Motor Octane Number vs Lead Content by Refinery Including Engine Cert 49 Figure 9 ndash Motor Octane Number vs Lead Content Specific to the Engine Certification Fuel 50
Page 36 of 50 Version 40 Oct 14 2010
Discussion
Background
PA issued an advanced notice of proposed rulemaking and requested input on data
reducing the amount of lead used in current compliant fuel formulations was considered as a
opadspaviation com The refiners seemed uncomfortable providing an assessment of their formulas and their current leaddiscouleadthe actu The third activity was a review of the CoArsquos for currently supplied fuel The hypothesis was that
ability to produce fuel with lower than maximum lead This collection was accomplished by resethfromanufath
nalysis were collected as copies from the FBOrsquos where fuel was purchased he FBOrsquos were selected randomly The data from the certificates were entered into a
In 2010 the Egaps As part of the Industry Stakeholders FAST plan to respond to the EPA the possibility of
near-term means of responding In the short time available several options for evaluating this tion were proposed 1) having the refiners report on their current ability to reduce their lead ditive levels and meet specification 2) having refiners blend very low lead (VLL) fuel meeting ecification and have it tested and 3) review current Certificates of Analysis available in the
munity and assess the actual lead content of current compliant fuels
additive levels Several of the refiners did agree to blend VLL formulas but there was rse over time regarding whether the refiners should take current formulas and just add less
and see what resulted or whether they should adjust the rest of the formula to maintain all of specified properties The activity was further complicated by the length of time necessary to ally blend the fuel and then test it
this was fuel that was currently produced If it had lower than maximum lead it indicated the
presentatives from the FAA Technical Center requesting and collecting CoArsquos from a random lection of Fixed Based Operations (FBOrsquos) In some cases fuel samples were collected from e FBO and specifically analyzed by an independent laboratory In addition to the data collected m FBO fuels the laboratory analyses from the certification fuels used by the engine
cturers and data from the NEG analyses were collected This data was compiled and en analyzed and is the topic of this report
Sample Handling The certificates of aTspreadsheet For those fuels collected from the FBOrsquos the laboratory data sheets were used as the source of the data The data was entered as provided no entries being made where data was not provided The only exception was for the values of MON and lead content as indicated below Each sample also had its refinery identity blinded such that the data could be sorted based on the refinery but so the refinersrsquo identification was not included in the data set
Region Identifier Each refinery listed was given a regional ID by using the US time zones based on the location of the refinery In some cases the location of the refinery was overtly provided In other cases it was inferred based on the primary location of a companyrsquos refinery For example one company had two locations at which they produced aviation gasoline both in the same time zone Thus any sample from this company could reasonably be placed in a time zone Each location was given a number based on the zones as shown in Figure 1 The small numbers of global aviation gasoline samples were just coded as ldquoglobalrdquo
Page 37 of 50 Version 40 Oct 14 2010
(MON) using Table 9 found in ASTM D-2700-09 and produced in
Figure 1 ndash US Time Zones
MON Values from Aviation Lean Ratings Some of the CoArsquos provided the octane performance as aviation lean ratings These were converted to motor octane numbers reFigure 2 The aviation lean rating was found on the table and the equivalent MON read off of the axes Where necessary the value was interpolated An example is shown in Figure 2 for a lean rating of 11228 being converted to a MON of 1042 Note that a MON of 100 is equivalent to a performance number of 1017 A performance number of 100 results in a MON value of 998
123
4
Figure 2 ndash Table 9 from ASTM D‐2700
Page 38 of 50 Version 40 Oct 14 2010
Page 39 of 50 Version 40 Oct 14 2010
For the were converted to a uniform unit of grams milliliters of TEL the conversion factor as lead in gallons these values were co
Other DataIn additio was included as a separate entry These data ed to confirm inter-laboratory
as average values with the
Data were also provided from engine manufacturers from their engine certification trials These d fuels blended specifically as test fuels
analysis
idual fuels that would have met the maximum levels was counted and reported It s meeting specification it was an indication that
with the indicated levels that met specification he larger population within an acceptable level
located in the Annex located at the end of the ction levels the 20 reduction is indicated by a
nge line
is analysis the analyst has only the values as of Analysis from which to perform the analysis The sole purpose of
this analysis was to determine whether there are currently fuels in the distribution network meeting minimum D910 cation with a lower than maximum permitted lead content It is not intended to be an analysis of the cushion in MON The values used in this analysis including MON are as provided For MON the values are either directly repo N or have been converted from values provided as Aviation Number Ratings (lean ratings) to MON The analyst has in good faith assumed the refiner providing the data via a CoA has provided correct data The analyst is not in a position to second guess correct reporting from incorrect reporting With respect to MONperformance number if 108 is assumed to be wrong what about 106 Or 105 Or 102 If part of the data is assumed to be incorrect then all of the data should be assumed to be incorrect
Lead Content
purpose of analysis all of the provided lead contents of lead per liter (gPbL) For lead contents provided as
of 1mL TEL = 10589 g Pb was used For those providednverted to liters 1 US gallon = 3785 liters
Sources n to the data from CoArsquos data from the NEG data
are averaged values from a set of samples usrepeatability of specification testing These data were providedrefinery information purged prior to receipt
data included both generic fuel procured for the test anOnly the actual aviation gasoline data were used for the
Development of Max Lead for Reduction Levels In order to assess the maximum reduction level that might be achieved the maximum lead content for each of three reduction levels was computed The reductions considered were 20 15 and 10 reduction from current maximum lead content permitted by specification This correlated to maximum elemental lead levels of 045 gPbL 048 and 051 For the analysis the
umber of indivnwas assumed that a) because these were fuelindividual refiners could currently produce fuels and b) that the small sample set would replicate t
Analysis For the following evaluations all of the charts are document For charts indicating the lead redupurple line and the 15 reduction indicated by an ora
Caveat on MON data With respect to the MON values reported in thprovided by the Certificates
specifi
rted as MO
Furthermore because the values of MON and rating numbers converge around 100 and 100 ne considered for compliance to specification the conclusions in this report are
by using incorrect MON data around or above 100 The extent of the
on may be warranted within the aviation gasoline producing industry
results of this analysis to make any assessments garding the formulation of aviation gasoline the relationships between lead and MON or the
aluate whether there was any bservable correlation between the supercharge rating the motor octane number and the lead
alues showed observable variations
s indicating the 20 reduction (purple) and the 15 reduction (orange) m TEL level are included on the graph This visually indicates the observation that
t This is not a weighted average atches of fuel is available
ecause it is known that refiners have basically three major building blocks with which to achieve
ount of lead used In some cases the
region of the country at which e fuel was produced the data were separated by regions based on time zones and then sorted
MON is the baseliot significantly impactedn
exceedance of MON to specification minimum is neither the purpose of this effort nor has any impact on the analysis towards the actual purpose a survey of how much lead is being used in currently delivered 100LL Reporting the MON serves only to confirm the fuels did meet specification independent of the amount of lead additive used and the MON data serves no other purpose in this analysis Therefore while discussiregarding the accuracy of the CoA sheets the actual status of the MON values has no substantive impact on the conclusions drawn for this report Readers are discouraged from using the recushion in MON for production
Combined Data The first exercise after completion of the datasets was to evocontent of the fuel Figure 3 ndash Supercharge rating and Motor Octane Number vs Lead content Including Engine Cert Figure 3 ndash Supercharge rating and Motor Octane Number vs Lead content Including Engine Cert contains all of the data from the CoArsquos the NEG data and the engine certification data excluding blended experimental samples This analysis was done to see if there was any indication of a correlation between observable variations in the supercharge rating and the motor octane number with changes in lead content No correlations were observed All of the MON values were reasonably consistent while the leadv In addition to the data line
the maximuinwas mathematically calculated that between 33 and 40 of the samples would meet the 20 reduction in maximum TEL content About 50 of the samples would meet 15 reduction in maximum TEL and 64 would meet 10 reduction in maximum TEL These values remained relatively constant as additional data was included in the dataseas no data on the size of the individual b Bthe desired MON and supercharge rating ie the alkylate the lead and the aromatic content it was desirous to evaluate any relationships between the building blocks No information was available for the alkylate type or quality so the relationship between aromatic content and lead content was evaluated This is shown graphically in Figure 4 Unfortunately few of the datasheets included a value for aromatic content For those samples that did there appeared to
e no correlation between the aromatic content and the amblead and aromatic were relatively higher together as compared to other samples and in other cases samples with high lead had low aromatics This was most likely due to differences in the type of alkylate used No correlation could be drawn from these data By Region
an attempt to determine if there were any trends based on theInth
Page 40 of 50 Version 40 Oct 14 2010
based on these regions The data were again graphed to evaluate lead content versus aromatic content by region excluding the engine certification data Because of the method for procuring the data the majority of the samples that could have a region attributed to them were from region one and two An attempt to identify whether aromatics were used more prevalently in a specific region was also made The data was graphed comparing aromatic content to lead content by region and is shown in Figure 5 Again the analysis was hampered by a lack of aromatic content data Those amples having aromatic content were primarily in data that could not be attributed to a region
he MON vs Lead was graphed and is shown in Figure 6 In general there was just as much
d to a specific region had similar variability in the data The samples attributed to non-US manufacturers ldquoglobalrdquo did have nearly exactly 100 MON values
ng prepared specifically for an ULL test
ould not continue to produce fuel could account for the
20 reduction 47 of the me and a 15 reduction about 53 of the time Further analysis of the use of lead by refinery
wo of the refineries with two and four samples respectively could meet the
sThe three global samples did show higher aromatic content but these were fuel samples blended specifically to be ULL samples Tvariability in both the MON and the lead content in regions one and two Regions three and four had similar sample values however with only two data points no conclusion can be reasonably drawn The data not attribute
but this was due to bei Again no trends in the data by region for either the MON vs Lead or the Aromatics vs Lead were observed with one possible exception There did appear to be slightly higher lead used in region two This however is likely explained by a review of the data by refinery presented in the next section
By Refinery There is a concern that a decision to reduce the maximum lead content may result in single refineries being unable or unwilling to continue to produce aviation gasoline Even if 40 of the refineries sampled are capable of producing spec fuel with lower lead there is a concern that it is
ossible that one of the 60 that wpmajority of the aviation gasoline produced Unfortunately it is beyond the scope of the data and this report to comment on that risk It was possible however to evaluate the currently produced fuel by the refiner of record on the CoA This gives no information on the refinerrsquos abilities to produce fuel of a lower lead content over time but it does give information on the existence of fuel produced by a refiner with lower lead contents at individual points in time There is also no data available on the sizes of the individual batches meaning no assessment of the impact of losing one refinery would have on the overall fuel production levels A review of the aromatic content by refiner shown in Figure 7 again showed too little aromatic data to be of value drawing conclusions However a review of the MON vs Lead data showed graphically in Figure 8 indicates there is a strong correlation in lead content for one of the blinded refineries The refinery indicated by ldquoHrdquo showed the routine use of nearly maximum TEL In only one instance was less than 045gPbL used and that instance correlated to a lower MON content at the same time For the dataset reviewed this refinery accounted for nearly one quarter of the fuel samples considered It is not known if this relationship is comparable to the industry position for the refinery Two of the refineries accounted for just under half of the samples reviewed One was refinery ldquoHrdquo
lready discussed The second was refinery ldquoCrdquo which could meet theatiindicated that t
Page 41 of 50 Version 40 Oct 14 2010
045gPbL limit with all their samples These two refineries only accounted for 8 of the samples reviewed and accounted for only six samples Refinery D with four samples could meet the 15 reduction with all the provided samples The breakdown of the remaining refineries is shown below in Table 1 Refinery Number
Table 1 ndash Refinery versus ability to produce lower lead in spec aviation gasoline
From Engine Certification Fuels
content was 040gPbL which was lightly lower than the general data
In addition to reviewing the fuels as an agglomeration the fuels were also reviewed specific to the dataset provided on the fuels used for engine certifications It was noted that not all of this data included any lead content data however all of the data including the blended test fuels provided MON values or Aviation Lean Rating values that were converted to MON Of the 15 samples provided 9 of them included a lead content This data is provided graphically in Figure 9 The maximum elemental lead content indicated for the engine certification fuels was 060gL which is out of specification high The minimum value indicated was 008gL This may have been a typographical error as it was reported to be 029gPbgal which would have been more in line with other data as 029gPbL As entered the mean leads This dataset like the industry dataset indicated a similar breakdown of approximately 40 being able to meet the 20 reduction 67 meeting the 15 reduction and 67 meeting the 10 reduction
Page 42 of 50 Version 40 Oct 14 2010
Page 43 of 50 Version 40 Oct 14 2010
ased on the review of the provided data five basic conclusions can be drawn
1 Ba n t 13 s cuproduced are l n ctspecification lead levels At a 15 reduction approximately frac12 would meet spec
2 The primary supplier of repre nting 24 of the dreduction of t lead level his supplier met axi adreduction in 11 of the sa
3 There doe ar t be a relation p between r s an co xcthe impact of the single i ry on th r gion da
4 No obvious relationship e drawn based on the le arlack of lead data and no information on alkylates There were instances of high lead with
a Similarly no relationship was found between the lead level and the motor octane number or the supercharge rating
had motor octane values higher than 102 and 60 er than 105
Conclusions B
sed on a agglomeration of the sampbelow the
le dataead conte
about at a 20
of the sampleredu
rrently current maximum ion over
fuel se ataset could not meet a 20 he maximum T the m mum le level at a 15
mples
s not appe o shi egion d lead ntent e luding ref ne e e ta
can b ad and omatics data due to the
high aromatics and low lead with high aromatics
5 Of the samples reviewed over 87were over 103 Only 5 were high
Annex ndash Graphical Representations of the Data
000
010
020
030
040
050
060
070
M ne berotor Octa Num
0
20
40
60
80
100
120
140008
034
036
039
039
041
041
041
041
042
043
044
044
044
045
047
048
048
048
049
050
050
051
052
053
053
053
053
053
054
056
MON and Supercharge
Lead content gL
Motor Octane and upercharg s d
052
S
053
053
e v
053
LeaSuperNumb
c e Performance ehargr
Rating
Lead co t Lnten g Pb
Linear or Octane Number)(Mot
053
060
gPbL
20 reduction from Max TEL (M045 gL)
ax 15 re(Max
duction fro48 gL)
m EL0
Max T
Figure 3 ndash Supercharge rating and Motor Octane Number vs Lead con ng tent Includi Engine Cert
Page 44 of 50 Version 40 Oct 14 2010
000
010
020
030
040
050
060
070
0
2
4
6
8
10
12
14
16
18
20008
034
036
039
039
041
041
041
041
042
043
044
044
044
045
047
048
048
048
049
050
050
051
052
052
053
053
053
053
053
053
053
053
053
054
056
060
Lead
Content gL
Aromatic Content Vol
gPbL
Aromatic Content vs LeadAromatic Content Vol Lead content g PbL
igure 4 ndash Lead Content vs Aromatic Content Including Engine Cert F
MON vs Lead by RegionMotor Octane NumberLead content g PbL
20 Reduction in
Figure 6 ndash Motor Octane Number vs Lead Content by Region for CoArsquos Excluding Engine Cert Fuels
Page 47 of 50 Version 40 Oct 14 2010
000
010
020
030
040
050
060
A C C C C C C C C C C C C C C C C C D D D D D H H H H H H H H H H H H H H H H H H H I L L MMMMP P P P P P P P P P P P P S S S S X X X X X X X X X L L
0
2
4
6
8
10
12
14
16
18
20Lead
Content gL
Blinded Refinery
Aromatic Content
Lead vs Aromatic by Refinery Lead content g PbLAromatic Content Vol
20 reduction from Max TEL
15 reduction from Max TEL
Figure 7 ndash Lead Content vs Aromatic Content by Blinded Refinery Including Engine Cert Data
Page 48 of 50 Version 40 Oct 14 2010
000
010
020
030
040
050
060
070
080
090
100
95
97
99
101
103
105
107
109
A C C C C C C C C C C C C C C C C C D D D D D H H H H H H H H H H H H H H H H H H H I L L MMMMP P P P P P P P P P P P P S S S S X X X X X X X X X L L L
Lead
gL
MON Rating
MON vs Lead by RefineryMotor Octane NumberLead content g PbL
20 reduction from Max TEL
Figure 8 ndash Motor Octane Number vs Lead Content by Refinery Including Engine Cert
Figure 9 ndash Motor Octane Number vs Lead Content Specific to the Engine Certification Fuel
Page 50 of 50 Version 40 Oct 14 2010
INVESTIGATION OF
REDUCED TEL CONTENT
IN COMMERCIAL100LL AVGAS
Summary
Discussion
Background
Sample Handling
Region Identifier
MON Values from Aviation Lean Ratings
Lead Content
Other Data Sources
Development of Max Lead for Reduction Levels
Analysis
Caveat on MON data
Combined Data
By Region
By Refinery
From Engine Certification Fuels
Conclusions
Annex ndash Graphical Representations of the Data
CRC VLL Round I Test Results IO-540-KFuel Flow Lbshr Knock On Set
Figure 40
ldquoLead Responserdquo TEL (mLgal) Curve IO-540-K
CRC VLL Round I Test Results IO-540-KFuel Flow Lbshr Knock On Set
Figure 50
ldquoLead Responserdquo TEL (mLL) Curve IO-540-K
Page 18 of 50 Version 40 Oct 14 2010
CRC VLL Round I Test FuelsD 2700 MON Ratings
90
95
100
105
110
0 02 04 06 08 1 12 14 16 18 2 22
MO
N D
270
0 M
ON
Rat
ing
TEL Content - (mLgal)
MON D2700
100LLEM1
EM2EM3
EM4
EM5
Figure 60
D s
2700 MON Ratings CRC VLL Round I Test Fuel
CRC VLL Round I Test FuelsASTM D 909 Supercharge Rich Rating
90
100
110
120
130
140
150
0 02 04 06 08 1 12 14 16 18 2 22
Supe
rcha
rge
Ric
h R
atin
g D
909
TEL Content - (mLgal)
SC RICH D909
EM3
EM4
EM2
EM1100LL
EM5
Figure 70
D 909 Supercharge Ratings CRC VLL Round I Test Fuels
Page 19 of 50 Version 40 Oct 14 2010
34 Figures 40 described
approaches
ock limited
TEL values ranging fro
content for t mented
CONCLUSIONS ROUND I VLL TESTS and 50 indicate the ldquolead responserdquo for the IO-540-K test engine using the fuels
in Table 30 The data indicates the ldquolead responserdquo in terms of knock limited fuel flow for TEL content in the 150 to 200 mLgal range is linear There is a ldquokneerdquo in the curvearound 060 mLgal below which the ldquolead responserdquo becomes non-linear as the TEL content
zero
The utility of Figures 40 and 50 is that they indicate the relative change in engine knfuel flow as a function of TEL content in the 150 ndash 20 mLgal range of interest and beyondwhich provides for correlation with the fleet service experience with AVGAS at
m 122 ndash 200 mLgal as discussed in Section 5 of this report
Figures 40 and 50 provide an indication of the sensitivity of knock limited fuel flow to TELhe conventional IO-540-K engine configuration and test conditions docu
ge of wn in
Assuming a linear response in the 13 ndash 20 mLgal range the data indicate a chan04 mLgal results in a 49 impact on knock limited fuel flow for the BHP shoFigures 40 and 50
Alternately a change of 05 mLgal results in a 6 impact on knock limited fuel flow for the BHP shown in Figures 40 and 50
A change in TEL content from 200 mLgal to 122 mLgal (39 reduction) is equivalent to a 94 chan d 50 ge in knock limited fuel flow reference Figures 40 an
ay be ote
d in
he size of the general avia
piston powe total ion
comprising 453 aircraft which is estdefined as he General Aviation Ma
Piston powe
arrangements manufactured by original eq nufacturers (OEM) Teledyne Continental Motors and Textro CAR 13 Civil Air Regulations or 14 CFR 33 Federal Aviation regulations
Many older GA engine models are approved to operate with a minimum grade 8087 AVGAS but are also approved to operate with the more readily available higher grade 100LL AVGAS A
Based upon Figures 40 and 50 the sensitivity of engine knock to TEL content mexpressed as 01 mLgal is equivalent to 12 impact on knock limited fuel flow Nthat this is in agreement with the radial engine lead response at 075 FA discusseSection 31 Although the metrics are expressed in different terms knock limited IMEP for a radial engine and knock limited fuel flow for a conventional engine they arecomplementary and indicate the relative change in knock on-set as a function of TEL
4 GENERAL AVIATION PISTON POWERED FLEET Of interest relative to the use of 100LL AVGAS and the associated TEL content is t
tion piston powered fleet which requires use of a minimum grade 100LL AVGASBased upon the results of a recent study which researched the FAA Registry for registered
red aircraft and the associated FAA TCDS for a listing of approved fuels theUS GA fleet in 2010 consists of 228078 aircraft with the piston powered fleet port
83 of the total(8) The US piston fleet in YR2010 consists of 189imated to be 60 - 70 of the total worldwide piston fleet General Aviation is all aviation other than military and commercial airlines according to tnufacturers Association(11)
red GA aircraft (less than 12000 lbs gross weight) are almost exclusively poweredby horizontally opposed spark ignition reciprocating engines configured in 4 6 and 8 cylinder
uipment man Lycoming as FAA approved products conforming to either
Page 20 of 50 Version 40 Oct 14 2010
small percentage of the fleet is approved to operawith a few aircraft listing 9198 as the approved fu
te on an older minimum grade 9196 AVGAS el GA engine models produced since the mid
GA engines are both naturally aspirated and turbocharged with ratings from
1970rsquos are mostly high output high performance high compression ratio (85 ndash 87CR) engines which require a minimum grade 100LL AVGAS for adequate knock protection The minimum grade fuel approved for operation with an aircraftengine is specified in the engine FAA TCDS the aircraft FAA TCDS and the aircraft POH (Pilot Operating Handbook)
he FAA approved T100 BHP to in excess of 400 BHP Fuels approved for operation in GA engines are specified in the FAA approved OEM continuous airworthiness data and the associated FAA TCDS (type certificate data sheet which may be accessed at httprglfaagov) The approved fuel is typically specified in the FAA TCDS as aviation gasoline conforming to ASTM D 910 pecification either minimum grade 8087 9196 9198 100LL or 10013s 0 FAA certification of
41A stud ssioned by the FAA Technical Centerrsquos Aviation Fuels and Engine Test Facility (AFETF) to quantify the piston powered fleet composition based upon the approved minwhich are based upon data contained in the FAA Registry and the FAA TCDS establish a baseline data base for the active piston powered aircraft by make and model along with a listing of t Based upon the results of this study reference (8) 433 of the GA fleet requires a minimum Gragasolinof the accounthe gen80 87 er grade 100LL Engine manufacturer service bulletins specify that engines are approved to
perate with the next higher grade AVGAS but are not approved to operate with a lower grade e eligible for operation with 100LL oved for use with an unleaded min
each engine model required that adequate detonation (knock) margins be demonstrated by test using a certified fuel of minimum quality while operating at worst case conditions for knock
FLEET APPROVED MINIMUM GRADE FUEL y was recently commi
imum grade fuel as listed in the FAA TCDS for each aircraft(8) The results of this study
he approved minimum grade fuel
de 100LL AVGAS and is therefore dependent upon the leaded aviation grade 100LL e for both performance and knock protection Industry specialists believe it is this 433 fleet representing later model aircraft used for business and utility purposes which ts for the majority of the general aviation flight time Although there is a large segment of eral aviation fleet (84429 aircraft representing 446 of fleet) rated on minimum grade
90 or 91 AVGAS this group of aircraft is also approved to operate with the next high
oTherefore 166492 aircraft representing 879 of the fleet arAVGAS FAA TCDS data show 04 of the aircraft are apprgrade 9196 In the absence of a domestic min Grade 91 production AVGAS and minimal availability of min Grade 80 AVGAS min Grade 100LL is the predominantly available AVGAS today A 9196UL AVGAS is available within Europe
Page 21 of 50 Version 40 Oct 14 2010
Table 40 (8)
General Aviation Fleet Approved Min Fuel Grade Based Upon FAA Registry amp TCDS
Fuel Grade Number of Aircraft
Percent of 189453 Aircraft
100LL Minimum 82063 433
80 Minimum 69402 366
Other Fuel 17508 92
91 Minimum 13387 71
Unknown 5306 28
Unleaded 9196 825 04
87 Minimum 802 04
Jet A 147 01
90 Minimum 13 00068
Total Aircraft 189453 100 Notes
Minimum fuel grades extracted from FAA TCDS for aircraft Category ldquoother fuelrdquo includes TCDS fuel designations of 65
70 73 108135 amp 115145
wing describes the results of the FAA echnical Centerrsquos survey to quantity FBO AVGAS TEL levels as dispensed to the fleet
1 OBJECTIVES STM D 910 specifies a maximum content for TEL in 100LL AVGAS but no minimum With the cognition that there are normal production variances in TEL content of AVGAS as the result of
rocess variables including basic alkylate and refining process the FAA Technical Centerrsquos FETF commissioned a study to investigate the actual variation of TEL content in 100LL VGAS The primary objective of this study was to quantify the normal variances in TEL ontent as encountered by the fleet at the FBO level with a secondary objective of documenting
s in TEL content The purpose of this study was to develop
5 SURVEY 100LL AVGAS TEL CONTENT Whereas 100LL AVGAS is the predominantly available aviation gasoline today and in consideration of the AVGAS Stakeholder Grouprsquos near term strategy to pursue a reduction in lead emissions using a ldquodrop inrdquo replacement reduced lead content 100 min grade AVGAS the AVGAS Stakeholder Group requested the CRC Unleaded AVGAS Development Group working in conjunction with the FAA Technical Center to explore options and viability for a reduced TEL content 100 min grade AVGAS In response to the Stakeholder request dual VLL initiatives were launched by the CRC and FAA including full scale engine testing of manufacturerrsquos reduced TEL content AVGAS in addition to an effort to assess and identify typical TEL content in 100LL AVGAS consumed by the fleet The folloT
5ArepAAcfleet operating exposure to variance
Page 22 of 50 Version 40 Oct 14 2010
a data base that would support and contribute to the industryrsquos study of options for reducing lead emissions Prior to this study there o no information available in a summary format which document vered to the fleet
52 METHODS The production and quality control processes for aviation gasoline require the documentation of critical fuel properties b at bot finery leve delivered by the fuel distributer to the FBO (Fixed Base Operator) Each batch of fuel is panied by a certificate of analysis which identifies nce o erties g TEL content MON SC rating density vapor pressure net heat of combustion and distillation properties in accordance with the applicable ASTM specification Accordingly the 100LL AVGAS delivered to the FBO infrastructure is ted by tificates of analysis (CofA)
Additional data on analysis of fuel properties is available through the ASTM NEG (National Exchange Group) wherein AVGAS samples are shared among various test laboratories for documentation of critic part of a s check of r bility The NEG data furnished for the purpose y was e format of average values and did not associate properties with a specific refinery The FAA Technical Centerrsquos field TEL study focused on generating a data base of TEL co using certific f analysis obtained at random from the FBO infrastructure The resulting data base also included TEL data provided by one major fuel produce years o oduction C of analysis for fuel samples collected by the F cted to by an inde included in the data base int wa rdquo for the pu f confidentiality
In recognition tha ates of analysis for 100LL AVGAS us conducted at the engine manufactu in FAA certification tests The resulti ed the FBO certificates of analysis Data from the
ngine manufacturers was also ldquoblindedrdquo for confidentiality
was limited ted normal TEL variances in 100LL AVGAS as deli
y laboratory test h the re l and as accom
includin the conforma f critical prop
well documen the cer
al properties as cros epeataof this surve in th
ntent ates o
r for several f pr ertificatesAA and subjeEach data po
analysiss ldquoblinded
pendent laboratory were alsorpose o
t the OEM engine manufacturers obtain and file certificed in official FAA certification testing a search was alsorers for documentation of 100LL AVGAS properties used ng data points complement
e
SURVEY DATA CAVEAT Survey data consisting of CofA NEG data and engine manufacturerrsquos reports were used without change or prejudice CofA are accepted by the industry as a certificate of validation Further investigation or verification of the accuracy of the reported data was determined to be outside the scope of the researcherrsquos authority It is noted that several data points indicated MON values higher than normal Although MON is of interest the primary objective of this survey was to explore and investigate TEL trends in production AVGAS
Page 23 of 50 Version 40 Oct 14 2010
53 RESULTS The resulting survey data consisting of certificates of analysis documentation furnished by the original engine manufacturers NEG data and refinery data were compiled and furnished by the FAA Technical Center to an independent consulting firm for review analysis and compilation in
summary report That report is included as Appendix A to this report (9) While the presented it was observed that the addition of data (from 55 to 89) had little impact on values of TEL The summary of findings is extracted from Reference (9) and
asample set is smallthe max and mean repeated as follows The reader is referred to Appendix A for a detail accounting of the survey data and associated analysis
(may indicate typographical error in original source report)
MON ratings
o Max = 1076
o Mean = 1038
o Min = 1011
Tetraethyl Lead content
o Max = 060 gPbL (107 of D 910 limit)
Page 24 of 50 Version 40 Oct 14 2010
Figure 100(9)
Segregation of Fuel Samples by TEL Reduction
39 of the fuel samples described by CofA and industry laboratory reports could meet a 20 reduction in TEL
51 of the fuel samples described by CofA and industry laboratory reports could meet a 15 reduction in TEL
64 of the fuel samples described by CofA and industry
laboratory reports could meet a 10 reduction in TEL
44 of the fuels u ertification could meet a 20 reduct
L
sed for FAA c
ion in TEL
67 of the fuels used for FAA certification could meet a 15 reduction in TE
6 GA FLEET 100LL SERVICE EXPERIENCE
he surve tion 100LL AVGAS as distributed to the fleet rough the general aviation iston powered fleet has
een exposed to service e a low of 61 of max mean of 8 g MON and other D 910
pecification properties As dditive TEL is effective as knock suppressant in AVG there is a corresponding pact on engine knock response A threshold of TEL reduction is ultimately reached where el octane quality is sufficiently degraded to the extent that engine knock margins are
egraded The latter is not the case with the current fleet as indicated by a study of related fleet ervice experience which indicates a neglible incident rate of knock with no indications of fuel lated incidents The successful service experience with varying levels of TEL speaks highly of e margins or
xperience has sh s usually manifested in burned pistons eroded iston domes or e holes in pistons with a resulting loss in engine power and a oticeable change in engine vibration With the objective of evaluating fleet service experience ased upon the premise that the fleet has been subjected to operation on 100LL AVGAS with EL content as low as 61 llowable TEL FAA Service Difficulty Reports (SDR) ave been reviewed for i tonation incidents as might be indicated by reports of urned pistons eroded pistons bu signs of detonationrdquo with the results
ummarized as fol
1 FAA SERVICE DIFhe FAA maintains a data viation products which may e accessed at http
Results of tth
y of TEL content in produc FBO network indicate that the domestic pxperience with TEL content varying fromb
allowable TEL to a s
4 of max allowable TEL while still meetindiscussed in Section 3 of this report the a
AS As the content of TEL is reducedaimfudsreth
iginally designed into the general aviation products
E own that the effect of knock ipn
dges or burned
bT - 84 of max ah ndications of de
rned hole in pistonldquobs lows
6 FICULTY DATA BASE T base for reports of service difficulties for ab av-infofaagovsdrx A reformatted version of the
d to list only general aviation related reports less air FAA SDR data base
hich is restructure carriers commuters nd military may be accessed at wwwlandingscom_landingspagessearchsearch_sdrhtml
wa
here SDR data is retrieved from the FAA ftp server on a weekly basis The FAA SDR data ase does not contain all reports of aviation difficulties but rather only those which are
wb
Page 25 of 50 Version 40 Oct 14 2010
voluntarily submitted to the FAA where each is based upon the submitterrsquos assessment of the ervice difficulty However the FAA SDR s provide useful information providing sight into specific ser ported difficulties rovide an indic tion of relative incident rates as compared to other difficulty categories or the
f all reports f ircraft models r engine models iation contains 500000 entries 1975
sin
data base doevice difficulties when viewed in the context that the re
p aaggregate oo
or a specified aircraft model engine model or groups of a The entire FAA SDR data base reflecting all elements of av
to present ref 1 httpwwwaviationdbcom
62 SDR REPOR
search of the FAA S ed for reports of etonation incident raft series hich represent t nce high ompression ratio engi aspirated and turbocharged Rather than searching all mall aircraft manu ral aviation ircraft models which a 5 aircraft or 817 of the total FAA registry of piston owered aircraft The search was facilitated by searching under the FAA JASC code ldquo8530rdquo(10)
nd key word ldquopistonrdquo FAA JASC code 8530 is defined as ldquoFor reports of engine cylinders and ssociated partshelliptypical parts are piston piston pin exhaust valve intake valve valve guide
s of the SDR data search are r each of the 31 ldquoburned pistonrdquo listings is
TS DETONATION INCIDENTS DR data base for the general aviation fleet was performA
d s by searching for reports of piston difficulties for the following airche manufacturers of those aircraft powered by high performa
nes both naturally wcs facturers the search targeted the following representative gene
ccount for 15482apaarocker arm valve cover cylinder pushrodhelliprdquo Resultsummarized as follows A copy of the SDR report foon file and available upon request The SDR reports surveyed covered a time period of 17 years 1993 to present
Table 50 FAA SDR Reports for Burned Pistons (10)
Representative Manufacturers ndash General Aviation Fleet FAA SDR Reports Aircraft
It is concluded based upon the review of SDR reports for detonation incidents for the fleet portion indicated that the occurrence of detonation in the fleet is rare with the total number of detonation incidents at 002 of the fleet surveyed None of the SDR reports corresponding to the above 31 reports of ldquoburned pistonsrdquo indicated fuel was a factor For some of the 31 reports it was not totally certain that detonation was the contributing event for the majority of the reports the cause of detonation was not identified Likely causes of detonation incidents include mis-adjusted ignition timing magneto failures blocked fuel injector nozzle and operation at high
ower with lean mixture Those reports which indicated structural failure of the piston rather an thermal failure were not included in the 31 reports which contained failure descriptions
ed hole in piston signs of detonationrdquo
pthconsistent with ldquoburned pistons eroded pistons burnPiston structural failures typically have unique signatures which are distinctly different from a detonation induced event which results in excessive piston temperature The engine models listed in the 31 reports are summarized in Table 60 relative to model designation and configuration - naturally aspirated turbocharged carbureted fuel injected compression ratio and approved min grade fuel Turbocharged engines represented 48 of the engines identified as possibly having encountered a detonation event No conclusions are drawn based upon engine models andor turbocharged versus naturally aspirated On the contrary the documented detonation events appear to be evenly distributed across the naturally aspirated and turbocharged models however the naturally aspirated fleet represents a larger population than turbocharged models
Table 60 (10)
Engine Models Listed in FAA SDR Reports of Bu Detonation rned Piston
Engine Model
Configuration Compression Ratio
Min Grade AVGAS
O-2 85 1035-L2 ) C (4ea NA Carb 0100LL
O-320-D2J NA Carb 85 9196
3G NA CaO-320-D rb 85 9196
O-470-R NA Carb 70 8087
IO-360-C1C NA FI 87 100100LL IO-360-G NA FI 85 100100LL IO-470-L (2) NA FI 86 100100LL
CB NAIO-520- FI 85 100100LL IO-520-D NA FI 85 100100LL IO-520-F NA FI 85 100100LL IO-540-K1J5 NA FI 87 100100LL IO-540-S1A5 NA FI 87 100100LL GTSIO-520-L Turbo FI 75 100100LL GTSIO-520-M Turbo FI 75 100100LL
100100LL GTSIO-520-N (2ea) Turbo FI 75
75 100100LL LTSIO-360-E Turbo FI
75 100100LL TSIO-360-KB Turbo FI
Page 27 of 50 Version 40 Oct 14 2010
TSIO-520-(Unkn) Turbo FI 75 100100LL
TSIO-520-NB (2ea) Turbo FI 75 100100LL TSIO-520-R (2ea) Turbo FI 75 100100LL TSIO-520-VB Turbo FI 75 100100LL
TSIO-520-WB Turbo FI 75 100100LL TIO-540-J2BD (2) Turbo FI 73 100100LL Notes
1) NA = naturally aspirated Turbo = turbocharged Carb = carbureted FI = fuel injected
7 CONCLUSIONS The purpose of the CRC research documented within this report was not to specify or recommend a specific reduced TEL level for AVGAS but rather to conduct research and investigations with the objective of generating technical data which would enable and facilitate the industryrsquos decision process for a reduced TEL AVGAS The results of the tests and investigations documented within this report fulfill this objective Significant findings and
bservations are summarized as follows
71 TEST RESULTS ENGINFigures 40 and 50 provide an indication of the sensitivit content for the conve -540-K g e t ns documented The following observations and conclusions are based the 15 gal TEL range of interest unless n
o
E LEAD RESPONSE y of knock limited fuel flow to TEL
uration and thupon
n IOtional engine confi est conditio 20 mL ndash
oted otherwise
Test res s a change Lgal (2 eduction ) results in a 49 impact on knock limited fuel flow
ults indicate of 04 m
0 r in TEL
Alternately a change of 05 mLgal (25 reduction in TEL) knock limited fuel flow
results in a 6 impact on
A chang ntent from Lgal to 1 mLgal ction in TEL) is equivalent to a 94 change in knock limited fuel flow Note that the survey results indicate minimum field FBO fuel ntent was umente 122 mLgal
e in TEL co 200 m 22 (39 redu
TEL co doc d as being
The sensitivity mLgal is equivalent to 12 impact on knock limited fuel flow over the 15 ndash 20 mLgal range of inter
may also be expressed as 01 est
Analysis conventio ine lead response is nt with the radial engine l of 10 -12 ge in kno mited IM 1 mLgal TEL as discussed in Section 31 Altho nock metrics are expressed in different terms knock lim radial en knock limited fuel flow for conventional engine these indice ementary a function
indicates theead response
nal eng chan
in agreemeEP per 0ck li
ugh the kited IMEP for
s are complgine and
nd indicate the relative change in knock on-set as a of TEL
Page 28 of 50 Version 40 Oct 14 2010
72 SURVEY R 00LL Figures 80 through 100 present a summary of the findings and observations documented within the Appe nifica and ob tions a ized as follows
ESULTS FBO 1 AVGAS
ndix A report Sig nt findings serva re summar
Survey r content i GAS (8 ta poinTEL content in AVGAS is 84 L allowe ASTM d upon the data examine
esults of TEL n FBO AV 9 da ts) indicate mean (average) of max TE d by D 910 base
d
Survey r tent i GAS in te the fleet has service experience with TEL content as low as 61 of the max TEL allowed by ASTM D 910 for fuels of 1016 MON
esults of TEL con n FBO AV dica
or higher
Mean MON for FBO AVGAS was observed to be 1037 MON with minimum MON documented at 1016 MON The maximum MON for AVGAS as indicated by the CofA data was 108 MON
Examination of engine manufacturer certification data (23 data points) indicates 100LL AVGAS used for official FAA engine certification testing had TEL content varying from minimum of 14 of max allowable to a mean of 71 of max allowed Associated minimum MON was 1011 with mean MON being 1038 The maximum MON for the 15 certification data samples was 1076 MON (Note that 14 may indicate a typographical error in the original source data)
39 of the fuel samples described by CofA and industry laboratory reports could meet a 20 reduction in TEL
51 of the fuel samples described by CofA a15 reduction in TEL
nd industry laboratory reports could meet a
64 of the fuel samples described by CofA and industry laboratory reports could meet a 10 reduction in TEL
44 of the fuels used for FAA certification could meet a 20 reduction in TEL
67 of the fuels used for FAA certification could meet a 15 reduction in TEL
73 FLEET SERVICE EXPERIENCE Withhas be n on 100LL AVGAS with TEL content as low as 61 - 84 of maDiffindicatedetona
the objective of evaluating fleet service experience based upon the premise that the fleet en subjected to operatio
ximum allowable TEL as documented by the Appendix A survey results FAA Service iculty Reports (SDR) were reviewed for indications of detonation incidents as might be
d by reports of ldquoburned pistons eroded pistons burned hole in piston signs of tionrdquo Significant findings and observations are summarized as follows
It is concluded based upon the review of FAA SDR reports for detonation incidents that the occurrence of detonation in the fleet is rare with the total number of detonation incidents at 002 of the fleet surveyed None of the SDR reports indicated fuel was a factor Qualifications regarding SDR reports are discussed in Section 61
r speaks highly of the margins originally designed into the general aviation powerplants in consideration that service experience indicates knock is a rare occurrence within the fleet
Analysis of survey results and engine lead response data indicates the fleet service experience with TEL content at 61 - 84 of max allowable TEL is equivalent to a 94 -38 variance in engine knock margin respectively from the baseline 20 mLgal TEL level The latte
Page 29 of 50 Version 40 Oct 14 2010
8 RECOMMENDATIONS The test results and findings documented within this report indicate the general aviation fleet hasAVGlead codocumented within this report Althtechnicthe aviation industry which are outside the jurisdiction of CRC research In tthe gemainte rovided with the necessary informational training
9 RE
f D02J02
GAS Coalition Briefing EAA AirVenture 2010 July 27 2010
ffects on Engine Performance NAVAER 06-5-501 USAF TO
I28 ldquoExperimental Studies of the Knock-Limited Blending d
inson
(8) Herbert W Schlickenmaier Crown Consulting Inc ldquoAviation Fuels Research Fleet Database 10 (prepared by Crown Consulting Inc under Purchase Order artin NISC II Bridge Contract DTFAWA-08-C-00009 with the
successful service experience with a TEL content of 122 ndash 200 mL TELgal (100LL AS) having a MON of 1016 or greater Technical considerations for specifying a maximum
ntent less than 200 mLgal should obviously be guided by the fleet service experience
ough a reduced TEL content within the range of experience documented within this report is ally feasible there are other non-technical considerations which must be addressed by
he advent of implementation of a reduced TEL AVGAS it is recommended that the FAA and neral aviation industry give consideration to ensuring aircraft owners pilots and nance personnel are p
FERENCES
(1) The History Specification Production Use and Evaluation of Unleaded Aviation Gasoline Report by the D 910 Task Force o
(2) Letter AVGAS Stakeholder Group to EPA dated June 10 2010
(3) Presentation GA AV
(4) ASTM D 910 ldquoStandard Specification for Aviation Gasolinesrdquo
(5) Aviation Fuels and Their ENo 06-5-4 dated 1951 by Ethyl Corporation
(6) NACA Report No E4Characteristics of Aviation Fuelsrdquo N D Sanders R V Hensley R Breitwieser dateOctober 1944
(7) FAA Technical Center Test Results Email dated July 25 2010 D Atwood to R Wilk
Reportrdquo dated October 13 207200006107 from Lockheed MFederal Aviation Administration)
(9) Melanie Thom Baere Aerospace Consulting Inc ldquoReview of Certificates of Analysis and Test Data of Aviation Gasoline for Current Ranges of Lead Additiverdquo dated Sept 9 2010 (prepared for Crown Consulting Inc under Purchase Order 7200006107 from Lockheed Martin NISC II Bridge Contract DTFAWA-08-C-00009 with the Federal Aviation Administration)
(10) FAA Flight Standards Service Aviation Data Systems Branch AFS-620 ldquoFederal Aviation Administration Joint Aircraft SystemComponent Code Table and Definitionsrdquo October 27 2008
(11) CRC Report AV-7-07 ldquoResearch Results Unleaded High Octane Aviation Gasolinerdquo June 17 2010
(12) Alisdair Q Clark BSc PhD ldquoAviation Gasoline History and Futurerdquo IASH 2007 October 2007
Page 30 of 50 Version 40 Oct 14 2010
izations specialized consulting firms the FAA and the CRC
nd Engine Test acility was crucial to the outcome Most importantly it was the foresight of the FAA AFETF
oject to survey FBO AVGAS with the goal of better understanding the mercial AVGAS
Lastly Developme report on their behalf
10 ACKNOWLEDGEMENTS The information contained within this report reflects the participation and commitment of industry specialists representing a broad segment of general aviation including fuel producers test laboratories FBO fuel distributors aviation engine and aircraft manufacturers aviation trade organizations fuel trade organexecutive office The successful completion of the survey of AVGAS properties followed by the compilation and analysis of survey data as complemented by engine testing to investigate engine lead response were made possible in no small part by the actions of those committed to the future of general aviation
The leadership and guidance provided by the Aviation Stakeholders was instrumental in establishing goals and objectives Typical of previous CRC aviation gasoline research projects the participation and contribution of the FAA Technical Centerrsquos Aviation Fuels aFwhich launched the prariance of TEL in comv
the author would like to express his humble appreciation to the CRC Unleaded AVGASnt Group for the opportunity to compile this
- END OF TEXT ndash
Page 31 of 50 Version 40 Oct 14 2010
Page 32 of 50 Version 40 Oct 14 2010
APPENDIX A
ldquoREVIEW OF CERTIFICA OF ANALYSIS AND TEST DATA OF AVIATION GASOLINE FOR CURRENT RANGES OF LEAD ADDITIVErdquo
VER 60 DATED S 9 2010
TES
EPTEMBER
REVIEW OF CERTIFICATES OF ANALYSIS AND TEST DATA OF AVIATION GASOLINE FOR CURRENT RANGES OF LEAD ADDITIVE AssesCurre In an attemptaviation gasoadded to current aviation gasoline This endeavor was to evaluate on a very small sample sASTM D-910 lower lead containing fuels This was done y reviewing the Certificates of Analysis procured for contemporary loads of aviation fuels from a variety of FBOrsquos and test labs as well as fuels used by engine manufacturers for engine certification The result was a sample set of 89 individual data points which were reviewed for the lead content all conver grams of lead per liter of fuel The samples were also segregated by gions using time zones of the manufacturer location and by refinery (blinded for this report) in an attempt to identify if any relationships of lead usage by region or by refiner This report used the data as provided by the manufacturers whose sole responsibility it is to the correctness of the data No assessment of the MON ldquocushionrdquo or evaluation of formulation should be made from this data
sing the Viability of Lowering Lead Levels in nt A iation Gasoline Production v
to demonstrate a commitment to the global community by the line user community it is desirou to reduce the amount of lead s
et the current lead additive levels in fuels currently meeting the specification to assess the industryrsquos current ability to produce
b
ted tore
Prepared by Melanie Thom 992010 Report Prepared for Crown Consulting
Page 33 of 50 Version 40 Oct 14 2010
REVIEW OF CERTIFICATES OF AND TEST DATA OF AVIATION GASOLINE
OR CURRENT RANGES OF LEAD ADDITIVE Aviation Gasoline
rrsquos reports was used t change or prejudi CoArsquos are accepted e industry as a certificate of validation
determined to be veral data points indicated MON
ctive of this survey was
garding the relationship between formulas MON cushion or how the he MON values can be made This analysis should only be used to uels currently meeting ASTM D910 with less than maximum allowable
d content Furthermore the production of VLL 100 requires more than just the reduction in to produce a lower lead ignificant research and
ulations that still meet all the specification uirements
While this is ve of the East resentative of
ions was also ch 21 had a
6 were blends sis This data
3 After reviewing the data it was determined that approximately 39 of the fuel described by the Certificates of Analysis (COA) and industry laboratory reports could meet a 20 reduction in the TEL additive 51 could meet a 15 reduction in TEL and 64 could meet a 10 reduction in TEL as indicated by current production lots
tion fuels with lead contents indicated 44 could meet the 20 reduction and 67 could meet the 15 reduction This is in line with the fielded data
NALYSIS
A
FAssessing the Viability of Lowering Lead Levels in Current
roduction
OTE Survey data consisting of CoA NEG data and engine manufactureithou ce by thurther investigation or verification of the accuracy of the reported data was tside the scope of the researcherrsquos authority It is noted that selues higher than normal Although MON is of interest the primary obje explore and investigate TEL trends in production AvGas
s such no conclusions read reduction will affect t
luate the existence of f
P
NwFouvato Aleeva
alelead The data in this report is only demonstration of the ability of refiners
el not an analysis of how to produce fuel with lower lead Svelopment will be required by refiners to develop form
fudere
q
S
ummary
1 The sample set excluding the ULL study included 89 individual data pointsa small sample set analysis of this data suggests that it is representatiCoast and Midwest There are no obvious indications that it is not repCentral and West Coasts
2 An additional set of Certificates for fuel used during engine certificatsupplied and reviewed This data set included 23 individual entries for whimotor octane value entry and 9 had a lead content Of the 23 samplesprepared from 100LL and iso-octane and were not included in the analywas analyzed separate from the field sample entries
o Of the nine certifica
Page 34 of 50 Version 40 Oct 14 2010
4 Sixteen (16) of the data was from the National Exchange Group (NEG) database and all location and refinery information was previously purged for these samples
5 When separated by refineries 25 of the fuel in the sample set was provided by a single refinery H Another 224 was provided by refinery C When the fuels from the individual refineries were analyzed it was determined that refinery H only produced 5that contained less than 20 TEL additive (1 of 19 samples) At a reduction of 15 and
uction (same of the
10 only 11 of the prod would be in spec 2 fuels 19) This is far
versa This is likely due to the influence of the third component the base alkylate for
o A question was raised that 108 as an MON seemed unlikely With this data point removed the mean was still 1037 and the new maximum was 1076
tent was 040gL and the median was 043 The maximum
10
11 d had a reported MON of greater than 102 sixty percent had an MON greater than 103 and thirty-two percent were
This res search Program at the William J Hughes Technical Center in Atlantic City New Jersey by Baere Aerospace Consulting IMartin NISC B
below the group percentages and indicates that this refinery would likely be unable to meet a lead reduction with current production
6 A review of the data by region and by refinery showed no relationship with the amounts of lead used with the exception of refinery H
7 While there was limited aromatic information available there did not appear to be any relationship between the amount of lead used and the amount of aromatics used Said another way there did not appear to be high lead required with low aromatics or vice
which there is no information
8 The mean MON value was 1037 The maximum was 108 and the minimum excluding a sample set made for the ULL study was 1016
o Of the 15 certification fuel samples the mean MON value was 1038 The maximum value was 1076 and the minimum was1011
9 The mean elemental lead content was 047gL and the median was 048gL The maximum was 056gL and the minimum excluding the ULL study set was 034 gL
o Of the 15 certification samples excluding the blended test samples the mean elemental lead conlead content was 060 gL and the minimum was 008gL
The mean elemental lead content of all analyzed samples excluding blend samples was 046gL This value is 82 of the maximum lead level permitted (046 056)
Eighty-seven percent (87) of the samples reviewe
greater than 104 Only five percent were higher than 105
earch was funded by the Federal Aviation Administrations Fuels Re
nc for Crown Consulting Inc under Purchase Order 7200006107 from Lockheed II ridge Contract DTFAWA-08-C-00009 with the Federal Aviation Administration
Page 35 of 50 Version 40 Oct 14 2010
ConteSummar
Discussio
Backg
Sa
Reg 37
Lead
Oth
Develo ion Levels 39
Analysis
Combined Data 40
By Region
By Refinery
From Engine C 42
Conc
Annex ndash 44
Figure 1 ndash US TiFigure 2 ndash Table 38 Figu 44 Figure 4 ndash Lead Content vs Aromatic Content Including Engine Cert 45 FiguFigure 6Fuels 47 igure 7 ndash Lead Content vs Aromatic Content by Blinded Refinery Including Engine Cert Data 48
nts y 34
n 37
round 37
mple Handling 37
ion Identifier
MON Values from Aviation Lean Ratings 38
Content 39
er Data Sources 39
pment of Max Lead for Reduct
39
40
401
ertification Fuels
lusions 43
Graphical Representations of the Data
me Zones 38 9 from ASTM D‐2700
re 3 ndash Supercharge rating vs Motor Octane Number vs Lead content Including Engine Cert
re 5 ndash Lead Content vs Aromatic Content by Region for CoArsquos Excluding Engine Cert Fuels46 ndash Motor Octane Number vs Lead Content by Region for CoArsquos Excluding Engine Cert
FFigure 8 ndash Motor Octane Number vs Lead Content by Refinery Including Engine Cert 49 Figure 9 ndash Motor Octane Number vs Lead Content Specific to the Engine Certification Fuel 50
Page 36 of 50 Version 40 Oct 14 2010
Discussion
Background
PA issued an advanced notice of proposed rulemaking and requested input on data
reducing the amount of lead used in current compliant fuel formulations was considered as a
opadspaviation com The refiners seemed uncomfortable providing an assessment of their formulas and their current leaddiscouleadthe actu The third activity was a review of the CoArsquos for currently supplied fuel The hypothesis was that
ability to produce fuel with lower than maximum lead This collection was accomplished by resethfromanufath
nalysis were collected as copies from the FBOrsquos where fuel was purchased he FBOrsquos were selected randomly The data from the certificates were entered into a
In 2010 the Egaps As part of the Industry Stakeholders FAST plan to respond to the EPA the possibility of
near-term means of responding In the short time available several options for evaluating this tion were proposed 1) having the refiners report on their current ability to reduce their lead ditive levels and meet specification 2) having refiners blend very low lead (VLL) fuel meeting ecification and have it tested and 3) review current Certificates of Analysis available in the
munity and assess the actual lead content of current compliant fuels
additive levels Several of the refiners did agree to blend VLL formulas but there was rse over time regarding whether the refiners should take current formulas and just add less
and see what resulted or whether they should adjust the rest of the formula to maintain all of specified properties The activity was further complicated by the length of time necessary to ally blend the fuel and then test it
this was fuel that was currently produced If it had lower than maximum lead it indicated the
presentatives from the FAA Technical Center requesting and collecting CoArsquos from a random lection of Fixed Based Operations (FBOrsquos) In some cases fuel samples were collected from e FBO and specifically analyzed by an independent laboratory In addition to the data collected m FBO fuels the laboratory analyses from the certification fuels used by the engine
cturers and data from the NEG analyses were collected This data was compiled and en analyzed and is the topic of this report
Sample Handling The certificates of aTspreadsheet For those fuels collected from the FBOrsquos the laboratory data sheets were used as the source of the data The data was entered as provided no entries being made where data was not provided The only exception was for the values of MON and lead content as indicated below Each sample also had its refinery identity blinded such that the data could be sorted based on the refinery but so the refinersrsquo identification was not included in the data set
Region Identifier Each refinery listed was given a regional ID by using the US time zones based on the location of the refinery In some cases the location of the refinery was overtly provided In other cases it was inferred based on the primary location of a companyrsquos refinery For example one company had two locations at which they produced aviation gasoline both in the same time zone Thus any sample from this company could reasonably be placed in a time zone Each location was given a number based on the zones as shown in Figure 1 The small numbers of global aviation gasoline samples were just coded as ldquoglobalrdquo
Page 37 of 50 Version 40 Oct 14 2010
(MON) using Table 9 found in ASTM D-2700-09 and produced in
Figure 1 ndash US Time Zones
MON Values from Aviation Lean Ratings Some of the CoArsquos provided the octane performance as aviation lean ratings These were converted to motor octane numbers reFigure 2 The aviation lean rating was found on the table and the equivalent MON read off of the axes Where necessary the value was interpolated An example is shown in Figure 2 for a lean rating of 11228 being converted to a MON of 1042 Note that a MON of 100 is equivalent to a performance number of 1017 A performance number of 100 results in a MON value of 998
123
4
Figure 2 ndash Table 9 from ASTM D‐2700
Page 38 of 50 Version 40 Oct 14 2010
Page 39 of 50 Version 40 Oct 14 2010
For the were converted to a uniform unit of grams milliliters of TEL the conversion factor as lead in gallons these values were co
Other DataIn additio was included as a separate entry These data ed to confirm inter-laboratory
as average values with the
Data were also provided from engine manufacturers from their engine certification trials These d fuels blended specifically as test fuels
analysis
idual fuels that would have met the maximum levels was counted and reported It s meeting specification it was an indication that
with the indicated levels that met specification he larger population within an acceptable level
located in the Annex located at the end of the ction levels the 20 reduction is indicated by a
nge line
is analysis the analyst has only the values as of Analysis from which to perform the analysis The sole purpose of
this analysis was to determine whether there are currently fuels in the distribution network meeting minimum D910 cation with a lower than maximum permitted lead content It is not intended to be an analysis of the cushion in MON The values used in this analysis including MON are as provided For MON the values are either directly repo N or have been converted from values provided as Aviation Number Ratings (lean ratings) to MON The analyst has in good faith assumed the refiner providing the data via a CoA has provided correct data The analyst is not in a position to second guess correct reporting from incorrect reporting With respect to MONperformance number if 108 is assumed to be wrong what about 106 Or 105 Or 102 If part of the data is assumed to be incorrect then all of the data should be assumed to be incorrect
Lead Content
purpose of analysis all of the provided lead contents of lead per liter (gPbL) For lead contents provided as
of 1mL TEL = 10589 g Pb was used For those providednverted to liters 1 US gallon = 3785 liters
Sources n to the data from CoArsquos data from the NEG data
are averaged values from a set of samples usrepeatability of specification testing These data were providedrefinery information purged prior to receipt
data included both generic fuel procured for the test anOnly the actual aviation gasoline data were used for the
Development of Max Lead for Reduction Levels In order to assess the maximum reduction level that might be achieved the maximum lead content for each of three reduction levels was computed The reductions considered were 20 15 and 10 reduction from current maximum lead content permitted by specification This correlated to maximum elemental lead levels of 045 gPbL 048 and 051 For the analysis the
umber of indivnwas assumed that a) because these were fuelindividual refiners could currently produce fuels and b) that the small sample set would replicate t
Analysis For the following evaluations all of the charts are document For charts indicating the lead redupurple line and the 15 reduction indicated by an ora
Caveat on MON data With respect to the MON values reported in thprovided by the Certificates
specifi
rted as MO
Furthermore because the values of MON and rating numbers converge around 100 and 100 ne considered for compliance to specification the conclusions in this report are
by using incorrect MON data around or above 100 The extent of the
on may be warranted within the aviation gasoline producing industry
results of this analysis to make any assessments garding the formulation of aviation gasoline the relationships between lead and MON or the
aluate whether there was any bservable correlation between the supercharge rating the motor octane number and the lead
alues showed observable variations
s indicating the 20 reduction (purple) and the 15 reduction (orange) m TEL level are included on the graph This visually indicates the observation that
t This is not a weighted average atches of fuel is available
ecause it is known that refiners have basically three major building blocks with which to achieve
ount of lead used In some cases the
region of the country at which e fuel was produced the data were separated by regions based on time zones and then sorted
MON is the baseliot significantly impactedn
exceedance of MON to specification minimum is neither the purpose of this effort nor has any impact on the analysis towards the actual purpose a survey of how much lead is being used in currently delivered 100LL Reporting the MON serves only to confirm the fuels did meet specification independent of the amount of lead additive used and the MON data serves no other purpose in this analysis Therefore while discussiregarding the accuracy of the CoA sheets the actual status of the MON values has no substantive impact on the conclusions drawn for this report Readers are discouraged from using the recushion in MON for production
Combined Data The first exercise after completion of the datasets was to evocontent of the fuel Figure 3 ndash Supercharge rating and Motor Octane Number vs Lead content Including Engine Cert Figure 3 ndash Supercharge rating and Motor Octane Number vs Lead content Including Engine Cert contains all of the data from the CoArsquos the NEG data and the engine certification data excluding blended experimental samples This analysis was done to see if there was any indication of a correlation between observable variations in the supercharge rating and the motor octane number with changes in lead content No correlations were observed All of the MON values were reasonably consistent while the leadv In addition to the data line
the maximuinwas mathematically calculated that between 33 and 40 of the samples would meet the 20 reduction in maximum TEL content About 50 of the samples would meet 15 reduction in maximum TEL and 64 would meet 10 reduction in maximum TEL These values remained relatively constant as additional data was included in the dataseas no data on the size of the individual b Bthe desired MON and supercharge rating ie the alkylate the lead and the aromatic content it was desirous to evaluate any relationships between the building blocks No information was available for the alkylate type or quality so the relationship between aromatic content and lead content was evaluated This is shown graphically in Figure 4 Unfortunately few of the datasheets included a value for aromatic content For those samples that did there appeared to
e no correlation between the aromatic content and the amblead and aromatic were relatively higher together as compared to other samples and in other cases samples with high lead had low aromatics This was most likely due to differences in the type of alkylate used No correlation could be drawn from these data By Region
an attempt to determine if there were any trends based on theInth
Page 40 of 50 Version 40 Oct 14 2010
based on these regions The data were again graphed to evaluate lead content versus aromatic content by region excluding the engine certification data Because of the method for procuring the data the majority of the samples that could have a region attributed to them were from region one and two An attempt to identify whether aromatics were used more prevalently in a specific region was also made The data was graphed comparing aromatic content to lead content by region and is shown in Figure 5 Again the analysis was hampered by a lack of aromatic content data Those amples having aromatic content were primarily in data that could not be attributed to a region
he MON vs Lead was graphed and is shown in Figure 6 In general there was just as much
d to a specific region had similar variability in the data The samples attributed to non-US manufacturers ldquoglobalrdquo did have nearly exactly 100 MON values
ng prepared specifically for an ULL test
ould not continue to produce fuel could account for the
20 reduction 47 of the me and a 15 reduction about 53 of the time Further analysis of the use of lead by refinery
wo of the refineries with two and four samples respectively could meet the
sThe three global samples did show higher aromatic content but these were fuel samples blended specifically to be ULL samples Tvariability in both the MON and the lead content in regions one and two Regions three and four had similar sample values however with only two data points no conclusion can be reasonably drawn The data not attribute
but this was due to bei Again no trends in the data by region for either the MON vs Lead or the Aromatics vs Lead were observed with one possible exception There did appear to be slightly higher lead used in region two This however is likely explained by a review of the data by refinery presented in the next section
By Refinery There is a concern that a decision to reduce the maximum lead content may result in single refineries being unable or unwilling to continue to produce aviation gasoline Even if 40 of the refineries sampled are capable of producing spec fuel with lower lead there is a concern that it is
ossible that one of the 60 that wpmajority of the aviation gasoline produced Unfortunately it is beyond the scope of the data and this report to comment on that risk It was possible however to evaluate the currently produced fuel by the refiner of record on the CoA This gives no information on the refinerrsquos abilities to produce fuel of a lower lead content over time but it does give information on the existence of fuel produced by a refiner with lower lead contents at individual points in time There is also no data available on the sizes of the individual batches meaning no assessment of the impact of losing one refinery would have on the overall fuel production levels A review of the aromatic content by refiner shown in Figure 7 again showed too little aromatic data to be of value drawing conclusions However a review of the MON vs Lead data showed graphically in Figure 8 indicates there is a strong correlation in lead content for one of the blinded refineries The refinery indicated by ldquoHrdquo showed the routine use of nearly maximum TEL In only one instance was less than 045gPbL used and that instance correlated to a lower MON content at the same time For the dataset reviewed this refinery accounted for nearly one quarter of the fuel samples considered It is not known if this relationship is comparable to the industry position for the refinery Two of the refineries accounted for just under half of the samples reviewed One was refinery ldquoHrdquo
lready discussed The second was refinery ldquoCrdquo which could meet theatiindicated that t
Page 41 of 50 Version 40 Oct 14 2010
045gPbL limit with all their samples These two refineries only accounted for 8 of the samples reviewed and accounted for only six samples Refinery D with four samples could meet the 15 reduction with all the provided samples The breakdown of the remaining refineries is shown below in Table 1 Refinery Number
Table 1 ndash Refinery versus ability to produce lower lead in spec aviation gasoline
From Engine Certification Fuels
content was 040gPbL which was lightly lower than the general data
In addition to reviewing the fuels as an agglomeration the fuels were also reviewed specific to the dataset provided on the fuels used for engine certifications It was noted that not all of this data included any lead content data however all of the data including the blended test fuels provided MON values or Aviation Lean Rating values that were converted to MON Of the 15 samples provided 9 of them included a lead content This data is provided graphically in Figure 9 The maximum elemental lead content indicated for the engine certification fuels was 060gL which is out of specification high The minimum value indicated was 008gL This may have been a typographical error as it was reported to be 029gPbgal which would have been more in line with other data as 029gPbL As entered the mean leads This dataset like the industry dataset indicated a similar breakdown of approximately 40 being able to meet the 20 reduction 67 meeting the 15 reduction and 67 meeting the 10 reduction
Page 42 of 50 Version 40 Oct 14 2010
Page 43 of 50 Version 40 Oct 14 2010
ased on the review of the provided data five basic conclusions can be drawn
1 Ba n t 13 s cuproduced are l n ctspecification lead levels At a 15 reduction approximately frac12 would meet spec
2 The primary supplier of repre nting 24 of the dreduction of t lead level his supplier met axi adreduction in 11 of the sa
3 There doe ar t be a relation p between r s an co xcthe impact of the single i ry on th r gion da
4 No obvious relationship e drawn based on the le arlack of lead data and no information on alkylates There were instances of high lead with
a Similarly no relationship was found between the lead level and the motor octane number or the supercharge rating
had motor octane values higher than 102 and 60 er than 105
Conclusions B
sed on a agglomeration of the sampbelow the
le dataead conte
about at a 20
of the sampleredu
rrently current maximum ion over
fuel se ataset could not meet a 20 he maximum T the m mum le level at a 15
mples
s not appe o shi egion d lead ntent e luding ref ne e e ta
can b ad and omatics data due to the
high aromatics and low lead with high aromatics
5 Of the samples reviewed over 87were over 103 Only 5 were high
Annex ndash Graphical Representations of the Data
000
010
020
030
040
050
060
070
M ne berotor Octa Num
0
20
40
60
80
100
120
140008
034
036
039
039
041
041
041
041
042
043
044
044
044
045
047
048
048
048
049
050
050
051
052
053
053
053
053
053
054
056
MON and Supercharge
Lead content gL
Motor Octane and upercharg s d
052
S
053
053
e v
053
LeaSuperNumb
c e Performance ehargr
Rating
Lead co t Lnten g Pb
Linear or Octane Number)(Mot
053
060
gPbL
20 reduction from Max TEL (M045 gL)
ax 15 re(Max
duction fro48 gL)
m EL0
Max T
Figure 3 ndash Supercharge rating and Motor Octane Number vs Lead con ng tent Includi Engine Cert
Page 44 of 50 Version 40 Oct 14 2010
000
010
020
030
040
050
060
070
0
2
4
6
8
10
12
14
16
18
20008
034
036
039
039
041
041
041
041
042
043
044
044
044
045
047
048
048
048
049
050
050
051
052
052
053
053
053
053
053
053
053
053
053
054
056
060
Lead
Content gL
Aromatic Content Vol
gPbL
Aromatic Content vs LeadAromatic Content Vol Lead content g PbL
igure 4 ndash Lead Content vs Aromatic Content Including Engine Cert F
MON vs Lead by RegionMotor Octane NumberLead content g PbL
20 Reduction in
Figure 6 ndash Motor Octane Number vs Lead Content by Region for CoArsquos Excluding Engine Cert Fuels
Page 47 of 50 Version 40 Oct 14 2010
000
010
020
030
040
050
060
A C C C C C C C C C C C C C C C C C D D D D D H H H H H H H H H H H H H H H H H H H I L L MMMMP P P P P P P P P P P P P S S S S X X X X X X X X X L L
0
2
4
6
8
10
12
14
16
18
20Lead
Content gL
Blinded Refinery
Aromatic Content
Lead vs Aromatic by Refinery Lead content g PbLAromatic Content Vol
20 reduction from Max TEL
15 reduction from Max TEL
Figure 7 ndash Lead Content vs Aromatic Content by Blinded Refinery Including Engine Cert Data
Page 48 of 50 Version 40 Oct 14 2010
000
010
020
030
040
050
060
070
080
090
100
95
97
99
101
103
105
107
109
A C C C C C C C C C C C C C C C C C D D D D D H H H H H H H H H H H H H H H H H H H I L L MMMMP P P P P P P P P P P P P S S S S X X X X X X X X X L L L
Lead
gL
MON Rating
MON vs Lead by RefineryMotor Octane NumberLead content g PbL
20 reduction from Max TEL
Figure 8 ndash Motor Octane Number vs Lead Content by Refinery Including Engine Cert
Figure 9 ndash Motor Octane Number vs Lead Content Specific to the Engine Certification Fuel
Page 50 of 50 Version 40 Oct 14 2010
INVESTIGATION OF
REDUCED TEL CONTENT
IN COMMERCIAL100LL AVGAS
Summary
Discussion
Background
Sample Handling
Region Identifier
MON Values from Aviation Lean Ratings
Lead Content
Other Data Sources
Development of Max Lead for Reduction Levels
Analysis
Caveat on MON data
Combined Data
By Region
By Refinery
From Engine Certification Fuels
Conclusions
Annex ndash Graphical Representations of the Data
Discussion
Background
PA issued an advanced notice of proposed rulemaking and requested input on data
reducing the amount of lead used in current compliant fuel formulations was considered as a
opadspaviation com The refiners seemed uncomfortable providing an assessment of their formulas and their current leaddiscouleadthe actu The third activity was a review of the CoArsquos for currently supplied fuel The hypothesis was that
ability to produce fuel with lower than maximum lead This collection was accomplished by resethfromanufath
nalysis were collected as copies from the FBOrsquos where fuel was purchased he FBOrsquos were selected randomly The data from the certificates were entered into a
In 2010 the Egaps As part of the Industry Stakeholders FAST plan to respond to the EPA the possibility of
near-term means of responding In the short time available several options for evaluating this tion were proposed 1) having the refiners report on their current ability to reduce their lead ditive levels and meet specification 2) having refiners blend very low lead (VLL) fuel meeting ecification and have it tested and 3) review current Certificates of Analysis available in the
munity and assess the actual lead content of current compliant fuels
additive levels Several of the refiners did agree to blend VLL formulas but there was rse over time regarding whether the refiners should take current formulas and just add less
and see what resulted or whether they should adjust the rest of the formula to maintain all of specified properties The activity was further complicated by the length of time necessary to ally blend the fuel and then test it
this was fuel that was currently produced If it had lower than maximum lead it indicated the
presentatives from the FAA Technical Center requesting and collecting CoArsquos from a random lection of Fixed Based Operations (FBOrsquos) In some cases fuel samples were collected from e FBO and specifically analyzed by an independent laboratory In addition to the data collected m FBO fuels the laboratory analyses from the certification fuels used by the engine
cturers and data from the NEG analyses were collected This data was compiled and en analyzed and is the topic of this report
Sample Handling The certificates of aTspreadsheet For those fuels collected from the FBOrsquos the laboratory data sheets were used as the source of the data The data was entered as provided no entries being made where data was not provided The only exception was for the values of MON and lead content as indicated below Each sample also had its refinery identity blinded such that the data could be sorted based on the refinery but so the refinersrsquo identification was not included in the data set
Region Identifier Each refinery listed was given a regional ID by using the US time zones based on the location of the refinery In some cases the location of the refinery was overtly provided In other cases it was inferred based on the primary location of a companyrsquos refinery For example one company had two locations at which they produced aviation gasoline both in the same time zone Thus any sample from this company could reasonably be placed in a time zone Each location was given a number based on the zones as shown in Figure 1 The small numbers of global aviation gasoline samples were just coded as ldquoglobalrdquo
Page 37 of 50 Version 40 Oct 14 2010
(MON) using Table 9 found in ASTM D-2700-09 and produced in
Figure 1 ndash US Time Zones
MON Values from Aviation Lean Ratings Some of the CoArsquos provided the octane performance as aviation lean ratings These were converted to motor octane numbers reFigure 2 The aviation lean rating was found on the table and the equivalent MON read off of the axes Where necessary the value was interpolated An example is shown in Figure 2 for a lean rating of 11228 being converted to a MON of 1042 Note that a MON of 100 is equivalent to a performance number of 1017 A performance number of 100 results in a MON value of 998
123
4
Figure 2 ndash Table 9 from ASTM D‐2700
Page 38 of 50 Version 40 Oct 14 2010
Page 39 of 50 Version 40 Oct 14 2010
For the were converted to a uniform unit of grams milliliters of TEL the conversion factor as lead in gallons these values were co
Other DataIn additio was included as a separate entry These data ed to confirm inter-laboratory
as average values with the
Data were also provided from engine manufacturers from their engine certification trials These d fuels blended specifically as test fuels
analysis
idual fuels that would have met the maximum levels was counted and reported It s meeting specification it was an indication that
with the indicated levels that met specification he larger population within an acceptable level
located in the Annex located at the end of the ction levels the 20 reduction is indicated by a
nge line
is analysis the analyst has only the values as of Analysis from which to perform the analysis The sole purpose of
this analysis was to determine whether there are currently fuels in the distribution network meeting minimum D910 cation with a lower than maximum permitted lead content It is not intended to be an analysis of the cushion in MON The values used in this analysis including MON are as provided For MON the values are either directly repo N or have been converted from values provided as Aviation Number Ratings (lean ratings) to MON The analyst has in good faith assumed the refiner providing the data via a CoA has provided correct data The analyst is not in a position to second guess correct reporting from incorrect reporting With respect to MONperformance number if 108 is assumed to be wrong what about 106 Or 105 Or 102 If part of the data is assumed to be incorrect then all of the data should be assumed to be incorrect
Lead Content
purpose of analysis all of the provided lead contents of lead per liter (gPbL) For lead contents provided as
of 1mL TEL = 10589 g Pb was used For those providednverted to liters 1 US gallon = 3785 liters
Sources n to the data from CoArsquos data from the NEG data
are averaged values from a set of samples usrepeatability of specification testing These data were providedrefinery information purged prior to receipt
data included both generic fuel procured for the test anOnly the actual aviation gasoline data were used for the
Development of Max Lead for Reduction Levels In order to assess the maximum reduction level that might be achieved the maximum lead content for each of three reduction levels was computed The reductions considered were 20 15 and 10 reduction from current maximum lead content permitted by specification This correlated to maximum elemental lead levels of 045 gPbL 048 and 051 For the analysis the
umber of indivnwas assumed that a) because these were fuelindividual refiners could currently produce fuels and b) that the small sample set would replicate t
Analysis For the following evaluations all of the charts are document For charts indicating the lead redupurple line and the 15 reduction indicated by an ora
Caveat on MON data With respect to the MON values reported in thprovided by the Certificates
specifi
rted as MO
Furthermore because the values of MON and rating numbers converge around 100 and 100 ne considered for compliance to specification the conclusions in this report are
by using incorrect MON data around or above 100 The extent of the
on may be warranted within the aviation gasoline producing industry
results of this analysis to make any assessments garding the formulation of aviation gasoline the relationships between lead and MON or the
aluate whether there was any bservable correlation between the supercharge rating the motor octane number and the lead
alues showed observable variations
s indicating the 20 reduction (purple) and the 15 reduction (orange) m TEL level are included on the graph This visually indicates the observation that
t This is not a weighted average atches of fuel is available
ecause it is known that refiners have basically three major building blocks with which to achieve
ount of lead used In some cases the
region of the country at which e fuel was produced the data were separated by regions based on time zones and then sorted
MON is the baseliot significantly impactedn
exceedance of MON to specification minimum is neither the purpose of this effort nor has any impact on the analysis towards the actual purpose a survey of how much lead is being used in currently delivered 100LL Reporting the MON serves only to confirm the fuels did meet specification independent of the amount of lead additive used and the MON data serves no other purpose in this analysis Therefore while discussiregarding the accuracy of the CoA sheets the actual status of the MON values has no substantive impact on the conclusions drawn for this report Readers are discouraged from using the recushion in MON for production
Combined Data The first exercise after completion of the datasets was to evocontent of the fuel Figure 3 ndash Supercharge rating and Motor Octane Number vs Lead content Including Engine Cert Figure 3 ndash Supercharge rating and Motor Octane Number vs Lead content Including Engine Cert contains all of the data from the CoArsquos the NEG data and the engine certification data excluding blended experimental samples This analysis was done to see if there was any indication of a correlation between observable variations in the supercharge rating and the motor octane number with changes in lead content No correlations were observed All of the MON values were reasonably consistent while the leadv In addition to the data line
the maximuinwas mathematically calculated that between 33 and 40 of the samples would meet the 20 reduction in maximum TEL content About 50 of the samples would meet 15 reduction in maximum TEL and 64 would meet 10 reduction in maximum TEL These values remained relatively constant as additional data was included in the dataseas no data on the size of the individual b Bthe desired MON and supercharge rating ie the alkylate the lead and the aromatic content it was desirous to evaluate any relationships between the building blocks No information was available for the alkylate type or quality so the relationship between aromatic content and lead content was evaluated This is shown graphically in Figure 4 Unfortunately few of the datasheets included a value for aromatic content For those samples that did there appeared to
e no correlation between the aromatic content and the amblead and aromatic were relatively higher together as compared to other samples and in other cases samples with high lead had low aromatics This was most likely due to differences in the type of alkylate used No correlation could be drawn from these data By Region
an attempt to determine if there were any trends based on theInth
Page 40 of 50 Version 40 Oct 14 2010
based on these regions The data were again graphed to evaluate lead content versus aromatic content by region excluding the engine certification data Because of the method for procuring the data the majority of the samples that could have a region attributed to them were from region one and two An attempt to identify whether aromatics were used more prevalently in a specific region was also made The data was graphed comparing aromatic content to lead content by region and is shown in Figure 5 Again the analysis was hampered by a lack of aromatic content data Those amples having aromatic content were primarily in data that could not be attributed to a region
he MON vs Lead was graphed and is shown in Figure 6 In general there was just as much
d to a specific region had similar variability in the data The samples attributed to non-US manufacturers ldquoglobalrdquo did have nearly exactly 100 MON values
ng prepared specifically for an ULL test
ould not continue to produce fuel could account for the
20 reduction 47 of the me and a 15 reduction about 53 of the time Further analysis of the use of lead by refinery
wo of the refineries with two and four samples respectively could meet the
sThe three global samples did show higher aromatic content but these were fuel samples blended specifically to be ULL samples Tvariability in both the MON and the lead content in regions one and two Regions three and four had similar sample values however with only two data points no conclusion can be reasonably drawn The data not attribute
but this was due to bei Again no trends in the data by region for either the MON vs Lead or the Aromatics vs Lead were observed with one possible exception There did appear to be slightly higher lead used in region two This however is likely explained by a review of the data by refinery presented in the next section
By Refinery There is a concern that a decision to reduce the maximum lead content may result in single refineries being unable or unwilling to continue to produce aviation gasoline Even if 40 of the refineries sampled are capable of producing spec fuel with lower lead there is a concern that it is
ossible that one of the 60 that wpmajority of the aviation gasoline produced Unfortunately it is beyond the scope of the data and this report to comment on that risk It was possible however to evaluate the currently produced fuel by the refiner of record on the CoA This gives no information on the refinerrsquos abilities to produce fuel of a lower lead content over time but it does give information on the existence of fuel produced by a refiner with lower lead contents at individual points in time There is also no data available on the sizes of the individual batches meaning no assessment of the impact of losing one refinery would have on the overall fuel production levels A review of the aromatic content by refiner shown in Figure 7 again showed too little aromatic data to be of value drawing conclusions However a review of the MON vs Lead data showed graphically in Figure 8 indicates there is a strong correlation in lead content for one of the blinded refineries The refinery indicated by ldquoHrdquo showed the routine use of nearly maximum TEL In only one instance was less than 045gPbL used and that instance correlated to a lower MON content at the same time For the dataset reviewed this refinery accounted for nearly one quarter of the fuel samples considered It is not known if this relationship is comparable to the industry position for the refinery Two of the refineries accounted for just under half of the samples reviewed One was refinery ldquoHrdquo
lready discussed The second was refinery ldquoCrdquo which could meet theatiindicated that t
Page 41 of 50 Version 40 Oct 14 2010
045gPbL limit with all their samples These two refineries only accounted for 8 of the samples reviewed and accounted for only six samples Refinery D with four samples could meet the 15 reduction with all the provided samples The breakdown of the remaining refineries is shown below in Table 1 Refinery Number
Table 1 ndash Refinery versus ability to produce lower lead in spec aviation gasoline
From Engine Certification Fuels
content was 040gPbL which was lightly lower than the general data
In addition to reviewing the fuels as an agglomeration the fuels were also reviewed specific to the dataset provided on the fuels used for engine certifications It was noted that not all of this data included any lead content data however all of the data including the blended test fuels provided MON values or Aviation Lean Rating values that were converted to MON Of the 15 samples provided 9 of them included a lead content This data is provided graphically in Figure 9 The maximum elemental lead content indicated for the engine certification fuels was 060gL which is out of specification high The minimum value indicated was 008gL This may have been a typographical error as it was reported to be 029gPbgal which would have been more in line with other data as 029gPbL As entered the mean leads This dataset like the industry dataset indicated a similar breakdown of approximately 40 being able to meet the 20 reduction 67 meeting the 15 reduction and 67 meeting the 10 reduction
Page 42 of 50 Version 40 Oct 14 2010
Page 43 of 50 Version 40 Oct 14 2010
ased on the review of the provided data five basic conclusions can be drawn
1 Ba n t 13 s cuproduced are l n ctspecification lead levels At a 15 reduction approximately frac12 would meet spec
2 The primary supplier of repre nting 24 of the dreduction of t lead level his supplier met axi adreduction in 11 of the sa
3 There doe ar t be a relation p between r s an co xcthe impact of the single i ry on th r gion da
4 No obvious relationship e drawn based on the le arlack of lead data and no information on alkylates There were instances of high lead with
a Similarly no relationship was found between the lead level and the motor octane number or the supercharge rating
had motor octane values higher than 102 and 60 er than 105
Conclusions B
sed on a agglomeration of the sampbelow the
le dataead conte
about at a 20
of the sampleredu
rrently current maximum ion over
fuel se ataset could not meet a 20 he maximum T the m mum le level at a 15
mples
s not appe o shi egion d lead ntent e luding ref ne e e ta
can b ad and omatics data due to the
high aromatics and low lead with high aromatics
5 Of the samples reviewed over 87were over 103 Only 5 were high
Annex ndash Graphical Representations of the Data
000
010
020
030
040
050
060
070
M ne berotor Octa Num
0
20
40
60
80
100
120
140008
034
036
039
039
041
041
041
041
042
043
044
044
044
045
047
048
048
048
049
050
050
051
052
053
053
053
053
053
054
056
MON and Supercharge
Lead content gL
Motor Octane and upercharg s d
052
S
053
053
e v
053
LeaSuperNumb
c e Performance ehargr
Rating
Lead co t Lnten g Pb
Linear or Octane Number)(Mot
053
060
gPbL
20 reduction from Max TEL (M045 gL)
ax 15 re(Max
duction fro48 gL)
m EL0
Max T
Figure 3 ndash Supercharge rating and Motor Octane Number vs Lead con ng tent Includi Engine Cert
Page 44 of 50 Version 40 Oct 14 2010
000
010
020
030
040
050
060
070
0
2
4
6
8
10
12
14
16
18
20008
034
036
039
039
041
041
041
041
042
043
044
044
044
045
047
048
048
048
049
050
050
051
052
052
053
053
053
053
053
053
053
053
053
054
056
060
Lead
Content gL
Aromatic Content Vol
gPbL
Aromatic Content vs LeadAromatic Content Vol Lead content g PbL
igure 4 ndash Lead Content vs Aromatic Content Including Engine Cert F
MON vs Lead by RegionMotor Octane NumberLead content g PbL
20 Reduction in
Figure 6 ndash Motor Octane Number vs Lead Content by Region for CoArsquos Excluding Engine Cert Fuels
Page 47 of 50 Version 40 Oct 14 2010
000
010
020
030
040
050
060
A C C C C C C C C C C C C C C C C C D D D D D H H H H H H H H H H H H H H H H H H H I L L MMMMP P P P P P P P P P P P P S S S S X X X X X X X X X L L
0
2
4
6
8
10
12
14
16
18
20Lead
Content gL
Blinded Refinery
Aromatic Content
Lead vs Aromatic by Refinery Lead content g PbLAromatic Content Vol
20 reduction from Max TEL
15 reduction from Max TEL
Figure 7 ndash Lead Content vs Aromatic Content by Blinded Refinery Including Engine Cert Data
Page 48 of 50 Version 40 Oct 14 2010
000
010
020
030
040
050
060
070
080
090
100
95
97
99
101
103
105
107
109
A C C C C C C C C C C C C C C C C C D D D D D H H H H H H H H H H H H H H H H H H H I L L MMMMP P P P P P P P P P P P P S S S S X X X X X X X X X L L L
Lead
gL
MON Rating
MON vs Lead by RefineryMotor Octane NumberLead content g PbL
20 reduction from Max TEL
Figure 8 ndash Motor Octane Number vs Lead Content by Refinery Including Engine Cert
Figure 9 ndash Motor Octane Number vs Lead Content Specific to the Engine Certification Fuel
Page 50 of 50 Version 40 Oct 14 2010
INVESTIGATION OF
REDUCED TEL CONTENT
IN COMMERCIAL100LL AVGAS
Summary
Discussion
Background
Sample Handling
Region Identifier
MON Values from Aviation Lean Ratings
Lead Content
Other Data Sources
Development of Max Lead for Reduction Levels
Analysis
Caveat on MON data
Combined Data
By Region
By Refinery
From Engine Certification Fuels
Conclusions
Annex ndash Graphical Representations of the Data
045gPbL limit with all their samples These two refineries only accounted for 8 of the samples reviewed and accounted for only six samples Refinery D with four samples could meet the 15 reduction with all the provided samples The breakdown of the remaining refineries is shown below in Table 1 Refinery Number
Table 1 ndash Refinery versus ability to produce lower lead in spec aviation gasoline
From Engine Certification Fuels
content was 040gPbL which was lightly lower than the general data
In addition to reviewing the fuels as an agglomeration the fuels were also reviewed specific to the dataset provided on the fuels used for engine certifications It was noted that not all of this data included any lead content data however all of the data including the blended test fuels provided MON values or Aviation Lean Rating values that were converted to MON Of the 15 samples provided 9 of them included a lead content This data is provided graphically in Figure 9 The maximum elemental lead content indicated for the engine certification fuels was 060gL which is out of specification high The minimum value indicated was 008gL This may have been a typographical error as it was reported to be 029gPbgal which would have been more in line with other data as 029gPbL As entered the mean leads This dataset like the industry dataset indicated a similar breakdown of approximately 40 being able to meet the 20 reduction 67 meeting the 15 reduction and 67 meeting the 10 reduction
Page 42 of 50 Version 40 Oct 14 2010
Page 43 of 50 Version 40 Oct 14 2010
ased on the review of the provided data five basic conclusions can be drawn
1 Ba n t 13 s cuproduced are l n ctspecification lead levels At a 15 reduction approximately frac12 would meet spec
2 The primary supplier of repre nting 24 of the dreduction of t lead level his supplier met axi adreduction in 11 of the sa
3 There doe ar t be a relation p between r s an co xcthe impact of the single i ry on th r gion da
4 No obvious relationship e drawn based on the le arlack of lead data and no information on alkylates There were instances of high lead with
a Similarly no relationship was found between the lead level and the motor octane number or the supercharge rating
had motor octane values higher than 102 and 60 er than 105
Conclusions B
sed on a agglomeration of the sampbelow the
le dataead conte
about at a 20
of the sampleredu
rrently current maximum ion over
fuel se ataset could not meet a 20 he maximum T the m mum le level at a 15
mples
s not appe o shi egion d lead ntent e luding ref ne e e ta
can b ad and omatics data due to the
high aromatics and low lead with high aromatics
5 Of the samples reviewed over 87were over 103 Only 5 were high
Annex ndash Graphical Representations of the Data
000
010
020
030
040
050
060
070
M ne berotor Octa Num
0
20
40
60
80
100
120
140008
034
036
039
039
041
041
041
041
042
043
044
044
044
045
047
048
048
048
049
050
050
051
052
053
053
053
053
053
054
056
MON and Supercharge
Lead content gL
Motor Octane and upercharg s d
052
S
053
053
e v
053
LeaSuperNumb
c e Performance ehargr
Rating
Lead co t Lnten g Pb
Linear or Octane Number)(Mot
053
060
gPbL
20 reduction from Max TEL (M045 gL)
ax 15 re(Max
duction fro48 gL)
m EL0
Max T
Figure 3 ndash Supercharge rating and Motor Octane Number vs Lead con ng tent Includi Engine Cert
Page 44 of 50 Version 40 Oct 14 2010
000
010
020
030
040
050
060
070
0
2
4
6
8
10
12
14
16
18
20008
034
036
039
039
041
041
041
041
042
043
044
044
044
045
047
048
048
048
049
050
050
051
052
052
053
053
053
053
053
053
053
053
053
054
056
060
Lead
Content gL
Aromatic Content Vol
gPbL
Aromatic Content vs LeadAromatic Content Vol Lead content g PbL
igure 4 ndash Lead Content vs Aromatic Content Including Engine Cert F
MON vs Lead by RegionMotor Octane NumberLead content g PbL
20 Reduction in
Figure 6 ndash Motor Octane Number vs Lead Content by Region for CoArsquos Excluding Engine Cert Fuels
Page 47 of 50 Version 40 Oct 14 2010
000
010
020
030
040
050
060
A C C C C C C C C C C C C C C C C C D D D D D H H H H H H H H H H H H H H H H H H H I L L MMMMP P P P P P P P P P P P P S S S S X X X X X X X X X L L
0
2
4
6
8
10
12
14
16
18
20Lead
Content gL
Blinded Refinery
Aromatic Content
Lead vs Aromatic by Refinery Lead content g PbLAromatic Content Vol
20 reduction from Max TEL
15 reduction from Max TEL
Figure 7 ndash Lead Content vs Aromatic Content by Blinded Refinery Including Engine Cert Data
Page 48 of 50 Version 40 Oct 14 2010
000
010
020
030
040
050
060
070
080
090
100
95
97
99
101
103
105
107
109
A C C C C C C C C C C C C C C C C C D D D D D H H H H H H H H H H H H H H H H H H H I L L MMMMP P P P P P P P P P P P P S S S S X X X X X X X X X L L L
Lead
gL
MON Rating
MON vs Lead by RefineryMotor Octane NumberLead content g PbL
20 reduction from Max TEL
Figure 8 ndash Motor Octane Number vs Lead Content by Refinery Including Engine Cert
Figure 9 ndash Motor Octane Number vs Lead Content Specific to the Engine Certification Fuel
Page 50 of 50 Version 40 Oct 14 2010
INVESTIGATION OF
REDUCED TEL CONTENT
IN COMMERCIAL100LL AVGAS
Summary
Discussion
Background
Sample Handling
Region Identifier
MON Values from Aviation Lean Ratings
Lead Content
Other Data Sources
Development of Max Lead for Reduction Levels
Analysis
Caveat on MON data
Combined Data
By Region
By Refinery
From Engine Certification Fuels
Conclusions
Annex ndash Graphical Representations of the Data
000
010
020
030
040
050
060
070
080
090
100
95
97
99
101
103
105
107
109
A C C C C C C C C C C C C C C C C C D D D D D H H H H H H H H H H H H H H H H H H H I L L MMMMP P P P P P P P P P P P P S S S S X X X X X X X X X L L L
Lead
gL
MON Rating
MON vs Lead by RefineryMotor Octane NumberLead content g PbL
20 reduction from Max TEL
Figure 8 ndash Motor Octane Number vs Lead Content by Refinery Including Engine Cert