92
ANALYST PACK RELEASE DATE 3 AUGUST 2017 Financial Results for the full year ended 30 June 2017 — Create a better today Suncorp Group Limited ABN 66 145 290 124

ANALYST PACK RELEASE DATE 3 AUGUST 2017
Financial Results for the full year ended 30 June 2017—
Create a better today
Suncorp Group Limited ABN 66 145 290 124
PAGE 2 FINANCIAL RESULTS FOR THE FULL YEAR ENDED 30 JUNE 2017
BASIS OF PREPARATION Suncorp Group (‘Group’, ‘the Group’, ‘the Company’ or ‘Suncorp’) is comprised of Suncorp Group Limited (SGL) and its subsidiaries, its interests in associates and jointly controlled entities. The structure of this report has been amended to align to the revised Suncorp Group operating model which took effect on 4 July 2016. The Group’s results and historical financial information are reported across three functions: Insurance (Australia), Banking & Wealth and New Zealand. Net profit after tax (NPAT) for the Group is measured in accordance with Australian Accounting Standards. Profit after tax from functions, associated ratios and key statistics are based on the segment reporting disclosures that follow Suncorp’s revised operating model. All figures have been quoted in Australian dollars rounded to the nearest million unless otherwise denoted. The New Zealand section reports the Profit Contribution table in both A$ and NZ$ and all other New Zealand tables and commentary in NZ$. All figures relate to the full year ended 30 June 2017 and comparatives are for the full year ended 30 June 2016, unless otherwise stated. Where necessary, comparatives have been restated to reflect any changes in table formats or methodology. In financial summary tables, where there has been a percentage movement greater than 500% or less than (500%), this has been labelled ‘large’. If a line item changes from negative to positive (or vice versa) between periods, this has been labelled ‘n/a’. This report has not been audited nor reviewed in accordance with Australian Auditing Standards. It should be read in conjunction with the Group’s consolidated annual and interim financial reports which have been either audited or reviewed in accordance with Australian Auditing Standards. In the context of ASIC’s Regulatory Guide 230, this report contains information that is ‘non-IFRS financial information’, such as the General Insurance Underlying Insurance Trading Result and the Life underlying profit after tax. The calculation of these metrics is outlined in the report and they are shown as they are used internally to determine operating performance within the various functions. This report should be read in conjunction with the definitions in Appendix 10.
DISCLAIMER This report contains general information which is current as at 3 August 2017. It is information given in summary form and does not purport to be complete. It is not a recommendation or advice in relation to the Group or any product or service offered by Suncorp or any of its subsidiaries. It is not intended to be relied upon as advice to investors or potential investors, and does not take into account the investment objectives, financial situation or needs of any particular investor. These should be considered, with or without professional advice, when deciding if an investment is appropriate. This report should be read in conjunction with all other information concerning Suncorp filed with the Australian Securities Exchange (ASX). The information in this report is for general information only. To the extent that the information may constitute forward-looking statements, the information reflects Suncorp’s intent, belief or current expectations with respect to the business and operations, market conditions, results of operations and financial condition, capital adequacy, specific provisions and risk management practices at the date of this report. Such forward-looking statements are not guarantees of future performance and involve known and unknown risks and uncertainties, many of which are beyond Suncorp’s control, which may cause actual results to differ materially from those expressed or implied. Suncorp undertakes no obligation to update any forward-looking statement to reflect events or circumstances after the date of this report (subject to ASX disclosure requirements).
REGISTERED OFFICE INVESTOR RELATIONS
Level 28, 266 George Street Andrew Dempster Brisbane Queensland 4000 Head of Investor Relations Telephone: (07) 3362 1222 Telephone: (02) 8121 9206 suncorpgroup.com.au [email protected]
FINANCIAL RESULTS FOR THE FULL YEAR ENDED 30 JUNE 2017 PAGE 3
TABLE OF CONTENTS
Basis of preparation .................................................................................................................................................... 2
Financial results and operational summary .............................................................................................................. 4
Group ............................................................................................................................................................................ 6
Result overview .......................................................................................................................................................... 6
Outlook ....................................................................................................................................................................... 7
Contribution to profit by function ................................................................................................................................. 9
Statement of financial position .................................................................................................................................. 11
Insurance (Australia) ................................................................................................................................................. 12
Result overview ........................................................................................................................................................ 12
Outlook ..................................................................................................................................................................... 14
Profit contribution and General Insurance ratios ....................................................................................................... 15
Banking & Wealth ...................................................................................................................................................... 27
Result overview ........................................................................................................................................................ 27
Outlook ..................................................................................................................................................................... 28
Profit contribution and Bank ratios ............................................................................................................................ 29
New Zealand ............................................................................................................................................................... 43
Result overview ........................................................................................................................................................ 43
Outlook ..................................................................................................................................................................... 44
Profit contribution and General Insurance ratios ....................................................................................................... 45
Group (continued) ..................................................................................................................................................... 55
Customer .................................................................................................................................................................. 55
Group capital ............................................................................................................................................................ 58
Investments .............................................................................................................................................................. 61
Dividends .................................................................................................................................................................. 63
Income tax ................................................................................................................................................................ 64
General Insurance reinsurance................................................................................................................................. 65
Appendix 1 – Consolidated statement of comprehensive income and financial position .................................. 66
Appendix 2 – Ratio calculations ............................................................................................................................... 69
Appendix 3 – Reported Underlying ITR ................................................................................................................... 73
Appendix 4 – General Insurance ITR Split............................................................................................................... 74
Appendix 5 – Group capital ...................................................................................................................................... 77
Appendix 6 – Operating expenses ........................................................................................................................... 82
Appendix 7 – Life Embedded Value ......................................................................................................................... 83
Appendix 8 – Statement of assets and liabilities .................................................................................................... 85
Appendix 9 – Life and Wealth invested shareholder assets .................................................................................. 88
Appendix 10 – Definitions ......................................................................................................................................... 89
Appendix 11 – 2017/18 key dates ............................................................................................................................. 91
GROUP
PAGE 4 FINANCIAL RESULTS FOR THE FULL YEAR ENDED 30 JUNE 2017
ANALYST PACK
FINANCIAL RESULTS SUMMARY — Group net profit after tax (NPAT) of $1,075 million (FY16: $1,038 million)
— Group top line growth of 3.6%
— Total operating expenses increased 2.9% to $2,746 million
— Cash Return on Average Shareholders’ Equity (ROE) of 8.4% (FY16: 8.2%). Statutory ROE of 7.9%
(FY16: 7.8%)
— Total ordinary dividends of 73 cents per share fully franked (FY16: 68 cents)
— Banking’s Common Equity Tier 1 (CET1) capital ratio of 9.23% and General Insurance holds CET1 of 1.32 times the Prescribed Capital Amount (PCA) are both above the top end of their target ranges
— The combined Australia and New Zealand General Insurance underlying insurance trading ratio (ITR)* was 11.5% (FY16: 10.6%) and 12.0% for the second half of the financial year
— Insurance (Australia) NPAT up 30% to $723 million (FY16: $558 million)
— Australian General Insurance gross written premium (GWP) up 3.9% to $8,111 million (FY16: $7,803 million)
— Net reserve releases of $301 million (FY16: $348 million) in Australia were well above the long-run expectation of 1.5% of net earned premium (NEP)
— Australian Life Insurance underlying profit of $53 million has remained stable (FY16: $53 million)
— Banking & Wealth NPAT was $400 million (FY16: $418 million)
— Banking lending growth of 1.9%
— Banking impairment losses of $7 million represents 1 basis point of gross loans and advances
— Wealth funds under management and administration increased 0.8% to $7,511 million (FY16: $7,452 million)
— New Zealand NPAT was A$82 million (FY16: A$183 million) impacted by the Kaikoura earthquake and associated reinsurance costs
— New Zealand General Insurance GWP increased 6.3% in NZ$ terms
— Disposal of the Autosure motor insurance business resulted in a A$30 million release of capital and a A$25 million loss on disposal in the Group non-cash items
— New Zealand Life Insurance NPAT of A$37 million (FY16: A$49 million)
— New Zealand Life Insurance in-force premiums grew 7% in NZ$ terms * Refer to page 73 for underlying ITR.

GROUP
FINANCIAL RESULTS FOR THE FULL YEAR ENDED 30 JUNE 2017 PAGE 5
ANALYST PACK
OPERATIONAL SUMMARY — Suncorp’s purpose to create a better today for its customers, shareholders, employees and
communities has been set and communicated
— The Group’s key priorities have been agreed:
— Elevate the customer
— Create the Marketplace
— Maintain momentum and grow
— Inspire our people
— Organisational structure aligned around the customer, with substantially new leadership team in place
— Key initiatives delivered include:
— Concept stores opened in Parramatta and Carindale
— Marketplace extended to embrace customer journeys and integrated offers
— the launch of white-labelled annuities and health insurance
— Money Profiles application
— Suncorp Business Toolbox
— Launch of AAMI SmartPlates
— Life Insurance offering for Austbrokers advisors
— Focus on elevating the customer is driving improved volumes and better retention
— Organic customer growth of 147,000 with a further 252,000 customers acquired through entry into the South Australian CTP scheme
— Successful remediation of Consumer claims processes with operating metrics and underlying ITR returning to target levels
— The Natural Hazards Aggregate cover provided effective protection and delivered a significant NPAT benefit. Suncorp has purchased a similar cover for the 2018 financial year
— Group’s core operating subsidiaries have retained an issuer credit rating of ‘A+/A1’ with a stable
outlook
— Discussions continue with Australian Prudential Regulation Authority (APRA) in the pursuit of Basel II Advanced Accreditation. Banking continues to operate as an Advanced Bank, with strong risk management and advanced models
— New banking platform delivering value for customers, brokers and the business as Suncorp becomes the first company globally to roll out and operate Oracle’s end-to-end loan origination, servicing and collections
— Completion of the Super Simplification Project, simplifying superannuation offerings from 43 to 10 products, outsourcing business and technology processes and consolidating legacy portfolios on a modern platform
— Suncorp’s GIO website ranked first place for Insurance in the Global Reviews 2016 Customer Experience Index. AAMI was also named as having the best online experience for life insurance customers
— Vero New Zealand was awarded Intermediated Insurance Company of the Year. New Zealand opened two SMART shops to improve average repair costs and customer turnaround times
GROUP
PAGE 6 FINANCIAL RESULTS FOR THE FULL YEAR ENDED 30 JUNE 2017
ANALYST PACK
GROUP
Result overview
For the financial year ended 30 June 2017, Suncorp Group delivered an NPAT of $1,075 million, up 3.6% and total ordinary dividends of 73 cents, up 7.4%.
The result is underpinned by Group growth of 3.6%, with momentum building over the course of the year. For the first time in several years Suncorp has reported an increase in customer numbers, with 399,000 new customers joining the Group. While top-line growth has been supported by the entry into the South Australian CTP market, early Marketplace initiatives and a focus on delivering value for customers puts the Group in a strong position entering the FY18 financial year.
Suncorp’s diversified business model provides it with multiple sources of growth. Over the past twelve months, the business has delivered:
— Insurance (Australia) GWP growth of 3.9% while Life in-force premium contracted 0.9%
— Banking & Wealth lending growth of 1.9%
— New Zealand GWP growth of 6.3% and Life in-force premium growth of 7.0%.
The improved growth profile, along with additional costs associated with the completion of the Core Banking and Superannuation platforms, has contributed to a 2.9% increase in total operating expenses.
Insurance (Australia) NPAT of $723 million was up 30% driven by improved growth, lower natural hazard costs and the continued remediation of claims cost issues in the Home and Motor portfolios.
GWP increased by 3.9% following strong growth in New South Wales CTP, premium increases in Home and Motor products and the successful entry into the South Australian CTP scheme. While Commercial insurance GWP reduced 2.2% there was evidence of an improving rate environment through the important June renewal period.
The purchase of additional reinsurance in the form of a Natural Hazards Aggregate protection (NHAP) has significantly reduced the financial impact associated with events greater than $5 million, resulting in total natural hazards costs of $655 million.
Remediating claims cost issues in the Home and Motor portfolios has been a major focus for the Group. Improvements reported in the half year to December 2016 have continued, with all operational metrics returning to sustainable levels. Although industry-wide claims inflation continues to be observed, the significant improvement in processes and controls has contributed to a General Insurance underlying ITR of 12.0% for the second half of the financial year.
Reserve releases of $301 million remain well above long-term expectations of 1.5% of Group NEP, reflecting the benign inflationary environment.
Australian Life Insurance planned margins remained stable and underlying profits were flat.
Banking & Wealth NPAT was $400 million, impacted by the additional investment in the Core Banking and Wealth platforms, both of which are crucial to support the Group strategy.
The Banking business achieved NPAT of $396 million with a focus on profitable growth while adapting to changing economic and regulatory dynamics. Lending growth of 1.9% reflected improved momentum in the second half of the financial year. NIM of 1.83% reflects targeted repricing of mortgage rates.

GROUP
FINANCIAL RESULTS FOR THE FULL YEAR ENDED 30 JUNE 2017 PAGE 7
ANALYST PACK
The cost to income ratio of 52.7% was a result of stable operating expenses and the subdued growth environment. Impairment losses reduced to $7 million, representing just 1 basis point of gross loans and advances.
The Wealth business NPAT of $4 million reflects the decision not to capitalise the cost of completing the Super Simplification Program and lower investment returns. Funds under management and administration increased by 0.8%.
New Zealand NPAT of A$82 million was impacted by claims costs associated with the Kaikoura earthquake and the associated reinsurance reinstatement expense.
New Zealand General Insurance NPAT reduced to A$45 million, however underlying ITR was above the Group’s target of 12%. GWP growth of 6.3%, in New Zealand dollar terms, was primarily driven by the Motor and Home portfolios.
New Zealand Life Insurance delivered NPAT of A$37 million with a stable underlying profit of A$39 million, offset by negative market adjustments.
During the financial year, the New Zealand business disposed of its Autosure motor insurance business. The sale resulted in a release of capital of A$30 million and will be accretive to the New Zealand long-term return on equity. A goodwill write-off of A$25 million has been included as a non-cash item in the Group result.
Dividend and capital
The Board has determined a fully franked final dividend of 40 cents per share. This brings total ordinary dividends for the 2017 financial year to 73 cents per share, up 7.4%. This represents a dividend payout ratio of 82% of cash earnings, slightly above the top end of the 60% to 80% dividend payout range, reflecting the Board’s confidence in the outlook for the Group.
After payment of the dividend, the franking account balance will be $235 million. The Group remains well capitalised with $377 million in CET1 capital held above its operating targets.
Outlook
Suncorp’s strategy is driving growth and increasing resilience to volatility. The Group is well capitalised
and has a diversified earnings base providing strong foundations and creating value for customers, shareholders, employees and communities. The ‘One Suncorp’ business model is being driven by a
substantially new leadership team.
Suncorp’s key priorities are to elevate the customer, create the Marketplace, maintain momentum and grow, and inspire our people.
Elevating the customer focusses on continuing to increase customer numbers and broadening relationships with existing customers. The Group’s operating model places customers at the centre of the Group, making experiences easy for customers, connecting them to the Marketplace and creating integrated solutions and journeys.
Creating the Marketplace by networking the brands, offering new solutions in priority segments and expanding the Group’s partner ecosystem, will enable customers to make better choices and allow them
to interact with the Group in any way they choose, driven by a digital first approach, complemented by physical and intermediary channels.
Maintaining momentum and growth is being achieved through execution of programs focused on operational excellence, portfolio optimisation, targeted growth and further strengthening the balance sheet.
GROUP
PAGE 8 FINANCIAL RESULTS FOR THE FULL YEAR ENDED 30 JUNE 2017
ANALYST PACK
Inspiring our people remains critical to the successful execution of the strategy, as the Group creates the workforce and workspace of the future.
Suncorp has commenced a group-wide Business Improvement Program (BIP) which will improve customer experience through operational excellence, removing pain points and designing innovative customer solutions. This program is expected to deliver material reductions in the Group’s cost base from
the 2019 financial year.
Given the Group’s confidence in creating significant shareholder value, Suncorp will make an additional investment of up to $100 million after-tax to deliver the key components of the Marketplace. This investment will be fully expensed in the 2018 financial year and will be reported in the ‘Other profit (loss)
after tax’ line of the Group profit and loss.
The investment will:
— Bring together for the first time a single digital experience for the entire Suncorp network through a new Suncorp Marketplace app
— Complete the Suncorp brand refresh and commence building national awareness and differentiation
— Accelerate the connection of new third party partnerships into the Marketplace to enhance speed and delivery of new services and solutions.
In the medium term, Suncorp’s key targets are:
— Broadening of customer relationships
— Improving underlying NPAT
— Delivering a sustainable ROE of at least 10%, which implies an underlying ITR of at least 12%
— A commitment to return surplus capital to shareholders and maintaining a dividend payout ratio of 60% to 80% of cash earnings.
For the 2018 financial year, the Board intends to increase the dividend payout ratio above the top end of the usual range to offset the impact on cash earnings of the additional investment to deliver key components of the Marketplace.
GROUP
FINANCIAL RESULTS FOR THE FULL YEAR ENDED 30 JUNE 2017 PAGE 9
ANALYST PACK
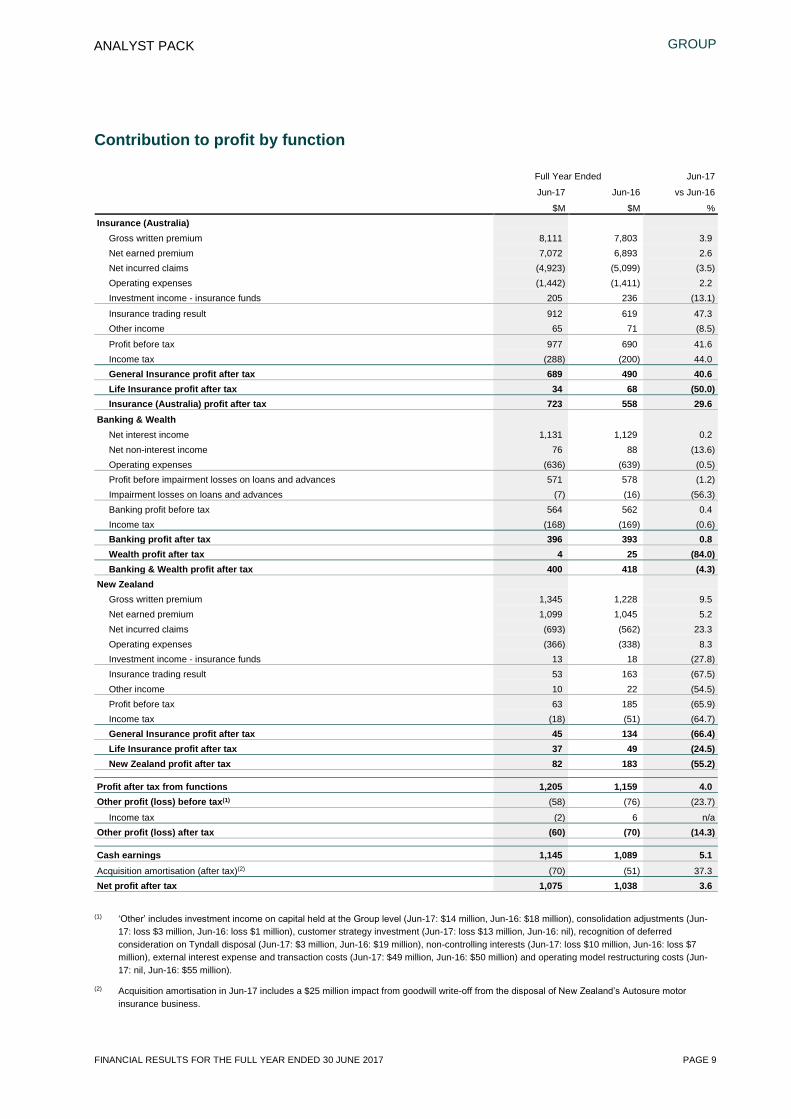
Contribution to profit by function
Full Year Ended Jun-17
Jun-17 Jun-16 vs Jun-16
$M $M % Insurance (Australia)
Gross written premium 8,111 7,803 3.9 Net earned premium 7,072 6,893 2.6 Net incurred claims (4,923) (5,099) (3.5) Operating expenses (1,442) (1,411) 2.2 Investment income - insurance funds 205 236 (13.1)
Insurance trading result 912 619 47.3 Other income 65 71 (8.5)
Profit before tax 977 690 41.6 Income tax (288) (200) 44.0 General Insurance profit after tax 689 490 40.6 Life Insurance profit after tax 34 68 (50.0) Insurance (Australia) profit after tax 723 558 29.6
Banking & Wealth
Net interest income 1,131 1,129 0.2 Net non-interest income 76 88 (13.6) Operating expenses (636) (639) (0.5) Profit before impairment losses on loans and advances 571 578 (1.2) Impairment losses on loans and advances (7) (16) (56.3) Banking profit before tax 564 562 0.4 Income tax (168) (169) (0.6) Banking profit after tax 396 393 0.8 Wealth profit after tax 4 25 (84.0) Banking & Wealth profit after tax 400 418 (4.3)
New Zealand Gross written premium 1,345 1,228 9.5 Net earned premium 1,099 1,045 5.2 Net incurred claims (693) (562) 23.3 Operating expenses (366) (338) 8.3 Investment income - insurance funds 13 18 (27.8) Insurance trading result 53 163 (67.5) Other income 10 22 (54.5) Profit before tax 63 185 (65.9) Income tax (18) (51) (64.7) General Insurance profit after tax 45 134 (66.4) Life Insurance profit after tax 37 49 (24.5) New Zealand profit after tax 82 183 (55.2)
Profit after tax from functions 1,205 1,159 4.0 Other profit (loss) before tax(1) (58) (76) (23.7)
Income tax (2) 6 n/a Other profit (loss) after tax (60) (70) (14.3)
Cash earnings 1,145 1,089 5.1 Acquisition amortisation (after tax)(2) (70) (51) 37.3 Net profit after tax 1,075 1,038 3.6
(1) ‘Other’ includes investment income on capital held at the Group level (Jun-17: $14 million, Jun-16: $18 million), consolidation adjustments (Jun-17: loss $3 million, Jun-16: loss $1 million), customer strategy investment (Jun-17: loss $13 million, Jun-16: nil), recognition of deferred consideration on Tyndall disposal (Jun-17: $3 million, Jun-16: $19 million), non-controlling interests (Jun-17: loss $10 million, Jun-16: loss $7 million), external interest expense and transaction costs (Jun-17: $49 million, Jun-16: $50 million) and operating model restructuring costs (Jun-17: nil, Jun-16: $55 million).
(2) Acquisition amortisation in Jun-17 includes a $25 million impact from goodwill write-off from the disposal of New Zealand’s Autosure motor
insurance business.
GROUP
PAGE 10 FINANCIAL RESULTS FOR THE FULL YEAR ENDED 30 JUNE 2017
ANALYST PACK
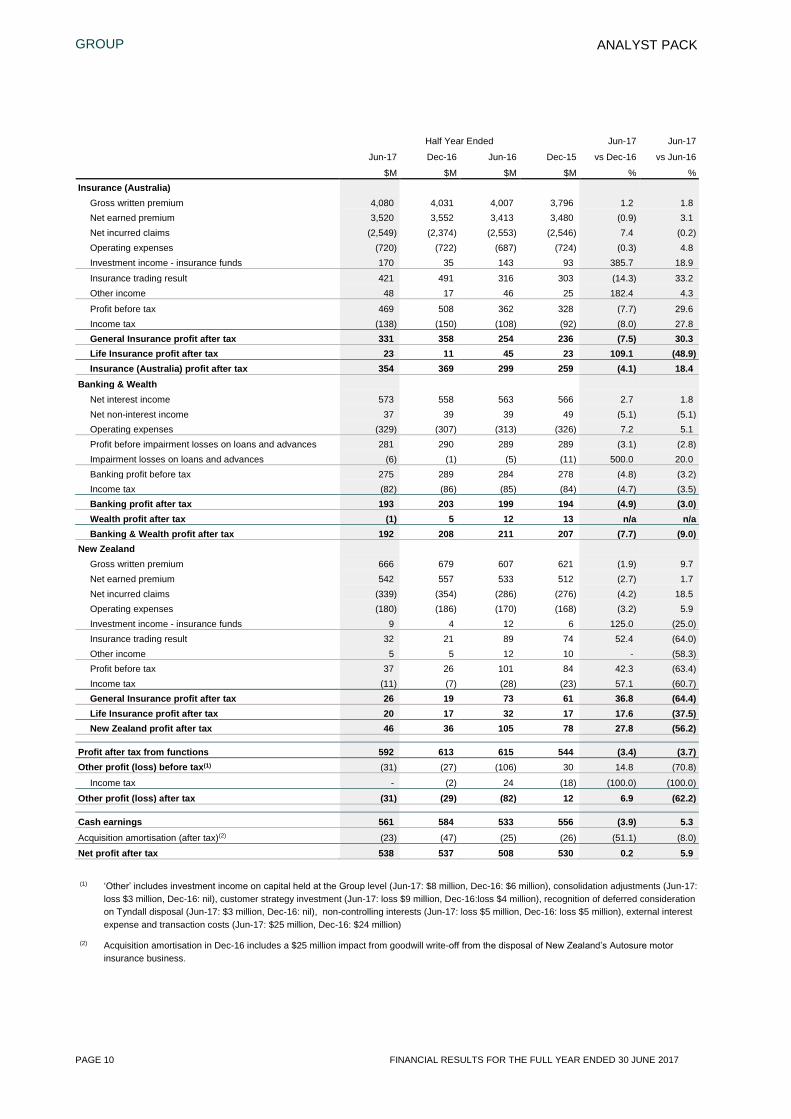
Half Year Ended Jun-17 Jun-17
Jun-17 Dec-16 Jun-16 Dec-15 vs Dec-16 vs Jun-16
$M $M $M $M % % Insurance (Australia)
Gross written premium 4,080 4,031 4,007 3,796 1.2 1.8 Net earned premium 3,520 3,552 3,413 3,480 (0.9) 3.1 Net incurred claims (2,549) (2,374) (2,553) (2,546) 7.4 (0.2) Operating expenses (720) (722) (687) (724) (0.3) 4.8 Investment income - insurance funds 170 35 143 93 385.7 18.9
Insurance trading result 421 491 316 303 (14.3) 33.2 Other income 48 17 46 25 182.4 4.3
Profit before tax 469 508 362 328 (7.7) 29.6 Income tax (138) (150) (108) (92) (8.0) 27.8 General Insurance profit after tax 331 358 254 236 (7.5) 30.3 Life Insurance profit after tax 23 11 45 23 109.1 (48.9) Insurance (Australia) profit after tax 354 369 299 259 (4.1) 18.4
Banking & Wealth
Net interest income 573 558 563 566 2.7 1.8 Net non-interest income 37 39 39 49 (5.1) (5.1) Operating expenses (329) (307) (313) (326) 7.2 5.1 Profit before impairment losses on loans and advances 281 290 289 289 (3.1) (2.8) Impairment losses on loans and advances (6) (1) (5) (11) 500.0 20.0 Banking profit before tax 275 289 284 278 (4.8) (3.2) Income tax (82) (86) (85) (84) (4.7) (3.5) Banking profit after tax 193 203 199 194 (4.9) (3.0) Wealth profit after tax (1) 5 12 13 n/a n/a Banking & Wealth profit after tax 192 208 211 207 (7.7) (9.0)
New Zealand Gross written premium 666 679 607 621 (1.9) 9.7 Net earned premium 542 557 533 512 (2.7) 1.7 Net incurred claims (339) (354) (286) (276) (4.2) 18.5 Operating expenses (180) (186) (170) (168) (3.2) 5.9 Investment income - insurance funds 9 4 12 6 125.0 (25.0) Insurance trading result 32 21 89 74 52.4 (64.0) Other income 5 5 12 10 - (58.3) Profit before tax 37 26 101 84 42.3 (63.4) Income tax (11) (7) (28) (23) 57.1 (60.7) General Insurance profit after tax 26 19 73 61 36.8 (64.4) Life Insurance profit after tax 20 17 32 17 17.6 (37.5) New Zealand profit after tax 46 36 105 78 27.8 (56.2)
Profit after tax from functions 592 613 615 544 (3.4) (3.7) Other profit (loss) before tax(1) (31) (27) (106) 30 14.8 (70.8)
Income tax - (2) 24 (18) (100.0) (100.0)
Other profit (loss) after tax (31) (29) (82) 12 6.9 (62.2)
Cash earnings 561 584 533 556 (3.9) 5.3 Acquisition amortisation (after tax)(2) (23) (47) (25) (26) (51.1) (8.0)
Net profit after tax 538 537 508 530 0.2 5.9
(1) ‘Other’ includes investment income on capital held at the Group level (Jun-17: $8 million, Dec-16: $6 million), consolidation adjustments (Jun-17: loss $3 million, Dec-16: nil), customer strategy investment (Jun-17: loss $9 million, Dec-16:loss $4 million), recognition of deferred consideration on Tyndall disposal (Jun-17: $3 million, Dec-16: nil), non-controlling interests (Jun-17: loss $5 million, Dec-16: loss $5 million), external interest expense and transaction costs (Jun-17: $25 million, Dec-16: $24 million)
(2) Acquisition amortisation in Dec-16 includes a $25 million impact from goodwill write-off from the disposal of New Zealand’s Autosure motor
insurance business.
GROUP
FINANCIAL RESULTS FOR THE FULL YEAR ENDED 30 JUNE 2017 PAGE 11
ANALYST PACK
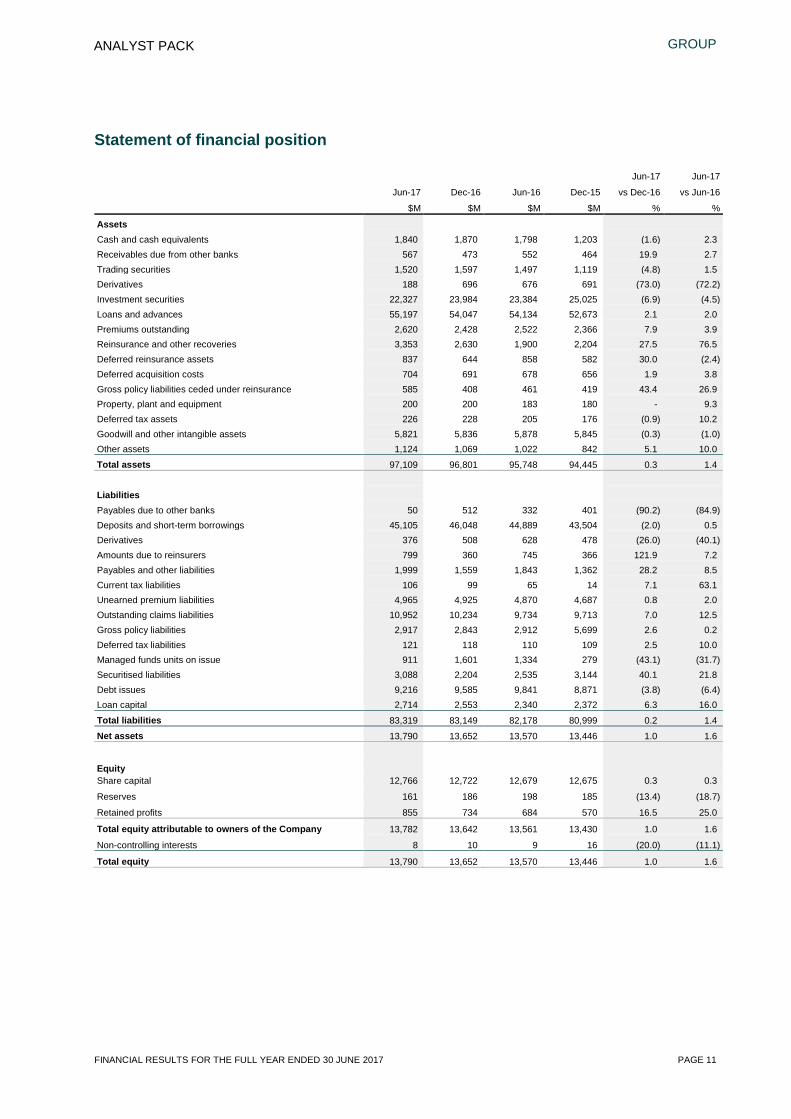
Statement of financial position
Jun-17 Jun-17
Jun-17 Dec-16 Jun-16 Dec-15 vs Dec-16 vs Jun-16
$M $M $M $M % %
Assets Cash and cash equivalents 1,840 1,870 1,798 1,203 (1.6) 2.3 Receivables due from other banks 567 473 552 464 19.9 2.7 Trading securities 1,520 1,597 1,497 1,119 (4.8) 1.5 Derivatives 188 696 676 691 (73.0) (72.2) Investment securities 22,327 23,984 23,384 25,025 (6.9) (4.5) Loans and advances 55,197 54,047 54,134 52,673 2.1 2.0 Premiums outstanding 2,620 2,428 2,522 2,366 7.9 3.9 Reinsurance and other recoveries 3,353 2,630 1,900 2,204 27.5 76.5 Deferred reinsurance assets 837 644 858 582 30.0 (2.4) Deferred acquisition costs 704 691 678 656 1.9 3.8 Gross policy liabilities ceded under reinsurance 585 408 461 419 43.4 26.9 Property, plant and equipment 200 200 183 180 - 9.3 Deferred tax assets 226 228 205 176 (0.9) 10.2 Goodwill and other intangible assets 5,821 5,836 5,878 5,845 (0.3) (1.0) Other assets 1,124 1,069 1,022 842 5.1 10.0
Total assets 97,109 96,801 95,748 94,445 0.3 1.4
Liabilities Payables due to other banks 50 512 332 401 (90.2) (84.9) Deposits and short-term borrowings 45,105 46,048 44,889 43,504 (2.0) 0.5 Derivatives 376 508 628 478 (26.0) (40.1) Amounts due to reinsurers 799 360 745 366 121.9 7.2 Payables and other liabilities 1,999 1,559 1,843 1,362 28.2 8.5 Current tax liabilities 106 99 65 14 7.1 63.1 Unearned premium liabilities 4,965 4,925 4,870 4,687 0.8 2.0 Outstanding claims liabilities 10,952 10,234 9,734 9,713 7.0 12.5 Gross policy liabilities 2,917 2,843 2,912 5,699 2.6 0.2 Deferred tax liabilities 121 118 110 109 2.5 10.0 Managed funds units on issue 911 1,601 1,334 279 (43.1) (31.7) Securitised liabilities 3,088 2,204 2,535 3,144 40.1 21.8 Debt issues 9,216 9,585 9,841 8,871 (3.8) (6.4) Loan capital 2,714 2,553 2,340 2,372 6.3 16.0
Total liabilities 83,319 83,149 82,178 80,999 0.2 1.4
Net assets 13,790 13,652 13,570 13,446 1.0 1.6
Equity Share capital 12,766 12,722 12,679 12,675 0.3 0.3
Reserves 161 186 198 185 (13.4) (18.7)
Retained profits 855 734 684 570 16.5 25.0
Total equity attributable to owners of the Company 13,782 13,642 13,561 13,430 1.0 1.6
Non-controlling interests 8 10 9 16 (20.0) (11.1)
Total equity 13,790 13,652 13,570 13,446 1.0 1.6
INSURANCE (AUSTRALIA)
PAGE 12 FINANCIAL RESULTS FOR THE FULL YEAR ENDED 30 JUNE 2017
ANALYST PACK
INSURANCE (AUSTRALIA)
Result overview
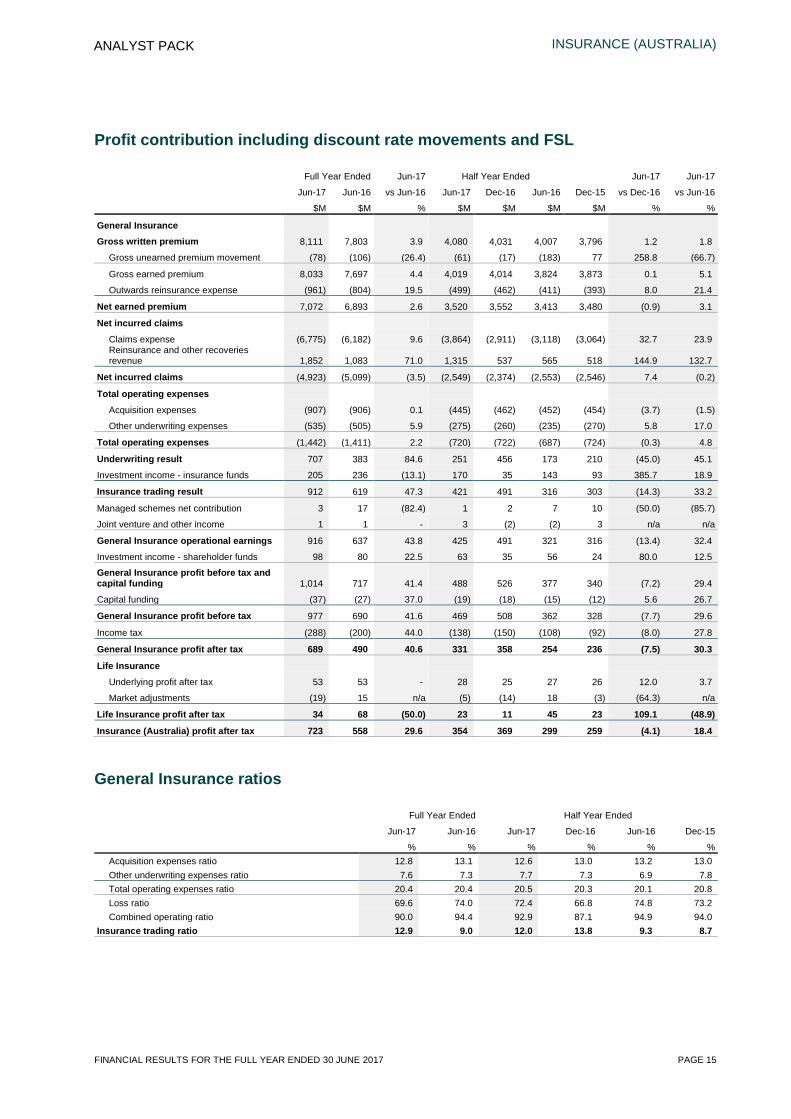
Insurance (Australia) achieved a profit after tax of $723 million for the year ended 30 June 2017. GWP increased 3.9% and in-force annual premiums contracted by 0.9%.
The General Insurance business contributed profit after tax of $689 million, up 40.6%. The insurance trading result was up 47.3% to $912 million, representing an ITR of 12.9%. ITR benefitted from top-line growth, reduced natural hazard costs and the continued remediation of claims cost issues in the Home and Motor portfolios.
GWP increased by 3.9% to $8,111 million due to premium increases in Home and Motor products, as well as increased customer numbers following the successful entry into the South Australia (SA) CTP market and strong growth in New South Wales (NSW) CTP.
The Consumer portfolio, consisting of Home and Motor, achieved GWP growth of 2.2% (2.4% excluding NSW FSL impact). While Commercial insurance GWP reduced by 2.2%, there was evidence of an improving rate environment through the important June renewal period.
CTP GWP grew 15.6%, supported by successful entry into the SA CTP market and volume and unit growth in NSW CTP. This was partially offset in Queensland through the introduction of the National Injury Insurance Scheme as well as reductions in the regulatory price ceiling.
Net incurred claims were $4,923 million, down 3.5% primarily due to lower natural hazards and the impact of changes in the yield curve on outstanding claims. Following a period of rectification, Consumer working claims operational metrics have returned to sustainable levels with improvements in home and motor loss ratios. The Commercial portfolio experienced a prior year strengthening in the run-off portfolio of home-owners warranty along with several other one-off large losses. Strong claims performance continues across CTP in NSW with improved frequency experience. Queensland has observed a slight increase in frequency, which is occurring across the industry.
Reserve releases of $301 million remain well above long-term expectations of 1.5% of Group NEP. This was primarily attributable to a continued focus on long-tail claims management and a benign environment for wage and super-imposed inflation. Going forward, superimposed inflation assumptions have been reduced to 2.5%.
Operating expense ratio was flat as continued growth of the portfolio resulted in a 2.2% increase in operating expenses.
Investment income on insurance funds of $205 million was impacted by bond yields which drove market valuation losses in the fixed-income portfolio. These were partially offset by the relative outperformance of inflation-linked bonds, narrowing credit spreads and improved returns from equities in shareholders’ funds.

INSURANCE (AUSTRALIA)
FINANCIAL RESULTS FOR THE FULL YEAR ENDED 30 JUNE 2017 PAGE 13
ANALYST PACK
The Australian Life business underlying profit after tax of $53 million was stable, reflecting higher planned profit margins and reduced experience profits due to the implementation of revised income protection and lapse assumptions at the end of last financial year, as well as some natural volatility in the lump sum claims portfolio.
In-force premium contracted 0.9% impacted by the run-off of the closed Group Risk book. This was partially offset by growth in retail and direct due to stepped age and CPI increases. New business volumes were impacted by ongoing industry disruption and heightened regulatory scrutiny.
Higher bond yields resulted in reduced investment income impacted by market adjustments resulting in Life Insurance profit after tax of $34 million.

INSURANCE (AUSTRALIA)
PAGE 14 FINANCIAL RESULTS FOR THE FULL YEAR ENDED 30 JUNE 2017
ANALYST PACK
Outlook
Insurance (Australia) continues to benefit from operating a diverse portfolio and will target profitable growth through pricing discipline, meeting more customer and intermediary needs, and successfully entering new markets.
In the Consumer portfolio, the favourable pricing environment is expected to continue as industry-wide pricing is adjusted to address claims cost inflation and the increasing incidence of natural hazards. With operational claims metrics in Consumer portfolios back to normal levels, focus has turned to implementing further improvements to the claims management process. In the Commercial portfolio, strong price increases have been achieved during the June renewal period whilst maintaining renewal rates. This positive price momentum is expected to continue into the 2018 financial year.
Within the Personal Injury portfolio, CTP regulatory reform continues to be a focus for state governments. Ongoing engagement in the reform process and the diversification of the CTP business through targeted growth in new and existing markets means Suncorp is well placed to manage scheme change. In the long-term, CTP reform aims to deliver reduced volatility and better customer outcomes. Short-term results will be impacted by reduced premiums but improvements in claims profiles will emerge over the short-to-medium term.
Claims management and disciplined underwriting are expected to result in reserve releases remaining above long-run expectations (1.5% of Group NEP) in the short to medium term, provided the low inflationary environment continues.
In Workers’ Compensation, reliance on the mining sector is steadily reducing with a move towards more profitable non-mining segments in Western Australia.
Insurance (Australia) remains committed to improving the profitability of the Australian Life business through an optimisation program which is focussed on generating long-term sustainable returns despite ongoing industry disruption and regulatory scrutiny. Life planned margins and experience have remained relatively stable, however, recent elevated claim incidence within the income protection and trauma business is being carefully monitored.
The Group continues to explore a number of strategic alternatives for the Australian Life business.
INSURANCE (AUSTRALIA)
FINANCIAL RESULTS FOR THE FULL YEAR ENDED 30 JUNE 2017 PAGE 15
ANALYST PACK
Profit contribution including discount rate movements and FSL
Full Year Ended Jun-17 Half Year Ended Jun-17 Jun-17
Jun-17 Jun-16 vs Jun-16 Jun-17 Dec-16 Jun-16 Dec-15 vs Dec-16 vs Jun-16
$M $M % $M $M $M $M % %
General Insurance
Gross written premium 8,111 7,803 3.9 4,080 4,031 4,007 3,796 1.2 1.8
Gross unearned premium movement (78) (106) (26.4) (61) (17) (183) 77 258.8 (66.7)
Gross earned premium 8,033 7,697 4.4 4,019 4,014 3,824 3,873 0.1 5.1
Outwards reinsurance expense (961) (804) 19.5 (499) (462) (411) (393) 8.0 21.4
Net earned premium 7,072 6,893 2.6 3,520 3,552 3,413 3,480 (0.9) 3.1
Net incurred claims
Claims expense (6,775) (6,182) 9.6 (3,864) (2,911) (3,118) (3,064) 32.7 23.9 Reinsurance and other recoveries revenue 1,852 1,083 71.0 1,315 537 565 518 144.9 132.7
Net incurred claims (4,923) (5,099) (3.5) (2,549) (2,374) (2,553) (2,546) 7.4 (0.2)
Total operating expenses
Acquisition expenses (907) (906) 0.1 (445) (462) (452) (454) (3.7) (1.5)
Other underwriting expenses (535) (505) 5.9 (275) (260) (235) (270) 5.8 17.0
Total operating expenses (1,442) (1,411) 2.2 (720) (722) (687) (724) (0.3) 4.8
Underwriting result 707 383 84.6 251 456 173 210 (45.0) 45.1
Investment income - insurance funds 205 236 (13.1) 170 35 143 93 385.7 18.9
Insurance trading result 912 619 47.3 421 491 316 303 (14.3) 33.2
Managed schemes net contribution 3 17 (82.4) 1 2 7 10 (50.0) (85.7)
Joint venture and other income 1 1 - 3 (2) (2) 3 n/a n/a
General Insurance operational earnings 916 637 43.8 425 491 321 316 (13.4) 32.4
Investment income - shareholder funds 98 80 22.5 63 35 56 24 80.0 12.5
General Insurance profit before tax and capital funding 1,014 717 41.4 488 526 377 340 (7.2) 29.4
Capital funding (37) (27) 37.0 (19) (18) (15) (12) 5.6 26.7
General Insurance profit before tax 977 690 41.6 469 508 362 328 (7.7) 29.6
Income tax (288) (200) 44.0 (138) (150) (108) (92) (8.0) 27.8
General Insurance profit after tax 689 490 40.6 331 358 254 236 (7.5) 30.3
Life Insurance Underlying profit after tax 53 53 - 28 25 27 26 12.0 3.7
Market adjustments (19) 15 n/a (5) (14) 18 (3) (64.3) n/a
Life Insurance profit after tax 34 68 (50.0) 23 11 45 23 109.1 (48.9)
Insurance (Australia) profit after tax 723 558 29.6 354 369 299 259 (4.1) 18.4
General Insurance ratios
Full Year Ended Half Year Ended
Jun-17 Jun-16 Jun-17 Dec-16 Jun-16 Dec-15
% % % % % % Acquisition expenses ratio 12.8 13.1 12.6 13.0 13.2 13.0 Other underwriting expenses ratio 7.6 7.3 7.7 7.3 6.9 7.8 Total operating expenses ratio 20.4 20.4 20.5 20.3 20.1 20.8 Loss ratio 69.6 74.0 72.4 66.8 74.8 73.2 Combined operating ratio 90.0 94.4 92.9 87.1 94.9 94.0
Insurance trading ratio 12.9 9.0 12.0 13.8 9.3 8.7

INSURANCE (AUSTRALIA)
PAGE 16 FINANCIAL RESULTS FOR THE FULL YEAR ENDED 30 JUNE 2017
ANALYST PACK
Profit contribution excluding discount rate movements and FSL
Full Year Ended Jun-17 Half Year Ended Jun-17 Jun-17
Jun-17 Jun-16 vs Jun-16 Jun-17 Dec-16 Jun-16 Dec-15 vs Dec-16 vs Jun-16
$M $M % $M $M $M $M % %
General Insurance
Gross written premium 7,960 7,643 4.1 4,025 3,935 3,926 3,717 2.3 2.5
Gross unearned premium movement (97) (95) 2.1 (92) (5) (178) 83 large (48.3)
Gross earned premium 7,863 7,548 4.2 3,933 3,930 3,748 3,800 0.1 4.9
Outwards reinsurance expense (961) (804) 19.5 (499) (462) (411) (393) 8.0 21.4
Net earned premium 6,902 6,744 2.3 3,434 3,468 3,337 3,407 (1.0) 2.9
Net incurred claims
Claims expense (6,857) (5,982) 14.6 (3,802) (3,055) (2,947) (3,035) 24.5 29.0 Reinsurance and other recoveries revenue 1,852 1,083 71.0 1,315 537 565 518 144.9 132.7
Net incurred claims (5,005) (4,899) 2.2 (2,487) (2,518) (2,382) (2,517) (1.2) 4.4
Total operating expenses
Acquisition expenses (907) (906) 0.1 (445) (462) (452) (454) (3.7) (1.5)
Other underwriting expenses (365) (356) 2.5 (189) (176) (159) (197) 7.4 18.9
Total operating expenses (1,272) (1,262) 0.8 (634) (638) (611) (651) (0.6) 3.8
Underwriting result 625 583 7.2 313 312 344 239 0.3 (9.0)
Investment income - insurance funds 287 36 large 108 179 (28) 64 (39.7) n/a
Insurance trading result 912 619 47.3 421 491 316 303 (14.3) 33.2
Managed schemes net contribution 3 17 (82.4) 1 2 7 10 (50.0) (85.7)
Joint venture and other income 1 1 - 3 (2) (2) 3 n/a n/a
General Insurance operational earnings 916 637 43.8 425 491 321 316 (13.4) 32.4
Investment income - shareholder funds 98 80 22.5 63 35 56 24 80.0 12.5 General Insurance profit before tax and capital funding 1,014 717 41.4 488 526 377 340 (7.2) 29.4
Capital funding (37) (27) 37.0 (19) (18) (15) (12) 5.6 26.7
General Insurance profit before tax 977 690 41.6 469 508 362 328 (7.7) 29.6
Income tax (288) (200) 44.0 (138) (150) (108) (92) (8.0) 27.8
General Insurance profit after tax 689 490 40.6 331 358 254 236 (7.5) 30.3
Life Insurance Underlying profit after tax 53 53 - 28 25 27 26 12.0 3.7
Market adjustments (19) 15 n/a (5) (14) 18 (3) (64.3) n/a
Life Insurance profit after tax 34 68 (50.0) 23 11 45 23 109.1 (48.9)
Insurance (Australia) profit after tax 723 558 29.6 354 369 299 259 (4.1) 18.4
General Insurance ratios
Full Year Ended Half Year Ended
Jun-17 Jun-16 Jun-17 Dec-16 Jun-16 Dec-15
% % % % % %
Acquisition expenses ratio 13.1 13.4 13.0 13.3 13.5 13.3
Other underwriting expenses ratio 5.3 5.3 5.5 5.1 4.8 5.8
Total operating expenses ratio 18.4 18.7 18.5 18.4 18.3 19.1
Loss ratio 72.5 72.6 72.4 72.6 71.4 73.9
Combined operating ratio 90.9 91.3 90.9 91.0 89.7 93.0

INSURANCE (AUSTRALIA)
FINANCIAL RESULTS FOR THE FULL YEAR ENDED 30 JUNE 2017 PAGE 17
ANALYST PACK
General Insurance
Gross Written Premium
Full Year Ended Jun-17 Half Year Ended Jun-17 Jun-17
Jun-17 Jun-16 vs Jun-16 Jun-17 Dec-16 Jun-16 Dec-15 vs Dec-16 vs Jun-16
$M $M % $M $M $M $M % %
Gross written premium by product
Motor 2,634 2,568 2.6 1,341 1,293 1,295 1,273 3.7 3.6
Home 2,233 2,193 1.8 1,110 1,123 1,096 1,097 (1.2) 1.3
Commercial 1,543 1,577 (2.2) 756 787 793 784 (3.9) (4.7)
Compulsory third party 1,404 1,215 15.6 682 722 648 567 (5.5) 5.2
Workers' compensation and other 297 250 18.8 191 106 175 75 80.2 9.1
Total 8,111 7,803 3.9 4,080 4,031 4,007 3,796 1.2 1.8
Full Year Ended Jun-17 Half Year Ended Jun-17 Jun-17
Jun-17 Jun-16 vs Jun-16 Jun-17 Dec-16 Jun-16 Dec-15 vs Dec-16 vs Jun-16
$M $M % $M $M $M $M % %
Gross written premium by geography
Queensland 2,133 2,236 (4.6) 1,075 1,058 1,116 1,120 1.6 (3.7)
New South Wales 2,762 2,618 5.5 1,361 1,401 1,364 1,254 (2.9) (0.2)
Victoria 1,742 1,687 3.3 885 857 863 824 3.3 2.5
Western Australia 615 562 9.4 328 287 312 250 14.3 5.1
South Australia 397 257 54.5 180 217 128 129 (17.1) 40.6
Tasmania 165 162 1.9 88 77 81 81 14.3 8.6
Other 297 281 5.7 163 134 143 138 21.6 14.0
Total 8,111 7,803 3.9 4,080 4,031 4,007 3,796 1.2 1.8
INSURANCE (AUSTRALIA)
PAGE 18 FINANCIAL RESULTS FOR THE FULL YEAR ENDED 30 JUNE 2017
ANALYST PACK
Gross Written Premium (continued)
Consumer
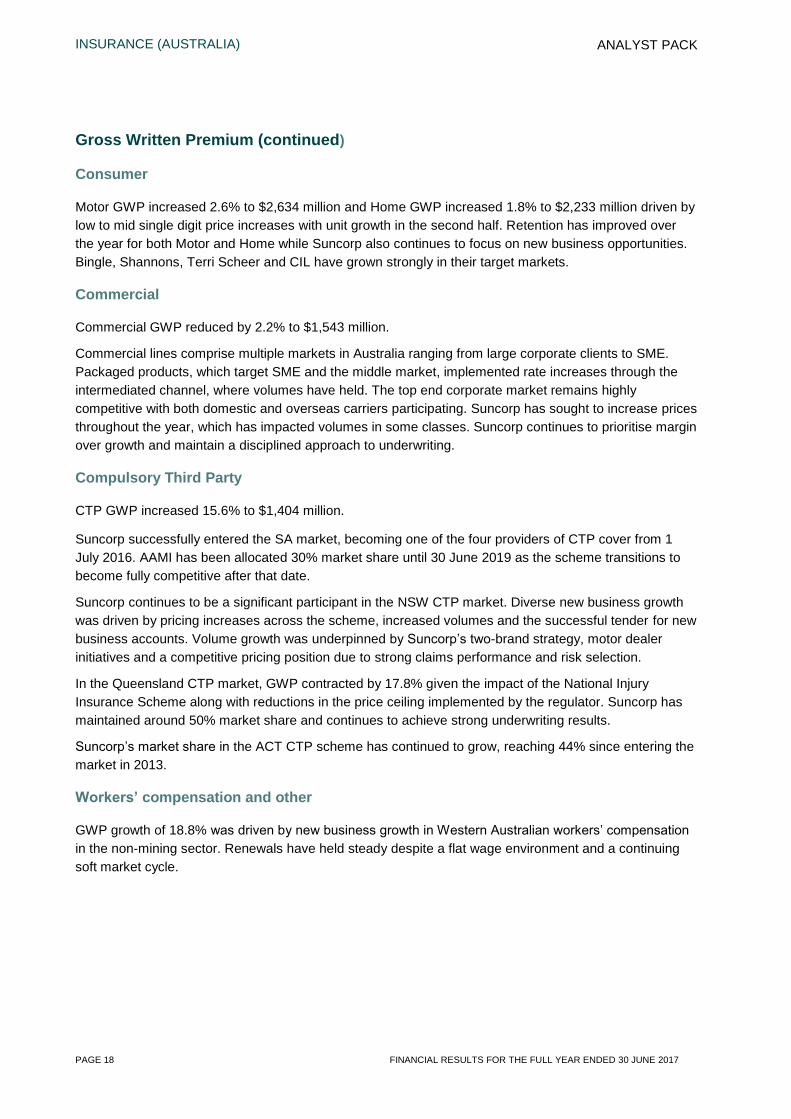
Motor GWP increased 2.6% to $2,634 million and Home GWP increased 1.8% to $2,233 million driven by low to mid single digit price increases with unit growth in the second half. Retention has improved over the year for both Motor and Home while Suncorp also continues to focus on new business opportunities. Bingle, Shannons, Terri Scheer and CIL have grown strongly in their target markets.
Commercial
Commercial GWP reduced by 2.2% to $1,543 million.
Commercial lines comprise multiple markets in Australia ranging from large corporate clients to SME. Packaged products, which target SME and the middle market, implemented rate increases through the intermediated channel, where volumes have held. The top end corporate market remains highly competitive with both domestic and overseas carriers participating. Suncorp has sought to increase prices throughout the year, which has impacted volumes in some classes. Suncorp continues to prioritise margin over growth and maintain a disciplined approach to underwriting.
Compulsory Third Party
CTP GWP increased 15.6% to $1,404 million.
Suncorp successfully entered the SA market, becoming one of the four providers of CTP cover from 1 July 2016. AAMI has been allocated 30% market share until 30 June 2019 as the scheme transitions to become fully competitive after that date.
Suncorp continues to be a significant participant in the NSW CTP market. Diverse new business growth was driven by pricing increases across the scheme, increased volumes and the successful tender for new business accounts. Volume growth was underpinned by Suncorp’s two-brand strategy, motor dealer initiatives and a competitive pricing position due to strong claims performance and risk selection.
In the Queensland CTP market, GWP contracted by 17.8% given the impact of the National Injury Insurance Scheme along with reductions in the price ceiling implemented by the regulator. Suncorp has maintained around 50% market share and continues to achieve strong underwriting results.
Suncorp’s market share in the ACT CTP scheme has continued to grow, reaching 44% since entering the market in 2013.
Workers’ compensation and other
GWP growth of 18.8% was driven by new business growth in Western Australian workers’ compensation
in the non-mining sector. Renewals have held steady despite a flat wage environment and a continuing soft market cycle.
INSURANCE (AUSTRALIA)
FINANCIAL RESULTS FOR THE FULL YEAR ENDED 30 JUNE 2017 PAGE 19
ANALYST PACK
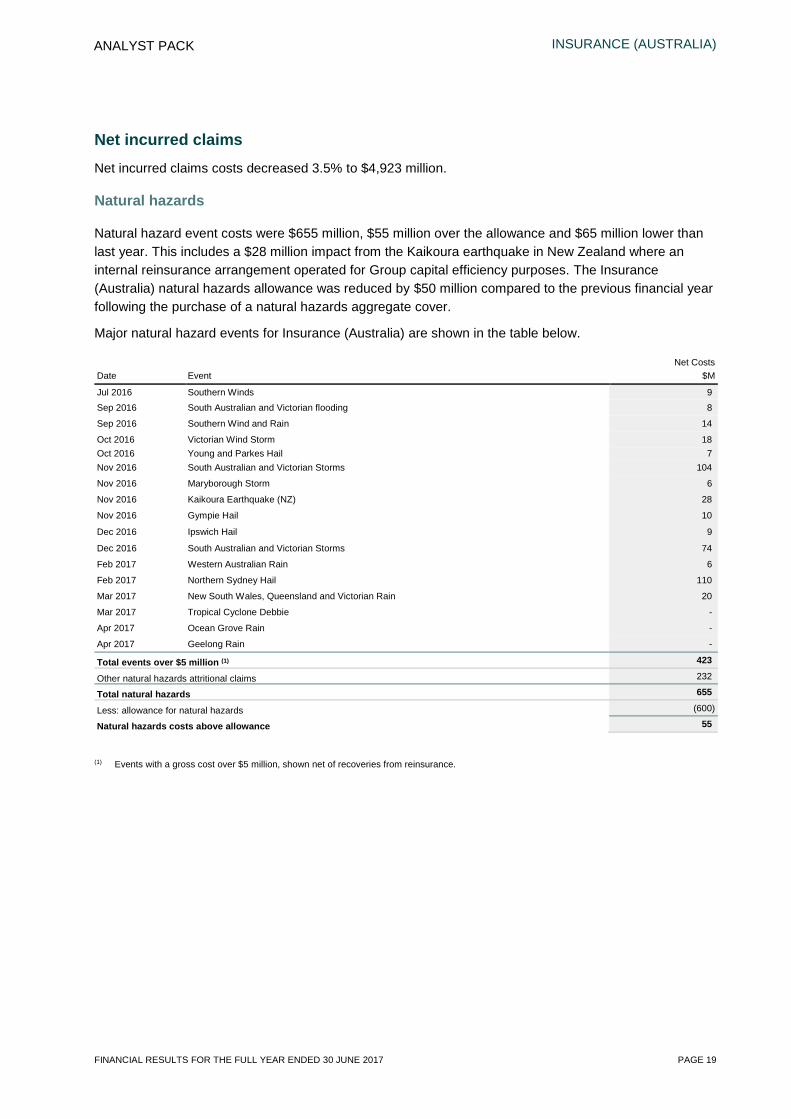
Net incurred claims Net incurred claims costs decreased 3.5% to $4,923 million.
Natural hazards
Natural hazard event costs were $655 million, $55 million over the allowance and $65 million lower than last year. This includes a $28 million impact from the Kaikoura earthquake in New Zealand where an internal reinsurance arrangement operated for Group capital efficiency purposes. The Insurance (Australia) natural hazards allowance was reduced by $50 million compared to the previous financial year following the purchase of a natural hazards aggregate cover.
Major natural hazard events for Insurance (Australia) are shown in the table below.
Net Costs Date Event $M
Jul 2016 Southern Winds 9 Sep 2016 South Australian and Victorian flooding 8
Sep 2016 Southern Wind and Rain 14
Oct 2016 Victorian Wind Storm 18 Oct 2016 Young and Parkes Hail 7 Nov 2016 South Australian and Victorian Storms 104
Nov 2016 Maryborough Storm 6
Nov 2016 Kaikoura Earthquake (NZ) 28
Nov 2016 Gympie Hail 10
Dec 2016 Ipswich Hail 9
Dec 2016 South Australian and Victorian Storms 74
Feb 2017 Western Australian Rain 6
Feb 2017 Northern Sydney Hail 110
Mar 2017 New South Wales, Queensland and Victorian Rain 20
Mar 2017 Tropical Cyclone Debbie -
Apr 2017 Ocean Grove Rain -
Apr 2017 Geelong Rain -
Total events over $5 million (1) 423
Other natural hazards attritional claims 232
Total natural hazards 655
Less: allowance for natural hazards (600)
Natural hazards costs above allowance 55
(1) Events with a gross cost over $5 million, shown net of recoveries from reinsurance.
INSURANCE (AUSTRALIA)
PAGE 20 FINANCIAL RESULTS FOR THE FULL YEAR ENDED 30 JUNE 2017
ANALYST PACK
Outstanding claims provision breakdown
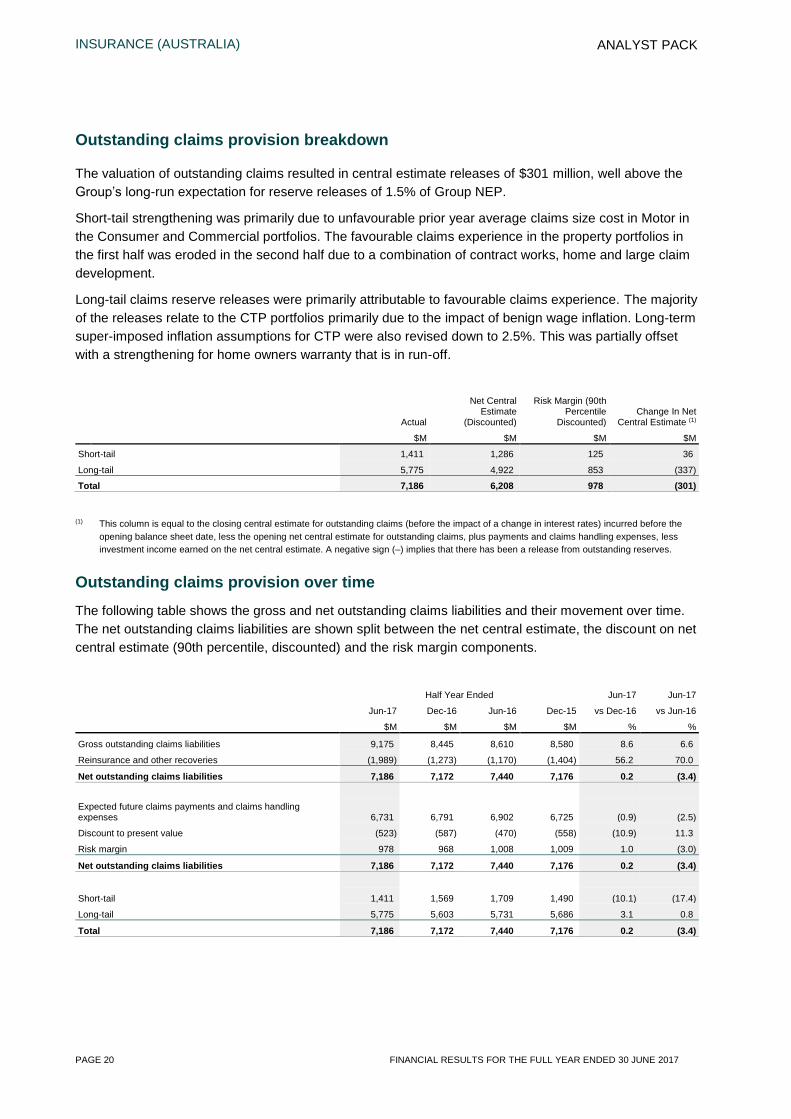
The valuation of outstanding claims resulted in central estimate releases of $301 million, well above the Group’s long-run expectation for reserve releases of 1.5% of Group NEP.
Short-tail strengthening was primarily due to unfavourable prior year average claims size cost in Motor in the Consumer and Commercial portfolios. The favourable claims experience in the property portfolios in the first half was eroded in the second half due to a combination of contract works, home and large claim development.
Long-tail claims reserve releases were primarily attributable to favourable claims experience. The majority of the releases relate to the CTP portfolios primarily due to the impact of benign wage inflation. Long-term super-imposed inflation assumptions for CTP were also revised down to 2.5%. This was partially offset with a strengthening for home owners warranty that is in run-off.
Actual
Net Central Estimate
(Discounted)
Risk Margin (90th Percentile
Discounted) Change In Net
Central Estimate (1)
$M $M $M $M
Short-tail 1,411 1,286 125 36
Long-tail 5,775 4,922 853 (337)
Total 7,186 6,208 978 (301) (1) This column is equal to the closing central estimate for outstanding claims (before the impact of a change in interest rates) incurred before the
opening balance sheet date, less the opening net central estimate for outstanding claims, plus payments and claims handling expenses, less investment income earned on the net central estimate. A negative sign (–) implies that there has been a release from outstanding reserves.
Outstanding claims provision over time
The following table shows the gross and net outstanding claims liabilities and their movement over time. The net outstanding claims liabilities are shown split between the net central estimate, the discount on net central estimate (90th percentile, discounted) and the risk margin components.
Half Year Ended Jun-17 Jun-17
Jun-17 Dec-16 Jun-16 Dec-15 vs Dec-16 vs Jun-16
$M $M $M $M % %
Gross outstanding claims liabilities 9,175 8,445 8,610 8,580 8.6 6.6
Reinsurance and other recoveries (1,989) (1,273) (1,170) (1,404) 56.2 70.0
Net outstanding claims liabilities 7,186 7,172 7,440 7,176 0.2 (3.4)
Expected future claims payments and claims handling expenses 6,731 6,791 6,902 6,725 (0.9) (2.5)
Discount to present value (523) (587) (470) (558) (10.9) 11.3
Risk margin 978 968 1,008 1,009 1.0 (3.0)
Net outstanding claims liabilities 7,186 7,172 7,440 7,176 0.2 (3.4)
Short-tail 1,411 1,569 1,709 1,490 (10.1) (17.4)
Long-tail 5,775 5,603 5,731 5,686 3.1 0.8
Total 7,186 7,172 7,440 7,176 0.2 (3.4)
INSURANCE (AUSTRALIA)
FINANCIAL RESULTS FOR THE FULL YEAR ENDED 30 JUNE 2017 PAGE 21
ANALYST PACK
Risk margins
Risk margins represent approximately 14% of outstanding claim reserves giving an approximate level of confidence of 90%.
Risk margins reduced $30 million during the period to $978 million from $1,008 million. The assets notionally backing risk margins had a net loss of $2 million. The net impact was therefore $28 million, which is excluded in the underlying ITR calculation.
Operating expenses
The total operating expense ratio was stable. Whilst total operating expenses have increased due to the growth of the portfolio, the expense base has continued to benefit from recalibrating costs as well as simplification and optimisation initiatives.
Managed schemes
Managed schemes contribution of $3 million is attributable to administering government Workers’
compensation schemes in NSW. This has reduced compared to prior year due to the Government insourcing policy services from all agents, resulting in lower service fee income.
Joint venture and other income
The Group participates in a joint venture with the Royal Automobile Club in Tasmania. The income from the joint venture was partially offset by the amortisation of intangibles and other miscellaneous net income.
INSURANCE (AUSTRALIA)
PAGE 22 FINANCIAL RESULTS FOR THE FULL YEAR ENDED 30 JUNE 2017
ANALYST PACK
Investment income
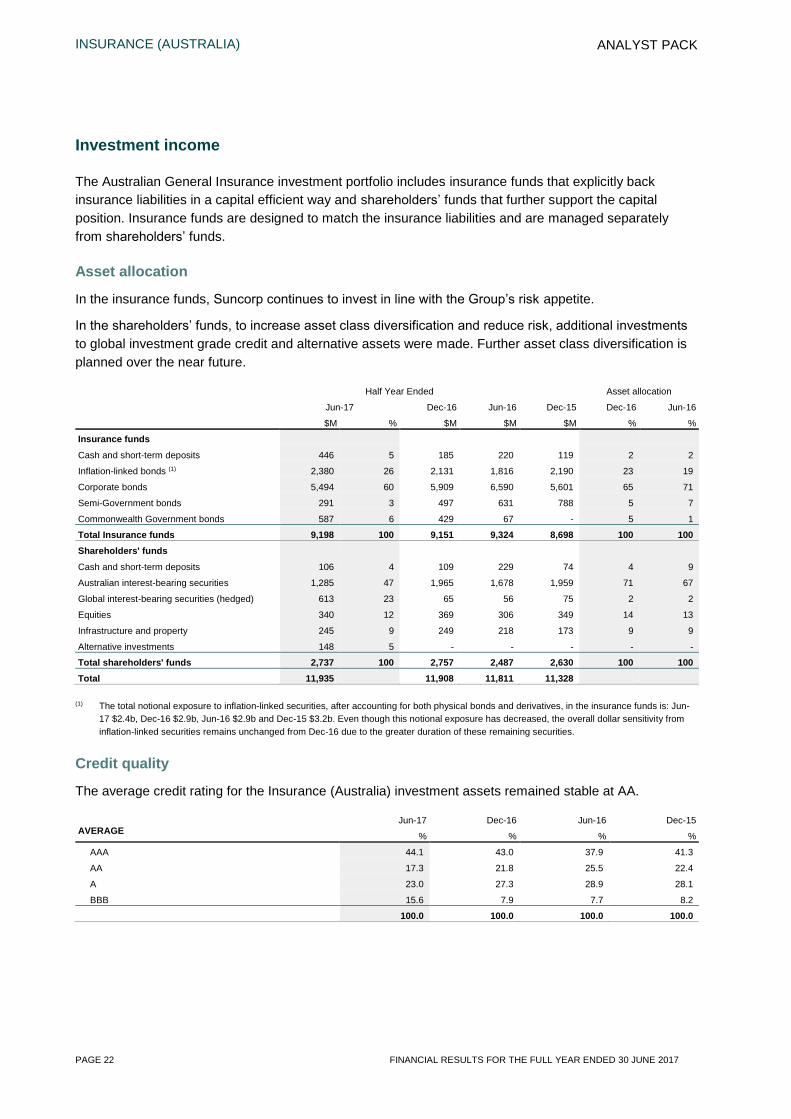
The Australian General Insurance investment portfolio includes insurance funds that explicitly back insurance liabilities in a capital efficient way and shareholders’ funds that further support the capital position. Insurance funds are designed to match the insurance liabilities and are managed separately from shareholders’ funds.
Asset allocation
In the insurance funds, Suncorp continues to invest in line with the Group’s risk appetite.
In the shareholders’ funds, to increase asset class diversification and reduce risk, additional investments
to global investment grade credit and alternative assets were made. Further asset class diversification is planned over the near future.
Half Year Ended Asset allocation
Jun-17 Dec-16 Jun-16 Dec-15 Dec-16 Jun-16
$M % $M $M $M % %
Insurance funds
Cash and short-term deposits 446 5 185 220 119 2 2
Inflation-linked bonds (1) 2,380 26 2,131 1,816 2,190 23 19
Corporate bonds 5,494 60 5,909 6,590 5,601 65 71
Semi-Government bonds 291 3 497 631 788 5 7
Commonwealth Government bonds 587 6 429 67 - 5 1
Total Insurance funds 9,198 100 9,151 9,324 8,698 100 100 Shareholders' funds
Cash and short-term deposits 106 4 109 229 74 4 9
Australian interest-bearing securities 1,285 47 1,965 1,678 1,959 71 67
Global interest-bearing securities (hedged) 613 23 65 56 75 2 2
Equities 340 12 369 306 349 14 13
Infrastructure and property 245 9 249 218 173 9 9
Alternative investments 148 5 - - - - -
Total shareholders' funds 2,737 100 2,757 2,487 2,630 100 100 Total 11,935 11,908 11,811 11,328
(1) The total notional exposure to inflation-linked securities, after accounting for both physical bonds and derivatives, in the insurance funds is: Jun-17 $2.4b, Dec-16 $2.9b, Jun-16 $2.9b and Dec-15 $3.2b. Even though this notional exposure has decreased, the overall dollar sensitivity from inflation-linked securities remains unchanged from Dec-16 due to the greater duration of these remaining securities.
Credit quality
The average credit rating for the Insurance (Australia) investment assets remained stable at AA.
Jun-17 Dec-16 Jun-16 Dec-15 AVERAGE % % % %
AAA 44.1 43.0 37.9 41.3
AA 17.3 21.8 25.5 22.4
A 23.0 27.3 28.9 28.1
BBB 15.6 7.9 7.7 8.2
100.0 100.0 100.0 100.0
INSURANCE (AUSTRALIA)
FINANCIAL RESULTS FOR THE FULL YEAR ENDED 30 JUNE 2017 PAGE 23
ANALYST PACK
Duration
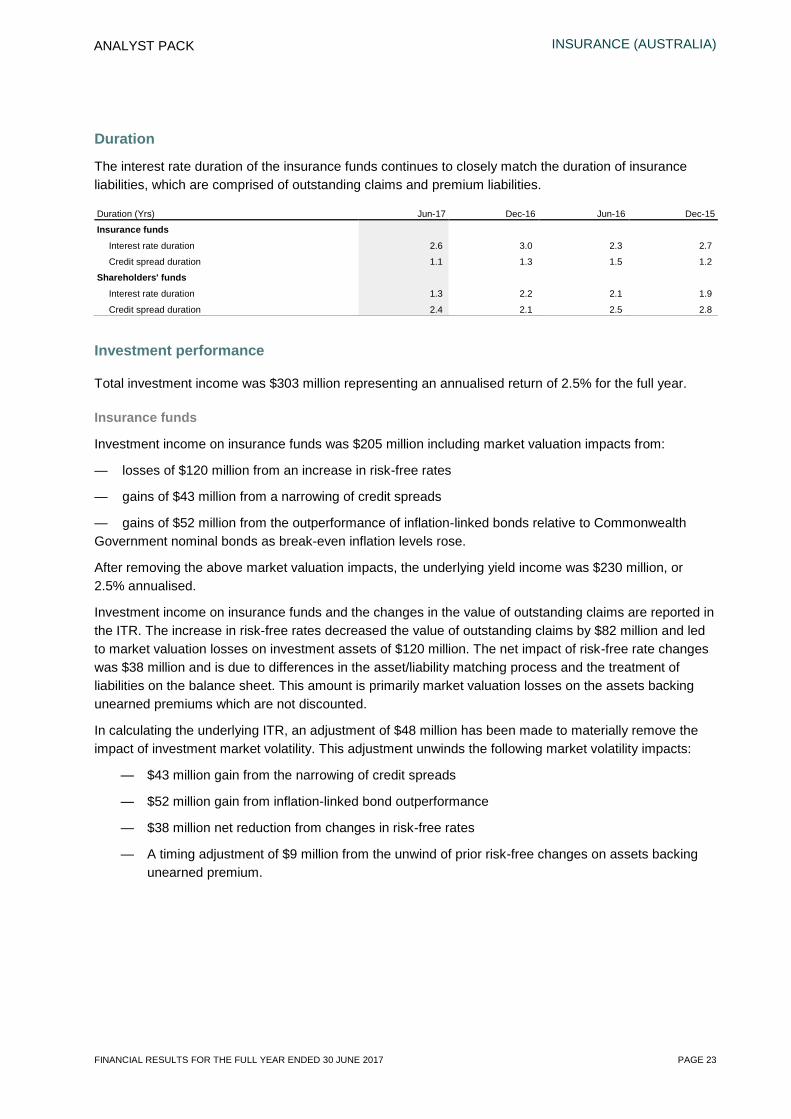
The interest rate duration of the insurance funds continues to closely match the duration of insurance liabilities, which are comprised of outstanding claims and premium liabilities.
Duration (Yrs) Jun-17 Dec-16 Jun-16 Dec-15
Insurance funds
Interest rate duration 2.6 3.0 2.3 2.7
Credit spread duration 1.1 1.3 1.5 1.2
Shareholders' funds
Interest rate duration 1.3 2.2 2.1 1.9
Credit spread duration 2.4 2.1 2.5 2.8
Investment performance
Total investment income was $303 million representing an annualised return of 2.5% for the full year.
Insurance funds
Investment income on insurance funds was $205 million including market valuation impacts from:
— losses of $120 million from an increase in risk-free rates
— gains of $43 million from a narrowing of credit spreads
— gains of $52 million from the outperformance of inflation-linked bonds relative to Commonwealth Government nominal bonds as break-even inflation levels rose.
After removing the above market valuation impacts, the underlying yield income was $230 million, or 2.5% annualised.
Investment income on insurance funds and the changes in the value of outstanding claims are reported in the ITR. The increase in risk-free rates decreased the value of outstanding claims by $82 million and led to market valuation losses on investment assets of $120 million. The net impact of risk-free rate changes was $38 million and is due to differences in the asset/liability matching process and the treatment of liabilities on the balance sheet. This amount is primarily market valuation losses on the assets backing unearned premiums which are not discounted.
In calculating the underlying ITR, an adjustment of $48 million has been made to materially remove the impact of investment market volatility. This adjustment unwinds the following market volatility impacts:
— $43 million gain from the narrowing of credit spreads
— $52 million gain from inflation-linked bond outperformance
— $38 million net reduction from changes in risk-free rates
— A timing adjustment of $9 million from the unwind of prior risk-free changes on assets backing unearned premium.
INSURANCE (AUSTRALIA)
PAGE 24 FINANCIAL RESULTS FOR THE FULL YEAR ENDED 30 JUNE 2017
ANALYST PACK
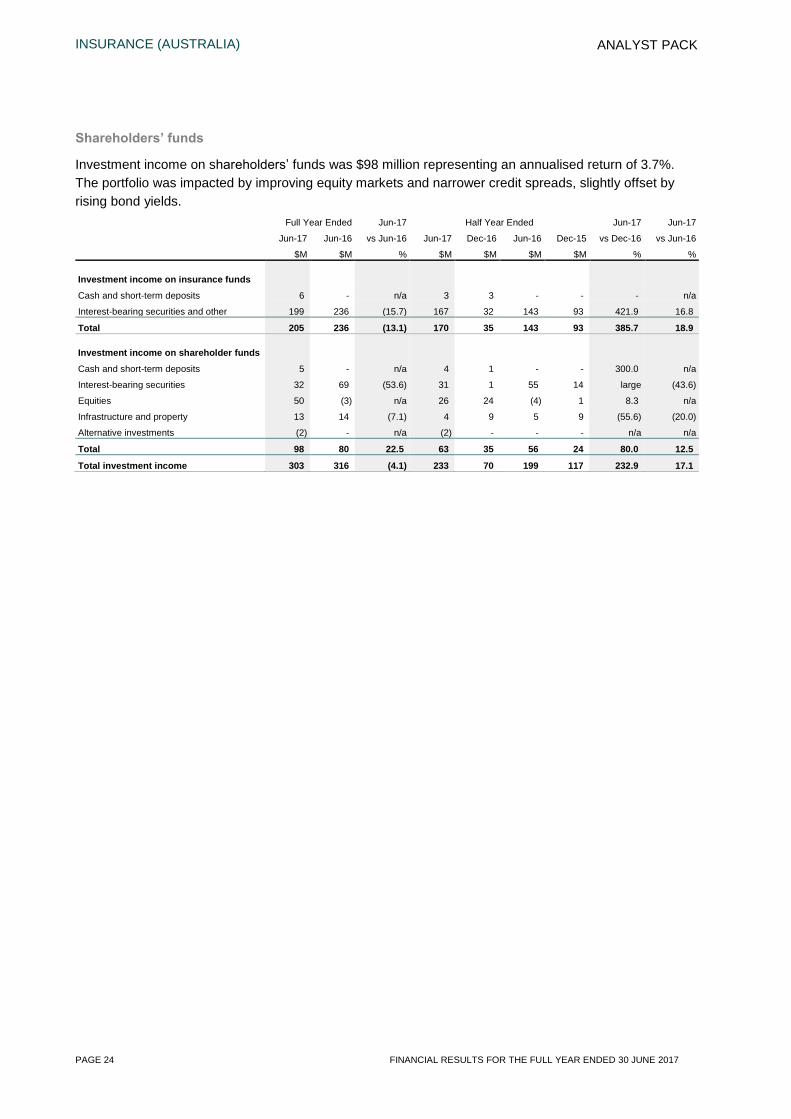
Shareholders’ funds
Investment income on shareholders’ funds was $98 million representing an annualised return of 3.7%. The portfolio was impacted by improving equity markets and narrower credit spreads, slightly offset by rising bond yields.
Full Year Ended Jun-17 Half Year Ended Jun-17 Jun-17
Jun-17 Jun-16 vs Jun-16 Jun-17 Dec-16 Jun-16 Dec-15 vs Dec-16 vs Jun-16
$M $M % $M $M $M $M % %
Investment income on insurance funds
Cash and short-term deposits 6 - n/a 3 3 - - - n/a
Interest-bearing securities and other 199 236 (15.7) 167 32 143 93 421.9 16.8
Total 205 236 (13.1) 170 35 143 93 385.7 18.9
Investment income on shareholder funds
Cash and short-term deposits 5 - n/a 4 1 - - 300.0 n/a
Interest-bearing securities 32 69 (53.6) 31 1 55 14 large (43.6)
Equities 50 (3) n/a 26 24 (4) 1 8.3 n/a
Infrastructure and property 13 14 (7.1) 4 9 5 9 (55.6) (20.0)
Alternative investments (2) - n/a (2) - - - n/a n/a
Total 98 80 22.5 63 35 56 24 80.0 12.5
Total investment income 303 316 (4.1) 233 70 199 117 232.9 17.1

INSURANCE (AUSTRALIA)
FINANCIAL RESULTS FOR THE FULL YEAR ENDED 30 JUNE 2017 PAGE 25
ANALYST PACK
Life Insurance
Life underlying profit of $53 million was stable. Higher planned profit margins and the timing of one-off experience items were offset by reduced experience profits.
As life insurance accounting is designed to recognise profits over the life of a policy, changes in assumptions in one year will impact planned margins in subsequent years.
Higher planned profit margins and reduced experience profits compared to the prior period is due to the implementation of revised income protection and lapse assumptions at the end of the 2016 financial year, as well as natural claims volatility in the lump sum portfolio.
Other and investment income includes benefits from a legacy profit share arrangement in group life risk, as well as positive experience from repricing in prior periods. Underlying investment income remained stable.
Increased long term bond yields over the financial year led to negative market adjustments.
In-force premium contracted 0.9%. This was impacted by the run-off of the closed Group Risk book that was partially offset by growth in retail and direct due to stepped age and CPI impacts. New business volumes were subdued across all channels reflecting challenging market conditions, including increased regulatory scrutiny.
Profit contribution
Full Year Ended Jun-17 Half Year Ended Jun-17 Jun-17
Jun-17 Jun-16 vs Jun-16 Jun-17 Dec-16 Jun-16 Dec-15 vs Dec-16 vs Jun-16
$M $M % $M $M $M $M % % Planned profit margin release (1) 19 15 26.7 10 9 8 7 11.1 25.0 Experience (6) 19 n/a (4) (2) 10 9 100.0 n/a Other and investments 40 19 110.5 22 18 9 10 22.2 144.4 Underlying profit after tax 53 53 - 28 25 27 26 12.0 3.7 Market adjustments (2) (19) 15 n/a (5) (14) 18 (3) (64.3) n/a Net profit after tax 34 68 (50.0) 23 11 45 23 109.1 (48.9)
(1) Planned profit margin release includes the unwind of policy liabilities which refers to the profit impact of changes in the value of policy liabilities due to the passing of time.
(2) Market adjustments consist of life risk policy discount rate changes and investment income experience.
Life risk in-force annual premium by channel
Half Year Ended Jun-17 Jun-17
Jun-17 Dec-16 Jun-16 Dec-15 vs Dec-16 vs Jun-16
$M $M $M $M % % Advised 658 653 652 642 0.8 0.9
Direct via General Insurance brands 68 66 64 60 3.0 6.3
Group and other 80 82 97 96 (2.4) (17.5)
Total 806 801 813 798 0.6 (0.9)
Life risk new business
Full Year Ended Jun-17 Half Year Ended Jun-17 Jun-17
Jun-17 Jun-16 vs Jun-16 Jun-17 Dec-16 Jun-16 Dec-15 vs Dec-16 vs Jun-16
$M $M % $M $M $M $M % % Total new business 62 74 (16.2) 29 33 36 38 (12.1) (19.4)
INSURANCE (AUSTRALIA)
PAGE 26 FINANCIAL RESULTS FOR THE FULL YEAR ENDED 30 JUNE 2017
ANALYST PACK
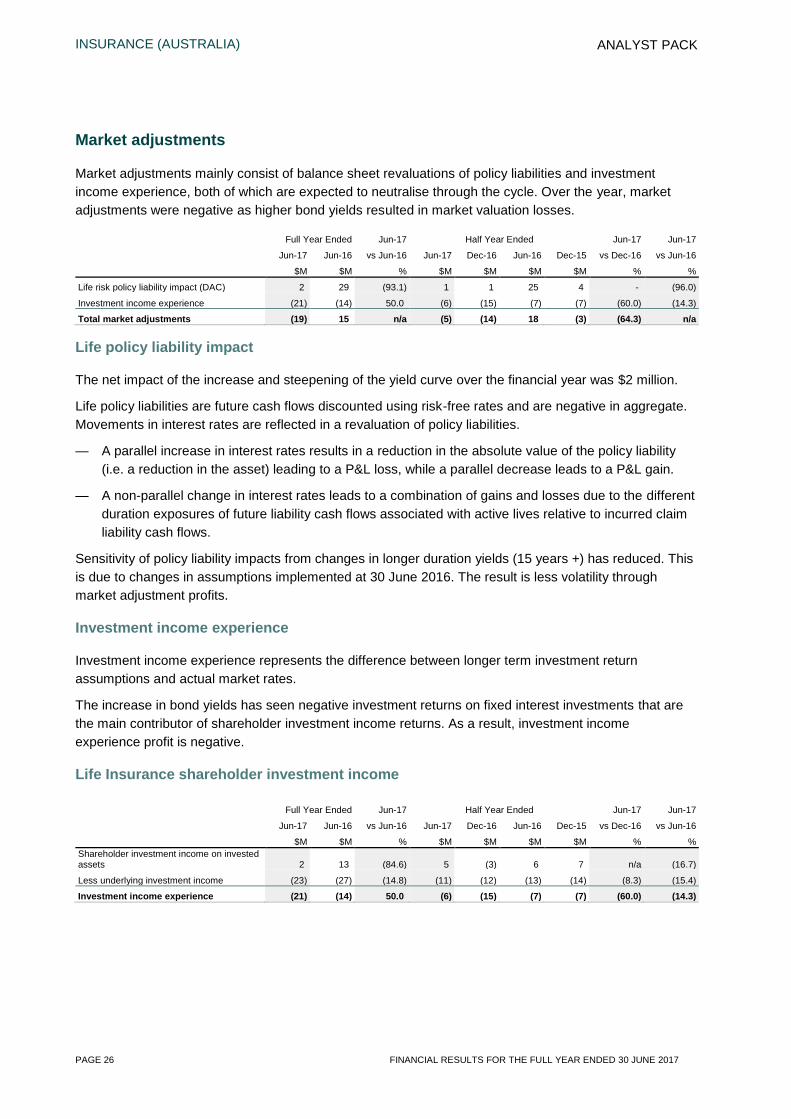
Market adjustments
Market adjustments mainly consist of balance sheet revaluations of policy liabilities and investment income experience, both of which are expected to neutralise through the cycle. Over the year, market adjustments were negative as higher bond yields resulted in market valuation losses.
Full Year Ended Jun-17 Half Year Ended Jun-17 Jun-17
Jun-17 Jun-16 vs Jun-16 Jun-17 Dec-16 Jun-16 Dec-15 vs Dec-16 vs Jun-16
$M $M % $M $M $M $M % %
Life risk policy liability impact (DAC) 2 29 (93.1) 1 1 25 4 - (96.0)
Investment income experience (21) (14) 50.0 (6) (15) (7) (7) (60.0) (14.3)
Total market adjustments (19) 15 n/a (5) (14) 18 (3) (64.3) n/a
Life policy liability impact
The net impact of the increase and steepening of the yield curve over the financial year was $2 million.
Life policy liabilities are future cash flows discounted using risk-free rates and are negative in aggregate. Movements in interest rates are reflected in a revaluation of policy liabilities.
— A parallel increase in interest rates results in a reduction in the absolute value of the policy liability (i.e. a reduction in the asset) leading to a P&L loss, while a parallel decrease leads to a P&L gain.
— A non-parallel change in interest rates leads to a combination of gains and losses due to the different duration exposures of future liability cash flows associated with active lives relative to incurred claim liability cash flows.
Sensitivity of policy liability impacts from changes in longer duration yields (15 years +) has reduced. This is due to changes in assumptions implemented at 30 June 2016. The result is less volatility through market adjustment profits.
Investment income experience
Investment income experience represents the difference between longer term investment return assumptions and actual market rates.
The increase in bond yields has seen negative investment returns on fixed interest investments that are the main contributor of shareholder investment income returns. As a result, investment income experience profit is negative.
Life Insurance shareholder investment income
Full Year Ended Jun-17 Half Year Ended Jun-17 Jun-17
Jun-17 Jun-16 vs Jun-16 Jun-17 Dec-16 Jun-16 Dec-15 vs Dec-16 vs Jun-16
$M $M % $M $M $M $M % % Shareholder investment income on invested assets 2 13 (84.6) 5 (3) 6 7 n/a (16.7)
Less underlying investment income (23) (27) (14.8) (11) (12) (13) (14) (8.3) (15.4)
Investment income experience (21) (14) 50.0 (6) (15) (7) (7) (60.0) (14.3)
BANKING & WEALTH
FINANCIAL RESULTS FOR THE FULL YEAR ENDED 30 JUNE 2017 PAGE 27
ANALYST PACK
BANKING & WEALTH
Result overview
The Banking & Wealth function delivered profit after tax of $400 million impacted by additional investment in the Core Banking and Wealth platforms, both of which are crucial to support the Group strategy.
Banking NPAT improved to $396 million, representing a return on CET1 of 13.0%. The result reflects a sustainable approach to lending and funding through a period of changing economic and regulatory dynamics.
Lending growth of 1.9% reflected improved momentum in the second half of the financial year. This was a result of the Group’s early response to macro-prudential and responsible lending measures after refraining from participating in intense pricing competition during the first half of the financial year. Retail lending growth of 1.2% was driven by the introduction of new competitive offers, improved retention rates and improved loan approval processes. Business lending growth of 5.2% was driven by new business volumes from target industries.
Net interest income was in line with the previous financial year at $1.1 billion. The full year NIM of 1.83% was at the top end of the target range, and above the target range for the second half of the financial year, following product repricing at the midpoint of the financial year.
The cost-to-income ratio of 52.7% was impacted by lower lending growth, low interest rates and low economic growth, along with further investment in the Suncorp strategy to position the business for growth. Operating expenses were flat at $636 million, including additional expenditure to complete the migration of loans and lending origination to the Core Banking platform.
In line with the industry, the Group has made changes to its hardship framework to align with regulatory standards. As expected, Suncorp is now reporting higher arrears as a result of this revised treatment, as well as the temporary impacts of Cyclone Debbie.
The Wealth profit after tax of $4 million was impacted by the decision not to capitalise the cost of completing the Super Simplification Program (SSP) and lower investment returns throughout the period.
Wealth activities have focused on the completion of SSP to simplify the superannuation product suite, outsource appropriate business and technology processes and consolidate legacy portfolios onto a modern platform. The latest releases in SSP have delivered system improvements and readiness for ongoing regulatory changes.
BANKING & WEALTH
PAGE 28 FINANCIAL RESULTS FOR THE FULL YEAR ENDED 30 JUNE 2017
ANALYST PACK
Banking & Wealth
Outlook
Banking & Wealth is committed to driving sustainable profitable growth. The business remains focused on growing savings and transaction banking solutions through improved digital capability and integrated customer offers. The additional investment in the Marketplace will also support national expansion of the Suncorp brand.
The current regulatory and political activity in the banking industry provides an opportunity for Suncorp. The Bank has a strong balance sheet, unchanged A+/A1/A+ issuer credit ratings and is not directly impacted by the recently introduced bank levy. This provides a comparative advantage to peers and will allow Suncorp to maintain a sustainable and diversified funding base.
Banking is seeing a range of benefits from operating as an advanced bank including improved granularity of information enabling better risk selection, better analysis of risk/return and improved credit quality and provisioning experience. Advanced modelling techniques also provide greater understanding of provisioning and capital requirements in stressed environments, enabling increased confidence in the strength of its capital and liquidity targets. As a result, impairment losses are expected to remain below the through-the-cycle range of 10 to 20 basis points of Gross Loans and Advances.
The Core Banking Platform implemented last financial year has taken longer than expected to fully embed and adapt for use in the Australian market. Suncorp will soon complete the final migration phase for remaining retail loans at which point it will pause the migration of deposits and transaction banking products, pending further system enhancements from the vendor. Suncorp recognises transaction banking as one of the most important services it provides to customers and will focus on accelerating payment technology and digital banking capabilities to deliver increased value to customers as society continues to progress towards cashless transactions.
With the completion of SSP, Wealth will benefit from a simplified platform and reduced investment costs in future periods with customers benefiting from lower fee product options. Superannuation solutions are included in the Marketplace, supporting Suncorp’s strategy.
The Banking & Wealth function continues to target a return on CET1 capital of 12.5% to 15.0%, supported by sustainable growth at or above system and a stable and diverse funding profile with a Net Stable Funding Ratio comfortably above 105%.
BANKING & WEALTH
FINANCIAL RESULTS FOR THE FULL YEAR ENDED 30 JUNE 2017 PAGE 29
ANALYST PACK
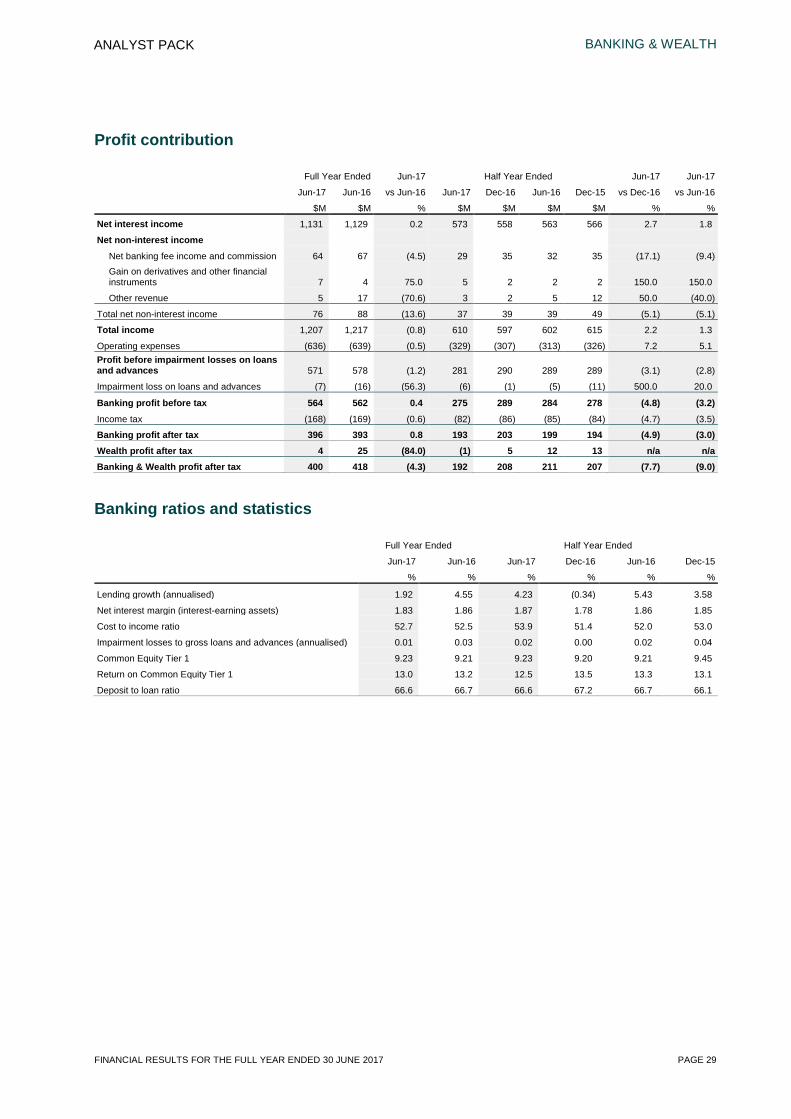
Profit contribution
Full Year Ended Jun-17 Half Year Ended Jun-17 Jun-17
Jun-17 Jun-16 vs Jun-16 Jun-17 Dec-16 Jun-16 Dec-15 vs Dec-16 vs Jun-16
$M $M % $M $M $M $M % %
Net interest income 1,131 1,129 0.2 573 558 563 566 2.7 1.8
Net non-interest income
Net banking fee income and commission 64 67 (4.5) 29 35 32 35 (17.1) (9.4) Gain on derivatives and other financial instruments 7 4 75.0 5 2 2 2 150.0 150.0
Other revenue 5 17 (70.6) 3 2 5 12 50.0 (40.0)
Total net non-interest income 76 88 (13.6) 37 39 39 49 (5.1) (5.1)
Total income 1,207 1,217 (0.8) 610 597 602 615 2.2 1.3
Operating expenses (636) (639) (0.5) (329) (307) (313) (326) 7.2 5.1 Profit before impairment losses on loans and advances 571 578 (1.2) 281 290 289 289 (3.1) (2.8)
Impairment loss on loans and advances (7) (16) (56.3) (6) (1) (5) (11) 500.0 20.0
Banking profit before tax 564 562 0.4 275 289 284 278 (4.8) (3.2) Income tax (168) (169) (0.6) (82) (86) (85) (84) (4.7) (3.5)
Banking profit after tax 396 393 0.8 193 203 199 194 (4.9) (3.0) Wealth profit after tax 4 25 (84.0) (1) 5 12 13 n/a n/a Banking & Wealth profit after tax 400 418 (4.3) 192 208 211 207 (7.7) (9.0)
Banking ratios and statistics
Full Year Ended Half Year Ended
Jun-17 Jun-16 Jun-17 Dec-16 Jun-16 Dec-15
% % % % % %
Lending growth (annualised) 1.92 4.55 4.23 (0.34) 5.43 3.58
Net interest margin (interest-earning assets) 1.83 1.86 1.87 1.78 1.86 1.85
Cost to income ratio 52.7 52.5 53.9 51.4 52.0 53.0
Impairment losses to gross loans and advances (annualised) 0.01 0.03 0.02 0.00 0.02 0.04
Common Equity Tier 1 9.23 9.21 9.23 9.20 9.21 9.45
Return on Common Equity Tier 1 13.0 13.2 12.5 13.5 13.3 13.1
Deposit to loan ratio 66.6 66.7 66.6 67.2 66.7 66.1

BANKING & WEALTH
PAGE 30 FINANCIAL RESULTS FOR THE FULL YEAR ENDED 30 JUNE 2017
ANALYST PACK
Banking
Loans and advances
Jun-17 Jun-17
Jun-17 Dec-16 Jun-16 Dec-15 vs Dec-16 vs Jun-16
$M $M $M $M % %
Housing loans 38,722 38,743 37,704 36,691 (0.1) 2.7
Securitised housing loans and covered bonds 6,122 5,332 6,548 6,355 14.8 (6.5)
Total housing loans 44,844 44,075 44,252 43,046 1.7 1.3
Consumer loans 254 268 312 345 (5.2) (18.6)
Retail loans 45,098 44,343 44,564 43,391 1.7 1.2
Commercial (SME) 5,729 5,462 5,356 5,203 4.9 7.0
Agribusiness 4,497 4,383 4,360 4,258 2.6 3.1
Total Business loans 10,226 9,845 9,716 9,461 3.9 5.2
Total lending 55,324 54,188 54,280 52,852 2.1 1.9
Other lending 13 7 18 - 85.7 (27.8)
Gross loans and advances 55,337 54,195 54,298 52,852 2.1 1.9
Provision for impairment (140) (148) (164) (179) (5.4) (14.6)
Total loans and advances 55,197 54,047 54,134 52,673 2.1 2.0 Credit-risk weighted assets 26,543 26,459 26,444 25,613 0.3 0.4
Geographical breakdown - Total lending
Queensland 29,288 28,935 29,132 28,735 1.2 0.5
New South Wales 14,469 13,925 13,808 13,162 3.9 4.8
Victoria 5,684 5,532 5,499 5,295 2.7 3.4
Western Australia 3,683 3,707 3,747 3,660 (0.6) (1.7)
South Australia and other 2,200 2,089 2,094 2,000 5.3 5.1
Outside of Queensland loans 26,036 25,253 25,148 24,117 3.1 3.5
Total lending 55,324 54,188 54,280 52,852 2.1 1.9
Total lending
Total lending receivables, including securitised assets grew 1.9% from the prior comparative period to $55.3 billion.
Retail loans
Retail lending grew by 1.2% from the prior comparative period to $45.1 billion with home lending growth in the second half of 1.7%.
Several initiatives were implemented within the home lending portfolio to improve customer experience and increase efficiency, including reviewing the existing loan approval process, utilising risk-based verification for select activities and increasing customer-led opportunities. These initiatives, along with competitive price offerings, resulted in growth during the second half with momentum continuing into the new financial year.
Banking continued to maintain a high-quality lending portfolio as indicated through a range of measures including serviceability, customer credit quality and average loan-to-value (LVR) ratio.
BANKING & WEALTH
FINANCIAL RESULTS FOR THE FULL YEAR ENDED 30 JUNE 2017 PAGE 31
ANALYST PACK
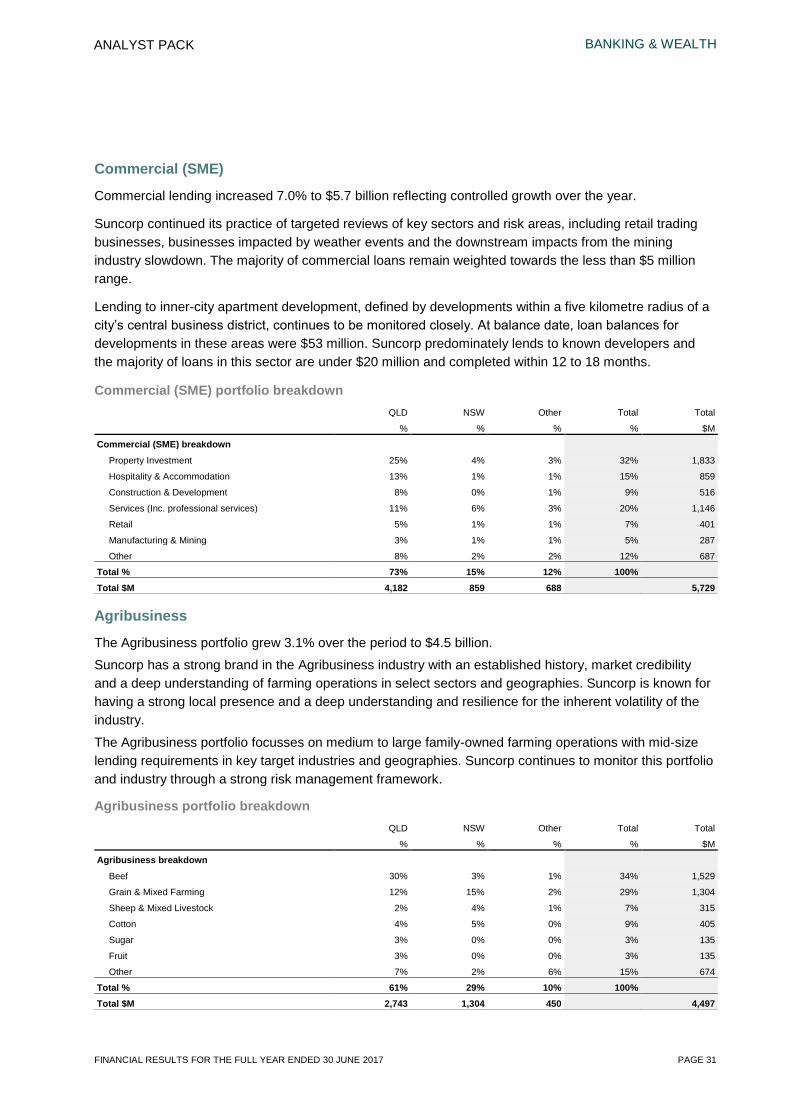
Commercial (SME)
Commercial lending increased 7.0% to $5.7 billion reflecting controlled growth over the year.
Suncorp continued its practice of targeted reviews of key sectors and risk areas, including retail trading businesses, businesses impacted by weather events and the downstream impacts from the mining industry slowdown. The majority of commercial loans remain weighted towards the less than $5 million range.
Lending to inner-city apartment development, defined by developments within a five kilometre radius of a city’s central business district, continues to be monitored closely. At balance date, loan balances for
developments in these areas were $53 million. Suncorp predominately lends to known developers and the majority of loans in this sector are under $20 million and completed within 12 to 18 months.
Commercial (SME) portfolio breakdown QLD NSW Other Total Total
% % % % $M
Commercial (SME) breakdown
Property Investment 25% 4% 3% 32% 1,833
Hospitality & Accommodation 13% 1% 1% 15% 859
Construction & Development 8% 0% 1% 9% 516
Services (Inc. professional services) 11% 6% 3% 20% 1,146
Retail 5% 1% 1% 7% 401
Manufacturing & Mining 3% 1% 1% 5% 287
Other 8% 2% 2% 12% 687
Total % 73% 15% 12% 100% Total $M 4,182 859 688 5,729
Agribusiness
The Agribusiness portfolio grew 3.1% over the period to $4.5 billion.
Suncorp has a strong brand in the Agribusiness industry with an established history, market credibility and a deep understanding of farming operations in select sectors and geographies. Suncorp is known for having a strong local presence and a deep understanding and resilience for the inherent volatility of the industry.
The Agribusiness portfolio focusses on medium to large family-owned farming operations with mid-size lending requirements in key target industries and geographies. Suncorp continues to monitor this portfolio and industry through a strong risk management framework.
Agribusiness portfolio breakdown QLD NSW Other Total Total
% % % % $M
Agribusiness breakdown
Beef 30% 3% 1% 34% 1,529
Grain & Mixed Farming 12% 15% 2% 29% 1,304
Sheep & Mixed Livestock 2% 4% 1% 7% 315
Cotton 4% 5% 0% 9% 405
Sugar 3% 0% 0% 3% 135
Fruit 3% 0% 0% 3% 135
Other 7% 2% 6% 15% 674
Total % 61% 29% 10% 100% Total $M 2,743 1,304 450 4,497
BANKING & WEALTH
PAGE 32 FINANCIAL RESULTS FOR THE FULL YEAR ENDED 30 JUNE 2017
ANALYST PACK
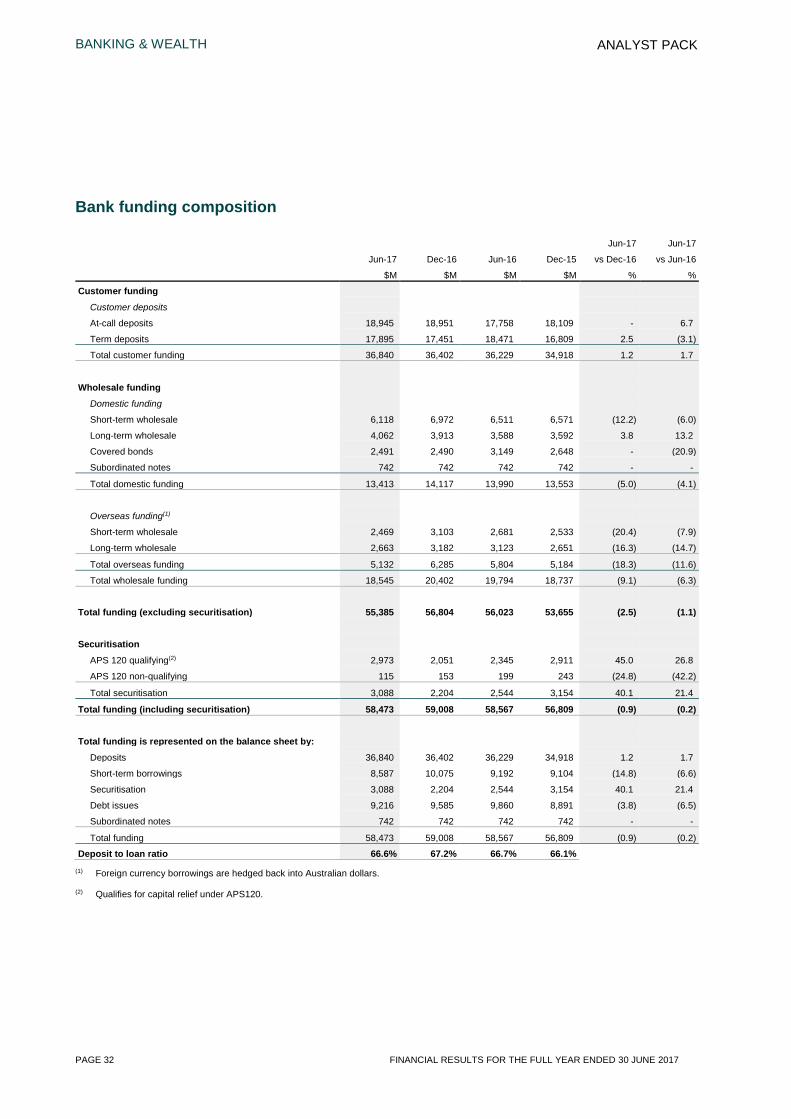
Bank funding composition
Jun-17 Jun-17
Jun-17 Dec-16 Jun-16 Dec-15 vs Dec-16 vs Jun-16
$M $M $M $M % %
Customer funding
Customer deposits
At-call deposits 18,945 18,951 17,758 18,109 - 6.7
Term deposits 17,895 17,451 18,471 16,809 2.5 (3.1)
Total customer funding 36,840 36,402 36,229 34,918 1.2 1.7
Wholesale funding
Domestic funding
Short-term wholesale 6,118 6,972 6,511 6,571 (12.2) (6.0)
Long-term wholesale 4,062 3,913 3,588 3,592 3.8 13.2
Covered bonds 2,491 2,490 3,149 2,648 - (20.9)
Subordinated notes 742 742 742 742 - -
Total domestic funding 13,413 14,117 13,990 13,553 (5.0) (4.1)
Overseas funding(1)
Short-term wholesale 2,469 3,103 2,681 2,533 (20.4) (7.9)
Long-term wholesale 2,663 3,182 3,123 2,651 (16.3) (14.7)
Total overseas funding 5,132 6,285 5,804 5,184 (18.3) (11.6)
Total wholesale funding 18,545 20,402 19,794 18,737 (9.1) (6.3)
Total funding (excluding securitisation) 55,385 56,804 56,023 53,655 (2.5) (1.1)
Securitisation
APS 120 qualifying(2) 2,973 2,051 2,345 2,911 45.0 26.8
APS 120 non-qualifying 115 153 199 243 (24.8) (42.2)
Total securitisation 3,088 2,204 2,544 3,154 40.1 21.4
Total funding (including securitisation) 58,473 59,008 58,567 56,809 (0.9) (0.2)
Total funding is represented on the balance sheet by:
Deposits 36,840 36,402 36,229 34,918 1.2 1.7
Short-term borrowings 8,587 10,075 9,192 9,104 (14.8) (6.6)
Securitisation 3,088 2,204 2,544 3,154 40.1 21.4
Debt issues 9,216 9,585 9,860 8,891 (3.8) (6.5)
Subordinated notes 742 742 742 742 - -
Total funding 58,473 59,008 58,567 56,809 (0.9) (0.2)
Deposit to loan ratio 66.6% 67.2% 66.7% 66.1% (1) Foreign currency borrowings are hedged back into Australian dollars.
(2) Qualifies for capital relief under APS120.

BANKING & WEALTH
FINANCIAL RESULTS FOR THE FULL YEAR ENDED 30 JUNE 2017 PAGE 33
ANALYST PACK
Funding
Suncorp has a conservative approach to managing liquidity and funding risk ensuring a sustainable funding profile is in place to support balance sheet growth.
Suncorp gained greater access to stable funding through connected customer relationships and quality retail deposit growth during the financial year. The current Net Stable Funding Ratio (NSFR) is compliant with regulatory requirements in advance of its adoption in January 2018 and the Liquidity Coverage Ratio (LCR) has been managed at an appropriate buffer to the 100% prudential minimum requirement.
Suncorp’s key funding and liquidity management strategies include:
− increasing stable deposits (both at-call and term deposits) coupled with an appropriate NSFR position − maintaining a sustainable and diversified funding base across a range of long-term wholesale markets
such as covered bond, domestic senior unsecured, and residential mortgage backed security (RMBS) − lengthening the weighted average tenor of new long-term wholesale funding − minimising the impact of market volatility by managing the maturity profile of liabilities − ensuring short-term resilience by managing high-quality liquid assets comfortably above net cash
outflows under various stress scenarios.
Net Stable Funding Ratio
Banking is well placed to meet the proposed NSFR requirements, which will be introduced from January 2018. The NSFR was estimated at 110% based on current APRA guidelines.
The Banking business monitors the composition and stability of its funding to remain within risk appetite. This includes compliance with both the LCR and upcoming NSFR requirements, with a focus on the stability of the overall funding profile rather than concentrating on a single measure.
Customer funding
Banking’s deposit-to-loan ratio of 66.6% reflects focus on growing higher-quality deposits from customers.
Liquidity Coverage Ratio
The average LCR for the full year ended 30 June 2017 was 128%, ending the financial year at 123%.
The banking business holds a portfolio of liquid assets available to meet balance sheet requirements and unforeseen cash outflows under a range of market conditions and stress scenarios. These assets consist of cash and highly rated securities eligible for repurchase agreements with the Reserve Bank of Australia (RBA).
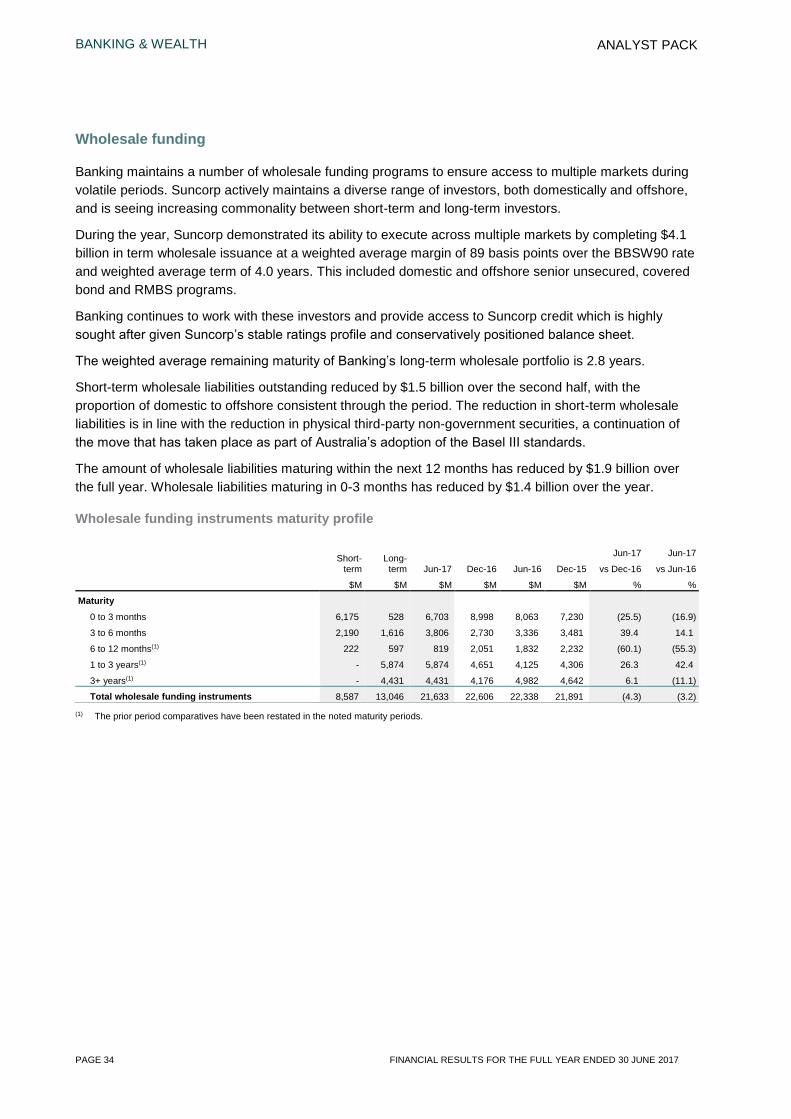
BANKING & WEALTH
PAGE 34 FINANCIAL RESULTS FOR THE FULL YEAR ENDED 30 JUNE 2017
ANALYST PACK
Wholesale funding
Banking maintains a number of wholesale funding programs to ensure access to multiple markets during volatile periods. Suncorp actively maintains a diverse range of investors, both domestically and offshore, and is seeing increasing commonality between short-term and long-term investors.
During the year, Suncorp demonstrated its ability to execute across multiple markets by completing $4.1 billion in term wholesale issuance at a weighted average margin of 89 basis points over the BBSW90 rate and weighted average term of 4.0 years. This included domestic and offshore senior unsecured, covered bond and RMBS programs.
Banking continues to work with these investors and provide access to Suncorp credit which is highly sought after given Suncorp’s stable ratings profile and conservatively positioned balance sheet.
The weighted average remaining maturity of Banking’s long-term wholesale portfolio is 2.8 years.
Short-term wholesale liabilities outstanding reduced by $1.5 billion over the second half, with the proportion of domestic to offshore consistent through the period. The reduction in short-term wholesale liabilities is in line with the reduction in physical third-party non-government securities, a continuation of the move that has taken place as part of Australia’s adoption of the Basel III standards.
The amount of wholesale liabilities maturing within the next 12 months has reduced by $1.9 billion over the full year. Wholesale liabilities maturing in 0-3 months has reduced by $1.4 billion over the year.
Wholesale funding instruments maturity profile
Short- term
Long- term
Jun-17 Jun-17
Jun-17 Dec-16 Jun-16 Dec-15 vs Dec-16 vs Jun-16
$M $M $M $M $M $M % %
Maturity
0 to 3 months 6,175 528 6,703 8,998 8,063 7,230 (25.5) (16.9)
3 to 6 months 2,190 1,616 3,806 2,730 3,336 3,481 39.4 14.1
6 to 12 months(1) 222 597 819 2,051 1,832 2,232 (60.1) (55.3)
1 to 3 years(1) - 5,874 5,874 4,651 4,125 4,306 26.3 42.4
3+ years(1) - 4,431 4,431 4,176 4,982 4,642 6.1 (11.1)
Total wholesale funding instruments 8,587 13,046 21,633 22,606 22,338 21,891 (4.3) (3.2)
(1) The prior period comparatives have been restated in the noted maturity periods.

BANKING & WEALTH
FINANCIAL RESULTS FOR THE FULL YEAR ENDED 30 JUNE 2017 PAGE 35
ANALYST PACK
Net interest income
Net interest income of $1.1 billion was in line with the previous financial year. This is reflective of a period of lower lending growth and margin compression, largely attributable to the ongoing impact of a record low interest rate environment and the prevailing conditions of highly competitive lending and deposits markets.
The full year NIM result of 1.83% is within the top end of the target range and was shaped by re-pricing of lending portfolios and prudent balance sheet and liquidity management. This was offset by customer retention activity and price offerings, ongoing economic pressures, such as low interest rates, and increased funding costs which peaked in late 2016.
NIM movements
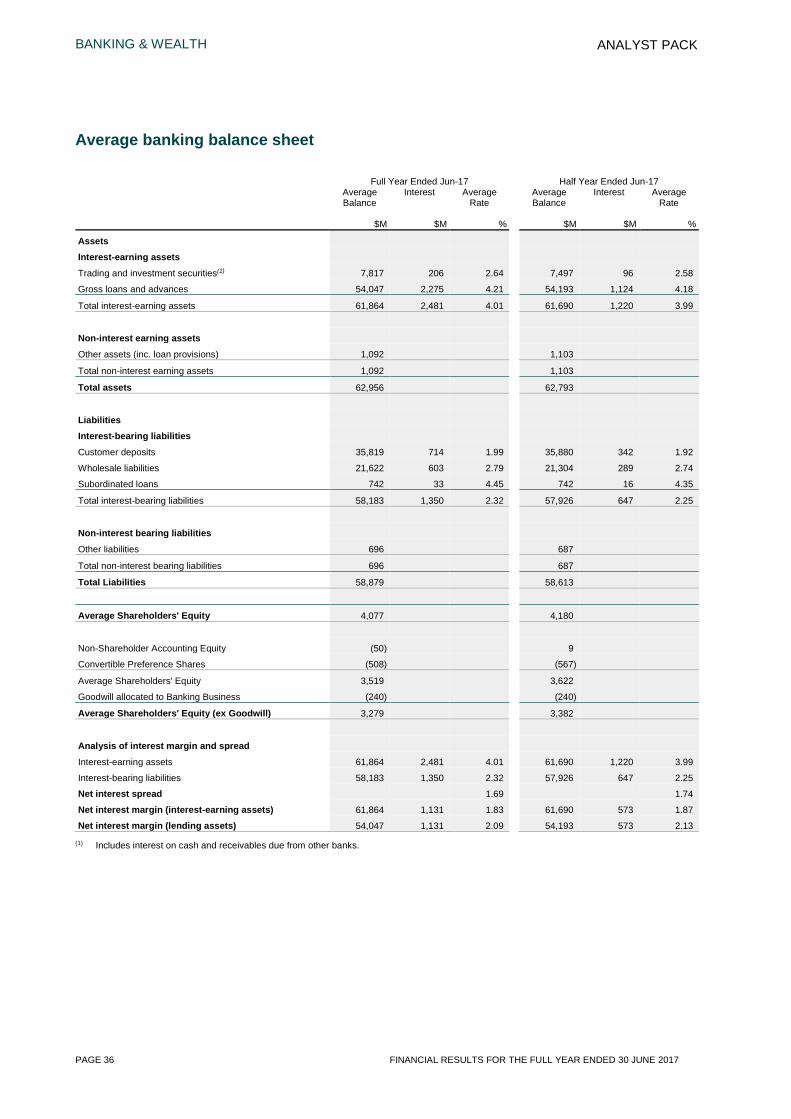
BANKING & WEALTH
PAGE 36 FINANCIAL RESULTS FOR THE FULL YEAR ENDED 30 JUNE 2017
ANALYST PACK
Average banking balance sheet
Full Year Ended Jun-17 Half Year Ended Jun-17
Average Balance
Interest Average Rate
Average Balance
Interest Average Rate
$M $M % $M $M %
Assets
Interest-earning assets
Trading and investment securities(1) 7,817 206 2.64 7,497 96 2.58
Gross loans and advances 54,047 2,275 4.21 54,193 1,124 4.18
Total interest-earning assets 61,864 2,481 4.01 61,690 1,220 3.99
Non-interest earning assets
Other assets (inc. loan provisions) 1,092 1,103
Total non-interest earning assets 1,092 1,103
Total assets 62,956 62,793
Liabilities
Interest-bearing liabilities
Customer deposits 35,819 714 1.99 35,880 342 1.92
Wholesale liabilities 21,622 603 2.79 21,304 289 2.74
Subordinated loans 742 33 4.45 742 16 4.35
Total interest-bearing liabilities 58,183 1,350 2.32 57,926 647 2.25
Non-interest bearing liabilities
Other liabilities 696 687
Total non-interest bearing liabilities 696 687
Total Liabilities 58,879 58,613
Average Shareholders' Equity 4,077 4,180
Non-Shareholder Accounting Equity (50) 9
Convertible Preference Shares (508) (567)
Average Shareholders' Equity 3,519 3,622
Goodwill allocated to Banking Business (240) (240)
Average Shareholders' Equity (ex Goodwill) 3,279 3,382
Analysis of interest margin and spread
Interest-earning assets 61,864 2,481 4.01 61,690 1,220 3.99
Interest-bearing liabilities 58,183 1,350 2.32 57,926 647 2.25
Net interest spread 1.69 1.74
Net interest margin (interest-earning assets) 61,864 1,131 1.83 61,690 573 1.87
Net interest margin (lending assets) 54,047 1,131 2.09 54,193 573 2.13
(1) Includes interest on cash and receivables due from other banks.
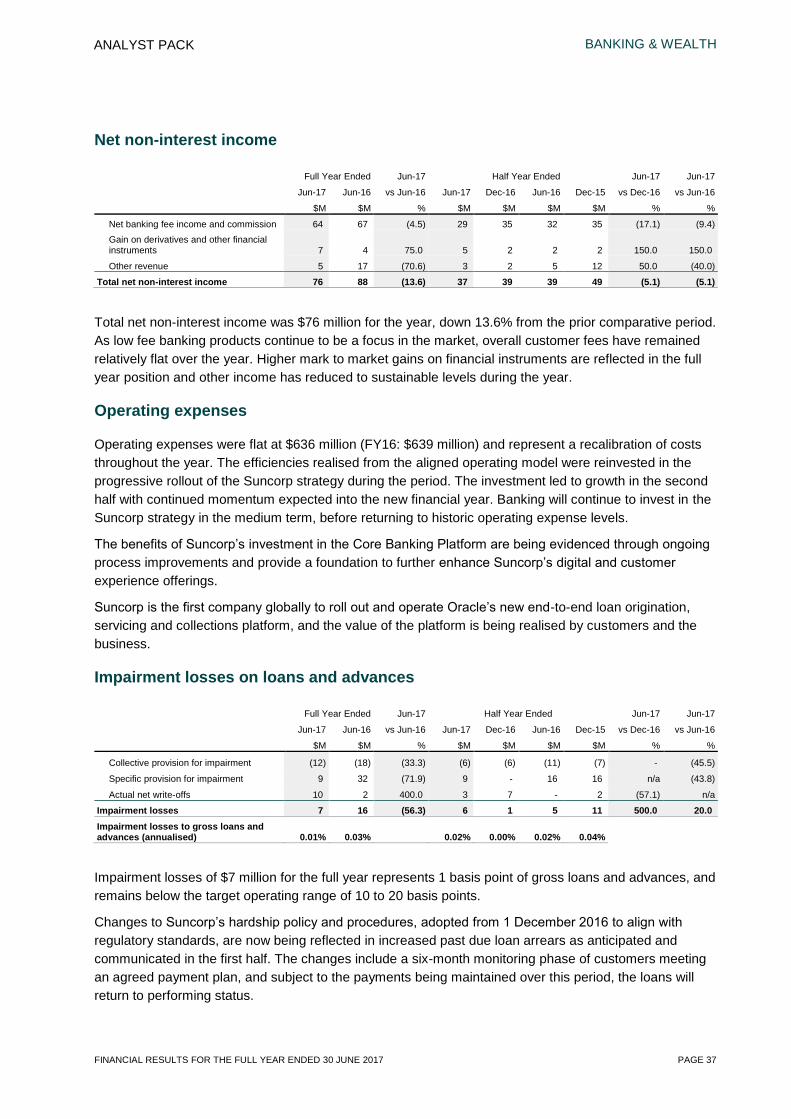
BANKING & WEALTH
FINANCIAL RESULTS FOR THE FULL YEAR ENDED 30 JUNE 2017 PAGE 37
ANALYST PACK
Net non-interest income
Full Year Ended Jun-17 Half Year Ended Jun-17 Jun-17
Jun-17 Jun-16 vs Jun-16 Jun-17 Dec-16 Jun-16 Dec-15 vs Dec-16 vs Jun-16
$M $M % $M $M $M $M % %
Net banking fee income and commission 64 67 (4.5) 29 35 32 35 (17.1) (9.4) Gain on derivatives and other financial instruments 7 4 75.0 5 2 2 2 150.0 150.0
Other revenue 5 17 (70.6) 3 2 5 12 50.0 (40.0)
Total net non-interest income 76 88 (13.6) 37 39 39 49 (5.1) (5.1)
Total net non-interest income was $76 million for the year, down 13.6% from the prior comparative period. As low fee banking products continue to be a focus in the market, overall customer fees have remained relatively flat over the year. Higher mark to market gains on financial instruments are reflected in the full year position and other income has reduced to sustainable levels during the year.
Operating expenses
Operating expenses were flat at $636 million (FY16: $639 million) and represent a recalibration of costs throughout the year. The efficiencies realised from the aligned operating model were reinvested in the progressive rollout of the Suncorp strategy during the period. The investment led to growth in the second half with continued momentum expected into the new financial year. Banking will continue to invest in the Suncorp strategy in the medium term, before returning to historic operating expense levels.
The benefits of Suncorp’s investment in the Core Banking Platform are being evidenced through ongoing
process improvements and provide a foundation to further enhance Suncorp’s digital and customer
experience offerings.
Suncorp is the first company globally to roll out and operate Oracle’s new end-to-end loan origination, servicing and collections platform, and the value of the platform is being realised by customers and the business.
Impairment losses on loans and advances
Full Year Ended Jun-17 Half Year Ended Jun-17 Jun-17
Jun-17 Jun-16 vs Jun-16 Jun-17 Dec-16 Jun-16 Dec-15 vs Dec-16 vs Jun-16
$M $M % $M $M $M $M % %
Collective provision for impairment (12) (18) (33.3) (6) (6) (11) (7) - (45.5)
Specific provision for impairment 9 32 (71.9) 9 - 16 16 n/a (43.8)
Actual net write-offs 10 2 400.0 3 7 - 2 (57.1) n/a
Impairment losses 7 16 (56.3) 6 1 5 11 500.0 20.0 Impairment losses to gross loans and advances (annualised) 0.01% 0.03% 0.02% 0.00% 0.02% 0.04%
Impairment losses of $7 million for the full year represents 1 basis point of gross loans and advances, and remains below the target operating range of 10 to 20 basis points.
Changes to Suncorp’s hardship policy and procedures, adopted from 1 December 2016 to align with
regulatory standards, are now being reflected in increased past due loan arrears as anticipated and communicated in the first half. The changes include a six-month monitoring phase of customers meeting an agreed payment plan, and subject to the payments being maintained over this period, the loans will return to performing status.
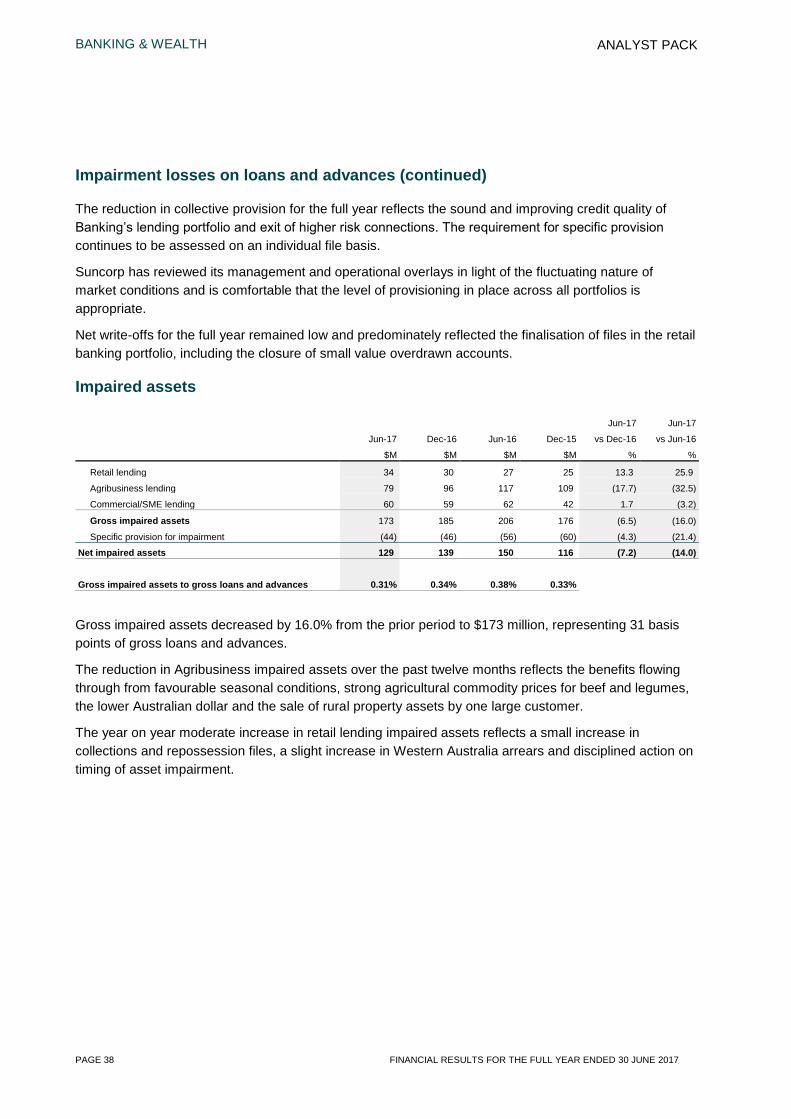
BANKING & WEALTH
PAGE 38 FINANCIAL RESULTS FOR THE FULL YEAR ENDED 30 JUNE 2017
ANALYST PACK
Impairment losses on loans and advances (continued)
The reduction in collective provision for the full year reflects the sound and improving credit quality of Banking’s lending portfolio and exit of higher risk connections. The requirement for specific provision
continues to be assessed on an individual file basis.
Suncorp has reviewed its management and operational overlays in light of the fluctuating nature of market conditions and is comfortable that the level of provisioning in place across all portfolios is appropriate.
Net write-offs for the full year remained low and predominately reflected the finalisation of files in the retail banking portfolio, including the closure of small value overdrawn accounts.
Impaired assets
Jun-17 Jun-17
Jun-17 Dec-16 Jun-16 Dec-15 vs Dec-16 vs Jun-16
$M $M $M $M % %
Retail lending 34 30 27 25 13.3 25.9
Agribusiness lending 79 96 117 109 (17.7) (32.5)
Commercial/SME lending 60 59 62 42 1.7 (3.2)
Gross impaired assets 173 185 206 176 (6.5) (16.0)
Specific provision for impairment (44) (46) (56) (60) (4.3) (21.4)
Net impaired assets 129 139 150 116 (7.2) (14.0)
Gross impaired assets to gross loans and advances 0.31% 0.34% 0.38% 0.33%
Gross impaired assets decreased by 16.0% from the prior period to $173 million, representing 31 basis points of gross loans and advances.
The reduction in Agribusiness impaired assets over the past twelve months reflects the benefits flowing through from favourable seasonal conditions, strong agricultural commodity prices for beef and legumes, the lower Australian dollar and the sale of rural property assets by one large customer.
The year on year moderate increase in retail lending impaired assets reflects a small increase in collections and repossession files, a slight increase in Western Australia arrears and disciplined action on timing of asset impairment.

BANKING & WEALTH
FINANCIAL RESULTS FOR THE FULL YEAR ENDED 30 JUNE 2017 PAGE 39
ANALYST PACK
Non-performing loans
Jun-17 Jun-17
Jun-17 Dec-16 Jun-16 Dec-15 vs Dec-16 vs Jun-16
$M $M $M $M % %
Gross balances of individually impaired loans Gross impaired assets 173 185 206 176 (6.5) (16.0)
Specific provision for impairment (44) (46) (56) (60) (4.3) (21.4)
Net impaired assets 129 139 150 116 (7.2) (14.0)
Size of gross individually impaired assets Less than one million 38 26 22 20 46.2 72.7
Greater than one million but less than ten million 73 102 117 100 (28.4) (37.6)
Greater than ten million 62 57 67 56 8.8 (7.5)
173 185 206 176 (6.5) (16.0)
Past due loans not shown as impaired assets 426 338 404 381 26.0 5.4
Gross non-performing loans 599 523 610 557 14.5 (1.8)
Analysis of movements in gross individually impaired assets
Balance at the beginning of the half year 185 206 176 218 (10.2) 5.1
Recognition of new impaired assets 40 55 86 48 (27.3) (53.5)
Increases in previously recognised impaired assets 1 3 4 2 (66.7) (75.0)
Impaired assets written off/sold during the half year (9) (7) (18) (35) 28.6 (50.0) Impaired assets which have been reclassed as performing assets or repaid (44) (72) (42) (57) (38.9) 4.8
Balance at the end of the half year 173 185 206 176 (6.5) (16.0)
Gross non-performing loans have declined 1.8% from the prior period to $599 million. The result was primarily driven by lower gross impaired assets from the finalisation of a large agribusiness file and increased past due loans not shown as impaired following changes to the hardship policy and procedures adopted from 1 December 2016.
Banking continues to closely monitor the portfolios in elevated risk areas for any material deterioration in lending quality. A limited number of customers in the agribusiness and commercial sectors and the retail portfolio have been impacted by Cyclone Debbie in Central and Northern Queensland, and the subsequent flooding to parts of South-East Queensland and Northern New South Wales. Suncorp is continuing to support customers who were impacted by the weather events with access to a Financial Assistance Package.
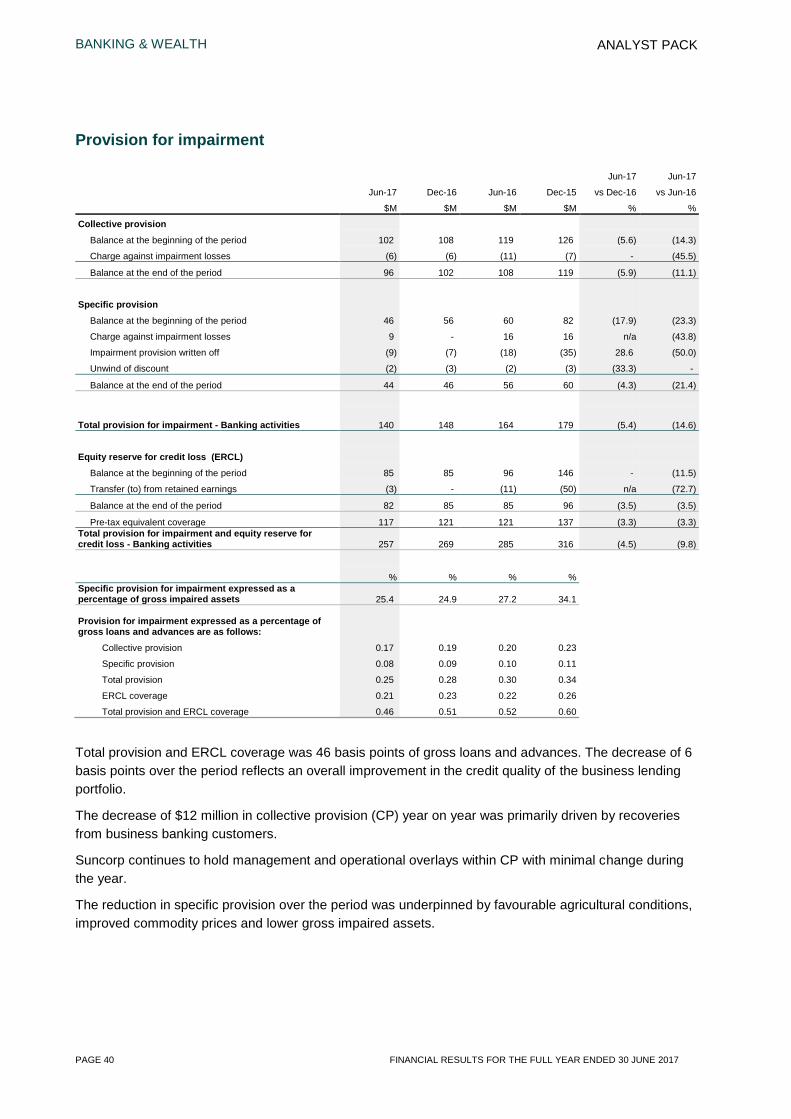
BANKING & WEALTH
PAGE 40 FINANCIAL RESULTS FOR THE FULL YEAR ENDED 30 JUNE 2017
ANALYST PACK
Provision for impairment
Jun-17 Jun-17
Jun-17 Dec-16 Jun-16 Dec-15 vs Dec-16 vs Jun-16
$M $M $M $M % %
Collective provision
Balance at the beginning of the period 102 108 119 126 (5.6) (14.3)
Charge against impairment losses (6) (6) (11) (7) - (45.5)
Balance at the end of the period 96 102 108 119 (5.9) (11.1)
Specific provision
Balance at the beginning of the period 46 56 60 82 (17.9) (23.3)
Charge against impairment losses 9 - 16 16 n/a (43.8)
Impairment provision written off (9) (7) (18) (35) 28.6 (50.0)
Unwind of discount (2) (3) (2) (3) (33.3) -
Balance at the end of the period 44 46 56 60 (4.3) (21.4)
Total provision for impairment - Banking activities 140 148 164 179 (5.4) (14.6)
Equity reserve for credit loss (ERCL)
Balance at the beginning of the period 85 85 96 146 - (11.5)
Transfer (to) from retained earnings (3) - (11) (50) n/a (72.7)
Balance at the end of the period 82 85 85 96 (3.5) (3.5)
Pre-tax equivalent coverage 117 121 121 137 (3.3) (3.3) Total provision for impairment and equity reserve for credit loss - Banking activities 257 269 285 316 (4.5) (9.8)
% % % % Specific provision for impairment expressed as a percentage of gross impaired assets 25.4 24.9 27.2 34.1
Provision for impairment expressed as a percentage of gross loans and advances are as follows:
Collective provision 0.17 0.19 0.20 0.23
Specific provision 0.08 0.09 0.10 0.11
Total provision 0.25 0.28 0.30 0.34
ERCL coverage 0.21 0.23 0.22 0.26
Total provision and ERCL coverage 0.46 0.51 0.52 0.60
Total provision and ERCL coverage was 46 basis points of gross loans and advances. The decrease of 6 basis points over the period reflects an overall improvement in the credit quality of the business lending portfolio.
The decrease of $12 million in collective provision (CP) year on year was primarily driven by recoveries from business banking customers.
Suncorp continues to hold management and operational overlays within CP with minimal change during the year.
The reduction in specific provision over the period was underpinned by favourable agricultural conditions, improved commodity prices and lower gross impaired assets.
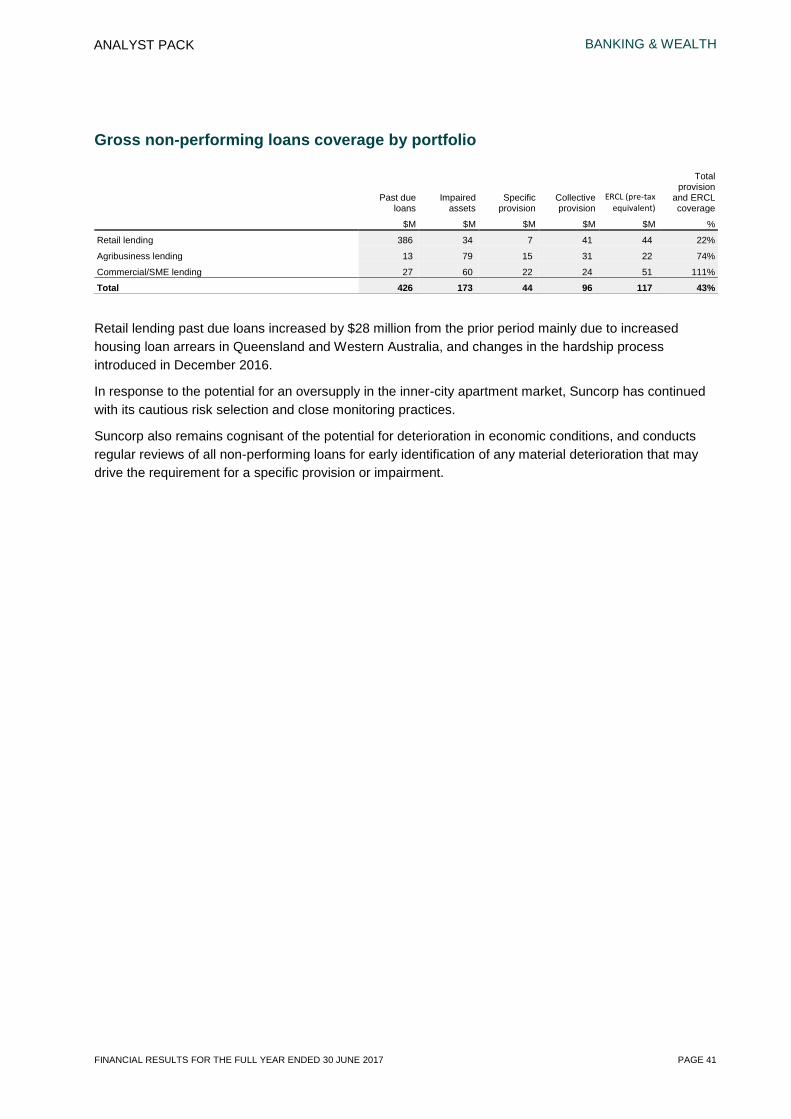
BANKING & WEALTH
FINANCIAL RESULTS FOR THE FULL YEAR ENDED 30 JUNE 2017 PAGE 41
ANALYST PACK
Gross non-performing loans coverage by portfolio
Past due
loans Impaired
assets Specific
provision Collective provision
ERCL (pre-tax equivalent)
Total provision
and ERCL coverage
$M $M $M $M $M %
Retail lending 386 34 7 41 44 22%
Agribusiness lending 13 79 15 31 22 74%
Commercial/SME lending 27 60 22 24 51 111%
Total 426 173 44 96 117 43%
Retail lending past due loans increased by $28 million from the prior period mainly due to increased housing loan arrears in Queensland and Western Australia, and changes in the hardship process introduced in December 2016.
In response to the potential for an oversupply in the inner-city apartment market, Suncorp has continued with its cautious risk selection and close monitoring practices.
Suncorp also remains cognisant of the potential for deterioration in economic conditions, and conducts regular reviews of all non-performing loans for early identification of any material deterioration that may drive the requirement for a specific provision or impairment.
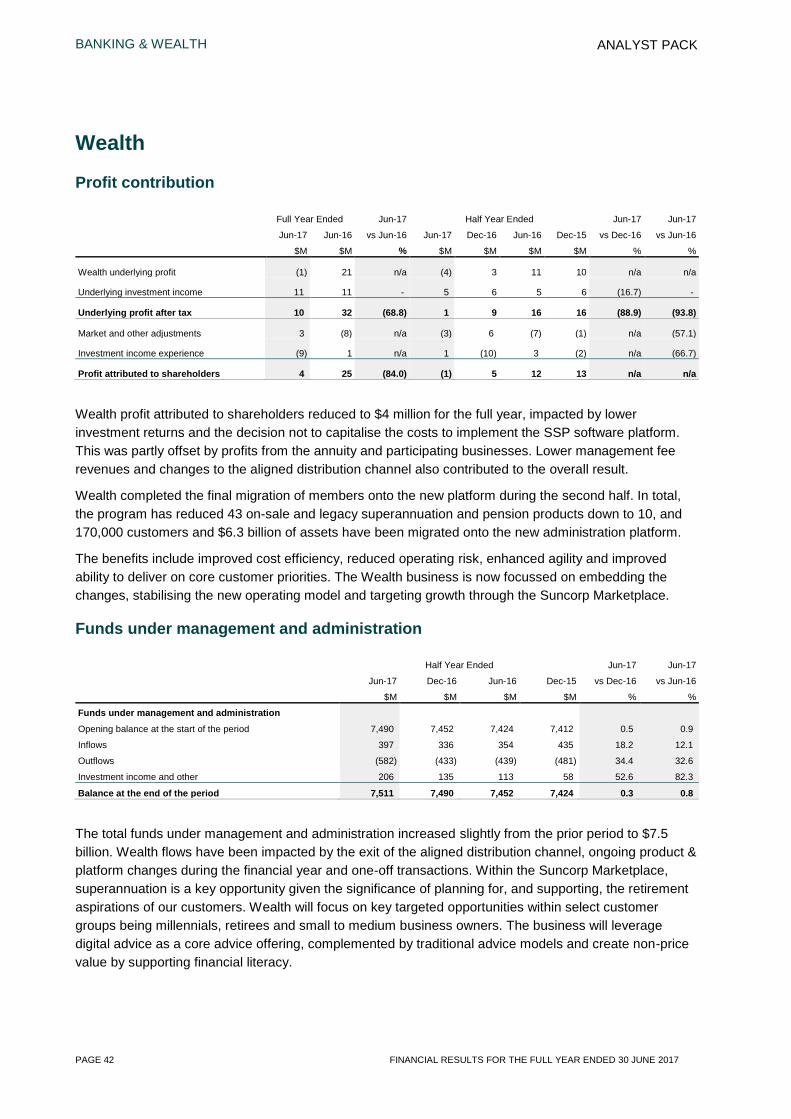
BANKING & WEALTH
PAGE 42 FINANCIAL RESULTS FOR THE FULL YEAR ENDED 30 JUNE 2017
ANALYST PACK
Wealth Profit contribution
Full Year Ended Jun-17 Half Year Ended Jun-17 Jun-17
Jun-17 Jun-16 vs Jun-16 Jun-17 Dec-16 Jun-16 Dec-15 vs Dec-16 vs Jun-16
$M $M % $M $M $M $M % %
Wealth underlying profit (1) 21 n/a (4) 3 11 10 n/a n/a
Underlying investment income 11 11 - 5 6 5 6 (16.7) -
Underlying profit after tax 10 32 (68.8) 1 9 16 16 (88.9) (93.8)
Market and other adjustments 3 (8) n/a (3) 6 (7) (1) n/a (57.1)
Investment income experience (9) 1 n/a 1 (10) 3 (2) n/a (66.7)
Profit attributed to shareholders 4 25 (84.0) (1) 5 12 13 n/a n/a
Wealth profit attributed to shareholders reduced to $4 million for the full year, impacted by lower investment returns and the decision not to capitalise the costs to implement the SSP software platform. This was partly offset by profits from the annuity and participating businesses. Lower management fee revenues and changes to the aligned distribution channel also contributed to the overall result.
Wealth completed the final migration of members onto the new platform during the second half. In total, the program has reduced 43 on-sale and legacy superannuation and pension products down to 10, and 170,000 customers and $6.3 billion of assets have been migrated onto the new administration platform.
The benefits include improved cost efficiency, reduced operating risk, enhanced agility and improved ability to deliver on core customer priorities. The Wealth business is now focussed on embedding the changes, stabilising the new operating model and targeting growth through the Suncorp Marketplace.
Funds under management and administration
Half Year Ended Jun-17 Jun-17
Jun-17 Dec-16 Jun-16 Dec-15 vs Dec-16 vs Jun-16
$M $M $M $M % %
Funds under management and administration
Opening balance at the start of the period 7,490 7,452 7,424 7,412 0.5 0.9
Inflows 397 336 354 435 18.2 12.1
Outflows (582) (433) (439) (481) 34.4 32.6
Investment income and other 206 135 113 58 52.6 82.3
Balance at the end of the period 7,511 7,490 7,452 7,424 0.3 0.8
The total funds under management and administration increased slightly from the prior period to $7.5 billion. Wealth flows have been impacted by the exit of the aligned distribution channel, ongoing product & platform changes during the financial year and one-off transactions. Within the Suncorp Marketplace, superannuation is a key opportunity given the significance of planning for, and supporting, the retirement aspirations of our customers. Wealth will focus on key targeted opportunities within select customer groups being millennials, retirees and small to medium business owners. The business will leverage digital advice as a core advice offering, complemented by traditional advice models and create non-price value by supporting financial literacy.
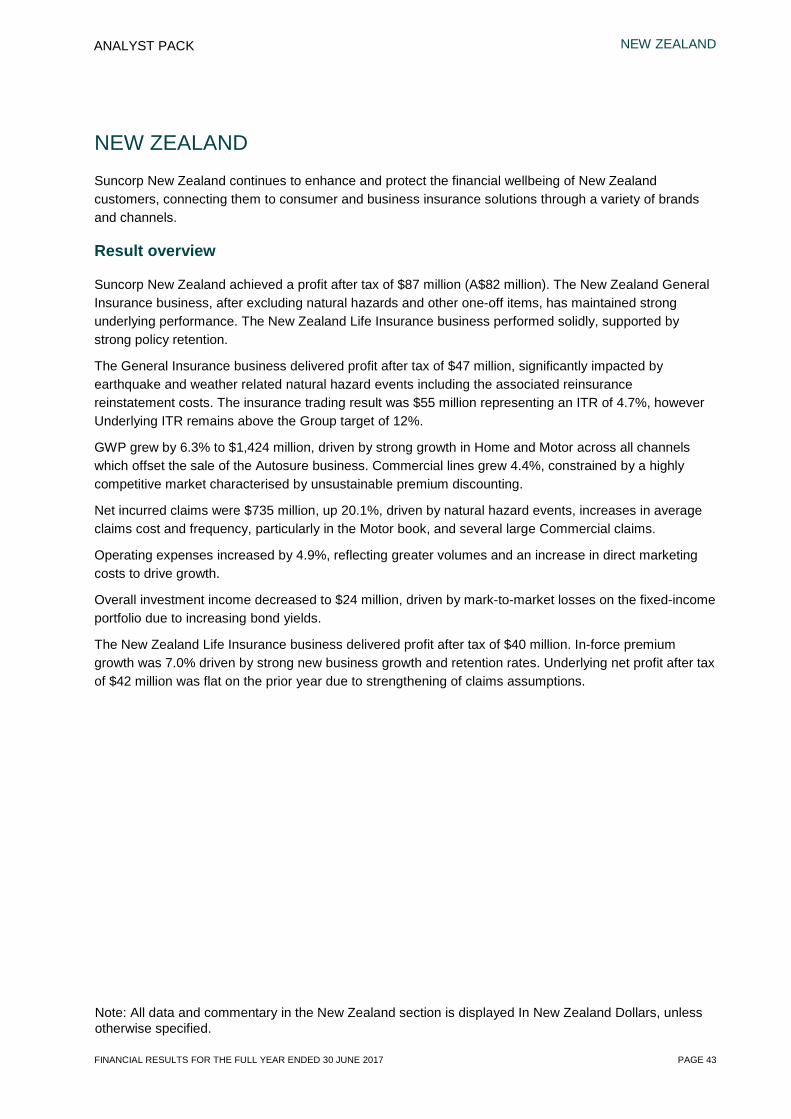
NEW ZEALAND
FINANCIAL RESULTS FOR THE FULL YEAR ENDED 30 JUNE 2017 PAGE 43
ANALYST PACK
Note: All data and commentary in the New Zealand section is displayed In New Zealand Dollars, unless otherwise specified.
NEW ZEALAND Suncorp New Zealand continues to enhance and protect the financial wellbeing of New Zealand customers, connecting them to consumer and business insurance solutions through a variety of brands and channels.
Result overview
Suncorp New Zealand achieved a profit after tax of $87 million (A$82 million). The New Zealand General Insurance business, after excluding natural hazards and other one-off items, has maintained strong underlying performance. The New Zealand Life Insurance business performed solidly, supported by strong policy retention.
The General Insurance business delivered profit after tax of $47 million, significantly impacted by earthquake and weather related natural hazard events including the associated reinsurance reinstatement costs. The insurance trading result was $55 million representing an ITR of 4.7%, however Underlying ITR remains above the Group target of 12%.
GWP grew by 6.3% to $1,424 million, driven by strong growth in Home and Motor across all channels which offset the sale of the Autosure business. Commercial lines grew 4.4%, constrained by a highly competitive market characterised by unsustainable premium discounting.
Net incurred claims were $735 million, up 20.1%, driven by natural hazard events, increases in average claims cost and frequency, particularly in the Motor book, and several large Commercial claims.
Operating expenses increased by 4.9%, reflecting greater volumes and an increase in direct marketing costs to drive growth.
Overall investment income decreased to $24 million, driven by mark-to-market losses on the fixed-income portfolio due to increasing bond yields.
The New Zealand Life Insurance business delivered profit after tax of $40 million. In-force premium growth was 7.0% driven by strong new business growth and retention rates. Underlying net profit after tax of $42 million was flat on the prior year due to strengthening of claims assumptions.
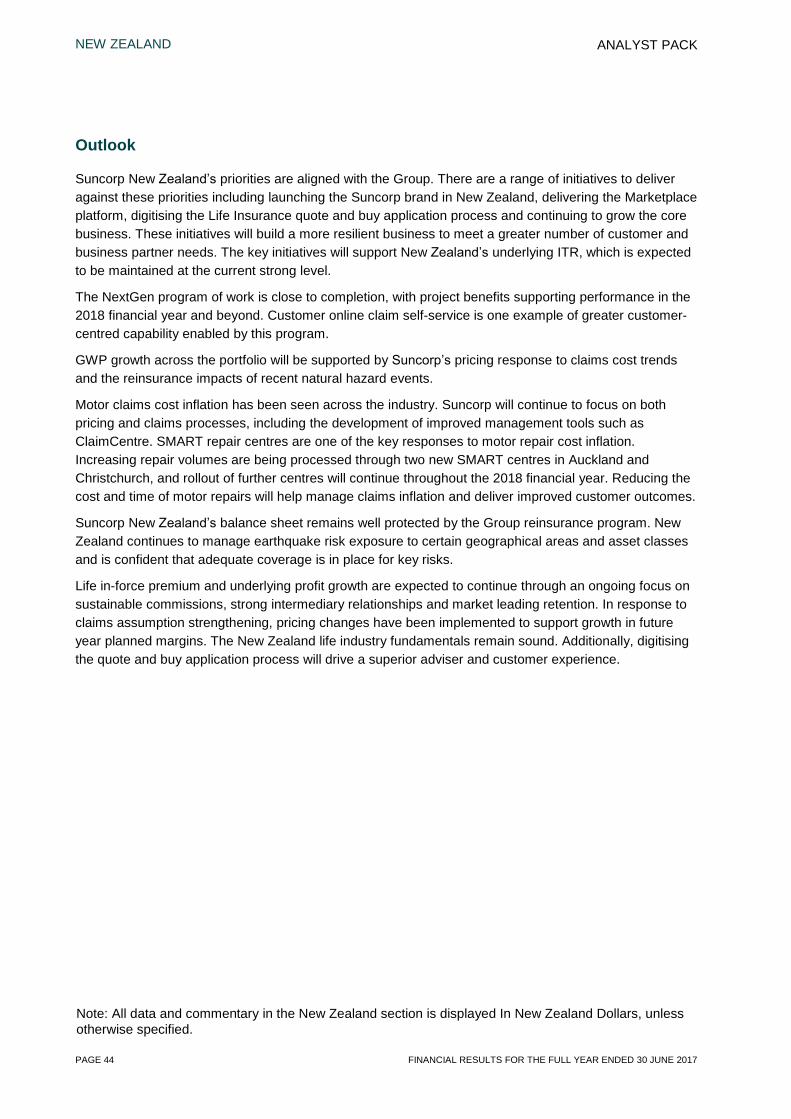
NEW ZEALAND
PAGE 44 FINANCIAL RESULTS FOR THE FULL YEAR ENDED 30 JUNE 2017
ANALYST PACK
Note: All data and commentary in the New Zealand section is displayed In New Zealand Dollars, unless otherwise specified.
Outlook
Suncorp New Zealand’s priorities are aligned with the Group. There are a range of initiatives to deliver against these priorities including launching the Suncorp brand in New Zealand, delivering the Marketplace platform, digitising the Life Insurance quote and buy application process and continuing to grow the core business. These initiatives will build a more resilient business to meet a greater number of customer and business partner needs. The key initiatives will support New Zealand’s underlying ITR, which is expected to be maintained at the current strong level.
The NextGen program of work is close to completion, with project benefits supporting performance in the 2018 financial year and beyond. Customer online claim self-service is one example of greater customer-centred capability enabled by this program.
GWP growth across the portfolio will be supported by Suncorp’s pricing response to claims cost trends and the reinsurance impacts of recent natural hazard events.
Motor claims cost inflation has been seen across the industry. Suncorp will continue to focus on both pricing and claims processes, including the development of improved management tools such as ClaimCentre. SMART repair centres are one of the key responses to motor repair cost inflation. Increasing repair volumes are being processed through two new SMART centres in Auckland and Christchurch, and rollout of further centres will continue throughout the 2018 financial year. Reducing the cost and time of motor repairs will help manage claims inflation and deliver improved customer outcomes.
Suncorp New Zealand’s balance sheet remains well protected by the Group reinsurance program. New Zealand continues to manage earthquake risk exposure to certain geographical areas and asset classes and is confident that adequate coverage is in place for key risks.
Life in-force premium and underlying profit growth are expected to continue through an ongoing focus on sustainable commissions, strong intermediary relationships and market leading retention. In response to claims assumption strengthening, pricing changes have been implemented to support growth in future year planned margins. The New Zealand life industry fundamentals remain sound. Additionally, digitising the quote and buy application process will drive a superior adviser and customer experience.
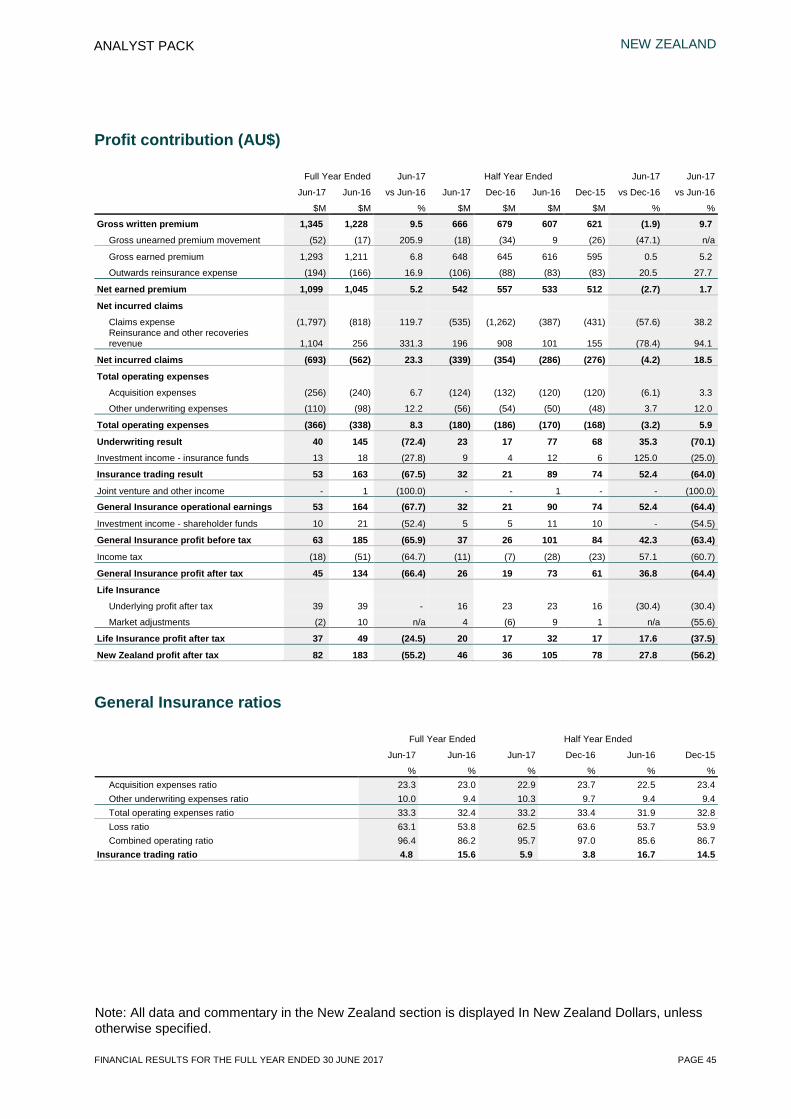
NEW ZEALAND
FINANCIAL RESULTS FOR THE FULL YEAR ENDED 30 JUNE 2017 PAGE 45
ANALYST PACK
Note: All data and commentary in the New Zealand section is displayed In New Zealand Dollars, unless otherwise specified.
Profit contribution (AU$)
Full Year Ended Jun-17 Half Year Ended Jun-17 Jun-17
Jun-17 Jun-16 vs Jun-16 Jun-17 Dec-16 Jun-16 Dec-15 vs Dec-16 vs Jun-16
$M $M % $M $M $M $M % %
Gross written premium 1,345 1,228 9.5 666 679 607 621 (1.9) 9.7 Gross unearned premium movement (52) (17) 205.9 (18) (34) 9 (26) (47.1) n/a
Gross earned premium 1,293 1,211 6.8 648 645 616 595 0.5 5.2
Outwards reinsurance expense (194) (166) 16.9 (106) (88) (83) (83) 20.5 27.7
Net earned premium 1,099 1,045 5.2 542 557 533 512 (2.7) 1.7
Net incurred claims
Claims expense (1,797) (818) 119.7 (535) (1,262) (387) (431) (57.6) 38.2 Reinsurance and other recoveries revenue 1,104 256 331.3 196 908 101 155 (78.4) 94.1
Net incurred claims (693) (562) 23.3 (339) (354) (286) (276) (4.2) 18.5
Total operating expenses
Acquisition expenses (256) (240) 6.7 (124) (132) (120) (120) (6.1) 3.3
Other underwriting expenses (110) (98) 12.2 (56) (54) (50) (48) 3.7 12.0
Total operating expenses (366) (338) 8.3 (180) (186) (170) (168) (3.2) 5.9
Underwriting result 40 145 (72.4) 23 17 77 68 35.3 (70.1) Investment income - insurance funds 13 18 (27.8) 9 4 12 6 125.0 (25.0)
Insurance trading result 53 163 (67.5) 32 21 89 74 52.4 (64.0)
Joint venture and other income - 1 (100.0) - - 1 - - (100.0)
General Insurance operational earnings 53 164 (67.7) 32 21 90 74 52.4 (64.4)
Investment income - shareholder funds 10 21 (52.4) 5 5 11 10 - (54.5)
General Insurance profit before tax 63 185 (65.9) 37 26 101 84 42.3 (63.4)
Income tax (18) (51) (64.7) (11) (7) (28) (23) 57.1 (60.7)
General Insurance profit after tax 45 134 (66.4) 26 19 73 61 36.8 (64.4)
Life Insurance Underlying profit after tax 39 39 - 16 23 23 16 (30.4) (30.4)
Market adjustments (2) 10 n/a 4 (6) 9 1 n/a (55.6)
Life Insurance profit after tax 37 49 (24.5) 20 17 32 17 17.6 (37.5)
New Zealand profit after tax 82 183 (55.2) 46 36 105 78 27.8 (56.2)
General Insurance ratios
Full Year Ended Half Year Ended
Jun-17 Jun-16 Jun-17 Dec-16 Jun-16 Dec-15
% % % % % % Acquisition expenses ratio 23.3 23.0 22.9 23.7 22.5 23.4 Other underwriting expenses ratio 10.0 9.4 10.3 9.7 9.4 9.4 Total operating expenses ratio 33.3 32.4 33.2 33.4 31.9 32.8 Loss ratio 63.1 53.8 62.5 63.6 53.7 53.9 Combined operating ratio 96.4 86.2 95.7 97.0 85.6 86.7
Insurance trading ratio 4.8 15.6 5.9 3.8 16.7 14.5

NEW ZEALAND
PAGE 46 FINANCIAL RESULTS FOR THE FULL YEAR ENDED 30 JUNE 2017
ANALYST PACK
Note: All data and commentary in the New Zealand section is displayed In New Zealand Dollars, unless otherwise specified.
Profit contribution (NZ$)
Full Year Ended Jun-17 Half Year Ended Jun-17 Jun-17
Jun-17 Jun-16 vs Jun-16 Jun-17 Dec-16 Jun-16 Dec-15 vs Dec-16 vs Jun-16
$M $M % $M $M $M $M % %
Gross written premium 1,424 1,339 6.3 710 714 658 681 (0.6) 7.9 Gross unearned premium movement (55) (19) 189.5 (19) (36) 9 (28) (47.2) n/a
Gross earned premium 1,369 1,320 3.7 691 678 667 653 1.9 3.6
Outwards reinsurance expense (206) (181) 13.8 (114) (92) (90) (91) 23.9 26.7
Net earned premium 1,163 1,139 2.1 577 586 577 562 (1.5) -
Net incurred claims
Claims expense (1,897) (890) 113.1 (570) (1,327) (415) (475) (57.0) 37.3 Reinsurance and other recoveries revenue 1,162 278 318.0 207 955 106 172 (78.3) 95.3
Net incurred claims (735) (612) 20.1 (363) (372) (309) (303) (2.4) 17.5
Total operating expenses
Acquisition expenses (271) (263) 3.0 (132) (139) (132) (131) (5.0) -
Other underwriting expenses (116) (106) 9.4 (59) (57) (54) (52) 3.5 9.3
Total operating expenses (387) (369) 4.9 (191) (196) (186) (183) (2.6) 2.7
Underwriting result 41 158 (74.1) 23 18 82 76 27.8 (72.0) Investment income - insurance funds 14 20 (30.0) 10 4 13 7 150.0 (23.1)
Insurance trading result 55 178 (69.1) 33 22 95 83 50.0 (65.3)
Joint venture and other income - 1 (100.0) - - 1 - - (100.0)
General Insurance operational earnings 55 179 (69.3) 33 22 96 83 50.0 (65.6) Investment income - shareholder funds 10 23 (56.5) 5 5 13 10 - (61.5)
General Insurance profit before tax 65 202 (67.8) 38 27 109 93 40.7 (65.1)
Income tax (18) (55) (67.3) (10) (8) (30) (25) 25.0 (66.7)
General Insurance profit after tax 47 147 (68.0) 28 19 79 68 47.4 (64.6)
Life Insurance Underlying profit after tax 42 42 - 18 24 25 17 (25.0) (28.0)
Market adjustments (2) 11 n/a 4 (6) 9 2 n/a (55.6)
Life Insurance profit after tax 40 53 (24.5) 22 18 34 19 22.2 (35.3)
New Zealand profit after tax 87 200 (56.5) 50 37 113 87 35.1 (55.8)
General Insurance ratios
Full Year Ended Half Year Ended
Jun-17 Jun-16 Jun-17 Dec-16 Jun-16 Dec-15
% % % % % % Acquisition expenses ratio 23.3 23.1 22.9 23.7 22.9 23.3 Other underwriting expenses ratio 10.0 9.3 10.2 9.7 9.4 9.3 Total operating expenses ratio 33.3 32.4 33.1 33.4 32.3 32.6 Loss ratio 63.2 53.7 62.9 63.5 53.6 53.9 Combined operating ratio 96.5 86.1 96.0 96.9 85.9 86.5
Insurance trading ratio 4.7 15.6 5.7 3.8 16.5 14.8

NEW ZEALAND
FINANCIAL RESULTS FOR THE FULL YEAR ENDED 30 JUNE 2017 PAGE 47
ANALYST PACK
Note: All data and commentary in the New Zealand section is displayed In New Zealand Dollars, unless otherwise specified.
General Insurance
Gross Written Premium
Full Year Ended Jun-17 Half Year Ended Jun-17 Jun-17
Jun-17 Jun-16 vs Jun-16 Jun-17 Dec-16 Jun-16 Dec-15 vs Dec-16 vs Jun-16
$M $M % $M $M $M $M % %
Gross written premium by product
Motor 340 317 7.3 176 164 163 154 7.3 8.0
Home 473 427 10.8 247 226 219 208 9.3 12.8
Commercial 571 547 4.4 273 298 252 295 (8.4) 8.3
Other 40 48 (16.7) 14 26 24 24 (46.2) (41.7)
Total 1,424 1,339 6.3 710 714 658 681 (0.6) 7.9
Motor
Motor GWP grew 7.3% to $340 million.
Growth has been achieved in all channels, with strong performance through the AA Insurance direct business and key corporate partnerships. Growth has been supported by both price and units, with unit growth driven by increased market share and underlying system growth, with more cars on New Zealand roads. Growth also reflects a new corporate partnership with Turners Limited.
Home
Home GWP grew 10.8% to $473 million.
Home growth has been achieved across all channels through strong retention and increases in new business. Unit growth was underpinned by direct marketing campaigns and strong key corporate partner performance. Product pricing changes have been implemented in response to an increase in claim and reinsurance costs.
Commercial
Commercial lines include Property, Commercial Motor, Liability, Marine and Engineering insurances. Commercial GWP grew 4.4% to $571 million.
The business maintained a disciplined approach to underwriting, with a focus on margins in a market that continues to face pricing pressures, driven by aggressive growth of large international providers and new entrants. Pricing changes have been implemented in the second half to mitigate increased earthquake reinsurance premiums. There are early indications of price hardening in response to recent natural hazard events.
Other
Other products include the Autosure Motor warranty book, sold in March 2017. The sale has resulted in an $8 million reduction in GWP in the period.
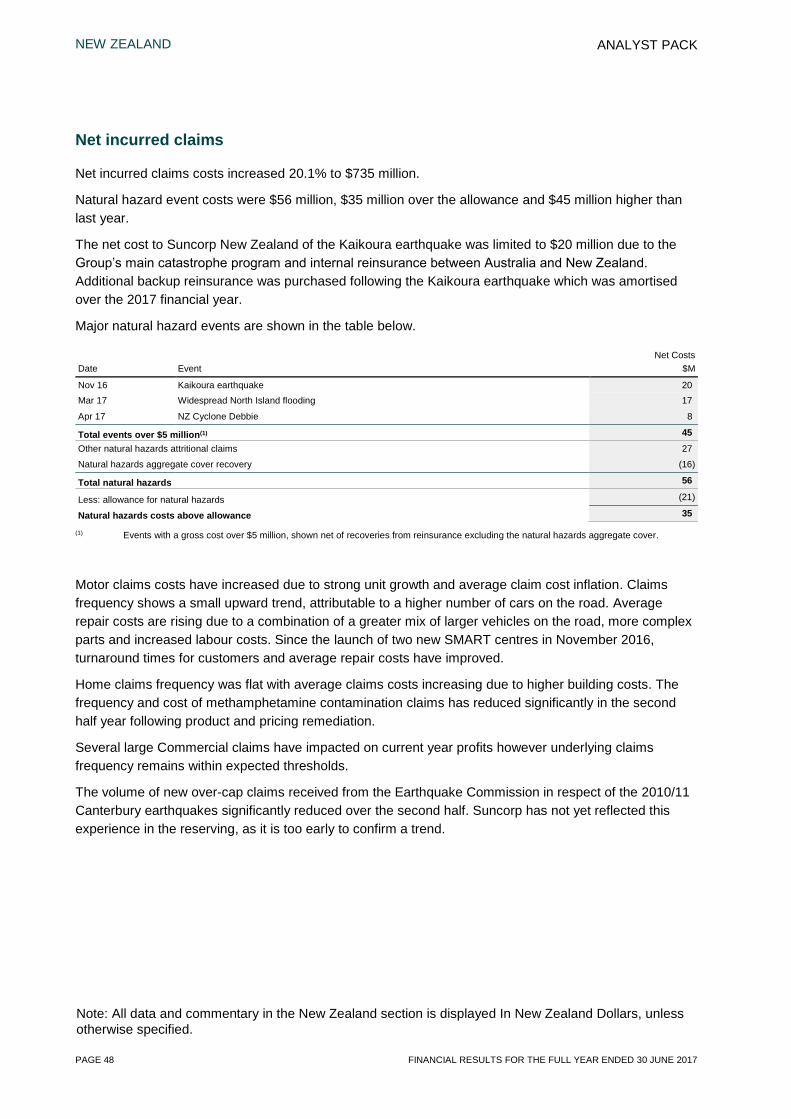
NEW ZEALAND
PAGE 48 FINANCIAL RESULTS FOR THE FULL YEAR ENDED 30 JUNE 2017
ANALYST PACK
Note: All data and commentary in the New Zealand section is displayed In New Zealand Dollars, unless otherwise specified.
Net incurred claims
Net incurred claims costs increased 20.1% to $735 million.
Natural hazard event costs were $56 million, $35 million over the allowance and $45 million higher than last year.
The net cost to Suncorp New Zealand of the Kaikoura earthquake was limited to $20 million due to the Group’s main catastrophe program and internal reinsurance between Australia and New Zealand.
Additional backup reinsurance was purchased following the Kaikoura earthquake which was amortised over the 2017 financial year.
Major natural hazard events are shown in the table below.
Net Costs Date Event $M
Nov 16 Kaikoura earthquake 20 Mar 17 Widespread North Island flooding 17
Apr 17 NZ Cyclone Debbie 8
Total events over $5 million(1) 45 Other natural hazards attritional claims 27
Natural hazards aggregate cover recovery (16)
Total natural hazards 56
Less: allowance for natural hazards (21)
Natural hazards costs above allowance 35
(1) Events with a gross cost over $5 million, shown net of recoveries from reinsurance excluding the natural hazards aggregate cover.
Motor claims costs have increased due to strong unit growth and average claim cost inflation. Claims frequency shows a small upward trend, attributable to a higher number of cars on the road. Average repair costs are rising due to a combination of a greater mix of larger vehicles on the road, more complex parts and increased labour costs. Since the launch of two new SMART centres in November 2016, turnaround times for customers and average repair costs have improved.
Home claims frequency was flat with average claims costs increasing due to higher building costs. The frequency and cost of methamphetamine contamination claims has reduced significantly in the second half year following product and pricing remediation.
Several large Commercial claims have impacted on current year profits however underlying claims frequency remains within expected thresholds.
The volume of new over-cap claims received from the Earthquake Commission in respect of the 2010/11 Canterbury earthquakes significantly reduced over the second half. Suncorp has not yet reflected this experience in the reserving, as it is too early to confirm a trend.
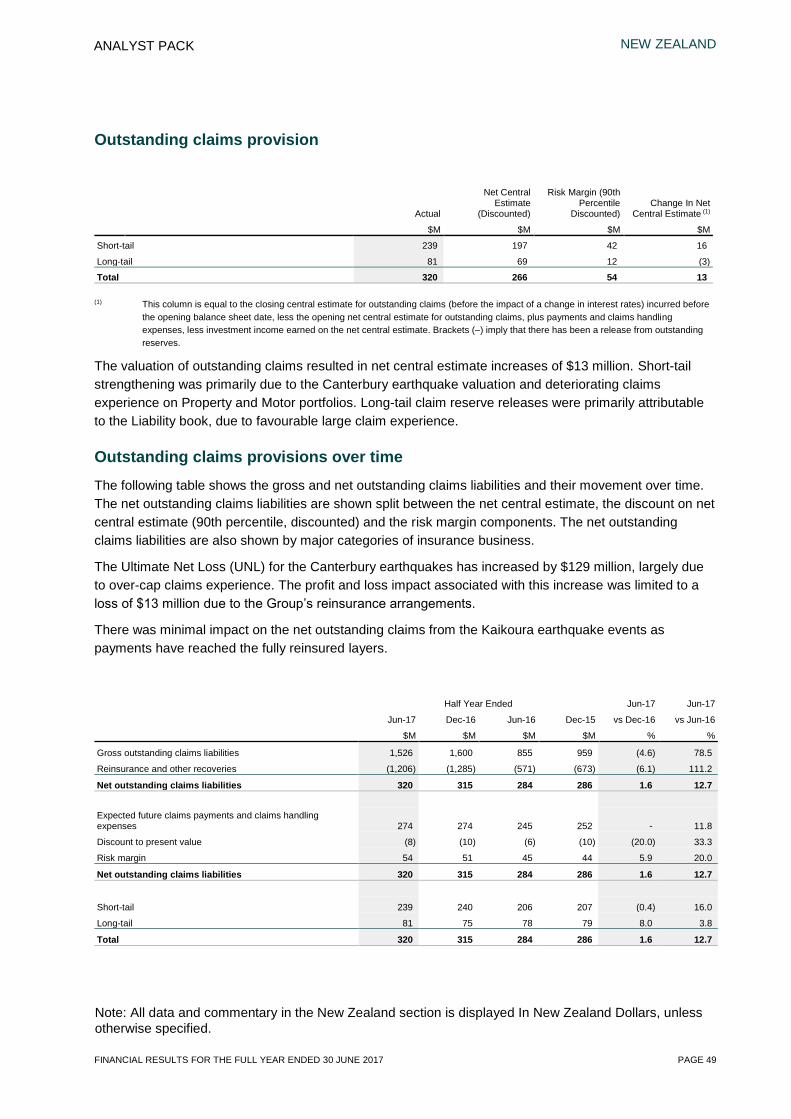
NEW ZEALAND
FINANCIAL RESULTS FOR THE FULL YEAR ENDED 30 JUNE 2017 PAGE 49
ANALYST PACK
Note: All data and commentary in the New Zealand section is displayed In New Zealand Dollars, unless otherwise specified.
Outstanding claims provision
Actual
Net Central Estimate
(Discounted)
Risk Margin (90th Percentile
Discounted) Change In Net
Central Estimate (1)
$M $M $M $M
Short-tail 239 197 42 16
Long-tail 81 69 12 (3)
Total 320 266 54 13
(1) This column is equal to the closing central estimate for outstanding claims (before the impact of a change in interest rates) incurred before the opening balance sheet date, less the opening net central estimate for outstanding claims, plus payments and claims handling expenses, less investment income earned on the net central estimate. Brackets (–) imply that there has been a release from outstanding reserves.
The valuation of outstanding claims resulted in net central estimate increases of $13 million. Short-tail strengthening was primarily due to the Canterbury earthquake valuation and deteriorating claims experience on Property and Motor portfolios. Long-tail claim reserve releases were primarily attributable to the Liability book, due to favourable large claim experience.
Outstanding claims provisions over time
The following table shows the gross and net outstanding claims liabilities and their movement over time. The net outstanding claims liabilities are shown split between the net central estimate, the discount on net central estimate (90th percentile, discounted) and the risk margin components. The net outstanding claims liabilities are also shown by major categories of insurance business.
The Ultimate Net Loss (UNL) for the Canterbury earthquakes has increased by $129 million, largely due to over-cap claims experience. The profit and loss impact associated with this increase was limited to a loss of $13 million due to the Group’s reinsurance arrangements.
There was minimal impact on the net outstanding claims from the Kaikoura earthquake events as payments have reached the fully reinsured layers.
Half Year Ended Jun-17 Jun-17
Jun-17 Dec-16 Jun-16 Dec-15 vs Dec-16 vs Jun-16
$M $M $M $M % %
Gross outstanding claims liabilities 1,526 1,600 855 959 (4.6) 78.5
Reinsurance and other recoveries (1,206) (1,285) (571) (673) (6.1) 111.2
Net outstanding claims liabilities 320 315 284 286 1.6 12.7
Expected future claims payments and claims handling expenses 274 274 245 252 - 11.8
Discount to present value (8) (10) (6) (10) (20.0) 33.3
Risk margin 54 51 45 44 5.9 20.0
Net outstanding claims liabilities 320 315 284 286 1.6 12.7
Short-tail 239 240 206 207 (0.4) 16.0
Long-tail 81 75 78 79 8.0 3.8
Total 320 315 284 286 1.6 12.7
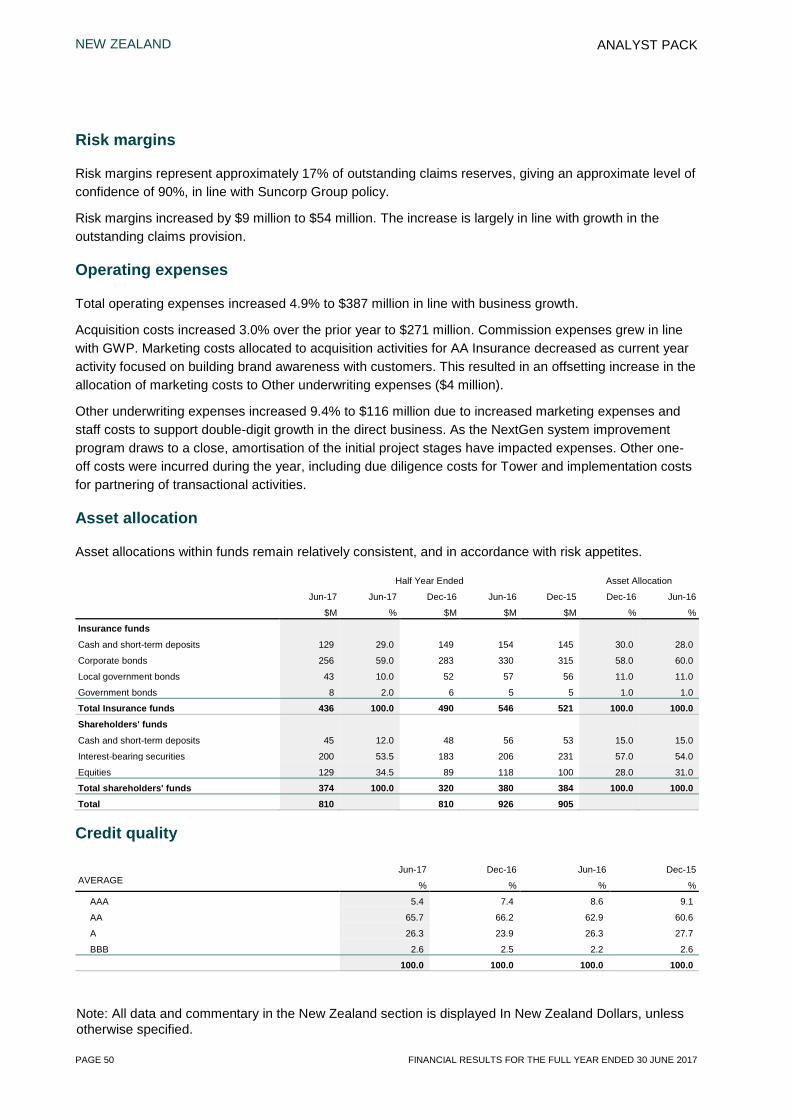
NEW ZEALAND
PAGE 50 FINANCIAL RESULTS FOR THE FULL YEAR ENDED 30 JUNE 2017
ANALYST PACK
Note: All data and commentary in the New Zealand section is displayed In New Zealand Dollars, unless otherwise specified.
Risk margins
Risk margins represent approximately 17% of outstanding claims reserves, giving an approximate level of confidence of 90%, in line with Suncorp Group policy.
Risk margins increased by $9 million to $54 million. The increase is largely in line with growth in the outstanding claims provision.
Operating expenses
Total operating expenses increased 4.9% to $387 million in line with business growth.
Acquisition costs increased 3.0% over the prior year to $271 million. Commission expenses grew in line with GWP. Marketing costs allocated to acquisition activities for AA Insurance decreased as current year activity focused on building brand awareness with customers. This resulted in an offsetting increase in the allocation of marketing costs to Other underwriting expenses ($4 million).
Other underwriting expenses increased 9.4% to $116 million due to increased marketing expenses and staff costs to support double-digit growth in the direct business. As the NextGen system improvement program draws to a close, amortisation of the initial project stages have impacted expenses. Other one-off costs were incurred during the year, including due diligence costs for Tower and implementation costs for partnering of transactional activities.
Asset allocation
Asset allocations within funds remain relatively consistent, and in accordance with risk appetites.
Half Year Ended Asset Allocation
Jun-17 Jun-17 Dec-16 Jun-16 Dec-15 Dec-16 Jun-16
$M % $M $M $M % %
Insurance funds
Cash and short-term deposits 129 29.0 149 154 145 30.0 28.0
Corporate bonds 256 59.0 283 330 315 58.0 60.0
Local government bonds 43 10.0 52 57 56 11.0 11.0
Government bonds 8 2.0 6 5 5 1.0 1.0
Total Insurance funds 436 100.0 490 546 521 100.0 100.0 Shareholders' funds
Cash and short-term deposits 45 12.0 48 56 53 15.0 15.0
Interest-bearing securities 200 53.5 183 206 231 57.0 54.0
Equities 129 34.5 89 118 100 28.0 31.0
Total shareholders' funds 374 100.0 320 380 384 100.0 100.0 Total 810 810 926 905
Credit quality
Jun-17 Dec-16 Jun-16 Dec-15 AVERAGE % % % %
AAA 5.4 7.4 8.6 9.1
AA 65.7 66.2 62.9 60.6
A 26.3 23.9 26.3 27.7
BBB 2.6 2.5 2.2 2.6
100.0 100.0 100.0 100.0

NEW ZEALAND
FINANCIAL RESULTS FOR THE FULL YEAR ENDED 30 JUNE 2017 PAGE 51
ANALYST PACK
Note: All data and commentary in the New Zealand section is displayed In New Zealand Dollars, unless otherwise specified.
Duration
Duration (Yrs) Jun-17 Dec-16 Jun-16 Dec-15
Insurance funds Interest rate duration 1.2 1.2 1.4 1.4
Shareholders' funds Interest rate duration 2.4 2.5 2.6 2.5
Investment performance
Total investment income was $24 million representing an annualised return of 2.8%. Overall investment income was lower than the prior year, as the rise in global bond yields resulted in mark to market losses on fixed interest investments. Investment assets were lower due to cash outflows related to natural hazard claim events.
Investment income on insurance funds was $14 million, which included mark-to-market losses of $3 million. Underlying investment income on insurance funds was $17 million, representing an annualised return of 3.5%.
Investment income on shareholders’ funds was $10 million representing an annualised return of 2.8%. Mark-to-market losses were $9 million, which includes $3 million relating to the shareholding in Tower. Excluding these losses, underlying investment income on shareholders’ funds was $19 million, representing an annualised return of 5.3%.
Full Year Ended Jun-17 Half Year Ended Jun-17 Jun-17
Jun-17 Jun-16 vs Jun-16 Jun-17 Dec-16 Jun-16 Dec-15 vs Dec-16 vs Jun-16
$M $M % $M $M $M $M % %
Investment income on insurance funds
Cash and short-term deposits 2 4 (50.0) 1 1 2 2 - (50.0)
Interest-bearing securities and other 12 16 (25.0) 9 3 11 5 200.0 (18.2)
Total 14 20 (30.0) 10 4 13 7 150.0 (23.1)
Investment income on shareholder funds
Cash and short-term deposits 2 3 (33.3) 1 1 1 2 - -
Interest-bearing securities 4 11 (63.6) 3 1 7 4 200.0 (57.1)
Equities 4 9 (55.6) 1 3 5 4 (66.7) (80.0)
Total 10 23 (56.5) 5 5 13 10 - (61.5)
Total investment income 24 43 (44.2) 15 9 26 17 66.7 (42.3)
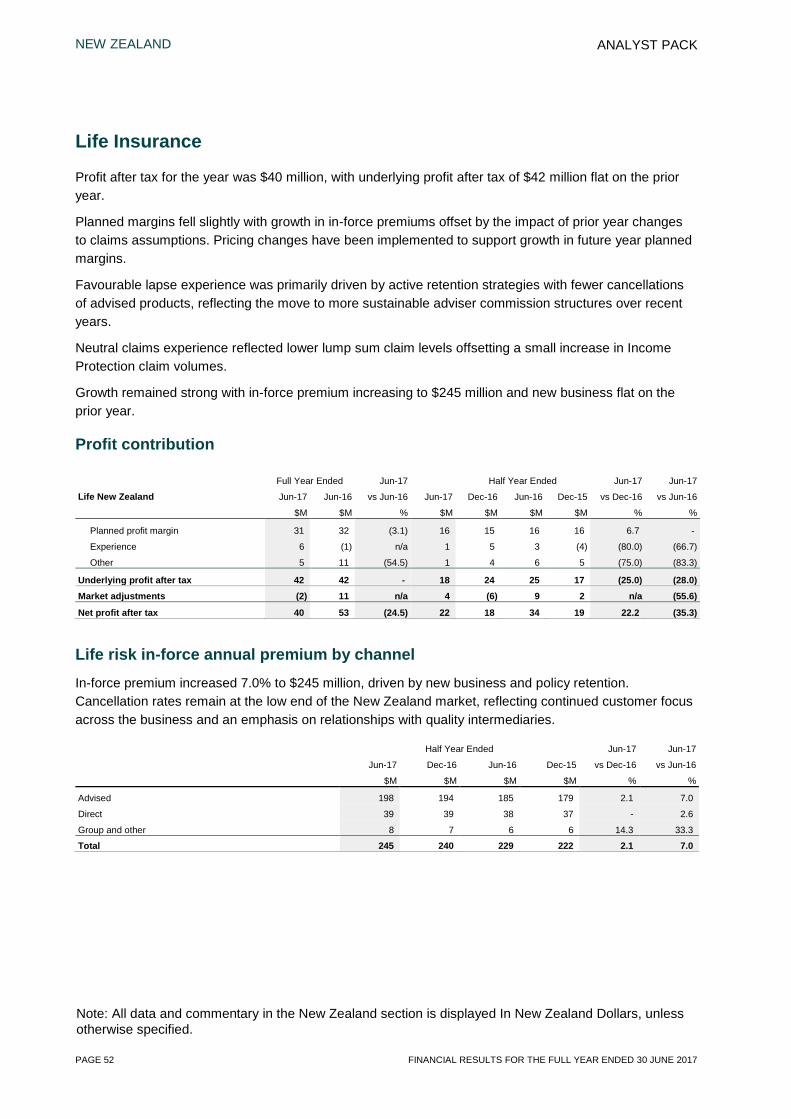
NEW ZEALAND
PAGE 52 FINANCIAL RESULTS FOR THE FULL YEAR ENDED 30 JUNE 2017
ANALYST PACK
Note: All data and commentary in the New Zealand section is displayed In New Zealand Dollars, unless otherwise specified.
Life Insurance
Profit after tax for the year was $40 million, with underlying profit after tax of $42 million flat on the prior year.
Planned margins fell slightly with growth in in-force premiums offset by the impact of prior year changes to claims assumptions. Pricing changes have been implemented to support growth in future year planned margins.
Favourable lapse experience was primarily driven by active retention strategies with fewer cancellations of advised products, reflecting the move to more sustainable adviser commission structures over recent years.
Neutral claims experience reflected lower lump sum claim levels offsetting a small increase in Income Protection claim volumes.
Growth remained strong with in-force premium increasing to $245 million and new business flat on the prior year.
Profit contribution
Full Year Ended Jun-17 Half Year Ended Jun-17 Jun-17
Life New Zealand Jun-17 Jun-16 vs Jun-16 Jun-17 Dec-16 Jun-16 Dec-15 vs Dec-16 vs Jun-16
$M $M % $M $M $M $M % %
Planned profit margin 31 32 (3.1) 16 15 16 16 6.7 -
Experience 6 (1) n/a 1 5 3 (4) (80.0) (66.7)
Other 5 11 (54.5) 1 4 6 5 (75.0) (83.3)
Underlying profit after tax 42 42 - 18 24 25 17 (25.0) (28.0) Market adjustments (2) 11 n/a 4 (6) 9 2 n/a (55.6)
Net profit after tax 40 53 (24.5) 22 18 34 19 22.2 (35.3)
Life risk in-force annual premium by channel In-force premium increased 7.0% to $245 million, driven by new business and policy retention. Cancellation rates remain at the low end of the New Zealand market, reflecting continued customer focus across the business and an emphasis on relationships with quality intermediaries.
Half Year Ended Jun-17 Jun-17
Jun-17 Dec-16 Jun-16 Dec-15 vs Dec-16 vs Jun-16
$M $M $M $M % %
Advised 198 194 185 179 2.1 7.0
Direct 39 39 38 37 - 2.6
Group and other 8 7 6 6 14.3 33.3
Total 245 240 229 222 2.1 7.0

NEW ZEALAND
FINANCIAL RESULTS FOR THE FULL YEAR ENDED 30 JUNE 2017 PAGE 53
ANALYST PACK
Note: All data and commentary in the New Zealand section is displayed In New Zealand Dollars, unless otherwise specified.
Life risk new business
Full Year Ended Jun-17 Half Year Ended Jun-17 Jun-17
Jun-17 Jun-16 vs Jun-16 Jun-17 Dec-16 Jun-16 Dec-15 vs Dec-16 vs Jun-16
$M $M % $M $M $M $M % %
Total new business 26 26 - 11 15 12 14 (26.7) (8.3)
New business was flat on the prior year. The focus on sustainable adviser commission options has continued, resulting in almost half of new business during the year being sold on level or reduced initial commission terms.
Strong growth in the first half of the financial year was driven by successful tendering of a number of large new schemes in the Group Life business. The Group Life business has benefited from a revised product offering and greater alignment with New Zealand’s large brokers as part of New Zealand’s operating
model changes.
Direct new business volumes were impacted in the second half of the financial year as call centres transitioned to a new model, which is now in place.
Funds under management and administration
Policyholder funds under management and administration of $693 million relate to legacy life and superannuation products which are closed to new business. The value of funds continues to gradually decline, as policyholder withdrawals are only partially offset by contractual contributions and investment earnings.
Half Year Ended Jun-17 Jun-17
Jun-17 Dec-16 (1) Jun-16 (1) Dec-15 (1) vs Dec-16 (1) vs Jun-16 (1)
$M $M $M $M % %
Funds under management and administration
Opening balance at the start of the period 704 739 745 750 (4.7) (5.5)
Net inflows (outflows), investment income and other (11) (35) (6) (5) (68.6) 83.3
Balance at the end of the period 693 704 739 745 (1.6) (6.2)
(1) The comparative figures above have been restated to exclude Policy Loan receivables (loans to policyholders that are secured against their policy surrender values). The impact is a reduction in the period end balances of $5m at 31 December 2016, $5m at 30 June 2016 and $5m at 31 December 2015.
Operating expenses
Operating expenses are flat on the prior year, with impacts from business growth and inflation offset by efficiencies gained from the new operating model.
The acquisition expense ratio has improved over the year, reflecting a higher uptake of lower-upfront commission options by advisers.
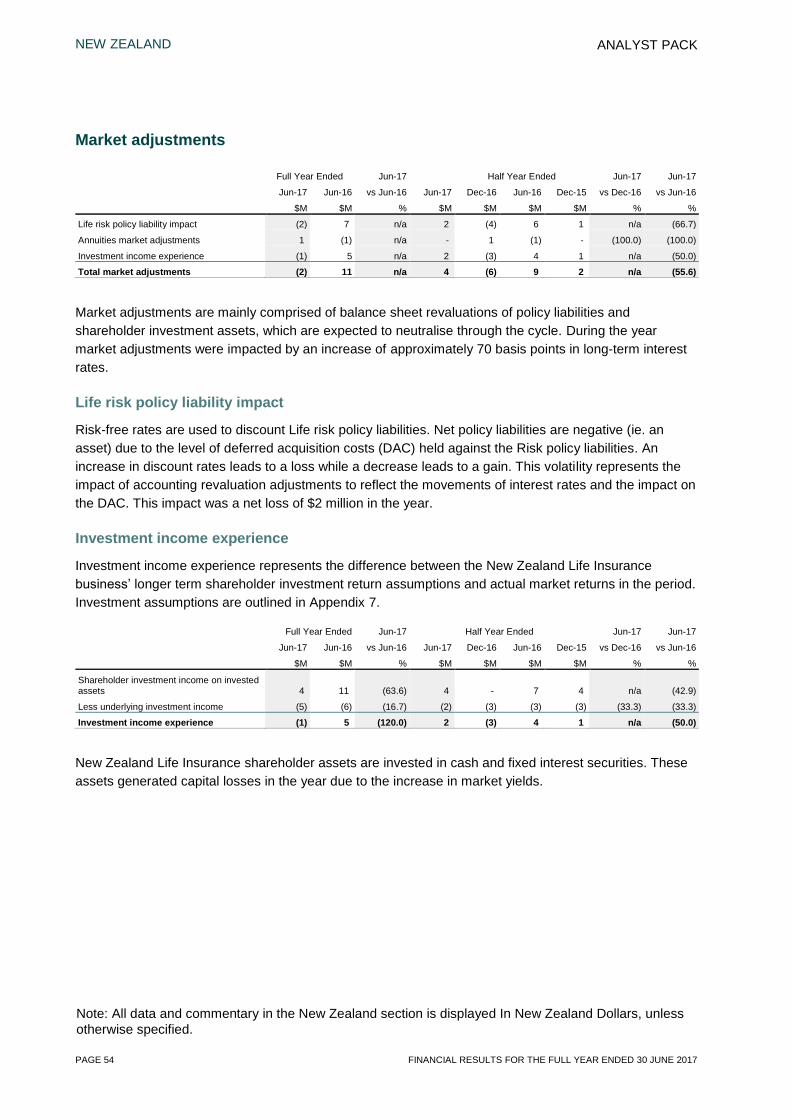
NEW ZEALAND
PAGE 54 FINANCIAL RESULTS FOR THE FULL YEAR ENDED 30 JUNE 2017
ANALYST PACK
Note: All data and commentary in the New Zealand section is displayed In New Zealand Dollars, unless otherwise specified.
Market adjustments
Full Year Ended Jun-17 Half Year Ended Jun-17 Jun-17
Jun-17 Jun-16 vs Jun-16 Jun-17 Dec-16 Jun-16 Dec-15 vs Dec-16 vs Jun-16
$M $M % $M $M $M $M % %
Life risk policy liability impact (2) 7 n/a 2 (4) 6 1 n/a (66.7)
Annuities market adjustments 1 (1) n/a - 1 (1) - (100.0) (100.0)
Investment income experience (1) 5 n/a 2 (3) 4 1 n/a (50.0)
Total market adjustments (2) 11 n/a 4 (6) 9 2 n/a (55.6)
Market adjustments are mainly comprised of balance sheet revaluations of policy liabilities and shareholder investment assets, which are expected to neutralise through the cycle. During the year market adjustments were impacted by an increase of approximately 70 basis points in long-term interest rates.
Life risk policy liability impact
Risk-free rates are used to discount Life risk policy liabilities. Net policy liabilities are negative (ie. an asset) due to the level of deferred acquisition costs (DAC) held against the Risk policy liabilities. An increase in discount rates leads to a loss while a decrease leads to a gain. This volatility represents the impact of accounting revaluation adjustments to reflect the movements of interest rates and the impact on the DAC. This impact was a net loss of $2 million in the year.
Investment income experience
Investment income experience represents the difference between the New Zealand Life Insurance business’ longer term shareholder investment return assumptions and actual market returns in the period. Investment assumptions are outlined in Appendix 7.
Full Year Ended Jun-17 Half Year Ended Jun-17 Jun-17
Jun-17 Jun-16 vs Jun-16 Jun-17 Dec-16 Jun-16 Dec-15 vs Dec-16 vs Jun-16
$M $M % $M $M $M $M % %
Shareholder investment income on invested assets 4 11 (63.6) 4 - 7 4 n/a (42.9)
Less underlying investment income (5) (6) (16.7) (2) (3) (3) (3) (33.3) (33.3)
Investment income experience (1) 5 (120.0) 2 (3) 4 1 n/a (50.0)
New Zealand Life Insurance shareholder assets are invested in cash and fixed interest securities. These assets generated capital losses in the year due to the increase in market yields.

GROUP
FINANCIAL RESULTS FOR THE FULL YEAR ENDED 30 JUNE 2017 PAGE 55
ANALYST PACK
CUSTOMER
Overview Through focused customer experience improvements and targeted retention and growth initiatives, the Group’s customer base increased by 399,000, including 252,000 from entry into South Australian CTP.
The Group’s strategic priority is to ‘elevate the customer’ by making experiences easy for the customer,
developing integrated solutions and customer journeys, and connecting customers to the Marketplace. The Marketplace will help customers navigate complexity, make better choices and allow them to interact with the Group in any way they choose, through both digital and physical channels.
Connecting customers to the Marketplace
The delivery of new value for customers has been a priority and progress has made across channels and solutions.
Digital
— Enabling customers to view and manage their Suncorp Insurance solutions within the Suncorp Mobile Banking App
— Making it faster and easier for customers to buy personal loan and health insurance solutions, through online application
— Introducing AAMI customers to Suncorp home and car lending solutions through the AAMI Access App and the AAMI Customer Hub
— Creating the AAMI SmartPlates Learner Driver App to reduce the time and effort required to learn to drive. The app has been launched in South Australia and Queensland to date, achieving strong penetration of the learner-driver market
— Launching the Suncorp Money profiles content hub. This tool helps people understand their attitude and beliefs about money. The hub is supported by a range of relevant products to help customers make good choices and improve their financial wellbeing.
Stores
— Launch of Parramatta and Carindale concept stores. The stores showcase the Group’s portfolio of
brands, connecting customers to a wide range of solutions from both Suncorp and third parties. The Stores provide a test and learn environment, allowing new methods of customer interaction and creating the ability to test processes, propositions and technologies in real time.
Contact Centres
— Pilot of a new platform to provide a single Group-view of the customer. This platform has improved customer experience and employee engagement by empowering team members at the frontline to understand and meet more customer needs.
GROUP
PAGE 56 FINANCIAL RESULTS FOR THE FULL YEAR ENDED 30 JUNE 2017
ANALYST PACK
Improving customer experiences
The Group has delivered key initiatives during the year to improve the level of service provided to customers:
— The motor claims zero touch functionality includes the use of Artificial Intelligence to automate liability decisions, which enables the customers to fully lodge their claim, as well as find and book a repairer removing the need for a call back through the process
— Significantly improving the time taken for customers to execute core banking needs (changing interest rates, changing loan types, redrawing cash from loans and conditional approval for home loans)
— Establishing the Office of the Customer Advocate, to help drive better outcomes and experiences for Suncorp
— Opening two new SMART repair centres in New Zealand, to drive further claims experience improvements.
Connecting new solutions and third party partnerships to the platform
The Group developed new solutions and capability with third party providers:
— Bundled incentives enabled frontline staff to discuss home and motor needs in single customer conversations.
— Introduction of AAMI customers to Suncorp home lending, CIL customers to Apia, and Apia customers to Suncorp banking through the Freedom Access account
— The nib health fund partnership was expanded to create Suncorp and AAMI health insurance
— The Challenger partnership introduced an annuities product providing customers with greater retirement choices
— Suncorp and Trōv co-developed the Trov Protection insurance product to offer customers, particularly millennials (69% of customers are aged 18-34), on demand access to insurance for single items such as cameras, tablets and laptops. Since launch, the Trov has generated over 20,000 registered users.
GROUP
FINANCIAL RESULTS FOR THE FULL YEAR ENDED 30 JUNE 2017 PAGE 57
ANALYST PACK
Outlook
Suncorp’s vision is to ‘be the destination for moments that matter’ with one of the Group’s strategic priorities being ‘elevate the customer’. This will be achieved by making customer experiences easy;
connecting customers to the Suncorp Marketplace, and; developing integrated solutions and customer journeys.
The Group continues to focus on broadening and deepening relationships with customers by connecting them to complementary solutions and experiences that solve their problems and meet more of their needs. Connected Customers will drive value by improving retention.
The financial services Marketplace will link customers, through both digital and physical channels, to a suite of trusted brands with products, integrated offers and customer journeys. In the 2018 financial year, Suncorp will:
— Continue to invest in digital solutions to make financial services simpler and easier for customers to access, including the delivery of key mobile application functionality
— Deliver Home and Mobility buying customer journeys, ensuring that more of customers’ needs are
met in the moments that matter
— Develop meaningful integrated offers for customers that leverage the Group’s unique breadth of
products and services
— Deliver a Group-wide reward and recognition program to encourage proactive customer engagement and loyalty
— Build an ecosystem of partners to enhance the financial wellbeing of customers
— Build Suncorp brand equity whilst positioning it as the endorser brand for the Group.
GROUP
PAGE 58 FINANCIAL RESULTS FOR THE FULL YEAR ENDED 30 JUNE 2017
ANALYST PACK
GROUP CAPITAL Suncorp Group’s capital management strategy is to optimise shareholder value by managing the level,
mix and use of capital resources. The primary objective is to ensure there are sufficient capital resources to maintain and grow the business, in accordance with risk appetite.
The Group is subject to, and complies with, external capital requirements set and monitored by APRA and the Reserve Bank of New Zealand.
The Group’s Internal Capital Adequacy Assessment Process (ICAAP) provides the framework to ensure
that the Group as a whole and each regulated entity, is capitalised to meet both internal and external requirements. The ICAAP is reviewed regularly and, where appropriate, adjustments are made to reflect changes in the Group’s capital requirements.
A range of instruments and methodologies are used to effectively manage capital including share issues, reinsurance, dividend policies and Tier 1 and Tier 2 instruments. Capital targets are structured according to risk appetite, regulatory frameworks and APRA’s Non-Operating Holding Company conditions.
For regulatory purposes, capital is classified as follows:
— CET1 comprising accounting equity with adjustments for intangible assets and regulatory reserves
— Tier 1 Capital comprising CET1 plus Additional Tier 1 Capital such as hybrid securities with ‘equity-like’ qualities
— Tier 2 Capital comprising certain securities recognised as Tier 2 Capital, together with specific Bank reserves eligible as regulatory capital
— Total Capital is the sum of Tier 1 Capital and Tier 2 Capital.
CET1 has the greatest capacity to absorb potential losses, followed by Additional Tier 1 Capital and then Tier 2 Capital.
Dividend
The Group aims to pay annual dividends based on a target payout ratio of 60% to 80% of cash earnings.
The Group’s profit result for the year led to a fully franked final dividend of 40 cents per share, an increase of 2 cents per share on the 2016 final dividend (38 cents per share). This brings the ordinary dividends for the 2017 financial year to 73 cents per share, an increase of 5 cents per share. The full year dividends equate to a payout ratio of 82% of cash earnings, slightly above the target range and supported by the Group’s capital position. The Group intends to issue new shares under the Dividend Reinvestment Plan for the final dividend.
Review of capital targets
The Group reviews its capital targets annually utilising both the Group’s Risk Based Capital models and capital stress testing. As a result of the annual review of capital targets:
— the CET1 target operating range for the General Insurance businesses has been increased to 1.0 – 1.2 times the Prescribed Capital Amount reflecting the higher level of volatility experienced in claims costs in recent years resulting in an increase in tail risk outcomes across both Consumer lines and CTP. The Total Capital target operating range remains unchanged
— the Bank CET1 target operating range is unchanged at 8.5% - 9.0% of Risk Weighted Assets
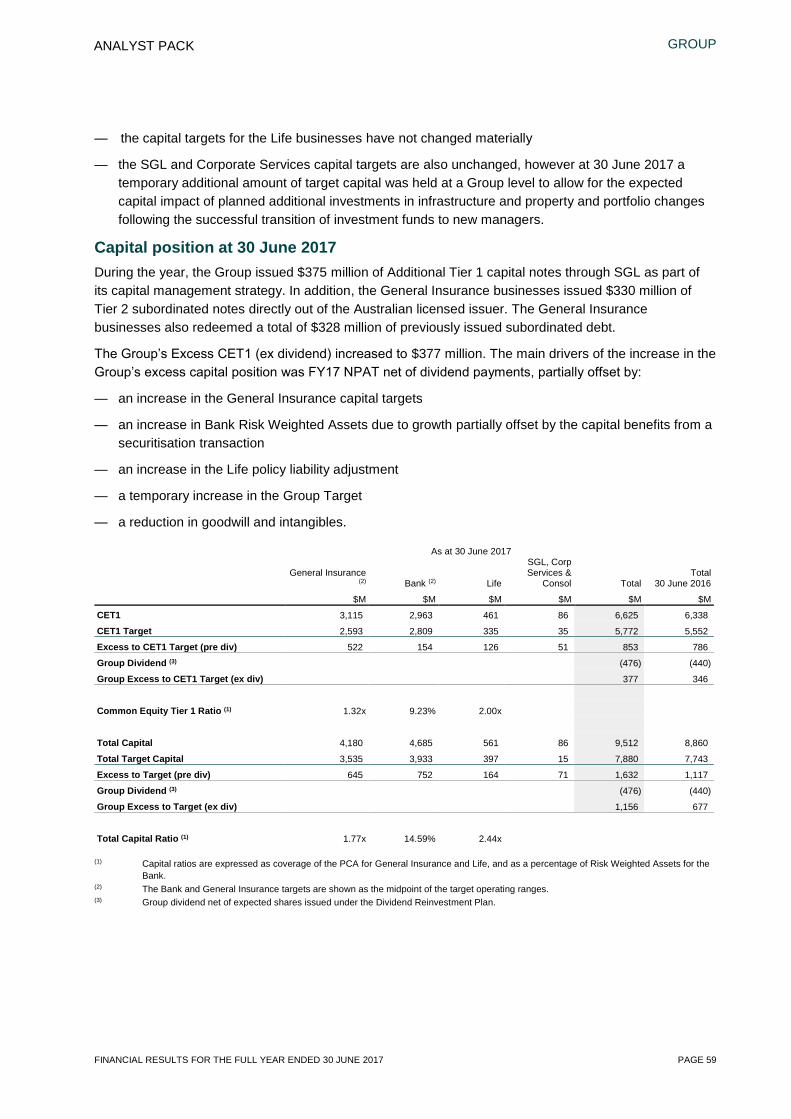
GROUP
FINANCIAL RESULTS FOR THE FULL YEAR ENDED 30 JUNE 2017 PAGE 59
ANALYST PACK
— the capital targets for the Life businesses have not changed materially
— the SGL and Corporate Services capital targets are also unchanged, however at 30 June 2017 a temporary additional amount of target capital was held at a Group level to allow for the expected capital impact of planned additional investments in infrastructure and property and portfolio changes following the successful transition of investment funds to new managers.
Capital position at 30 June 2017 During the year, the Group issued $375 million of Additional Tier 1 capital notes through SGL as part of its capital management strategy. In addition, the General Insurance businesses issued $330 million of Tier 2 subordinated notes directly out of the Australian licensed issuer. The General Insurance businesses also redeemed a total of $328 million of previously issued subordinated debt.
The Group’s Excess CET1 (ex dividend) increased to $377 million. The main drivers of the increase in the Group’s excess capital position was FY17 NPAT net of dividend payments, partially offset by:
— an increase in the General Insurance capital targets
— an increase in Bank Risk Weighted Assets due to growth partially offset by the capital benefits from a securitisation transaction
— an increase in the Life policy liability adjustment
— a temporary increase in the Group Target
— a reduction in goodwill and intangibles.
As at 30 June 2017
General Insurance
(2) Bank (2) Life
SGL, Corp Services &
Consol Total Total
30 June 2016
$M $M $M $M $M $M
CET1 3,115 2,963 461 86 6,625 6,338
CET1 Target 2,593 2,809 335 35 5,772 5,552
Excess to CET1 Target (pre div) 522 154 126 51 853 786
Group Dividend (3) (476) (440)
Group Excess to CET1 Target (ex div) 377 346
Common Equity Tier 1 Ratio (1) 1.32x 9.23% 2.00x
Total Capital 4,180 4,685 561 86 9,512 8,860
Total Target Capital 3,535 3,933 397 15 7,880 7,743
Excess to Target (pre div) 645 752 164 71 1,632 1,117
Group Dividend (3) (476) (440)
Group Excess to Target (ex div) 1,156 677
Total Capital Ratio (1) 1.77x 14.59% 2.44x
(1) Capital ratios are expressed as coverage of the PCA for General Insurance and Life, and as a percentage of Risk Weighted Assets for the Bank.
(2) The Bank and General Insurance targets are shown as the midpoint of the target operating ranges. (3) Group dividend net of expected shares issued under the Dividend Reinvestment Plan.
GROUP
PAGE 60 FINANCIAL RESULTS FOR THE FULL YEAR ENDED 30 JUNE 2017
ANALYST PACK
In terms of the CET1 positions across the Group (pre dividend):
— the General Insurance businesses’ CET1 position was 1.32 times the PCA, above its target operating range of 1.0 - 1.2 times PCA
— the Bank’s CET1 Ratio was 9.23%, above its target operating range of 8.5% - 9.0%
— Life businesses’ excess CET1 to target was $126 million
— an additional $51 million of excess CET1 was held at the SGL and Corporate Services level.
The Group maintains a strong capital position with all businesses holding CET1 in excess of targets. The Group’s excess to CET1 target is $377 million after adjusting for the final dividend.
Appendix 5 contains further information on the capital position of the Suncorp Group.

GROUP
FINANCIAL RESULTS FOR THE FULL YEAR ENDED 30 JUNE 2017 PAGE 61
ANALYST PACK
INVESTMENTS
Investment strategy and arrangements
Investment strategy is a material driver of the profit, capital and risk profile of the Group and delivers significant value for shareholders and customers.
The primary objective is to optimise investment returns relative to investment risk appetite, which remains conservatively positioned. This process inherently has regard to the insurance liabilities and capital that the investment assets are supporting and seeks to substantially offset the associated interest rate and claims inflation risks. High quality fixed interest securities and inflation-linked bonds play a central role in achieving this objective.
The Suncorp Group Investments function provides investment strategy advice, external investment manager selection and oversight, investment implementation and investment risk management services to the Group. Over the course of the 2017 financial year, a program of work to diversify investment manager exposure was substantially realised, facilitating the diversification of investment and business risks. In addition, the establishment of a global investment grade credit portfolio and an allocation to a low-volatility absolute return strategy have further diversified the portfolios’ market, geographic and sector
risks.
Investment markets commentary
The 2017 financial year began in the aftermath of the ‘Brexit’ vote while, domestically, low inflation led to
a further RBA rate cut taking the cash rate to a record low 1.5%. Australian bond yields and breakeven inflation followed suit also registering new lows in August 2016.
At the same time signs of resilience in global growth and rising commodity prices became evident, contributing to a turning point for bond markets. The move higher in yields was accentuated in November as Trump secured the US Presidency and markets adopted a ‘risk on’ tone. The anticipation of fiscal
stimulus and stronger US growth saw sharp advances in share markets, bond yields and inflation expectations. Meanwhile, the US Federal Reserve continued its gradual tightening of monetary policy.
The ‘reflation’ theme was sustained into early 2017 before doubts emerged regarding Trump’s ability to
pursue his domestic agenda. This coincided with a softer period for US growth and a pullback in commodity prices. Accordingly, bond yields and inflation expectations retraced a portion of the increase from their lows, before moving sharply higher in late June on the back of central banks’ intentions to
remove stimulus. Global share markets, however, continued to rally amid strong profit growth, both domestically and offshore.
In Australia, 2017 has seen greater concern over indebtedness and housing excesses, creating uncertainty regarding the impact of mortgage repricing and macro-prudential policy tightening. Nevertheless, the economic trends remain broadly favourable, with business investment displaying signs of improvement and inflation firming.
In this environment, growth assets outperformed fixed interest which registered only a modest return for the year. Looking ahead, Suncorp anticipates a continuation of this theme, although lower equity returns are expected.
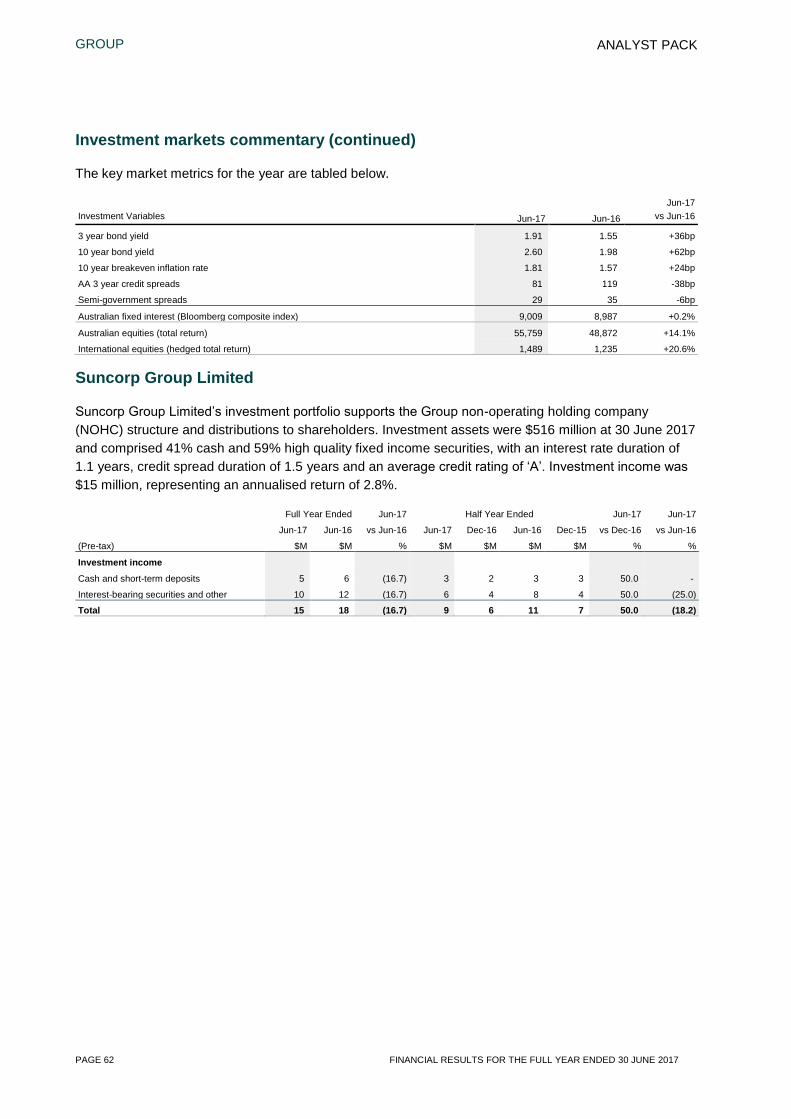
GROUP
PAGE 62 FINANCIAL RESULTS FOR THE FULL YEAR ENDED 30 JUNE 2017
ANALYST PACK
Investment markets commentary (continued)
The key market metrics for the year are tabled below.
Jun-17 Investment Variables Jun-17 Jun-16 vs Jun-16
3 year bond yield 1.91 1.55 +36bp
10 year bond yield 2.60 1.98 +62bp
10 year breakeven inflation rate 1.81 1.57 +24bp
AA 3 year credit spreads 81 119 -38bp
Semi-government spreads 29 35 -6bp
Australian fixed interest (Bloomberg composite index) 9,009 8,987 +0.2%
Australian equities (total return) 55,759 48,872 +14.1%
International equities (hedged total return) 1,489 1,235 +20.6%
Suncorp Group Limited
Suncorp Group Limited’s investment portfolio supports the Group non-operating holding company (NOHC) structure and distributions to shareholders. Investment assets were $516 million at 30 June 2017 and comprised 41% cash and 59% high quality fixed income securities, with an interest rate duration of 1.1 years, credit spread duration of 1.5 years and an average credit rating of ‘A’. Investment income was
$15 million, representing an annualised return of 2.8%.
Full Year Ended Jun-17 Half Year Ended Jun-17 Jun-17
Jun-17 Jun-16 vs Jun-16 Jun-17 Dec-16 Jun-16 Dec-15 vs Dec-16 vs Jun-16
(Pre-tax) $M $M % $M $M $M $M % %
Investment income
Cash and short-term deposits 5 6 (16.7) 3 2 3 3 50.0 -
Interest-bearing securities and other 10 12 (16.7) 6 4 8 4 50.0 (25.0)
Total 15 18 (16.7) 9 6 11 7 50.0 (18.2)
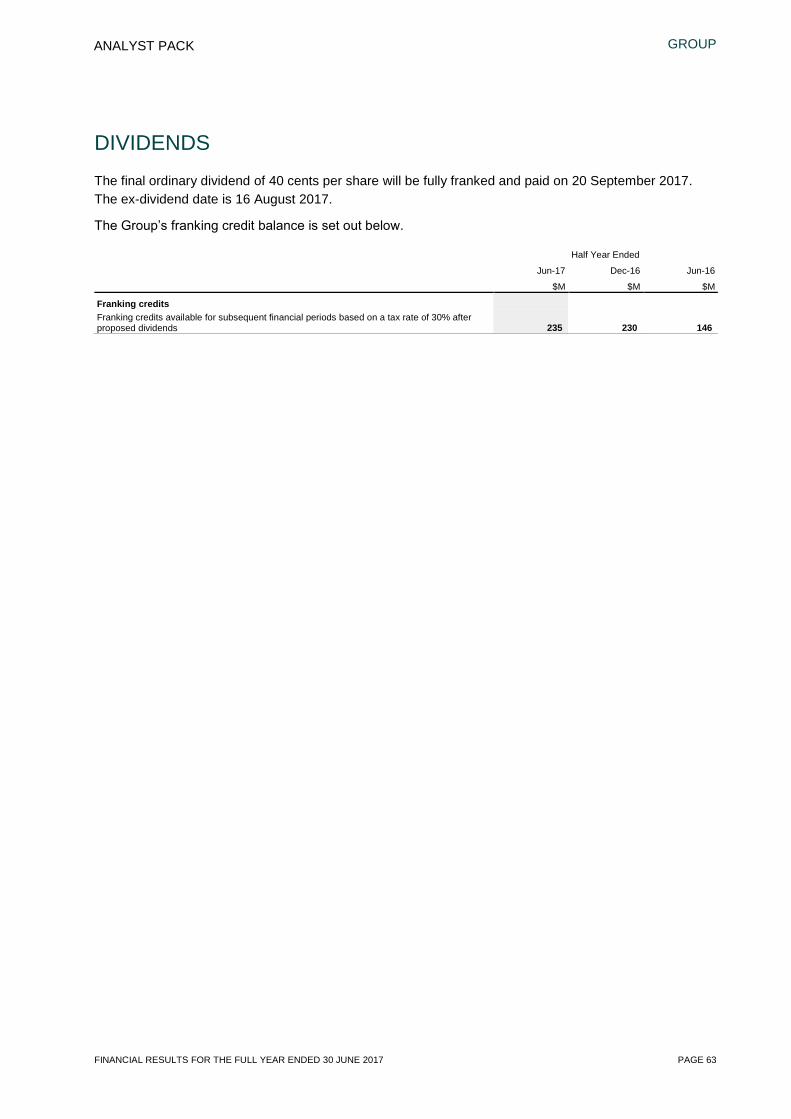
GROUP
FINANCIAL RESULTS FOR THE FULL YEAR ENDED 30 JUNE 2017 PAGE 63
ANALYST PACK
DIVIDENDS
The final ordinary dividend of 40 cents per share will be fully franked and paid on 20 September 2017. The ex-dividend date is 16 August 2017.
The Group’s franking credit balance is set out below.
Half Year Ended
Jun-17 Dec-16 Jun-16
$M $M $M
Franking credits Franking credits available for subsequent financial periods based on a tax rate of 30% after proposed dividends 235 230 146
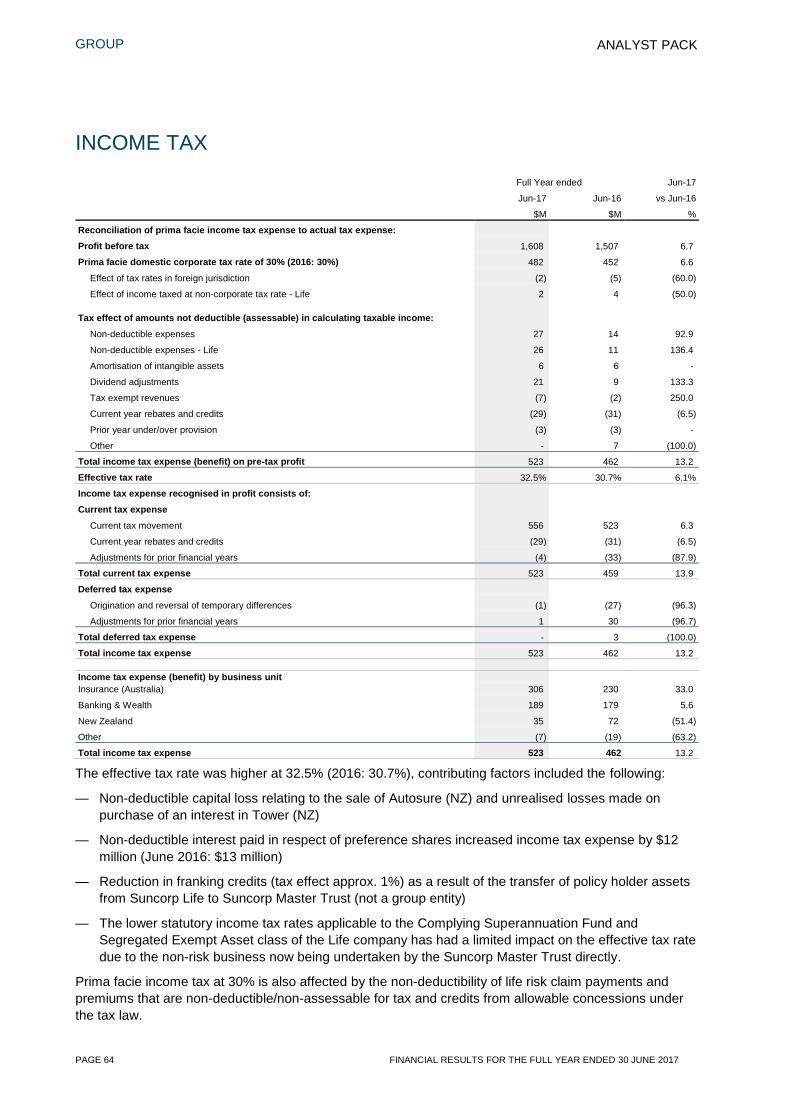
GROUP
PAGE 64 FINANCIAL RESULTS FOR THE FULL YEAR ENDED 30 JUNE 2017
ANALYST PACK
INCOME TAX Full Year ended Jun-17
Jun-17 Jun-16 vs Jun-16
$M $M %
Reconciliation of prima facie income tax expense to actual tax expense: Profit before tax 1,608 1,507 6.7
Prima facie domestic corporate tax rate of 30% (2016: 30%) 482 452 6.6
Effect of tax rates in foreign jurisdiction (2) (5) (60.0)
Effect of income taxed at non-corporate tax rate - Life 2 4 (50.0)
Tax effect of amounts not deductible (assessable) in calculating taxable income:
Non-deductible expenses 27 14 92.9
Non-deductible expenses - Life 26 11 136.4
Amortisation of intangible assets 6 6 -
Dividend adjustments 21 9 133.3
Tax exempt revenues (7) (2) 250.0
Current year rebates and credits (29) (31) (6.5)
Prior year under/over provision (3) (3) -
Other - 7 (100.0)
Total income tax expense (benefit) on pre-tax profit 523 462 13.2
Effective tax rate 32.5% 30.7% 6.1%
Income tax expense recognised in profit consists of:
Current tax expense
Current tax movement 556 523 6.3
Current year rebates and credits (29) (31) (6.5)
Adjustments for prior financial years (4) (33) (87.9)
Total current tax expense 523 459 13.9
Deferred tax expense
Origination and reversal of temporary differences (1) (27) (96.3)
Adjustments for prior financial years 1 30 (96.7)
Total deferred tax expense - 3 (100.0)
Total income tax expense 523 462 13.2 Income tax expense (benefit) by business unit Insurance (Australia) 306 230 33.0
Banking & Wealth 189 179 5.6
New Zealand 35 72 (51.4)
Other (7) (19) (63.2)
Total income tax expense 523 462 13.2
The effective tax rate was higher at 32.5% (2016: 30.7%), contributing factors included the following:
— Non-deductible capital loss relating to the sale of Autosure (NZ) and unrealised losses made on purchase of an interest in Tower (NZ)
— Non-deductible interest paid in respect of preference shares increased income tax expense by $12 million (June 2016: $13 million)
— Reduction in franking credits (tax effect approx. 1%) as a result of the transfer of policy holder assets from Suncorp Life to Suncorp Master Trust (not a group entity)
— The lower statutory income tax rates applicable to the Complying Superannuation Fund and Segregated Exempt Asset class of the Life company has had a limited impact on the effective tax rate due to the non-risk business now being undertaken by the Suncorp Master Trust directly.
Prima facie income tax at 30% is also affected by the non-deductibility of life risk claim payments and premiums that are non-deductible/non-assessable for tax and credits from allowable concessions under the tax law.
GROUP
FINANCIAL RESULTS FOR THE FULL YEAR ENDED 30 JUNE 2017 PAGE 65
ANALYST PACK
GENERAL INSURANCE REINSURANCE Outwards reinsurance expense for the 2017 financial year was $1,155 million, an increase of $185 million which included the cost of the new natural hazards aggregate cover, new SA CTP quota share and additional backup protection following the Kaikoura earthquake.
Suncorp has a significant share of the Queensland home insurance market and, to reduce its geographical concentration, the Group has a 30%, multi-year, proportional quota share arrangement covering this portfolio in place.
The upper limit on Suncorp’s main catastrophe program, which covers the Group’s Home, Motor and Commercial Property portfolios for major events, will remain unchanged at $6.9 billion for the 2018 financial year. In line with RBNZ regulatory requirements, New Zealand protection is 100% placed to $6.3 billion with additional 65% coverage from $6.3 billion to $6.9 billion.
The maximum event retention is $250 million. Additional cover has been purchased to reduce this retention to $200 million for a second Australian event and to $50 million for third and fourth events. For New Zealand risks, the Group purchases a multi-year cover which reduces the first event retention to NZ$50 million and the second event retention to NZ$25 million. For capital efficiency purposes, an internal reinsurance arrangement reduces the Suncorp New Zealand retention to NZ$20 million for the first and second events.
Suncorp has again purchased a natural hazards aggregate protection. This provides $300 million of cover over the retained portion of natural hazard events greater than $10 million that exceed a total of $475 million. The retained natural hazard allowance has increased by $72 million to $692 million reflecting the increased frequency and severity of natural hazards in recent years.
Reinsurance security has been maintained for the 2018 financial year program, with over 85% of business protected by reinsurers rated ‘A+’ or better.
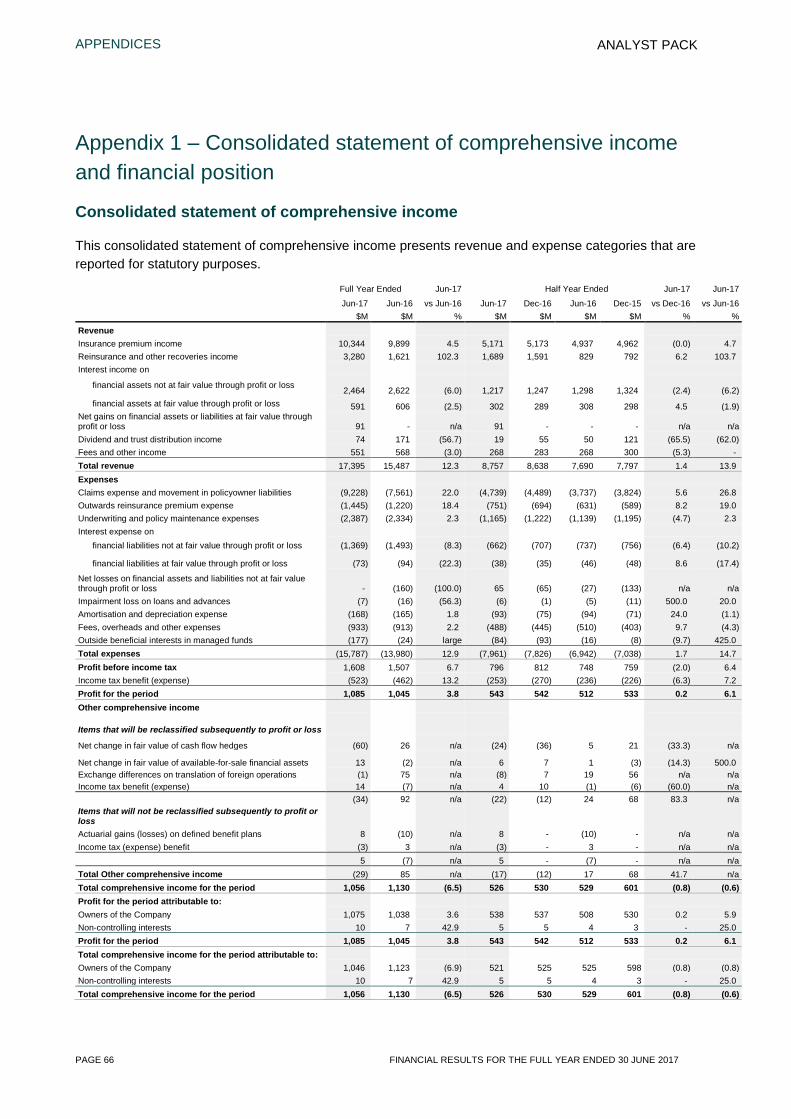
APPENDICES
PAGE 66 FINANCIAL RESULTS FOR THE FULL YEAR ENDED 30 JUNE 2017
ANALYST PACK
Appendix 1 – Consolidated statement of comprehensive income and financial position
Consolidated statement of comprehensive income
This consolidated statement of comprehensive income presents revenue and expense categories that are reported for statutory purposes.
Full Year Ended Jun-17 Half Year Ended Jun-17 Jun-17
Jun-17 Jun-16 vs Jun-16 Jun-17 Dec-16 Jun-16 Dec-15 vs Dec-16 vs Jun-16 $M $M % $M $M $M $M % %
Revenue Insurance premium income 10,344 9,899 4.5 5,171 5,173 4,937 4,962 (0.0) 4.7 Reinsurance and other recoveries income 3,280 1,621 102.3 1,689 1,591 829 792 6.2 103.7 Interest income on
financial assets not at fair value through profit or loss 2,464 2,622 (6.0) 1,217 1,247 1,298 1,324 (2.4) (6.2) financial assets at fair value through profit or loss 591 606 (2.5) 302 289 308 298 4.5 (1.9)
Net gains on financial assets or liabilities at fair value through profit or loss 91 - n/a 91 - - - n/a n/a Dividend and trust distribution income 74 171 (56.7) 19 55 50 121 (65.5) (62.0) Fees and other income 551 568 (3.0) 268 283 268 300 (5.3) - Total revenue 17,395 15,487 12.3 8,757 8,638 7,690 7,797 1.4 13.9
Expenses Claims expense and movement in policyowner liabilities (9,228) (7,561) 22.0 (4,739) (4,489) (3,737) (3,824) 5.6 26.8 Outwards reinsurance premium expense (1,445) (1,220) 18.4 (751) (694) (631) (589) 8.2 19.0 Underwriting and policy maintenance expenses (2,387) (2,334) 2.3 (1,165) (1,222) (1,139) (1,195) (4.7) 2.3 Interest expense on
financial liabilities not at fair value through profit or loss (1,369) (1,493) (8.3) (662) (707) (737) (756) (6.4) (10.2)
financial liabilities at fair value through profit or loss (73) (94) (22.3) (38) (35) (46) (48) 8.6 (17.4)
Net losses on financial assets and liabilities not at fair value through profit or loss - (160) (100.0) 65 (65) (27) (133) n/a n/a Impairment loss on loans and advances (7) (16) (56.3) (6) (1) (5) (11) 500.0 20.0 Amortisation and depreciation expense (168) (165) 1.8 (93) (75) (94) (71) 24.0 (1.1) Fees, overheads and other expenses (933) (913) 2.2 (488) (445) (510) (403) 9.7 (4.3) Outside beneficial interests in managed funds (177) (24) large (84) (93) (16) (8) (9.7) 425.0
Total expenses (15,787) (13,980) 12.9 (7,961) (7,826) (6,942) (7,038) 1.7 14.7
Profit before income tax 1,608 1,507 6.7 796 812 748 759 (2.0) 6.4 Income tax benefit (expense) (523) (462) 13.2 (253) (270) (236) (226) (6.3) 7.2
Profit for the period 1,085 1,045 3.8 543 542 512 533 0.2 6.1 Other comprehensive income
Items that will be reclassified subsequently to profit or loss
Net change in fair value of cash flow hedges (60) 26 n/a (24) (36) 5 21 (33.3) n/a
Net change in fair value of available-for-sale financial assets 13 (2) n/a 6 7 1 (3) (14.3) 500.0 Exchange differences on translation of foreign operations (1) 75 n/a (8) 7 19 56 n/a n/a Income tax benefit (expense) 14 (7) n/a 4 10 (1) (6) (60.0) n/a (34) 92 n/a (22) (12) 24 68 83.3 n/a Items that will not be reclassified subsequently to profit or loss Actuarial gains (losses) on defined benefit plans 8 (10) n/a 8 - (10) - n/a n/a Income tax (expense) benefit (3) 3 n/a (3) - 3 - n/a n/a
5 (7) n/a 5 - (7) - n/a n/a
Total Other comprehensive income (29) 85 n/a (17) (12) 17 68 41.7 n/a
Total comprehensive income for the period 1,056 1,130 (6.5) 526 530 529 601 (0.8) (0.6) Profit for the period attributable to: Owners of the Company 1,075 1,038 3.6 538 537 508 530 0.2 5.9 Non-controlling interests 10 7 42.9 5 5 4 3 - 25.0
Profit for the period 1,085 1,045 3.8 543 542 512 533 0.2 6.1 Total comprehensive income for the period attributable to: Owners of the Company 1,046 1,123 (6.9) 521 525 525 598 (0.8) (0.8) Non-controlling interests 10 7 42.9 5 5 4 3 - 25.0
Total comprehensive income for the period 1,056 1,130 (6.5) 526 530 529 601 (0.8) (0.6)
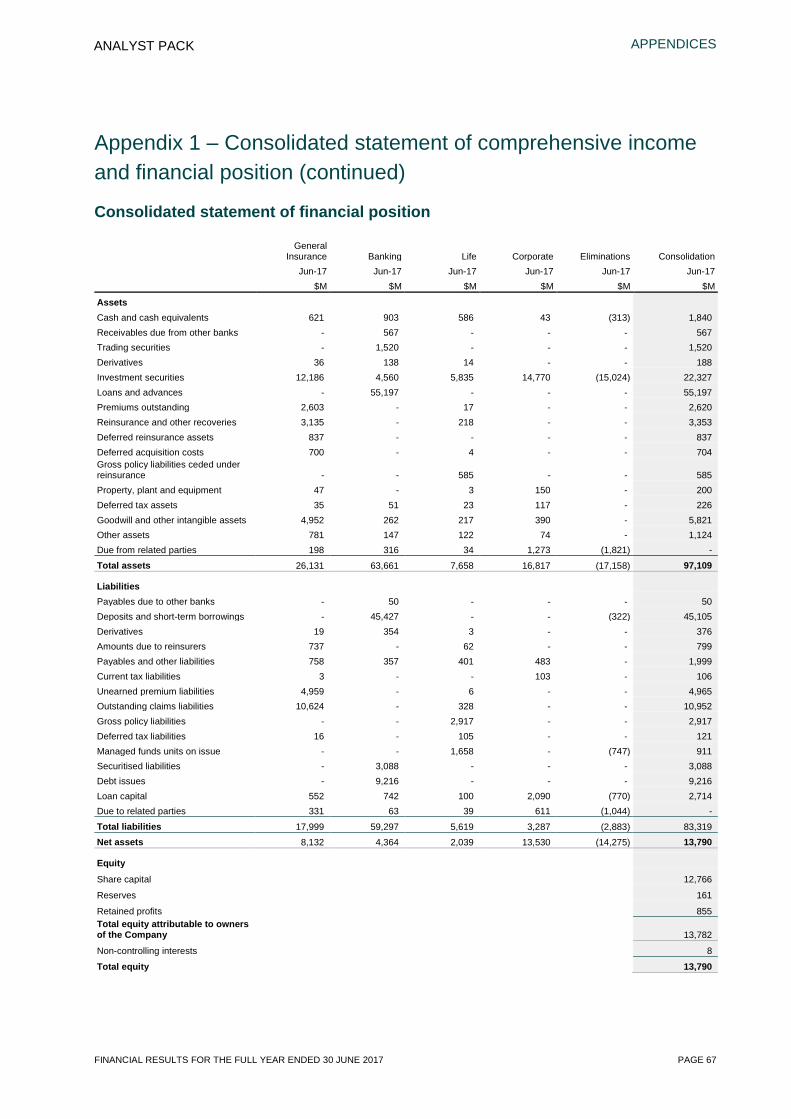
APPENDICES
FINANCIAL RESULTS FOR THE FULL YEAR ENDED 30 JUNE 2017 PAGE 67
ANALYST PACK
Appendix 1 – Consolidated statement of comprehensive income and financial position (continued)
Consolidated statement of financial position
General
Insurance Banking Life Corporate Eliminations Consolidation Jun-17 Jun-17 Jun-17 Jun-17 Jun-17 Jun-17 $M $M $M $M $M $M
Assets Cash and cash equivalents 621 903 586 43 (313) 1,840 Receivables due from other banks - 567 - - - 567 Trading securities - 1,520 - - - 1,520 Derivatives 36 138 14 - - 188 Investment securities 12,186 4,560 5,835 14,770 (15,024) 22,327 Loans and advances - 55,197 - - - 55,197 Premiums outstanding 2,603 - 17 - - 2,620 Reinsurance and other recoveries 3,135 - 218 - - 3,353 Deferred reinsurance assets 837 - - - - 837 Deferred acquisition costs 700 - 4 - - 704 Gross policy liabilities ceded under reinsurance - - 585 - - 585 Property, plant and equipment 47 - 3 150 - 200 Deferred tax assets 35 51 23 117 - 226 Goodwill and other intangible assets 4,952 262 217 390 - 5,821 Other assets 781 147 122 74 - 1,124 Due from related parties 198 316 34 1,273 (1,821) -
Total assets 26,131 63,661 7,658 16,817 (17,158) 97,109 Liabilities Payables due to other banks - 50 - - - 50 Deposits and short-term borrowings - 45,427 - - (322) 45,105 Derivatives 19 354 3 - - 376 Amounts due to reinsurers 737 - 62 - - 799 Payables and other liabilities 758 357 401 483 - 1,999 Current tax liabilities 3 - - 103 - 106 Unearned premium liabilities 4,959 - 6 - - 4,965 Outstanding claims liabilities 10,624 - 328 - - 10,952 Gross policy liabilities - - 2,917 - - 2,917 Deferred tax liabilities 16 - 105 - - 121 Managed funds units on issue - - 1,658 - (747) 911 Securitised liabilities - 3,088 - - - 3,088 Debt issues - 9,216 - - - 9,216 Loan capital 552 742 100 2,090 (770) 2,714 Due to related parties 331 63 39 611 (1,044) -
Total liabilities 17,999 59,297 5,619 3,287 (2,883) 83,319 Net assets 8,132 4,364 2,039 13,530 (14,275) 13,790 Equity Share capital 12,766
Reserves 161
Retained profits 855 Total equity attributable to owners of the Company 13,782
Non-controlling interests 8
Total equity 13,790
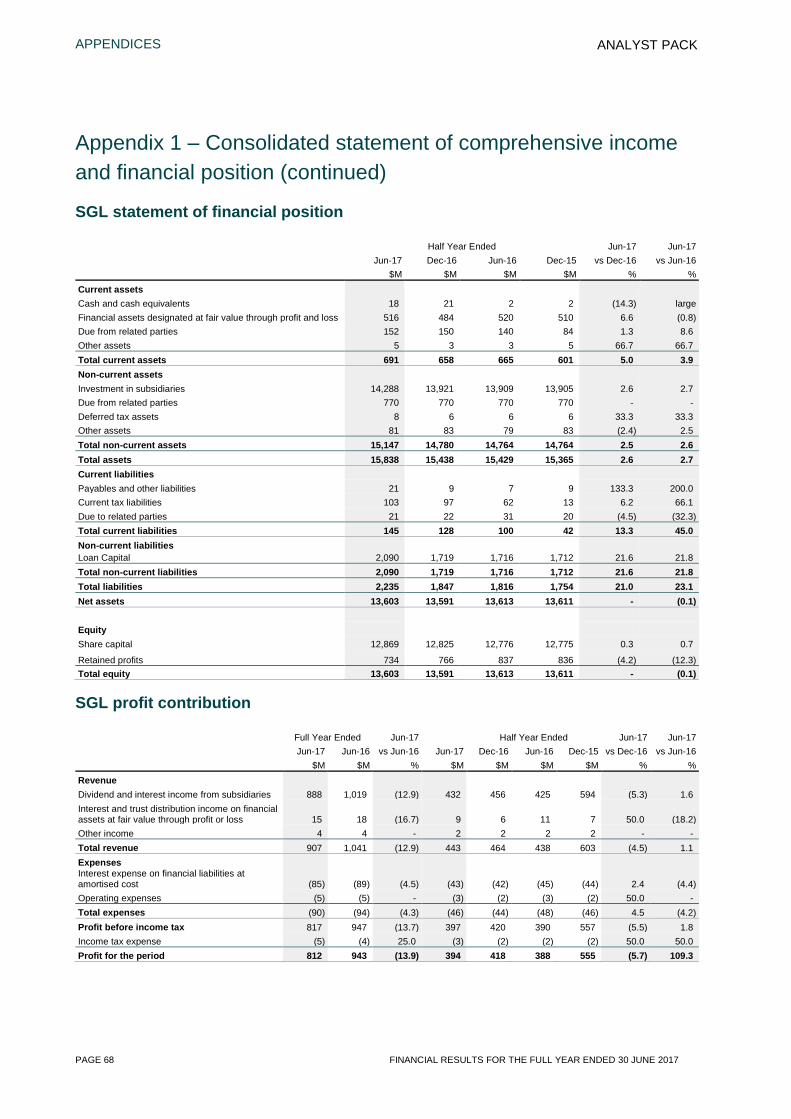
APPENDICES
PAGE 68 FINANCIAL RESULTS FOR THE FULL YEAR ENDED 30 JUNE 2017
ANALYST PACK
Appendix 1 – Consolidated statement of comprehensive income and financial position (continued)
SGL statement of financial position
Half Year Ended Jun-17 Jun-17 Jun-17 Dec-16 Jun-16 Dec-15 vs Dec-16 vs Jun-16 $M $M $M $M % % Current assets Cash and cash equivalents 18 21 2 2 (14.3) large Financial assets designated at fair value through profit and loss 516 484 520 510 6.6 (0.8) Due from related parties 152 150 140 84 1.3 8.6 Other assets 5 3 3 5 66.7 66.7 Total current assets 691 658 665 601 5.0 3.9 Non-current assets Investment in subsidiaries 14,288 13,921 13,909 13,905 2.6 2.7 Due from related parties 770 770 770 770 - - Deferred tax assets 8 6 6 6 33.3 33.3 Other assets 81 83 79 83 (2.4) 2.5 Total non-current assets 15,147 14,780 14,764 14,764 2.5 2.6 Total assets 15,838 15,438 15,429 15,365 2.6 2.7 Current liabilities Payables and other liabilities 21 9 7 9 133.3 200.0 Current tax liabilities 103 97 62 13 6.2 66.1 Due to related parties 21 22 31 20 (4.5) (32.3) Total current liabilities 145 128 100 42 13.3 45.0 Non-current liabilities Loan Capital 2,090 1,719 1,716 1,712 21.6 21.8 Total non-current liabilities 2,090 1,719 1,716 1,712 21.6 21.8 Total liabilities 2,235 1,847 1,816 1,754 21.0 23.1 Net assets 13,603 13,591 13,613 13,611 - (0.1) Equity Share capital 12,869 12,825 12,776 12,775 0.3 0.7 - - - - n/a n/a Retained profits 734 766 837 836 (4.2) (12.3) Total equity 13,603 13,591 13,613 13,611 - (0.1)
SGL profit contribution
Full Year Ended Jun-17 Half Year Ended Jun-17 Jun-17 Jun-17 Jun-16 vs Jun-16 Jun-17 Dec-16 Jun-16 Dec-15 vs Dec-16 vs Jun-16 $M $M % $M $M $M $M % % Revenue Dividend and interest income from subsidiaries 888 1,019 (12.9) 432 456 425 594 (5.3) 1.6 Interest and trust distribution income on financial assets at fair value through profit or loss 15 18 (16.7) 9 6 11 7 50.0 (18.2) Other income 4 4 - 2 2 2 2 - - Total revenue 907 1,041 (12.9) 443 464 438 603 (4.5) 1.1 Expenses Interest expense on financial liabilities at amortised cost (85) (89) (4.5) (43) (42) (45) (44) 2.4 (4.4) Operating expenses (5) (5) - (3) (2) (3) (2) 50.0 - Total expenses (90) (94) (4.3) (46) (44) (48) (46) 4.5 (4.2) Profit before income tax 817 947 (13.7) 397 420 390 557 (5.5) 1.8 Income tax expense (5) (4) 25.0 (3) (2) (2) (2) 50.0 50.0 Profit for the period 812 943 (13.9) 394 418 388 555 (5.7) 109.3
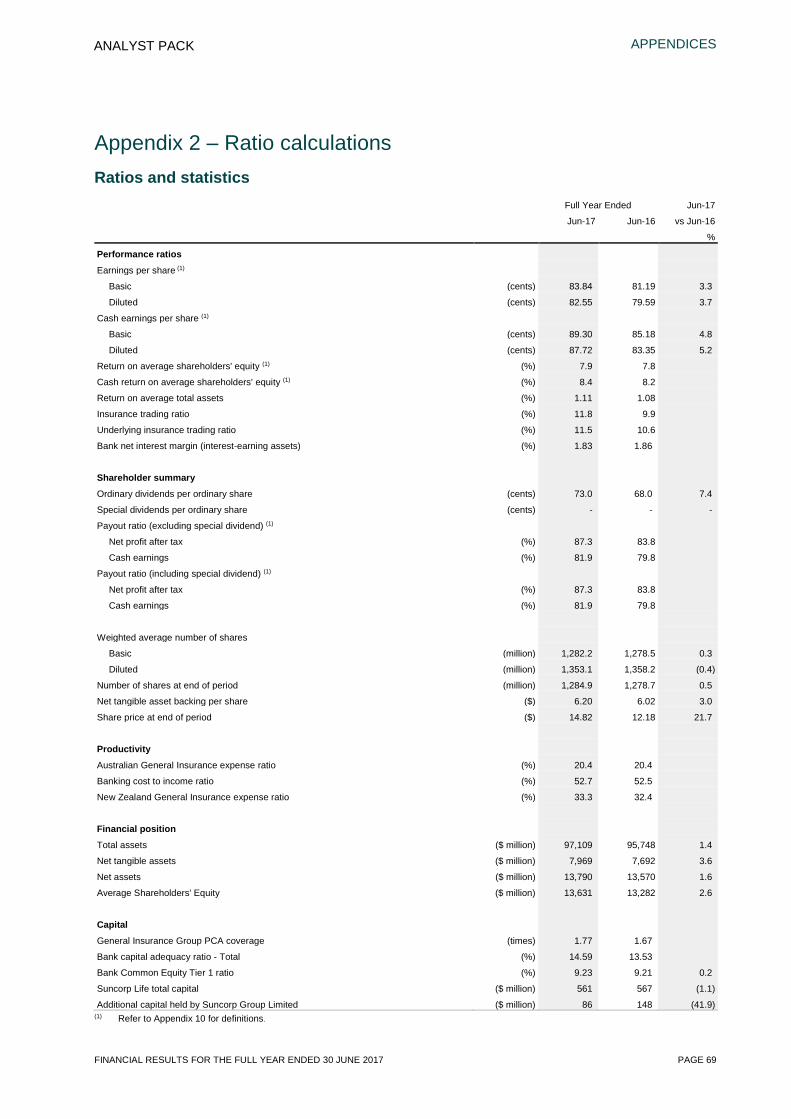
APPENDICES
FINANCIAL RESULTS FOR THE FULL YEAR ENDED 30 JUNE 2017 PAGE 69
ANALYST PACK
Appendix 2 – Ratio calculations Ratios and statistics Full Year Ended Jun-17
Jun-17 Jun-16 vs Jun-16
%
Performance ratios
Earnings per share (1)
Basic (cents) 83.84 81.19 3.3
Diluted (cents) 82.55 79.59 3.7
Cash earnings per share (1)
Basic (cents) 89.30 85.18 4.8
Diluted (cents) 87.72 83.35 5.2
Return on average shareholders' equity (1) (%) 7.9 7.8
Cash return on average shareholders' equity (1) (%) 8.4 8.2
Return on average total assets (%) 1.11 1.08
Insurance trading ratio (%) 11.8 9.9
Underlying insurance trading ratio (%) 11.5 10.6
Bank net interest margin (interest-earning assets) (%) 1.83 1.86
Shareholder summary
Ordinary dividends per ordinary share (cents) 73.0 68.0 7.4
Special dividends per ordinary share (cents) - - -
Payout ratio (excluding special dividend) (1)
Net profit after tax (%) 87.3 83.8
Cash earnings (%) 81.9 79.8
Payout ratio (including special dividend) (1)
Net profit after tax (%) 87.3 83.8
Cash earnings (%) 81.9 79.8
Weighted average number of shares
Basic (million) 1,282.2 1,278.5 0.3
Diluted (million) 1,353.1 1,358.2 (0.4)
Number of shares at end of period (million) 1,284.9 1,278.7 0.5
Net tangible asset backing per share ($) 6.20 6.02 3.0
Share price at end of period ($) 14.82 12.18 21.7
Productivity
Australian General Insurance expense ratio (%) 20.4 20.4
Banking cost to income ratio (%) 52.7 52.5
New Zealand General Insurance expense ratio (%) 33.3 32.4
Financial position
Total assets ($ million) 97,109 95,748 1.4
Net tangible assets ($ million) 7,969 7,692 3.6
Net assets ($ million) 13,790 13,570 1.6
Average Shareholders' Equity ($ million) 13,631 13,282 2.6
Capital
General Insurance Group PCA coverage (times) 1.77 1.67
Bank capital adequacy ratio - Total (%) 14.59 13.53
Bank Common Equity Tier 1 ratio (%) 9.23 9.21 0.2
Suncorp Life total capital ($ million) 561 567 (1.1)
Additional capital held by Suncorp Group Limited ($ million) 86 148 (41.9) (1) Refer to Appendix 10 for definitions.

APPENDICES
PAGE 70 FINANCIAL RESULTS FOR THE FULL YEAR ENDED 30 JUNE 2017
ANALYST PACK
Appendix 2 – Ratio calculations (continued) Ratios and statistics Half Year Ended Jun-17 Jun-17
Jun-17 Dec-16 Jun-16 Dec-15 vs Dec-16 vs Jun-16
% %
Performance ratios
Earnings per share (1)
Basic (cents) 41.91 41.93 39.73 41.45 (0.0) 5.5
Diluted (cents) 41.21 41.13 39.02 40.56 0.2 5.6
Cash earnings per share (1)
Basic (cents) 43.70 45.60 41.69 43.49 (4.2) 4.8
Diluted (cents) 42.91 44.61 40.86 42.47 (3.8) 5.0
Return on average shareholders' equity (1) (%) 7.9 7.8 7.7 7.9
Cash return on average shareholders' equity (1) (%) 8.2 8.5 8.1 8.3
Return on average total assets (%) 1.11 1.11 1.07 1.11
Insurance trading ratio (%) 11.2 12.5 10.3 9.4
Underlying insurance trading ratio (%) 12.0 11.0 11.0 10.1
Bank net interest margin (interest-earning assets) (%) 1.87 1.78 1.86 1.85
Shareholder summary
Ordinary dividends per ordinary share (cents) 40.0 33.0 38.0 30.0 21.2 5.3
Special dividends per ordinary share (cents) - - - - - -
Payout ratio (excluding special dividend) (1)
Net profit after tax (%) 95.5 78.8 95.7 72.4
Cash earnings (%) 91.6 72.5 91.2 69.0
Payout ratio (including special dividend) (1)
Net profit after tax (%) 95.5 78.8 95.7 72.4
Cash earnings (%) 91.6 72.5 91.2 69.0
Weighted average number of shares
Basic (million) 1,283.7 1,280.7 1,278.6 1,278.5 0.2 0.4
Diluted (million) 1,358.7 1,354.1 1,358.2 1,358.5 0.3 0.0
Number of shares at end of period (million) 1,284.9 1,282.2 1,278.7 1,278.3 0.2 0.5
Net tangible asset backing per share ($) 6.20 6.10 6.02 5.95 1.7 3.1
Share price at end of period ($) 14.82 13.52 12.18 12.14 9.6 21.7
Productivity
Australian General Insurance expense ratio (%) 20.5 20.3 20.1 20.8
Banking cost to income ratio (%) 53.9 51.4 52.0 53.0
New Zealand General Insurance expense ratio (%) 33.2 33.4 31.9 32.8
Financial position
Total assets ($ million) 97,109 96,801 95,748 94,445 0.3 1.4
Net tangible assets ($ million) 7,969 7,816 7,692 7,601 2.0 3.6
Net assets ($ million) 13,790 13,652 13,570 13,446 1.0 1.6
Average Shareholders' Equity ($ million) 13,638 13,625 13,303 13,261 0.1 2.5
Capital
General Insurance Group PCA coverage (times) 1.77 1.78 1.67 1.73
Bank capital adequacy ratio - Total (%) 14.59 13.48 13.53 13.97
Bank Common Equity Tier 1 ratio (%) 9.23 9.20 9.21 9.45
Suncorp Life total capital ($ million) 561 625 567 541 (10.2) (1.1)
Additional capital held by Suncorp Group Limited ($ million) 86 121 148 243 (28.9) (41.9) (1) Refer to Appendix 10 for definitions.

APPENDICES
FINANCIAL RESULTS FOR THE FULL YEAR ENDED 30 JUNE 2017 PAGE 71
ANALYST PACK
Appendix 2 – Ratio Calculations (continued)
Earnings per share
Numerator Full Year Ended Half Year Ended
Jun-17 Jun-16 Jun-17 Dec-16 Jun-16 Dec-15
$M $M $M $M $M $M
Earnings:
Profit attributable to ordinary equity holders of the company (basic) 1,075 1,038 538 537 508 530 Interest expense on convertible preference shares (net of tax) 40 43 20 20 22 21
Interest expense on convertible capital notes (net of tax) 2 - 2 - - -
Profit attributable to ordinary equity holders of the company (diluted) 1,117 1,081 560 557 530 551
Denominator Full Year Ended Half Year Ended
Jun-17 Jun-16 Jun-17 Dec-16 Jun-16 Dec-15
No. of
Shares No. of
Shares No. of
Shares No. of
Shares No. of
Shares No. of
Shares
Weighted average number of shares:
Weighted average number of ordinary shares (basic) 1,282,167,879 1,278,537,834 1,283,666,294 1,280,693,895 1,278,551,701 1,278,526,717
Effect of conversion of convertible preference shares 66,852,101 79,666,795 66,852,101 73,384,999 79,666,795 79,932,669
Effect of conversion of convertible capital notes 4,078,093 - 8,223,778 - - -
Weighted average number of ordinary shares (diluted) 1,353,098,073 1,358,204,629 1,358,742,173 1,354,078,894 1,358,218,496 1,358,459,386
Cash earnings per share
Numerator Full Year Ended Half Year Ended
Jun-17 Jun-16 Jun-17 Dec-16 Jun-16 Dec-15
$M $M $M $M $M $M
Earnings:
Cash Profit attributable to ordinary equity holders of the company (basic) 1,145 1,089 561 584 533 556 Interest expense on convertible preference shares (net of tax) 40 43 20 20 22 21
Interest expense on convertible capital notes (net of tax) 2 - 2 - - -
Cash Profit attributable to ordinary equity holders of the company (diluted) 1,187 1,132 583 604 555 577
Denominator Full Year Ended Half Year Ended
Jun-17 Jun-16 Jun-17 Dec-16 Jun-16 Dec-15
No. of
Shares No. of
Shares No. of
Shares No. of
Shares No. of
Shares No. of
Shares
Weighted average number of shares:
Weighted average number of ordinary shares (basic) 1,282,167,879 1,278,537,834 1,283,666,294 1,280,693,895 1,278,551,701 1,278,526,717 Effect of conversion of convertible preference shares 66,852,101 79,666,795 66,852,101 73,384,999 79,666,795 79,932,669 Effect of conversion of convertible capital notes 4,078,093 - 8,223,778 - - -
Weighted average number of ordinary shares (diluted) 1,353,098,073 1,358,204,629 1,358,742,173 1,354,078,894 1,358,218,496 1,358,459,386
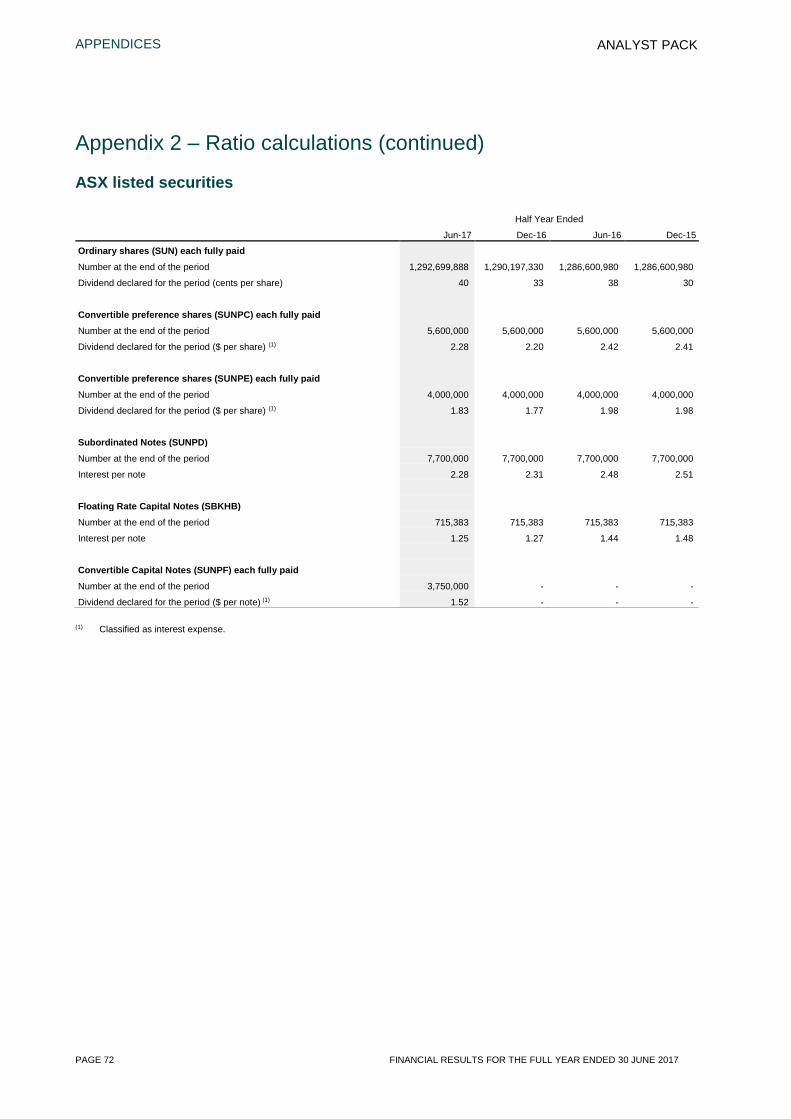
APPENDICES
PAGE 72 FINANCIAL RESULTS FOR THE FULL YEAR ENDED 30 JUNE 2017
ANALYST PACK
Appendix 2 – Ratio calculations (continued)
ASX listed securities
Half Year Ended
Jun-17 Dec-16 Jun-16 Dec-15
Ordinary shares (SUN) each fully paid
Number at the end of the period 1,292,699,888 1,290,197,330 1,286,600,980 1,286,600,980
Dividend declared for the period (cents per share) 40 33 38 30
Convertible preference shares (SUNPC) each fully paid
Number at the end of the period 5,600,000 5,600,000 5,600,000 5,600,000
Dividend declared for the period ($ per share) (1) 2.28 2.20 2.42 2.41
Convertible preference shares (SUNPE) each fully paid
Number at the end of the period 4,000,000 4,000,000 4,000,000 4,000,000
Dividend declared for the period ($ per share) (1) 1.83 1.77 1.98 1.98
Subordinated Notes (SUNPD)
Number at the end of the period 7,700,000 7,700,000 7,700,000 7,700,000
Interest per note 2.28 2.31 2.48 2.51
Floating Rate Capital Notes (SBKHB)
Number at the end of the period 715,383 715,383 715,383 715,383
Interest per note 1.25 1.27 1.44 1.48
Convertible Capital Notes (SUNPF) each fully paid
Number at the end of the period 3,750,000 - - -
Dividend declared for the period ($ per note) (1) 1.52 - - -
(1) Classified as interest expense.

APPENDICES
FINANCIAL RESULTS FOR THE FULL YEAR ENDED 30 JUNE 2017 PAGE 73
ANALYST PACK
Appendix 3 – Reported Underlying ITR Jun-17 Jun-16 Jun-15 $M $M $M
Reported ITR 965 782 894 Reported reserve releases (above) below long-run expectations (166) (228) (309)
Natural hazards above (below) long-run allowances 89 60 473
Investment income mismatch (46) 207 85
Other: Risk margin (19) (50) (26) Abnormal (Simplification/restructuring) expenses 61 67 41 Reinsurance backup cover 53 - -
Underlying ITR 937 838 1,158 Underlying ITR ratio 11.5% 10.6% 14.7%
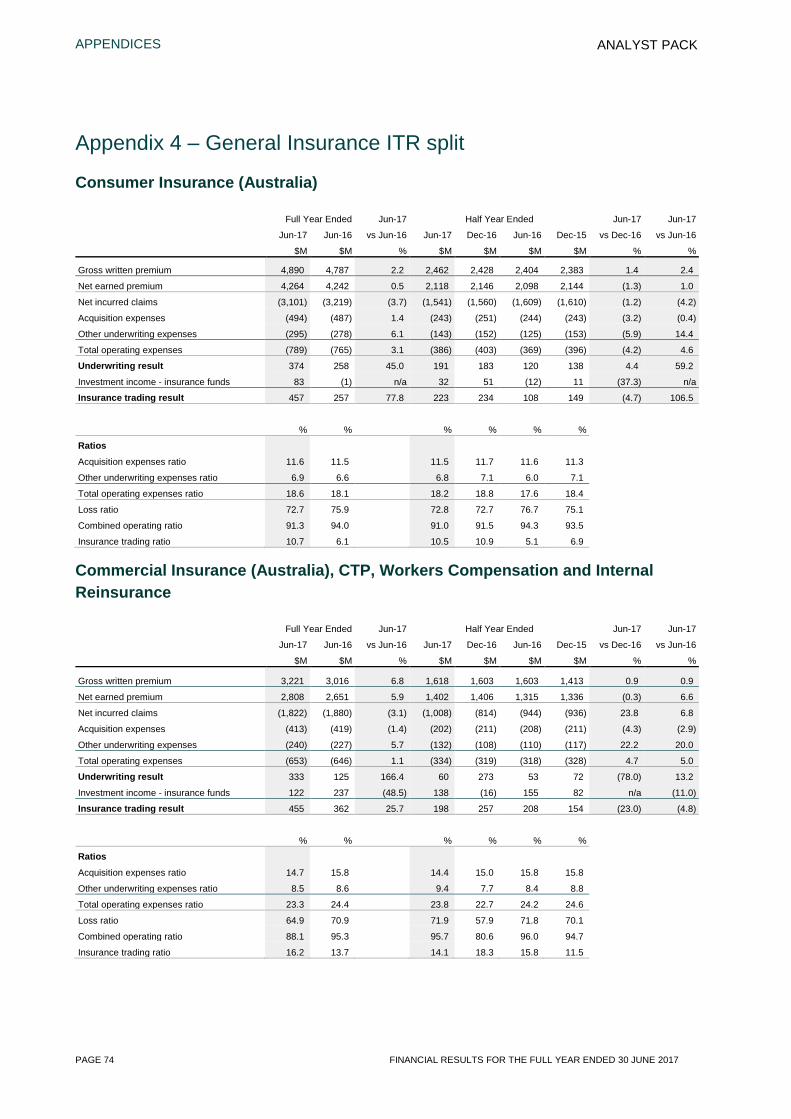
APPENDICES
PAGE 74 FINANCIAL RESULTS FOR THE FULL YEAR ENDED 30 JUNE 2017
ANALYST PACK
Appendix 4 – General Insurance ITR split
Consumer Insurance (Australia)
Full Year Ended Jun-17 Half Year Ended Jun-17 Jun-17
Jun-17 Jun-16 vs Jun-16 Jun-17 Dec-16 Jun-16 Dec-15 vs Dec-16 vs Jun-16
$M $M % $M $M $M $M % %
Gross written premium 4,890 4,787 2.2 2,462 2,428 2,404 2,383 1.4 2.4
Net earned premium 4,264 4,242 0.5 2,118 2,146 2,098 2,144 (1.3) 1.0
Net incurred claims (3,101) (3,219) (3.7) (1,541) (1,560) (1,609) (1,610) (1.2) (4.2)
Acquisition expenses (494) (487) 1.4 (243) (251) (244) (243) (3.2) (0.4)
Other underwriting expenses (295) (278) 6.1 (143) (152) (125) (153) (5.9) 14.4
Total operating expenses (789) (765) 3.1 (386) (403) (369) (396) (4.2) 4.6
Underwriting result 374 258 45.0 191 183 120 138 4.4 59.2
Investment income - insurance funds 83 (1) n/a 32 51 (12) 11 (37.3) n/a
Insurance trading result 457 257 77.8 223 234 108 149 (4.7) 106.5
% % % % % %
Ratios
Acquisition expenses ratio 11.6 11.5 11.5 11.7 11.6 11.3
Other underwriting expenses ratio 6.9 6.6 6.8 7.1 6.0 7.1
Total operating expenses ratio 18.6 18.1 18.2 18.8 17.6 18.4
Loss ratio 72.7 75.9 72.8 72.7 76.7 75.1
Combined operating ratio 91.3 94.0 91.0 91.5 94.3 93.5
Insurance trading ratio 10.7 6.1 10.5 10.9 5.1 6.9
Commercial Insurance (Australia), CTP, Workers Compensation and Internal Reinsurance
Full Year Ended Jun-17 Half Year Ended Jun-17 Jun-17
Jun-17 Jun-16 vs Jun-16 Jun-17 Dec-16 Jun-16 Dec-15 vs Dec-16 vs Jun-16
$M $M % $M $M $M $M % %
Gross written premium 3,221 3,016 6.8 1,618 1,603 1,603 1,413 0.9 0.9
Net earned premium 2,808 2,651 5.9 1,402 1,406 1,315 1,336 (0.3) 6.6
Net incurred claims (1,822) (1,880) (3.1) (1,008) (814) (944) (936) 23.8 6.8
Acquisition expenses (413) (419) (1.4) (202) (211) (208) (211) (4.3) (2.9)
Other underwriting expenses (240) (227) 5.7 (132) (108) (110) (117) 22.2 20.0
Total operating expenses (653) (646) 1.1 (334) (319) (318) (328) 4.7 5.0
Underwriting result 333 125 166.4 60 273 53 72 (78.0) 13.2
Investment income - insurance funds 122 237 (48.5) 138 (16) 155 82 n/a (11.0)
Insurance trading result 455 362 25.7 198 257 208 154 (23.0) (4.8)
% % % % % %
Ratios
Acquisition expenses ratio 14.7 15.8 14.4 15.0 15.8 15.8
Other underwriting expenses ratio 8.5 8.6 9.4 7.7 8.4 8.8
Total operating expenses ratio 23.3 24.4 23.8 22.7 24.2 24.6
Loss ratio 64.9 70.9 71.9 57.9 71.8 70.1
Combined operating ratio 88.1 95.3 95.7 80.6 96.0 94.7
Insurance trading ratio 16.2 13.7 14.1 18.3 15.8 11.5
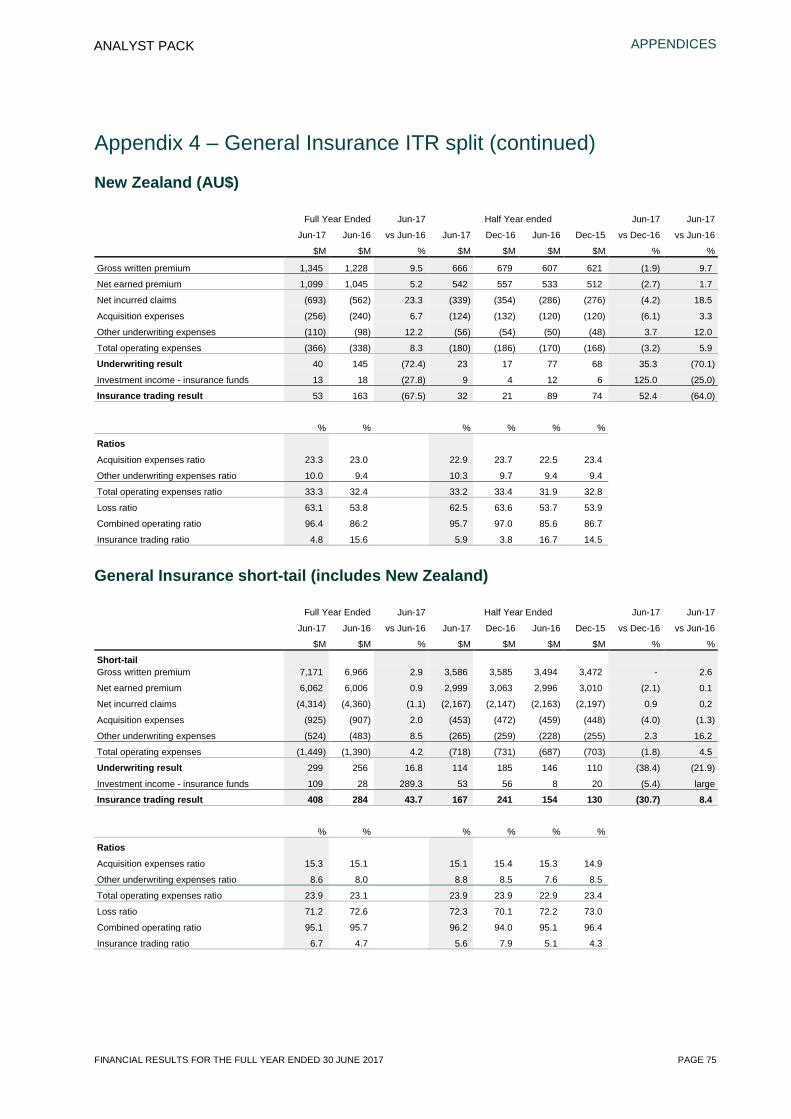
APPENDICES
FINANCIAL RESULTS FOR THE FULL YEAR ENDED 30 JUNE 2017 PAGE 75
ANALYST PACK
Appendix 4 – General Insurance ITR split (continued)
New Zealand (AU$)
Full Year Ended Jun-17 Half Year ended Jun-17 Jun-17
Jun-17 Jun-16 vs Jun-16 Jun-17 Dec-16 Jun-16 Dec-15 vs Dec-16 vs Jun-16
$M $M % $M $M $M $M % %
Gross written premium 1,345 1,228 9.5 666 679 607 621 (1.9) 9.7
Net earned premium 1,099 1,045 5.2 542 557 533 512 (2.7) 1.7
Net incurred claims (693) (562) 23.3 (339) (354) (286) (276) (4.2) 18.5
Acquisition expenses (256) (240) 6.7 (124) (132) (120) (120) (6.1) 3.3
Other underwriting expenses (110) (98) 12.2 (56) (54) (50) (48) 3.7 12.0
Total operating expenses (366) (338) 8.3 (180) (186) (170) (168) (3.2) 5.9
Underwriting result 40 145 (72.4) 23 17 77 68 35.3 (70.1)
Investment income - insurance funds 13 18 (27.8) 9 4 12 6 125.0 (25.0)
Insurance trading result 53 163 (67.5) 32 21 89 74 52.4 (64.0)
% % % % % %
Ratios
Acquisition expenses ratio 23.3 23.0 22.9 23.7 22.5 23.4
Other underwriting expenses ratio 10.0 9.4 10.3 9.7 9.4 9.4
Total operating expenses ratio 33.3 32.4 33.2 33.4 31.9 32.8
Loss ratio 63.1 53.8 62.5 63.6 53.7 53.9
Combined operating ratio 96.4 86.2 95.7 97.0 85.6 86.7
Insurance trading ratio 4.8 15.6 5.9 3.8 16.7 14.5
General Insurance short-tail (includes New Zealand)
Full Year Ended Jun-17 Half Year Ended Jun-17 Jun-17
Jun-17 Jun-16 vs Jun-16 Jun-17 Dec-16 Jun-16 Dec-15 vs Dec-16 vs Jun-16
$M $M % $M $M $M $M % %
Short-tail Gross written premium 7,171 6,966 2.9 3,586 3,585 3,494 3,472 - 2.6
Net earned premium 6,062 6,006 0.9 2,999 3,063 2,996 3,010 (2.1) 0.1
Net incurred claims (4,314) (4,360) (1.1) (2,167) (2,147) (2,163) (2,197) 0.9 0.2
Acquisition expenses (925) (907) 2.0 (453) (472) (459) (448) (4.0) (1.3)
Other underwriting expenses (524) (483) 8.5 (265) (259) (228) (255) 2.3 16.2
Total operating expenses (1,449) (1,390) 4.2 (718) (731) (687) (703) (1.8) 4.5
Underwriting result 299 256 16.8 114 185 146 110 (38.4) (21.9)
Investment income - insurance funds 109 28 289.3 53 56 8 20 (5.4) large
Insurance trading result 408 284 43.7 167 241 154 130 (30.7) 8.4 % % % % % %
Ratios
Acquisition expenses ratio 15.3 15.1 15.1 15.4 15.3 14.9
Other underwriting expenses ratio 8.6 8.0 8.8 8.5 7.6 8.5
Total operating expenses ratio 23.9 23.1 23.9 23.9 22.9 23.4
Loss ratio 71.2 72.6 72.3 70.1 72.2 73.0
Combined operating ratio 95.1 95.7 96.2 94.0 95.1 96.4
Insurance trading ratio 6.7 4.7 5.6 7.9 5.1 4.3

APPENDICES
PAGE 76 FINANCIAL RESULTS FOR THE FULL YEAR ENDED 30 JUNE 2017
ANALYST PACK
Appendix 4 – General Insurance ITR split (continued)
General Insurance long-tail (includes New Zealand)
Full Year Ended Jun-17 Half Year Ended Jun-17 Jun-17
Jun-17 Jun-16 vs Jun-16 Jun-17 Dec-16 Jun-16 Dec-15 vs Dec-16 vs Jun-16
$M $M % $M $M $M $M % %
Long-tail
Gross written premium 2,285 2,065 10.7 1,160 1,125 1,120 945 3.1 3.6
Net earned premium 2,108 1,932 9.1 1,062 1,046 950 982 1.5 11.8
Net incurred claims (1,302) (1,301) 0.1 (721) (581) (676) (625) 24.1 6.7
Acquisition expenses (238) (239) (0.4) (116) (122) (113) (126) (4.9) 2.7
Other underwriting expenses (120) (120) - (65) (55) (57) (63) 18.2 14.0
Total operating expenses (358) (359) (0.3) (181) (177) (170) (189) 2.3 6.5
Underwriting result 448 272 64.7 160 288 104 168 (44.4) 53.8
Investment income - insurance funds 109 226 (51.8) 126 (17) 147 79 n/a (14.3)
Insurance trading result 557 498 11.8 286 271 251 247 5.5 13.9 % % % % % %
Ratios
Acquisition expenses ratio 11.3 12.4 10.9 11.6 11.9 12.8
Other underwriting expenses ratio 5.7 6.2 6.1 5.3 6.0 6.4
Total operating expenses ratio 17.0 18.6 17.0 16.9 17.9 19.2
Loss ratio 61.8 67.3 67.9 55.5 71.2 63.7
Combined operating ratio 78.8 85.9 84.9 72.4 89.1 82.9
Insurance trading ratio 26.4 25.8 26.9 25.9 26.4 25.2
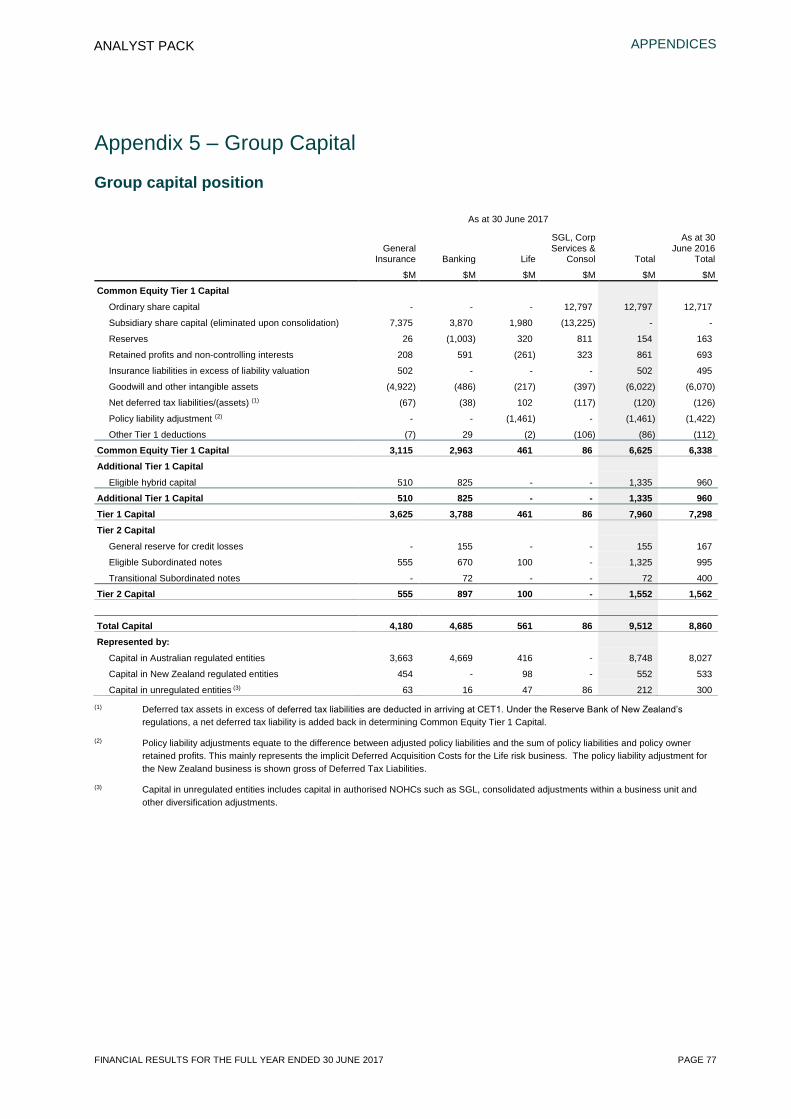
APPENDICES
FINANCIAL RESULTS FOR THE FULL YEAR ENDED 30 JUNE 2017 PAGE 77
ANALYST PACK
Appendix 5 – Group Capital
Group capital position
As at 30 June 2017
As at 30 June 2016
Total General
Insurance Banking Life
SGL, Corp Services &
Consol Total
$M $M $M $M $M $M
Common Equity Tier 1 Capital
Ordinary share capital - - - 12,797 12,797 12,717
Subsidiary share capital (eliminated upon consolidation) 7,375 3,870 1,980 (13,225) - -
Reserves 26 (1,003) 320 811 154 163
Retained profits and non-controlling interests 208 591 (261) 323 861 693
Insurance liabilities in excess of liability valuation 502 - - - 502 495
Goodwill and other intangible assets (4,922) (486) (217) (397) (6,022) (6,070)
Net deferred tax liabilities/(assets) (1) (67) (38) 102 (117) (120) (126)
Policy liability adjustment (2) - - (1,461) - (1,461) (1,422)
Other Tier 1 deductions (7) 29 (2) (106) (86) (112)
Common Equity Tier 1 Capital 3,115 2,963 461 86 6,625 6,338 Additional Tier 1 Capital
Eligible hybrid capital 510 825 - - 1,335 960
Additional Tier 1 Capital 510 825 - - 1,335 960 Tier 1 Capital 3,625 3,788 461 86 7,960 7,298 Tier 2 Capital
General reserve for credit losses - 155 - - 155 167
Eligible Subordinated notes 555 670 100 - 1,325 995
Transitional Subordinated notes - 72 - - 72 400
Tier 2 Capital 555 897 100 - 1,552 1,562
Total Capital 4,180 4,685 561 86 9,512 8,860 Represented by:
Capital in Australian regulated entities 3,663 4,669 416 - 8,748 8,027
Capital in New Zealand regulated entities 454 - 98 - 552 533
Capital in unregulated entities (3) 63 16 47 86 212 300
(1) Deferred tax assets in excess of deferred tax liabilities are deducted in arriving at CET1. Under the Reserve Bank of New Zealand’s
regulations, a net deferred tax liability is added back in determining Common Equity Tier 1 Capital.
(2) Policy liability adjustments equate to the difference between adjusted policy liabilities and the sum of policy liabilities and policy owner retained profits. This mainly represents the implicit Deferred Acquisition Costs for the Life risk business. The policy liability adjustment for the New Zealand business is shown gross of Deferred Tax Liabilities.
(3) Capital in unregulated entities includes capital in authorised NOHCs such as SGL, consolidated adjustments within a business unit and other diversification adjustments.
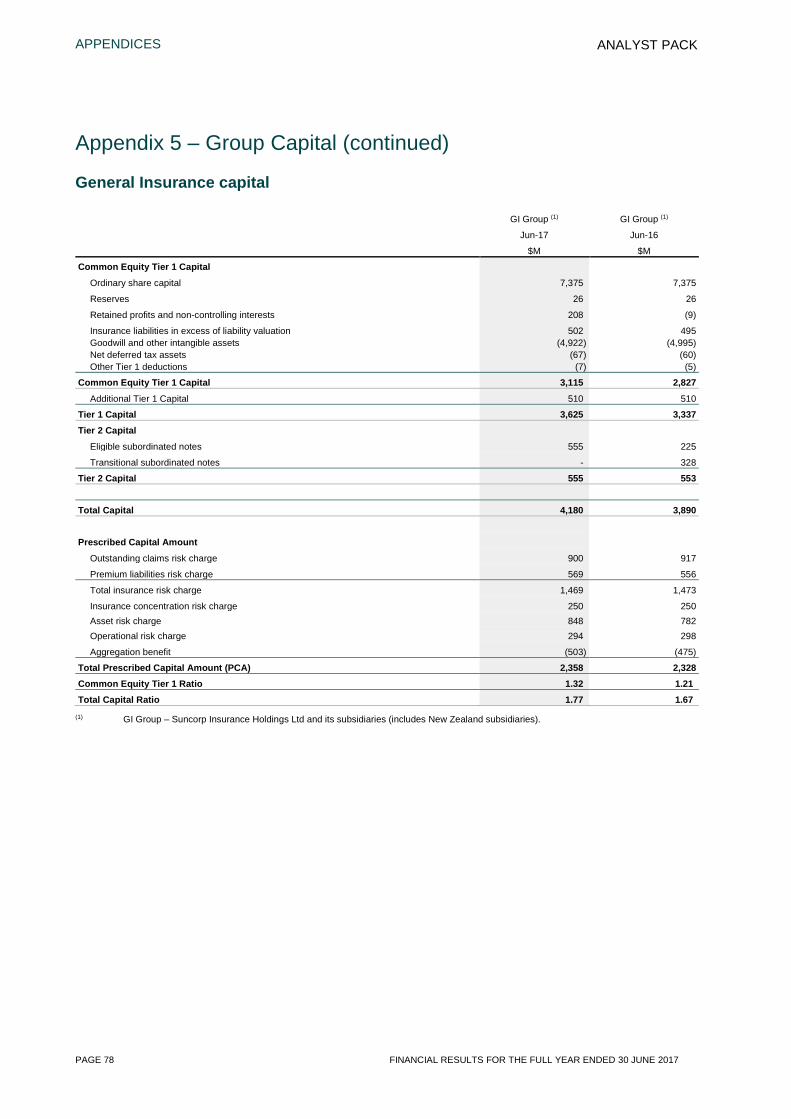
APPENDICES
PAGE 78 FINANCIAL RESULTS FOR THE FULL YEAR ENDED 30 JUNE 2017
ANALYST PACK
Appendix 5 – Group Capital (continued)
General Insurance capital
GI Group (1) GI Group (1)
Jun-17 Jun-16
$M $M
Common Equity Tier 1 Capital
Ordinary share capital 7,375 7,375
Reserves 26 26
Retained profits and non-controlling interests 208 (9)
Insurance liabilities in excess of liability valuation 502 495 Goodwill and other intangible assets (4,922) (4,995) Net deferred tax assets (67) (60) Other Tier 1 deductions (7) (5)
Common Equity Tier 1 Capital 3,115 2,827 Additional Tier 1 Capital 510 510
Tier 1 Capital 3,625 3,337 Tier 2 Capital
Eligible subordinated notes 555 225
Transitional subordinated notes - 328
Tier 2 Capital 555 553 Total Capital 4,180 3,890
Prescribed Capital Amount Outstanding claims risk charge 900 917
Premium liabilities risk charge 569 556
Total insurance risk charge 1,469 1,473
Insurance concentration risk charge 250 250 Asset risk charge 848 782 Operational risk charge 294 298
Aggregation benefit (503) (475)
Total Prescribed Capital Amount (PCA) 2,358 2,328 Common Equity Tier 1 Ratio 1.32 1.21 Total Capital Ratio 1.77 1.67
(1) GI Group – Suncorp Insurance Holdings Ltd and its subsidiaries (includes New Zealand subsidiaries).
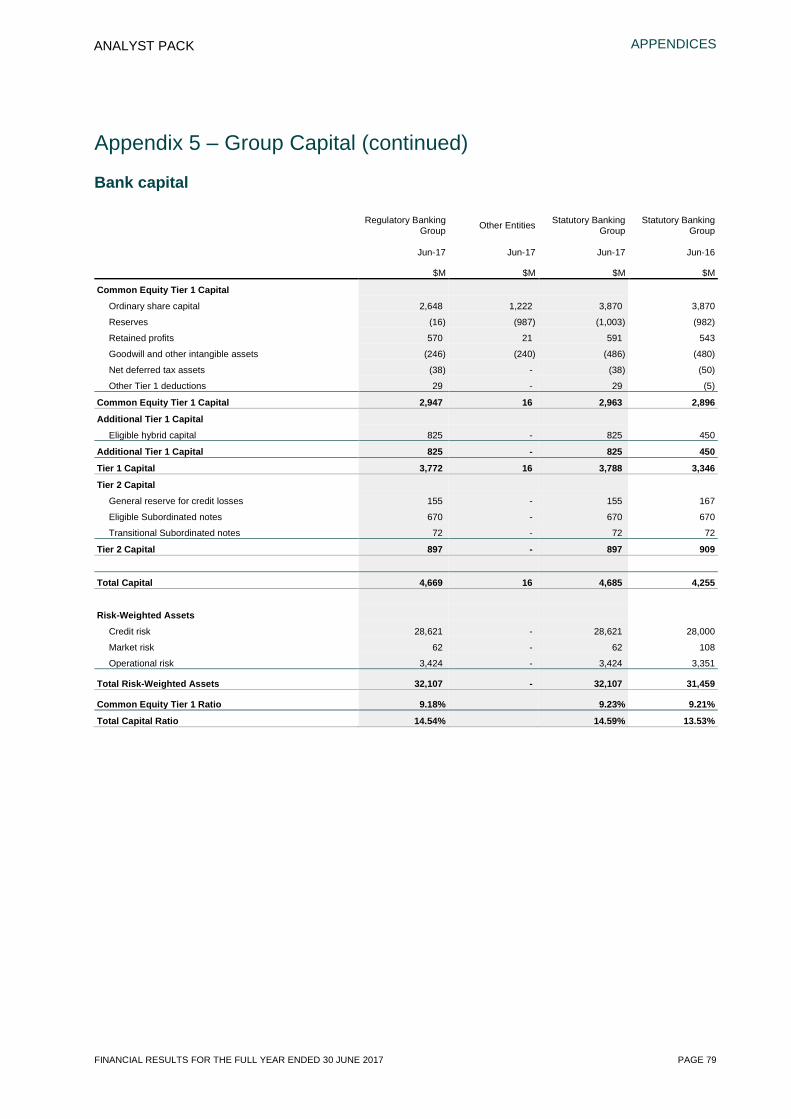
APPENDICES
FINANCIAL RESULTS FOR THE FULL YEAR ENDED 30 JUNE 2017 PAGE 79
ANALYST PACK
Appendix 5 – Group Capital (continued)
Bank capital
Regulatory Banking Group Other Entities Statutory Banking
Group Statutory Banking
Group
Jun-17 Jun-17 Jun-17 Jun-16
$M $M $M $M
Common Equity Tier 1 Capital
Ordinary share capital 2,648 1,222 3,870 3,870
Reserves (16) (987) (1,003) (982)
Retained profits 570 21 591 543
Goodwill and other intangible assets (246) (240) (486) (480)
Net deferred tax assets (38) - (38) (50)
Other Tier 1 deductions 29 - 29 (5)
Common Equity Tier 1 Capital 2,947 16 2,963 2,896
Additional Tier 1 Capital
Eligible hybrid capital 825 - 825 450
Additional Tier 1 Capital 825 - 825 450
Tier 1 Capital 3,772 16 3,788 3,346
Tier 2 Capital
General reserve for credit losses 155 - 155 167
Eligible Subordinated notes 670 - 670 670
Transitional Subordinated notes 72 - 72 72
Tier 2 Capital 897 - 897 909
Total Capital 4,669 16 4,685 4,255
Risk-Weighted Assets
Credit risk 28,621 - 28,621 28,000
Market risk 62 - 62 108
Operational risk 3,424 - 3,424 3,351
Total Risk-Weighted Assets 32,107 - 32,107 31,459
Common Equity Tier 1 Ratio 9.18% 9.23% 9.21%
Total Capital Ratio 14.54% 14.59% 13.53%
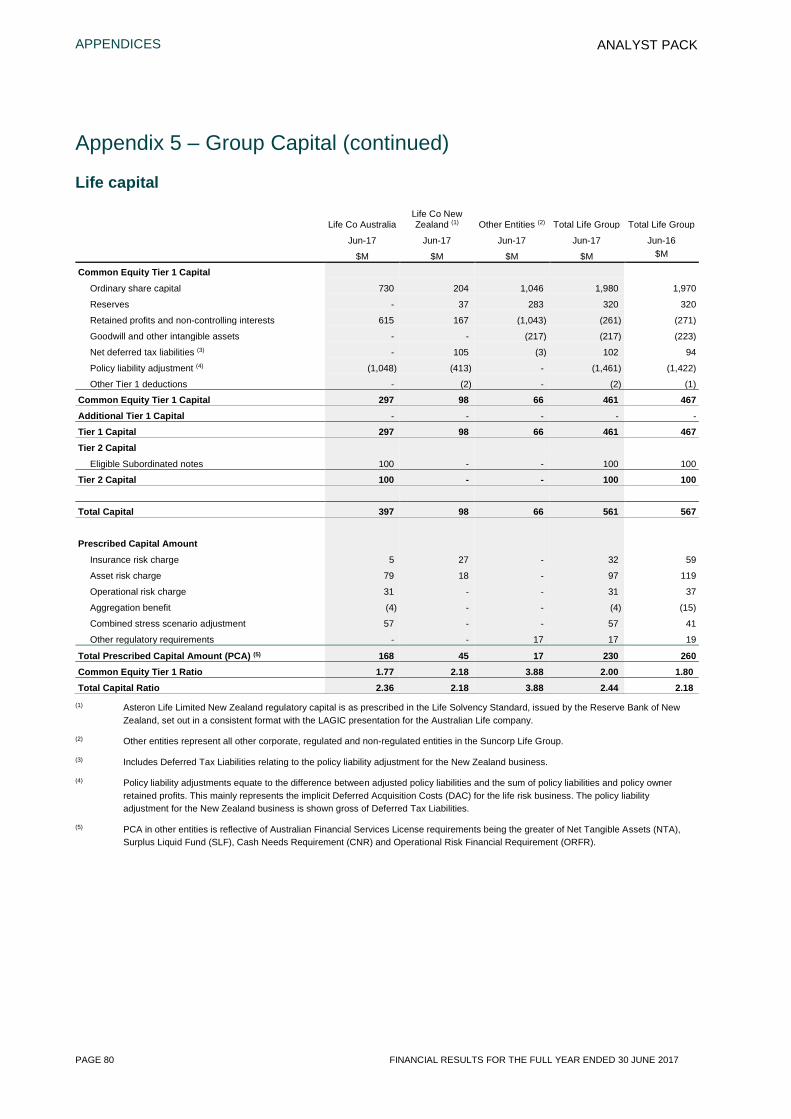
APPENDICES
PAGE 80 FINANCIAL RESULTS FOR THE FULL YEAR ENDED 30 JUNE 2017
ANALYST PACK
Appendix 5 – Group Capital (continued)
Life capital
Life Co Australia Life Co New Zealand (1) Other Entities (2) Total Life Group Total Life Group
Jun-17 Jun-17 Jun-17 Jun-17 Jun-16
$M $M $M $M $M
Common Equity Tier 1 Capital
Ordinary share capital 730 204 1,046 1,980 1,970
Reserves - 37 283 320 320
Retained profits and non-controlling interests 615 167 (1,043) (261) (271)
Goodwill and other intangible assets - - (217) (217) (223)
Net deferred tax liabilities (3) - 105 (3) 102 94
Policy liability adjustment (4) (1,048) (413) - (1,461) (1,422)
Other Tier 1 deductions - (2) - (2) (1)
Common Equity Tier 1 Capital 297 98 66 461 467 Additional Tier 1 Capital - - - - -
Tier 1 Capital 297 98 66 461 467 Tier 2 Capital
Eligible Subordinated notes 100 - - 100 100
Tier 2 Capital 100 - - 100 100
Total Capital 397 98 66 561 567 Prescribed Capital Amount
Insurance risk charge 5 27 - 32 59
Asset risk charge 79 18 - 97 119
Operational risk charge 31 - - 31 37
Aggregation benefit (4) - - (4) (15)
Combined stress scenario adjustment 57 - - 57 41
Other regulatory requirements - - 17 17 19
Total Prescribed Capital Amount (PCA) (5) 168 45 17 230 260 Common Equity Tier 1 Ratio 1.77 2.18 3.88 2.00 1.80 Total Capital Ratio 2.36 2.18 3.88 2.44 2.18
(1) Asteron Life Limited New Zealand regulatory capital is as prescribed in the Life Solvency Standard, issued by the Reserve Bank of New Zealand, set out in a consistent format with the LAGIC presentation for the Australian Life company.
(2) Other entities represent all other corporate, regulated and non-regulated entities in the Suncorp Life Group.
(3) Includes Deferred Tax Liabilities relating to the policy liability adjustment for the New Zealand business.
(4) Policy liability adjustments equate to the difference between adjusted policy liabilities and the sum of policy liabilities and policy owner retained profits. This mainly represents the implicit Deferred Acquisition Costs (DAC) for the life risk business. The policy liability adjustment for the New Zealand business is shown gross of Deferred Tax Liabilities.
(5) PCA in other entities is reflective of Australian Financial Services License requirements being the greater of Net Tangible Assets (NTA), Surplus Liquid Fund (SLF), Cash Needs Requirement (CNR) and Operational Risk Financial Requirement (ORFR).
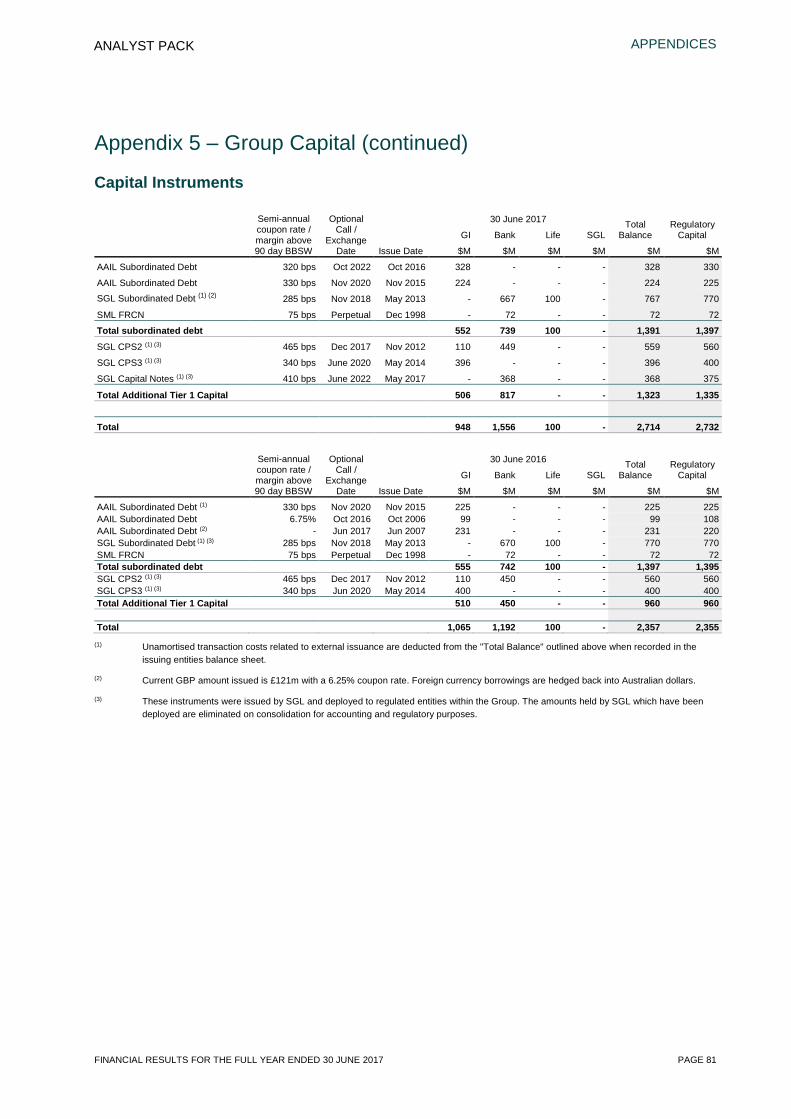
APPENDICES
FINANCIAL RESULTS FOR THE FULL YEAR ENDED 30 JUNE 2017 PAGE 81
ANALYST PACK
Appendix 5 – Group Capital (continued)
Capital Instruments
Semi-annual coupon rate / margin above 90 day BBSW
Optional Call /
Exchange Date Issue Date
30 June 2017 Total Balance
Regulatory Capital GI Bank Life SGL
$M $M $M $M $M $M
AAIL Subordinated Debt 320 bps Oct 2022 Oct 2016 328 - - - 328 330
AAIL Subordinated Debt 330 bps Nov 2020 Nov 2015 224 - - - 224 225
SGL Subordinated Debt (1) (2) 285 bps Nov 2018 May 2013 - 667 100 - 767 770
SML FRCN 75 bps Perpetual Dec 1998 - 72 - - 72 72
Total subordinated debt 552 739 100 - 1,391 1,397 SGL CPS2 (1) (3) 465 bps Dec 2017 Nov 2012 110 449 - - 559 560
SGL CPS3 (1) (3) 340 bps June 2020 May 2014 396 - - - 396 400
SGL Capital Notes (1) (3) 410 bps June 2022 May 2017 - 368 - - 368 375
Total Additional Tier 1 Capital 506 817 - - 1,323 1,335
Total 948 1,556 100 - 2,714 2,732 Semi-annual
coupon rate / margin above 90 day BBSW
Optional Call /
Exchange Date Issue Date
30 June 2016 Total Balance
Regulatory Capital GI Bank Life SGL
$M $M $M $M $M $M
AAIL Subordinated Debt (1) 330 bps Nov 2020 Nov 2015 225 - - - 225 225 AAIL Subordinated Debt 6.75% Oct 2016 Oct 2006 99 - - - 99 108 AAIL Subordinated Debt (2) - Jun 2017 Jun 2007 231 - - - 231 220 SGL Subordinated Debt (1) (3) 285 bps Nov 2018 May 2013 - 670 100 - 770 770 SML FRCN 75 bps Perpetual Dec 1998 - 72 - - 72 72 Total subordinated debt 555 742 100 - 1,397 1,395 SGL CPS2 (1) (3) 465 bps Dec 2017 Nov 2012 110 450 - - 560 560 SGL CPS3 (1) (3) 340 bps Jun 2020 May 2014 400 - - - 400 400 Total Additional Tier 1 Capital 510 450 - - 960 960 Total 1,065 1,192 100 - 2,357 2,355
(1) Unamortised transaction costs related to external issuance are deducted from the "Total Balance" outlined above when recorded in the issuing entities balance sheet.
(2) Current GBP amount issued is £121m with a 6.25% coupon rate. Foreign currency borrowings are hedged back into Australian dollars.
(3) These instruments were issued by SGL and deployed to regulated entities within the Group. The amounts held by SGL which have been deployed are eliminated on consolidation for accounting and regulatory purposes.

APPENDICES
PAGE 82 FINANCIAL RESULTS FOR THE FULL YEAR ENDED 30 JUNE 2017
ANALYST PACK
Appendix 6 – Operating expenses Full Year Ended Jun-17 Half Year Ended Jun-17 Jun-17 Jun-17 Jun-16 vs Jun-16 Jun-17 Dec-16 Jun-16 Dec-15 vs Dec-16 vs Jun-16 $M $M % $M $M $M $M % %
Insurance (Australia) operating expenses Acquisition expenses 907 906 0.1 445 462 452 454 (3.7) (1.5)
Other underwriting expenses 535 505 5.9 275 260 235 270 5.8 17.0
Life operating expenses 174 165 5.5 92 82 83 82 12.2 10.8
Insurance (Australia) operating expenses 1,616 1,576 2.5 812 804 770 806 1.0 5.5 New Zealand operating expenses
Acquisition expenses 256 240 6.7 124 132 120 120 (6.1) 3.3 Other underwriting expenses 110 98 12.2 56 54 50 48 3.7 12.0 Life operating expenses 34 34 - 17 17 16 18 - 6.3
New Zealand operating expenses 400 372 7.5 197 203 186 186 (3.0) 5.9 Banking & Wealth operating expenses
Banking operating expenses 636 639 (0.5) 329 307 313 326 7.2 5.1
Wealth operating expenses 94 82 14.6 48 46 40 42 4.3 20.0
Banking & Wealth operating expenses 730 721 1.2 377 353 353 368 6.8 6.8 Group total operating expenses 2,746 2,669 2.9 1,386 1,360 1,309 1,360 1.9 5.9
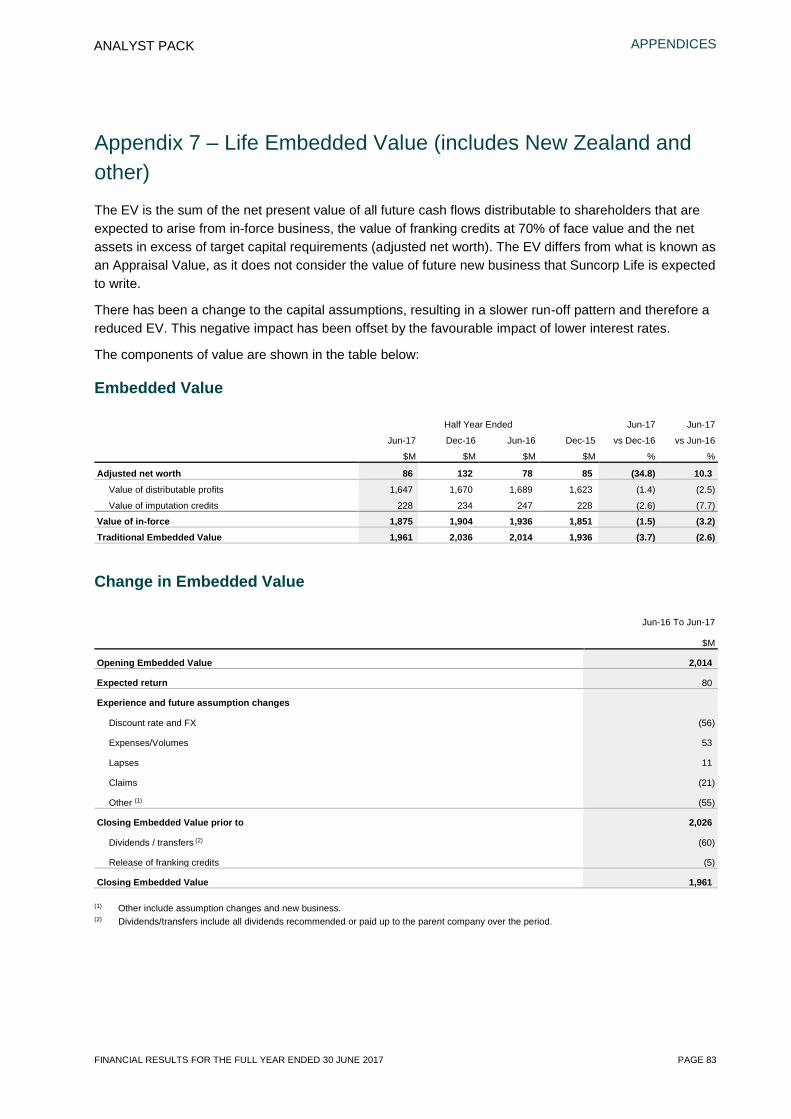
APPENDICES
FINANCIAL RESULTS FOR THE FULL YEAR ENDED 30 JUNE 2017 PAGE 83
ANALYST PACK
Appendix 7 – Life Embedded Value (includes New Zealand and other) The EV is the sum of the net present value of all future cash flows distributable to shareholders that are expected to arise from in-force business, the value of franking credits at 70% of face value and the net assets in excess of target capital requirements (adjusted net worth). The EV differs from what is known as an Appraisal Value, as it does not consider the value of future new business that Suncorp Life is expected to write.
There has been a change to the capital assumptions, resulting in a slower run-off pattern and therefore a reduced EV. This negative impact has been offset by the favourable impact of lower interest rates.
The components of value are shown in the table below:
Embedded Value
Half Year Ended Jun-17 Jun-17
Jun-17 Dec-16 Jun-16 Dec-15 vs Dec-16 vs Jun-16
$M $M $M $M % %
Adjusted net worth 86 132 78 85 (34.8) 10.3 Value of distributable profits 1,647 1,670 1,689 1,623 (1.4) (2.5)
Value of imputation credits 228 234 247 228 (2.6) (7.7)
Value of in-force 1,875 1,904 1,936 1,851 (1.5) (3.2) Traditional Embedded Value 1,961 2,036 2,014 1,936 (3.7) (2.6)
Change in Embedded Value
Jun-16 To Jun-17
$M
Opening Embedded Value 2,014
Expected return 80
Experience and future assumption changes
Discount rate and FX (56)
Expenses/Volumes 53
Lapses 11
Claims (21)
Other (1) (55)
Closing Embedded Value prior to 2,026
Dividends / transfers (2) (60)
Release of franking credits (5)
Closing Embedded Value 1,961
(1) Other include assumption changes and new business. (2) Dividends/transfers include all dividends recommended or paid up to the parent company over the period.

APPENDICES
PAGE 84 FINANCIAL RESULTS FOR THE FULL YEAR ENDED 30 JUNE 2017
ANALYST PACK
Appendix 7 – Life Embedded Value (continued)
As At
Jun-17 Jun-16
$M $M
Base Embedded Value 1,961 2,014
Embedded Value assuming
Discount rate and returns 1% higher 1,926 1,955
Discount rate and returns 1% lower 1,997 2,081
Discontinuance rates 10% lower 2,153 2,224
Renewal expenses 10% lower 1,987 2,066
Claims 10% lower 2,177 2,177
Assumptions
The assumptions used for valuing in-force business are based on long-term best estimate assumptions.
Lapses and claims (death and disability) assumptions are best estimate assumptions based on company experience and are consistent with those used for profit reporting.
Life risk assumptions (Australia)
Jun-17 Jun-16
% per annum % per annum
Investment return for underlying asset classes (gross of tax)
Risk-free rate (at 10 years) 2.7 2.0
Cash 2.7 2.0
Fixed interest 3.7 2.5
Australian equities (inc. allowance for franking credits) 6.7 6.0
International equities 7.0 6.0
Property 6.9 4.5
Investment returns (net of tax) 2.7 2.3 Inflation
Benefit indexation 2.5 2.5
Expense Inflation 2.5 2.5
Risk discount rate 6.7 6.0
Life risk assumptions (New Zealand)
Jun-17 Jun-16
% per annum % per annum
Investment return for underlying asset classes (gross of tax)
Risk-free rate (at 10 years) 3.8 3.2
Cash 3.3 2.7
Fixed interest 3.3 2.7
Australian equities (inc. allowance for franking credits) 7.5 6.9
International equities 6.5 5.9
Property 5.5 4.9
Investment returns (net of tax) 2.4 2.0 Inflation
Expense Inflation 2.3 2.3
Risk discount rate 7.0 6.3
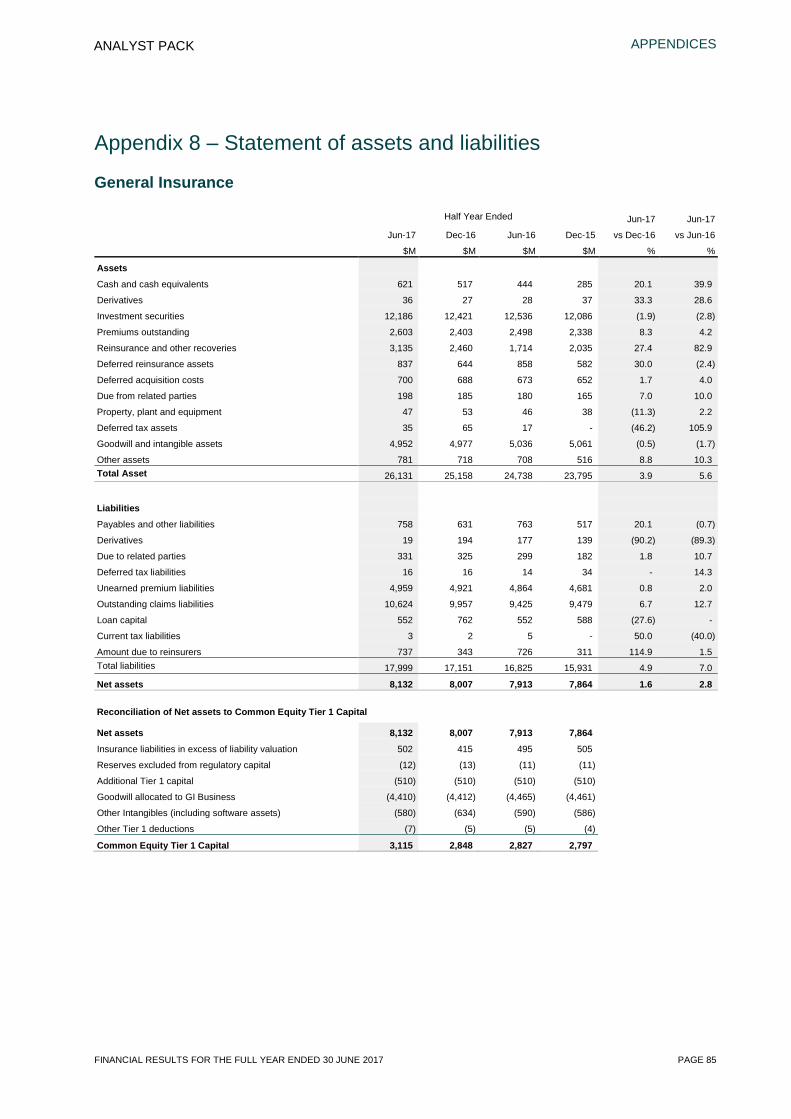
APPENDICES
FINANCIAL RESULTS FOR THE FULL YEAR ENDED 30 JUNE 2017 PAGE 85
ANALYST PACK
Appendix 8 – Statement of assets and liabilities
General Insurance
Half Year Ended Jun-17 Jun-17
Jun-17 Dec-16 Jun-16 Dec-15 vs Dec-16 vs Jun-16
$M $M $M $M % %
Assets
Cash and cash equivalents 621 517 444 285 20.1 39.9
Derivatives 36 27 28 37 33.3 28.6
Investment securities 12,186 12,421 12,536 12,086 (1.9) (2.8)
Premiums outstanding 2,603 2,403 2,498 2,338 8.3 4.2
Reinsurance and other recoveries 3,135 2,460 1,714 2,035 27.4 82.9
Deferred reinsurance assets 837 644 858 582 30.0 (2.4)
Deferred acquisition costs 700 688 673 652 1.7 4.0
Due from related parties 198 185 180 165 7.0 10.0
Property, plant and equipment 47 53 46 38 (11.3) 2.2
Deferred tax assets 35 65 17 - (46.2) 105.9
Goodwill and intangible assets 4,952 4,977 5,036 5,061 (0.5) (1.7)
Other assets 781 718 708 516 8.8 10.3 Total Asset 26,131 25,158 24,738 23,795 3.9 5.6
Liabilities
Payables and other liabilities 758 631 763 517 20.1 (0.7)
Derivatives 19 194 177 139 (90.2) (89.3)
Due to related parties 331 325 299 182 1.8 10.7
Deferred tax liabilities 16 16 14 34 - 14.3
Unearned premium liabilities 4,959 4,921 4,864 4,681 0.8 2.0
Outstanding claims liabilities 10,624 9,957 9,425 9,479 6.7 12.7
Loan capital 552 762 552 588 (27.6) -
Current tax liabilities 3 2 5 - 50.0 (40.0)
Amount due to reinsurers 737 343 726 311 114.9 1.5 Total liabilities 17,999 17,151 16,825 15,931 4.9 7.0
Net assets 8,132 8,007 7,913 7,864 1.6 2.8
Reconciliation of Net assets to Common Equity Tier 1 Capital Net assets 8,132 8,007 7,913 7,864 Insurance liabilities in excess of liability valuation 502 415 495 505 Reserves excluded from regulatory capital (12) (13) (11) (11) Additional Tier 1 capital (510) (510) (510) (510) Goodwill allocated to GI Business (4,410) (4,412) (4,465) (4,461) Other Intangibles (including software assets) (580) (634) (590) (586) Other Tier 1 deductions (7) (5) (5) (4)
Common Equity Tier 1 Capital 3,115 2,848 2,827 2,797
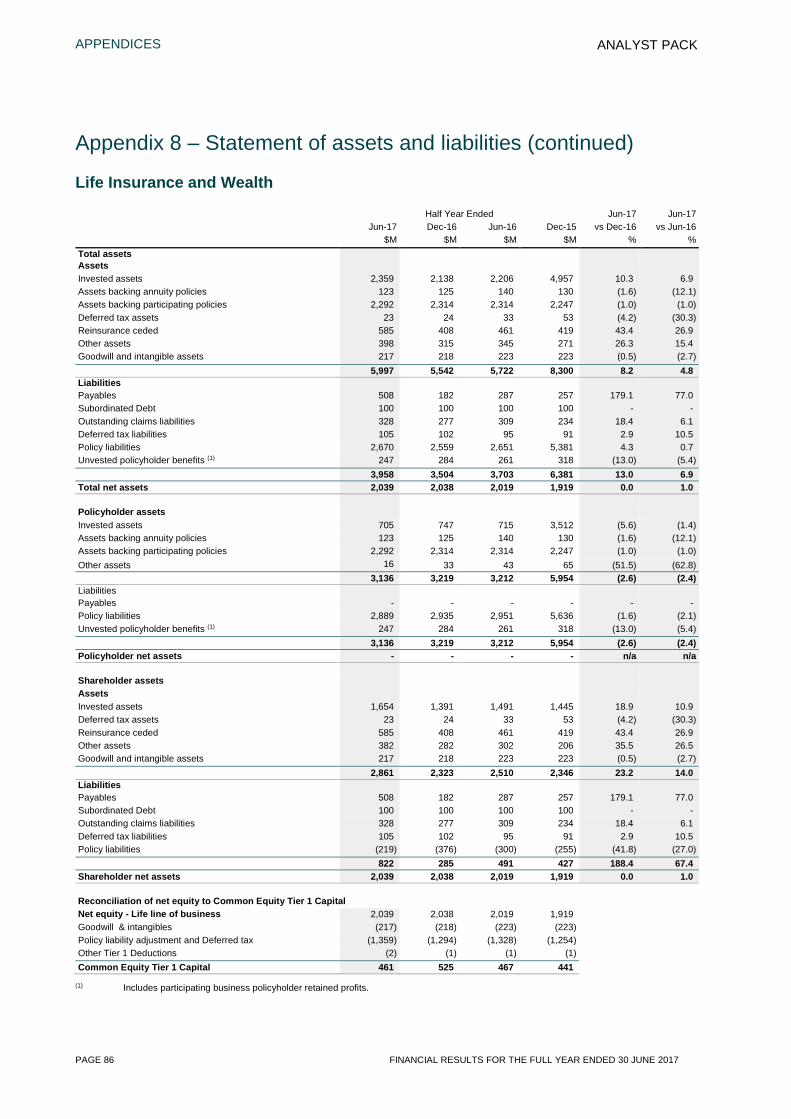
APPENDICES
PAGE 86 FINANCIAL RESULTS FOR THE FULL YEAR ENDED 30 JUNE 2017
ANALYST PACK
Appendix 8 – Statement of assets and liabilities (continued)
Life Insurance and Wealth
Half Year Ended Jun-17 Jun-17 Jun-17 Dec-16 Jun-16 Dec-15 vs Dec-16 vs Jun-16 $M $M $M $M % % Total assets Assets Invested assets 2,359 2,138 2,206 4,957 10.3 6.9 Assets backing annuity policies 123 125 140 130 (1.6) (12.1) Assets backing participating policies 2,292 2,314 2,314 2,247 (1.0) (1.0) Deferred tax assets 23 24 33 53 (4.2) (30.3) Reinsurance ceded 585 408 461 419 43.4 26.9 Other assets 398 315 345 271 26.3 15.4 Goodwill and intangible assets 217 218 223 223 (0.5) (2.7) 5,997 5,542 5,722 8,300 8.2 4.8 Liabilities Payables 508 182 287 257 179.1 77.0 Subordinated Debt 100 100 100 100 - - Outstanding claims liabilities 328 277 309 234 18.4 6.1 Deferred tax liabilities 105 102 95 91 2.9 10.5 Policy liabilities 2,670 2,559 2,651 5,381 4.3 0.7 Unvested policyholder benefits (1) 247 284 261 318 (13.0) (5.4) 3,958 3,504 3,703 6,381 13.0 6.9 Total net assets 2,039 2,038 2,019 1,919 0.0 1.0 Policyholder assets Invested assets 705 747 715 3,512 (5.6) (1.4) Assets backing annuity policies 123 125 140 130 (1.6) (12.1) Assets backing participating policies 2,292 2,314 2,314 2,247 (1.0) (1.0) Other assets 16 33 43 65 (51.5) (62.8) 3,136 3,219 3,212 5,954 (2.6) (2.4) Liabilities Payables - - - - - - Policy liabilities 2,889 2,935 2,951 5,636 (1.6) (2.1) Unvested policyholder benefits (1) 247 284 261 318 (13.0) (5.4) 3,136 3,219 3,212 5,954 (2.6) (2.4) Policyholder net assets - - - - n/a n/a Shareholder assets Assets Invested assets 1,654 1,391 1,491 1,445 18.9 10.9 Deferred tax assets 23 24 33 53 (4.2) (30.3) Reinsurance ceded 585 408 461 419 43.4 26.9 Other assets 382 282 302 206 35.5 26.5 Goodwill and intangible assets 217 218 223 223 (0.5) (2.7) 2,861 2,323 2,510 2,346 23.2 14.0 Liabilities Payables 508 182 287 257 179.1 77.0 Subordinated Debt 100 100 100 100 - - Outstanding claims liabilities 328 277 309 234 18.4 6.1 Deferred tax liabilities 105 102 95 91 2.9 10.5 Policy liabilities (219) (376) (300) (255) (41.8) (27.0) 822 285 491 427 188.4 67.4 Shareholder net assets 2,039 2,038 2,019 1,919 0.0 1.0 Reconciliation of net equity to Common Equity Tier 1 Capital Net equity - Life line of business 2,039 2,038 2,019 1,919 Goodwill & intangibles (217) (218) (223) (223) Policy liability adjustment and Deferred tax (1,359) (1,294) (1,328) (1,254) Other Tier 1 Deductions (2) (1) (1) (1) Common Equity Tier 1 Capital 461 525 467 441
(1) Includes participating business policyholder retained profits.
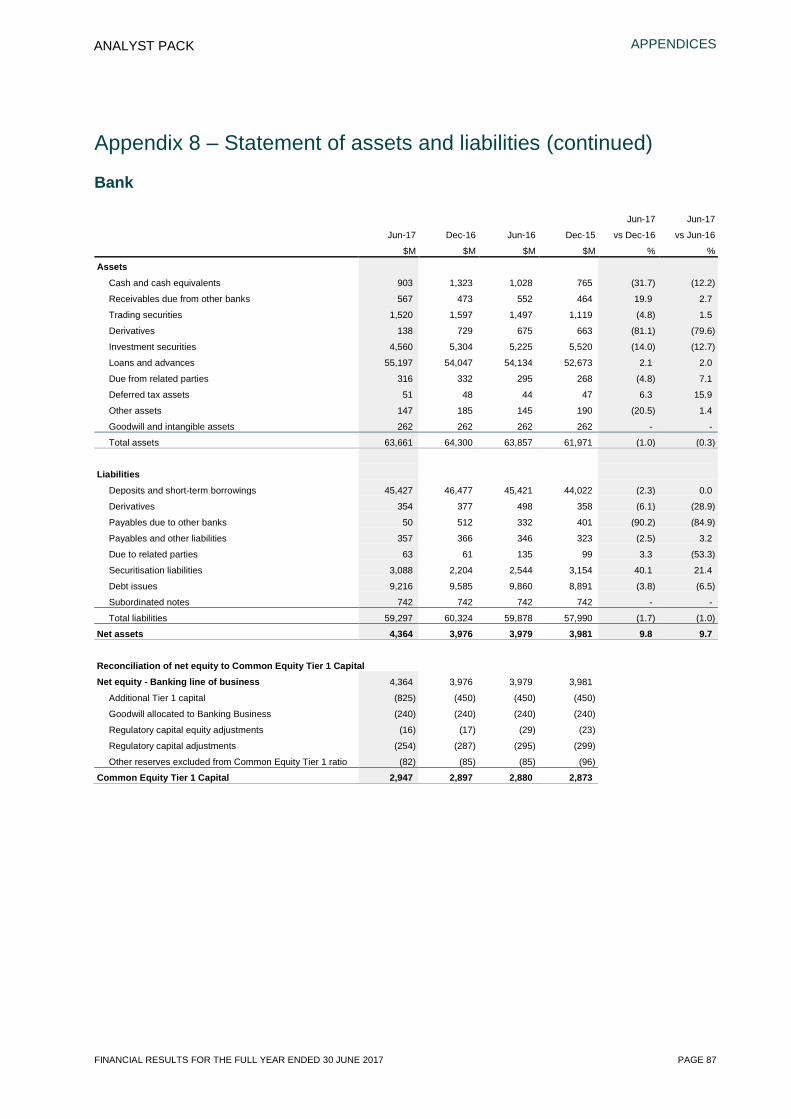
APPENDICES
FINANCIAL RESULTS FOR THE FULL YEAR ENDED 30 JUNE 2017 PAGE 87
ANALYST PACK
Appendix 8 – Statement of assets and liabilities (continued)
Bank
Jun-17 Jun-17
Jun-17 Dec-16 Jun-16 Dec-15 vs Dec-16 vs Jun-16
$M $M $M $M % %
Assets
Cash and cash equivalents 903 1,323 1,028 765 (31.7) (12.2)
Receivables due from other banks 567 473 552 464 19.9 2.7
Trading securities 1,520 1,597 1,497 1,119 (4.8) 1.5
Derivatives 138 729 675 663 (81.1) (79.6)
Investment securities 4,560 5,304 5,225 5,520 (14.0) (12.7)
Loans and advances 55,197 54,047 54,134 52,673 2.1 2.0
Due from related parties 316 332 295 268 (4.8) 7.1
Deferred tax assets 51 48 44 47 6.3 15.9
Other assets 147 185 145 190 (20.5) 1.4
Goodwill and intangible assets 262 262 262 262 - -
Total assets 63,661 64,300 63,857 61,971 (1.0) (0.3)
Liabilities
Deposits and short-term borrowings 45,427 46,477 45,421 44,022 (2.3) 0.0
Derivatives 354 377 498 358 (6.1) (28.9)
Payables due to other banks 50 512 332 401 (90.2) (84.9)
Payables and other liabilities 357 366 346 323 (2.5) 3.2
Due to related parties 63 61 135 99 3.3 (53.3)
Securitisation liabilities 3,088 2,204 2,544 3,154 40.1 21.4
Debt issues 9,216 9,585 9,860 8,891 (3.8) (6.5)
Subordinated notes 742 742 742 742 - -
Total liabilities 59,297 60,324 59,878 57,990 (1.7) (1.0)
Net assets 4,364 3,976 3,979 3,981 9.8 9.7
Reconciliation of net equity to Common Equity Tier 1 Capital
Net equity - Banking line of business 4,364 3,976 3,979 3,981
Additional Tier 1 capital (825) (450) (450) (450)
Goodwill allocated to Banking Business (240) (240) (240) (240)
Regulatory capital equity adjustments (16) (17) (29) (23)
Regulatory capital adjustments (254) (287) (295) (299)
Other reserves excluded from Common Equity Tier 1 ratio (82) (85) (85) (96)
Common Equity Tier 1 Capital 2,947 2,897 2,880 2,873
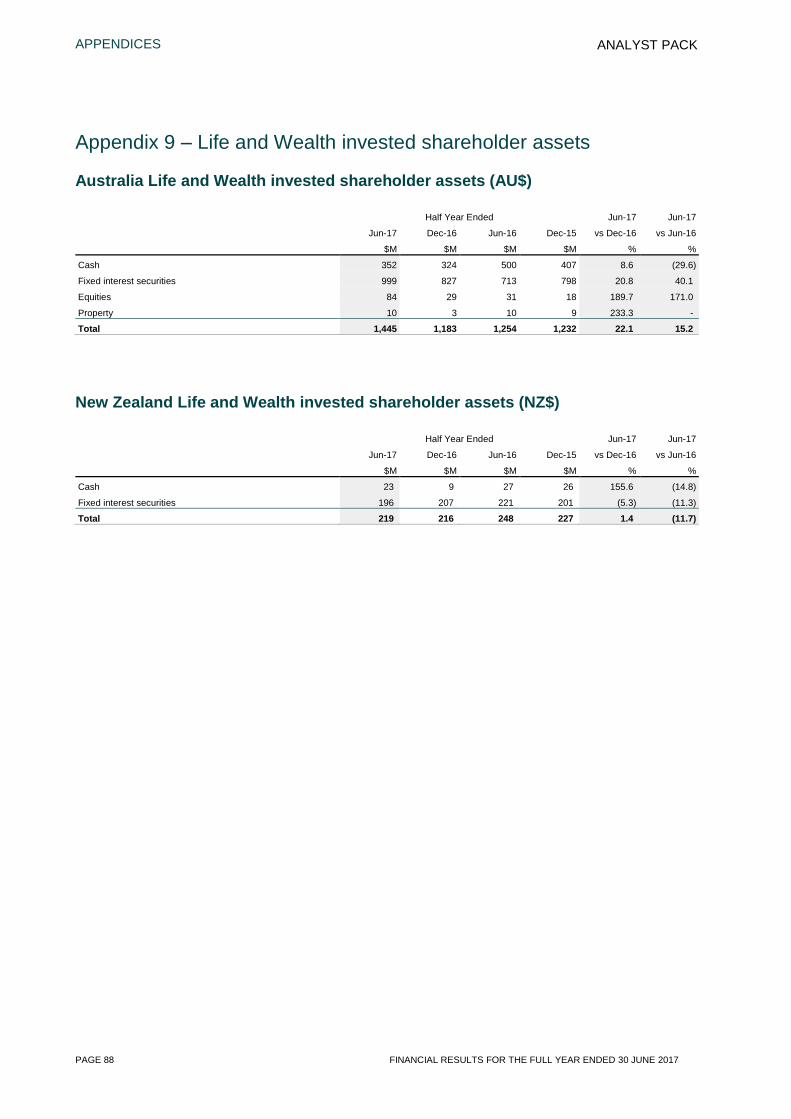
APPENDICES
PAGE 88 FINANCIAL RESULTS FOR THE FULL YEAR ENDED 30 JUNE 2017
ANALYST PACK
Appendix 9 – Life and Wealth invested shareholder assets
Australia Life and Wealth invested shareholder assets (AU$)
Half Year Ended Jun-17 Jun-17
Jun-17 Dec-16 Jun-16 Dec-15 vs Dec-16 vs Jun-16
$M $M $M $M % %
Cash 352 324 500 407 8.6 (29.6)
Fixed interest securities 999 827 713 798 20.8 40.1
Equities 84 29 31 18 189.7 171.0
Property 10 3 10 9 233.3 -
Total 1,445 1,183 1,254 1,232 22.1 15.2
New Zealand Life and Wealth invested shareholder assets (NZ$)
Half Year Ended Jun-17 Jun-17
Jun-17 Dec-16 Jun-16 Dec-15 vs Dec-16 vs Jun-16
$M $M $M $M % %
Cash 23 9 27 26 155.6 (14.8)
Fixed interest securities 196 207 221 201 (5.3) (11.3)
Total 219 216 248 227 1.4 (11.7)

APPENDICES
FINANCIAL RESULTS FOR THE FULL YEAR ENDED 30 JUNE 2017 PAGE 89
ANALYST PACK
Appendix 10 – Definitions Acquisition expense ratio Acquisition expenses expressed as a percentage of net earned premium
ADI Authorised Deposit-taking Institution
Annuities market adjustments The value of annuity obligations are determined by discounting future obligations into today’s dollars using
risk-free rates. The value of such obligations fluctuates as market referenced discount rates change. The value of assets backing annuity obligations also fluctuates with investment markets. The net impact of both of these market-driven valuation changes are removed from the Life Insurance underlying profit and recorded as annuity market adjustments
APRA Australian Prudential Regulation Authority
Basis points (bps) A ‘basis point’ is 1/100th of a percentage point
Cash earnings Net profit after tax adjusted for the amortisation of acquisition intangible assets, the profit or loss on divestments and their tax effect
Cash earnings per share Basic: cash earnings divided by the weighted average number of ordinary shares (net of treasury shares) outstanding during the period
Diluted: cash earnings adjusted for consequential changes in income or expenses associated with the dilutive potential ordinary shares divided by the weighted average number of diluted shares (net of treasury shares) outstanding during the period
Cash return on average shareholders' equity Cash earnings divided by average equity attributable to owners of the Company. Averages are based on monthly balances over the period. The ratio is annualised for half years
Combined operating ratio The percentage of net earned premium that is used to meet the costs of all claims incurred plus pay the costs of acquiring (including commission), writing and servicing the General Insurance business
Common Equity Tier 1 (CET1) Common Equity Tier 1 Capital comprises accounting equity plus adjustments for intangible assets and regulatory reserves
Common Equity Tier 1 Ratio Common Equity Tier 1 divided by the Prescribed Capital Amount for Life and General Insurance, or total risk-weighted assets for the Bank
Cost to income ratio Operating expenses of the Banking business divided by total income from Banking activities
Credit risk-weighted assets Total of the carrying value of each asset class multiplied by their assigned risk weighting, as defined by APRA
Deferred acquisition costs The portion of acquisition costs not yet expensed on the basis that it can be reliably measured and it is probable that it will give rise to premium revenue that will be brought to account in subsequent financial periods
Deposit to loan ratio Total retail deposits divided by total loans and advances, excluding other receivables
Diluted shares Diluted shares is based on the weighted average number of ordinary shares outstanding during the period adjusted for potential ordinary shares that are dilutive in accordance with AASB 133 Earnings per Share
Effective tax rate Income tax expense divided by profit before tax
Embedded Value Embedded Value is equivalent to the sum of the adjusted net worth and the net present value of all future cashflows distributable to the shareholder that are expected to arise from in-force business, together with the value of franking credits
Equity reserve for credit losses The equity reserve for credit losses represents the difference between the collective provision for impairment and the estimate of credit losses across the credit cycle based on guidance provided by APRA
Fire service levies (FSL) The expense levied on premiums for insurance policies with a fire risk component, which is recoverable from insurance companies by the applicable State Government. Fire service levies were established to cover corresponding fire brigade charges
Funds under management and administration Funds where the Wealth Australia business receives a fee for the administration and management of an asset portfolio

APPENDICES
PAGE 90 FINANCIAL RESULTS FOR THE FULL YEAR ENDED 30 JUNE 2017
ANALYST PACK
Appendix 10 – Definitions (continued) General Insurance – Commercial Commercial products consist of commercial motor insurance, commercial property insurance, marine
insurance, industrial special risk insurance, and public liability and professional indemnity insurance
General Insurance – Consumer Consumer Insurance products consist of home and contents insurance, motor insurance, boat insurance, and travel insurance
Gross non-performing loans Gross impaired assets plus past due loans
Impairment losses to gross loans and advances
Impairment losses on loans and advances divided by gross loans and advances. The ratio is annualised for half years
Insurance Trading Result Underwriting result plus investment income on assets backing technical reserves
Insurance Trading Ratio (ITR) The insurance trading result expressed as a percentage of net earned premium
Life insurance policyholders' interests Amounts due to an entity or person who owns a life insurance policy. This need not be the insured. This is distinct from shareholders’ interests
Life risk in-force annual premiums Total annualised statistical premium for all business in-force at the date (including new business written during the reporting period)
Life risk new business annual premiums Total annualised statistical premium for policies issued during the reporting period
Life underlying profit after tax Net profit after tax less market adjustments. Market adjustments represents the impact of movements in discount rates on the value of policy liabilities, investment income experience on invested shareholder assets and annuities mismatches
Loss ratio Net claims incurred expressed as a percentage of net earned premium. Net claims incurred consist of claims paid during the period increased (or decreased) by the increase (decrease) in outstanding claims liabilities
Net interest spread The difference between the average interest rate on average interest earning assets and the average interest rate on average interest bearing liabilities
Net profit after tax Net profit after tax attributable to owners of the Company derived in accordance with Australian Accounting Standards
Net tangible asset backing per share Total equity less intangible assets divided by ordinary shares at the end of the period adjusted for treasury shares
Other underwriting expenses ratio Other underwriting expenses expressed as a percentage of net earned premium
Past due loans Loans outstanding for more than 90 days
Payout ratio – cash earnings Ordinary shares (net of treasury shares) at the end of the period multiplied by the ordinary dividend per share for the period divided by cash earnings
Payout ratio – net profit after tax Ordinary shares (net of treasury shares) at the end of the period multiplied by the ordinary dividend per share for the period divided by profit after tax
Profit after tax from functions The net profit after tax for the Insurance (Australia), Banking & Wealth and New Zealand functions
Return on average shareholders' equity Net profit after tax divided by average equity attributable to owners of the Company. Averages are based on monthly balances over the period. The ratio is annualised for half years
Return on average total assets Net profit after tax divided by average total assets. Averages are based on beginning and end of period balances. The ratio is annualised for half years
Return on Common Equity Tier 1 Net profit after tax adjusted for dividends paid on capital notes divided by average Common Equity Tier 1 Capital. Average Common Equity Tier 1 Capital is based on the monthly balance of Common Equity Tier 1 Capital over the period. The ratio is annualised for half years
Total capital ratio Total capital divided by the Prescribed Capital Amount for Life and General Insurance, or total risk-weighted assets for the Bank, as defined by APRA
Total operating expense ratio Total operating expenses (acquisition and other underwriting expenses) expressed as a percentage of net earned premium
Total risk-weighted assets Bank credit risk-weighted assets, off-balance sheet positions and market risk capital charge and operational risk charge, as defined by APRA
Treasury shares Ordinary shares of Suncorp Group Limited that are acquired by subsidiaries
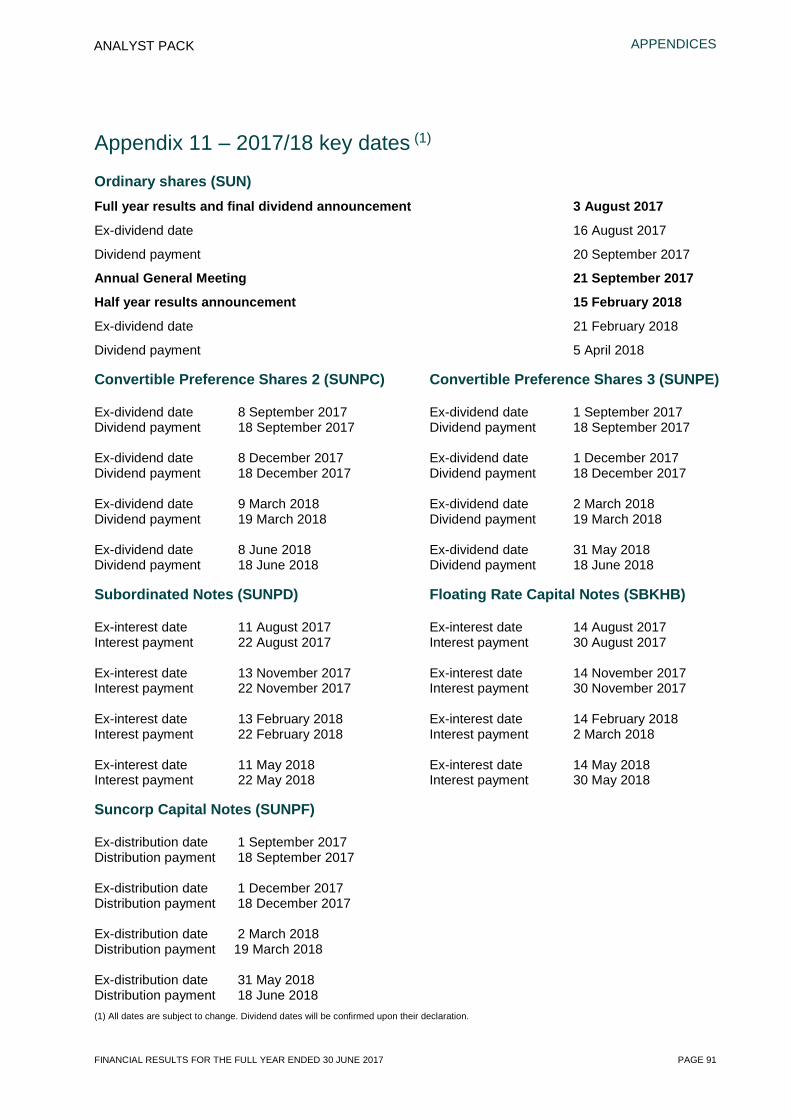
APPENDICES
FINANCIAL RESULTS FOR THE FULL YEAR ENDED 30 JUNE 2017 PAGE 91
ANALYST PACK
Appendix 11 – 2017/18 key dates (1)
Ordinary shares (SUN) Full year results and final dividend announcement 3 August 2017
Ex-dividend date 16 August 2017
Dividend payment 20 September 2017
Annual General Meeting 21 September 2017
Half year results announcement 15 February 2018
Ex-dividend date 21 February 2018
Dividend payment 5 April 2018
Convertible Preference Shares 2 (SUNPC) Convertible Preference Shares 3 (SUNPE)
Ex-dividend date 8 September 2017 Ex-dividend date 1 September 2017 Dividend payment 18 September 2017 Dividend payment 18 September 2017 Ex-dividend date 8 December 2017 Ex-dividend date 1 December 2017 Dividend payment 18 December 2017 Dividend payment 18 December 2017 Ex-dividend date 9 March 2018 Ex-dividend date 2 March 2018 Dividend payment 19 March 2018 Dividend payment 19 March 2018 Ex-dividend date 8 June 2018 Ex-dividend date 31 May 2018 Dividend payment 18 June 2018 Dividend payment 18 June 2018
Subordinated Notes (SUNPD) Floating Rate Capital Notes (SBKHB)
Ex-interest date 11 August 2017 Ex-interest date 14 August 2017 Interest payment 22 August 2017 Interest payment 30 August 2017 Ex-interest date 13 November 2017 Ex-interest date 14 November 2017 Interest payment 22 November 2017 Interest payment 30 November 2017 Ex-interest date 13 February 2018 Ex-interest date 14 February 2018 Interest payment 22 February 2018 Interest payment 2 March 2018 Ex-interest date 11 May 2018 Ex-interest date 14 May 2018 Interest payment 22 May 2018 Interest payment 30 May 2018
Suncorp Capital Notes (SUNPF)
Ex-distribution date 1 September 2017 Distribution payment 18 September 2017 Ex-distribution date 1 December 2017 Distribution payment 18 December 2017 Ex-distribution date 2 March 2018 Distribution payment 19 March 2018 Ex-distribution date 31 May 2018 Distribution payment 18 June 2018 (1) All dates are subject to change. Dividend dates will be confirmed upon their declaration.

To see more, go onlinesuncorpgroup.com.au
—Registered officeLevel 28, 266 George Street Brisbane, Qld Australia 4000 +61 7 3362 1222
Investor relations contactsAndrew Dempster Ph: 02 8121 9206Susan Troy Ph: 07 3135 3729Sophie Bastin-Byrne Ph: 07 3135 4700Gabrielle Gulliver Ph: 02 8121 1225Leo Ling Ph: 02 8121 0305
Connect
suncorpgroup.com.au @SuncorpGroup


