103


Created in 1965, the Delaware Valley Regional Planning Commission (DVRPC) is an interstate, intercounty and intercity agency that provides continuing, comprehensive and coordinated planning to shape a vision for the future growth of the Delaware Valley region. The region includes Bucks, Chester, Delaware, and Montgomery counties, as well as the City of Philadelphia, in Pennsylvania; and Burlington, Camden, Gloucester and Mercer counties in New Jersey. DVRPC provides technical assistance and services; conducts high priority studies that respond to the requests and demands of member state and local governments; fosters cooperation among various constituents to forge a consensus on diverse regional issues; determines and meets the needs of the private sector; and practices public outreach efforts to promote two-way communication and public awareness of regional issues and the Commission.
Our logo is adapted from the official DVRPC seal, and is designed as a stylized image of the Delaware Valley. The outer ring symbolizes the region as a whole, while the diagonal bar signifies the Delaware River. The two adjoining crescents represent the Commonwealth of Pennsylvania and the State of New Jersey.
DVRPC is funded by a variety of funding sources including federal grants from the U.S. Department of Transportation’s Federal Highway Administration (FHWA) and Federal Transit Administration (FTA), the Pennsylvania and New Jersey departments of transportation, as well as by DVRPC’s state and local member governments. The authors, however, are solely responsible for its findings and conclusions, which may not represent the official views or policies of the funding agencies.

TABLE OF CONTENTS
Page I. EXECUTIVE SUMMARY 1 II. PURPOSE 3 III. STUDY AREA DESCRIPTION 5 1. Regional Setting 5 2. Population Forecast 6 3. Jobs Forecast 7 4. Population Density 8 IV. HIGHWAY NETWORK 9 1. Major Parallel Routes 9 2. Major Intersecting Routes 9 3. 2000 - 2002 Traffic Accidents 10 V. LAND USE AND ZONING 19 1. Current Land Use Patterns 19 2. Future Land Use Patterns 20 VI. HISTORIC PRESERVATION AREAS 29 VII. CONSERVATION AREAS 33 Vlll. INTERSECTION LEVEL OF SERVICE ANALYSIS 39 1. Hartford Road at Elbo Lane 40 2. Hartford Road at Union Mill Road 43 3. Hartford Road at Borton Landing Road 45
IX. ARTERIAL SECTION LEVEL OF SERVICE ANALYSIS 49
X. SIGNAL WARRANT ANALYSIS 53 1. Hartford Road at Salem Road 53 XI. PEDESTRIAN AND BICYCLE FACILITIES 59 XII. IMPROVEMENT PLAN 63 1. Intersection Improvement 67 2. Corridor-wide Improvement 68

TABLES
1. Burlington County MCD Population Forecast 6 2. Burlington County MCD Job Forecast 7 3. MCD Population Density 2000 – 2025 8 4. CR 686 Hartford Road (M.P. 1.6 – 7.88) Accident Summary 1999 – 10/30/2002 17 5. Centerton Square Development 20 6. Warrant 1: Eight-Hour Vehicular Volume Condition A 54 7. Warrant 1: Eight-Hour Vehicular Volume Condition B 55 8. Selected Future Bicycle and Pedestrian Facilities, Mount Laurel Township 60 9. Selected Future Bicycle and Pedestrian Facilities, Moorestown Township 61
FIGURES
1. Burlington County MCD Population Percent Change 6 2. Burlington County MCD Jobs Percentage Change 7 3. Hartford Road & Elbo Lane Level of Service 42 4. Hartford Road & Union Mill Road Level of Service 44 5. Hartford Road & Borton Landing Road Level of Service 47 6. Westbound Hartford Road Arterial Level of Service 52 7. Eastbound Hartford Road Arterial Level of Service 52 8. Warrant 2: Four-Hour Vehicular Volume 56 9. Warrant 3: Peak Hour Vehicular Volume 57
MAPS 1. Study Area 5 2. Highway Network 13 3. Accident Locations 15 4. 2000 Land Use 21 5. 2025 Land Use 23 6. Planned Developments 25 7. Historic Preservation Areas 31 8. Wetlands 37
APPENDIX 1. Appendix I: Intersection Turning Movement Counts I-1 2. Appendix II: Current Intersection Level of Service II-1 3. Appendix III: Modified Intersection Level of Service III-1 4. Appendix IV: Signal Warrant Analysis Traffic Counts IV-1

Hartford Road Traffic Assessment Study
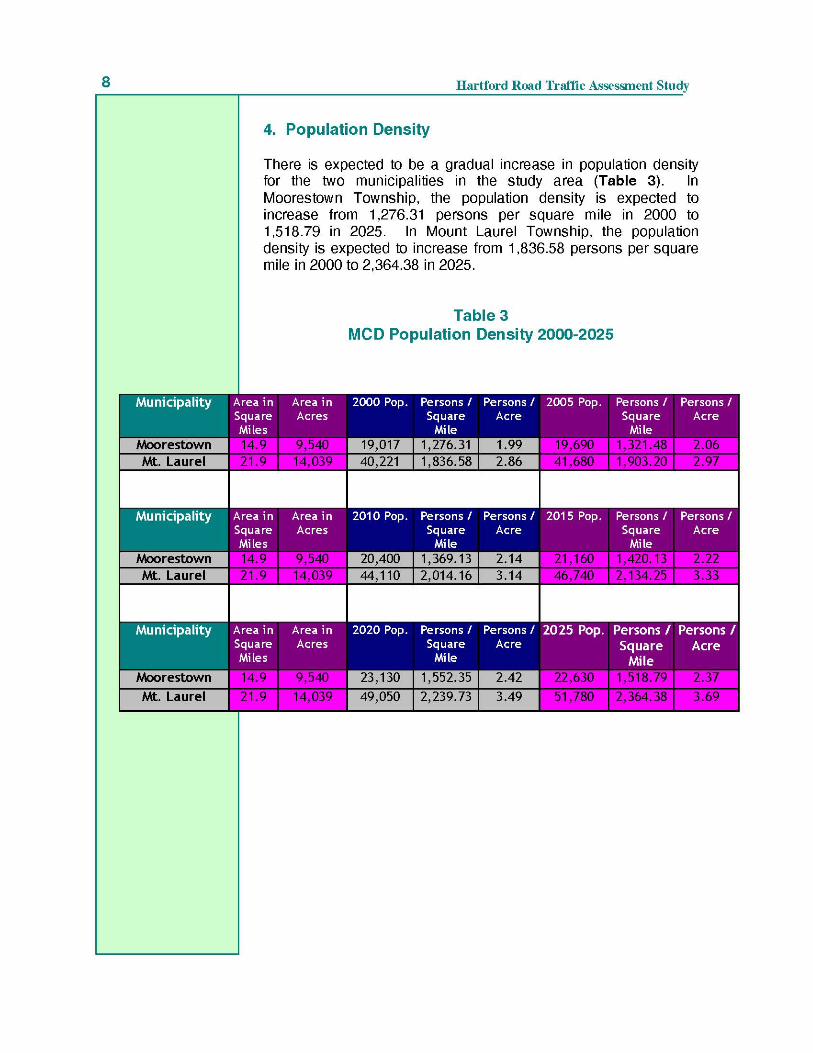
1 Hartford Road (CR 686), extending through Moorestown and Mount Laurel Townships, is an important east-west connector in western Burlington County. As the surrounding area develops, peak traffic volumes on Hartford Road have increased. This has led to congestion at several major intersections. This study has identified specific problem locations within the corridor. Three intersections, Hartford Road at Elbo Lane, Union Mill Road and Borton Landing Road, were analyzed to determine operational conditions within the traffic stream by using Level of Service (LOS) analysis. At Hartford Road and Elbo Lane, the worst LOS experienced in both the AM and PM peaks was LOS C. At the Hartford Road and Union Mill Road intersection, the AM and PM peaks also performed at LOS C. The intersection of Hartford Road and Borton Landing Road performed at LOS B in the AM peak and C for the PM peak. Mid-block locations were also studied and LOS analyzed. A signal warrant analysis was conducted at the intersection of Hartford Road and Salem Road to determine whether peak volumes warrant the construction of a traffic signal. Based on three warrant tests taken from the Manual of Uniform Traffic Control Devices (2000), there is not a need for a signal at this location at this time. An accident analysis was done within the corridor covering the three-year and 10-month period of 1999 to October 2002. Over this period, there were 135 accidents at 77 unique milepost locations. In terms of accident severity, 1 (0.7%) fatal accident occurred, 57 (42.2%) injury accidents occurred resulting in 79 injured persons, and 77 (57%) accidents occurred with property damage only. Accident clusters were identified at two locations: MP 5.37, the intersection of Hartford Road and Union Mill Road, and MP 7.62, the intersection of Hartford Road and Elbo Lane. Twelve accidents took place at each of these locations. A plan was developed which outlines priorities, cost range, benefits, roles, and responsibilities for traffic improvement in the corridor.
I. EXECUTIVE SUMMARY


Hartford Road Traffic Assessment Study
3
Burlington County requested that DVRPC conduct a corridor wide planning effort to address transportation and circulation issues along Hartford Road in Moorestown and Mount Laurel townships. This study has attempted to address these issues by conducting a traffic assessment of the Hartford Road corridor. The area included in this study includes Hartford Road from Garwood Road in Moorestown to Elbo Lane in Mount Laurel. Burlington County is well-served by a number of major transportation routes including Rt. 130, Rt. 206, I-295, the New Jersey Turnpike, Rt. 38, Rt. 73, and Rt. 70. Several County routes carry traffic parallel to these state routes including CR 607 and CR 537. Historically, development in Burlington County has followed these routes. More recently however, extensive development has occurred east of these roads into previously more rural areas of the county, causing increased traffic on cross-county routes. With the exception of Rt. 73 and CR 541 that have traditionally carried large volumes of cross-county traffic, there are few other roads available for this use. Hartford Road is one of these roads. Built as a two-lane farm road, Hartford Road, which traverses the county from Medford to Delran, has become increasingly congested as Delran, Moorestown, Mount Laurel, Medford, Shamong, and Tabernacle have developed. Traffic volumes during the AM and PM peak periods combined with existing roadway geometrics create congested conditions. Despite well-timed, modern signal equipment, long queues develop at intersections, exacerbated by a lack of right and left turn lanes. There are seven signalized intersections along this segment. Several have been improved or are currently being improved. This study addresses the adequacy of these intersections and arterial segments to accommodate current and future traffic volumes.
II. PURPOSE


Hartford Road Traffic Assessment Study
9
The study area is served by several county routes and local routes that run parallel to or intersect with Hartford Road. Together they form a network that provides land access and enables traffic circulation within the corridor (See Map 2). 1. Major Parallel Routes • Creek Road (CR 636), located to the north of Hartford Road, is
a parallel route that connects US 130 in the west to I-295 and points east.
• Westfield Road (CR 614) parallels Hartford Road to the south between Marne Highway (CR 537) and Bridgeboro Road (CR 613).
2. Major Intersecting Routes • Garwood Road intersects with Hartford Road at milepost 1.60
and forms the westernmost limit of the study area. Together with Abbey Road, they form a connector between Westfield Road and Creek Road.
• Borton Landing Road intersects with Hartford Road at milepost 3.05. It provides a direct connection between Creek Road and CR 537. It also provides a link to Main Street, the town center of Moorestown.
• Centerton Road intersects with Hartford Road at milepost 3.65. It connects Mt. Holly Road (CR 537) with Creek Road just west of the I-295 interchange.
• Marne Highway intersects with Hartford Road at milepost 4.21. It provides a direct connection between Mount Holly and Main Street, Moorestown.
• NJ 38 intersects with Hartford Road at milepost 4.80. It provides regional access to the study area with connections from US 206 to Philadelphia.
• Union Mill Road intersects with Hartford Road at milepost 5.37. It provides a primarily local function linking CR 612, CR 603, and CR 636 with Hartford Road.
• Hainesport - Mt Laurel Road (CR 674) intersects with Hartford Road at milepost 6.40. It is a major north-south route linking several east-west routes between Marne Highway and CR 607.
IV. HIGHWAY NETWORK

Hartford Road Traffic Assessment Study
10
• Elbo Lane intersects with Hartford Road at milepost 7.62. It links the East Gate commercial center via CR 607 with Hartford Road. It also provides access to the South Jersey Airport.
3. 2000 - 2002 Traffic Accidents Accident Data The data for this analysis was obtained from accident records from Mount Laurel and Moorestown Townships for years 2000 through October of 2002. These records were cross-checked against the New Jersey Department of Transportation Bureau of Safety Program’s Accident Records Database. The data set used for this report focuses on Hartford Road (CR 686), mileposts 1.6 - 7.88. DVRPC expanded the data to include 1999, also obtained from NJDOT. Hartford Road Accident Summary Data was compiled for Hartford Road between milepost 1.6 - 7.88, approximately 6.2 miles within Moorestown and Mount Laurel Townships. During the three-year and 10-month period of 1999 to October 2002, there were 135 accidents at 77 unique milepost locations. Concerning accident severity, 1 (0.7%) fatal accident occurred, 57 (42.2%) injury accidents occurred resulting in 79 injured persons, and 77 (57%) property damage only accidents. According to the New Jersey Department of Transportation (NJDOT), rear end and sideswipe collisions involve traffic moving in the same direction. Angle crashes involve angular traffic (north and west, etc.) and left turn and head-on events involve opposing traffic. Rear end collisions, the highest percentage in this corridor account for 40% (54) of the total. Angle crashes, 23% (31) of the total, may indicate restricted sight distance. Left turn accidents were 9.6% of the total with 13 incidents. Sideswipe accidents accounted for 5.9% (8). Accidents in the “other” category, which relates to incidents involving animals, fixed objects, overturned vehicles, and pedestrians, among others; accounted for 16.3% (22). NJDOT considers an accident to be “at intersection” when it occurs 30 feet or less from the center of the intersection. Crashes outside of this area are considered “between intersections”. For Hartford Road within the study area, the percentage of accident locations is nearly split between “at intersection” accounting for 48.1% (65), and “between intersections” at 51.9% (70). Concerning lighting and

Hartford Road Traffic Assessment Study
11
surface condition of the roadway, most accidents occurred during daylight hours (74.1%) under dry conditions (69.6%). This suggests that other contributing factors may be more significant, such as road geometry, sight distance, or driver behavior, etc. Map 3 depicts the location and year of all accidents on all routes within the study area, with the exception of local streets. Table 4 summarizes the accidents by type, which occurred in the corridor.


Hartford Road Traffic Assessment Study
18
Accident Cluster Locations For the purpose of this study an accident cluster location is any single mile post location where 10 or more accidents occurred during the 1999 to October 2002 analysis period. Two locations met this criteria: MP 5.37, the intersection of Hartford Road and Union Mill Road, and MP 7.62, the intersection of Hartford Road and Elbo Lane. Twelve accidents took place at each of these locations. Milepost 5.37: CR 686 & Union Mill Road Of the 12 accidents at this location during the analysis period there were 6 property damage only, 5 injury, and 1 fatal accident. There were 7 (58.3%) angle crashes and 3 (25%) same direction rear-end crashes. Milepost 7.61 - 7.63: CR 686 & CR 612 Elbo Lane Of the 12 crashes at this location there were no fatalities, 4 injury accidents, and 8 property damage only. There were 5 (41.7%) angle crashes and 3 (25%) same direction rear-end crashes.

Hartford Road Traffic Assessment Study
19
The character and land use patterns of the municipalities in the study area, Mount Laurel and Moorestown Townships, are a reflection of the area’s unique character as well as local land use policies over time. 1. Current Land Use Patterns
Map 4 illustrates the land use within the study area for the year 2000. Based on the Mount Laurel master plan of 2000, housing development on the western part of the municipality is largely a continuation of similar type development in neighboring Cherry Hill Township. Here, the largest concentration of housing developments are located next to Church Street where approximately 11 separate housing developments have been built. On the eastern side of the township, most of the housing development is contained within the Larchmont Planned Unit Development (P.U.D). Commercial activities, while initially concentrated along NJ 38 and NJ 73, have in later years been dispersed throughout the township. Industrial uses are found primarily along NJ 38 and NJ 73. The interchange of I-295 and NJ Turnpike at NJ 73 creates an ideal setting for industrial park activities. Another interchange of I-295 at NJ 38 has created a secondary area attractive to industrial and office uses. Some of the parks, recreation, and school facilities at the western end of the township are located within or adjacent to residential neighborhoods. At the opposite end of the township, new facilities have been built as part of the master plan of the Larchmont P.U.D. including the Hartford Lower Middle School located at Hartford Road and Hainesport-Mount Laurel Road. A significant amount of land at Hillside Elementary School and the Middle School is available for recreation activities. Finally, the Laurel Acres Park between Church Street and Union Mill Road on the western side of the township has approximately 100 acres. The township now has 573 acres of township-owned open space and recreation facilities, including school recreation areas. These areas are located in the center of the township and are largely comprised of wetlands. The 2002 Master Plan for Moorestown Township indicates that 41.7% of the total acreage within the township is devoted to single-family detached residential land use. All types of residential land uses account for 49.3% of all land uses. Other land uses account for far less acreage with Undeveloped Land accounting for 21.5%, Institutional and Open Space 15.1%, Industrial 8.7%, and Commercial 5.4%. Residential development is generally concentrated within the central part of the township. Open space is
V. LAND USE AND ZONING

Hartford Road Traffic Assessment Study
20
distributed throughout with concentrations along water bodies. Industrial uses are concentrated in the western part of the township while commercial land uses are primarily in the south and at the town center.
2. Future Land Use Patterns
Based on the 2025 Land Use Plan (Map 5), much of the study area is expected to remain residential. The future growth area is concentrated in the Moorestown section of the corridor where major retail and commercial projects have been planned.
Planned Developments
Several major developments have been planned for the study area, the majority of which are concentrated in the area of Hartford Road in the vicinity of I-295 at the border of Moorestown and Mount Laurel. One of the largest developments proposed is the Centerton Square development (Map 6). This will be a retail/office development to be located in both Mount Laurel and Moorestown. The development will be bounded by I-295 to the east, NJ 38 to the south, Marter Avenue to the west, and Marne Highway to the north. The development will be built on a minimum lot of 85.9 acres, 80.48 in Mount Laurel and 5.42 in Moorestown. It is expected to have a total of 761,763 square feet of building coverage. The development will consist of 5 anchor buildings, 7 retail buildings, and 5 pad buildings (See Table 5). Based on the traffic impact study conducted by Orth-Rodgers and Associates Inc. in 2002, a total of 1,087 AM peak hour trips will be generated by this development. This comprises 739 in and 348 out. A total of 2,372 PM peak hour trips are also expected (1,011 in and 1,361 out). Additional trips will be generated when the development is completed. The design year for this project is 2007.
Table 5 Centerton Square Development
Building Anchor
Size (Sq. Ft.)
Building Retail
Size (Sq. Ft.)
Building Pad Size (Sq. Ft.)
A 110,000 F 27,500 M 3,900B 142,500 G 26,700 N 12,000C 70,000 H 23,400 O 2,900D 90,000 I 20,000 P 11,200E 148,663 J 20,000 Q 10,000
K 23,000 L 20,000
Total 561,163 160,600 40,000
Total All Buildings 761,763 Sq. Ft.


Hartford Road Traffic Assessment Study
27
Other planned development projects that are expected in the area include:
1) Laurel Creek - The development will consist of an ultimate build-out of 1,000,000 SF of office space. Of this amount, 300,000 SF is expected to be built and occupied by the 2007 design year.
2) Griffin Office - This site is anticipated to be approximately 30,000 SF of office space.
3) Burlington County College - Approximately 153,000 SF of the proposed 350,000 SF college is anticipated to be in place by the 2007 build year.
4) Laurel Corporate Center I - This site will consist of approximately 113,000 SF of office space.
5) Automotive Resources - This site will consist of an ultimate build-out of 275,000 SF of office and 350,000 SF of retail space. It is anticipated that 200,000 SF of the office space and none of the retail component will be on line by the 2007 design year.
6) Bishop’s Gate II - This development will consist of approximately 793,000 SF of office space, all of which is anticipated to be on line by 2003.
7) Hovtek Park - This site will consist of an additional 120,000 SF of warehouse space and a 72,500 SF skating rink. The entire site is assumed to be operational by 2007.
8) Stevens Industrial - This site will consist of approximately 139,252 SF of warehouse space, 46,425 SF of office space, a 13,798 daycare center, and a 17,500 SF post office. The entire site is expected to be in place by the 2007 build year.
9) Samost - Site consists of approximately 180,000 SF of office space, 10,000 SF of which is anticipated to be on line by the 2007 build year.
10) Lockheed Martin Expansion - The existing facility is to occupy a 20,000 SF research office building.
11) Whitesell Creek Road - This site will consist of approximately 400,000 SF of office space.
12) William Powers – This site will consist of approximately 30,000 SF of office space.
13) Moorestown Office Center – This site will consist of approximately 25,000 SF of office space.
14) Westfield Estates – Consist of 17 single family homes. 15) Wexford II – Consist of 26 single family homes 16) Laurel Creek Mews – This development will consist of 122
Town-homes. 17) Moorestown Farms - This site will consist of 12 single family
homes

Hartford Road Traffic Assessment Study
28
18) Moorestown Green – This will consist of 20 single family homes Partly in anticipation of the Centerton Square development, the following traffic improvements have been planned for the area: a. The completion of Centerton Road to the Westfield Road intersection, b. The realignment of Marne Highway with Centerton Road, c. The construction of Young Avenue from Centerton Road to Marne Highway and, d. The installation of traffic signals at the following locations: • Marter Avenue and Centerton Road • Centerton Road and Young Avenue/Phase I retail • Centerton Road and Phase II retail access/YMCA • Centerton Road and realigned Marne Highway • Marne Highway and Young Avenue • Marter Avenue and Midlantic Drive

Hartford Road Traffic Assessment Study
29
Historic places inform a community as to where it came from and what previous generations achieved. Historic preservation protects these reminders of the past and also builds the present and the future, by serving as reminders of a community's goals and dreams. As required by law, transportation improvements must give paramount consideration to the protection of historic properties in planning projects. This improvement is intended to protect designated natural and cultural heritage sites. Within the Moorestown section of the study area, there is one property (Ivins-Conover House and Barn) that is on the National and State Registers of Historical Places. The Historic Preservation Element of Moorestown Master Plan, however, has identified several additional properties that are local historic landmarks. These exhibit characteristics that are important to the understanding of history and changing architectural styles in Moorestown. These are all located within a half-mile cordon of Hartford Road (Map 7):
1. W.B Lippincott House - located on Hartford Road near Borton Landing
2. Ivins-Conover House and Barn - on the National and State Register of Historical Places, located on 801 Cox Road
3. Bishop House - located at 781 Garwood Road 4. L.L.Walton House - located on Hartford Road at the
Delran Township line 5. Samuel Huston House - located at 551 Hartford Road 6. William Cox House - located at 800 Cox Road 7. Lippincott/Pew House - located on Commonwealth
Drive 8. 101 Hartford Road 9. Pleasant Acres Dairy Farm - located at 500, 501, and
590 Centerton Road Within Mount Laurel Township, the master plan lists the following historical sites that are within one mile of Hartford Road: 1. Cistercian Monastery 2. Darnell Homestead 3. Hallett House 4. W. M. Haines Jr. House 5. Macfarland House
VI. HISTORIC PRESERVATION AREAS


Hartford Road Traffic Assessment Study
33
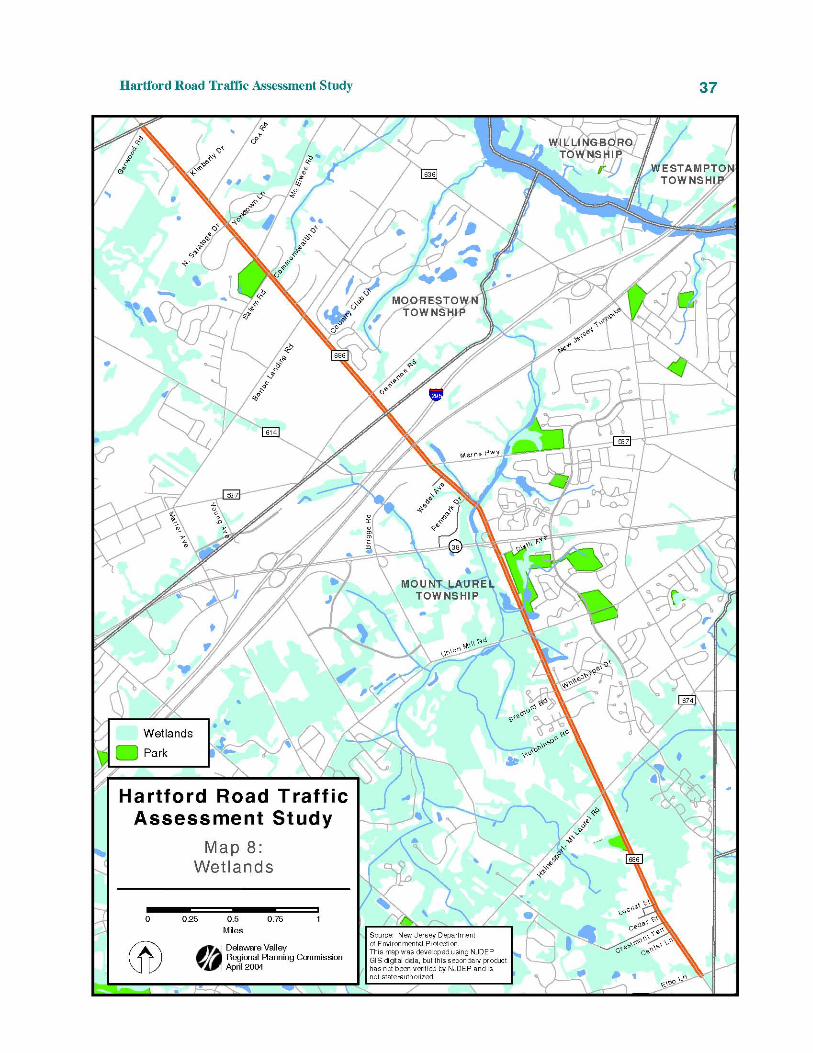
Land use strategy within the corridor reflects the identification and location of environmental constraints posed by the presence of environmentally sensitive areas, primarily wetlands (Map 8). Development has to be sensitive to the potential impact on some of the area’s most valuable resources and to ensure the preservation of these resources. The environment is therefore influential in determining the location of buildings, utility systems, and road patterns. If development is permitted without consideration of natural features, the environment can be adversely affected. Both the Mount Laurel and Moorestown Master Plans include conservation, open space, and recreation plan elements that establish constraints on development. Mount Laurel The Mount Laurel May 2000 Master Plan states that “ecologically sensitive lands will continue to be recognized and preserved in future land development in the township.” The Conservation and Open Space Plan map denotes “areas where development should be prohibited to insure the retention of ... critical environmental areas.” One area of protected land is the streambed of Parkers Creek, which parallels and then crosses Hartford Road. The largest swath of protected land near Parkers Creek lies between Union Mill Road and US 38. The Natural Features element of the Master Plan denotes important physical features of the land, including drainage, soil conditions, and water table level. According to the Natural Features element, “[p]hysical features ... are particularly significant in determining the location and intensity of future development.” The presence of ground and surface water, as well as the related flora and fauna, comprises a major part of the conservation area in the corridor. Water table depth varies depending on precipitation and surface drainage conditions. Based on the Master Plan for Mount Laurel Township, in the majority of land adjacent to Hartford Road within the township, the depth to the seasonal high water table is generally within 1-5 feet. However, water table depths of 0-1 foot are clustered in the area between US 38 and Union Mill Road. The Master Plan further notes that the current development pattern of the township reflects the physical constraints imposed on development by high water tables.
VII. CONSERVATION AREAS

Hartford Road Traffic Assessment Study
34
The development pattern of Mount Laurel reflects the physical constraints imposed by high water tables. The level of the water table determines whether water will either permeate through the soil or move over the surface of the land to drainage and stream courses; a high water table is not conducive to the use of septic systems. Even if sewage facilities were extended to the center of the township, the drainage issues would still have to be solved. In the absence of solutions to correct the water table situation, the Master Plan advises that all high water table areas be designated for low-intensity development, or preferably be retained as farmland or open space areas. Moorestown The Moorestown Conservation Plan element identifies the township’s strategies for conservation. These strategies address the protection of wetlands, floodplains, coastal areas, aquifer recharge, threatened and endangered species, stream corridors, and view sheds. There are several environmentally sensitive parcels within close proximity to Hartford Road in Moorestown that could impact development patterns in the area. These are mainly wetlands, streams, and creeks. The Conservation element of the Moorestown Township Master Plan identifies areas in the vicinity of Hartford Road near Centerton Road, Commonwealth Drive, and Yorktown Lane to border areas of environmentally sensitive land. This Master Plan also concludes that the imposition of environmental regulations over the past 20 years has greatly reduced or eliminated the development of certain type of environmentally sensitive land. In 1998, Moorestown Township established stream setback regulations that prohibit development or site disturbance next to streams, open bodies of water, net fill in flood plain areas, and other types of environmental regulation. The regulations prohibit buildings and paved areas from being located within 50 feet of the bank of any stream or pond. A buffer strip adjoins all streams in a stream corridor to provide for the preservation and enhancement of natural vegetation. The Conservation Element also notes that “[m]ost of the regulation of environmentally sensitive land has reverted to the state level.” This includes regulation of stream encroachment, freshwater wetlands, water withdrawals, and effluent disposal. In 1998, the township

Hartford Road Traffic Assessment Study
35
established stream setback regulations that complemented the state requirements. The Conservation Element also identifies a number of soil series that “present moderate to severe constraints to development.” These soil series are not compatible with septic systems, or require significant modification to work with septic systems. One of these soil series, Woodstown, is found in the Hartford Road corridor near the northern township boundary. The Conservation Element states that “Woodstown soils have a fluctuating water table that rises to a depth of two feet in winter,” but “with proper techniques may be developed.” The township has addressed the potential problems by reducing the minimum lot size to one and one-half acres (0.667 units per acre) in the R-1 district, which occupies most of the non-sewered area. In addition, the Conservation Element describes a process, including goals and criteria that will be used to identify additional environmentally sensitive land to be set aside for conservation. The Open Space and Recreation Plan Element of the Master Plan also designates specific parcels for preservation, including a number in the Hartford Road corridor. Recreational facilities are a priority for Moorestown because demand by sports teams in the township currently exceeds supply. The designated parcels include: a 100 acre wood at the intersection of Hartford Road and Cox Road; the 30 acre Moorestown Farms and another 21 acre parcel, both located on Borton Landing Road; a 16 acre parcel on Commonwealth Drive, and a proposed 20 acre public park on Moorestown Centerton Road. There are also two existing public parks, one on Salem Road and the other on McElwee Road. In summary, the net effect of the constraints on development is that the density and intensity of development in the Hartford Road corridor in Mount Laurel and Moorestown should increase only slightly. This is based on the fact that the zoning for the corridor is primarily low-density residential, open space, and recreation.


Hartford Road Traffic Assessment Study
39
The LOS analysis is used extensively in this report. A general description taken from the 2000 Highway Capacity Manual of the different LOS follows:
LOS A - describes primarily free-flow operations at average travel speeds. Vehicles are completely unimpeded in their ability to maneuver within the traffic stream. Control delay at signalized intersections is minimal.
LOS B - describes reasonably unimpeded operations at average travel speeds. The ability to maneuver within the traffic stream is only slightly restricted, and control delays at signalized intersections are not significant.
LOS C - describes stable operations. However, the ability to maneuver and change lanes in midblock locations may be more restricted than at LOS B. Longer queues, adverse signal coordination, or both may contribute to lower average travel speeds of about 50 percent of the free-flow speed (FFS) for the street class.
LOS D - borders on a range in which small increases in flow may cause substantial increases in delay and decreases in travel speeds. LOS D may be due to adverse signal progression, high signal densities, high volumes, or a combination of these factors.
LOS E - is characterized by significant delays. Such operations are caused by a combination of adverse progression, high signal density, high volumes, extensive delays at critical intersections, and inappropriate signal timing.
LOS F - is characterized by traffic flow at extremely low speeds, typically one third to one fourth of the FFS. Intersection congestion is likely at critical signalized locations, with high delays, high volumes, and extensive queuing.
An LOS analysis was performed on Hartford Road at the Elbo Lane, Union Mill Road, and Borton Landing Road intersections for the AM and PM peak periods. Traffic counts were
VIII. INTERSECTION LEVEL OF SERVICE ANALYSIS

Hartford Road Traffic Assessment Study
40
collected during the peak periods in fifteen-minute increments (Appendix I). This data was used to determine the peak hour traffic volumes. For all three of the intersections on Hartford Road that were analyzed, the AM peak hour was 7:30 to 8:30, while the PM peak hour was 5:00 to 6:00. Traffic volume data, along with data from the Traffic Signal Timing & Operation Plan, were analyzed using Highway Capacity Software (HCS) to determine the LOS. The measure of effectiveness for signalized intersection LOS is the average control delay per vehicle. At each intersection, delay was estimated for each lane group and aggregated for each approach and for the intersection as a whole. This methodology does not take into account the potential impact of downstream congestion on intersection operation. 1. Hartford Road at Elbo Lane The intersection of Hartford Road and Elbo Lane (CR 612) is located in the southeastern section of Mount Laurel Township and is illustrated in Figure 3. Physical Deficiencies and Constraints a. Geometric Deficiencies All lanes at this intersection are 10 feet in width except for the eastbound approach lane of Hartford Road which is 11 feet. There are no shoulders present on the approach legs or departure legs of the intersection. All approaches at this intersection are impeded by left turning vehicles traveling in the same direction. Sight distance appears to be adequate at all approaches to this intersection. b. Drainage Deficiencies There are storm drains at three of the four corners of the intersection. Drainage at this location appears to be adequate. Accident data shows that between 1999 and October 2002, only 4 of 17 accidents occurred during wet conditions at this intersection. c. Pedestrian and Bicycle Deficiencies There are no pedestrian crosswalks and no sidewalks at this intersection, although there are pedestrian pushbuttons at the traffic lights. There were no pedestrians observed at this intersection. The lack of sidewalks and pedestrian facilities does not create a pedestrian-friendly environment. The absence of shoulders

Hartford Road Traffic Assessment Study
411
discourages bicycle traffic since bicyclists have no alternative but to share the travel lane with vehicular traffic.
c. Inter-modal Deficiencies
There are no public bus routes through this intersection.
d. Capacity/Operational Deficiencies
The primary approach on Hartford Road during the AM peak hour is the westbound approach, with 745 vehicles. The primary approach on Elbo Lane is the northbound leg, with 193 vehicles. During the PM peak hour, the eastbound approach is the primary approach on Hartford Road, with 802 vehicles, while the northbound approach on Elbo Lane has 277 vehicles. The traffic signal operates on a two-phase cycle. According to the Traffic Signal Timing & Operation Plan, the green time on Hartford Road varies between 15-40 seconds, while the green time given to Elbo Lane varies between 8-25 seconds. This results in a variable signal cycle length of 37-79 seconds, depending on traffic conditions. However, through field data collection, 100-second cycle lengths were observed. This is probably due to phases being skipped in response to the traffic demand. A sample of signal timings was taken during the AM and PM peaks and an average cycle length was calculated.

Hartford Road Traffic Assessment Study
42
Figure 3 Hartford Road & Elbo Lane Level of Service
Results: An LOS analysis was conducted at all approaches as well as the intersection as a whole. Figure 3 shows the LOS by approach lane group for the AM and PM peak periods. Details are found in Appendix II. During the AM peak, a cycle length of 88 seconds was used. The intersection experienced LOS C during the AM peak, with an overall intersection delay of 26 seconds. During the PM peak, a cycle length of 78 seconds was used. The intersection experienced LOS C, with an average vehicle delay of 24 seconds. Recommended Improvements: To improve mobility through this intersection in the long term, the following improvements should be implemented: • A left turn lane should be constructed for the all approaches to the intersection on Hartford Road. This would separate left turning traffic from the through traffic, and thereby increase the
Level of Service by Approach Lane Group AM (PM)
Hartford Rd
Elbo
Lane
To Medford Twp.
SCHEMATIC NOT TO SCALE
To
Sou
thJe
rsey
Airp
ort
10'10'
10' 10'
10'
11'11'
10'
D (D)
C (C)
C (B)
A (C)
Delaware Valley Regional Planning CommissionNovember 2003

Hartford Road Traffic Assessment Study
43
capacity of the intersection. This will permit shorter cycle lengths and shorter delays. Under current traffic volumes, incorporating left turn lanes on all approaches improves intersection Level of Service from LOS C to LOS B in both the AM and PM peak periods.
• Shoulders should be constructed to a width of 8 feet, environmental factors, and adjacent land use permitting.
• Once left turn lanes are in place at all approaches, then a protected/permitted phase should be implemented. This will decrease overall intersection delay.
2. Hartford Road at Union Mill Road The intersection of Hartford Road and Union Mill Road is located near the center of Mount Laurel Township, illustrated in Figure 4. Physical Deficiencies and Constraints
a. Geometric Deficiencies
Both of the approaches on Hartford Road have a left turn only lane and a through/right shared lane. The approaches on Union Mill have a right turn only lane, and a through/left lane. The shared through/right lanes on Hartford Road are 13 feet wide, while the left turn lanes are 12 feet wide. The shared through/left turn lanes on Union Mill Road are 12 feet wide, while the right turn lanes are 13 feet wide. The departure lanes on Hartford Road are 18 feet, while on Union Mill Road they are 25 feet wide. There are no shoulders present on the approach legs or departure legs of the intersection. Sight distance appears adequate at all approaches to this intersection.
b. Drainage Deficiencies
There are storm drain structures at all four corners of the intersection. Accident data shows that between 1999 and October 2002, only 3 of 13 accidents occurred during wet conditions at this intersection. Drainage at this location appears to be adequate.
c. Pedestrian and Bicycle Deficiencies
There are no pedestrian crosswalks and sidewalks at this intersection, although there are pedestrian pushbuttons at the traffic lights. There were no pedestrians observed at this intersection. This intersection is not pedestrian-friendly because the orientation of the traffic signals makes them difficult to view at the pedestrian level. The current absence of adequate shoulders discourages bicycle traffic.

Hartford Road Traffic Assessment Study
44
d. Inter-modal Deficiencies
There are no public bus routes through this intersection. e. Capacity/Operational Deficiencies
The primary approach at this intersection during the AM peak hour is the westbound approach on Hartford Road, with 1,028 vehicles. The primary approach on Union Mill Road is the southbound approach, with 359 vehicles. During the PM peak hour, the primary approach on Hartford Road is eastbound, with 848 vehicles. The primary approach on Union Mill Road is northbound, with 523 vehicles. The traffic signal operates on a two-phase cycle. According to the Traffic Signal Timing & Operation Plan, the green time on Hartford Road varies between 10-55 seconds, while the green time given to Union Mill varies between 8-25 seconds during peak hours. This results in a variable signal cycle length ranging between 30 and 92 seconds, depending on traffic conditions.
Figure 4 Hartford Road & Union Mill Road Level of Service
Level of Service by ApproachLane Group AM (PM)
Hartford Rd
Union M
ill Rd
13'12'
25'
25'
SCHEMATIC NOT TO SCALE
13'
12'
18'
18'
To NJ 38
13'
12'
13'12'
A (A)
B (B)
C (C)
C (A)
E (F)
C (C)
C (C)
D (E)
Delaware Valley Regional Planning CommissionNovember 2003

Hartford Road Traffic Assessment Study
455
Results:
A LOS analysis was conducted at all approaches as well as the intersection as a whole. Details are found in Appendix II. During both peak periods, the signal cycle reached the maximum of 92 seconds every cycle for every sample timing. As a result, a cycle length of 92 seconds was used to calculate LOS.
During the AM peak, the intersection performed at LOS C, with an overall intersection delay of 28 seconds. The intersection performed at LOS E during the PM peak, with an average delay of 75 seconds. All of the approach lane group LOS for the AM and PM peak periods are shown in Figure 4. Recommended Improvements: • Shoulders should be constructed to a width of 8 feet where
possible, so as to accommodate bicycle traffic. • The left turn lanes on Hartford Road should be aligned to
improve sight distance. This can be achieved as a low-cost measure by restriping the intersection.
• Currently, the left turn lanes on Union Mill Road are shared through/left turn lanes. To avoid delays to through traffic by left turning vehicles, the lanes should be redesignated to allow for a through/right turn lane and left turn only lane. Under current traffic volumes, this improvement would reduce intersection delay from 27 to 23 seconds in the AM peak. During the PM peak, intersection LOS is improved from LOS E to LOS C.
• When demanded by future traffic volumes, the left turn should be set to a protected/permitted phasing on Hartford Road.
3. Hartford Road at Borton Landing Road The intersection of Hartford Road and Borton Landing Road is located at the southern edge of Moorestown Township, as illustrated in Figure 5. Physical Deficiencies and Constraints
a. Geometric Deficiencies There is one approach lane and one departure lane on all legs of the intersection. All approach and departure lanes on Hartford Road are 11 feet wide. On Borton Landing Road, the eastbound approach lane and westbound departure lane is 12 feet wide, while the westbound approach lane and eastbound departure lane are 20 feet and 18 feet respectively. Both lanes on Borton Landing Road have one-foot shoulders. On Hartford Road, the westbound lane

Hartford Road Traffic Assessment Study
46
has a 12-foot shoulder while the eastbound lane has a 6-foot shoulder. Sight distance appears is adequate at all approaches to this intersection.
b. Drainage Deficiencies There are storm drain structures at all four corners of the intersection. Accident data shows that between 1999 and October 2002, none of the 7 accidents that occurred at this intersection was during wet conditions. Drainage at this location appears to be adequate. c. Pedestrian and Bicycle Deficiencies There are pedestrian crosswalks at this intersection and a sidewalk on at least one leg of the intersection. There are also shoulders present, which can accommodate bicycle traffic.
d. Inter-modal Deficiencies
There are no public bus routes through this intersection. e. Capacity/Operational Deficiencies
The primary approach on Hartford Road during the AM peak hour is the eastbound approach, with 620 vehicles. The primary approach on Borton Landing Road is southbound, with 191 vehicles. During the PM peak hour, the primary approach on Hartford road is eastbound, with 410 vehicles. The primary approach on Borton Landing is the northbound approach, with 276 vehicles. The traffic signal operates on a two-phase cycle. According to the Traffic Signal Timing & Operation Plan, the green time on Hartford Road is set at 50 seconds, while the green time given to Borton Landing Road varies between 8-18 seconds during the peak periods.

Hartford Road Traffic Assessment Study
47
Figure 5
Hartford Road & Borton Landing Road Level of Service
Results: The appropriate cycle length collected from field data revealed a 75 second cycle length for the AM peak period and an 84 second cycle length for the PM peak. The intersection performed at LOS B during the AM peak and LOS C for the PM peak. All of the approach lane group LOS are shown in Figure 5. All approaches performed at LOS D or better. Details are found in Appendix II. Recommended Improvements: In an effort to improve mobility and reduce delays at this intersection, the following improvement should be implemented: • A right turn lane should be constructed at the eastbound
approach lane on Hartford Road. As shown in Appendix I, approximately 28 percent of all vehicles on this approach make a right turn during the AM peak. Incorporating a right turn lane would require only a few feet of right-of-way and restriping.
Level of Service by Approach LaneGroup AM (PM)
Hartford Rd
Borton Landing R
d
18'
20'
To Mount Laruel Twp.
11'
11'11'
11'
12'
12'
A (B)
A (B)
D (D)
D (C)
Delaware Valley Regional Planning CommissionNovember 2003
SCHEMATIC NOT TO SCALE

Hartford Road Traffic Assessment Study
48
• Traffic detectors should be added to Hartford Road to optimize the signal cycle lengths and reduce overall delay. • Incorporating a lead left turn interval for the northbound Borton Landing Road approach would improve intersection operations during the PM peak. During the PM peak under current traffic volumes, incorporating a lead left turn interval for the northbound Borton Landing approach reduces the left turn lane group delay from 51 seconds to 29 seconds.

Hartford Road Traffic Assessment Study
49
Measures of Performance The basic unit of the arterial is the segment, which is the one-directional distance from one signalized intersection to the next. If two or more consecutive segments are comparable in arterial classification, segment length, speed limit, and general land use activity, then the segments were aggregated into arterial sections. Based on comprehensive data collection and analysis of both the segment and each arterial section as a whole, several criteria were used to measure traffic performance. A travel time study was conducted on the arterial within the study area. There were several measures of performance used to interpret the amount of congestion on an arterial section. It should be noted that the gathered information was based on field observations, and represent a snapshot of roadway conditions at that time. Because this is a growing section of Burlington County, traffic conditions change quickly, due mainly to increases in person trips and vehicle miles traveled (VMT). • Travel Time Study - For the purpose of this analysis, travel time
studies were conducted to measure actual travel speeds on arterials within the study area. Travel time studies are used specifically to evaluate the extent and causes of congestion. The travel time information can be used to identify problem locations on facilities by virtue of high travel times and delays, and to measure arterial LOS.
• Average Car Technique - To ensure uniformity of data, a
method called the average car technique was used. In this procedure, the driver approximates the average conditions by maintaining a similar position within the traffic stream.
Measurements of time travel were taken at each intersection of the travel area. Travel runs were conducted during the AM and PM peak periods. A single travel run took an average of ten to fifteen minutes to complete. This allowed adequate time for three travel runs in each direction to be conducted for each peak period. Through the use of this technique, a representative sample of traffic conditions throughout the peak period was documented to assure that the duration and variation of congestion throughout the period was taken into account. Directional variations in traffic flow were also noted.
IX. ARTERIAL SECTION ANALYSIS

Hartford Road Traffic Assessment Study
50
The AM and PM peak periods were conducted during the same time each day that travel times were performed. The AM peak period generally ranged from 7:00 am to 8:30 am. The PM peak was generally from 4:00 pm to 6:30 pm. Travel runs were conducted midweek, while school was in session. This technique was used to capture typical weekday traffic conditions. The travel speed, or average speed of a traffic stream computed as the length of a roadway segment divided by the average travel time of a vehicle traversing the segment, was calculated for each segment on the arterial. • Free-Flow Speed - The free-flow speed (FFS) is defined by the
2000 Highway Capacity Manual (HCM) as the theoretical speed of traffic when density is zero. This can be interpreted in practical terms as the average speed vehicles tend to drive when they are not constrained by control delay. The free-flow runs were conducted during times of unimpeded travel, typically between 9:30 am and 10:30 am in the morning. Two travel runs were performed in each direction and an average FFS was computed. It should be noted that the FFS is an ideal speed that serves as a benchmark by which the effect of traffic congestion and other impediments to normal traffic flow can be gauged.
• Travel Time Speed versus Free-Flow Speed - This is the
relationship between average travel speed and FFS. This is calculated by simply dividing the congested travel time speed with the FFS, which yields a certain percentage. The top ten arterial sections are ranked based on travel speed as a percentage of ideal speed and are listed by direction. The peak period and the corresponding Highway Capacity Manual LOS are also given. Additional variations in peak period and direction of the top ten arterial sections are listed, providing that the travel speed to FFS ratio is less than 50 percent.
In general, the LOS is consistent with the percentage of FFS. However, since the travel speeds and FFSs were recorded from field research, a straightforward comparison between the two speeds is more precise than LOS. Level of Service (LOS) - Arterial LOS is based on average through-vehicle travel speed for the segment or arterial section under consideration. LOS is defined in terms of the average travel speed of all through vehicles on the arterial. On a given facility, such factors as inappropriate signal timing, poor

Hartford Road Traffic Assessment Study
51
1 progression, traffic signal density, increasing traffic flow, turning
vehicles, and average intersection control delay can influence LOS. The arterial sections are categorized based on a combination of average travel speed and street classification. Determining the street classification is established from direct field measurements of the FFS and on an assessment of the street’s functional and design categories. Functional categories are based on mobility, access, connectivity, and predominant trip type. Design is based on a variety of criteria, including driveway density, arterial type, parking, speed limit, pedestrian activity, and roadside development. Once the arterial sections have been properly classified, the appropriate LOS can be determined based on average travel speed. There is some subjectivity in determining the road classification in the LOS analysis. Arterial roads in any given area can change capacity and geometry very rapidly; generalizing an urban street may be difficult. There may be instances where an arterial falls into multiple categories, or may be so unique that it does not fall into any distinct, individual category. When this occurred, the FFS was used to aid in this determination, because each arterial classification has a characteristic range of Free-Flow Speeds. Although there is some subjectivity, it is important to remember that the LOS is a widely accepted and valid indicator of traffic performance. In addition to the signalized intersection analysis, an LOS analysis was performed on Hartford Road between Elbo Lane and Borton Landing Road. The arterial section analysis was conducted for the AM and PM peaks in both the eastbound and westbound direction on Hartford Road. The westbound arterial LOS is shown in Figure 6.
Travel runs were conducted during the AM and PM peak periods. Measurements of time travel were taken at each intersection of the Hartford Road study area. A single travel run took an average of ten to fifteen minutes to complete. This allowed adequate time for four travel runs in each direction to be conducted for each peak period. Through the use of this technique, a representative sample of traffic conditions throughout the peak period was documented to assure that the duration and variation of congestion throughout the period was taken into account. Directional variations in traffic flow were also noted.

Hartford Road Traffic Assessment Study
52
Figure 6: Westbound Hartford Road Arterial Level of Service
As shown in Figure 6, the worst performing arterial section in the westbound direction was between NJ 38 and Marne Highway, which performed at LOS D in both the AM and PM peak periods.
Figure 7: Eastbound Hartford Road Arterial Level of Service
As shown in Figure 7, the worst performing arterial section in the eastbound direction was between Marne Highway and NJ 38 in the PM peak period, which performed at LOS D. The rest of the corridor performed at LOS C or better.
ElboLane
Mt LaurelRoad
Union MillRoad
NJ 38 MarneHighway
CentertonRoad
BortonLanding
Road
B (B) A (A) C (D) D (D) C (C) A (A)
Delaware Valley Regional Planning CommissionNovember 2003
SCHEMATIC NOT TO SCALEAM (PM)
ElboLane
Mt LaurelRoad
Union MillRoad
NJ 38 MarneHighway
CentertonRoad
BortonLanding
Road
B (B) B (B) B (C) C (D) B (B) A (B)
Delaware Valley Regional Planning CommissionNovember 2003SCHEMATIC NOT TO SCALE AM (PM)

Hartford Road Traffic Assessment Study
53
Hartford Road at Salem Road The intersection of Hartford Road and Salem Road is a two-way stop-controlled intersection. Salem Road is a local road while Hartford Road is a major arterial road. At this intersection, drivers on Salem Road determine when the gap in traffic on Hartford Road is large enough to permit safe entry. The fewer gaps there are on Hartford Road, the greater the delay is on Salem Road. Based on recent turning movement counts in both the AM and PM peaks, the need to upgrade this intersection to a traffic signal was analyzed. The traffic counts taken at this intersection for the traffic signal warrant analysis are listed in Appendix III. The Manual of Uniform Traffic Control Devices (MUTCD), outlines the warrants for justifying traffic control signals. An analysis was done of the applicable factors in three traffic signal warrants: Warrant 1: Eight-Hour Vehicular Volume, Warrant 2: Four-Hour Vehicular Volume, and Warrant 3: Peak Hour. The intersection needs only to fulfill the requirements of one of these warrants to demonstrate a need for a traffic signal at this intersection.
• Warrant 1: Eight-Hour Vehicular Volume was used to determine whether a large traffic volume on Hartford Road results in excessive delays on Salem Road due to a conflict with traffic entering or crossing Hartford Road. Because the speed limit on Hartford Road is 45 mph, the 70 percent value threshold was used. • Warrant 2: Four-Hour Vehicular Volume was used to determine whether there was a large volume of intersecting traffic. • Warrant 3: Peak Hour Vehicular Volume was used to determine whether traffic conditions on Salem Road for a minimum of one hour each day, suffers due to undue delay when entering or crossing Hartford Road.
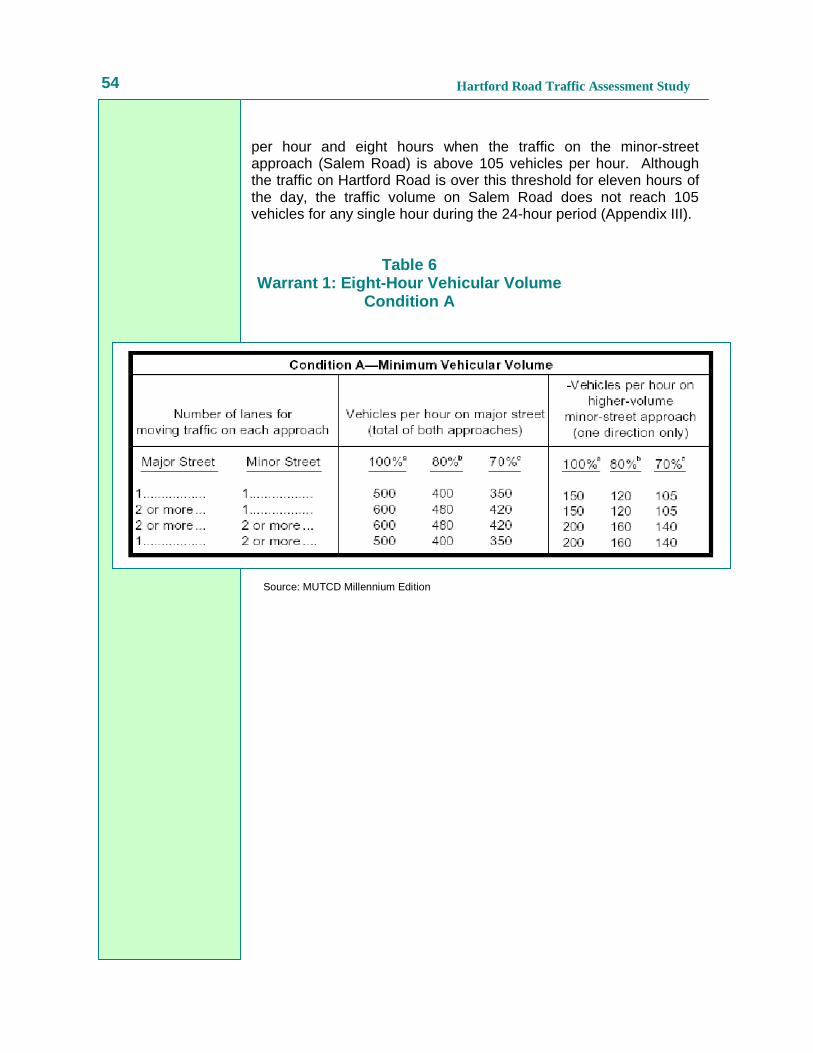
The intersection currently being examined has one lane of traffic on each approach of both the major and minor street. According to Condition A from Table 6 Warrant 1: Eight-Hour Vehicular Volume, for this intersection type there must be at least eight hours when the traffic on the major street (Hartford Road) is above 350 vehicles
X. SIGNAL WARRANT ANALYSIS
Hartford Road Traffic Assessment Study
54
per hour and eight hours when the traffic on the minor-street approach (Salem Road) is above 105 vehicles per hour. Although the traffic on Hartford Road is over this threshold for eleven hours of the day, the traffic volume on Salem Road does not reach 105 vehicles for any single hour during the 24-hour period (Appendix III).
Table 6 Warrant 1: Eight-Hour Vehicular Volume
Condition A
Source: MUTCD Millennium Edition

Hartford Road Traffic Assessment Study
55
According to Condition B from Table 7 Warrant 1: Eight-Hour Vehicular Volume, there must be at least eight hours when the traffic on the major street (Hartford Road) is above 525 vehicles per hour and eight hours when the traffic on the minor-street approach (Salem Road) is above 53 vehicles per hour. The traffic on Hartford Road only surpasses this threshold for ten hours of the day and the traffic on Salem Road is over 53 vehicles per hour for only three hour of the day (Appendix III). This intersection, therefore, does not meet the warrant, the eight-hour test.
Table 7 Warrant 1: Eight-Hour Vehicular Volume
Condition B
Source: MUTCD Millennium Edition
Hartford Road Traffic Assessment Study
56
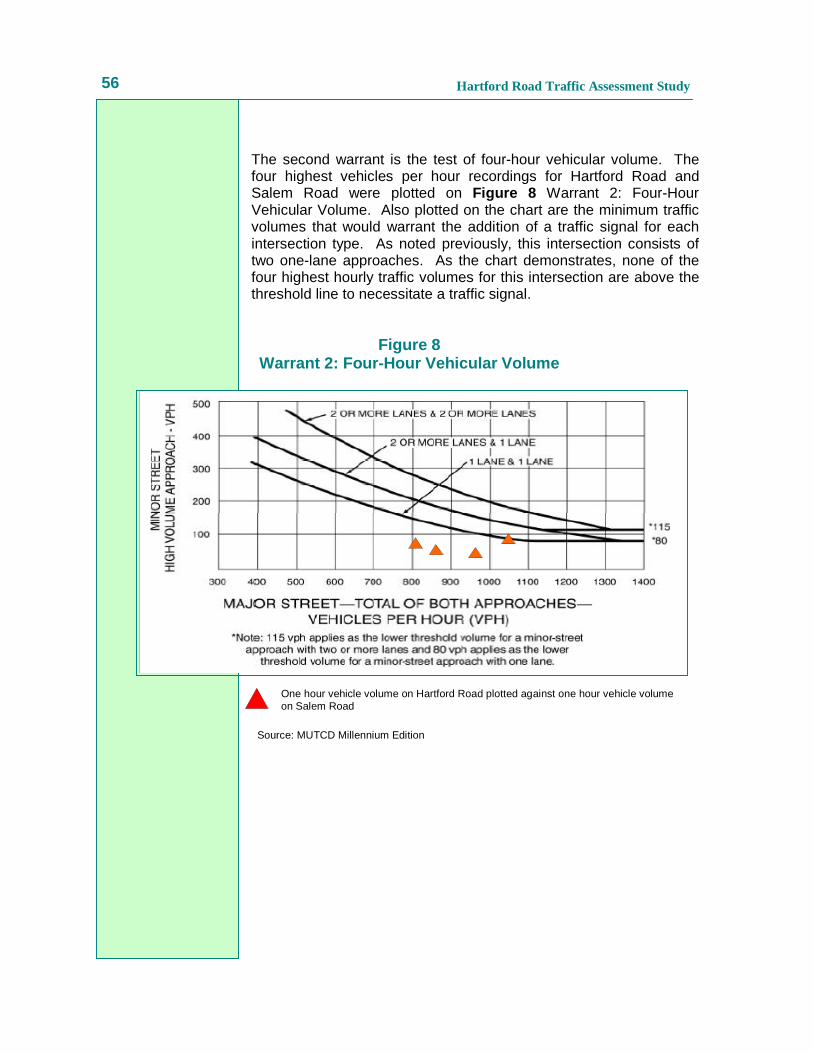
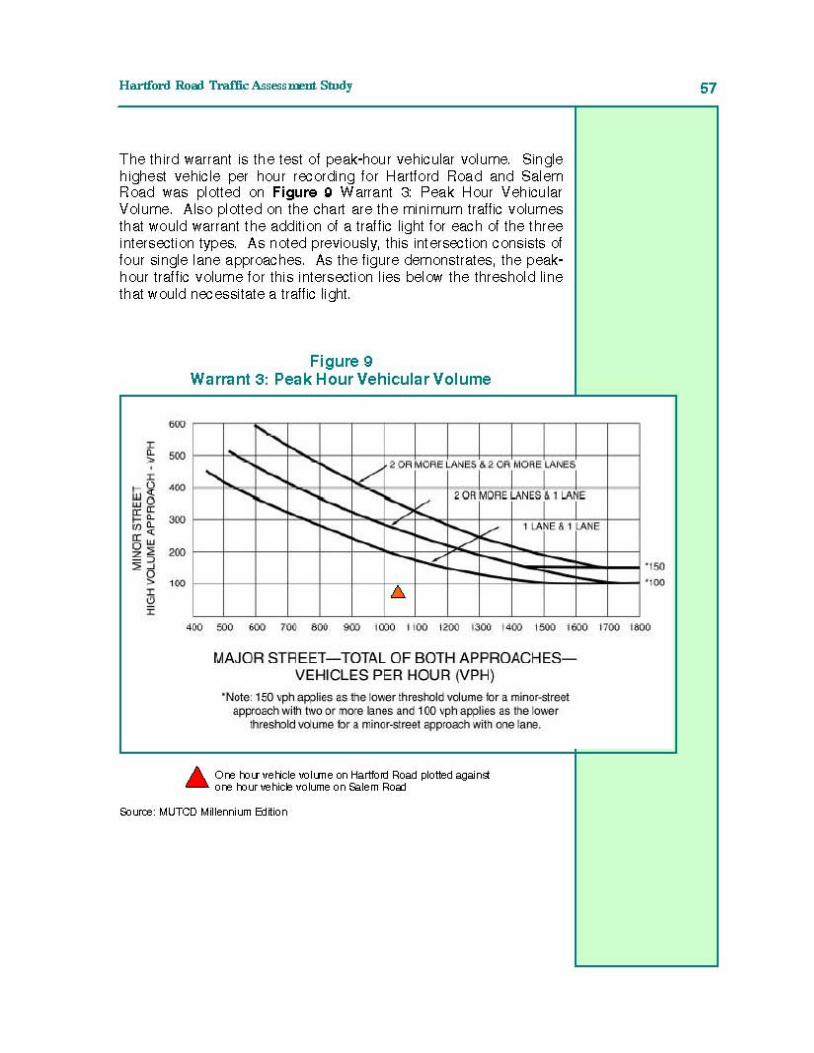
The second warrant is the test of four-hour vehicular volume. The four highest vehicles per hour recordings for Hartford Road and Salem Road were plotted on Figure 8 Warrant 2: Four-Hour Vehicular Volume. Also plotted on the chart are the minimum traffic volumes that would warrant the addition of a traffic signal for each intersection type. As noted previously, this intersection consists of two one-lane approaches. As the chart demonstrates, none of the four highest hourly traffic volumes for this intersection are above the threshold line to necessitate a traffic signal.
Figure 8 Warrant 2: Four-Hour Vehicular Volume
One hour vehicle volume on Hartford Road plotted against one hour vehicle volume on Salem Road
Source: MUTCD Millennium Edition

Hartford Road Traffic Assessment Study
58
Findings Based on the standards used in the MUTCD Millennium Edition 12.28.2001, the minimum vehicular volume was not exceeded for any of the three warrant analyses at the intersection of Hartford Road (CR 686) and Salem Road. The analysis as demonstrated in the previous tables and figures, shows that a traffic signal is not warranted at this intersection at this time. However, in future years, this intersection should be re-evaluated as traffic volumes increase to see whether it fulfills the minimum volume required for a traffic signal.

Hartford Road Traffic Assessment Study
59599
Walking and biking, for many short to mid-length trips, represent alternatives to the use of a single occupancy vehicle. There are many trips that can be made by foot or in combination with other modes. In order to integrate pedestrians and bicyclists into the existing transportation systems, the appropriate facilities should be provided. These are influenced by characteristics such as land use, population, and transportation patterns. A regional pedestrian/ bicycle program should consist of an interconnected system of routes, lanes, paths, and greenways that provide recreational as well as alternative transportation opportunities. There are several existing and proposed pedestrian and bicycle routes and trails in the study area that can provide alternative transportation opportunities. Hartford Road is currently a popular thoroughfare for weekend cyclists, although most cyclists who use it are advanced. This is dictated by road conditions that include shoulders that are usually narrow or non-existent. The Mount Laurel and Moorestown Master Plans designate a network of bicycle and pedestrian facilities. The facilities are (or would be) designed for basic bicyclists (and pedestrians), who usually require separation from vehicle traffic for safety and comfort. Mount Laurel The Mount Laurel Recreation and Open Space Plan states that the “township is now attempting to provide open spaces to soften the density of development, to provide relief from the stresses of suburban living, and to provide a unified land use pattern that links together all parts of the township.” In addition, “a major consideration is providing a mixed use path system that will link together open space and recreation parcels with housing development areas.” The General Recreation Plan shows the locations of existing and possible future recreation sites, and also shows the designated pathway system, some of which has already been constructed. The Hartford Road corridor has the highest concentration of recreation sites and open space in the township. A bicycle-pedestrian path has been proposed for Larchmont Boulevard, which runs roughly parallel to Hartford Road. The Larchmont Boulevard path would connect numerous recreational sites, some of them now isolated from each other. It would also provide access to these sites from housing development areas, including the densely
XI. PEDESTRIAN AND BICYCLE FACILITIES

Hartford Road Traffic Assessment Study
60
developed eastern side of the township. There are also paths proposed on two intersecting routes: 1) Union Mill Road, between Elbo Lane and Larchmont Boulevard, and 2) Hainesport-Mount Laurel Road, between Moorestown-Mount Laurel Road and Larchmont Boulevard (Table 8). Both paths would also cross Hartford Road. The intersections of Hartford Road and the Union Mill Road path and Hartford Road and the Hainesport-Mount Laurel Road path, will probably require special bicycle and pedestrian treatment. Weekend bicycle and pedestrian traffic is likely to be high, especially on the Union Mill Road path, which would be accessible from the population centers on both the western and eastern sides of the township. Moreover, the users of these paths are likely to include a significant number of families with children. Consequently, there is likely to be a need to redesign the intersections, signals, or both. One possibility would be a special crossing with flashing lights. Alternatively, bicyclists and pedestrians could be accommodated under the current signal cycling by changing the phasing or allowing them to extend the phase by pushing an interrupter button. It may be cost-effective to add the amenities at the Union Mill Road intersection now as part of the intersection improvements recommended in this report.
Table 8
Selected Future Bicycle and Pedestrian Facilities, Mount Laurel Township
Location From To Designation
Larchmont Boulevard Hainesport-Mount Laurel Road
Masonville-Centerton Road
Bicycle-Pedestrian Path
Union Mill Road Elbo Lane Larchmont Boulevard
Bicycle-Pedestrian Path
Hainesport-Mount Laurel Road
Moorestown-Mount Laurel Road
Hartford Road Possible Future Path System
Moorestown The Open Space and Recreation Plan Element of the Moorestown Township Master Plan states that “the township has an ambitious plan for establishing bikeways and bike routes throughout the municipality.” The Plan Element also designates a bikeway system to extend along most major thoroughfares and connect neighborhoods to schools, parks, and community facilities. Bikeways are understood to refer to facilities intended and

Hartford Road Traffic Assessment Study
61
designed for both bicyclists and pedestrians. Of the three classes of
bikeways, two classes are present in the Township: Class 1 bikeways are paved bicycle paths that are horizontally separated from the paved cartway of a road, and Class 3 bikeways are routes designated on existing streets. The eastern side of the township includes a number of parks and recreation sites as well as sites identified for preservation and open space. It also has a lower residential density than much of the township. A network of bikeways (all Class 1) has been identified along selected roadways on the eastern side of the township. Some of the bikeways already exist. A bikeway running along Hartford Road, between Moorestown-Centerton Road and Kimberly Drive, is a natural north-south route. There are also bikeways along two intersecting east-west routes: 1) Borton Landing Road, between Hartford Road and Creek Road, and 2) Old Salem Road, between Hartford Road and Westfield Road. Another existing bikeway follows the perimeter of Laurel Creek Country Club along Country Club Drive. In the future, the bikeway on Hartford Road will be extended north to Garwood Road, and additional intersecting routes will be added along Centerton-Moorestown Road, McElwee Road, and Garwood Road (Table 9). The bikeways along Old Salem Road and McElwee Road will connect via a short segment of Hartford Road. The two bikeways together will constitute a natural east-west route. The segment of Hartford Road that connects Old Salem Road and McElwee Road will probably require a special bicycle and pedestrian treatment. Because there is likely to be a significant flow of bicycle and pedestrian traffic at this location, it will probably be necessary to establish a controlled crossing of Hartford Road for bicyclists and pedestrians at one of the intersections.
Table 9 Selected Future Bicycle and Pedestrian Facilities,
Moorestown Township
Location From To Designation
Moorestown-Centerton Road Marne Highway Township Boundary
Class 1 Bikeway
Garwood Road Westfield Road Hartford Road Class 1 Bikeway
Hartford Road Kimberly Drive Garwood Road Class 1 Bikeway
McElwee Road Hartford Road Creek Road Class 1 Bikeway

Hartford Road Traffic Assessment Study
62
Bicycle Facility Best Practice The preference when constructing bicycle facilities should be to locate them on the roadway. The reason is that an off-road bicycle facility running parallel to a roadway results in the creation of a second point of conflict for drivers at each intersection. The construction of an on-road bicycle facility may be best accomplished by designing the roadway wide enough to accommodate both vehicles and bicycles. Off-road facilities are acceptable, but require the following guidelines to be implemented safely: First, there should be no direct access from abutting properties to the roadway that cross the bicycle facility (i.e., driveways). Second, bicyclists should be required to stop at a stop sign at all intersections. This will eliminate the second point of conflict for drivers, and increase the safety of bicyclists. In addition, even if a municipality opts to construct off-road bicycle facilities, it is necessary to widen the roadway anyway because some cyclists will choose to ride in the roadway even when presented with an off-road alternative. Delaware River Heritage Trail Once completed, the Delaware River Heritage Trail will be a loop trail between Morrisville-Trenton to the north, and Palmyra-Philadelphia to the south. Existing trails within those endpoints will be used as part of the trail. The intent is to make a land trail available for walking and bicycling as close to the Delaware River as possible. Connections will be possible to the proposed station of the Southern New Jersey Light Rail Transit System in Bordentown as well as the Delaware and Raritan Canal State Park. Locating a trail immediately adjacent to the shoreline of the Delaware River will be difficult in many areas because of the natural topography, and because of the presence of heavy industry or private residential property. In these areas, the trail will probably have to be on-road. The riverfront of the Delaware River has been identified by Burlington County as a project area in its Parks and Open Space Master Plan. Burlington County and DVRPC are currently overseeing a scoping study of the section of the route that is in New Jersey.

Hartford Road Traffic Assessment Study
63
The Hartford Road Corridor Assessment Study can be used as a dynamic long-range tool for the systematic selection of projects to create a significantly improved transportation system within the study area. This document can serve as a punch list for the government agencies with a stake in the implementation of improvements. Municipal governments are key players in this process. Even though a highway may be maintained by the state or county, it is the welfare of the local residents which is affected the most. Safety and mobility benefits are felt more by those who use the highway frequently. Therefore, the local municipality should assure that the improvements are advanced expediently by being involved in the process no matter which agency has a lead role. Characteristics In choosing which projects should advance first, stakeholders can be guided by the information presented in this section on the relative importance to stakeholders of the various attributes of each problem location. Each improvement scenario identified is evaluated in terms of project priority, cost range, and project benefits. The stakeholders necessary to carry out the plan are also identified. Priority Priorities are estimated in terms of three categories: high, moderate, and low. Priorities are assigned based on the perception of the extent of the problems they present drivers, with safety being most important, but congestion (or time delay) and mobility also being considered. A higher degree of priority is also assigned if there is an urgency to complete the improvement due to the imminent completion of a nearby major investment (development or transportation improvement). If there is concern that a section of right-of-way needed to complete an improvement is in danger of being developed or used for another use, the priority to act on that improvement is also heightened. If a project is relatively small scale and low cost, yet offers a projected high benefit, it also receives a higher priority ranking. Cost Range Costs are also assigned to categories of high, moderate, and low. High-cost projects usually involve a major commitment from one or more funding sources, lengthy public involvement, and several years lead time in programming the required funds. They are
XII. IMPROVEMENT PLAN
typically large-scale, complex, or multi-phased improvements and can entail the construction of new facilities. In general, a project in this category is estimated to cost between $5 and $35 million.

Hartford Road Traffic Assessment Study
64 typically large-scale, complex, or multi-phased improvements and
can entail the construction of new facilities. In general, a project in this category is estimated to cost between $5 and $35 million. However, some major projects have been known to cost in the hundreds of millions of dollars. An improvement estimated to have a moderate cost could involve a major reconstruction of an intersection, construction of a short connector road, or a widening of an existing road. In general, a project in this category is estimated to cost between $2 and $5 million. Low-cost projects can often be fast-tracked with maintenance or pool funding. They are often operational type improvements at isolated locations and typically cost less than $2 million. These cost ranges are generalized estimates and could be significantly changed for a specific location due to environmental, right-of-way, or other factors uncovered during detailed design of the improvement. Benefits Benefits describe the kind of impact the improvement will yield, such as enhancing safety, lessening congestion, improving mobility or encouraging economic development. Economic development benefits are derived from a transportation improvement generally through an increase in the accessibility of affected individual properties or areas. The strategic location and magnitude of the improvement determines the extent of the benefits received by the affected properties. The increased level of access to a property may make it attractive enough to induce new commercial or residential development or entice existing land uses to expand. Increased accessibility can also have a positive effect on property values. Roles of Agencies Municipalities make land use decisions in the corridor, which ultimately affect traffic levels on Hartford Road. In addition, many of the cross streets are designed, built, and maintained by local government, and these also impact how well Hartford Road functions. Lastly, developers actually build the housing, commercial, and industrial projects, which generate the trips which must be accommodated by a publicly-owned transportation infrastructure. In addition, some of the transportation improvements themselves are designed and financed by developers. New Jersey Department of Transportation (NJDOT) NJDOT has jurisdiction over the state highways in the corridor. These include US 38. Improvements to this highway are typically financed by state and/or federal funds. Occasionally, developer contributions are also a source of funding if the project has special impact by a development. The State ultimately makes the decision on what improvements are done to their facilities but often coordinates with the county or local municipalities when the improvements include facilities under their jurisdiction.

Hartford Road Traffic Assessment Study
65
Burlington County The county has jurisdiction over a network of roads throughout the study area. In New Jersey, county roads are given 500, 600, or 700 route designations. The primary function of the county network is to serve medium-range trips or to serve as feeders to the state system. Improvements to county roads are financed by county dollars, or where eligible, by federal or state funding. The county has the ultimate decision concerning improvements on county roads but typically coordinates with the municipality in which the improvement is located. Metropolitan Planning Organization (MPO) DVRPC, serving as the MPO for this region, is required to coordinate a comprehensive and continuing transportation planning process. This process results in the development of a Transportation Improvement Program (TIP), which identifies all priority projects for which federal funds will be sought. The TIP represents a consensus among state and regional officials as to what regional improvements are to be made. In addition to the TIP, the MPO is required by federal legislation to develop a long-range plan (LRP) to help direct region-wide transportation decision making over a period of at least 20 years. LRPs do not specify the design of actual projects. Rather, they identify future needs to address transportation deficiencies. Municipalities Local governments not only have jurisdiction over their local road system but they also control local land use decisions. The decisions made at the local level can affect the traffic on roads at all levels. Therefore, local officials must understand the traffic impacts which could be generated from a particular development and understand the synergy that exists between land use decisions and transportation improvements. Local officials need to be involved in the transportation planning process for all levels of transportation improvements to make sure that the concerns of their residents are addressed and to assist in the problem identification and improvement recommendations. Municipal officials need to make use of the circulation element of their Master Plan to identify important missing links in their highway network and begin to preserve space for these links to be built. The Master Plan is an important tool for municipalities to use in addressing their circulation needs.

Hartford Road Traffic Assessment Study
66
Developers As properties are developed or redeveloped, the transportation needs of the properties can change, sometimes drastically. Providing proper transportation access to a new development is often critical to the success of that development. Therefore, developers must work with the transportation providers to assure that the necessary changes are beneficial to both the development and the existing transportation infrastructure. Developers frequently design and construct improvements for traffic attributable to their developments or to provide enhanced access to their site.

Hartford Road Traffic Assessment Study
67
1. Intersection Improvement
Location: A. Hartford Road at Elbo Lane Improvement: • A left turn lane should be constructed for the all approaches
to the intersection on Hartford Road. This would separate left turning traffic from the through traffic, and thereby increase the capacity of the intersection. This will permit shorter cycle lengths and shorter delays. Incorporating left turn lanes also improves overall safety at the intersection.
• Shoulders should be constructed of 8 feet, environmental factors, and adjacent land use permitting.
• Once left turn lanes are in place at all approaches, then a protected/permitted phase should be implemented. This will decrease overall intersection delay.
Priority: Moderate Cost Range: Low Benefits: Congestion, Mobility, Safety Role: Municipality, County Location: B. Hartford Road at Union Mill Road Improvement: • Shoulders should be constructed of 8 feet where possible, so as
to accommodate bicycle traffic. • The left turn lanes on Hartford Road should be aligned to
improve sight distance. This can be achieved as a low-cost measure by restriping the intersection.
• When demanded by future traffic volumes, the left turn should be set to a protected/permitted phasing on Hartford Road.
• Currently, the left turn lanes on Union Mill Road are shared through/left turn lanes. To avoid delays to through traffic by left turning vehicles, the lanes should be redesignated to allow for a through/right turn lane and left turn only lane. This would also allow for a an exclusive protected left turn phase on Union Mill Road as future traffic volumes increase.
Hartford Road Traffic Assessment Study
68
Priority: Low Cost Range: Low Benefits: Congestion, Mobility, Safety Role: Municipality, County Location: C. Hartford Road at Borton Landing Road Improvement: • A right turn lane should be constructed at the eastbound
approach lane on Hartford Road. Approximately 28 percent of all vehicles on this approach make a right turn during the AM peak. Incorporating a right turn lane would require only a few feet of right-of-way and restriping.
• Traffic detectors should be added to Hartford Road to optimize the signal cycle lengths and reduce overall delay.
• Incorporating a lead left turn interval for the northbound Borton Landing Road approach would improve intersection operations during the PM peak.
Priority: Moderate Cost Range: Low Benefits: Congestion, Mobility, Safety Role: Municipality, County 2. Corridor-wide Improvement A. Shoulder Width: • While lane width in the corridor is generally 10-12 feet,
shoulders are missing from large segments of the corridor. Where possible, a shoulder width of 8 feet should be established within the corridor, environmental conditions and historic features permitting. This is consistent with the Mount Laurel Master Plan, which recommends that Hartford Road from Route 38 to Medford Township should be upgraded from one lane in each direction to two 12-foot lanes in each direction with 8-foot wide shoulders. The proposed right-of-way for Hartford Road in

Hartford Road Traffic Assessment Study
69
Mount Laurel Township is 86 feet. This right-of-way width is reserved for roads (such as Hartford Road) that carry relatively large volumes of traffic and serve as connectors to arterial highways.
• The shoulder along Hartford Road is often used as an additional
width for the traveled way. This permits drivers meeting or passing other vehicles to drive on the edge of the roadway without leaving the surfacing, thus making use of the shoulder itself. According to the American Association of State Highway and Transportation Officials (AASHTO) guidelines, “Roads with a narrow traveled way, narrow shoulders and an appreciable traffic volume tend to provide poor service, have a relatively higher crash rate, and need frequent and costly maintenance.” A shoulder of adequate width will permit space away from the traveled way for vehicles to stop for mechanical difficulties or emergencies. It would provide space for evasive maneuvers to avoid potential crashes. An adequate shoulder would increase highway capacity as well as provide space for maintenance operations such as snow removal and storage. Finally, adequate shoulders provide space for pedestrian and bicycle use. Based on AASHTO guidelines, the design volume and speed for Hartford Road warrants an 8-foot shoulder.
Priority: High
Cost Range: Low
Benefits: Mobility, Safety Role: Municipality, County
B. Right-of-Way:
• All segments of Hartford Road within Mount Laurel Township
were identified as having too narrow a width, alignment and congestion problems by the year 2010.
Priority: Moderate
Cost Range: Low
Benefits: Congestion Role: Municipality, County
Hartford Road Traffic Assessment Study
70
C. Pedestrian and Bicycle Trails: • Pedestrian and bicycle trails should be clearly marked and
signed. Several multipurpose trails intersect with or run parallel to Hartford Road. These intersections should be clearly signed both for vehicular traffic on Hartford Road as well as for trail traffic on the trails.
Priority: Low Cost Range: Low Benefits: Mobility, Safety Role: Municipality, County D. Land Use Strategies: • The municipalities should adopt land use strategies that
recognize the impact of future growth on circulation and mobility and make the necessary accommodations if these are encouraged.
Priority: Moderate Cost Range: Low Benefits: Congestion, Mobility Role: Municipality, County
I-1
APPENDIX I
Intersection Turning Movement Counts

I-2

I-3
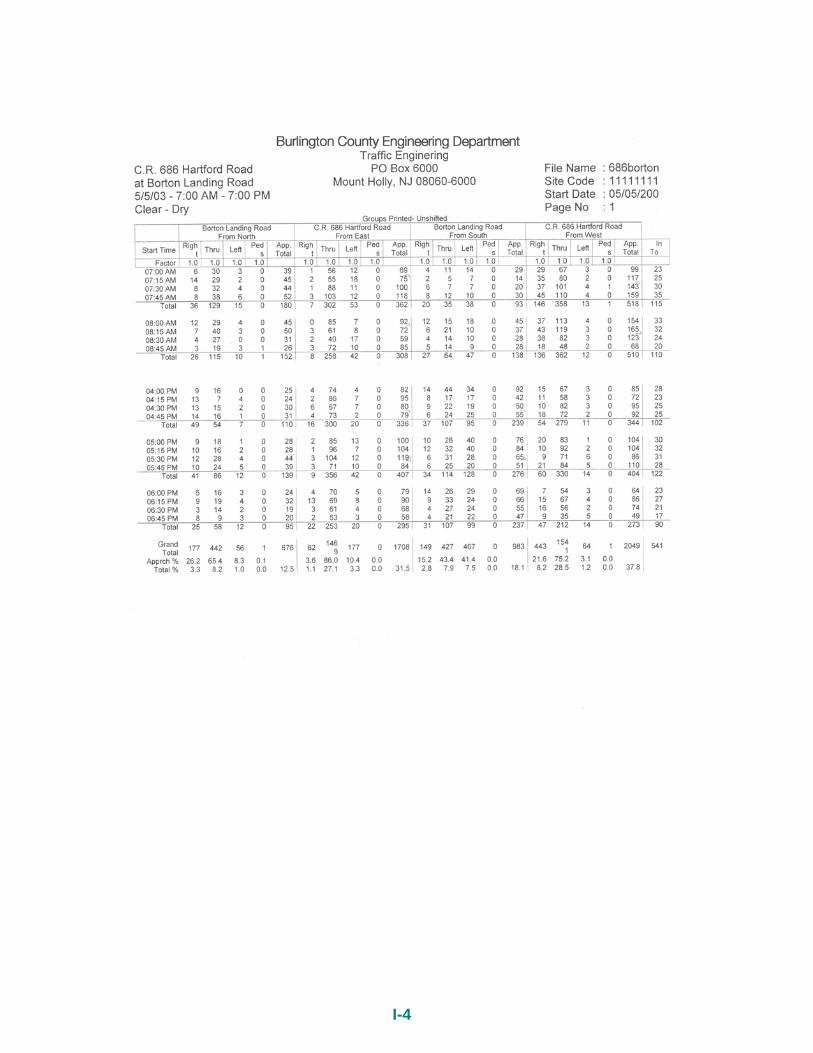
I-4

APPENDIX II
Current Intersection Level of Service
II-1

II-2
HCS2000ô DETAILED REPORTGeneral Information Site Information
Analyst Agency or Co. DVRPC Date Performed 08/14/2003 Time Period 7:30 AM to 8:30 AM
Intersection Hartford Road at Elbo Lane Area Type All other areas Jurisdiction Mount Laurel, NJ Analysis Year 2003
Project ID Hartford Road Traffic Assessment Study
Volume and Timing InputEB WB NB SB
LT TH RT LT TH RT LT TH RT LT TH RT Number of lanes, N
1 0 1 0 0 1 0 0 1 0 0 1 0
Lane group LTR LTR LTR LTR
Volume, V (vph) 6 348 31 99 593 53 45 45 103 54 90 20
% Heavy vehicles, %HV 14 14 14 14 14 14 2 2 2 2 2 2
Peak-hour factor, PHF 0.90 0.90 0.90 0.90 0.90 0.90 0.90 0.90 0.90 0.90 0.90 0.90
Pretimed (P) or actuated (A) A A A A A A A A A A A A
Start-up lost time, l1 2.0 2.0 2.0 2.0
Extension of effective green, e 2.0 2.0 2.0 2.0
Arrival type, AT 3 3 3 3
Unit extension, UE 3.0 3.0 3.0 3.0
Filtering/metering, I 1.000 1.000 1.000 1.000
Initial unmet demand, Qb 0.0 0.0 0.0 0.0
Ped / Bike / RTOR volumes 0 0 0 0 0 0 0 0
Lane width 12.0 12.0 12.0 12.0
Parking / Grade / Parking N 0 N N 0 N N 0 N N 0 N
Parking maneuvers, Nm
Buses stopping, NB 0 0 0 0
Min. time for pedestrians, Gp 3.2 3.2 3.2 3.2
Phasing EW Perm 02 03 04 NS Perm 06 07 08
Timing G = 55.0 G = G = G = G = 19.0 G = G = G =
Y = 7 Y = Y = Y = Y = 7 Y = Y = Y = Duration of Analysis, T = 0.25 Cycle Length, C = 88.0
Lane Group Capacity, Control Delay, and LOS DeterminationEB WB NB SB
LT TH RT LT TH RT LT TH RT LT TH RT Adjusted flow rate, v 428 828 214 182
Lane group capacity, c 1018 906 320 301
v/c ratio, X 0.42 0.91 0.67 0.60
Total green ratio, g/C 0.63 0.63 0.22 0.22
Uniform delay, d1 8.4 14.4 31.6 31.1
Progression factor, PF 1.000 1.000 1.000 1.000
Delay calibration, k 0.11 0.43 0.24 0.19
Incremental delay, d2 0.3 13.5 5.3 3.4
Detailed Report
Initial queue delay, d3
Control delay 8.7 28.0 36.9 34.6
Lane group LOS A C D C
Approach delay 8.7 28.0 36.9 34.6
Approach LOS A C D C
Intersection delay 24.9 XC
= 0.85 Intersection LOS C
HCS2000TM Copyright © 2000 University of Florida, All Rights Reserved Version 4.1d
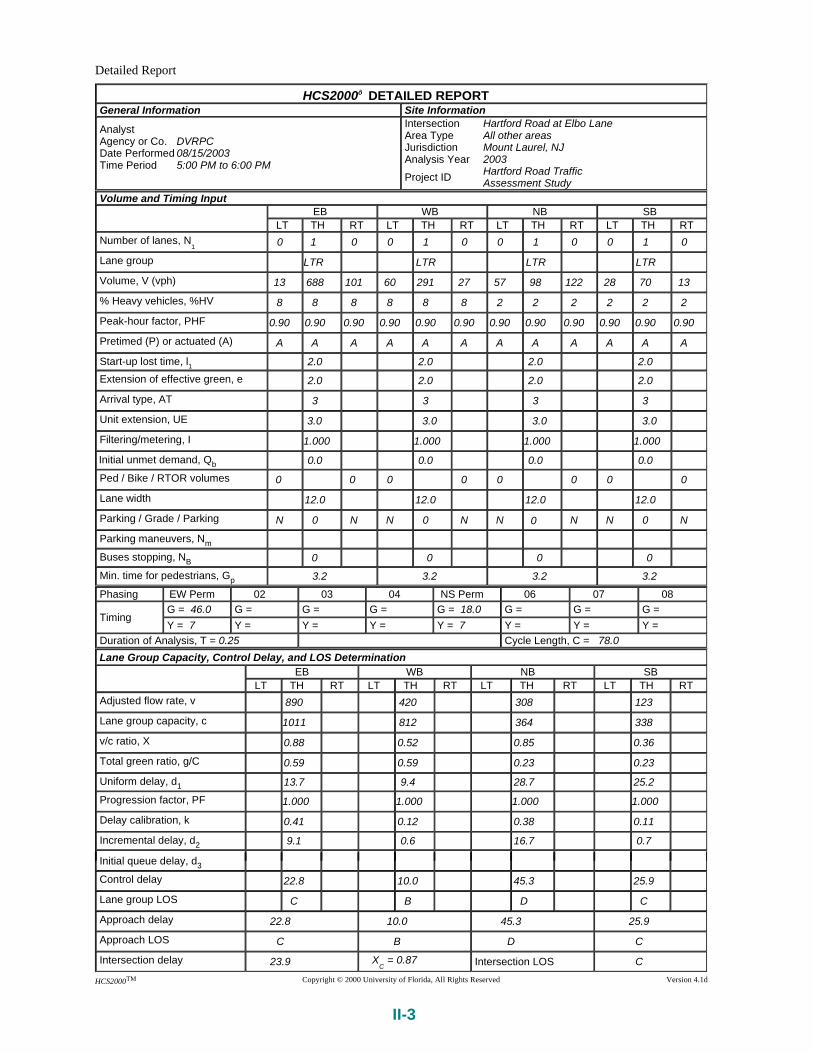
II-3
HCS2000ô DETAILED REPORTGeneral Information Site Information
Analyst Agency or Co. DVRPC Date Performed 08/15/2003 Time Period 5:00 PM to 6:00 PM
Intersection Hartford Road at Elbo Lane Area Type All other areas Jurisdiction Mount Laurel, NJ Analysis Year 2003
Project ID Hartford Road Traffic Assessment Study
Volume and Timing InputEB WB NB SB
LT TH RT LT TH RT LT TH RT LT TH RT Number of lanes, N
1 0 1 0 0 1 0 0 1 0 0 1 0
Lane group LTR LTR LTR LTR
Volume, V (vph) 13 688 101 60 291 27 57 98 122 28 70 13
% Heavy vehicles, %HV 8 8 8 8 8 8 2 2 2 2 2 2
Peak-hour factor, PHF 0.90 0.90 0.90 0.90 0.90 0.90 0.90 0.90 0.90 0.90 0.90 0.90
Pretimed (P) or actuated (A) A A A A A A A A A A A A
Start-up lost time, l1 2.0 2.0 2.0 2.0
Extension of effective green, e 2.0 2.0 2.0 2.0
Arrival type, AT 3 3 3 3
Unit extension, UE 3.0 3.0 3.0 3.0
Filtering/metering, I 1.000 1.000 1.000 1.000
Initial unmet demand, Qb 0.0 0.0 0.0 0.0
Ped / Bike / RTOR volumes 0 0 0 0 0 0 0 0
Lane width 12.0 12.0 12.0 12.0
Parking / Grade / Parking N 0 N N 0 N N 0 N N 0 N
Parking maneuvers, Nm
Buses stopping, NB 0 0 0 0
Min. time for pedestrians, Gp 3.2 3.2 3.2 3.2
Phasing EW Perm 02 03 04 NS Perm 06 07 08
Timing G = 46.0 G = G = G = G = 18.0 G = G = G =
Y = 7 Y = Y = Y = Y = 7 Y = Y = Y = Duration of Analysis, T = 0.25 Cycle Length, C = 78.0
Lane Group Capacity, Control Delay, and LOS DeterminationEB WB NB SB
LT TH RT LT TH RT LT TH RT LT TH RT Adjusted flow rate, v 890 420 308 123
Lane group capacity, c 1011 812 364 338
v/c ratio, X 0.88 0.52 0.85 0.36
Total green ratio, g/C 0.59 0.59 0.23 0.23
Uniform delay, d1 13.7 9.4 28.7 25.2
Progression factor, PF 1.000 1.000 1.000 1.000
Delay calibration, k 0.41 0.12 0.38 0.11
Incremental delay, d2 9.1 0.6 16.7 0.7
Detailed Report
Initial queue delay, d3
Control delay 22.8 10.0 45.3 25.9
Lane group LOS C B D C
Approach delay 22.8 10.0 45.3 25.9
Approach LOS C B D C
Intersection delay 23.9 XC
= 0.87 Intersection LOS C
HCS2000TM Copyright © 2000 University of Florida, All Rights Reserved Version 4.1d

II-4
HCS2000ô DETAILED REPORTGeneral Information Site Information
Analyst Agency or Co. DVRPC Date Performed 08/15/2003 Time Period 7:30 AM to 8:30 AM
Intersection Hartford Road at Union Mill Rd
Area Type All other areas Jurisdiction Mount Laurel, NJ Analysis Year 2003
Project ID Hartford Road Traffic Assessment Study
Volume and Timing InputEB WB NB SB
LT TH RT LT TH RT LT TH RT LT TH RT Number of lanes, N
1 1 1 0 1 1 0 0 1 1 0 1 1
Lane group L TR L TR LT R LT R
Volume, V (vph) 10 363 131 270 717 41 55 136 33 36 275 48
% Heavy vehicles, %HV 12 12 12 12 12 12 2 2 2 2 2 2
Peak-hour factor, PHF 0.90 0.90 0.90 0.90 0.90 0.90 0.90 0.90 0.90 0.90 0.90 0.90
Pretimed (P) or actuated (A) A A A A A A A A A A A A
Start-up lost time, l1 2.0 2.0 2.0 2.0 2.0 2.0 2.0 2.0
Extension of effective green, e 2.0 2.0 2.0 2.0 2.0 2.0 2.0 2.0
Arrival type, AT 3 3 3 3 3 3 3 3
Unit extension, UE 3.0 3.0 3.0 3.0 3.0 3.0 3.0 3.0
Filtering/metering, I 1.000 1.000 1.000 1.000 1.000 1.000 1.000 1.000
Initial unmet demand, Qb 0.0 0.0 0.0 0.0 0.0 0.0 0.0 0.0
Ped / Bike / RTOR volumes 0 0 0 0 0 0 0 0
Lane width 12.0 12.0 12.0 12.0 12.0 12.0 12.0 12.0
Parking / Grade / Parking N 0 N N 0 N N 0 N N 0 N
Parking maneuvers, Nm
Buses stopping, NB 0 0 0 0 0 0 0 0
Min. time for pedestrians, Gp 3.2 3.2 3.2 3.2
Phasing EW Perm 02 03 04 NS Perm 06 07 08
Timing G = 55.0 G = G = G = G = 25.0 G = G = G =
Y = 6 Y = Y = Y = Y = 6 Y = Y = Y = Duration of Analysis, T = 0.25 Cycle Length, C = 92.0
Lane Group Capacity, Control Delay, and LOS DeterminationEB WB NB SB
LT TH RT LT TH RT LT TH RT LT TH RT Adjusted flow rate, v 11 549 300 843 212 37 346 53
Lane group capacity, c 183 974 379 1006 237 430 430 430
v/c ratio, X 0.06 0.56 0.79 0.84 0.89 0.09 0.80 0.12
Total green ratio, g/C 0.60 0.60 0.60 0.60 0.27 0.27 0.27 0.27
Uniform delay, d1 7.7 11.2 14.1 14.9 32.2 25.0 31.2 25.2
Progression factor, PF 1.000 1.000 1.000 1.000 1.000 1.000 1.000 1.000
Delay calibration, k 0.11 0.16 0.34 0.37 0.42 0.11 0.35 0.11
0.1 0.8 10.9 6.4 32.1 0.1 10.7 0.1
Detailed Report
Incremental delay, d2
Initial queue delay, d3
Control delay 7.9 12.0 25.0 21.3 64.3 25.1 41.9 25.4
Lane group LOS A B C C E C D C
Approach delay 11.9 22.3 58.5 39.7
Approach LOS B C E D
Intersection delay 26.6 XC
= 0.86 Intersection LOS C
HCS2000TM Copyright © 2000 University of Florida, All Rights Reserved Version 4.1d
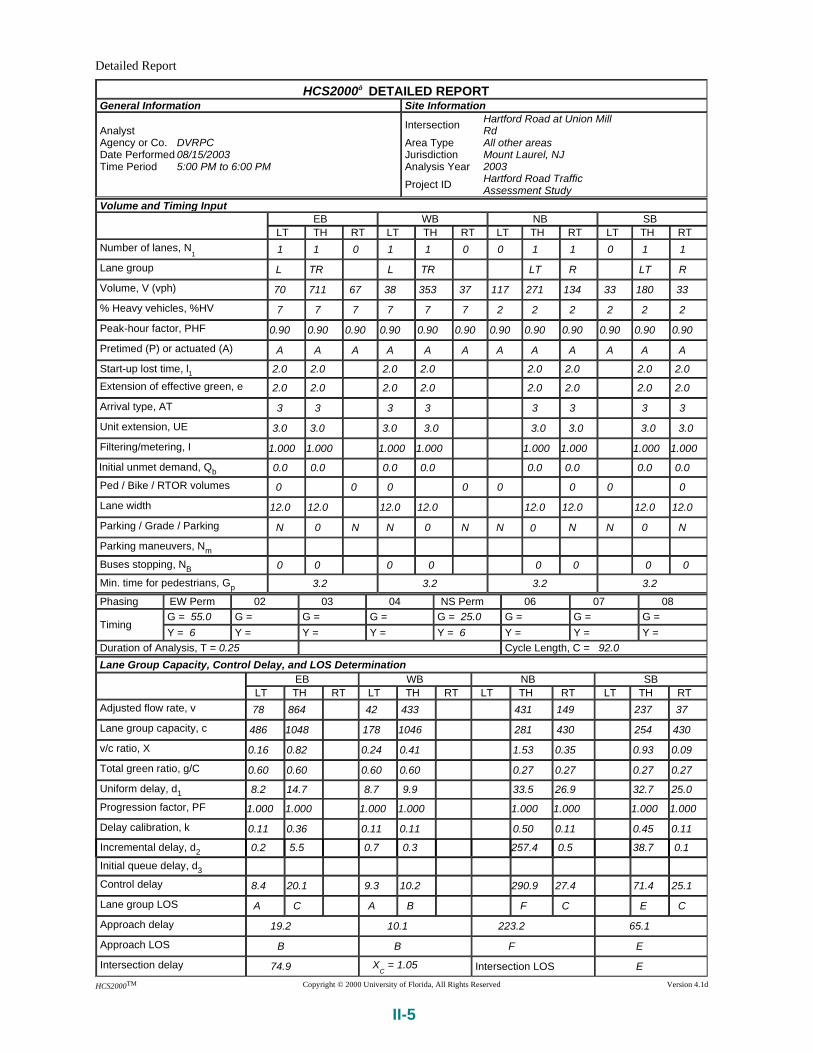
II-5
HCS2000ô DETAILED REPORTGeneral Information Site Information
Analyst Agency or Co. DVRPC Date Performed 08/15/2003 Time Period 5:00 PM to 6:00 PM
Intersection Hartford Road at Union Mill Rd
Area Type All other areas Jurisdiction Mount Laurel, NJ Analysis Year 2003
Project ID Hartford Road Traffic Assessment Study
Volume and Timing InputEB WB NB SB
LT TH RT LT TH RT LT TH RT LT TH RT Number of lanes, N
1 1 1 0 1 1 0 0 1 1 0 1 1
Lane group L TR L TR LT R LT R
Volume, V (vph) 70 711 67 38 353 37 117 271 134 33 180 33
% Heavy vehicles, %HV 7 7 7 7 7 7 2 2 2 2 2 2
Peak-hour factor, PHF 0.90 0.90 0.90 0.90 0.90 0.90 0.90 0.90 0.90 0.90 0.90 0.90
Pretimed (P) or actuated (A) A A A A A A A A A A A A
Start-up lost time, l1 2.0 2.0 2.0 2.0 2.0 2.0 2.0 2.0
Extension of effective green, e 2.0 2.0 2.0 2.0 2.0 2.0 2.0 2.0
Arrival type, AT 3 3 3 3 3 3 3 3
Unit extension, UE 3.0 3.0 3.0 3.0 3.0 3.0 3.0 3.0
Filtering/metering, I 1.000 1.000 1.000 1.000 1.000 1.000 1.000 1.000
Initial unmet demand, Qb 0.0 0.0 0.0 0.0 0.0 0.0 0.0 0.0
Ped / Bike / RTOR volumes 0 0 0 0 0 0 0 0
Lane width 12.0 12.0 12.0 12.0 12.0 12.0 12.0 12.0
Parking / Grade / Parking N 0 N N 0 N N 0 N N 0 N
Parking maneuvers, Nm
Buses stopping, NB 0 0 0 0 0 0 0 0
Min. time for pedestrians, Gp 3.2 3.2 3.2 3.2
Phasing EW Perm 02 03 04 NS Perm 06 07 08
Timing G = 55.0 G = G = G = G = 25.0 G = G = G =
Y = 6 Y = Y = Y = Y = 6 Y = Y = Y = Duration of Analysis, T = 0.25 Cycle Length, C = 92.0
Lane Group Capacity, Control Delay, and LOS DeterminationEB WB NB SB
LT TH RT LT TH RT LT TH RT LT TH RT Adjusted flow rate, v 78 864 42 433 431 149 237 37
Lane group capacity, c 486 1048 178 1046 281 430 254 430
v/c ratio, X 0.16 0.82 0.24 0.41 1.53 0.35 0.93 0.09
Total green ratio, g/C 0.60 0.60 0.60 0.60 0.27 0.27 0.27 0.27
Uniform delay, d1 8.2 14.7 8.7 9.9 33.5 26.9 32.7 25.0
Progression factor, PF 1.000 1.000 1.000 1.000 1.000 1.000 1.000 1.000
Delay calibration, k 0.11 0.36 0.11 0.11 0.50 0.11 0.45 0.11
0.2 5.5 0.7 0.3 257.4 0.5 38.7 0.1
Detailed Report
Incremental delay, d2
Initial queue delay, d3
Control delay 8.4 20.1 9.3 10.2 290.9 27.4 71.4 25.1
Lane group LOS A C A B F C E C
Approach delay 19.2 10.1 223.2 65.1
Approach LOS B B F E
Intersection delay 74.9 XC
= 1.05 Intersection LOS E
HCS2000TM Copyright © 2000 University of Florida, All Rights Reserved Version 4.1d

II-6
HCS2000ô DETAILED REPORTGeneral Information Site Information
Analyst Keith Hartington Agency or Co. DVRPC Date Performed 08/15/2003 Time Period 7:30 AM to 8:30 AM
Intersection Hartford Rd at Borton Landing
Area Type All other areas Jurisdiction Moorestown Twp Analysis Year 2003
Project ID Hartford Road Traffic Assessment Study
Volume and Timing InputEB WB NB SB
LT TH RT LT TH RT LT TH RT LT TH RT Number of lanes, N
1 0 1 0 0 1 0 0 1 0 0 1 0
Lane group LTR LTR LTR LTR
Volume, V (vph) 15 443 162 38 337 7 45 55 32 17 139 35
% Heavy vehicles, %HV 8 8 8 8 8 8 2 2 2 2 2 2
Peak-hour factor, PHF 0.90 0.90 0.90 0.90 0.90 0.90 0.90 0.90 0.90 0.90 0.90 0.90
Pretimed (P) or actuated (A) P P P P P P A A A A A A
Start-up lost time, l1 2.0 2.0 2.0 2.0
Extension of effective green, e 2.0 2.0 2.0 2.0
Arrival type, AT 3 3 3 3
Unit extension, UE 3.0 3.0 3.0 3.0
Filtering/metering, I 1.000 1.000 1.000 1.000
Initial unmet demand, Qb 0.0 0.0 0.0 0.0
Ped / Bike / RTOR volumes 0 0 0 0 0 0 0 0
Lane width 12.0 12.0 12.0 12.0
Parking / Grade / Parking N 0 N N 0 N N 0 N N 0 N
Parking maneuvers, Nm
Buses stopping, NB 0 0 0 0
Min. time for pedestrians, Gp 3.2 3.2 3.2 3.2
Phasing EW Perm 02 03 04 NS Perm 06 07 08
Timing G = 50.0 G = G = G = G = 12.0 G = G = G =
Y = 7 Y = Y = Y = Y = 6 Y = Y = Y = Duration of Analysis, T = 0.25 Cycle Length, C = 75.0
Lane Group Capacity, Control Delay, and LOS DeterminationEB WB NB SB
LT TH RT LT TH RT LT TH RT LT TH RT Adjusted flow rate, v 689 424 147 212
Lane group capacity, c 1116 1050 197 280
v/c ratio, X 0.62 0.40 0.75 0.76
Total green ratio, g/C 0.67 0.67 0.16 0.16
Uniform delay, d1 7.1 5.7 30.0 30.1
Progression factor, PF 1.000 1.000 1.000 1.000
Delay calibration, k 0.50 0.50 0.30 0.31
2.6 1.2 14.4 11.3
Page 1 of 2Detailed Report
Incremental delay, d2
Initial queue delay, d3
Control delay 9.6 6.9 44.5 41.4
Lane group LOS A A D D
Approach delay 9.6 6.9 44.5 41.4
Approach LOS A A D D
Intersection delay 16.9 XC
= 0.64 Intersection LOS B
HCS2000TM Copyright © 2000 University of Florida, All Rights Reserved Version 4.1d
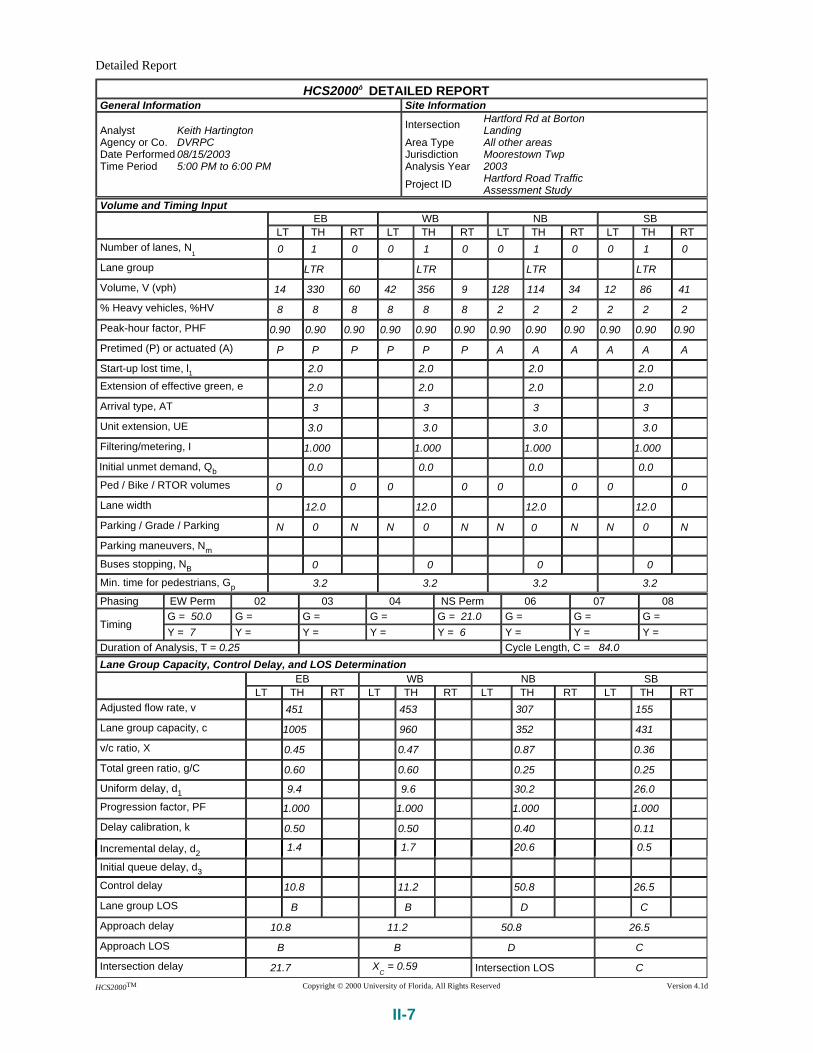
II-7
HCS2000ô DETAILED REPORTGeneral Information Site Information
Analyst Keith Hartington Agency or Co. DVRPC Date Performed 08/15/2003 Time Period 5:00 PM to 6:00 PM
Intersection Hartford Rd at Borton Landing
Area Type All other areas Jurisdiction Moorestown Twp Analysis Year 2003
Project ID Hartford Road Traffic Assessment Study
Volume and Timing InputEB WB NB SB
LT TH RT LT TH RT LT TH RT LT TH RT Number of lanes, N
1 0 1 0 0 1 0 0 1 0 0 1 0
Lane group LTR LTR LTR LTR
Volume, V (vph) 14 330 60 42 356 9 128 114 34 12 86 41
% Heavy vehicles, %HV 8 8 8 8 8 8 2 2 2 2 2 2
Peak-hour factor, PHF 0.90 0.90 0.90 0.90 0.90 0.90 0.90 0.90 0.90 0.90 0.90 0.90
Pretimed (P) or actuated (A) P P P P P P A A A A A A
Start-up lost time, l1 2.0 2.0 2.0 2.0
Extension of effective green, e 2.0 2.0 2.0 2.0
Arrival type, AT 3 3 3 3
Unit extension, UE 3.0 3.0 3.0 3.0
Filtering/metering, I 1.000 1.000 1.000 1.000
Initial unmet demand, Qb 0.0 0.0 0.0 0.0
Ped / Bike / RTOR volumes 0 0 0 0 0 0 0 0
Lane width 12.0 12.0 12.0 12.0
Parking / Grade / Parking N 0 N N 0 N N 0 N N 0 N
Parking maneuvers, Nm
Buses stopping, NB 0 0 0 0
Min. time for pedestrians, Gp 3.2 3.2 3.2 3.2
Phasing EW Perm 02 03 04 NS Perm 06 07 08
Timing G = 50.0 G = G = G = G = 21.0 G = G = G =
Y = 7 Y = Y = Y = Y = 6 Y = Y = Y = Duration of Analysis, T = 0.25 Cycle Length, C = 84.0
Lane Group Capacity, Control Delay, and LOS DeterminationEB WB NB SB
LT TH RT LT TH RT LT TH RT LT TH RT Adjusted flow rate, v 451 453 307 155
Lane group capacity, c 1005 960 352 431
v/c ratio, X 0.45 0.47 0.87 0.36
Total green ratio, g/C 0.60 0.60 0.25 0.25
Uniform delay, d1 9.4 9.6 30.2 26.0
Progression factor, PF 1.000 1.000 1.000 1.000
Delay calibration, k 0.50 0.50 0.40 0.11
1.4 1.7 20.6 0.5
Detailed Report
Incremental delay, d2
Initial queue delay, d3
Control delay 10.8 11.2 50.8 26.5
Lane group LOS B B D C
Approach delay 10.8 11.2 50.8 26.5
Approach LOS B B D C
Intersection delay 21.7 XC
= 0.59 Intersection LOS C
HCS2000TM Copyright © 2000 University of Florida, All Rights Reserved Version 4.1d


III-1
APPENDIX III
Modified Intersection Level of Service

III-2
HCS2000ô DETAILED REPORTGeneral Information Site Information
Analyst Agency or Co. DVRPC Date Performed 08/15/2003 Time Period 7:30 AM to 8:30 AM
Intersection Hartford Rd at Borton Landing
Area Type All other areas Jurisdiction Moorestown Twp Analysis Year 2003
Project ID Hartford Road Traffic Assessment Study
Volume and Timing InputEB WB NB SB
LT TH RT LT TH RT LT TH RT LT TH RT Number of lanes, N
1 0 1 0 0 1 0 1 1 0 0 1 0
Lane group LTR LTR L TR LTR
Volume, V (vph) 15 443 162 38 337 7 45 55 32 17 139 35
% Heavy vehicles, %HV 8 8 8 8 8 8 2 2 2 2 2 2
Peak-hour factor, PHF 0.90 0.90 0.90 0.90 0.90 0.90 0.90 0.90 0.90 0.90 0.90 0.90
Pretimed (P) or actuated (A) P P P P P P A A A A A A
Start-up lost time, l1 2.0 2.0 2.0 2.0 2.0
Extension of effective green, e 2.0 2.0 2.0 2.0 2.0
Arrival type, AT 3 3 3 3 3
Unit extension, UE 3.0 3.0 3.0 3.0 3.0
Filtering/metering, I 1.000 1.000 1.000 1.000 1.000
Initial unmet demand, Qb 0.0 0.0 0.0 0.0 0.0
Ped / Bike / RTOR volumes 0 0 0 0 0 0 0 0
Lane width 12.0 12.0 12.0 12.0 12.0
Parking / Grade / Parking N 0 N N 0 N N 0 N N 0 N
Parking maneuvers, Nm
Buses stopping, NB 0 0 0 0 0
Min. time for pedestrians, Gp 3.2 3.2 3.2 3.2
Phasing EW Perm 02 03 04 NB Only NS Perm 07 08
Timing G = 50.0 G = G = G = G = 6.0 G = 14.0 G = G =
Y = 7 Y = Y = Y = Y = 4 Y = 6 Y = Y = Duration of Analysis, T = 0.25 Cycle Length, C = 87.0
Lane Group Capacity, Control Delay, and LOS DeterminationEB WB NB SB
LT TH RT LT TH RT LT TH RT LT TH RT Adjusted flow rate, v 689 424 50 97 212
Lane group capacity, c 961 900 231 283 281
v/c ratio, X 0.72 0.47 0.22 0.34 0.75
Total green ratio, g/C 0.57 0.57 0.28 0.16 0.16
Uniform delay, d1 13.4 10.8 24.6 32.4 34.9
Progression factor, PF 1.000 1.000 1.000 1.000 1.000
Delay calibration, k 0.50 0.50 0.11 0.11 0.31
4.6 1.8 0.5 0.7 11.0
Detailed Report
Incremental delay, d2
Initial queue delay, d3
Control delay 18.0 12.6 25.1 33.1 45.9
Lane group LOS B B C C D
Approach delay 18.0 12.6 30.4 45.9
Approach LOS B B C D
Intersection delay 21.7 XC
= 0.72 Intersection LOS C
HCS2000TM Copyright © 2000 University of Florida, All Rights Reserved Version 4.1d

III-3
HCS2000ô DETAILED REPORTGeneral Information Site Information
Analyst Agency or Co. DVRPC Date Performed 08/15/2003 Time Period 5:00 PM to 6:00 PM
Intersection Hartford Rd at Borton Landing
Area Type All other areas Jurisdiction Moorestown Twp Analysis Year 2003
Project ID Hartford Road Traffic Assessment Study
Volume and Timing InputEB WB NB SB
LT TH RT LT TH RT LT TH RT LT TH RT Number of lanes, N
1 0 1 0 0 1 0 1 1 0 0 1 0
Lane group LTR LTR L TR LTR
Volume, V (vph) 14 330 60 42 356 9 128 114 34 12 86 41
% Heavy vehicles, %HV 8 8 8 8 8 8 2 2 2 2 2 2
Peak-hour factor, PHF 0.90 0.90 0.90 0.90 0.90 0.90 0.90 0.90 0.90 0.90 0.90 0.90
Pretimed (P) or actuated (A) P P P P P P A A A A A A
Start-up lost time, l1 2.0 2.0 2.0 2.0 2.0
Extension of effective green, e 2.0 2.0 2.0 2.0 2.0
Arrival type, AT 3 3 3 3 3
Unit extension, UE 3.0 3.0 3.0 3.0 3.0
Filtering/metering, I 1.000 1.000 1.000 1.000 1.000
Initial unmet demand, Qb 0.0 0.0 0.0 0.0 0.0
Ped / Bike / RTOR volumes 0 0 0 0 0 0 0 0
Lane width 12.0 12.0 12.0 12.0 12.0
Parking / Grade / Parking N 0 N N 0 N N 0 N N 0 N
Parking maneuvers, Nm
Buses stopping, NB 0 0 0 0 0
Min. time for pedestrians, Gp 3.2 3.2 3.2 3.2
Phasing EW Perm 02 03 04 NB Only NS Perm 07 08
Timing G = 50.0 G = G = G = G = 6.0 G = 21.0 G = G =
Y = 7 Y = Y = Y = Y = 4 Y = 6 Y = Y = Duration of Analysis, T = 0.25 Cycle Length, C = 94.0
Lane Group Capacity, Control Delay, and LOS DeterminationEB WB NB SB
LT TH RT LT TH RT LT TH RT LT TH RT Adjusted flow rate, v 451 453 142 165 155
Lane group capacity, c 897 855 344 402 387
v/c ratio, X 0.50 0.53 0.41 0.41 0.40
Total green ratio, g/C 0.53 0.53 0.33 0.22 0.22
Uniform delay, d1 14.1 14.3 23.7 31.2 31.1
Progression factor, PF 1.000 1.000 1.000 1.000 1.000
Delay calibration, k 0.50 0.50 0.11 0.11 0.11
2.0 2.3 0.8 0.7 0.7
Detailed Report
Incremental delay, d2
Initial queue delay, d3
Control delay 16.1 16.7 24.5 31.9 31.8
Lane group LOS B B C C C
Approach delay 16.1 16.7 28.5 31.8
Approach LOS B B C C
Intersection delay 20.8 XC
= 0.55 Intersection LOS C
HCS2000TM Copyright © 2000 University of Florida, All Rights Reserved Version 4.1d

III-4
HCS2000ô DETAILED REPORTGeneral Information Site Information
Analyst Agency or Co. DVRPC Date Performed 08/14/2003 Time Period 7:30 AM to 8:30 AM
Intersection Hartford Road at Elbo Lane Area Type All other areas Jurisdiction Mount Laurel, NJ Analysis Year 2003
Project ID Hartford Road Traffic Assessment Study
Volume and Timing InputEB WB NB SB
LT TH RT LT TH RT LT TH RT LT TH RT Number of lanes, N
1 1 1 0 1 1 0 1 1 0 1 1 0
Lane group L TR L TR L TR L TR
Volume, V (vph) 6 348 31 99 593 53 45 45 103 54 90 20
% Heavy vehicles, %HV 14 14 14 14 14 14 2 2 2 2 2 2
Peak-hour factor, PHF 0.90 0.90 0.90 0.90 0.90 0.90 0.90 0.90 0.90 0.90 0.90 0.90
Pretimed (P) or actuated (A) A A A A A A A A A A A A
Start-up lost time, l1 2.0 2.0 2.0 2.0 2.0 2.0 2.0 2.0
Extension of effective green, e 2.0 2.0 2.0 2.0 2.0 2.0 2.0 2.0
Arrival type, AT 3 3 3 3 3 3 3 3
Unit extension, UE 3.0 3.0 3.0 3.0 3.0 3.0 3.0 3.0
Filtering/metering, I 1.000 1.000 1.000 1.000 1.000 1.000 1.000 1.000
Initial unmet demand, Qb 0.0 0.0 0.0 0.0 0.0 0.0 0.0 0.0
Ped / Bike / RTOR volumes 0 0 0 0 0 0 0 0
Lane width 12.0 12.0 12.0 12.0 12.0 12.0 12.0 12.0
Parking / Grade / Parking N 0 N N 0 N N 0 N N 0 N
Parking maneuvers, Nm
Buses stopping, NB 0 0 0 0 0 0 0 0
Min. time for pedestrians, Gp 3.2 3.2 3.2 3.2
Phasing EW Perm 02 03 04 NS Perm 06 07 08
Timing G = 55.0 G = G = G = G = 19.0 G = G = G =
Y = 7 Y = Y = Y = Y = 7 Y = Y = Y = Duration of Analysis, T = 0.25 Cycle Length, C = 88.0
Lane Group Capacity, Control Delay, and LOS DeterminationEB WB NB SB
LT TH RT LT TH RT LT TH RT LT TH RT Adjusted flow rate, v 7 421 110 718 50 164 60 122
Lane group capacity, c 298 1029 508 1029 273 360 263 391
v/c ratio, X 0.02 0.41 0.22 0.70 0.18 0.46 0.23 0.31
Total green ratio, g/C 0.63 0.63 0.63 0.63 0.22 0.22 0.22 0.22
Uniform delay, d1 6.3 8.3 7.2 11.0 28.2 30.0 28.5 29.0
Progression factor, PF 1.000 1.000 1.000 1.000 1.000 1.000 1.000 1.000
Delay calibration, k 0.11 0.11 0.11 0.26 0.11 0.11 0.11 0.11
Incremental delay, d2 0.0 0.3 0.2 2.1 0.3 0.9 0.4 0.5
Detailed Report
Initial queue delay, d3
Control delay 6.3 8.6 7.4 13.1 28.5 30.9 28.9 29.5
Lane group LOS A A A B C C C C
Approach delay 8.5 12.3 30.4 29.3
Approach LOS A B C C
Intersection delay 15.5 XC
= 0.64 Intersection LOS B
HCS2000TM Copyright © 2000 University of Florida, All Rights Reserved Version 4.1d

III-5
HCS2000ô DETAILED REPORTGeneral Information Site Information
Analyst Agency or Co. DVRPC Date Performed 08/15/2003 Time Period 5:00 PM to 6:00 PM
Intersection Hartford Road at Elbo Lane Area Type All other areas Jurisdiction Mount Laurel, NJ Analysis Year 2003
Project ID Hartford Road Traffic Assessment Study
Volume and Timing InputEB WB NB SB
LT TH RT LT TH RT LT TH RT LT TH RT Number of lanes, N
1 1 1 0 1 1 0 1 1 0 1 1 0
Lane group L TR L TR L TR L TR
Volume, V (vph) 13 688 101 60 291 27 57 98 122 28 70 13
% Heavy vehicles, %HV 8 8 8 8 8 8 2 2 2 2 2 2
Peak-hour factor, PHF 0.90 0.90 0.90 0.90 0.90 0.90 0.90 0.90 0.90 0.90 0.90 0.90
Pretimed (P) or actuated (A) A A A A A A A A A A A A
Start-up lost time, l1 2.0 2.0 2.0 2.0 2.0 2.0 2.0 2.0
Extension of effective green, e 2.0 2.0 2.0 2.0 2.0 2.0 2.0 2.0
Arrival type, AT 3 3 3 3 3 3 3 3
Unit extension, UE 3.0 3.0 3.0 3.0 3.0 3.0 3.0 3.0
Filtering/metering, I 1.000 1.000 1.000 1.000 1.000 1.000 1.000 1.000
Initial unmet demand, Qb 0.0 0.0 0.0 0.0 0.0 0.0 0.0 0.0
Ped / Bike / RTOR volumes 0 0 0 0 0 0 0 0
Lane width 12.0 12.0 12.0 12.0 12.0 12.0 12.0 12.0
Parking / Grade / Parking N 0 N N 0 N N 0 N N 0 N
Parking maneuvers, Nm
Buses stopping, NB 0 0 0 0 0 0 0 0
Min. time for pedestrians, Gp 3.2 3.2 3.2 3.2
Phasing EW Perm 02 03 04 NS Perm 06 07 08
Timing G = 46.0 G = G = G = G = 18.0 G = G = G =
Y = 7 Y = Y = Y = Y = 7 Y = Y = Y = Duration of Analysis, T = 0.25 Cycle Length, C = 78.0
Lane Group Capacity, Control Delay, and LOS DeterminationEB WB NB SB
LT TH RT LT TH RT LT TH RT LT TH RT Adjusted flow rate, v 14 876 67 353 63 245 31 92
Lane group capacity, c 560 1018 173 1024 300 394 225 420
v/c ratio, X 0.03 0.86 0.39 0.34 0.21 0.62 0.14 0.22
Total green ratio, g/C 0.59 0.59 0.59 0.59 0.23 0.23 0.23 0.23
Uniform delay, d1 6.7 13.3 8.5 8.2 24.3 26.9 23.8 24.3
Progression factor, PF 1.000 1.000 1.000 1.000 1.000 1.000 1.000 1.000
Delay calibration, k 0.11 0.39 0.11 0.11 0.11 0.21 0.11 0.11
Incremental delay, d2 0.0 7.6 1.4 0.2 0.4 3.0 0.3 0.3
Detailed Report
Initial queue delay, d3
Control delay 6.7 20.9 9.9 8.4 24.6 30.0 24.1 24.6
Lane group LOS A C A A C C C C
Approach delay 20.7 8.7 28.9 24.5
Approach LOS C A C C
Intersection delay 19.5 XC
= 0.79 Intersection LOS B
HCS2000TM Copyright © 2000 University of Florida, All Rights Reserved Version 4.1d

III-6
HCS2000ô DETAILED REPORTGeneral Information Site Information
Analyst Agency or Co. DVRPC Date Performed 08/15/2003 Time Period 7:30 AM to 8:30 AM
Intersection Hartford Road at Union Mill Rd
Area Type All other areas Jurisdiction Mount Laurel, NJ Analysis Year 2003
Project ID Hartford Road Traffic Assessment Study
Volume and Timing InputEB WB NB SB
LT TH RT LT TH RT LT TH RT LT TH RT Number of lanes, N
1 1 1 0 1 1 0 1 1 0 1 1 0
Lane group L TR L TR L TR L TR
Volume, V (vph) 10 363 131 270 717 41 55 136 33 36 275 48
% Heavy vehicles, %HV 12 12 12 12 12 12 2 2 2 2 2 2
Peak-hour factor, PHF 0.90 0.90 0.90 0.90 0.90 0.90 0.90 0.90 0.90 0.90 0.90 0.90
Pretimed (P) or actuated (A) A A A A A A A A A A A A
Start-up lost time, l1 2.0 2.0 2.0 2.0 2.0 2.0 2.0 2.0
Extension of effective green, e 2.0 2.0 2.0 2.0 2.0 2.0 2.0 2.0
Arrival type, AT 3 3 3 3 3 3 3 3
Unit extension, UE 3.0 3.0 3.0 3.0 3.0 3.0 3.0 3.0
Filtering/metering, I 1.000 1.000 1.000 1.000 1.000 1.000 1.000 1.000
Initial unmet demand, Qb 0.0 0.0 0.0 0.0 0.0 0.0 0.0 0.0
Ped / Bike / RTOR volumes 0 0 0 0 0 0 0 0
Lane width 12.0 12.0 12.0 12.0 12.0 12.0 12.0 12.0
Parking / Grade / Parking N 0 N N 0 N N 0 N N 0 N
Parking maneuvers, Nm
Buses stopping, NB 0 0 0 0 0 0 0 0
Min. time for pedestrians, Gp 3.2 3.2 3.2 3.2
Phasing EW Perm 02 03 04 NS Perm 06 07 08
Timing G = 55.0 G = G = G = G = 25.0 G = G = G =
Y = 6 Y = Y = Y = Y = 6 Y = Y = Y = Duration of Analysis, T = 0.25 Cycle Length, C = 92.0
Lane Group Capacity, Control Delay, and LOS DeterminationEB WB NB SB
LT TH RT LT TH RT LT TH RT LT TH RT Adjusted flow rate, v 11 549 300 843 61 188 40 359
Lane group capacity, c 183 974 379 1006 158 491 300 495
v/c ratio, X 0.06 0.56 0.79 0.84 0.39 0.38 0.13 0.73
Total green ratio, g/C 0.60 0.60 0.60 0.60 0.27 0.27 0.27 0.27
Uniform delay, d1 7.7 11.2 14.1 14.9 27.3 27.2 25.3 30.4
Progression factor, PF 1.000 1.000 1.000 1.000 1.000 1.000 1.000 1.000
Delay calibration, k 0.11 0.16 0.34 0.37 0.11 0.11 0.11 0.29
0.1 0.8 10.9 6.4 1.6 0.5 0.2 5.3
Detailed Report
Incremental delay, d2
Initial queue delay, d3
Control delay 7.9 12.0 25.0 21.3 28.8 27.7 25.5 35.6
Lane group LOS A B C C C C C D
Approach delay 11.9 22.3 28.0 34.6
Approach LOS B C C C
Intersection delay 22.5 XC
= 0.80 Intersection LOS C
HCS2000TM Copyright © 2000 University of Florida, All Rights Reserved Version 4.1d
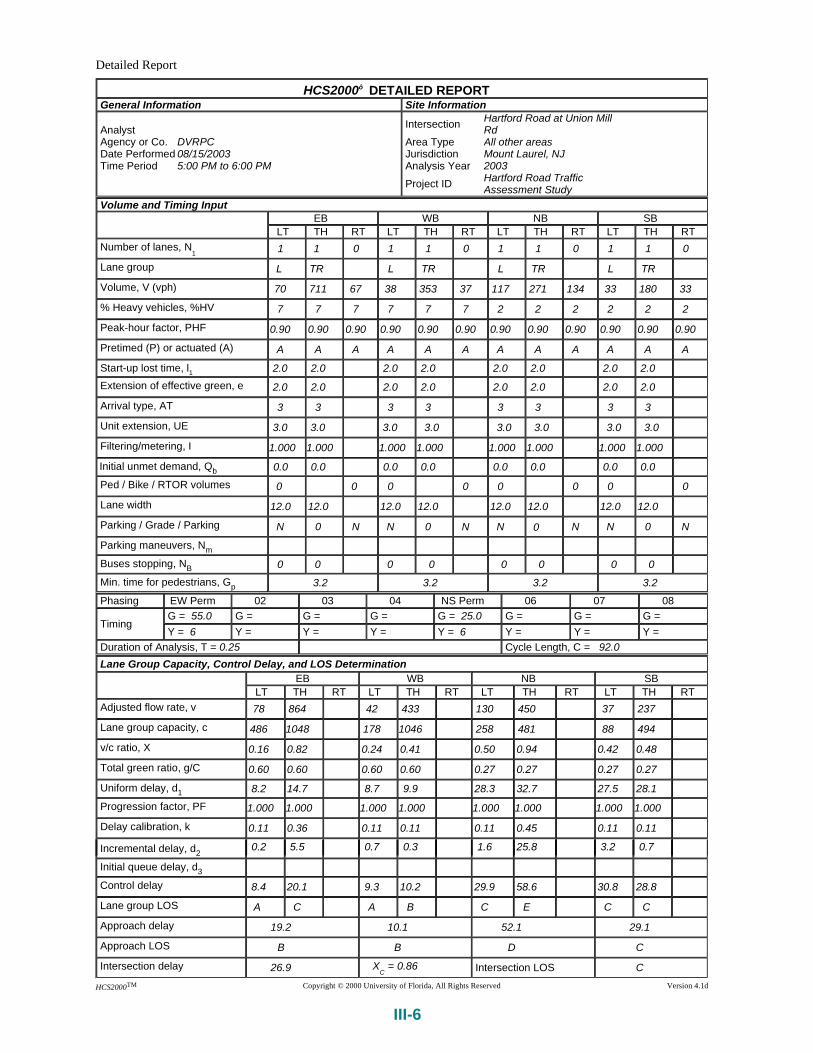
III-6
HCS2000ô DETAILED REPORTGeneral Information Site Information
Analyst Agency or Co. DVRPC Date Performed 08/15/2003 Time Period 5:00 PM to 6:00 PM
Intersection Hartford Road at Union Mill Rd
Area Type All other areas Jurisdiction Mount Laurel, NJ Analysis Year 2003
Project ID Hartford Road Traffic Assessment Study
Volume and Timing InputEB WB NB SB
LT TH RT LT TH RT LT TH RT LT TH RT Number of lanes, N
1 1 1 0 1 1 0 1 1 0 1 1 0
Lane group L TR L TR L TR L TR
Volume, V (vph) 70 711 67 38 353 37 117 271 134 33 180 33
% Heavy vehicles, %HV 7 7 7 7 7 7 2 2 2 2 2 2
Peak-hour factor, PHF 0.90 0.90 0.90 0.90 0.90 0.90 0.90 0.90 0.90 0.90 0.90 0.90
Pretimed (P) or actuated (A) A A A A A A A A A A A A
Start-up lost time, l1 2.0 2.0 2.0 2.0 2.0 2.0 2.0 2.0
Extension of effective green, e 2.0 2.0 2.0 2.0 2.0 2.0 2.0 2.0
Arrival type, AT 3 3 3 3 3 3 3 3
Unit extension, UE 3.0 3.0 3.0 3.0 3.0 3.0 3.0 3.0
Filtering/metering, I 1.000 1.000 1.000 1.000 1.000 1.000 1.000 1.000
Initial unmet demand, Qb 0.0 0.0 0.0 0.0 0.0 0.0 0.0 0.0
Ped / Bike / RTOR volumes 0 0 0 0 0 0 0 0
Lane width 12.0 12.0 12.0 12.0 12.0 12.0 12.0 12.0
Parking / Grade / Parking N 0 N N 0 N N 0 N N 0 N
Parking maneuvers, Nm
Buses stopping, NB 0 0 0 0 0 0 0 0
Min. time for pedestrians, Gp 3.2 3.2 3.2 3.2
Phasing EW Perm 02 03 04 NS Perm 06 07 08
Timing G = 55.0 G = G = G = G = 25.0 G = G = G =
Y = 6 Y = Y = Y = Y = 6 Y = Y = Y = Duration of Analysis, T = 0.25 Cycle Length, C = 92.0
Lane Group Capacity, Control Delay, and LOS DeterminationEB WB NB SB
LT TH RT LT TH RT LT TH RT LT TH RT Adjusted flow rate, v 78 864 42 433 130 450 37 237
Lane group capacity, c 486 1048 178 1046 258 481 88 494
v/c ratio, X 0.16 0.82 0.24 0.41 0.50 0.94 0.42 0.48
Total green ratio, g/C 0.60 0.60 0.60 0.60 0.27 0.27 0.27 0.27
Uniform delay, d1 8.2 14.7 8.7 9.9 28.3 32.7 27.5 28.1
Progression factor, PF 1.000 1.000 1.000 1.000 1.000 1.000 1.000 1.000
Delay calibration, k 0.11 0.36 0.11 0.11 0.11 0.45 0.11 0.11
0.2 5.5 0.7 0.3 1.6 25.8 3.2 0.7
Detailed Report
Incremental delay, d2
Initial queue delay, d3
Control delay 8.4 20.1 9.3 10.2 29.9 58.6 30.8 28.8
Lane group LOS A C A B C E C C
Approach delay 19.2 10.1 52.1 29.1
Approach LOS B B D C
Intersection delay 26.9 XC
= 0.86 Intersection LOS C
HCS2000TM Copyright © 2000 University of Florida, All Rights Reserved Version 4.1d

IV-1
APPENDIX IV
Signal Warrant Analysis Traffic Counts
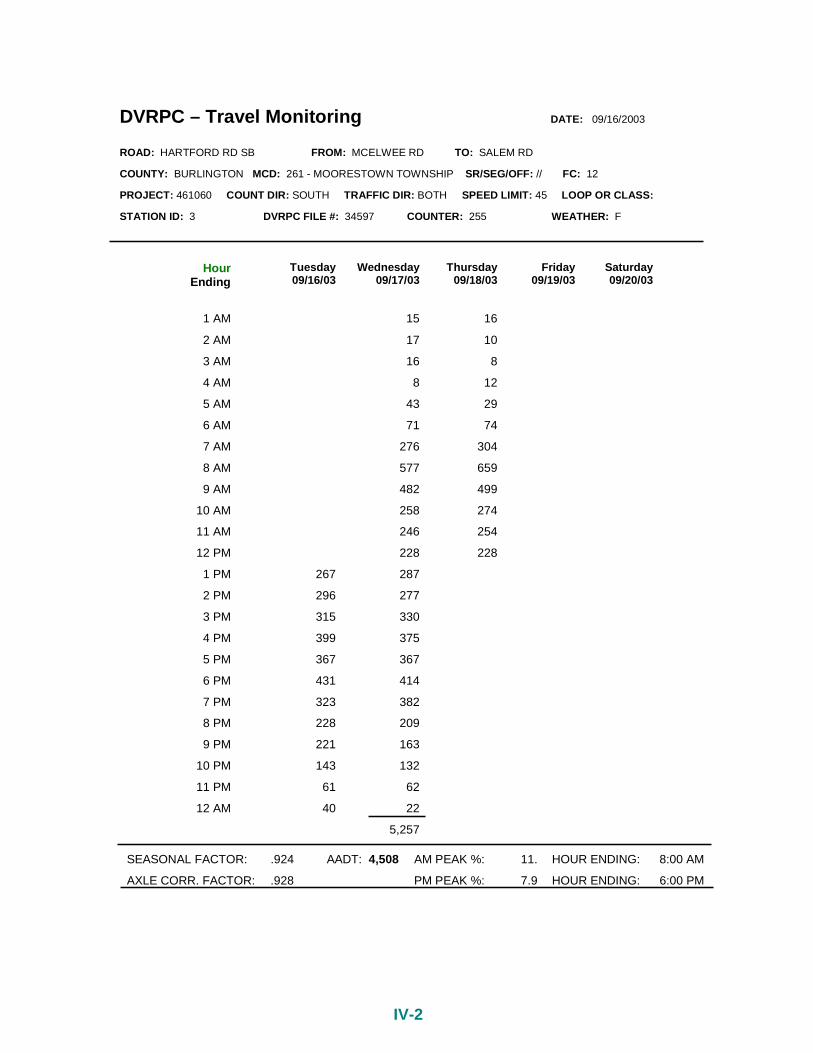
IV-2
DVRPC – Travel Monitoring DATE: 09/16/2003
ROAD: HARTFORD RD SB FROM: MCELWEE RD TO: SALEM RD COUNTY: BURLINGTON MCD: 261 - MOORESTOWN TOWNSHIP SR/SEG/OFF: // FC: 12 PROJECT: 461060 COUNT DIR: SOUTH TRAFFIC DIR: BOTH SPEED LIMIT: 45 LOOP OR CLASS: STATION ID: 3 DVRPC FILE #: 34597 COUNTER: 255 WEATHER: F
Hour Ending
Tuesday 09/16/03
Wednesday
09/17/03
Thursday
09/18/03
Friday
09/19/03
Saturday 09/20/03
1 AM
15
16
2 AM
17
10
3 AM
16
8
4 AM
8
12
5 AM
43
29
6 AM
71
74
7 AM
276
304
8 AM
577
659
9 AM
482
499
10 AM
258
274
11 AM
246
254
12 PM
228
228
1 PM
267
287
2 PM
296
277
3 PM
315
330
4 PM
399
375
5 PM
367
367
6 PM
431
414
7 PM
323
382
8 PM
228
209
9 PM
221
163
10 PM
143
132
11 PM
61
62
12 AM
40
22
5,257
SEASONAL FACTOR: .924 AADT: 4,508 AM PEAK %: 11. HOUR ENDING: 8:00 AM
AXLE CORR. FACTOR: .928 PM PEAK %: 7.9 HOUR ENDING: 6:00 PM

IV-3
DVRPC – Travel Monitoring DATE: 09/16/2003
ROAD: HARTFORD RD NB FROM: WORTHINGTON DR TO: SALEM RD COUNTY: BURLINGTON MCD: 261 - MOORESTOWN TOWNSHIP SR/SEG/OFF: // FC: 12 PROJECT: 461060 COUNT DIR: NORTH TRAFFIC DIR: BOTH SPEED LIMIT: 45 LOOP OR CLASS: STATION ID: 1 DVRPC FILE #: 34595 COUNTER: 247 WEATHER: F
Hour Ending
Tuesday 09/16/03
Wednesday
09/17/03
Thursday
09/18/03
Friday
09/19/03
Saturday 09/20/03
1 AM
26
20
2 AM
22
22
3 AM
11
4
4 AM
7
12
5 AM
22
22
6 AM
39
31
7 AM
209
218
8 AM
386
400
9 AM
299
275
10 AM
263
282
11 AM
216
220
12 PM
301
262
1 PM
308
263
2 PM
255
233
3 PM
302
326
4 PM
419
387
5 PM
454
491
6 PM
654
633
7 PM
467
424
8 PM
317
283
9 PM
224
223
10 PM
181
188
11 PM
94
83
12 AM
47
51
5,386
SEASONAL FACTOR: .924 AADT: 4,618 AM PEAK %: 7.2 HOUR ENDING: 8:00 AM
AXLE CORR. FACTOR: .928 PM PEAK %: 11.8 HOUR ENDING: 6:00 PM

IV-4
DVRPC – Travel Monitoring DATE: 09/16/2003
ROAD: SALEM RD EB FROM: AUTUMN DR TO: HARTFORD RD COUNTY: BURLINGTON MCD: 261 - MOORESTOWN TOWNSHIP SR/SEG/OFF: // FC: 12 PROJECT: 461060 COUNT DIR: EAST TRAFFIC DIR: BOTH SPEED LIMIT: 25 LOOP OR CLASS: STATION ID: 2 DVRPC FILE #: 34596 COUNTER: 9999 WEATHER: F
Hour Ending
Tuesday 09/16/03
Wednesday
09/17/03
Thursday
09/18/03
Friday
09/19/03
Saturday 09/20/03
1 AM
1
4
2 AM
1
1
3 AM
2
4 AM
1
2
5 AM
1
6 AM
10
7
7 AM
17
19
8 AM
45
45
9 AM
38
44
10 AM
24
34
11 AM
16
30
12 PM
26
30
1 PM
34
31
2 PM
20
26
3 PM
33
26
4 PM
36
37
5 PM
38
59
6 PM
82
89
7 PM
84
72
8 PM
38
33
9 PM
20
30
10 PM
10
14
11 PM
1
5
12 AM
3
2
605
SEASONAL FACTOR: .924 AADT: 519 AM PEAK %: 7.4 HOUR ENDING: 8:00 AM
AXLE CORR. FACTOR: .928 PM PEAK %: 14.7 HOUR ENDING: 6:00 PM


Title of Report: Hartford Road Traffic Assessment Study Publication No.: 04013 Date Published: April 2004 Geographic Area Covered: The study area includes or is adjacent to the following Burlington County municipalities: Moorestown Township, Mount Laurel Township. Key Words: traffic counts, intersection analysis, level of service, signal warrant, accidents, population forecast, historic preservation, drainage, pedestrian facilities, bicycle facilities ABSTRACT: This is a traffic assessment study for the section of Hartford Road in Moorestown and Mount Laurel Townships in Burlington County NJ. As development increases, there has been a corresponding increase in traffic volumes. This has led to congestion at several major intersections and arterial sections along Hartford Road. Three intersections, Hartford Road at Elbo Lane, Union Mill Road, and Borton Landing Road, were analyzed to determine their operational conditions within the traffic stream, by using Level of Service analysis. Arterial segments between Elbo Lane and Garwood Road were also studied and levels of service analyzed. A signal warrant analysis was conducted at the intersection of Hartford Road and Salem Road to determine whether peak volumes warrant the construction of a traffic signal. An improvement plan was developed which identifies necessary improvements to the highway infrastructure that would improve mobility and reduce congestion.
Delaware Valley Regional Planning Commission 8th Floor — The Bourse Building 111 South Independence Mall East Philadelphia, PA 19106-2582 Phone: 215-592-1800 Fax: 215-592-9125 Internet: www.dvrpc.org Staff contacts: Direct phone: E-mail: David Anderson, Project Coordinator 215-238-2825 [email protected] Keith Hartington, Project Planner 215-238-2852 [email protected] Kevin Murphy, Project Planner 215-238-2864 [email protected] Robert Berger, Project Planner 215-238-2845 [email protected]


![Medi-Cal Handbook Intercounty Transfer (ICT) 15 ...Intercounty Transfer (ICT) 15. Intercounty Transfer (ICT) 15.1 General Requirements [50136-50138, 50185] An Intercounty Transfer](https://static.documents.pub/doc/80x56/5f26078611cd1310f24a122e/medi-cal-handbook-intercounty-transfer-ict-15-intercounty-transfer-ict-15.jpg)


