Creating a Dashboard in OnCommand Report Yuvaraju.B, NetApp CREATING A DASHBOARD OnCommand™ Report (also called OnCommand Insight Report) provides comprehensive reporting of your NetApp® storage infrastructure. Using OnCommand Report, you can consolidate data from DataFabric® Manager or OnCommand servers and then view predesigned reports and create your own custom reports and dashboards. These reports can help you optimize your storage and improve capacity planning. This technical report provides information on how to create a custom dashboard based on the customer’s requirements.
Transcript
Creating a Dashboard in OnCommand Report
Yuvaraju.B, NetApp
CREATING A DASHBOARD
OnCommand™ Report (also called OnCommand Insight Report) provides comprehensive
reporting of your NetApp® storage infrastructure. Using OnCommand Report, you can
consolidate data from DataFabric® Manager or OnCommand servers and then view
predesigned reports and create your own custom reports and dashboards. These reports can
help you optimize your storage and improve capacity planning. This technical report provides
information on how to create a custom dashboard based on the customer’s requirements.
TABLE OF CONTENTS
1 INTRODUCTION TO ONCOMMAND REPORT .................................................................................... 3
1.1 ONCOMMAND REPORT FEATURES .......................................................................................................................3
2 DASHBOARD OPTIONS IN ONCOMMAND REPORT......................................................................... 4
2.2 CREATING A CUSTOM DASHBOARD FOR YOUR REPORTS ...............................................................................5
2.3 OTHER SAMPLE DASHBOARDS........................................................................................................................... 22
4 REFERENCES ..................................................................................................................................... 22 LIST OF FIGURES
OnCommand Report provides data center visibility to NetApp storage resources. With OnCommand Report, administrators can consolidate data from multiple DataFabric Manager or OnCommand servers.
OnCommand Report:
Identifies your NetApp storage environment.
Operates as agentless software that runs on Microsoft®
Windows®.
Enables the consolidation of data from multiple DataFabric Manager or OnCommand servers.
Displays inventory and capacity information such as growth, capacity utilization, overcommitted
capacity, deduplication effects, and space reservation.
Provides the ability to group data in reports by constructs supported by the DataFabric Manager server, for example, resource groups.
Provides information on controllers, status of controllers (for example, active-active status), and resource groups.
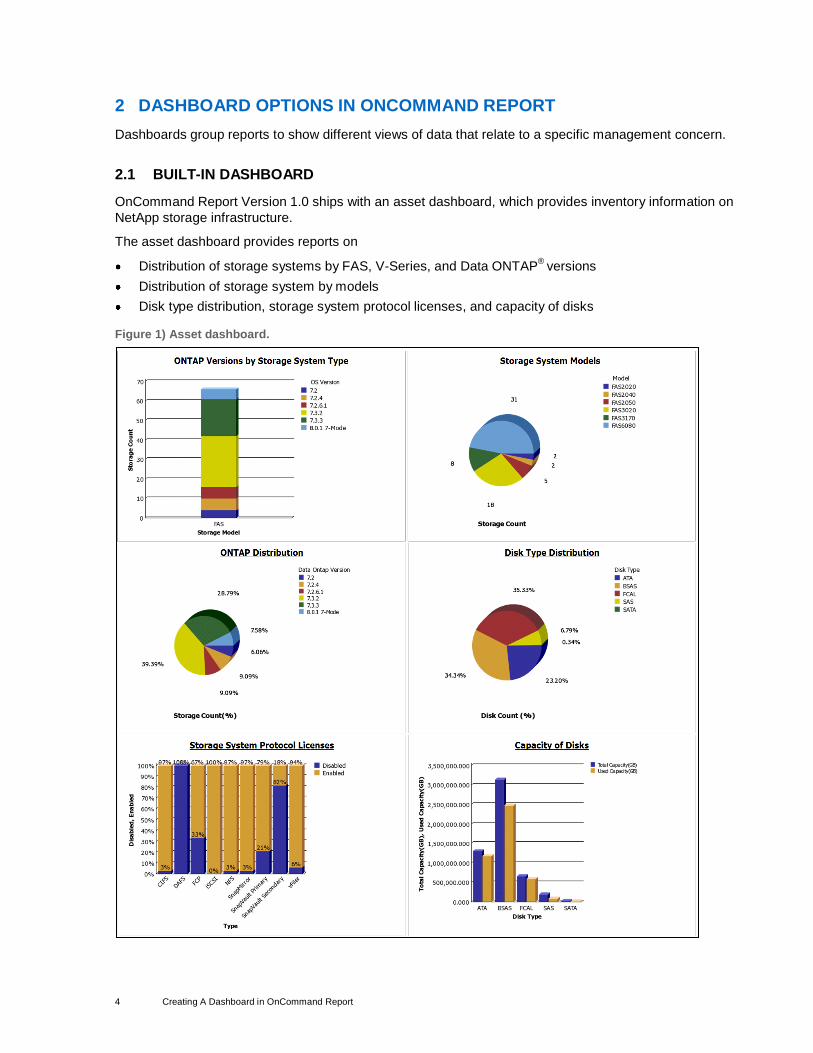
Dashboards group reports to show different views of data that relate to a specific management concern.
2.1 BUILT-IN DASHBOARD
OnCommand Report Version 1.0 ships with an asset dashboard, which provides inventory information on
NetApp storage infrastructure.
The asset dashboard provides reports on
Distribution of storage systems by FAS, V-Series, and Data ONTAP®
versions
Distribution of storage system by models
Disk type distribution, storage system protocol licenses, and capacity of disks
Figure 1) Asset dashboard.
4 Creating A Dashboard in OnCommand Report
2.2 CREATING A CUSTOM DASHBOARD FOR YOUR REPORTS
OnCommand Report provides the flexibility to create your own custom dashboard that groups reports to
show different views of data that relate to a specific management concern.
Dashboards can include predefined reports and your custom reports.
We will consider an example of creating a storage capacity and growth dashboard.
As part of this scenario, we assume that the reports have already been created and are stored in a
subfolder.
The summary of steps to create a custom dashboard:
1. Log in to OnCommand Insight Report connection.
2. Select a location where you want to place the dashboard.
3. Design the dashboard layout.
4. Select the reports to be displayed on the dashboard.
5. Add additional options in dashboard.
5 Creating A Dashboard in OnCommand Report
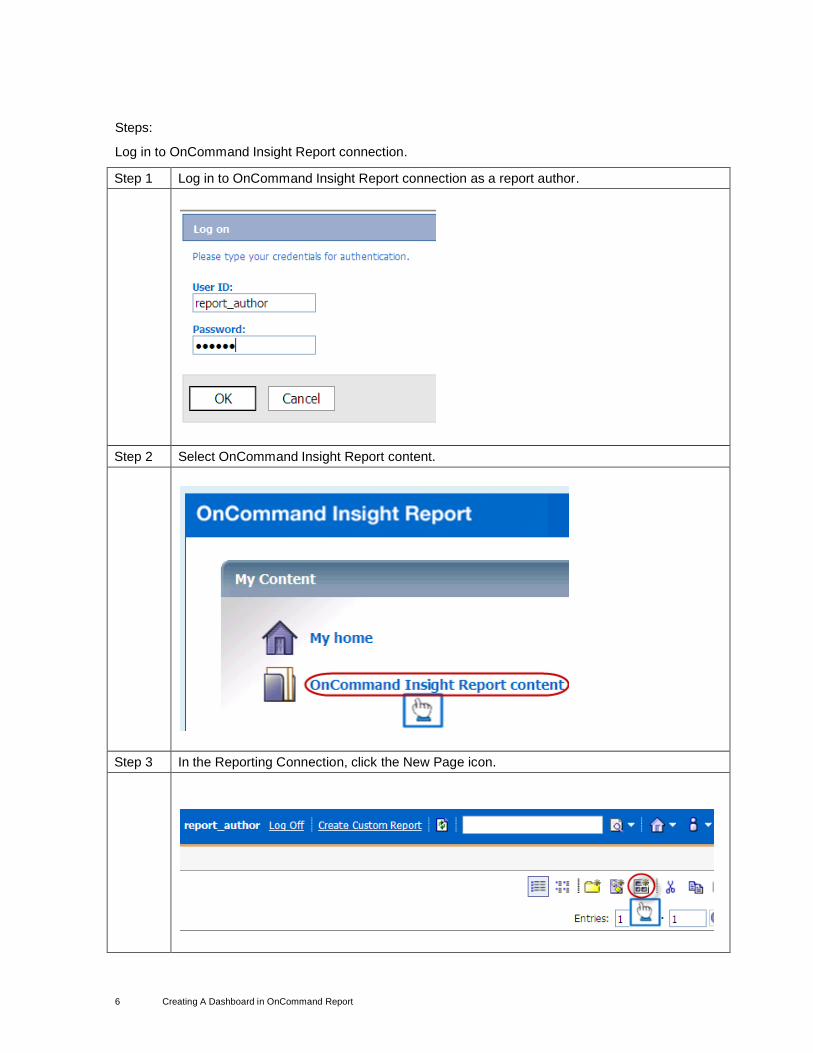
Steps:
Log in to OnCommand Insight Report connection.
Step 1 Log in to OnCommand Insight Report connection as a report author.
Step 2 Select OnCommand Insight Report content.
Step 3 In the Reporting Connection, click the New Page icon.
6 Creating A Dashboard in OnCommand Report
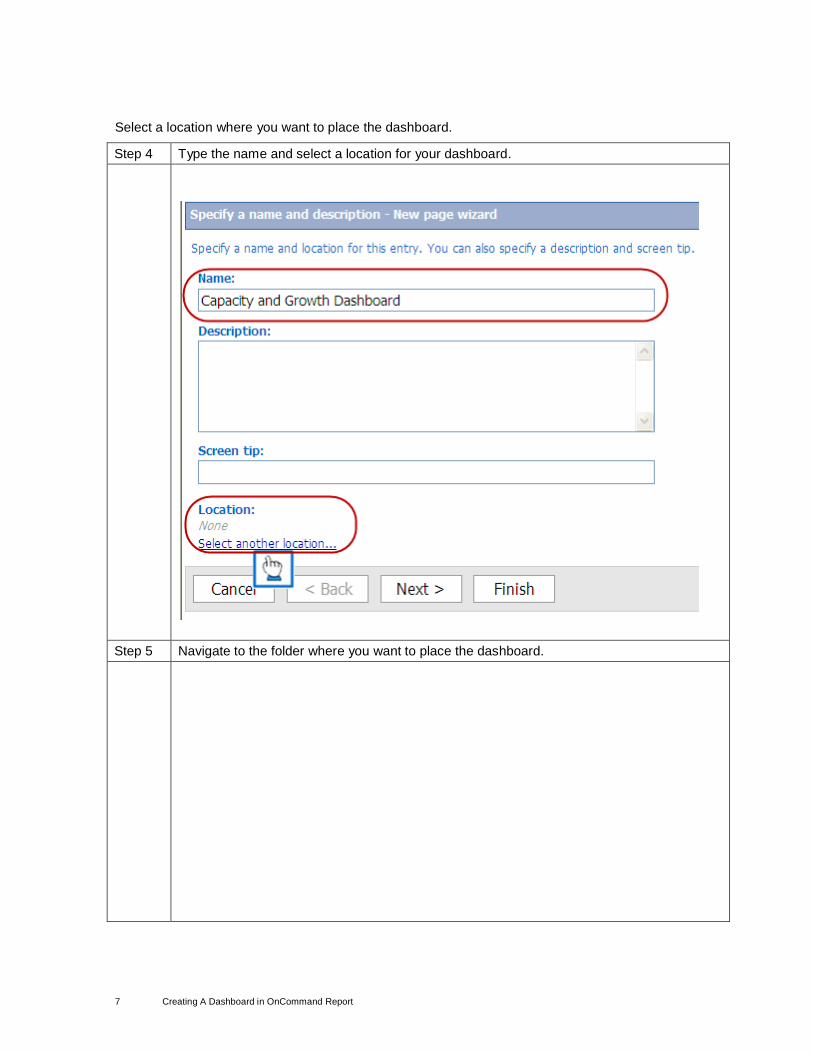
Select a location where you want to place the dashboard.
Step 4 Type the name and select a location for your dashboard.
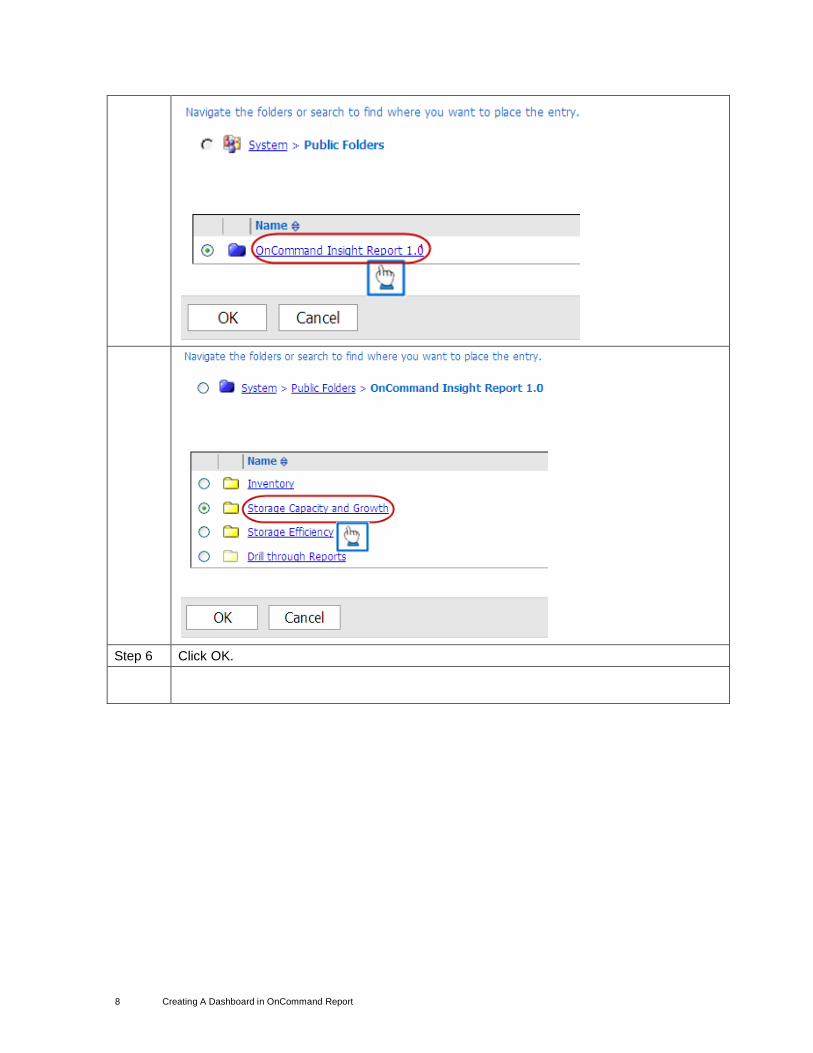
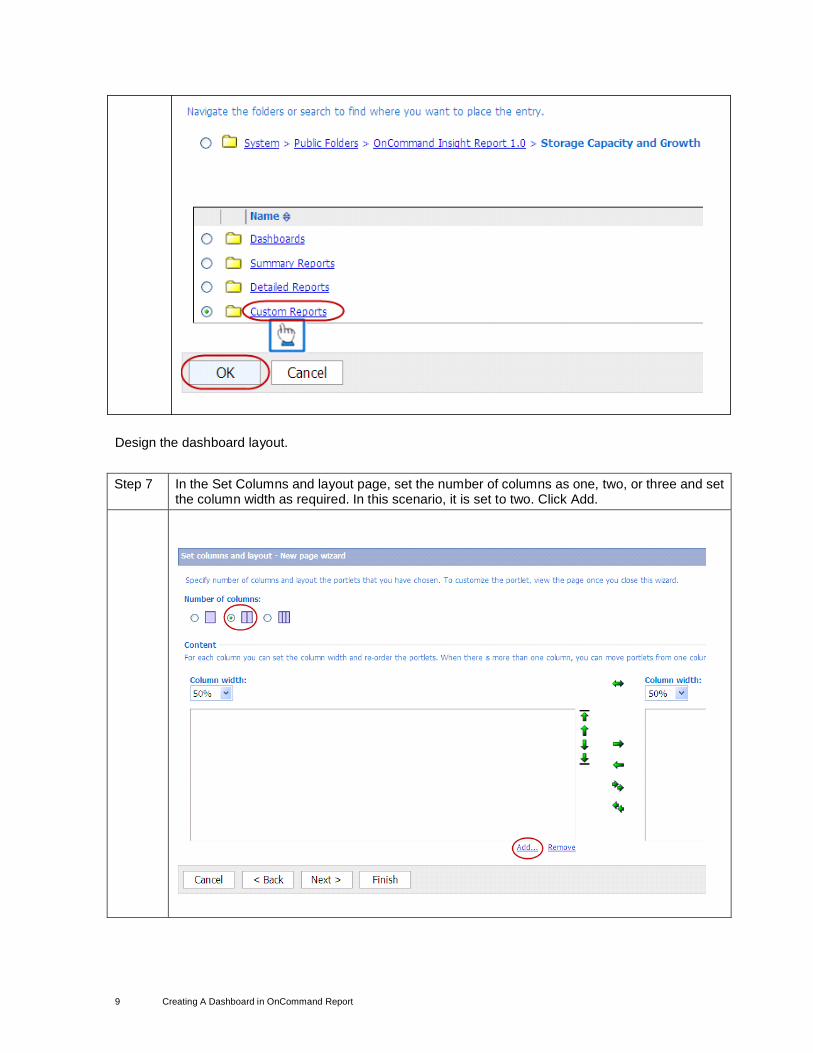
Step 5 Navigate to the folder where you want to place the dashboard.
7 Creating A Dashboard in OnCommand Report
Step 6 Click OK.
8 Creating A Dashboard in OnCommand Report
Design the dashboard layout.
Step 7 In the Set Columns and layout page, set the number of columns as one, two, or three and set the column width as required. In this scenario, it is set to two. Click Add.
9 Creating A Dashboard in OnCommand Report
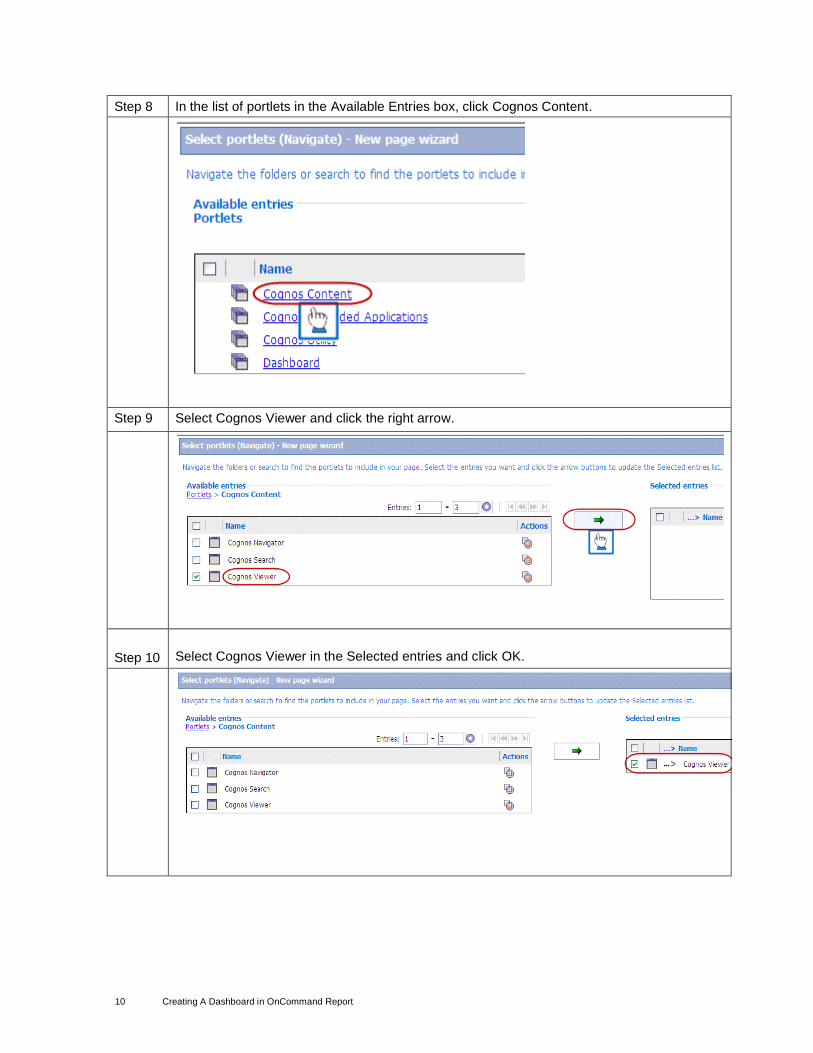
Step 8 In the list of portlets in the Available Entries box, click Cognos Content.
Step 9 Select Cognos Viewer and click the right arrow.
Step 10
Select Cognos Viewer in the Selected entries and click OK.
10 Creating A Dashboard in OnCommand Report
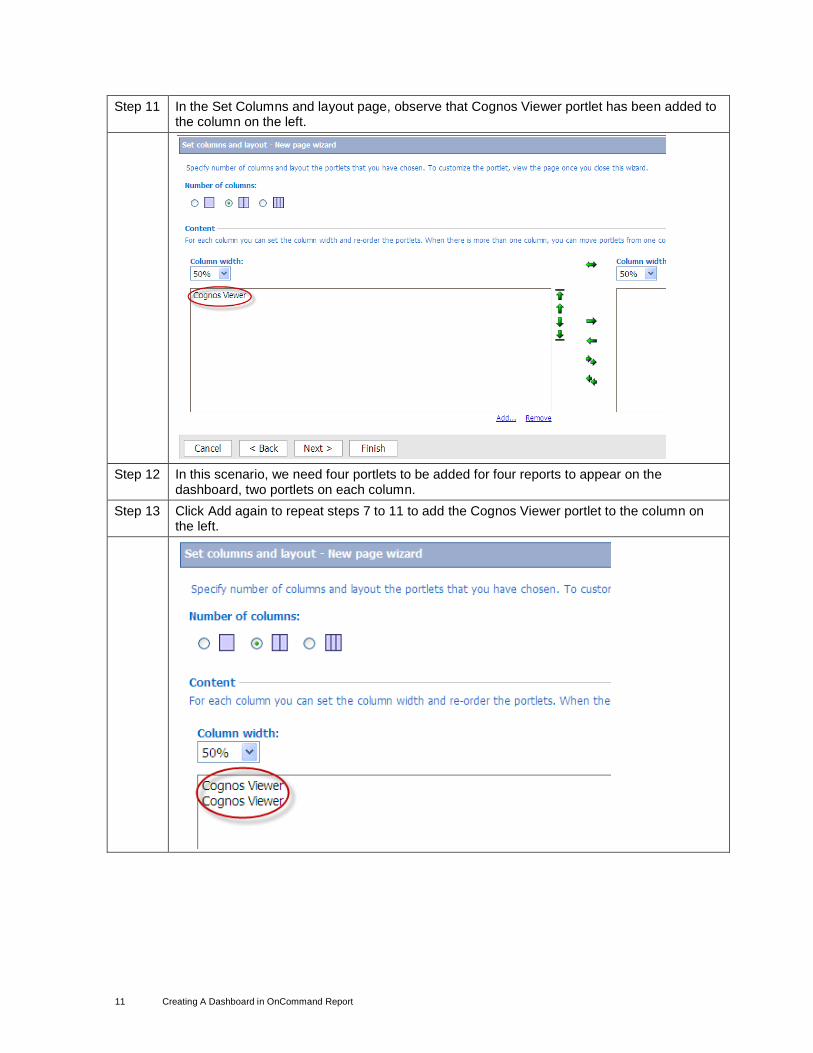
Step 11 In the Set Columns and layout page, observe that Cognos Viewer portlet has been added to the column on the left.
Step 12 In this scenario, we need four portlets to be added for four reports to appear on the dashboard, two portlets on each column.
Step 13 Click Add again to repeat steps 7 to 11 to add the Cognos Viewer portlet to the column on the left.
11 Creating A Dashboard in OnCommand Report
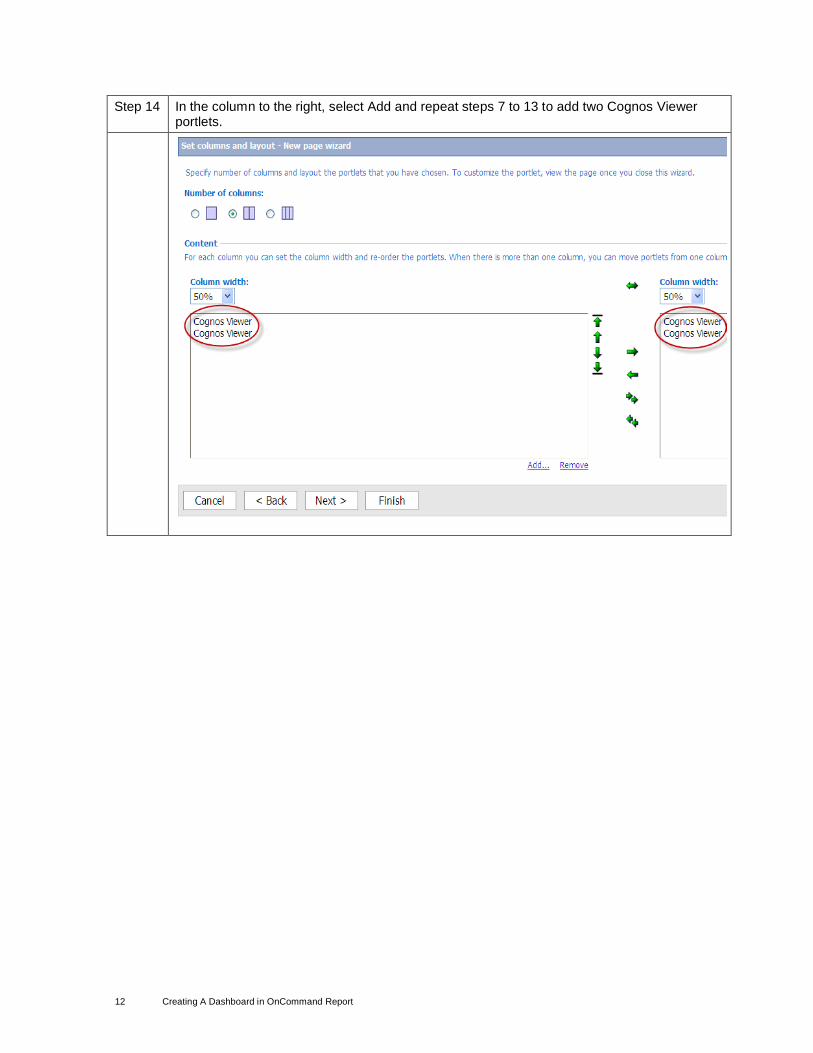
Step 14 In the column to the right, select Add and repeat steps 7 to 13 to add two Cognos Viewer portlets.
12 Creating A Dashboard in OnCommand Report
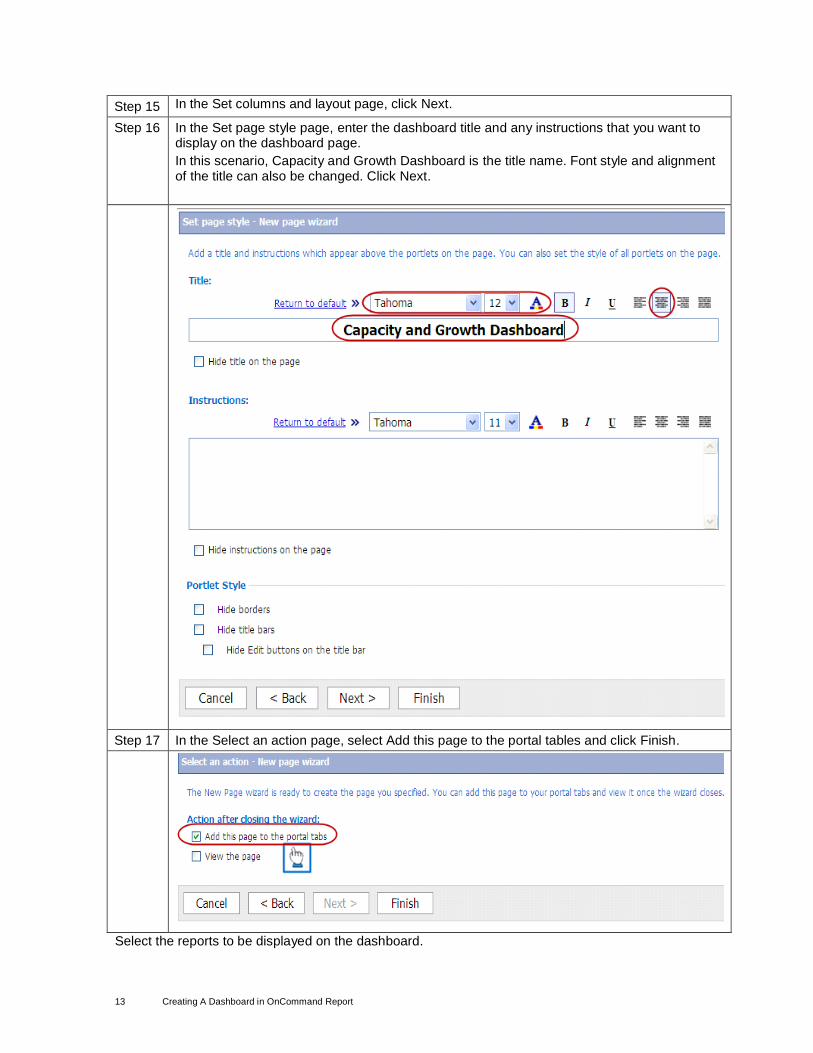
Step 15 In the Set columns and layout page, click Next.
Step 16 In the Set page style page, enter the dashboard title and any instructions that you want to display on the dashboard page.
In this scenario, Capacity and Growth Dashboard is the title name. Font style and alignment of the title can also be changed. Click Next.
Step 17 In the Select an action page, select Add this page to the portal tables and click Finish.
Select the reports to be displayed on the dashboard.
13 Creating A Dashboard in OnCommand Report
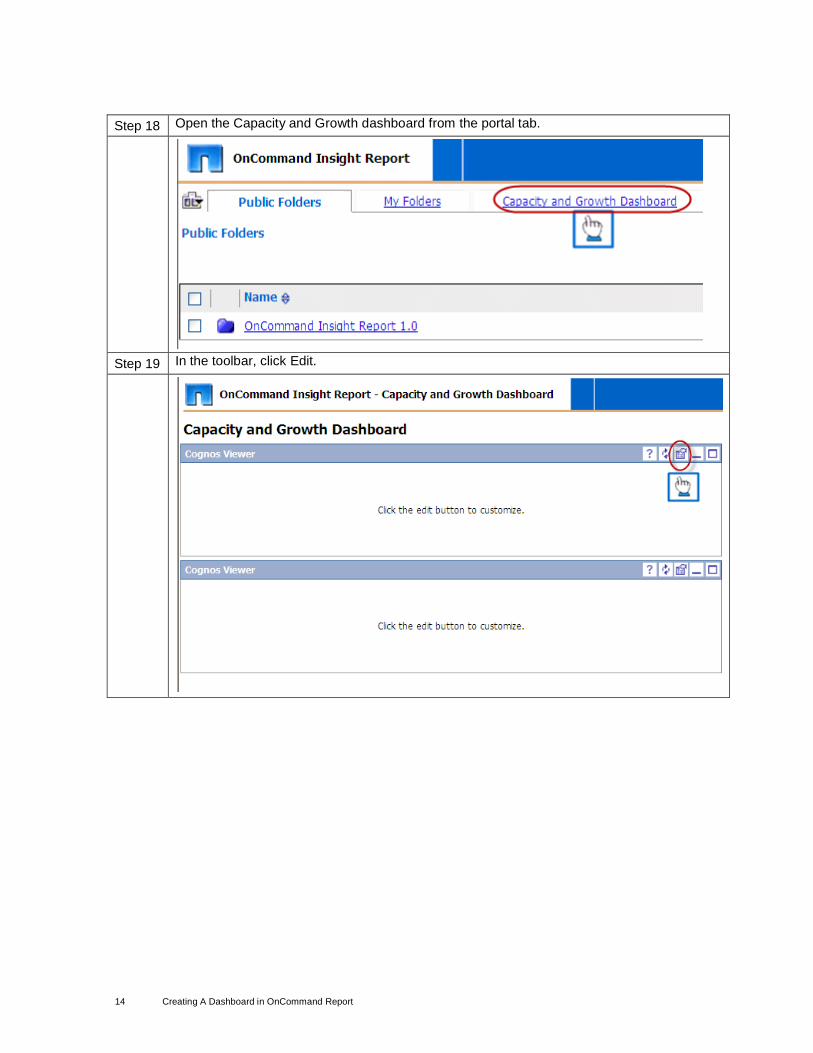
Step 18 Open the Capacity and Growth dashboard from the portal tab.
Step 19 In the toolbar, click Edit.
14 Creating A Dashboard in OnCommand Report
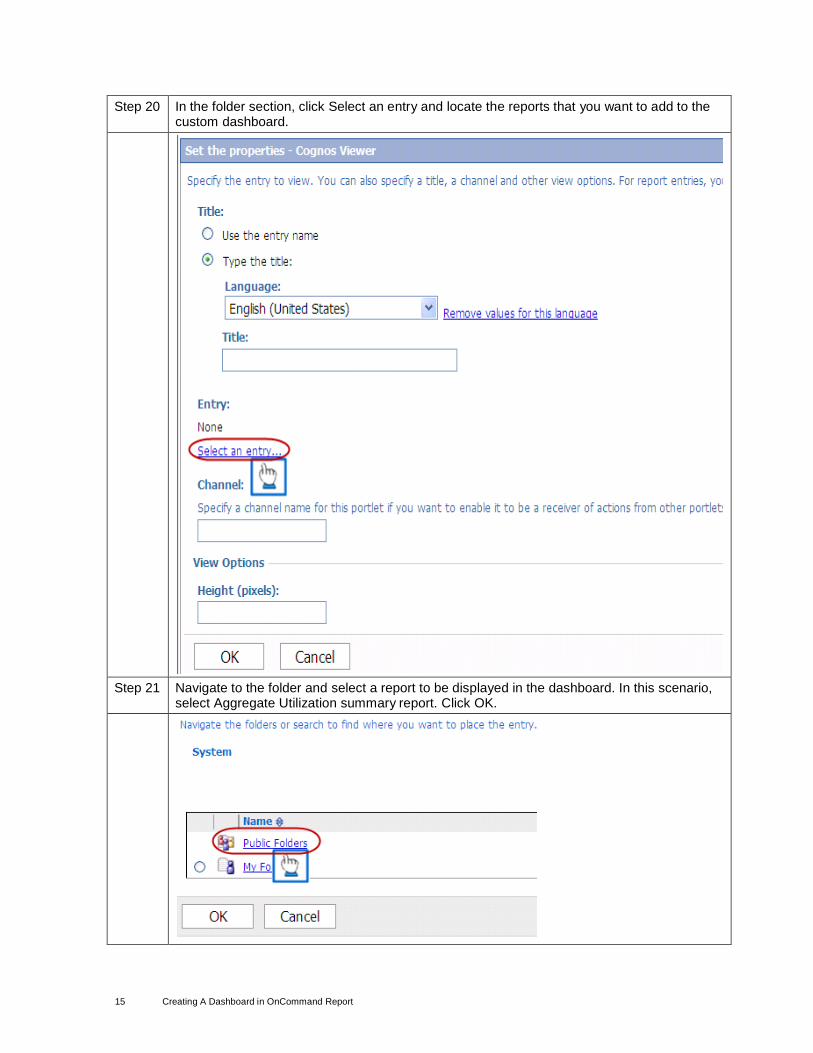
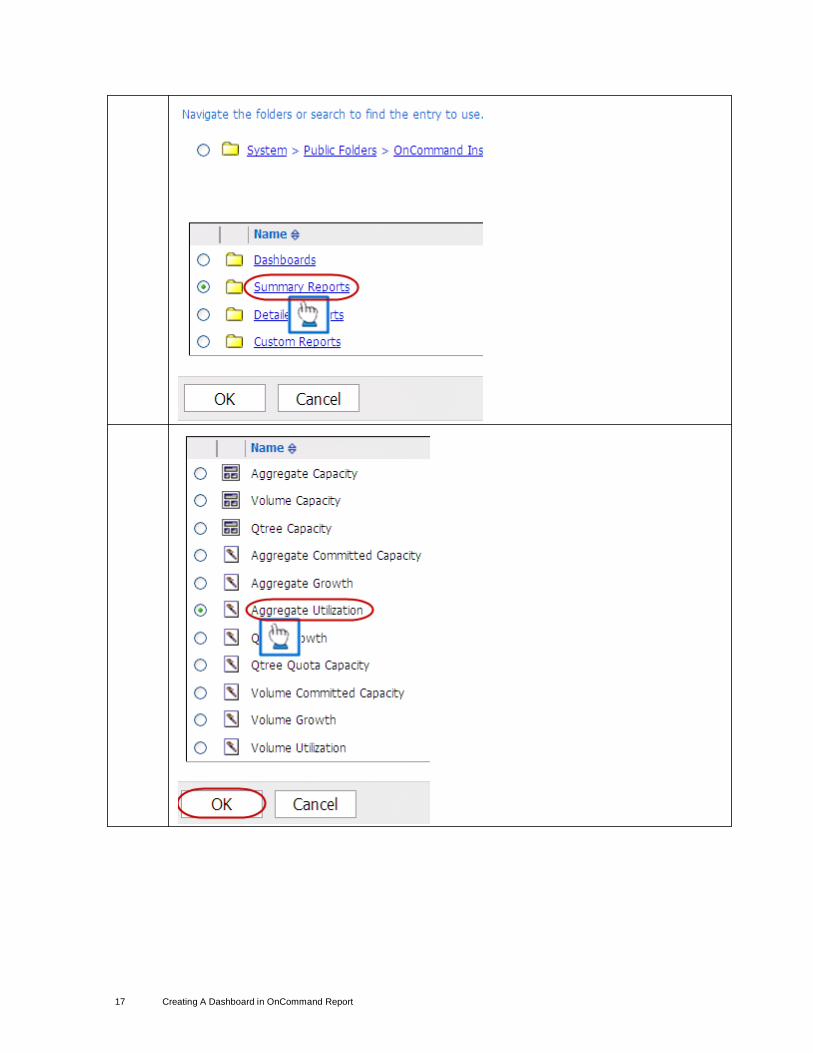
Step 20 In the folder section, click Select an entry and locate the reports that you want to add to the custom dashboard.
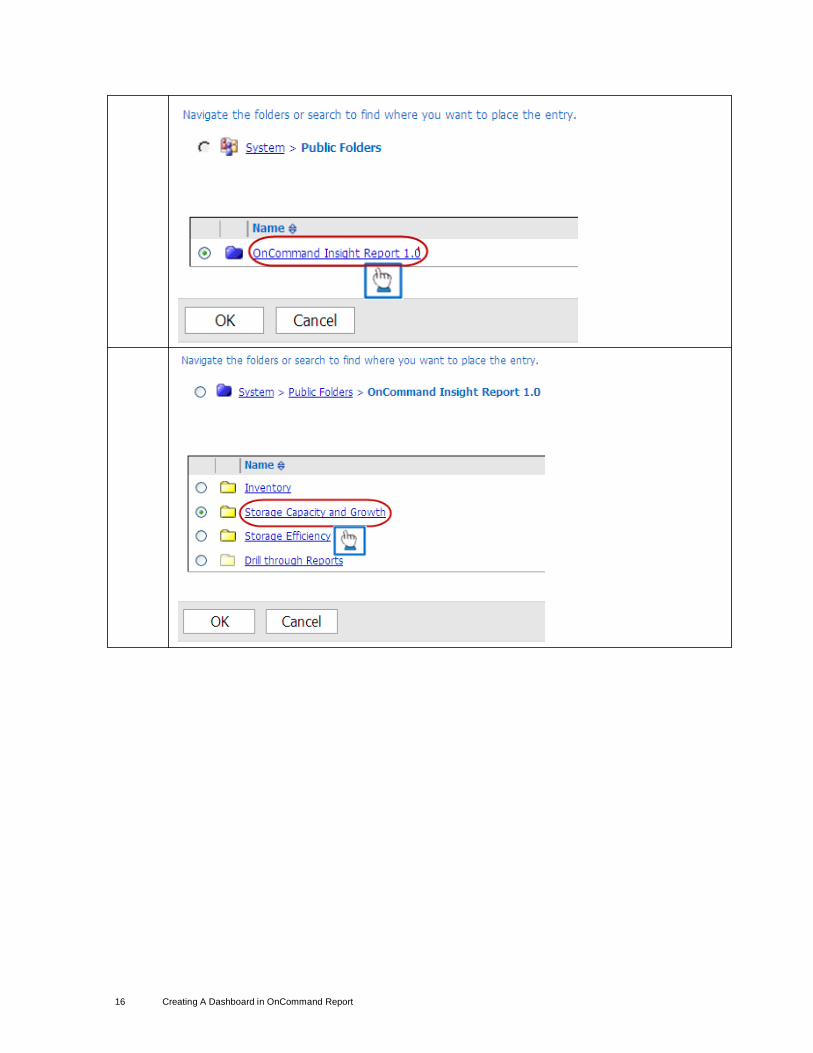
Step 21 Navigate to the folder and select a report to be displayed in the dashboard. In this scenario, select Aggregate Utilization summary report. Click OK.
15 Creating A Dashboard in OnCommand Report
16 Creating A Dashboard in OnCommand Report
17 Creating A Dashboard in OnCommand Report
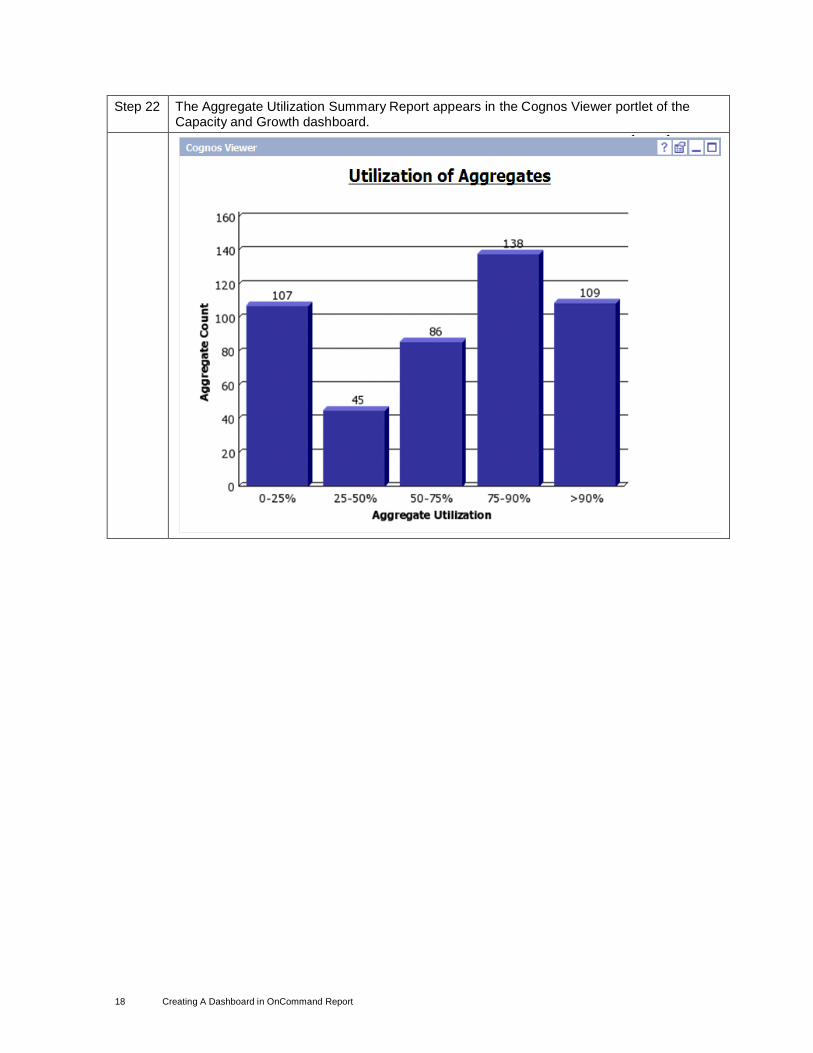
Step 22 The Aggregate Utilization Summary Report appears in the Cognos Viewer portlet of the Capacity and Growth dashboard.
18 Creating A Dashboard in OnCommand Report
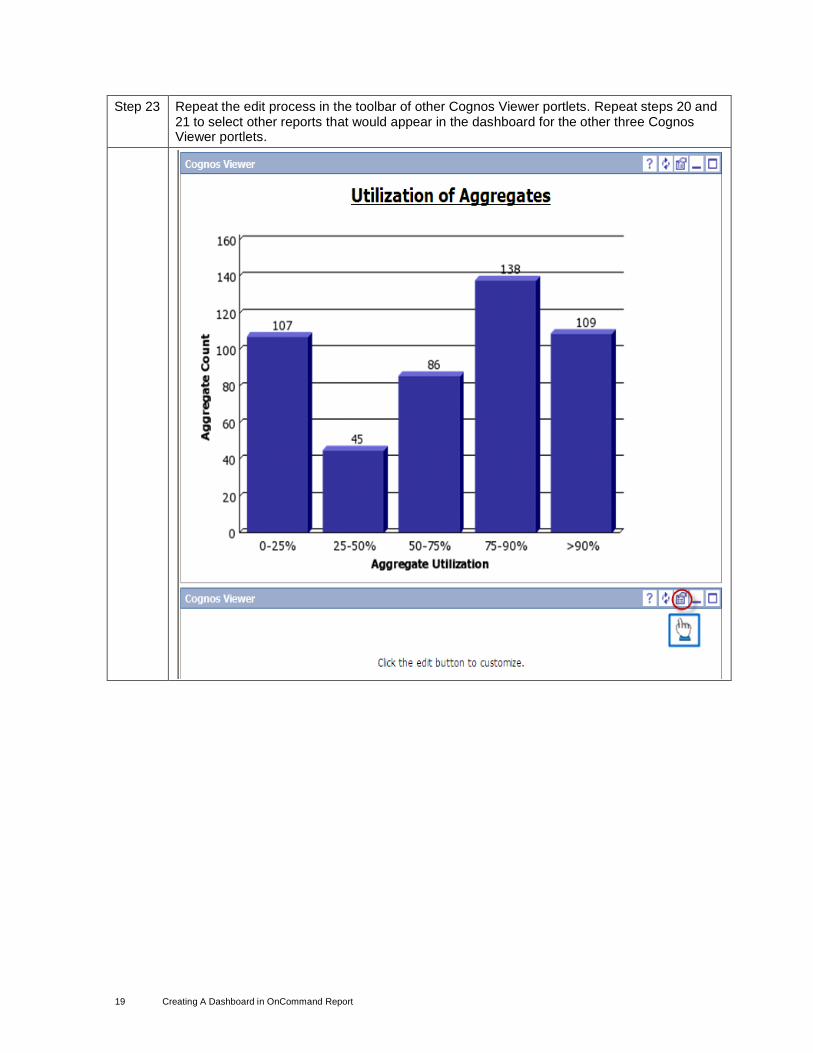
Step 23 Repeat the edit process in the toolbar of other Cognos Viewer portlets. Repeat steps 20 and 21 to select other reports that would appear in the dashboard for the other three Cognos Viewer portlets.
19 Creating A Dashboard in OnCommand Report
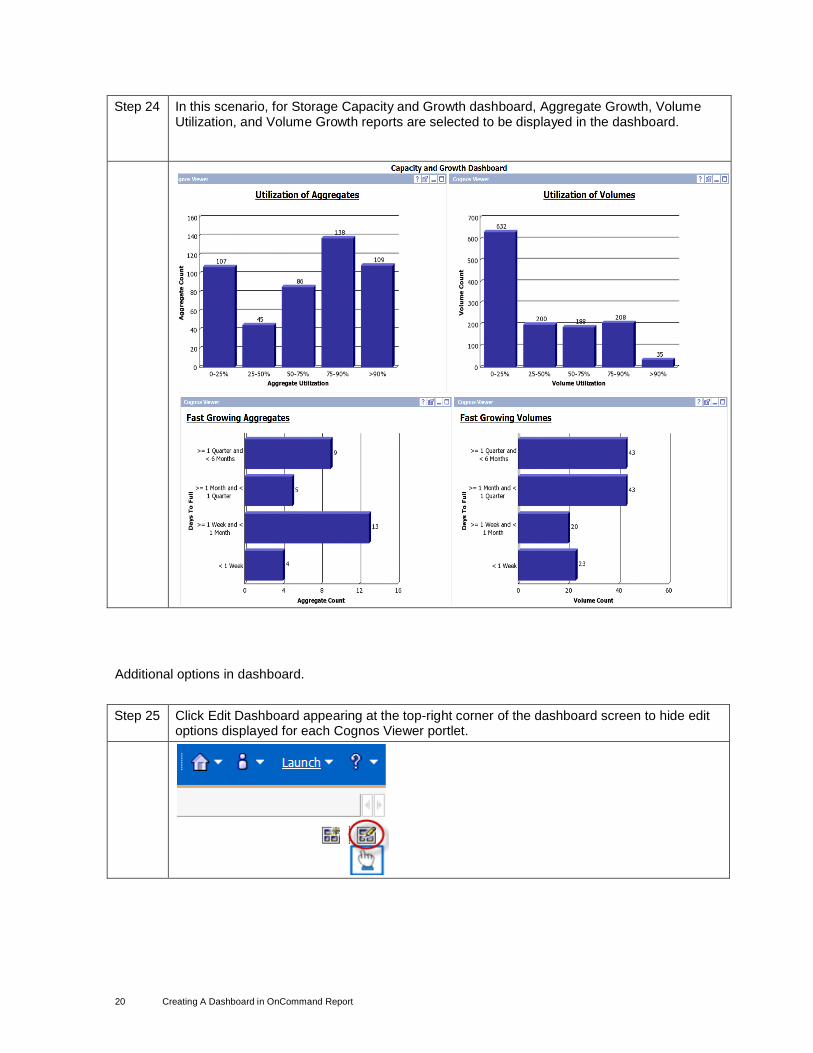
Step 24 In this scenario, for Storage Capacity and Growth dashboard, Aggregate Growth, Volume Utilization, and Volume Growth reports are selected to be displayed in the dashboard.
Additional options in dashboard.
Step 25 Click Edit Dashboard appearing at the top-right corner of the dashboard screen to hide edit options displayed for each Cognos Viewer portlet.
20 Creating A Dashboard in OnCommand Report
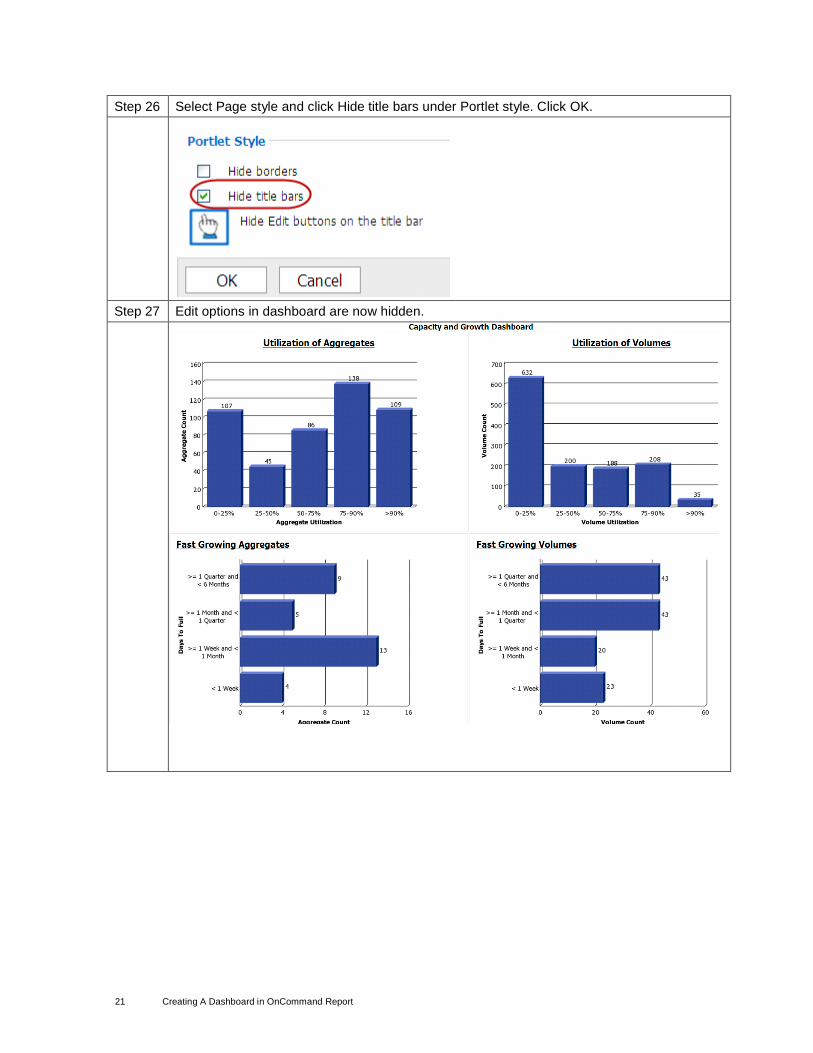
Step 26 Select Page style and click Hide title bars under Portlet style. Click OK.
Step 27 Edit options in dashboard are now hidden.
21 Creating A Dashboard in OnCommand Report
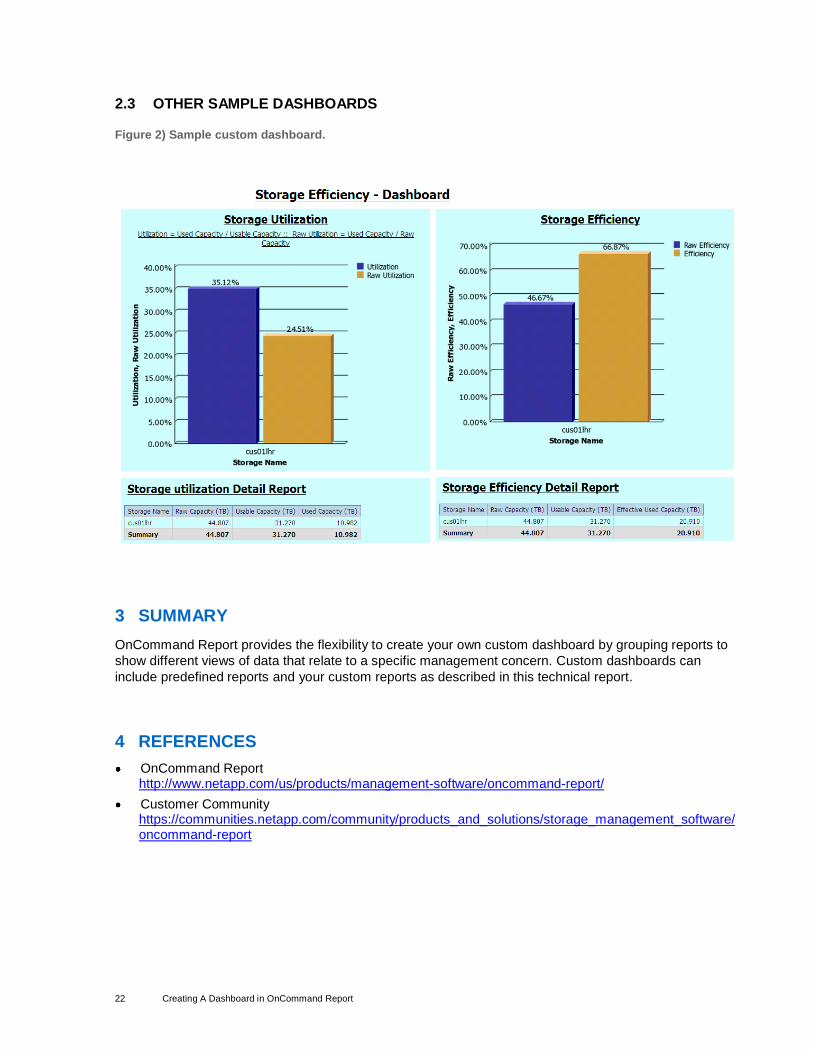
2.3 OTHER SAMPLE DASHBOARDS
Figure 2) Sample custom dashboard.
3 SUMMARY
OnCommand Report provides the flexibility to create your own custom dashboard by grouping reports to
show different views of data that relate to a specific management concern. Custom dashboards can
include predefined reports and your custom reports as described in this technical report.
NetApp provides no representations or warranties regarding the accuracy, reliability, or serviceability of any information or recommendations provided in this publication, or with respect to any results that may be obtained by the use of the information or observance of any recommendations provided herein. The information in this document is distributed AS IS, and the use of this information or the implementation of any recommendations or techniques herein is a customer’s responsibility and depends on the customer’s ability to evaluate and integrate them into the customer’s operational environment. This document and the information contained herein may be used solely in connection with the NetApp products discussed in this document.