ABSTRACTIt is important to detect changes in software performance duringdevelopment in order to avoid performance decreasing release torelease or dealing with costly delays at release time. Performancetesting is part of the development process at MongoDB, and inte-grated into our continuous integration system. We describe a setof changes to that performance testing environment designed toimprove testing effectiveness. These changes help improve cover-age, provide faster and more accurate signaling for performancechanges, and help us better understand the state of performance.In addition to each component performing better, we believe thatwe have created and exploited a virtuous cycle: performance testimprovements drive impact, which drives more use, which drivesfurther impact and investment in improvements. Overall, Mon-goDB is getting faster and we avoid shipping major performanceregressions to our customers because of this infrastructure.
CCS CONCEPTS• General and reference → Performance; • Information sys-tems→Database performance evaluation; •Mathematics ofcomputing → Time series analysis.
KEYWORDSchange point detection, performance, testing, continuous integra-tion, variabilityACM Reference Format:David Daly. 2021. Creating a Virtuous Cycle in Performance Testing atMongoDB. In Proceedings of the 2021 ACM/SPEC International Conference onPerformance Engineering (ICPE ’21), April 19–23, 2021, Virtual Event, France.ACM, New York, NY, USA, 9 pages. https://doi.org/10.1145/3427921.3450234
1 INTRODUCTIONOver the last several years we have focused on improving ourperformance testing infrastructure at MongoDB. The performancetesting infrastructure is a key component in ensuring the overallquality of the software we develop, run, and support. It allows us todetect changes in performance as we develop the software, enablingprompt isolation and resolution of regressions and bugs. It keepsperformance regressions from being included in the software werelease to customers. It also allows us to recognize, confirm, and lockin performance improvements. As a business, performance testingimpacts our top and bottom lines: the more performant the server,the more our customers will use our services; the more effective
our performance testing infrastructure, the more productive areour developers. Testing performance and detecting performancechanges is a hard problem in practice, as performance tests andtest platforms inherently contain some degree of noise. The use ofchange point detection [10] was a large improvement in our abilityto detect performance changes in the presence of noise.
After putting our change point detection system into production,we explicitly focused on 4 challenges: how to deal with the largenumber of results and process all the changes; how to better dealwith and isolate noise due to the testbed system itself; how to easilycompare the results from arbitrary test runs; and how to captureand how to more flexibly handle more result types. The first twoare familiar challenges, having been an explicit focus of the changepoint detection work, while the second two challenges becomemore serious problems once we achieved a basic ability to processour existing results.
The cumulative impact of these changes and our previous workhas been to enable a virtuous cycle for performance at MongoDB.As the system is used more, we catch and address more performancechanges, leading to us using the system more.
The rest of this paper is organized as follows. In Section 2 wereview our previous work on which this paper builds. In Section 3we discuss changes that have happened naturally as we have usedthe system more, leading to more load on the system. We thendive into four changes that we have tried in order to improve ourinfrastructure: Section 4 for improving our processing of results,Section 5 for handlingmore result types, Section 6 to address systemnoise, and Section 7 to improve the comparison of arbitrary test runs.Those sections are followed by a dive into the practical impact of allthese changes in Section 8, before reviewing future work, relatedwork, and conclusions in Sections 9, 10, and 12.
2 REVIEWWe built our performance testing infrastructure to be completelyautomated, and integrated with our continuous integration systemEvergreen [3]. From past experience we had concluded that it wasessential to automate the execution and analysis of our performancetests, and regularly run those tests as our developers worked onthe next release. Previously we had done ad-hoc testing and man-ual testing at the end of the release cycle. In both cases we werecontinually challenged by test results that would not reproduce, aswell as a huge diagnosis effort to identify which component andchanges to that component caused the performance changes. Thecombination of those challenges led to a large effort late in each re-lease cycle to try to identify and fix performance regressions, oftenresulting in release delays or performance regressions shipping tocustomers. Creating the infrastructure [16] to test performance inour CI system let us identify and address regressions earlier, andmade it much easier to isolate performance changes.
ICPE ’21, April 19–23, 2021, Virtual Event, France David Daly
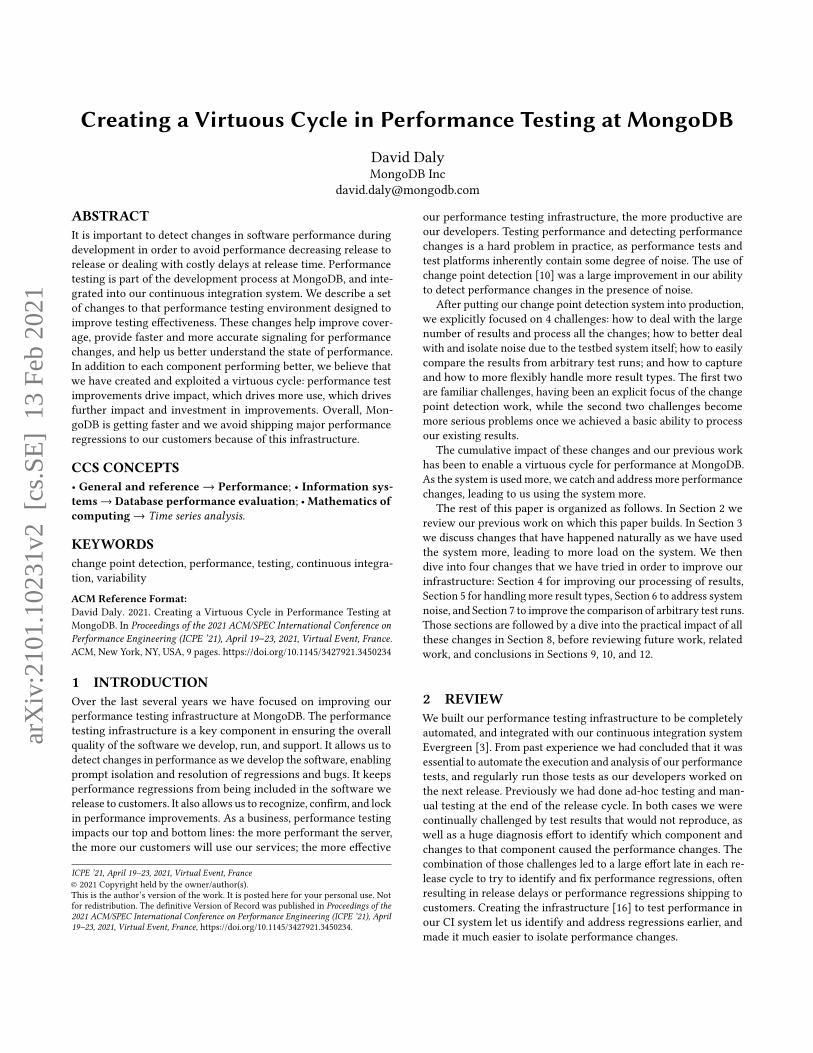
2018 2019 2020Number of Configurations 8 17 24Number of Tasks 86 181 356Number of Tests 960 1849 3122Number of Results 2393 3865 5787
Table 1: The number of total possible test results we can cre-ate per source code revision has increased significantly overthe past two years. This is due to increases in the numberof tests and the number of configurations in which we runthose tests.
Automation does not inherently make the tests reproducible, butit does make it clearer that there is noise in the results. Furtherwork went into lowering the noise in the test results [14]. That worklowered, but did not eliminate the noise in the performance results.It was still challenging to detect changes in performance. Originallywe tested for performance changes above some threshold (usually10%), but this had a number of problems, leading us to use changepoint detection [10]. Change point detection attempts to determinewhen there are statistical changes in a time-series, which is preciselythe problem we want to solve. After the transition to change pointdetection, we had a system with completely automated, low noisetests that we could successfully triage and process.
3 ORGANIC CHANGESThere are a number of organic changes to our performance testenvironment that have occurred over the last couple of years. Thesechanges were not planned, but they were still important changes.The performance testing system works, detecting that the perfor-mance has changed and correctly identifying when those perfor-mance changes occurred. The development engineers have seenthat it works and so they use the performance test infrastructuremore. One key aspect of that increase in use is that the develop-ment engineers have added more tests. We have also added newtest configurations to further increase test coverage. Developmentengineers and performance engineers both add performance testsand configurations.
Table 1 shows the number of system under test configurations,tasks (collections of tests), tests, and number of raw results fromrunning the performance tests for any version of the software. Thedata covers that past three years and is collected from tests run inSeptember of each year. The table specifically filters out canary1results and anything that we would not actively triage. In somecases, the line between configurations, tasks, tests, and results maybe arbitrary, but it is how our system is organized and users interactwith each of those levels.
You can see the huge increase in every dimension. We run ourchange point detection algorithm on the time-series for every result,and someonemust triage all of that data. The total number of resultswent up 50% year over year, and 142% over two years.
Additionally, the development organization has grown leadingto more commits to our source repository. Overall the number of
1Canary tests are discussed in Section 6.
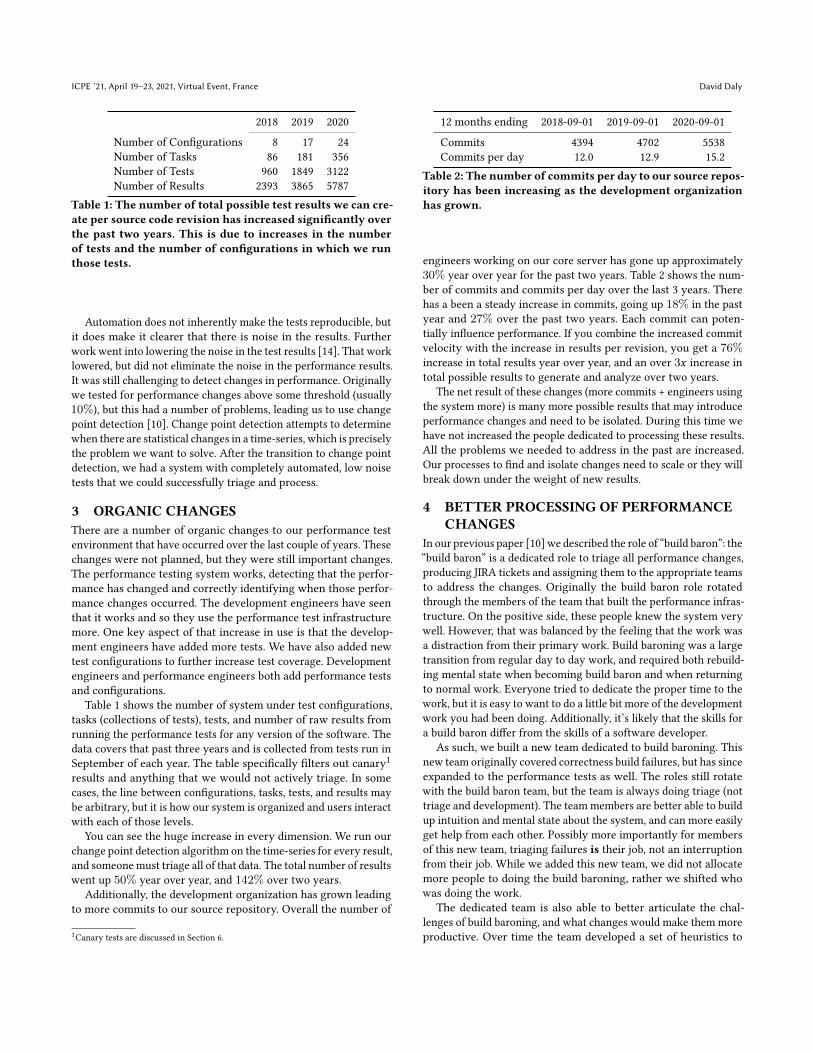
12 months ending 2018-09-01 2019-09-01 2020-09-01Commits 4394 4702 5538Commits per day 12.0 12.9 15.2
Table 2: The number of commits per day to our source repos-itory has been increasing as the development organizationhas grown.
engineers working on our core server has gone up approximately30% year over year for the past two years. Table 2 shows the num-ber of commits and commits per day over the last 3 years. Therehas a been a steady increase in commits, going up 18% in the pastyear and 27% over the past two years. Each commit can poten-tially influence performance. If you combine the increased commitvelocity with the increase in results per revision, you get a 76%increase in total results year over year, and an over 3𝑥 increase intotal possible results to generate and analyze over two years.
The net result of these changes (more commits + engineers usingthe system more) is many more possible results that may introduceperformance changes and need to be isolated. During this time wehave not increased the people dedicated to processing these results.All the problems we needed to address in the past are increased.Our processes to find and isolate changes need to scale or they willbreak down under the weight of new results.
4 BETTER PROCESSING OF PERFORMANCECHANGES
In our previous paper [10] we described the role of “build baron”: the“build baron” is a dedicated role to triage all performance changes,producing JIRA tickets and assigning them to the appropriate teamsto address the changes. Originally the build baron role rotatedthrough the members of the team that built the performance infras-tructure. On the positive side, these people knew the system verywell. However, that was balanced by the feeling that the work wasa distraction from their primary work. Build baroning was a largetransition from regular day to day work, and required both rebuild-ing mental state when becoming build baron and when returningto normal work. Everyone tried to dedicate the proper time to thework, but it is easy to want to do a little bit more of the developmentwork you had been doing. Additionally, it’s likely that the skills fora build baron differ from the skills of a software developer.
As such, we built a new team dedicated to build baroning. Thisnew team originally covered correctness build failures, but has sinceexpanded to the performance tests as well. The roles still rotatewith the build baron team, but the team is always doing triage (nottriage and development). The team members are better able to buildup intuition and mental state about the system, and can more easilyget help from each other. Possibly more importantly for membersof this new team, triaging failures is their job, not an interruptionfrom their job. While we added this new team, we did not allocatemore people to doing the build baroning, rather we shifted whowas doing the work.
The dedicated team is also able to better articulate the chal-lenges of build baroning, and what changes would make them moreproductive. Over time the team developed a set of heuristics to
Virtuous Cycle in Performance Testing ICPE ’21, April 19–23, 2021, Virtual Event, France
deal with all the change points they had to process and sharedknowledge. Part of this was adding filters to the existing boardsand new ways of looking at the data. Where feasible we reviewedthese heuristics and integrated them into the displays by default.Examples include better filtering of canary workloads (recall we donot want to triage changes in canaries, but rather rerun them) andsorting capabilities.
The impact of these changes show up in our overall statisticswhich are discussed in Section 8. The summary is that they allowedus to evaluate more tests and commits to find more changes, whilealso increasing the overall quality of the generated tickets withoutany additional human time.
5 MAKING THE SYSTEM MOREDESCRIPTIVE
Our performance testing environment was originally designed fortests that measured throughput, as throughput based tests are theeasiest to create and analyze (just run an operation in a loop for aperiod of time, possibly with multiple threads). This assumption gotbuilt into the system. We knew it was a limitation in our system andhave been striving to get around it. We developed conventions toadd some latency results to our system, but it was inelegant. Worse,it largely assumed only one result per test. Ideally we could measuremany performance results per test, such as throughput, medianlatency, tail latencies, and resource utilizations. Before change pointdetection, we could not add significantly more metrics since wecould not keep up with the simpler tests we already had. Now thatwe had change point detection, we wanted to be able to track andprocess these additional metrics.
There were fundamentally two ways we could add these newmetrics: 1. Have tests measure the metrics of interest and thencompute and report the relevant statistics to the results system. 2.Have tests measure the metrics of interest and report all of thoseresults to the result system. In the second case the test would reportthe metric for every operation — much more data — and let theresults system calculate the statistics. After some review, we decidedwe preferred case 2, but that we also had to support case 1.
We preferred the more data intensive case 2 because of what itenables. If we run a test that executes 10k operations, the systemwill report the latency for each of those 10k operations. First, havingall the data allows us to change and recompute the statistics in thefuture. For example, if we decide we need the 99.99% latency inaddition to the existing statistics, we can add it and recompute.If the test itself was computing the statistics we would have torerun the test. Additionally, it allows us to view performance overtest time, within a test and from the test’s perspective (client side).This gives us a much more dynamic view of the performance ofthe system. We chose our preferred case, and it was paired withwork on our open-source performance workload generation toolGenny [7]. We created a new service called Cedar [5] to store theresults and calculate the statistics, and a tool called Poplar [6] tohelp report the results from the testbed to Cedar. Both are opensource and part of our continuous integration system ecosystem [4].
While we chose the detailed case, we decided we also had tosupport the case in which tests computed their own statistics. Thereason for this was simple: in addition to workloads written in
Genny, we also run third party industry standard benchmarks inour regression environment (e.g., YCSB [8, 9]). Those tests alreadygenerate their own statistics, and it is not reasonable to adapt eachsuch workload to report the metrics for every operation. The systemwe built handles both the case of getting all the raw results and thecase of receiving the pre-aggregated data.
The new system was just that, a new system. We needed tointegrate it into our production systems without breaking anything.The test result history is important both to the result display aswell as the change point analysis, so we could not just turn off theold system and turn on the new. Instead we needed to make theold system and the new work together in the UI. We also neededto make it possible to handle the increase in information withoutcompletely overwhelming the build baron team2.
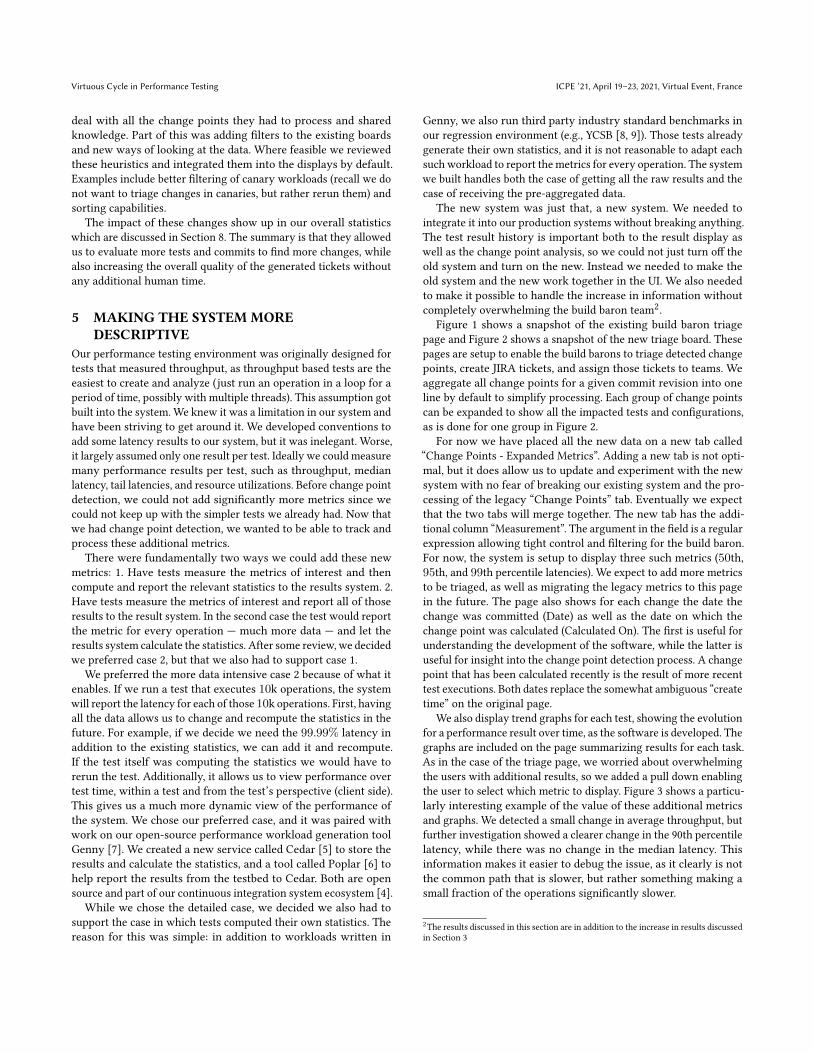
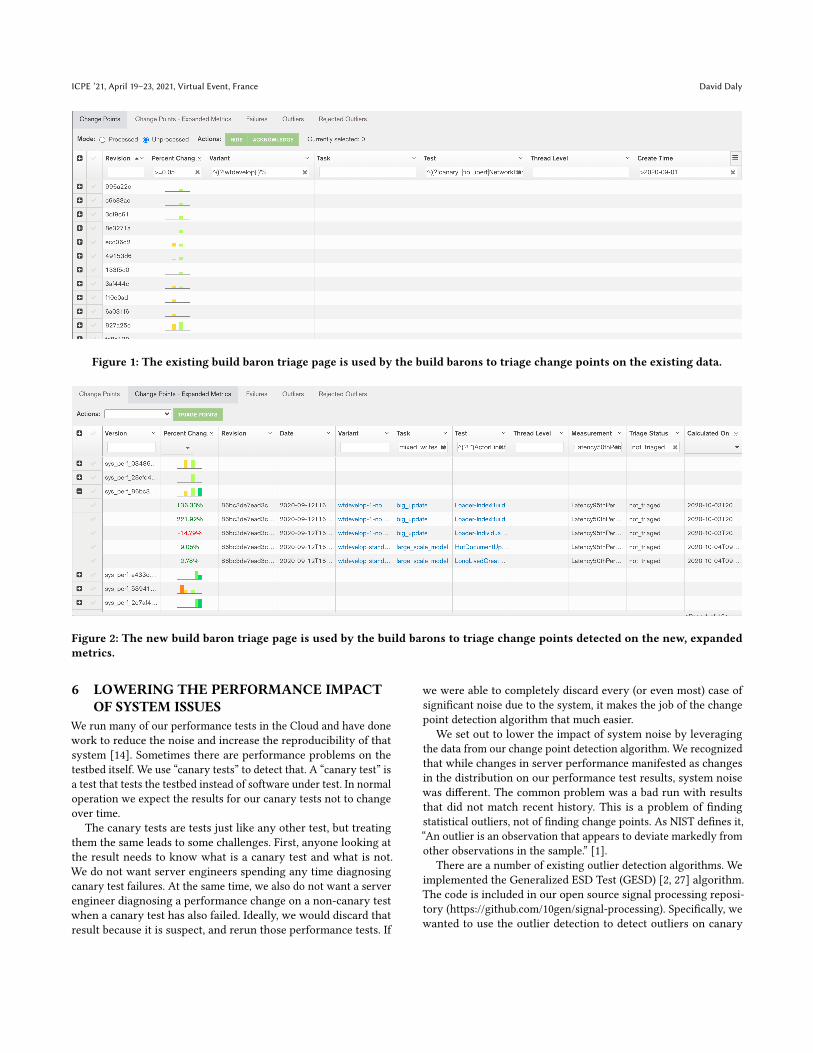
Figure 1 shows a snapshot of the existing build baron triagepage and Figure 2 shows a snapshot of the new triage board. Thesepages are setup to enable the build barons to triage detected changepoints, create JIRA tickets, and assign those tickets to teams. Weaggregate all change points for a given commit revision into oneline by default to simplify processing. Each group of change pointscan be expanded to show all the impacted tests and configurations,as is done for one group in Figure 2.
For now we have placed all the new data on a new tab called“Change Points - Expanded Metrics”. Adding a new tab is not opti-mal, but it does allow us to update and experiment with the newsystem with no fear of breaking our existing system and the pro-cessing of the legacy “Change Points” tab. Eventually we expectthat the two tabs will merge together. The new tab has the addi-tional column “Measurement”. The argument in the field is a regularexpression allowing tight control and filtering for the build baron.For now, the system is setup to display three such metrics (50th,95th, and 99th percentile latencies). We expect to add more metricsto be triaged, as well as migrating the legacy metrics to this pagein the future. The page also shows for each change the date thechange was committed (Date) as well as the date on which thechange point was calculated (Calculated On). The first is useful forunderstanding the development of the software, while the latter isuseful for insight into the change point detection process. A changepoint that has been calculated recently is the result of more recenttest executions. Both dates replace the somewhat ambiguous “createtime” on the original page.
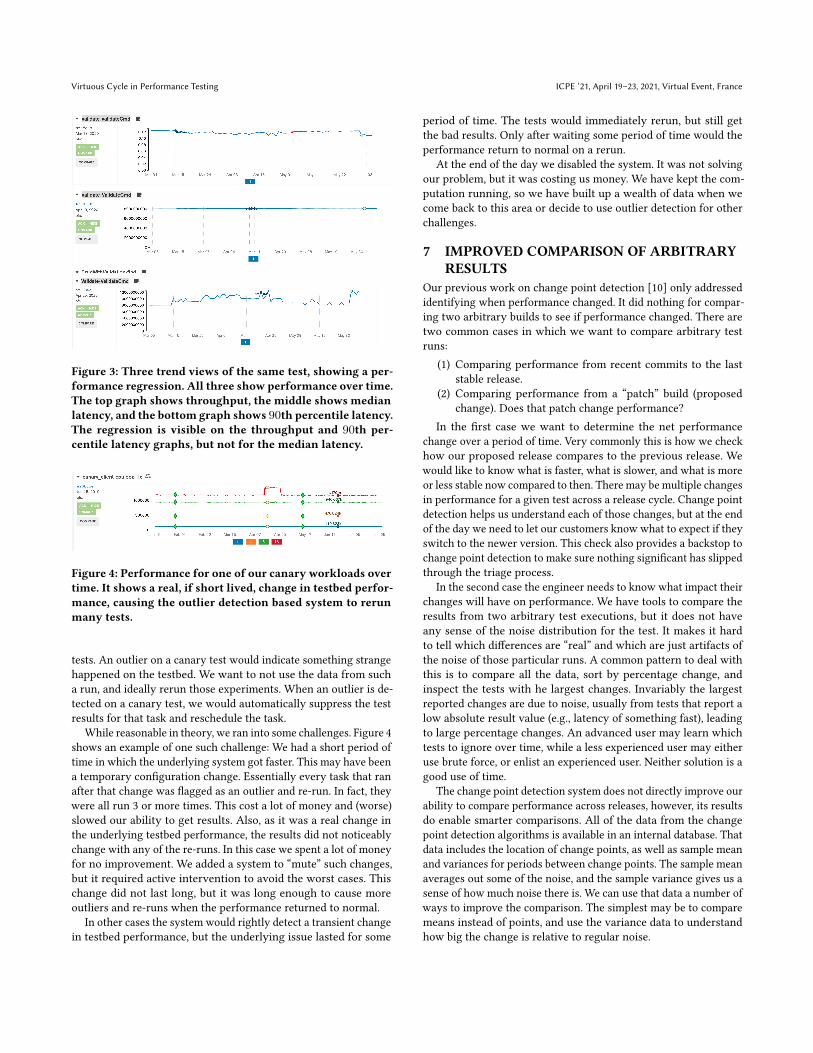
We also display trend graphs for each test, showing the evolutionfor a performance result over time, as the software is developed. Thegraphs are included on the page summarizing results for each task.As in the case of the triage page, we worried about overwhelmingthe users with additional results, so we added a pull down enablingthe user to select which metric to display. Figure 3 shows a particu-larly interesting example of the value of these additional metricsand graphs. We detected a small change in average throughput, butfurther investigation showed a clearer change in the 90th percentilelatency, while there was no change in the median latency. Thisinformation makes it easier to debug the issue, as it clearly is notthe common path that is slower, but rather something making asmall fraction of the operations significantly slower.
2The results discussed in this section are in addition to the increase in results discussedin Section 3
ICPE ’21, April 19–23, 2021, Virtual Event, France David Daly
Figure 1: The existing build baron triage page is used by the build barons to triage change points on the existing data.
Figure 2: The new build baron triage page is used by the build barons to triage change points detected on the new, expandedmetrics.
6 LOWERING THE PERFORMANCE IMPACTOF SYSTEM ISSUES
We run many of our performance tests in the Cloud and have donework to reduce the noise and increase the reproducibility of thatsystem [14]. Sometimes there are performance problems on thetestbed itself. We use “canary tests” to detect that. A “canary test” isa test that tests the testbed instead of software under test. In normaloperation we expect the results for our canary tests not to changeover time.
The canary tests are tests just like any other test, but treatingthem the same leads to some challenges. First, anyone looking atthe result needs to know what is a canary test and what is not.We do not want server engineers spending any time diagnosingcanary test failures. At the same time, we also do not want a serverengineer diagnosing a performance change on a non-canary testwhen a canary test has also failed. Ideally, we would discard thatresult because it is suspect, and rerun those performance tests. If
we were able to completely discard every (or even most) case ofsignificant noise due to the system, it makes the job of the changepoint detection algorithm that much easier.
We set out to lower the impact of system noise by leveragingthe data from our change point detection algorithm. We recognizedthat while changes in server performance manifested as changesin the distribution on our performance test results, system noisewas different. The common problem was a bad run with resultsthat did not match recent history. This is a problem of findingstatistical outliers, not of finding change points. As NIST defines it,“An outlier is an observation that appears to deviate markedly fromother observations in the sample.” [1].
There are a number of existing outlier detection algorithms. Weimplemented the Generalized ESD Test (GESD) [2, 27] algorithm.The code is included in our open source signal processing reposi-tory (https://github.com/10gen/signal-processing). Specifically, wewanted to use the outlier detection to detect outliers on canary
Virtuous Cycle in Performance Testing ICPE ’21, April 19–23, 2021, Virtual Event, France
Figure 3: Three trend views of the same test, showing a per-formance regression. All three show performance over time.The top graph shows throughput, the middle shows medianlatency, and the bottom graph shows 90th percentile latency.The regression is visible on the throughput and 90th per-centile latency graphs, but not for the median latency.
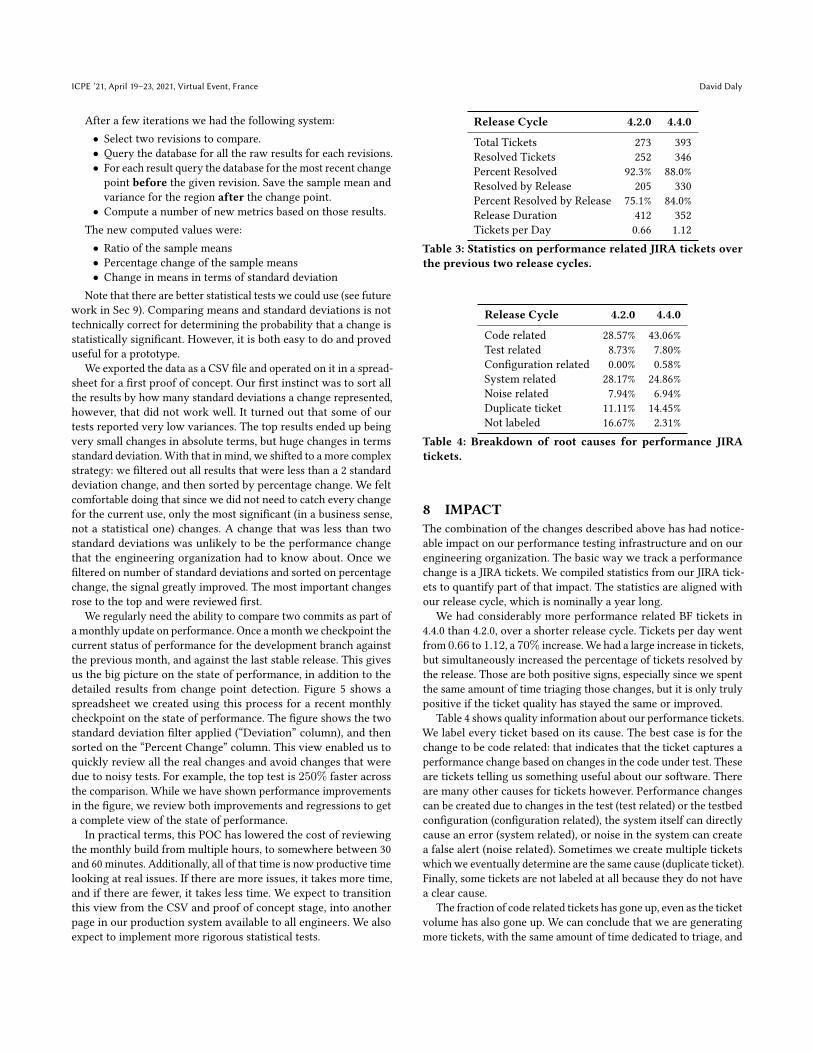
Figure 4: Performance for one of our canary workloads overtime. It shows a real, if short lived, change in testbed perfor-mance, causing the outlier detection based system to rerunmany tests.
tests. An outlier on a canary test would indicate something strangehappened on the testbed. We want to not use the data from sucha run, and ideally rerun those experiments. When an outlier is de-tected on a canary test, we would automatically suppress the testresults for that task and reschedule the task.
While reasonable in theory, we ran into some challenges. Figure 4shows an example of one such challenge: We had a short period oftime in which the underlying system got faster. This may have beena temporary configuration change. Essentially every task that ranafter that change was flagged as an outlier and re-run. In fact, theywere all run 3 or more times. This cost a lot of money and (worse)slowed our ability to get results. Also, as it was a real change inthe underlying testbed performance, the results did not noticeablychange with any of the re-runs. In this case we spent a lot of moneyfor no improvement. We added a system to “mute” such changes,but it required active intervention to avoid the worst cases. Thischange did not last long, but it was long enough to cause moreoutliers and re-runs when the performance returned to normal.
In other cases the system would rightly detect a transient changein testbed performance, but the underlying issue lasted for some
period of time. The tests would immediately rerun, but still getthe bad results. Only after waiting some period of time would theperformance return to normal on a rerun.
At the end of the day we disabled the system. It was not solvingour problem, but it was costing us money. We have kept the com-putation running, so we have built up a wealth of data when wecome back to this area or decide to use outlier detection for otherchallenges.
7 IMPROVED COMPARISON OF ARBITRARYRESULTS
Our previous work on change point detection [10] only addressedidentifying when performance changed. It did nothing for compar-ing two arbitrary builds to see if performance changed. There aretwo common cases in which we want to compare arbitrary testruns:
(1) Comparing performance from recent commits to the laststable release.
(2) Comparing performance from a “patch” build (proposedchange). Does that patch change performance?
In the first case we want to determine the net performancechange over a period of time. Very commonly this is how we checkhow our proposed release compares to the previous release. Wewould like to know what is faster, what is slower, and what is moreor less stable now compared to then. There may be multiple changesin performance for a given test across a release cycle. Change pointdetection helps us understand each of those changes, but at the endof the day we need to let our customers know what to expect if theyswitch to the newer version. This check also provides a backstop tochange point detection to make sure nothing significant has slippedthrough the triage process.
In the second case the engineer needs to know what impact theirchanges will have on performance. We have tools to compare theresults from two arbitrary test executions, but it does not haveany sense of the noise distribution for the test. It makes it hardto tell which differences are “real” and which are just artifacts ofthe noise of those particular runs. A common pattern to deal withthis is to compare all the data, sort by percentage change, andinspect the tests with he largest changes. Invariably the largestreported changes are due to noise, usually from tests that report alow absolute result value (e.g., latency of something fast), leadingto large percentage changes. An advanced user may learn whichtests to ignore over time, while a less experienced user may eitheruse brute force, or enlist an experienced user. Neither solution is agood use of time.
The change point detection system does not directly improve ourability to compare performance across releases, however, its resultsdo enable smarter comparisons. All of the data from the changepoint detection algorithms is available in an internal database. Thatdata includes the location of change points, as well as sample meanand variances for periods between change points. The sample meanaverages out some of the noise, and the sample variance gives us asense of how much noise there is. We can use that data a number ofways to improve the comparison. The simplest may be to comparemeans instead of points, and use the variance data to understandhow big the change is relative to regular noise.
ICPE ’21, April 19–23, 2021, Virtual Event, France David Daly
After a few iterations we had the following system:• Select two revisions to compare.• Query the database for all the raw results for each revisions.• For each result query the database for the most recent changepoint before the given revision. Save the sample mean andvariance for the region after the change point.
• Compute a number of new metrics based on those results.The new computed values were:• Ratio of the sample means• Percentage change of the sample means• Change in means in terms of standard deviation
Note that there are better statistical tests we could use (see futurework in Sec 9). Comparing means and standard deviations is nottechnically correct for determining the probability that a change isstatistically significant. However, it is both easy to do and proveduseful for a prototype.
We exported the data as a CSV file and operated on it in a spread-sheet for a first proof of concept. Our first instinct was to sort allthe results by how many standard deviations a change represented,however, that did not work well. It turned out that some of ourtests reported very low variances. The top results ended up beingvery small changes in absolute terms, but huge changes in termsstandard deviation. With that in mind, we shifted to a more complexstrategy: we filtered out all results that were less than a 2 standarddeviation change, and then sorted by percentage change. We feltcomfortable doing that since we did not need to catch every changefor the current use, only the most significant (in a business sense,not a statistical one) changes. A change that was less than twostandard deviations was unlikely to be the performance changethat the engineering organization had to know about. Once wefiltered on number of standard deviations and sorted on percentagechange, the signal greatly improved. The most important changesrose to the top and were reviewed first.
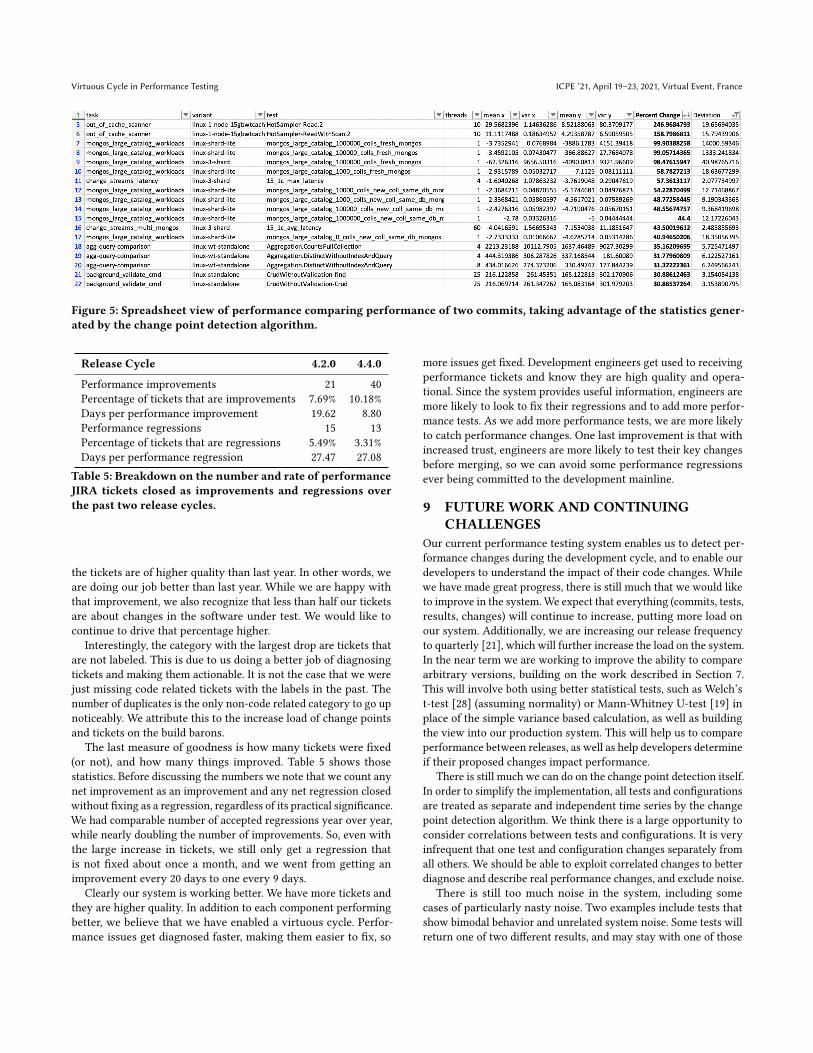
We regularly need the ability to compare two commits as part ofa monthly update on performance. Once a month we checkpoint thecurrent status of performance for the development branch againstthe previous month, and against the last stable release. This givesus the big picture on the state of performance, in addition to thedetailed results from change point detection. Figure 5 shows aspreadsheet we created using this process for a recent monthlycheckpoint on the state of performance. The figure shows the twostandard deviation filter applied (“Deviation” column), and thensorted on the “Percent Change” column. This view enabled us toquickly review all the real changes and avoid changes that weredue to noisy tests. For example, the top test is 250% faster acrossthe comparison. While we have shown performance improvementsin the figure, we review both improvements and regressions to geta complete view of the state of performance.
In practical terms, this POC has lowered the cost of reviewingthe monthly build from multiple hours, to somewhere between 30and 60 minutes. Additionally, all of that time is now productive timelooking at real issues. If there are more issues, it takes more time,and if there are fewer, it takes less time. We expect to transitionthis view from the CSV and proof of concept stage, into anotherpage in our production system available to all engineers. We alsoexpect to implement more rigorous statistical tests.
Release Cycle 4.2.0 4.4.0
Total Tickets 273 393Resolved Tickets 252 346Percent Resolved 92.3% 88.0%Resolved by Release 205 330Percent Resolved by Release 75.1% 84.0%Release Duration 412 352Tickets per Day 0.66 1.12
Table 3: Statistics on performance related JIRA tickets overthe previous two release cycles.
Release Cycle 4.2.0 4.4.0
Code related 28.57% 43.06%Test related 8.73% 7.80%Configuration related 0.00% 0.58%System related 28.17% 24.86%Noise related 7.94% 6.94%Duplicate ticket 11.11% 14.45%Not labeled 16.67% 2.31%
Table 4: Breakdown of root causes for performance JIRAtickets.
8 IMPACTThe combination of the changes described above has had notice-able impact on our performance testing infrastructure and on ourengineering organization. The basic way we track a performancechange is a JIRA tickets. We compiled statistics from our JIRA tick-ets to quantify part of that impact. The statistics are aligned withour release cycle, which is nominally a year long.
We had considerably more performance related BF tickets in4.4.0 than 4.2.0, over a shorter release cycle. Tickets per day wentfrom 0.66 to 1.12, a 70% increase.We had a large increase in tickets,but simultaneously increased the percentage of tickets resolved bythe release. Those are both positive signs, especially since we spentthe same amount of time triaging those changes, but it is only trulypositive if the ticket quality has stayed the same or improved.
Table 4 shows quality information about our performance tickets.We label every ticket based on its cause. The best case is for thechange to be code related: that indicates that the ticket captures aperformance change based on changes in the code under test. Theseare tickets telling us something useful about our software. Thereare many other causes for tickets however. Performance changescan be created due to changes in the test (test related) or the testbedconfiguration (configuration related), the system itself can directlycause an error (system related), or noise in the system can createa false alert (noise related). Sometimes we create multiple ticketswhich we eventually determine are the same cause (duplicate ticket).Finally, some tickets are not labeled at all because they do not havea clear cause.
The fraction of code related tickets has gone up, even as the ticketvolume has also gone up. We can conclude that we are generatingmore tickets, with the same amount of time dedicated to triage, and
Virtuous Cycle in Performance Testing ICPE ’21, April 19–23, 2021, Virtual Event, France
Figure 5: Spreadsheet view of performance comparing performance of two commits, taking advantage of the statistics gener-ated by the change point detection algorithm.
Release Cycle 4.2.0 4.4.0
Performance improvements 21 40Percentage of tickets that are improvements 7.69% 10.18%Days per performance improvement 19.62 8.80Performance regressions 15 13Percentage of tickets that are regressions 5.49% 3.31%Days per performance regression 27.47 27.08
Table 5: Breakdown on the number and rate of performanceJIRA tickets closed as improvements and regressions overthe past two release cycles.
the tickets are of higher quality than last year. In other words, weare doing our job better than last year. While we are happy withthat improvement, we also recognize that less than half our ticketsare about changes in the software under test. We would like tocontinue to drive that percentage higher.
Interestingly, the category with the largest drop are tickets thatare not labeled. This is due to us doing a better job of diagnosingtickets and making them actionable. It is not the case that we werejust missing code related tickets with the labels in the past. Thenumber of duplicates is the only non-code related category to go upnoticeably. We attribute this to the increase load of change pointsand tickets on the build barons.
The last measure of goodness is how many tickets were fixed(or not), and how many things improved. Table 5 shows thosestatistics. Before discussing the numbers we note that we count anynet improvement as an improvement and any net regression closedwithout fixing as a regression, regardless of its practical significance.We had comparable number of accepted regressions year over year,while nearly doubling the number of improvements. So, even withthe large increase in tickets, we still only get a regression thatis not fixed about once a month, and we went from getting animprovement every 20 days to one every 9 days.
Clearly our system is working better. We have more tickets andthey are higher quality. In addition to each component performingbetter, we believe that we have enabled a virtuous cycle. Perfor-mance issues get diagnosed faster, making them easier to fix, so
more issues get fixed. Development engineers get used to receivingperformance tickets and know they are high quality and opera-tional. Since the system provides useful information, engineers aremore likely to look to fix their regressions and to add more perfor-mance tests. As we add more performance tests, we are more likelyto catch performance changes. One last improvement is that withincreased trust, engineers are more likely to test their key changesbefore merging, so we can avoid some performance regressionsever being committed to the development mainline.
9 FUTUREWORK AND CONTINUINGCHALLENGES
Our current performance testing system enables us to detect per-formance changes during the development cycle, and to enable ourdevelopers to understand the impact of their code changes. Whilewe have made great progress, there is still much that we would liketo improve in the system.We expect that everything (commits, tests,results, changes) will continue to increase, putting more load onour system. Additionally, we are increasing our release frequencyto quarterly [21], which will further increase the load on the system.In the near term we are working to improve the ability to comparearbitrary versions, building on the work described in Section 7.This will involve both using better statistical tests, such as Welch’st-test [28] (assuming normality) or Mann-Whitney U-test [19] inplace of the simple variance based calculation, as well as buildingthe view into our production system. This will help us to compareperformance between releases, as well as help developers determineif their proposed changes impact performance.
There is still much we can do on the change point detection itself.In order to simplify the implementation, all tests and configurationsare treated as separate and independent time series by the changepoint detection algorithm. We think there is a large opportunity toconsider correlations between tests and configurations. It is veryinfrequent that one test and configuration changes separately fromall others. We should be able to exploit correlated changes to betterdiagnose and describe real performance changes, and exclude noise.
There is still too much noise in the system, including somecases of particularly nasty noise. Two examples include tests thatshow bimodal behavior and unrelated system noise. Some tests willreturn one of two different results, and may stay with one of those
ICPE ’21, April 19–23, 2021, Virtual Event, France David Daly
results for a period of time before reverting to the other (e.g., 5tests runs at 20 followed by 4 tests runs at 10). The change pointdetection algorithm has a very hard time with bimodal behavioras it looks like a statistical change. Today, a human has to filterthese changes out. There are also cases of system noise that are realperformance changes due to compiler changes. Sometimes these aredue to code layout issues letting a critical code segment fit within ornot fit within a performance-critical hardware cache. These issuesmanifest as deterministic changes in performance, but there is notmuch we can do about them except filter them out by hand.
Ultimately, the goal of all of this work can be described as a multi-dimensional optimization problem. We want to simultaneously:
• Maximize the useful signal on performance versus noise anddistractions.
• Maximize the test and configuration coverage.• Minimize the cost of performance testing.• Minimize the time from creation of a performance change toits detection, diagnosis, and fix. (the limit of this is catchinga regression before commit).
We have work to do on all of these points. Often, in the past, wehave found ourselves with bad options, which explicitly trade offone point for another. We hope to develop techniques that improveone or more items above at the same time, without hurting theothers.
10 RELATEDWORKRelated work has looked at testing performance in continuous inte-gration systems. Rehman et al. [26] describe the system developedfor testing SAP HANA and stressed the need for complete automa-tion. The system compared results to a user specified limit in orderto determine a pass fail criterion. The authors also discuss chal-lenges in reproducibility, isolation, and getting developers to acceptresponsibility for issues.
Continuous integration tests need to be fast, but standard bench-marks require extended periods of time to run. Laaber and Leit-ner [17] looked at using microbenchmarks for performance testingin continuous integration to deal with this problem. They foundsome, but not all microbenchmarks are suitable for this purpose.
Once performance tests are included in a CI system, the nextchallenge is to efficiently isolate the changes. Muhlbauer et al. [22]describe sampling performance histories to build a Gaussian Pro-cess model of those histories. The system decides which versionsshould be tested in order to efficiently build up an accurate model ofperformance over time and to isolate abrupt performance changes.The paper addresses a problem similar to our previous work ondetecting change points in test histories [10], although our previouswork assumes performance test results have a constant mean valuebetween change points.
Test result noise is an ongoing challenge. Several papers investi-gate both sources of noise [12, 20] and quantifying the impact ofthat noise [18]. Duplyakin et al. [12] use change point detection toidentify when the performance of the nodes in a datacenter change.Their objective is to identify and isolate those performance changesin order to keep them from impacting experiments run in the data-center. The paper by Maricq et al. [20] includes a number of practi-cal suggestions to reduce performance variability. The suggestions
should be useful for anyone running performance benchmarks, andwe perform many of these suggestions in our system. They alsoshow the lack of statistical normality in their results, validating ourdesign choice to not assume normality. Finally, Laaber et al. [18]compare the variability of different microbenchmark tests acrossdifferent clouds and instance types on those clouds, demonstratingthat different tests and different instance types have wildly differ-ent performance variability. Running benchmark test and controlexperiments on the same hardware can help control the impact ofthat noise.
The related area of energy consumption testing shows similarissues with test noise. Ournani et al. [24] describe the impact of CPUfeatures (C-states, TurboBoost, core pinning) on energy variability.We have observed similar impacts on performance variability fromthose factor in our test environment [14]. Other work looks atextending the state of the art for change point detection in thepresence of outliers [25]. Our system is sensitive to outliers inthe results as well. Our efforts on outlier detection would havehelped reduce the impact of outliers in our use case, if it had beensuccessful.
Finally, there is ongoing work related to our ultimate goal ofmore efficiently detecting changes while simultaneously increasingour overall performance test coverage. Grano et al. [13] investigatedtesting with fewer resources. While this work is focused on correct-ness testing, the principles can be extended to performance testing.Multiple papers [11, 15] try to identify which software changesare most likely to have performance impact in order to prioritizethe testing of those changes. Huang et al. [15] use code analysisof software changes to decide which changes are most likely toimpact which tests, while de Oliveria et al. [11] use many indica-tors (including static and dynamic data) to build a predictor of thelikelihood of a performance change in the tests based on a givensoftware change. Other work has focused on efficiently findingperformance changes across both versions and configurations [23]and is specifically focused on minimizing test effort while enablingthe testing of potentially huge space of configuration options andsoftware changes. We hope to build on these efforts to improve theefficiency of our performance testing.
11 ACKNOWLEDGMENTSThe work described in this paper was done by a large collectionof people within MongoDB. Key teams include the Decision Au-tomation Group (including David Bradford, Alexander Costas, andJim O’Leary) who are collectively responsible for all of our analysiscode, the Server Tooling and Methods team who own the testinginfrastructure, the Evergreen team which built Cedar and Poplarfor the expanded metrics support, and of course our dedicated buildbaron team whom make the whole system work.
We would also like to thank Eoin Brazil for his feedback on draftsof this paper.
12 CONCLUSIONIn this paper we have reviewed a number of recent changes to ourperformance testing infrastructure at MongoDB. This builds onprevious work we have done to automate our performance testingenvironment, reduce the noise in the environment (both actual
Virtuous Cycle in Performance Testing ICPE ’21, April 19–23, 2021, Virtual Event, France
noise and its impact), and better makes use of the results from ourperformance testing. This infrastructure is critical to our softwaredevelopment processes in order to ensure the overall quality of thesoftware we develop.
We first reviewed the general increase in load on the infrastruc-ture. Each year we run more tests in more configurations while ourdevelopers commit more changes to our source repository. Overallwe had a more than 3𝑥 increase over two years in the total possiblenumber of test results to generate and analyze.
Paired with the general increase in load, we focused on improv-ing the scalability of our ability to process those results and isolateperformance changes. We also added the ability to report more andmore descriptive results from tests, enabling saving informationabout every operation within a performance test. This required newsystems to store and process the results, as well as new displays fortriaging the results.
Attempting to better control system noise, we built a system todetect when the performance of our testbeds changed, and thereforewe should not trust the results of our performance tests. Whilepromising in theory, in practice this did not work as well as we hadhoped, and ultimately we disabled it.
Finally, we enabled better comparison of results between arbi-trary commits. This was a large open challenge for us. Buildingupon the change point detection system we use to process ourresults, we were able to give a much clearer view of the significantchanges between arbitrary commits, making it much easier to reg-ularly check the current state of the development software againstthe last stable release. We continue to both refine this comparisonof results and lift it into our production environment.
The cumulative impact of these changes and our previous workhas been to enable a virtuous cycle for performance at MongoDB.As the system is used more, we catch and address more performancechanges, leading us to use the system more. This virtuous cycledirectly increases the productivity of our development engineersand leads to a more performant product.
REFERENCES[1] [n.d.]. 1.3.5.17. Detection of Outliers. https://www.itl.nist.gov/div898/handbook/
eda/section3/eda35h.htm[2] [n.d.]. 1.3.5.17.3. Generalized Extreme Studentized Deviate Test for Outliers.
https://www.itl.nist.gov/div898/handbook/eda/section3/eda35h3.htm[3] [n.d.]. Evergreen Continuous Integration: Why We Reinvented The
17T18:10:30Z.[9] Brian F. Cooper, Adam Silberstein, Erwin Tam, Raghu Ramakrishnan, and Russell
Sears. 2010. Benchmarking cloud serving systems with YCSB. In Proceedings ofthe 1st ACM symposium on Cloud computing - SoCC ’10. ACM Press, Indianapolis,Indiana, USA, 143. https://doi.org/10.1145/1807128.1807152
[10] David Daly, William Brown, Henrik Ingo, Jim O’Leary, and David Bradford.2020. The Use of Change Point Detection to Identify Software PerformanceRegressions in a Continuous Integration System. In Proceedings of the ACM/SPECInternational Conference on Performance Engineering (ICPE ’20). Association forComputing Machinery, Edmonton AB, Canada, 67–75. https://doi.org/10.1145/3358960.3375791
[11] Augusto Born De Oliveira, Sebastian Fischmeister, Amer Diwan, MatthiasHauswirth, and Peter F. Sweeney. 2017. Perphecy: Performance Regression
Test Selection Made Simple but Effective. In 2017 IEEE International Confer-ence on Software Testing, Verification and Validation (ICST). 103–113. https://doi.org/10.1109/ICST.2017.17
[12] Dmitry Duplyakin, Alexandru Uta, Aleksander Maricq, and Robert Ricci. 2020. InDatacenter Performance, The Only Constant Is Change. In 2020 20th IEEE/ACMInternational Symposium on Cluster, Cloud and Internet Computing (CCGRID).370–379. https://doi.org/10.1109/CCGrid49817.2020.00-56
[13] Giovanni Grano, Christoph Laaber, Annibale Panichella, and SebastianoPanichella. 2019. Testing with Fewer Resources: An Adaptive Approach toPerformance-Aware Test Case Generation. IEEE Transactions on Software Engi-neering (2019), 1–1. https://doi.org/10.1109/TSE.2019.2946773 arXiv: 1907.08578.
[14] Henrik Ingo and David Daly. 2019. Reducing variability in performance tests onEC2: Setup and Key Results. https://engineering.mongodb.com/post/reducing-variability-in-performance-tests-on-ec2-setup-and-key-results
[15] Peng Huang, Xiao Ma, Dongcai Shen, and Yuanyuan Zhou. 2014. Perfor-mance regression testing target prioritization via performance risk analysis.In Proceedings of the 36th International Conference on Software Engineering(ICSE 2014). Association for Computing Machinery, Hyderabad, India, 60–71.https://doi.org/10.1145/2568225.2568232
[16] Henrik Ingo and David Daly. 2020. Automated system performance testing atMongoDB. In Proceedings of the workshop on Testing Database Systems (DBTest’20). Association for Computing Machinery, New York, NY, USA, 1–6. https://doi.org/10.1145/3395032.3395323
[17] Christoph Laaber and Philipp Leitner. 2018. An evaluation of open-source soft-ware microbenchmark suites for continuous performance assessment. In Pro-ceedings of the 15th International Conference on Mining Software Repositories(MSR ’18). Association for Computing Machinery, Gothenburg, Sweden, 119–130.https://doi.org/10.1145/3196398.3196407
[18] Christoph Laaber, Joel Scheuner, and Philipp Leitner. 2019. Software microbench-marking in the cloud. How bad is it really? Empirical Software Engineering 24, 4(Aug. 2019), 2469–2508. https://doi.org/10.1007/s10664-019-09681-1
[19] H. B. Mann and D. R. Whitney. 1947. On a Test of Whether one of Two RandomVariables is Stochastically Larger than the Other. Annals of Mathematical Statistics18, 1 (March 1947), 50–60. https://doi.org/10.1214/aoms/1177730491 Publisher:Institute of Mathematical Statistics.
[20] Aleksander Maricq, Dmitry Duplyakin, Ivo Jimenez, Carlos Maltzahn, RyanStutsman, and Robert Ricci. 2018. Taming Performance Variability. In 13th$\{$USENIX$\}$ Symposium on Operating Systems Design and Implementa-tion ($\{$OSDI$\}$ 18). 409–425. https://www.usenix.org/conference/osdi18/presentation/maricq
[21] Mat Keep and Dan Pasette. 2020. Accelerating Delivery with a New QuarterlyRelease Cycle, Starting with MongoDB 5.0 | MongoDB Blog. https://www.mongodb.com/blog/post/new-quarterly-releases-starting-with-mongodb-5-0
[22] Stefan Muhlbauer, Sven Apel, and Norbert Siegmund. 2019. Accurate Modelingof Performance Histories for Evolving Software Systems. In 2019 34th IEEE/ACMInternational Conference on Automated Software Engineering (ASE). IEEE, SanDiego, CA, USA, 640–652. https://doi.org/10.1109/ASE.2019.00065
[23] Stefan Mühlbauer, Sven Apel, and Norbert Siegmund. 2020. Identifying SoftwarePerformance Changes Across Variants and Versions. In 2020 35th IEEE/ACMInternational Conference on Automated Software Engineering (ASE). 12. https://doi.org/10.1145/3324884.3416573
[24] Zakaria Ournani, Mohammed Chakib Belgaid, Romain Rouvoy, Pierre Rust, JoelPenhoat, and Lionel Seinturier. 2020. Taming Energy Consumption Variations InSystems Benchmarking. In Proceedings of the ACM/SPEC International Conferenceon Performance Engineering (ICPE ’20). Association for Computing Machinery,New York, NY, USA, 36–47. https://doi.org/10.1145/3358960.3379142
[25] Paul Fearnhead and Guillem Rigaill. 2019. Changepoint Detection in the Presenceof Outliers. J. Amer. Statist. Assoc. 114, 525 (2019), 169–183. https://doi.org/10.1080/01621459.2017.1385466
[26] Kim-Thomas Rehmann, Changyun Seo, Dongwon Hwang, Binh Than Truong,Alexander Boehm, and Dong Hun Lee. 2016. Performance Monitoring in SAPHANA’s Continuous Integration Process. ACM SIGMETRICS Performance Evalu-ation Review 43, 4 (Feb. 2016), 43–52. https://doi.org/10.1145/2897356.2897362
[27] Bernard Rosner. 1983. Percentage Points for a Generalized ESD Many-OutlierProcedure. Technometrics 25, 2 (1983), 165–172. https://doi.org/10.2307/1268549Publisher: [Taylor & Francis, Ltd., American Statistical Association, AmericanSociety for Quality].
[28] B. L. Welch. 1947. The Generalization of ’Student’s’ Problem When SeveralDifferent Population Variances are Involved. Biometrika 34, 1-2 (Jan. 1947), 28–35.https://doi.org/10.1093/biomet/34.1-2.28 Publisher: Oxford Academic.