77
Creating Action Sequences

Creating Action Sequences

This document is copyright © 2012 Pentaho Corporation. No part may be reprinted without written permission fromPentaho Corporation. All trademarks are the property of their respective owners.
Help and Support ResourcesIf you have questions that are not covered in this guide, or if you would like to report errors in the documentation,please contact your Pentaho technical support representative.
Support-related questions should be submitted through the Pentaho Customer Support Portal athttp://support.pentaho.com.
For information about how to purchase support or enable an additional named support contact, please contact yoursales representative, or send an email to [email protected].
For information about instructor-led training on the topics covered in this guide, visithttp://www.pentaho.com/training.
Limits of Liability and Disclaimer of WarrantyThe author(s) of this document have used their best efforts in preparing the content and the programs containedin it. These efforts include the development, research, and testing of the theories and programs to determine theireffectiveness. The author and publisher make no warranty of any kind, express or implied, with regard to theseprograms or the documentation contained in this book.
The author(s) and Pentaho shall not be liable in the event of incidental or consequential damages in connectionwith, or arising out of, the furnishing, performance, or use of the programs, associated instructions, and/or claims.
TrademarksPentaho (TM) and the Pentaho logo are registered trademarks of Pentaho Corporation. All other trademarks are theproperty of their respective owners. Trademarked names may appear throughout this document. Rather than listthe names and entities that own the trademarks or insert a trademark symbol with each mention of the trademarkedname, Pentaho states that it is using the names for editorial purposes only and to the benefit of the trademarkowner, with no intention of infringing upon that trademark.
Company InformationPentaho CorporationCitadel International, Suite 3405950 Hazeltine National DriveOrlando, FL 32822Phone: +1 407 812-OPEN (6736)Fax: +1 407 517-4575http://www.pentaho.com
E-mail: [email protected]
Sales Inquiries: [email protected]
Documentation Suggestions: [email protected]
Sign-up for our newsletter: http://community.pentaho.com/newsletter/

| TOC | 3
Contents
Introduction................................................................................................................................5What is an Action Sequence?....................................................................................................6What is a Solution?....................................................................................................................7Requirements and Recommendations...................................................................................... 8Using Design Studio.................................................................................................................. 9
Initial Design Studio Configuration................................................................................................................9Using PDI Data Sources in Action Sequences................................................................................ 10
The Design Studio Interface....................................................................................................................... 10Creating Design Studio Templates............................................................................................................. 11
Creating a Solution Directory...................................................................................................12Your First Action Sequence.....................................................................................................13Anatomy of an Action Sequence............................................................................................. 14
Output Types.............................................................................................................................................. 15Input Types.................................................................................................................................................16Resources...................................................................................................................................................17Parameter Data Types................................................................................................................................18
Action Definition Reference..................................................................................................... 19ContentRepositoryCleaner......................................................................................................................... 19EmailComponent........................................................................................................................................ 20PrintComponent..........................................................................................................................................22SecureFilterComponent..............................................................................................................................23SubActionComponent.................................................................................................................................26TemplateComponent (Message Template)................................................................................................ 28JavascriptRule............................................................................................................................................ 28SimpleReportingComponent.......................................................................................................................29JFreeReportComponent............................................................................................................................. 32Charting...................................................................................................................................................... 35
JFreeChart (ChartComponent)........................................................................................................ 35Pentaho ChartBeans (ChartBeansComponent)...............................................................................35OpenFlashChart (OpenFlashChartComponent).............................................................................. 35
Editing Existing Action Sequences.......................................................................................... 54Internationalization Guidelines.................................................................................................55Action Sequence Error Handling............................................................................................. 57
Customizing Error Output........................................................................................................................... 57Error Token Reference............................................................................................................................... 58
Basic Action Sequence Tips and Tricks.................................................................................. 60Emailing a Report....................................................................................................................................... 60
Advanced Action Sequence Tips and Tricks........................................................................... 63Using Java Virtual Machine Input Parameters............................................................................................63Using Action Sequence Variables in Kettle/PDI......................................................................................... 63Sharing Result Sets in Action Sequences.................................................................................................. 66Using Security Information In Action Sequences........................................................................................67Content Linking in Dashboards...................................................................................................................68
In-Depth Action Sequence Tutorials........................................................................................69Creating a Bar Chart Using the Flash Chart Component........................................................................... 69
Configuring Design Studio............................................................................................................... 69Creating the Chart Definition............................................................................................................70Creating the Action Sequence......................................................................................................... 72Viewing your Chart in the BI Platform.............................................................................................. 75Finding More Information................................................................................................................. 76
Troubleshooting.......................................................................................................................77Action Sequences That Call PDI Content Won't Run................................................................................. 77
Adding PDI Enterprise Repository Content Support to the BA Server.............................................77

| TOC | 4
Null Pointer Exception When Sharing Result Sets..................................................................................... 77

| Introduction | 5
Introduction
Action sequences are a unique and powerful feature of the Pentaho BI Platform; they enable BI developers andbusiness users to perform advanced tasks that cannot easily be accomplished through Pentaho's design tools anduser interface functions, including interaction with third-party software frameworks. This guide is designed to helpexperienced BI Platform users learn to create and edit action sequences using the Action Sequence Editor built intoPentaho Design Studio.
Note: This guide is not yet finished. It is being published early because it contains a great deal of usefulinformation, and the extended delay caused by completing the component reference and action sequenceexamples would unreasonably prevent it from reaching Pentaho Business Analytics Enterprise Editioncustomers in an acceptable timeframe. Please do let your Pentaho sales or support representative know if thereare unfinished or missing sections that you would like to read.

| What is an Action Sequence? | 6
What is an Action Sequence?
An action sequence is an XML document that defines an ordered set of action definitions that together perform asingle task; it is the smallest complete task that the Pentaho BI Platform's solution engine can perform. It is useful forsequencing small, linear, success-oriented tasks like reporting and bursting, and has the ability to loop through a resultset, call other action sequences, and conditionally execute components.
Action sequences can be created through raw XML (though the DOM for each component can be unique), or throughthe graphical interface built into Design Studio (though not every function in every component is supported).

| What is a Solution? | 7
What is a Solution?
A collection of action sequences that fit a common theme or purpose is called a solution, and each solution is typicallyin its own directory. By default, all solutions are in subdirectories in the /pentaho/server/biserver-ee/pentaho-solutions/ directory, which is mirrored in the solution repository database. Mirroring the solutions directory allows theBI Platform to have fine-grained control of user and role access to each file and subdirectory.

| Requirements and Recommendations | 8
Requirements and Recommendations
At its core, an action sequence is an XML file with a .xaction extension. Because each component and plugin has itsown unique inputs, outputs, and action definitions, it's best not to try to create an action sequence by hand with an XMLeditor -- you'll quickly get lost. Instead, you should use the Action Sequence Editor built into Pentaho Design Studio.
Design Studio is a standalone tool that facilitates the creation and management of action sequences using a graphicalinterface, and should be your tool of choice when creating, editing, and publishing action sequences. It doesn't requireknowledge or manipulation of the underlying XML, but does offer an XML editor so that you can hand-edit actionsequences that you create through the standard user interface. While you do not necessarily need to understand howto code the bare XML for each component in order to create simple action sequences, more complex operations requirehand-editing.
Note: Some BI Platform components -- especially very new ones -- may not be fully or correctly implemented inDesign Studio, and will require hand-editing.
Design Studio is included with a standard Pentaho Business Analytics Enterprise Edition workstation deployment. Ifit is not installed on your system, you can either re-run the Pentaho Business Analytics installation utility, or you candownload an individual Design Studio package from the Pentaho Customer Support Portal. If you are on a supported64-bit operating system, you will have to install the Eclipse integrated development environment for your platform onyour own, then download and install the Pentaho Action Sequence Editor Eclipse plugins. Instructions for this processare included in the Pentaho Archive-Based Installation Guide, which is available in the Pentaho InfoCenter.
In order to test and publish your action sequences, you will have to either install Design Studio on the same machineas your BI Server, or you will have to install a standalone BI Server instance for action sequence development on yourworkstation. Once you've developed and tested your new action sequence, you can copy it over to your productionserver to deploy it.

| Using Design Studio | 9
Using Design Studio
This section explains how to use the basic functionality of the Action Sequence Editor in Pentaho Design Studio.
Initial Design Studio ConfigurationWhen you first launch Design Studio, you must establish a workspace and an Eclipse project before you can begincreating action sequences. Follow the below directions to initialize Design Studio.
1. Start Pentaho Design Studio.
On Windows, you can start Design Studio through the Start menu in the Pentaho Business Analytics category. OnLinux, run the /pentaho/design-tools/design-studio/PentahoDesignStudio script.
2. If this is the first time you've run Design Studio, you'll be asked to type in a workspace location. Type in /pentaho/server/biserver-ee/pentaho-solutions/, or whatever the location of your solutions directory is.
This is where Eclipse (the integrated development environment that Design Studio is based on) stores project files.Using the solutions directory for the BI Platform ensures that your xactions will be easily accessible from it.
3. Start a new Eclipse project by going to the File menu, then selecting New, then clicking Project in the sub-menu.
A New Project selection window will appear.
4. Click the triangle next to General, then click the Project item under it, then click Next.
5. Type learning_solutions in the Project Name field, then click Finish.
You will return to the Welcome screen.
6. Click Workbench to go to the Eclipse workbench.
This is the view you will need to be in to perform most Design Studio functions.
Design Studio is now configured with a Pentaho workspace and a project directory for creating and managing newaction sequences.
When you are ready to create production-quality action sequences, you should start a new Eclipse project for each newsolution.

| Using Design Studio | 10
Using PDI Data Sources in Action Sequences
If you have any action sequences that rely on Pentaho Data Integration (PDI) data sources that are stored in anenterprise repository, you must make a configuration change in order to run them.
Create a .kettle directory in the home directory of the user account that runs the BI Server, and copy therepositories.xml file from your local PDI configuration directory to the new one you just created on the BI Servermachine.
You must also edit the /pentaho-solutions/system/kettle/settings.xml file and put in your PDI enterpriserepository information.
Once these changes have been made, restart the BI Server. When it comes back up, the Use Kettle Repositoryfunction in Pentaho Design Studio should properly connect to the DI Server.
The Design Studio InterfaceDesign Studio features a modular interface with the following tabs:
• General This tab enables you to define and modify basic values including the logging level, result type, and icon forthe action sequence.
• Define Process This tab is where you define the process inputs, process actions, and process outputs that gotogether to make up an action sequence.
• XML Source This tab enables you to view the bare action sequence XML.• Test This tab allows you to test the action sequence inside of Design Studio.
Note: The Test tab does not work on Linux or Solaris. To test an action sequence, publish it to your test server
Design Studio starts by default in a specialized view that limits its interface options to the actions defined in thetemplate. You can switch to Generic Component Mode, which shows all possible component parameters, by clickingthe toggle button to the right of Process Inputs, shown in the graphic below underneath the untitled1.xaction tab:
The following example shows the JFree_Quad.xaction in the Define Process tab with some defined process inputs,process actions, and process outputs. The focus is on the REGION process input, so the right pane shows the optionsfor defining this specific input.
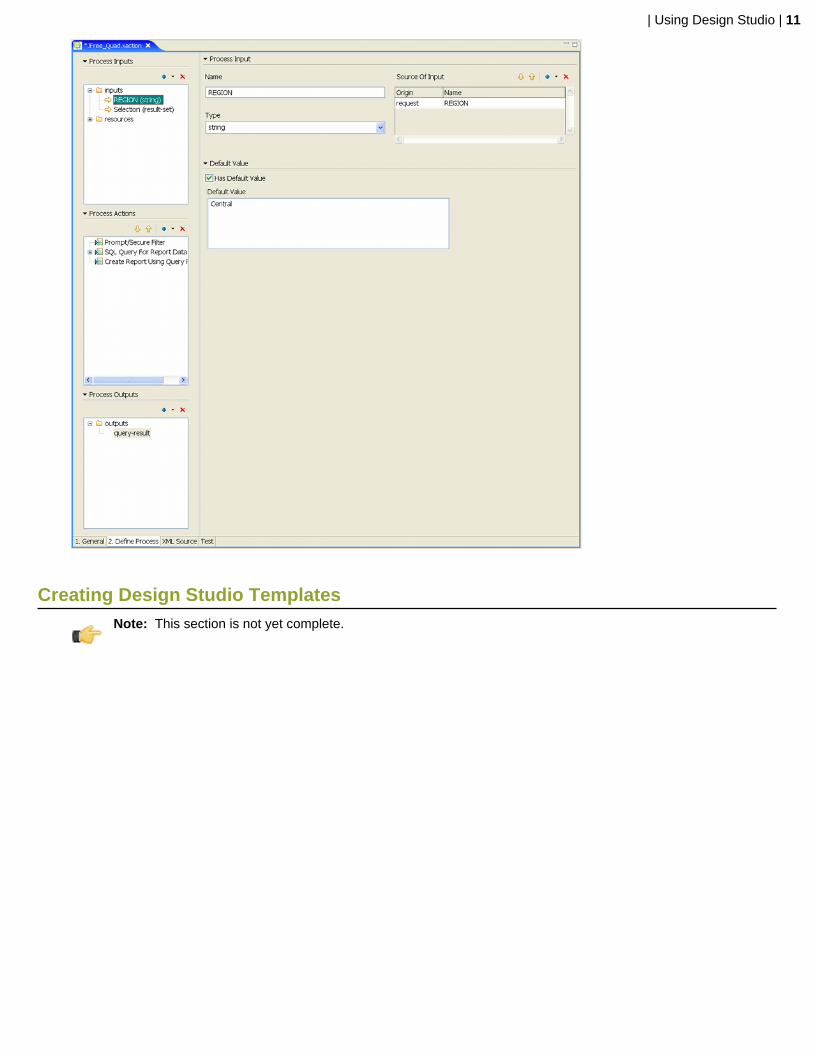
| Using Design Studio | 11
Creating Design Studio TemplatesNote: This section is not yet complete.
| Creating a Solution Directory | 12
Creating a Solution Directory
Before you begin creating action sequences, it makes sense to create a directory to store them in. In theory, thisdirectory will contain a collection of action sequences that fit a common purpose or theme -- a solution, which wouldmake this a solution directory. You should create a new directory for every solution you develop.
1. Create a new directory in /pentaho/server/biserver-ee/pentaho-solutions/.
Use underscores instead of spaces in the solution directory name. Ensure that the directory has the appropriate userand group ownership to be writable from the BI Platform.
2. Using an XML-aware text editor (or Design Studio), create a file named index.xml in your new solution directory.
3. Copy the following text into the index.xml file, changing the content accordingly:
<index> <name>Example Solution</name> <description>This solution contains examples I created while learning to work with action sequences.</description> <icon></icon> <visible>true</visible> <display-type>icons</display-type></index>
4. Save the file and close the text editor.
5. Log into the Pentaho User Console as an administrator.
6. Refresh the solution repository cache by going to the Tools menu, then selecting the Refresh submenu, thenclicking on Repository Cache.
You now have a new solution directory. It will show up in all file dialogues in the Pentaho User Console as well as theSolution Browser in the left pane.
Every time you add or edit an action sequence to your solution directory, you must refresh the repository cache asexplained above. Each user currently logged into the Pentaho User Console must also refresh their session cache; thisis best done by re-logging into the Pentaho User Console.
| Your First Action Sequence | 13
Your First Action Sequence
Follow the directions below to create the simplest kind of functional action sequence with Design Studio.
1. In Design Studio, go to the File menu, then select New, and click on Other... in the sub-menu.
The New window will appear.
2. In the New window, click the triangle next to Pentaho, select New Action Sequence Wizard, then click Next.
3. In the File name field, type hello_world.xaction.
4. Select Hello World from the Template drop-down box, then click Finish.
The wizard will generate the new file and bring you back to the workbench.
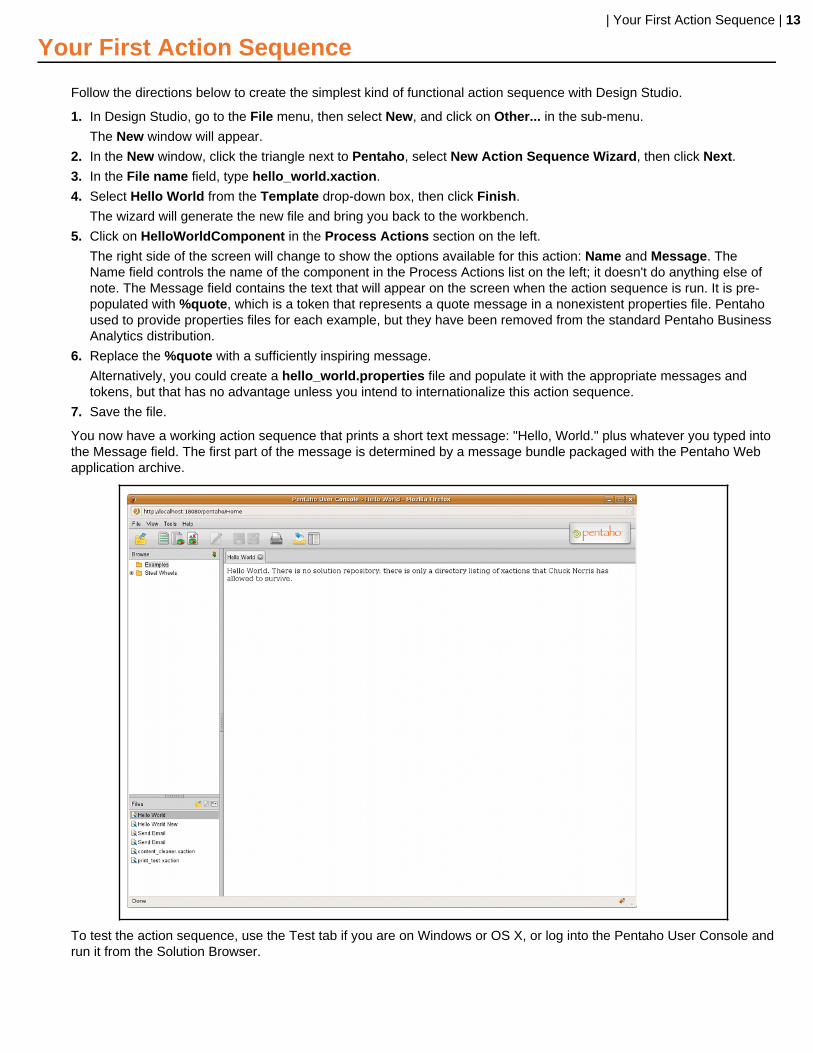
5. Click on HelloWorldComponent in the Process Actions section on the left.
The right side of the screen will change to show the options available for this action: Name and Message. TheName field controls the name of the component in the Process Actions list on the left; it doesn't do anything else ofnote. The Message field contains the text that will appear on the screen when the action sequence is run. It is pre-populated with %quote, which is a token that represents a quote message in a nonexistent properties file. Pentahoused to provide properties files for each example, but they have been removed from the standard Pentaho BusinessAnalytics distribution.
6. Replace the %quote with a sufficiently inspiring message.
Alternatively, you could create a hello_world.properties file and populate it with the appropriate messages andtokens, but that has no advantage unless you intend to internationalize this action sequence.
7. Save the file.
You now have a working action sequence that prints a short text message: "Hello, World." plus whatever you typed intothe Message field. The first part of the message is determined by a message bundle packaged with the Pentaho Webapplication archive.
To test the action sequence, use the Test tab if you are on Windows or OS X, or log into the Pentaho User Console andrun it from the Solution Browser.

| Anatomy of an Action Sequence | 14
Anatomy of an Action Sequence
In the below example action sequence, an email is generated and sent to either Joe or Suzy, depending on whichregion the user selects. There are four inputs: region, from, subject, and message-plain. The region input type isdefined as a string, and it has a default value of Central. Region may come from one of two sources: request orsession. When the RuntimeContext resolves the region input at runtime, it will first look in the request (most likelyan HTTP request). If it doesn't find it in the request, it will look in the session (most likely the HTTP session). If it is notavailable in the session, the default value will be used. The order that the sources are specified in the XML document isthe order that they will be searched. The default is always used as a last resort.
The other three inputs only specify a default value. This is analogous to hard-coding the parameters to a constant value.Since the output of this action sequence is an email message, no output parameters will be set.
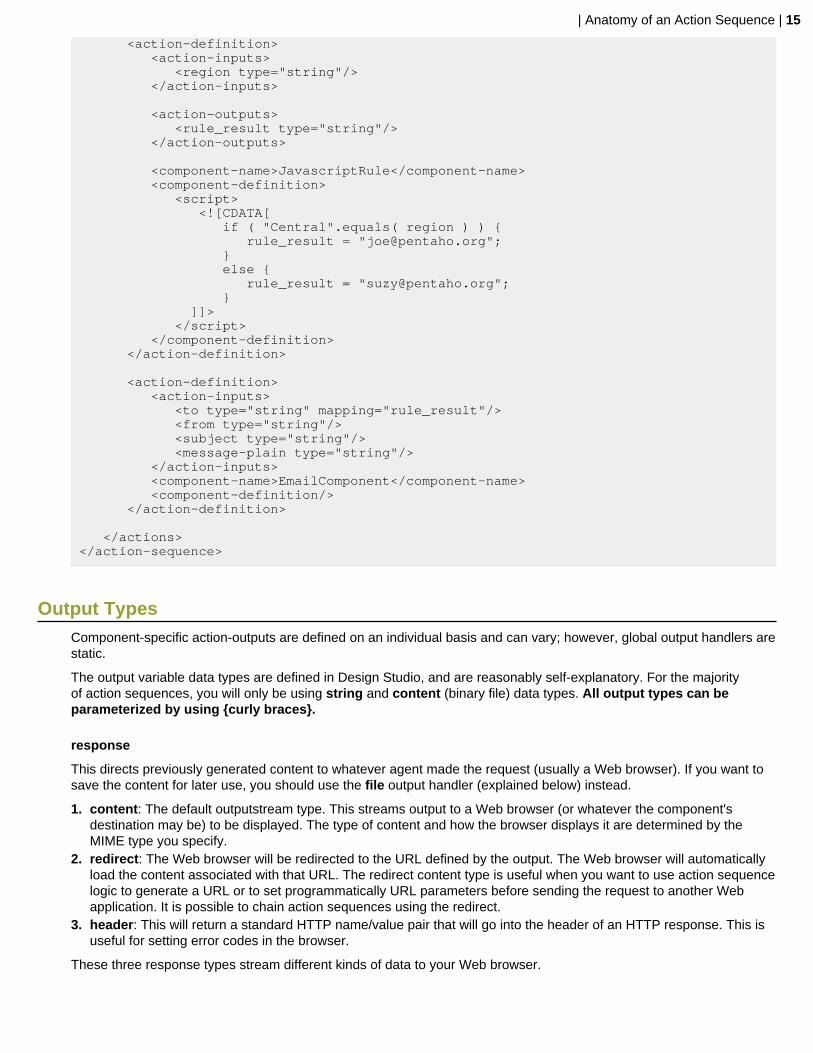
There are two action-definition nodes for this sequence. The first invokes the JavascriptRule component and takesa region parameter as input; it will create a new parameter called rule_result as output. This new parameter will bemade available to other action-definition nodes in the sequence.
The JavaScript defined in the component-definition will be executed and will set the value of rule_result to theappropriate email address, based on the value of region.
When the first action-definition completes, the second, which defines an interaction with EmailComponent, willexecute. EmailComponent requires four action-inputs: to, from, subject, and message-plain.
You may have noticed that some of the action-inputs (from, subject and message-plain) are also specified in theinputs section of the action sequence header. The RuntimeContext will take the values from there and pass them toEmailComponent just as it passed region to the JavascriptRule. The source of the action-input is indirectly defined withthe mapping attribute, which tells the RuntimeContext to use the value from rule_result that was generated by theJavascriptRule action and use it as the component's to input.
<action-sequence> <name>Example1.xaction</name>
<documentation> <author>Chuck Norris</author> <description>Email to selected user</description> <help>There is no help when Chuck Norris emails you</help> </documentation>
<inputs> <region type="string"> <default-value>Central</default-value> <sources> <request>REGION</request> <session>aRegion</session> </sources> </region>
<from type="string"> <default-value>[email protected]</default-value> </from>
<subject type="string"> <default-value>Pentaho Example1</default-value> </subject>
<message-plain type="string"> <default-value> This is an email from the Pentaho BI Platform - Example1 </default-value> </message-plain> </inputs>
<outputs/>
<resources/>
<actions>
| Anatomy of an Action Sequence | 15
<action-definition> <action-inputs> <region type="string"/> </action-inputs>
<action-outputs> <rule_result type="string"/> </action-outputs>
<component-name>JavascriptRule</component-name> <component-definition> <script> <![CDATA[ if ( "Central".equals( region ) ) { rule_result = "[email protected]"; } else { rule_result = "[email protected]"; } ]]> </script> </component-definition> </action-definition>
<action-definition> <action-inputs> <to type="string" mapping="rule_result"/> <from type="string"/> <subject type="string"/> <message-plain type="string"/> </action-inputs> <component-name>EmailComponent</component-name> <component-definition/> </action-definition>
</actions></action-sequence>
Output TypesComponent-specific action-outputs are defined on an individual basis and can vary; however, global output handlers arestatic.
The output variable data types are defined in Design Studio, and are reasonably self-explanatory. For the majorityof action sequences, you will only be using string and content (binary file) data types. All output types can beparameterized by using {curly braces}.
response
This directs previously generated content to whatever agent made the request (usually a Web browser). If you want tosave the content for later use, you should use the file output handler (explained below) instead.
1. content: The default outputstream type. This streams output to a Web browser (or whatever the component'sdestination may be) to be displayed. The type of content and how the browser displays it are determined by theMIME type you specify.
2. redirect: The Web browser will be redirected to the URL defined by the output. The Web browser will automaticallyload the content associated with that URL. The redirect content type is useful when you want to use action sequencelogic to generate a URL or to set programmatically URL parameters before sending the request to another Webapplication. It is possible to chain action sequences using the redirect.
3. header: This will return a standard HTTP name/value pair that will go into the header of an HTTP response. This isuseful for setting error codes in the browser.
These three response types stream different kinds of data to your Web browser.

| Anatomy of an Action Sequence | 16
Below is a typical global output response example; just replace content with redirect or header to define otherresponse types:
<outputs> <myReport type="string"> <destinations> <response>content</response> </destinations> </myReport> </outputs>
file
This is direct output to a file. The path to the file is defined through a platform-specific URI. The default location is theBI Server's working directory. If the location you specify does not exist, the BI Platform will attempt to create it. If the filename you specify is already in use, the existing file will be replaced with the new one you are generating.
<outputs> <myReport type="content"> <destinations> <file>file:invoice_{orderkey}.pdf</file> </destinations> </myReport> </outputs>
Apache VFS
This directs output to the Apache Commons Virtual Filesystem. Currently, only the FTP destination type is supported.
<outputs> <content type="content"> <destinations> <vfs-ftp>vfs-ftp://ftp.example.org|bsmith:[email protected]/mytest.txt</vfs-ftp> </destinations> </content> </outputs>
Custom output types
You can define your own output type in the BI Platform by writing an output class, then mapping it to a new outputtype in the /pentaho/server/biserver-ee/pentaho-solutions/system/pentahoObjects-spring.xmlconfiguration file. Once that work is complete, you can use the new output type in an action sequence. This is usefulfor action sequence output that has to be formatted in a certain way, particularly for use as an input file for otherapplications.
<outputs> <myReport type="content"> <destinations> <myOutput>myoutput:custom_app_data_{datestamp}.xmp</myOutput> </destinations> </myReport> </outputs>
Input TypesInputs are typically small, dynamic data sources that are available globally for all actions in an action sequence. Each isdeclared as a variable with a static data type, one or more methods of retrieving the data, and a default value in case nodata is retrieved.
Note: If you declare a default-value without assigning a value, the user running the action sequence will beprompted for a value, if possible.
| Anatomy of an Action Sequence | 17
There are four potential sources for input values:
1. runtime: parameters that are stored in the runtime context, which retains the inputs and outputs from previousinstances and makes them available to future executions of the same runtime instance-id.
2. request: the name/value pairs specified on a URL.3. session: variables that are stored in the user's session and may contain unique values for each user.4. global: similar to session parameters, except they have the same values for all users. Global scope contains the
output of any global startup action sequences or any action sequences that have explicitly output to global.
<inputs> <region type="string"> <sources> <request>REGION</request> <runtime>aRegion</runtime> </sources> <default-value>Central</default-value> </region></inputs>
In the above example, a single input named region is declared as a string. The BI Platform first attempts to get thevalue from the REGION variable in the browser request; if no value is found, the BI Platform looks in the runtime contextfor an aRegion variable; if no value is found there either, the default value of Central is assigned.
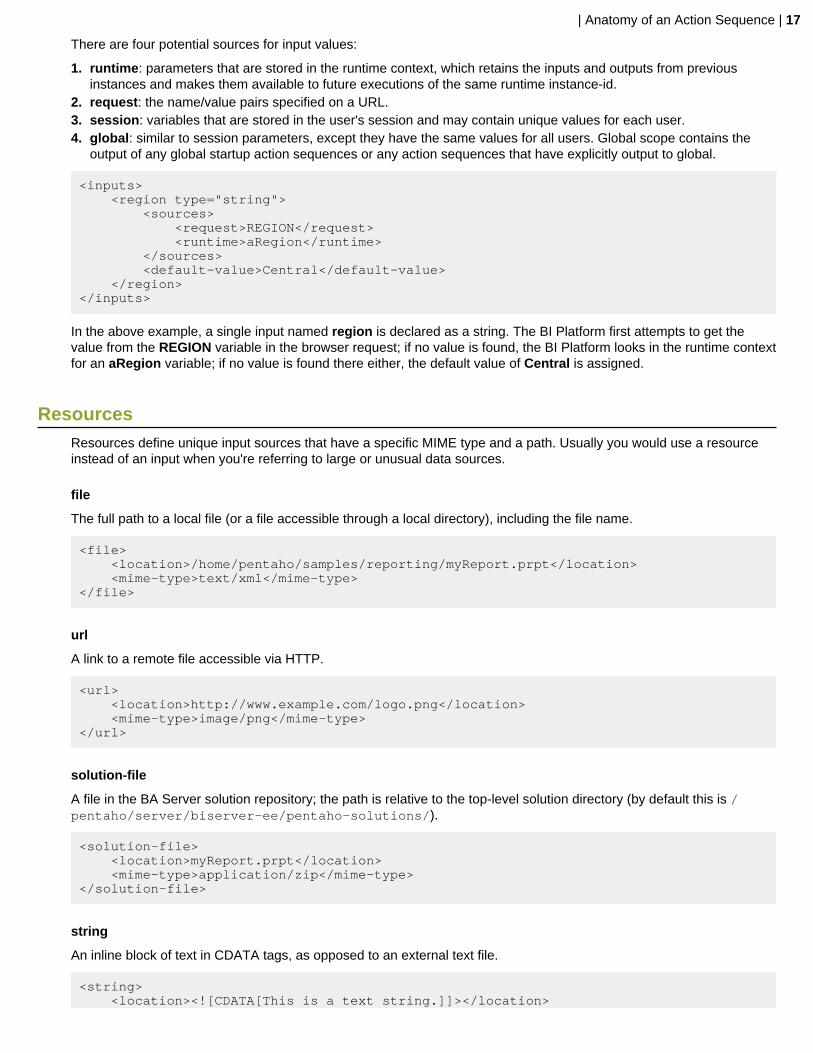
ResourcesResources define unique input sources that have a specific MIME type and a path. Usually you would use a resourceinstead of an input when you're referring to large or unusual data sources.
file
The full path to a local file (or a file accessible through a local directory), including the file name.
<file> <location>/home/pentaho/samples/reporting/myReport.prpt</location> <mime-type>text/xml</mime-type></file>
url
A link to a remote file accessible via HTTP.
<url> <location>http://www.example.com/logo.png</location> <mime-type>image/png</mime-type></url>
solution-file
A file in the BA Server solution repository; the path is relative to the top-level solution directory (by default this is /pentaho/server/biserver-ee/pentaho-solutions/).
<solution-file> <location>myReport.prpt</location> <mime-type>application/zip</mime-type></solution-file>
string
An inline block of text in CDATA tags, as opposed to an external text file.
<string> <location><![CDATA[This is a text string.]]></location>
| Anatomy of an Action Sequence | 18
<mime-type>text/plain</mime-type></string>
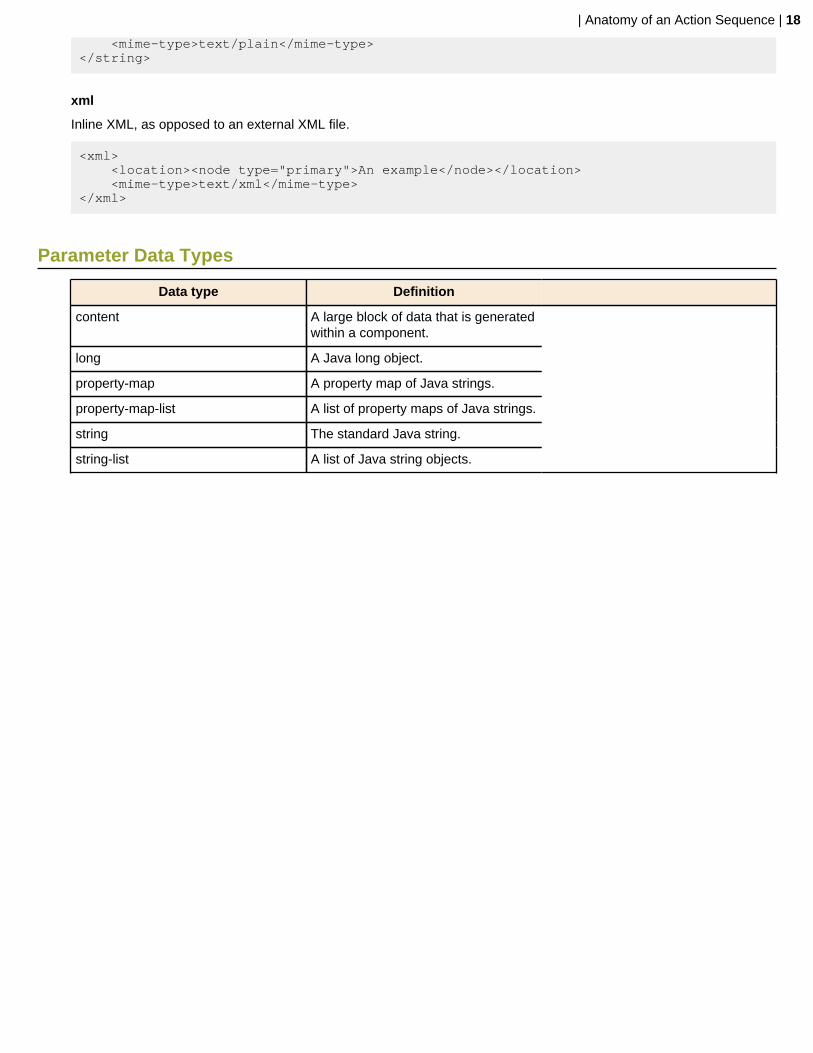
xml
Inline XML, as opposed to an external XML file.
<xml> <location><node type="primary">An example</node></location> <mime-type>text/xml</mime-type></xml>
Parameter Data Types
Data type Definition
content A large block of data that is generatedwithin a component.
long A Java long object.
property-map A property map of Java strings.
property-map-list A list of property maps of Java strings.
string The standard Java string.
string-list A list of Java string objects.
| Action Definition Reference | 19
Action Definition Reference
All of the possible BI Platform action definitions -- the entirety of what you can do with an action sequence -- are definedin sufficient detail below. Some components have templates in Design Studio, and some do not. When you can't use atemplate, you will have to switch to Generic Component Mode, or create the action sequence with raw XML.
Note: All XML tags are case-sensitive. Some are all lowercase, some are all uppercase, and some are camel-cased. Pay close attention to case-sensitivity when working in Generic Component Mode and with raw XML.
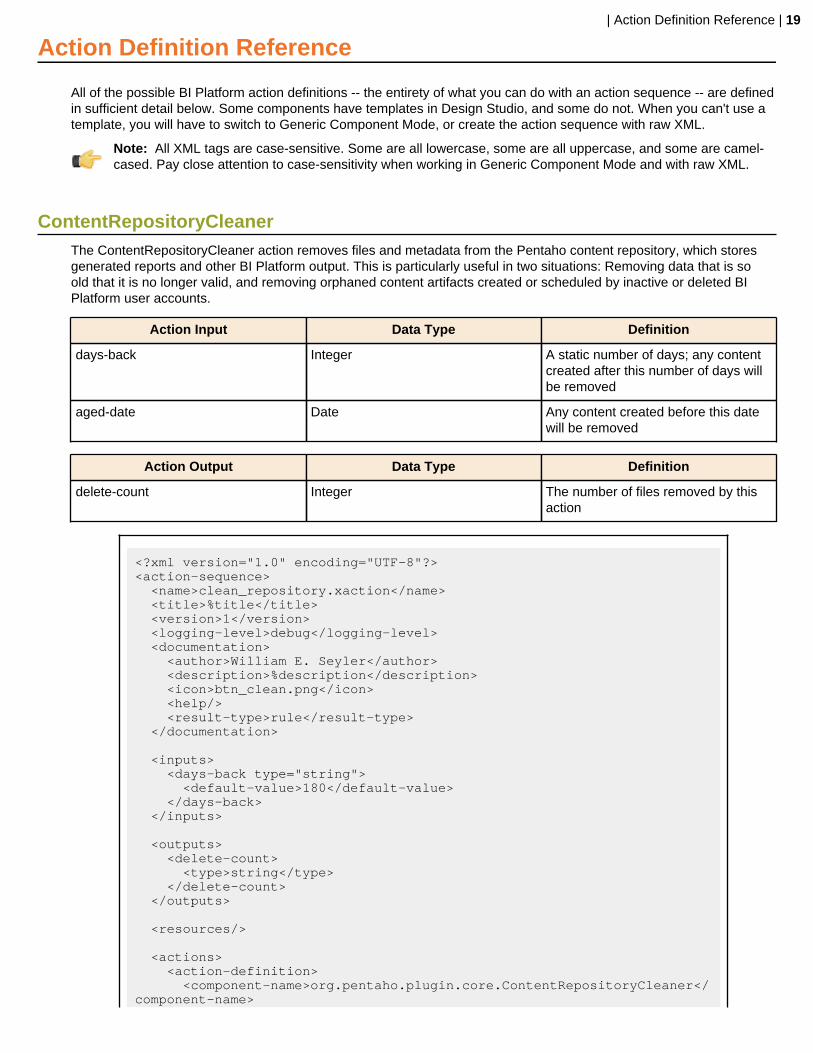
ContentRepositoryCleanerThe ContentRepositoryCleaner action removes files and metadata from the Pentaho content repository, which storesgenerated reports and other BI Platform output. This is particularly useful in two situations: Removing data that is soold that it is no longer valid, and removing orphaned content artifacts created or scheduled by inactive or deleted BIPlatform user accounts.
Action Input Data Type Definition
days-back Integer A static number of days; any contentcreated after this number of days willbe removed
aged-date Date Any content created before this datewill be removed
Action Output Data Type Definition
delete-count Integer The number of files removed by thisaction
<?xml version="1.0" encoding="UTF-8"?><action-sequence> <name>clean_repository.xaction</name> <title>%title</title> <version>1</version> <logging-level>debug</logging-level> <documentation> <author>William E. Seyler</author> <description>%description</description> <icon>btn_clean.png</icon> <help/> <result-type>rule</result-type> </documentation>
<inputs> <days-back type="string"> <default-value>180</default-value> </days-back> </inputs>
<outputs> <delete-count> <type>string</type> </delete-count> </outputs>
<resources/> <actions> <action-definition> <component-name>org.pentaho.plugin.core.ContentRepositoryCleaner</component-name>
| Action Definition Reference | 20
<action-type>rule</action-type> <action-inputs> <days-back type="string"/> </action-inputs> <action-outputs> <delete-count type="string"/> </action-outputs> <component-definition/> </action-definition> </actions> </action-sequence>
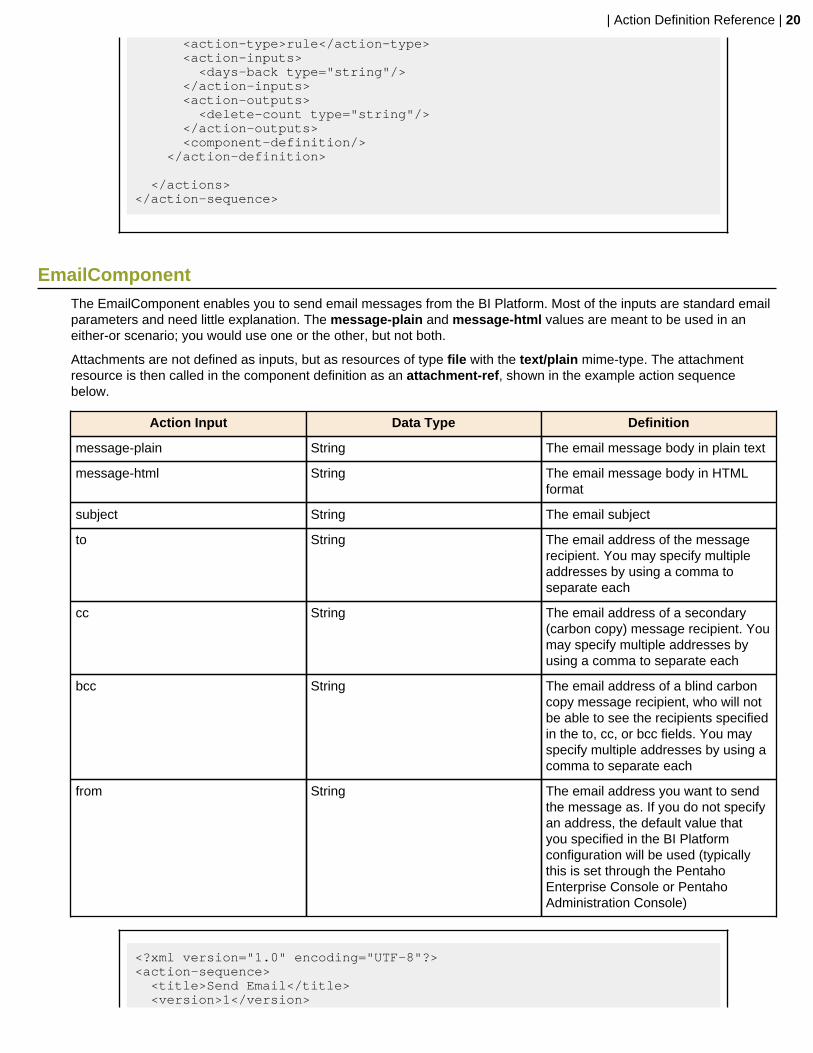
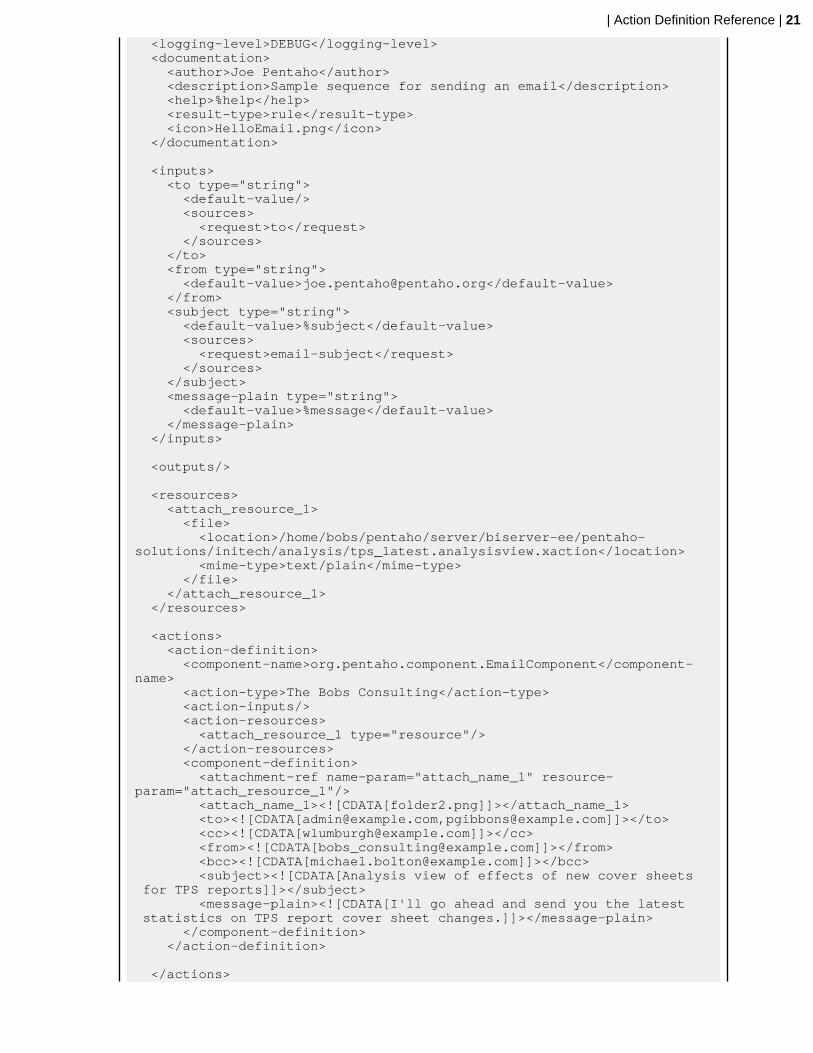
EmailComponentThe EmailComponent enables you to send email messages from the BI Platform. Most of the inputs are standard emailparameters and need little explanation. The message-plain and message-html values are meant to be used in aneither-or scenario; you would use one or the other, but not both.
Attachments are not defined as inputs, but as resources of type file with the text/plain mime-type. The attachmentresource is then called in the component definition as an attachment-ref, shown in the example action sequencebelow.
Action Input Data Type Definition
message-plain String The email message body in plain text
message-html String The email message body in HTMLformat
subject String The email subject
to String The email address of the messagerecipient. You may specify multipleaddresses by using a comma toseparate each
cc String The email address of a secondary(carbon copy) message recipient. Youmay specify multiple addresses byusing a comma to separate each
bcc String The email address of a blind carboncopy message recipient, who will notbe able to see the recipients specifiedin the to, cc, or bcc fields. You mayspecify multiple addresses by using acomma to separate each
from String The email address you want to sendthe message as. If you do not specifyan address, the default value thatyou specified in the BI Platformconfiguration will be used (typicallythis is set through the PentahoEnterprise Console or PentahoAdministration Console)
<?xml version="1.0" encoding="UTF-8"?><action-sequence> <title>Send Email</title> <version>1</version>
| Action Definition Reference | 21
<logging-level>DEBUG</logging-level> <documentation> <author>Joe Pentaho</author> <description>Sample sequence for sending an email</description> <help>%help</help> <result-type>rule</result-type> <icon>HelloEmail.png</icon> </documentation>
<inputs> <to type="string"> <default-value/> <sources> <request>to</request> </sources> </to> <from type="string"> <default-value>[email protected]</default-value> </from> <subject type="string"> <default-value>%subject</default-value> <sources> <request>email-subject</request> </sources> </subject> <message-plain type="string"> <default-value>%message</default-value> </message-plain> </inputs>
<outputs/>
<resources> <attach_resource_1> <file> <location>/home/bobs/pentaho/server/biserver-ee/pentaho-solutions/initech/analysis/tps_latest.analysisview.xaction</location> <mime-type>text/plain</mime-type> </file> </attach_resource_1> </resources> <actions> <action-definition> <component-name>org.pentaho.component.EmailComponent</component-name> <action-type>The Bobs Consulting</action-type> <action-inputs/> <action-resources> <attach_resource_1 type="resource"/> </action-resources> <component-definition> <attachment-ref name-param="attach_name_1" resource-param="attach_resource_1"/> <attach_name_1><![CDATA[folder2.png]]></attach_name_1> <to><![CDATA[[email protected],[email protected]]]></to> <cc><![CDATA[[email protected]]]></cc> <from><![CDATA[[email protected]]]></from> <bcc><![CDATA[[email protected]]]></bcc> <subject><![CDATA[Analysis view of effects of new cover sheets for TPS reports]]></subject> <message-plain><![CDATA[I'll go ahead and send you the latest statistics on TPS report cover sheet changes.]]></message-plain> </component-definition> </action-definition> </actions>
| Action Definition Reference | 22
</action-sequence>
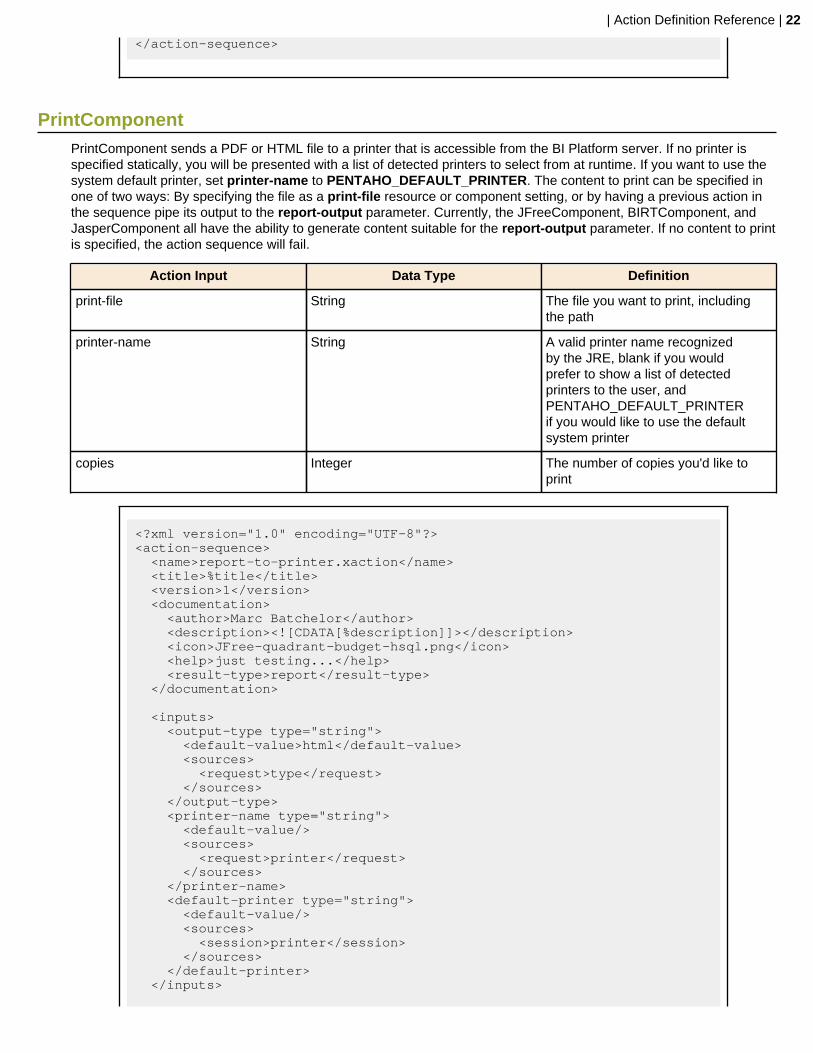
PrintComponentPrintComponent sends a PDF or HTML file to a printer that is accessible from the BI Platform server. If no printer isspecified statically, you will be presented with a list of detected printers to select from at runtime. If you want to use thesystem default printer, set printer-name to PENTAHO_DEFAULT_PRINTER. The content to print can be specified inone of two ways: By specifying the file as a print-file resource or component setting, or by having a previous action inthe sequence pipe its output to the report-output parameter. Currently, the JFreeComponent, BIRTComponent, andJasperComponent all have the ability to generate content suitable for the report-output parameter. If no content to printis specified, the action sequence will fail.
Action Input Data Type Definition
print-file String The file you want to print, includingthe path
printer-name String A valid printer name recognizedby the JRE, blank if you wouldprefer to show a list of detectedprinters to the user, andPENTAHO_DEFAULT_PRINTERif you would like to use the defaultsystem printer
copies Integer The number of copies you'd like toprint
<?xml version="1.0" encoding="UTF-8"?><action-sequence> <name>report-to-printer.xaction</name> <title>%title</title> <version>1</version> <documentation> <author>Marc Batchelor</author> <description><![CDATA[%description]]></description> <icon>JFree-quadrant-budget-hsql.png</icon> <help>just testing...</help> <result-type>report</result-type> </documentation>
<inputs> <output-type type="string"> <default-value>html</default-value> <sources> <request>type</request> </sources> </output-type> <printer-name type="string"> <default-value/> <sources> <request>printer</request> </sources> </printer-name> <default-printer type="string"> <default-value/> <sources> <session>printer</session> </sources> </default-printer> </inputs>
| Action Definition Reference | 23
<outputs> <default-printer type="string"> <destinations> <session>printer</session> </destinations> </default-printer> </outputs>
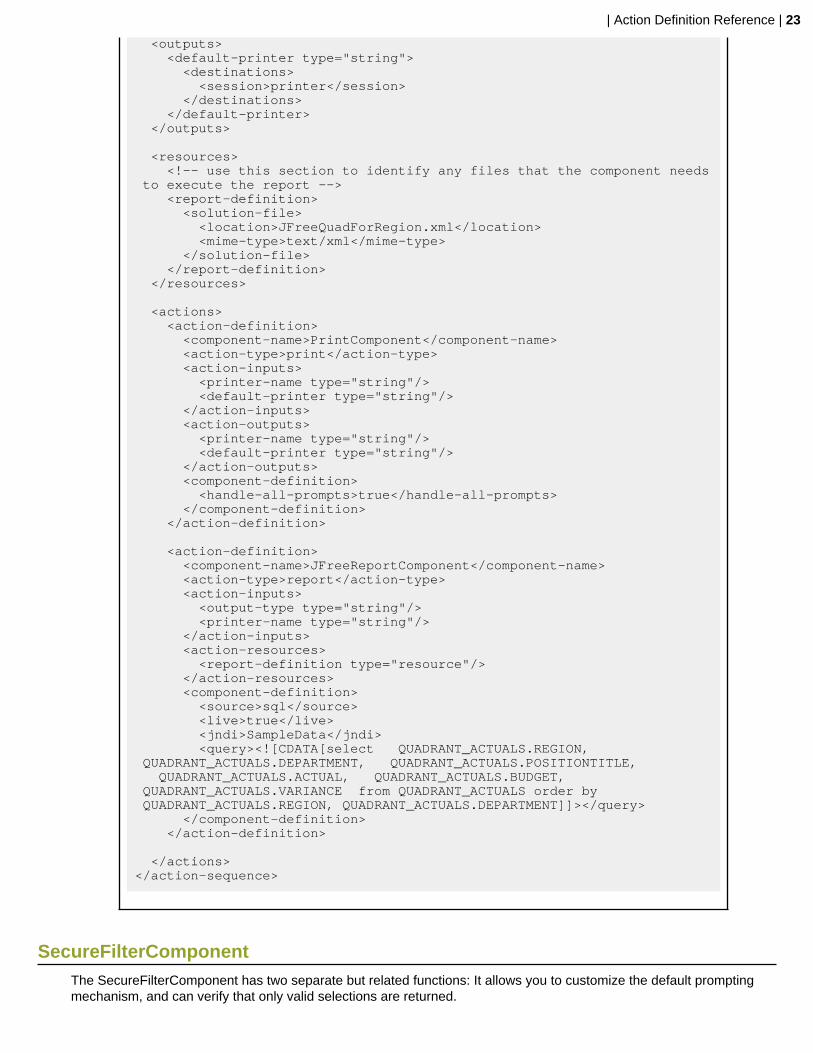
<resources> <!-- use this section to identify any files that the component needs to execute the report --> <report-definition> <solution-file> <location>JFreeQuadForRegion.xml</location> <mime-type>text/xml</mime-type> </solution-file> </report-definition> </resources> <actions> <action-definition> <component-name>PrintComponent</component-name> <action-type>print</action-type> <action-inputs> <printer-name type="string"/> <default-printer type="string"/> </action-inputs> <action-outputs> <printer-name type="string"/> <default-printer type="string"/> </action-outputs> <component-definition> <handle-all-prompts>true</handle-all-prompts> </component-definition> </action-definition> <action-definition> <component-name>JFreeReportComponent</component-name> <action-type>report</action-type> <action-inputs> <output-type type="string"/> <printer-name type="string"/> </action-inputs> <action-resources> <report-definition type="resource"/> </action-resources> <component-definition> <source>sql</source> <live>true</live> <jndi>SampleData</jndi> <query><![CDATA[select QUADRANT_ACTUALS.REGION, QUADRANT_ACTUALS.DEPARTMENT, QUADRANT_ACTUALS.POSITIONTITLE, QUADRANT_ACTUALS.ACTUAL, QUADRANT_ACTUALS.BUDGET, QUADRANT_ACTUALS.VARIANCE from QUADRANT_ACTUALS order by QUADRANT_ACTUALS.REGION, QUADRANT_ACTUALS.DEPARTMENT]]></query> </component-definition> </action-definition> </actions> </action-sequence>
SecureFilterComponentThe SecureFilterComponent has two separate but related functions: It allows you to customize the default promptingmechanism, and can verify that only valid selections are returned.
| Action Definition Reference | 24
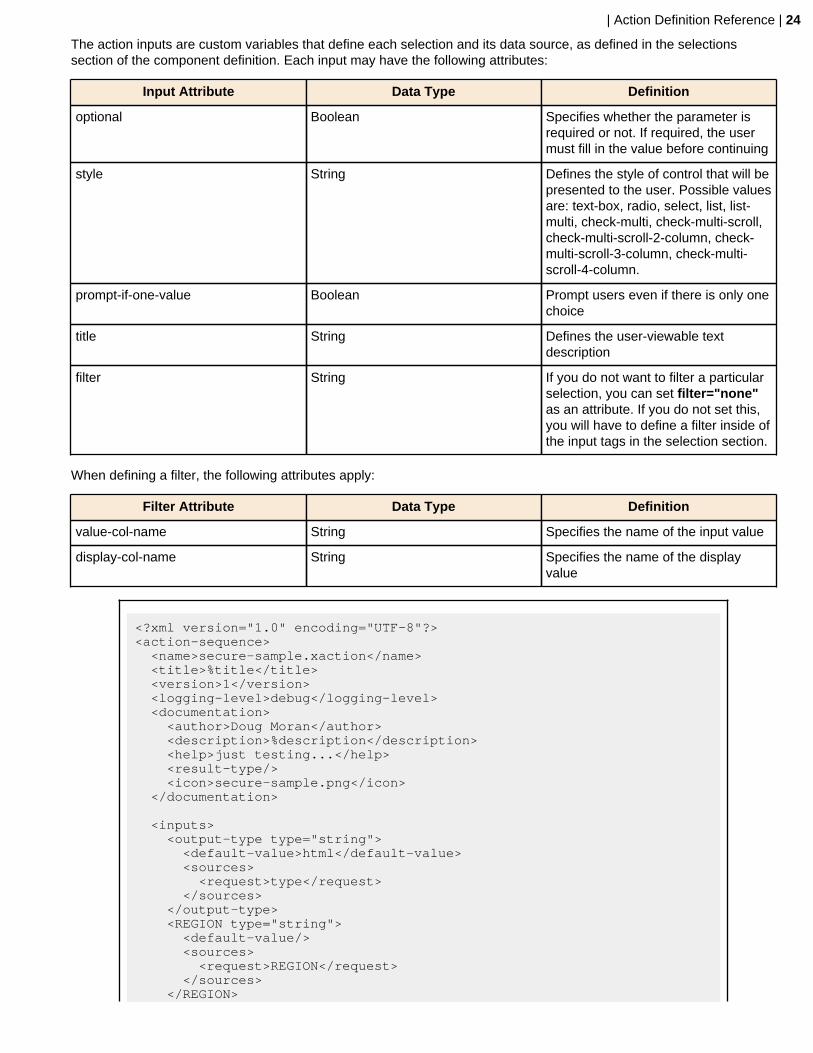
The action inputs are custom variables that define each selection and its data source, as defined in the selectionssection of the component definition. Each input may have the following attributes:
Input Attribute Data Type Definition
optional Boolean Specifies whether the parameter isrequired or not. If required, the usermust fill in the value before continuing
style String Defines the style of control that will bepresented to the user. Possible valuesare: text-box, radio, select, list, list-multi, check-multi, check-multi-scroll,check-multi-scroll-2-column, check-multi-scroll-3-column, check-multi-scroll-4-column.
prompt-if-one-value Boolean Prompt users even if there is only onechoice
title String Defines the user-viewable textdescription
filter String If you do not want to filter a particularselection, you can set filter="none"as an attribute. If you do not set this,you will have to define a filter inside ofthe input tags in the selection section.
When defining a filter, the following attributes apply:
Filter Attribute Data Type Definition
value-col-name String Specifies the name of the input value
display-col-name String Specifies the name of the displayvalue
<?xml version="1.0" encoding="UTF-8"?><action-sequence> <name>secure-sample.xaction</name> <title>%title</title> <version>1</version> <logging-level>debug</logging-level> <documentation> <author>Doug Moran</author> <description>%description</description> <help>just testing...</help> <result-type/> <icon>secure-sample.png</icon> </documentation>
<inputs> <output-type type="string"> <default-value>html</default-value> <sources> <request>type</request> </sources> </output-type> <REGION type="string"> <default-value/> <sources> <request>REGION</request> </sources> </REGION>

| Action Definition Reference | 25
<REGION_FILTER type="result-set"> <sources> <session>REGION_FILTER</session> </sources> <default-value/> </REGION_FILTER> <DEPARTMENT_FILTER type="property-map-list"> <default-value type="property-map-list"> <property-map> <entry key="Dept">Human Resource</entry> <entry key="Display">HR Dudes</entry> </property-map> <property-map> <entry key="Dept">Product Development</entry> <entry key="Display">The Smart Guys</entry> </property-map> <property-map> <entry key="Dept">Executive Management</entry> <entry key="Display">Overhead</entry> </property-map> </default-value> </DEPARTMENT_FILTER> <DEPARTMENT type="string"> <default-value/> <sources> <request>DEPARTMENT</request> </sources> </DEPARTMENT> <result type="string"> <sources> <request>result</request> </sources> <default-value><HTML>No selections for REGION were found in your session. <p/>This means you are not logged in or you do not have permission to view this report.</HTML></default-value> </result> </inputs>
<outputs> <result type="content"> <destinations> <response>content</response> </destinations> </result> </outputs>
<resources> <report-definition1> <solution-file> <location>JFreeQuadForRegion.xml</location> <mime-type>text/plain</mime-type> </solution-file> </report-definition1> </resources> <actions> <actions> <condition><![CDATA[REGION_FILTER]]></condition> <action-definition> <component-name>SecureFilterComponent</component-name> <action-type>Prompt For Region and Dept</action-type> <action-inputs> <REGION type="string"/> <REGION_FILTER type="result-set"/> <DEPARTMENT type="string"/> <DEPARTMENT_FILTER type="property-map-list"/> </action-inputs> <action-outputs/> <component-definition>

| Action Definition Reference | 26
<selections> <!-- for now ignore the column names --> <REGION style="radio"> <filter value-col-name="REGION" display-col-name="REGION">REGION_FILTER</filter> <title>Select the Region</title> </REGION> <DEPARTMENT style="select"> <filter value-col-name="Dept" display-col-name="Display">DEPARTMENT_FILTER</filter> <title>Select the Department</title> </DEPARTMENT> </selections> <xsl>CustomReportParameters.xsl</xsl> <target>Report_Window</target> </component-definition> </action-definition> <action-definition> <component-name>SQLLookupRule</component-name> <action-type>Get Data from Relational</action-type> <action-inputs> <REGION type="string"/> <DEPARTMENT type="string"/> </action-inputs> <action-outputs> <query-result type="result-set"/> </action-outputs> <component-definition> <jndi>SampleData</jndi> <query><![CDATA[select QUADRANT_ACTUALS.REGION, QUADRANT_ACTUALS.DEPARTMENT, QUADRANT_ACTUALS.POSITIONTITLE, QUADRANT_ACTUALS.ACTUAL, QUADRANT_ACTUALS.BUDGET, QUADRANT_ACTUALS.VARIANCE from QUADRANT_ACTUALS where QUADRANT_ACTUALS.REGION={PREPARE:REGION} and QUADRANT_ACTUALS.DEPARTMENT={PREPARE:DEPARTMENT} order by QUADRANT_ACTUALS.REGION, QUADRANT_ACTUALS.DEPARTMENT]]></query> </component-definition> </action-definition>
<action-definition> <component-name>JFreeReportComponent</component-name> <action-type>Pentaho Report</action-type> <action-inputs> <data type="result-set" mapping="query-result"/> </action-inputs> <action-resources> <report-definition type="resource" mapping="report-definition1"/> </action-resources> <component-definition> <output-type>html</output-type> </component-definition> </action-definition> </actions> </actions> </action-sequence>
SubActionComponentSubactions create content that is used by the parent action. If you need to perform several dependent actions, youwould accomplish them individually through SubActionComponents.
Each input may have the following attributes, all of which are required except the session-proxy:

| Action Definition Reference | 27
Input Attribute Data Type Definition
solution String The solution containing the xaction torun
path String Path within the solution that locatesthe xaction to run
action String The xaction to run
session-proxy String String value that contains an arbitrarysession name. Defining this will causethe subaction to process in a differentsession (asynchronously)
query String XMLA query to be run
filter String If you do not want to filter a particularselection, you can set filter="none"as an attribute. If you do not set this,you will have to define a filter inside ofthe input tags in the selection section
Each output needs to have a specific name that the parent action will reference as the subaction result.
There is a good example in the /pentaho-solutions/cdf/components/jfreechart.xaction action sequence, but it's a little too long to print here in its entirety. Below isa relevant excerpt that shows SubActionComponent in use:
<actions> <condition><![CDATA[QUERY_TYPE == "kettle"]]></condition> <action-definition> <component-name>SubActionComponent</component-name> <action-type>Pentaho BI Process</action-type> <action-inputs> <PARAMETER1 type="string"/> <PARAMETER2 type="string"/> <PARAMETER3 type="string"/> <PARAMETER4 type="string"/> <PARAMETER5 type="string"/> <PARAMETER6 type="string"/> <PARAMETER7 type="string"/> <PARAMETER8 type="string"/> <PARAMETER9 type="string"/> <TRANSFORMATION type="string"/> <DIRECTORY type="string"/> <IMPORTSTEP type="string"/> </action-inputs> <action-outputs> <newResults type="result-set"/> </action-outputs> <component-definition> <solution><![CDATA[cdf]]></solution> <path><![CDATA[components]]></path> <action><![CDATA[kettletransformation.xaction]]></action> </component-definition> </action-definition></actions>
| Action Definition Reference | 28
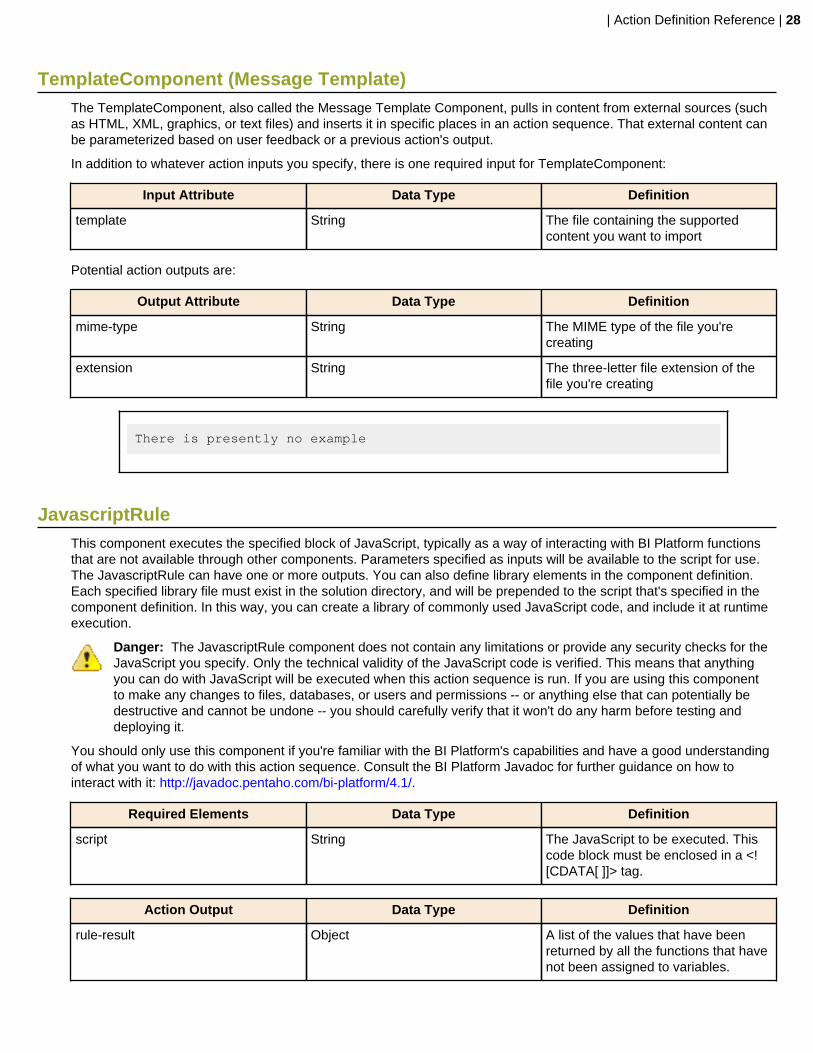
TemplateComponent (Message Template)The TemplateComponent, also called the Message Template Component, pulls in content from external sources (suchas HTML, XML, graphics, or text files) and inserts it in specific places in an action sequence. That external content canbe parameterized based on user feedback or a previous action's output.
In addition to whatever action inputs you specify, there is one required input for TemplateComponent:
Input Attribute Data Type Definition
template String The file containing the supportedcontent you want to import
Potential action outputs are:
Output Attribute Data Type Definition
mime-type String The MIME type of the file you'recreating
extension String The three-letter file extension of thefile you're creating
There is presently no example
JavascriptRuleThis component executes the specified block of JavaScript, typically as a way of interacting with BI Platform functionsthat are not available through other components. Parameters specified as inputs will be available to the script for use.The JavascriptRule can have one or more outputs. You can also define library elements in the component definition.Each specified library file must exist in the solution directory, and will be prepended to the script that's specified in thecomponent definition. In this way, you can create a library of commonly used JavaScript code, and include it at runtimeexecution.
Danger: The JavascriptRule component does not contain any limitations or provide any security checks for theJavaScript you specify. Only the technical validity of the JavaScript code is verified. This means that anythingyou can do with JavaScript will be executed when this action sequence is run. If you are using this componentto make any changes to files, databases, or users and permissions -- or anything else that can potentially bedestructive and cannot be undone -- you should carefully verify that it won't do any harm before testing anddeploying it.
You should only use this component if you're familiar with the BI Platform's capabilities and have a good understandingof what you want to do with this action sequence. Consult the BI Platform Javadoc for further guidance on how tointeract with it: http://javadoc.pentaho.com/bi-platform/4.1/.
Required Elements Data Type Definition
script String The JavaScript to be executed. Thiscode block must be enclosed in a <![CDATA[ ]]> tag.
Action Output Data Type Definition
rule-result Object A list of the values that have beenreturned by all the functions that havenot been assigned to variables.
| Action Definition Reference | 29
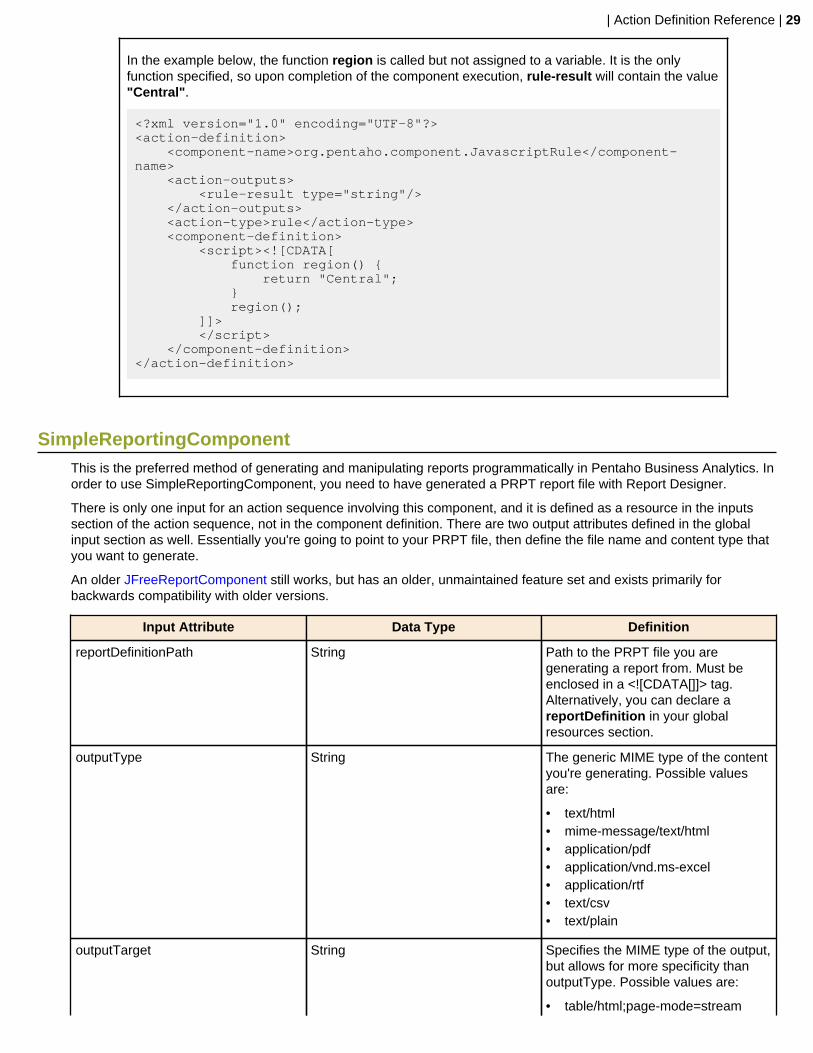
In the example below, the function region is called but not assigned to a variable. It is the onlyfunction specified, so upon completion of the component execution, rule-result will contain the value"Central".
<?xml version="1.0" encoding="UTF-8"?><action-definition> <component-name>org.pentaho.component.JavascriptRule</component-name> <action-outputs> <rule-result type="string"/> </action-outputs> <action-type>rule</action-type> <component-definition> <script><![CDATA[ function region() { return "Central"; } region(); ]]> </script> </component-definition></action-definition>
SimpleReportingComponentThis is the preferred method of generating and manipulating reports programmatically in Pentaho Business Analytics. Inorder to use SimpleReportingComponent, you need to have generated a PRPT report file with Report Designer.
There is only one input for an action sequence involving this component, and it is defined as a resource in the inputssection of the action sequence, not in the component definition. There are two output attributes defined in the globalinput section as well. Essentially you're going to point to your PRPT file, then define the file name and content type thatyou want to generate.
An older JFreeReportComponent still works, but has an older, unmaintained feature set and exists primarily forbackwards compatibility with older versions.
Input Attribute Data Type Definition
reportDefinitionPath String Path to the PRPT file you aregenerating a report from. Must beenclosed in a <![CDATA[]]> tag.Alternatively, you can declare areportDefinition in your globalresources section.
outputType String The generic MIME type of the contentyou're generating. Possible valuesare:
• text/html• mime-message/text/html• application/pdf• application/vnd.ms-excel• application/rtf• text/csv• text/plain
outputTarget String Specifies the MIME type of the output,but allows for more specificity thanoutputType. Possible values are:
• table/html;page-mode=stream

| Action Definition Reference | 30
Input Attribute Data Type Definition
• table/html;page-mode=page• table/excel;page-mode=flow• table/csv;page-mode=stream• table/rtf;page-mode=flow• pageable/pdf• pageable/text
There is only one output, defined in either the global outputs section or the SimpleReportingComponent's action-outputssection:
Output Attribute Data Type Definition
outputstream String The output destination; where theoutput will be written.
There are many report options, all of which are technically component inputs, and are positioned in the action-inputssection. Most of these options are rarely used because most report functionality is determined when you initially createthe report.
Report Attribute Data Type Definition
paginate Boolean Determines whether the interfaceturns on the page controller for thereport.
report-definition String The path (relative to the top-levelsolution directory), to the PRPT file,including the file name.
useContentRepository Boolean Determines whether the output iswritten to the BA Server contentrepository.
accepted-page Integer The page number that should beshown when in paginated-html-mode.
print Boolean Determines whether or not you wantto send output to the printer.
printer-name String The (optional) name of the printer.Default printer is the operatingsystem's default printer.
content-handler-pattern String When exporting to HTML, this is thename of the content handler servletthat sends images and CSS files tothe browser.
res-url String If the report-definition stream hasbeen given, then this defines thecontext-url for loading resources withrelative paths.
<?xml version="1.0" encoding="UTF-8"?><action-sequence> <version>1</version> <logging-level>ERROR</logging-level> <documentation> <author>Michael D'Amour</author> <description>%description</description> <help>just testing...</help>

| Action Definition Reference | 31
<result-type>report</result-type> <icon>JFree-quadrant-budget-hsql.png</icon> </documentation>
<inputs> <outputType type="string"> <default-value>text/html</default-value> <sources> <request>outputType</request> </sources> </outputType> <outputTypeList type="property-map-list"> <sources> <runtime>outputTypeList</runtime> </sources> <default-value type="property-map-list"> <property-map> <entry key="report-output-desc">PDF</entry> <entry key="report-output-type-id">application/pdf</entry> </property-map> <property-map> <entry key="report-output-desc">Excel</entry> <entry key="report-output-type-id">application/vnd.ms-excel</entry> </property-map> <property-map> <entry key="report-output-desc">Web Page</entry> <entry key="report-output-type-id">text/html</entry> </property-map> </default-value> </outputTypeList>
</inputs>
<outputs> <myReport type="content"> <destinations> <response>content</response> </destinations> </myReport> </outputs>
<resources> <reportDefinition> <solution-file> <location>incomestatement_external.prpt</location> <mime-type>application/zip</mime-type> </solution-file> </reportDefinition> </resources> <actions>
<action-definition> <component-name>SecureFilterComponent</component-name> <action-type>Prompt for Product Line and Report Format</action-type> <action-inputs> <outputTypeList type="property-map-list"/> <outputType type="string"/> </action-inputs> <component-definition> <selections> <outputType style="radio"> <title>Select Report Format</title> <filter value-col-name="report-output-type-id" display-col-name="report-output-desc">outputTypeList</filter> </outputType>
| Action Definition Reference | 32
</selections> </component-definition> </action-definition>
<action-definition> <component-name>SQLLookupRule</component-name> <action-type>SQL Query For Report Data</action-type> <action-outputs> <query-result type="result-set"/> </action-outputs> <component-definition> <jndi>SampleData</jndi> <live>true</live> <query><![CDATA[SELECT * FROM TRIAL_BALANCE]]></query> </component-definition> </action-definition>
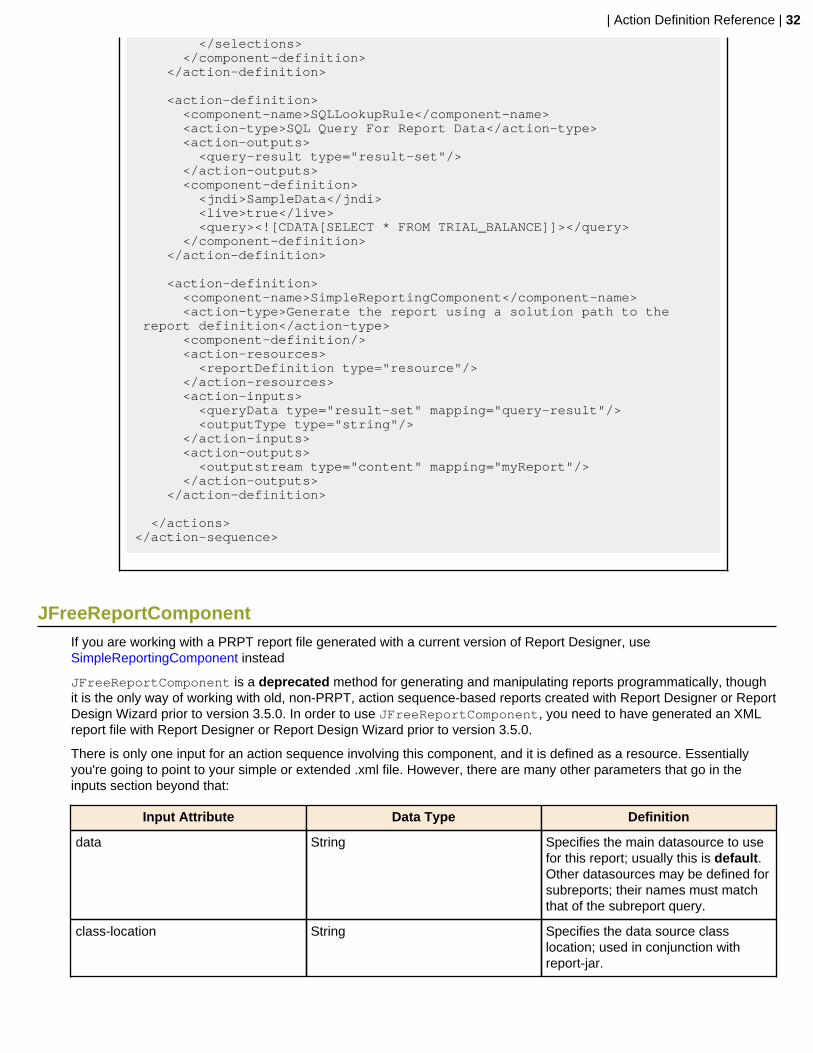
<action-definition> <component-name>SimpleReportingComponent</component-name> <action-type>Generate the report using a solution path to the report definition</action-type> <component-definition/> <action-resources> <reportDefinition type="resource"/> </action-resources> <action-inputs> <queryData type="result-set" mapping="query-result"/> <outputType type="string"/> </action-inputs> <action-outputs> <outputstream type="content" mapping="myReport"/> </action-outputs> </action-definition> </actions> </action-sequence>
JFreeReportComponentIf you are working with a PRPT report file generated with a current version of Report Designer, useSimpleReportingComponent instead
JFreeReportComponent is a deprecated method for generating and manipulating reports programmatically, thoughit is the only way of working with old, non-PRPT, action sequence-based reports created with Report Designer or ReportDesign Wizard prior to version 3.5.0. In order to use JFreeReportComponent, you need to have generated an XMLreport file with Report Designer or Report Design Wizard prior to version 3.5.0.
There is only one input for an action sequence involving this component, and it is defined as a resource. Essentiallyyou're going to point to your simple or extended .xml file. However, there are many other parameters that go in theinputs section beyond that:
Input Attribute Data Type Definition
data String Specifies the main datasource to usefor this report; usually this is default.Other datasources may be defined forsubreports; their names must matchthat of the subreport query.
class-location String Specifies the data source classlocation; used in conjunction withreport-jar.
| Action Definition Reference | 33
Input Attribute Data Type Definition
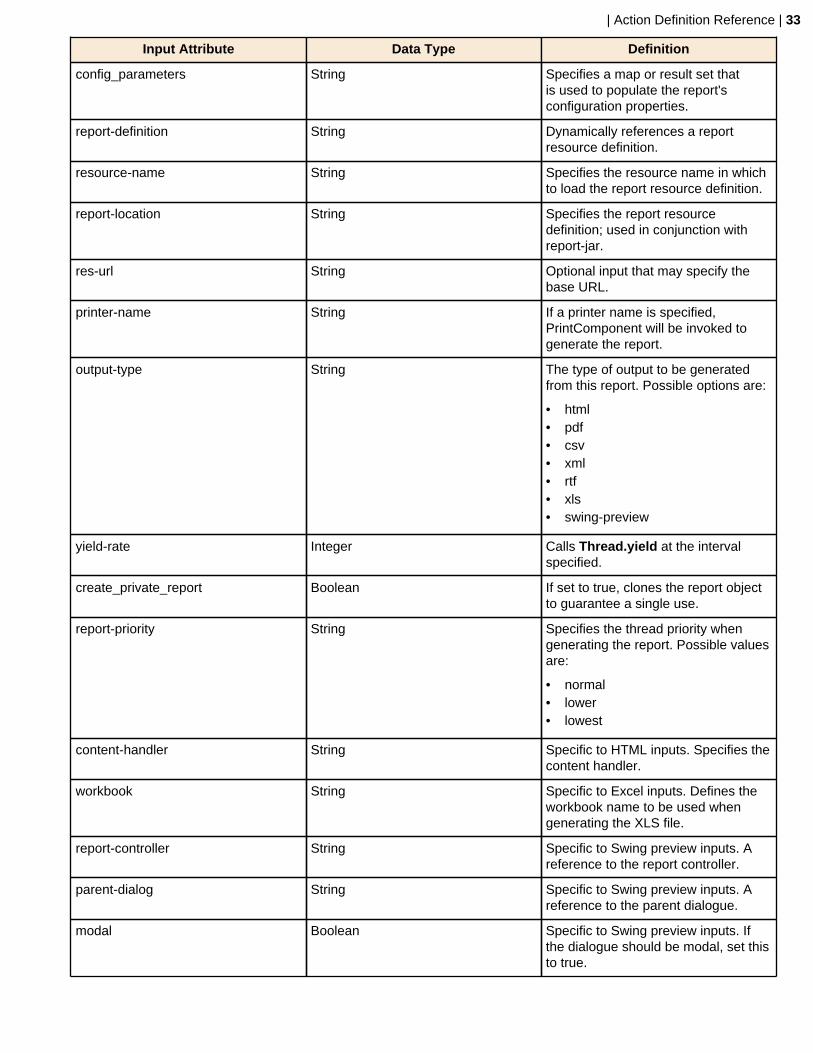
config_parameters String Specifies a map or result set thatis used to populate the report'sconfiguration properties.
report-definition String Dynamically references a reportresource definition.
resource-name String Specifies the resource name in whichto load the report resource definition.
report-location String Specifies the report resourcedefinition; used in conjunction withreport-jar.
res-url String Optional input that may specify thebase URL.
printer-name String If a printer name is specified,PrintComponent will be invoked togenerate the report.
output-type String The type of output to be generatedfrom this report. Possible options are:
• html• pdf• csv• xml• rtf• xls• swing-preview
yield-rate Integer Calls Thread.yield at the intervalspecified.
create_private_report Boolean If set to true, clones the report objectto guarantee a single use.
report-priority String Specifies the thread priority whengenerating the report. Possible valuesare:
• normal• lower• lowest
content-handler String Specific to HTML inputs. Specifies thecontent handler.
workbook String Specific to Excel inputs. Defines theworkbook name to be used whengenerating the XLS file.
report-controller String Specific to Swing preview inputs. Areference to the report controller.
parent-dialog String Specific to Swing preview inputs. Areference to the parent dialogue.
modal Boolean Specific to Swing preview inputs. Ifthe dialogue should be modal, set thisto true.

| Action Definition Reference | 34
Input Attribute Data Type Definition
progress-bar Boolean Specific to Swing preview inputs. If aprogress bar is to be displayed, setthis to true.
progress-dialog Boolean Specific to Swing preview inputs. If aprogress dialog is to be displayed, setto true.
There is only one output:
Output Attribute Data Type Definition
report-output String The default name of the outputstream.Any other output defined will be usedin place of the report-output as aname.
<?xml version="1.0" encoding="UTF-8"?><action-sequence> <title>%title</title> <version>1</version> <logging-level>ERROR</logging-level> <documentation> <author>Angelo Rodriguez</author> <description>%description</description> <help>just testing...</help> <result-type>report</result-type> <icon>JFree-quadrant-budget-hsql.png</icon> </documentation>
<inputs/>
<outputs/>
<resources> <report-definition> <solution-file> <location>JFreeQuadForRegion.xml</location> <mime-type>text/xml</mime-type> </solution-file> </report-definition> </resources> <actions> <action-definition> <component-name>SQLLookupRule</component-name> <action-type>SQL Query For Report Data</action-type> <action-outputs> <query-result type="result-set"/> </action-outputs> <component-definition> <jndi>SampleData</jndi> <live>true</live> <query><![CDATA[select QUADRANT_ACTUALS.REGION, QUADRANT_ACTUALS.DEPARTMENT, QUADRANT_ACTUALS.POSITIONTITLE, QUADRANT_ACTUALS.ACTUAL, QUADRANT_ACTUALS.BUDGET, QUADRANT_ACTUALS.VARIANCE from QUADRANT_ACTUALS order by QUADRANT_ACTUALS.REGION, QUADRANT_ACTUALS.DEPARTMENT]]></query> </component-definition> </action-definition> <action-definition> <component-name>JFreeReportComponent</component-name> <action-type>Create Report Using Query Results</action-type>

| Action Definition Reference | 35
<action-inputs> <data type="result-set" mapping="query-result"/> </action-inputs> <action-resources> <report-definition type="resource"/> </action-resources> <component-definition> <output-type>html</output-type> </component-definition> </action-definition> </actions> </action-sequence>
ChartingThere are three components related to charting in the Pentaho BI Platform, each of which uses a different chart engine:
1. ChartComponent: Uses the JFreeChart engine; this is the default chart engine in the BI Platform.2. ChartBeansComponent: Uses the Pentaho ChartBeans engine; this is the newest chart engine in the BI Platform,
and will someday replace JFreeChart.3. OpenFlashChartComponent: Uses the OpenFlashChart engine; this is a small, limited, but visually impressive
chart engine.
Each component has its own reference section below.
JFreeChart (ChartComponent)
JFreeChart is the default charting engine in the BI Platform.
Note: This section is not yet complete.
Pentaho ChartBeans (ChartBeansComponent)
ChartBeans is the next-generation chart engine in the BI Platform.
Note: This section is not yet complete.
OpenFlashChart (OpenFlashChartComponent)
OpenFlashChart is for visually appealing, Adobe Flash-based charts.
Introducing the Flash Chart Component
The Open Flash Chart component employs Open Flash Charts as its charting engine.
The OpenFlashChartComponent is a BI component that allows you to create a variety of chart types that include:
• Bar• Line• Bar/Line Combinations• Pie• Area• XY dot• Bubble
| Action Definition Reference | 36
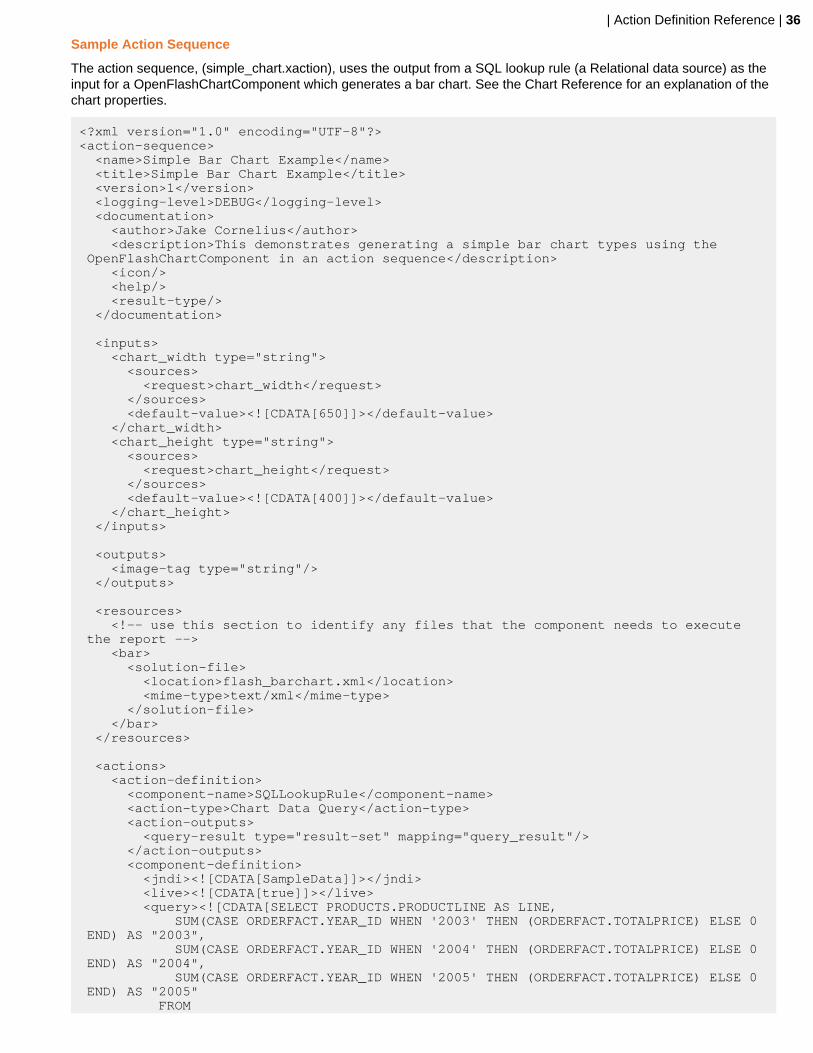
Sample Action Sequence
The action sequence, (simple_chart.xaction), uses the output from a SQL lookup rule (a Relational data source) as theinput for a OpenFlashChartComponent which generates a bar chart. See the Chart Reference for an explanation of thechart properties.
<?xml version="1.0" encoding="UTF-8"?><action-sequence> <name>Simple Bar Chart Example</name> <title>Simple Bar Chart Example</title> <version>1</version> <logging-level>DEBUG</logging-level> <documentation> <author>Jake Cornelius</author> <description>This demonstrates generating a simple bar chart types using the OpenFlashChartComponent in an action sequence</description> <icon/> <help/> <result-type/> </documentation>
<inputs> <chart_width type="string"> <sources> <request>chart_width</request> </sources> <default-value><![CDATA[650]]></default-value> </chart_width> <chart_height type="string"> <sources> <request>chart_height</request> </sources> <default-value><![CDATA[400]]></default-value> </chart_height> </inputs>
<outputs> <image-tag type="string"/> </outputs>
<resources> <!-- use this section to identify any files that the component needs to execute the report --> <bar> <solution-file> <location>flash_barchart.xml</location> <mime-type>text/xml</mime-type> </solution-file> </bar> </resources>
<actions> <action-definition> <component-name>SQLLookupRule</component-name> <action-type>Chart Data Query</action-type> <action-outputs> <query-result type="result-set" mapping="query_result"/> </action-outputs> <component-definition> <jndi><![CDATA[SampleData]]></jndi> <live><![CDATA[true]]></live> <query><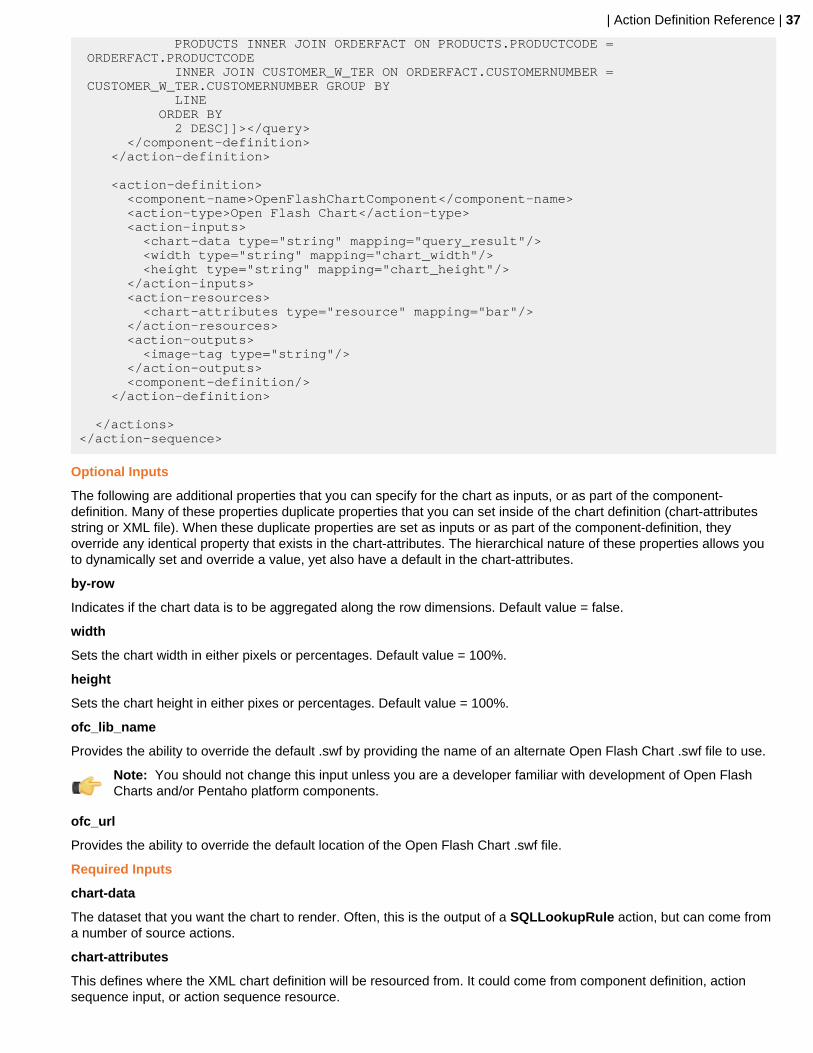
| Action Definition Reference | 37
PRODUCTS INNER JOIN ORDERFACT ON PRODUCTS.PRODUCTCODE = ORDERFACT.PRODUCTCODE INNER JOIN CUSTOMER_W_TER ON ORDERFACT.CUSTOMERNUMBER = CUSTOMER_W_TER.CUSTOMERNUMBER GROUP BY LINE ORDER BY 2 DESC]]></query> </component-definition> </action-definition>
<action-definition> <component-name>OpenFlashChartComponent</component-name> <action-type>Open Flash Chart</action-type> <action-inputs> <chart-data type="string" mapping="query_result"/> <width type="string" mapping="chart_width"/> <height type="string" mapping="chart_height"/> </action-inputs> <action-resources> <chart-attributes type="resource" mapping="bar"/> </action-resources> <action-outputs> <image-tag type="string"/> </action-outputs> <component-definition/> </action-definition>
</actions></action-sequence>
Optional Inputs
The following are additional properties that you can specify for the chart as inputs, or as part of the component-definition. Many of these properties duplicate properties that you can set inside of the chart definition (chart-attributesstring or XML file). When these duplicate properties are set as inputs or as part of the component-definition, theyoverride any identical property that exists in the chart-attributes. The hierarchical nature of these properties allows youto dynamically set and override a value, yet also have a default in the chart-attributes.
by-row
Indicates if the chart data is to be aggregated along the row dimensions. Default value = false.
width
Sets the chart width in either pixels or percentages. Default value = 100%.
height
Sets the chart height in either pixes or percentages. Default value = 100%.
ofc_lib_name
Provides the ability to override the default .swf by providing the name of an alternate Open Flash Chart .swf file to use.
Note: You should not change this input unless you are a developer familiar with development of Open FlashCharts and/or Pentaho platform components.
ofc_url
Provides the ability to override the default location of the Open Flash Chart .swf file.
Required Inputs
chart-data
The dataset that you want the chart to render. Often, this is the output of a SQLLookupRule action, but can come froma number of source actions.
chart-attributes
This defines where the XML chart definition will be resourced from. It could come from component definition, actionsequence input, or action sequence resource.
| Action Definition Reference | 38
Note: The XML chart definition specified in chart attributes also supports parameterization of elements. This isaccomplished by inserting parameter strings (for example, {INPUT PARAM}) values in the chart XML or input.
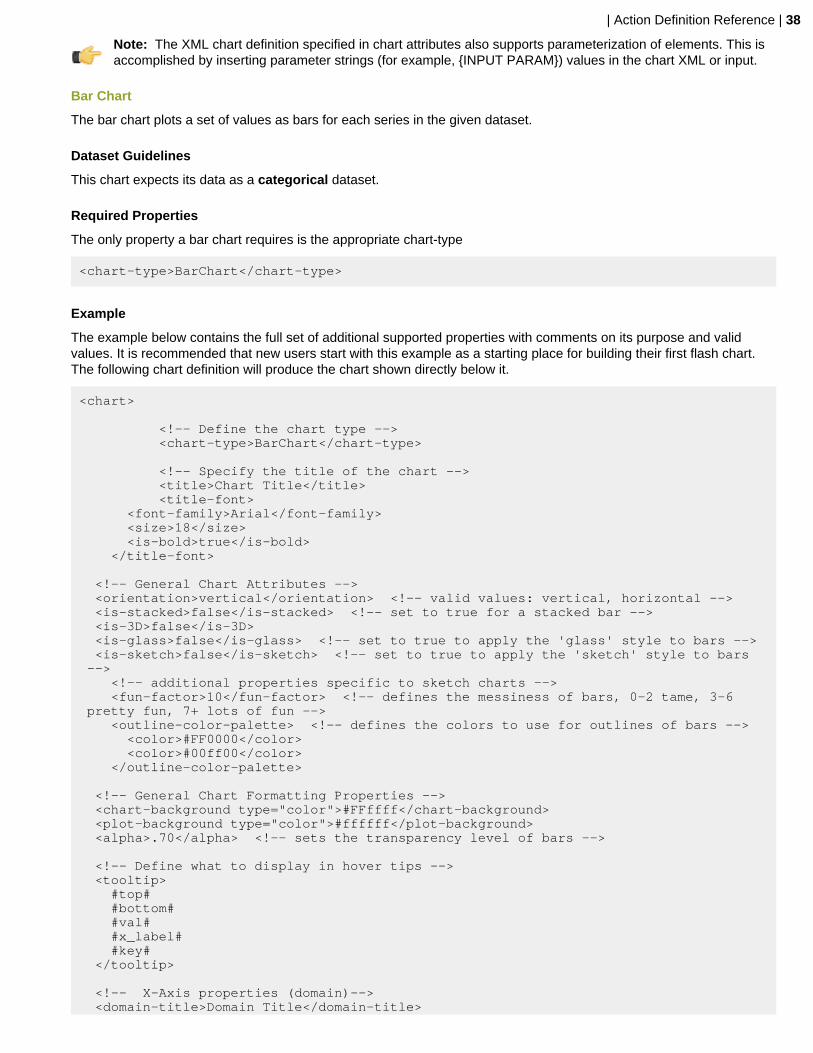
Bar Chart
The bar chart plots a set of values as bars for each series in the given dataset.
Dataset Guidelines
This chart expects its data as a categorical dataset.
Required Properties
The only property a bar chart requires is the appropriate chart-type
<chart-type>BarChart</chart-type>
Example
The example below contains the full set of additional supported properties with comments on its purpose and validvalues. It is recommended that new users start with this example as a starting place for building their first flash chart.The following chart definition will produce the chart shown directly below it.
<chart> <!-- Define the chart type --> <chart-type>BarChart</chart-type> <!-- Specify the title of the chart --> <title>Chart Title</title> <title-font> <font-family>Arial</font-family> <size>18</size> <is-bold>true</is-bold> </title-font>
<!-- General Chart Attributes --> <orientation>vertical</orientation> <!-- valid values: vertical, horizontal --> <is-stacked>false</is-stacked> <!-- set to true for a stacked bar --> <is-3D>false</is-3D> <is-glass>false</is-glass> <!-- set to true to apply the 'glass' style to bars --> <is-sketch>false</is-sketch> <!-- set to true to apply the 'sketch' style to bars --> <!-- additional properties specific to sketch charts --> <fun-factor>10</fun-factor> <!-- defines the messiness of bars, 0-2 tame, 3-6 pretty fun, 7+ lots of fun --> <outline-color-palette> <!-- defines the colors to use for outlines of bars --> <color>#FF0000</color> <color>#00ff00</color> </outline-color-palette>
<!-- General Chart Formatting Properties --> <chart-background type="color">#FFffff</chart-background> <plot-background type="color">#ffffff</plot-background> <alpha>.70</alpha> <!-- sets the transparency level of bars -->
<!-- Define what to display in hover tips --> <tooltip> #top# #bottom# #val# #x_label# #key# </tooltip>
<!-- X-Axis properties (domain)--> <domain-title>Domain Title</domain-title>
| Action Definition Reference | 39
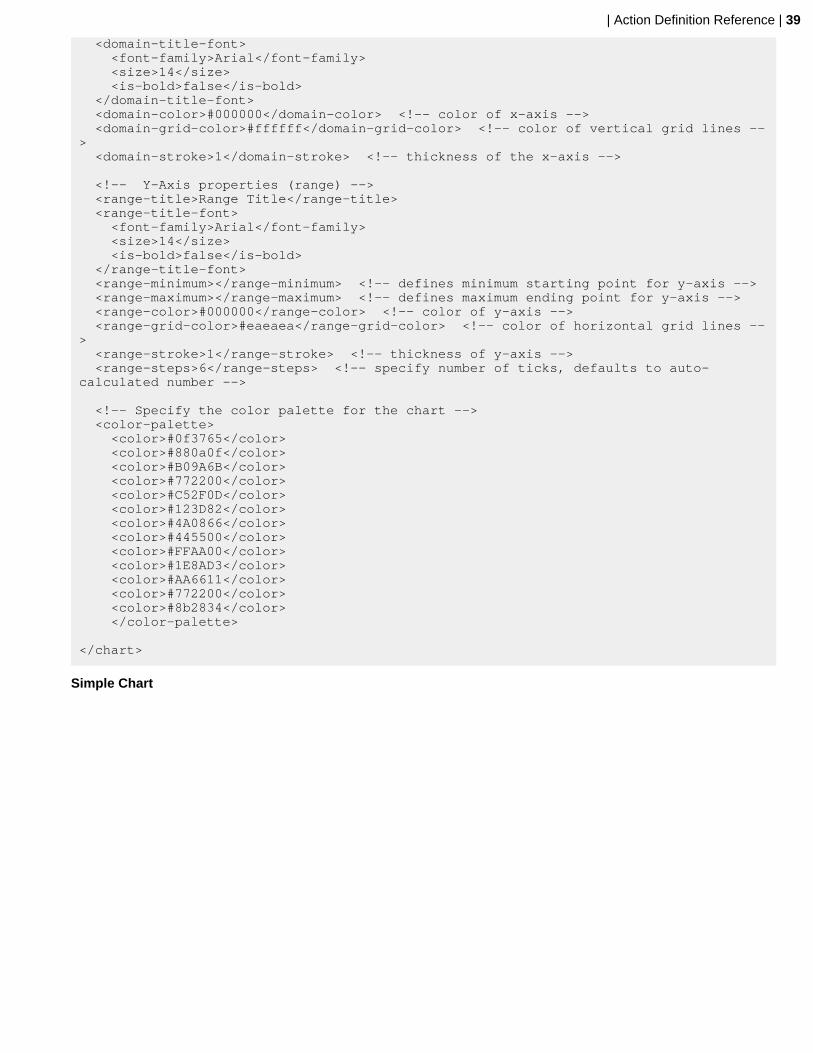
<domain-title-font> <font-family>Arial</font-family> <size>14</size> <is-bold>false</is-bold> </domain-title-font> <domain-color>#000000</domain-color> <!-- color of x-axis --> <domain-grid-color>#ffffff</domain-grid-color> <!-- color of vertical grid lines --> <domain-stroke>1</domain-stroke> <!-- thickness of the x-axis -->
<!-- Y-Axis properties (range) --> <range-title>Range Title</range-title> <range-title-font> <font-family>Arial</font-family> <size>14</size> <is-bold>false</is-bold> </range-title-font> <range-minimum></range-minimum> <!-- defines minimum starting point for y-axis --> <range-maximum></range-maximum> <!-- defines maximum ending point for y-axis --> <range-color>#000000</range-color> <!-- color of y-axis --> <range-grid-color>#eaeaea</range-grid-color> <!-- color of horizontal grid lines --> <range-stroke>1</range-stroke> <!-- thickness of y-axis --> <range-steps>6</range-steps> <!-- specify number of ticks, defaults to auto-calculated number -->
<!-- Specify the color palette for the chart --> <color-palette> <color>#0f3765</color> <color>#880a0f</color> <color>#B09A6B</color> <color>#772200</color> <color>#C52F0D</color> <color>#123D82</color> <color>#4A0866</color> <color>#445500</color> <color>#FFAA00</color> <color>#1E8AD3</color> <color>#AA6611</color> <color>#772200</color> <color>#8b2834</color> </color-palette>
</chart>
Simple Chart
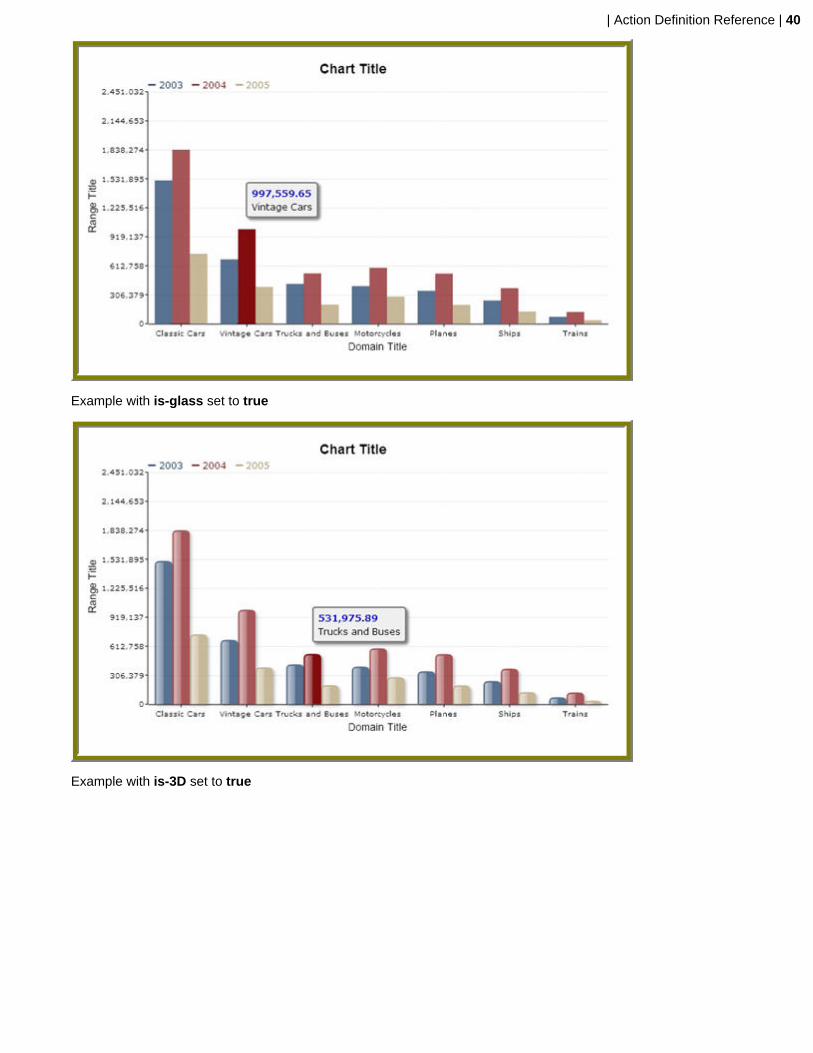
| Action Definition Reference | 40
Example with is-glass set to true
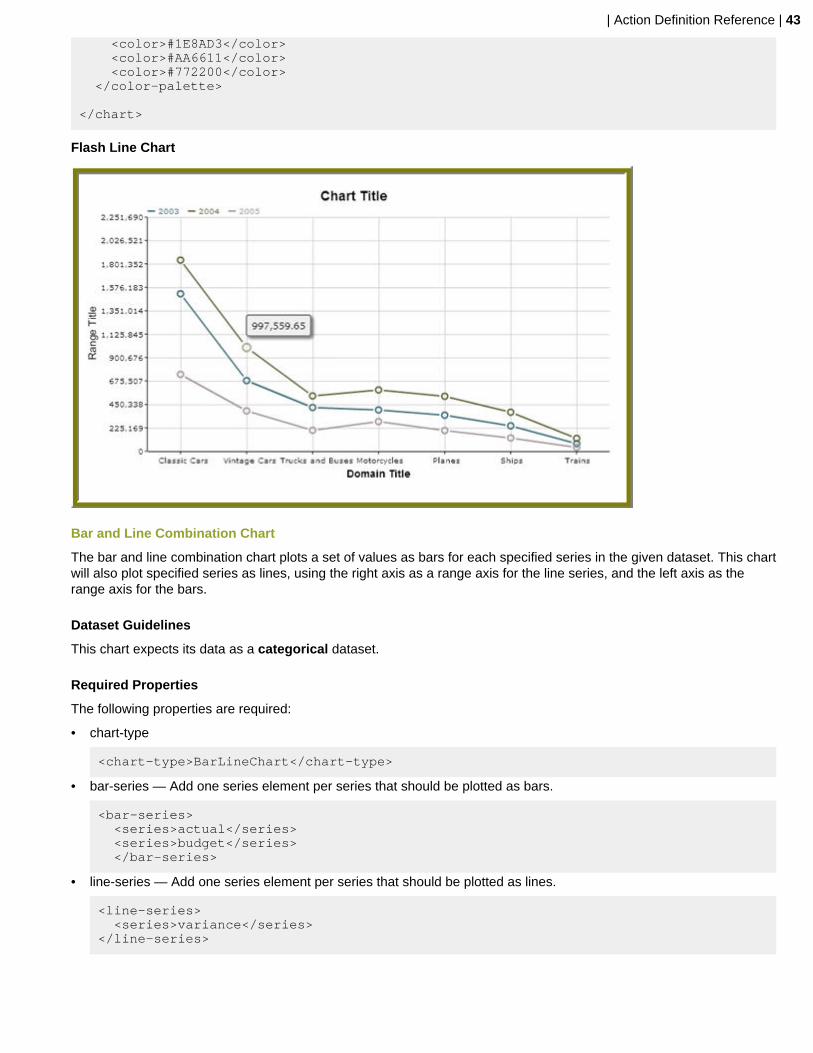
Example with is-3D set to true

| Action Definition Reference | 41
Example with is-sketch set to true (fun factor = 10)
Line Chart
The line chart plots a set of values on a line for each series in the given dataset.
Dataset Guidelines
This chart expects its data as a categorical dataset.
Required Properties
The only property a line chart requires is the appropriate chart-type.
<chart-type>LineChart</chart-type>

| Action Definition Reference | 42
Example
The example below contains the full set of additional supported properties with comments about its purpose and validvalues. If you are new to flash charts start here. The following chart definition will produce the chart shown directlybelow it.
<chart> <!-- Define the chart type --> <chart-type>LineChart</chart-type>
<!-- Specify the title of the chart --> <title>Chart Title</title> <title-font> <font-family>Arial</font-family> <size>18</size> <is-bold>true</is-bold> </title-font>
<!-- Line Chart properties --> <line-width>2.0</line-width> <dot-style>hollow</dot-style> <!-- values: dot, normal, hollow --> <dot-width>5</dot-width>
<!-- General Chart Propeties --> <chart-background type="color">#FFFFFF</chart-background> <plot-background type="color">#FFFFFF</plot-background>
<!-- X-Axis properties (domain) --> <domain-title>Domain Title</domain-title> <domain-title-font> <font-family>Arial</font-family> <size>14</size> <is-bold>true</is-bold> </domain-title-font> <domain-color>#000000</domain-color> <!-- color of x-axis --> <domain-grid-color>#CCCCCC</domain-grid-color> <!-- color of vertical grid lines --> <domain-stroke>1</domain-stroke> <!-- thickness of x-axis -->
<!-- Y-Axis properties (range) --> <range-title>Range Title</range-title> <range-title-font> <font-family>Arial</font-family> <size>14</size> <is-bold>true</is-bold> </range-title-font> <range-minimum></range-minimum> <!-- defines minimum starting point for y-axis range --> <range-maximum></range-maximum> <!-- defines maximum ending point for y-axis range --> <range-color>#000000</range-color> <!-- color of y-axis --> <range-grid-color>#CCCCCC</range-grid-color> <!-- color of horizontal grid lines --> <range-stroke>1</range-stroke> <!-- thickness of y-axis --> <range-steps>8</range-steps> <!-- specify number of ticks, defaults to auto-calculated number -->
<!-- Specify the color palette for the chart series--> <color-palette> <color>#387179</color> <color>#626638</color> <color>#A8979A</color> <color>#B09A6B</color> <color>#772200</color> <color>#C52F0D</color> <color>#123D82</color> <color>#4A0866</color> <color>#445500</color> <color>#FFAA00</color>
| Action Definition Reference | 43
<color>#1E8AD3</color> <color>#AA6611</color> <color>#772200</color> </color-palette>
</chart>
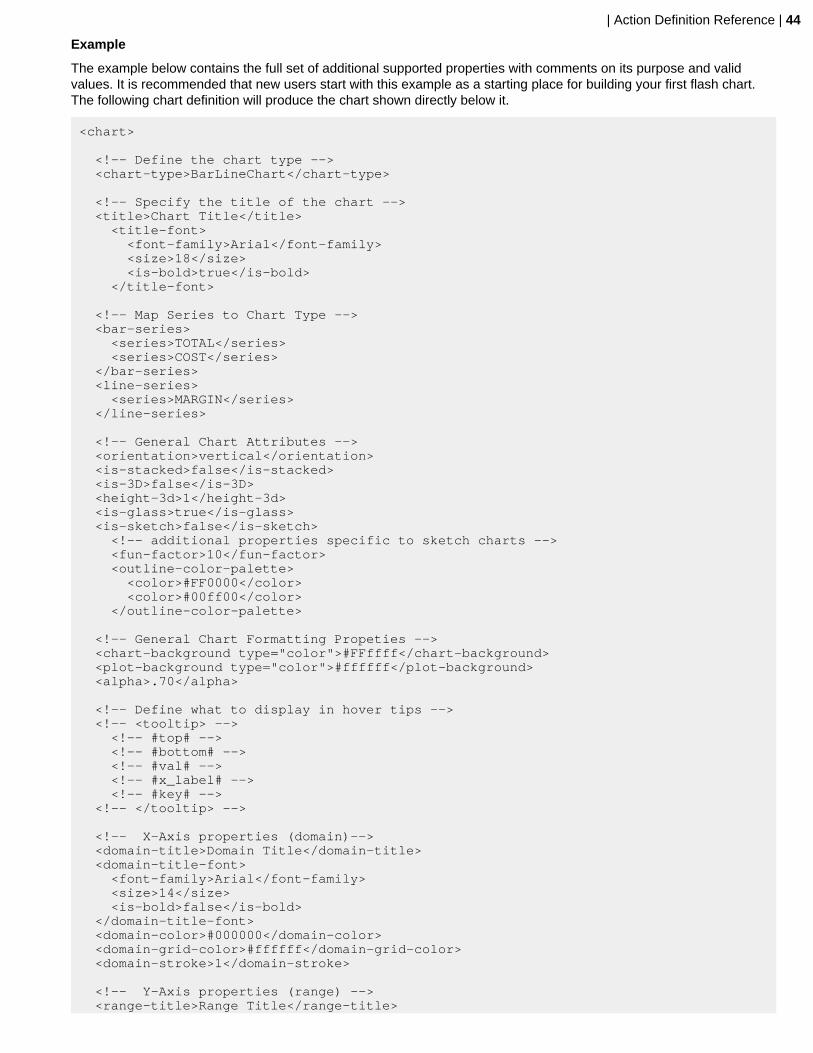
Flash Line Chart
Bar and Line Combination Chart
The bar and line combination chart plots a set of values as bars for each specified series in the given dataset. This chartwill also plot specified series as lines, using the right axis as a range axis for the line series, and the left axis as therange axis for the bars.
Dataset Guidelines
This chart expects its data as a categorical dataset.
Required Properties
The following properties are required:
• chart-type
<chart-type>BarLineChart</chart-type>
• bar-series — Add one series element per series that should be plotted as bars.
<bar-series> <series>actual</series> <series>budget</series> </bar-series>
• line-series — Add one series element per series that should be plotted as lines.
<line-series> <series>variance</series></line-series>
| Action Definition Reference | 44
Example
The example below contains the full set of additional supported properties with comments on its purpose and validvalues. It is recommended that new users start with this example as a starting place for building your first flash chart.The following chart definition will produce the chart shown directly below it.
<chart>
<!-- Define the chart type --> <chart-type>BarLineChart</chart-type>
<!-- Specify the title of the chart --> <title>Chart Title</title> <title-font> <font-family>Arial</font-family> <size>18</size> <is-bold>true</is-bold> </title-font>
<!-- Map Series to Chart Type --> <bar-series> <series>TOTAL</series> <series>COST</series> </bar-series> <line-series> <series>MARGIN</series> </line-series>
<!-- General Chart Attributes --> <orientation>vertical</orientation> <is-stacked>false</is-stacked> <is-3D>false</is-3D> <height-3d>1</height-3d> <is-glass>true</is-glass> <is-sketch>false</is-sketch> <!-- additional properties specific to sketch charts --> <fun-factor>10</fun-factor> <outline-color-palette> <color>#FF0000</color> <color>#00ff00</color> </outline-color-palette>
<!-- General Chart Formatting Propeties --> <chart-background type="color">#FFffff</chart-background> <plot-background type="color">#ffffff</plot-background> <alpha>.70</alpha>
<!-- Define what to display in hover tips --> <!-- <tooltip> --> <!-- #top# --> <!-- #bottom# --> <!-- #val# --> <!-- #x_label# --> <!-- #key# --> <!-- </tooltip> -->
<!-- X-Axis properties (domain)--> <domain-title>Domain Title</domain-title> <domain-title-font> <font-family>Arial</font-family> <size>14</size> <is-bold>false</is-bold> </domain-title-font> <domain-color>#000000</domain-color> <domain-grid-color>#ffffff</domain-grid-color> <domain-stroke>1</domain-stroke>
<!-- Y-Axis properties (range) --> <range-title>Range Title</range-title>

| Action Definition Reference | 45
<range-title-font> <font-family>Arial</font-family> <size>14</size> <is-bold>false</is-bold> </range-title-font> <range-minimum></range-minimum> <range-maximum></range-maximum> <range-color>#000000</range-color> <range-grid-color>#eaeaea</range-grid-color> <range-stroke>1</range-stroke> <range-steps>6</range-steps>
<!-- Secondary Y-Axis properties (line-range) --> <lines-range-minimum>40</lines-range-minimum> <lines-range-maximum>60</lines-range-maximum> <lines-range-color>#000000</lines-range-color> <lines-range-stroke>1</lines-range-stroke> <line-range-steps>6</line-range-steps>
<!-- Specify the color palette for the chart --> <color-palette> <color>#0f3765</color> <color>#880a0f</color> <color>#B09A6B</color> <color>#772200</color> <color>#C52F0D</color> <color>#123D82</color> <color>#4A0866</color> <color>#445500</color> <color>#FFAA00</color> <color>#1E8AD3</color> <color>#AA6611</color> <color>#772200</color> <color>#8b2834</color> </color-palette>
</chart>
Bar/Line Combination Chart
Pie Chart
The pie chart plots a single value per series in a pie shape.
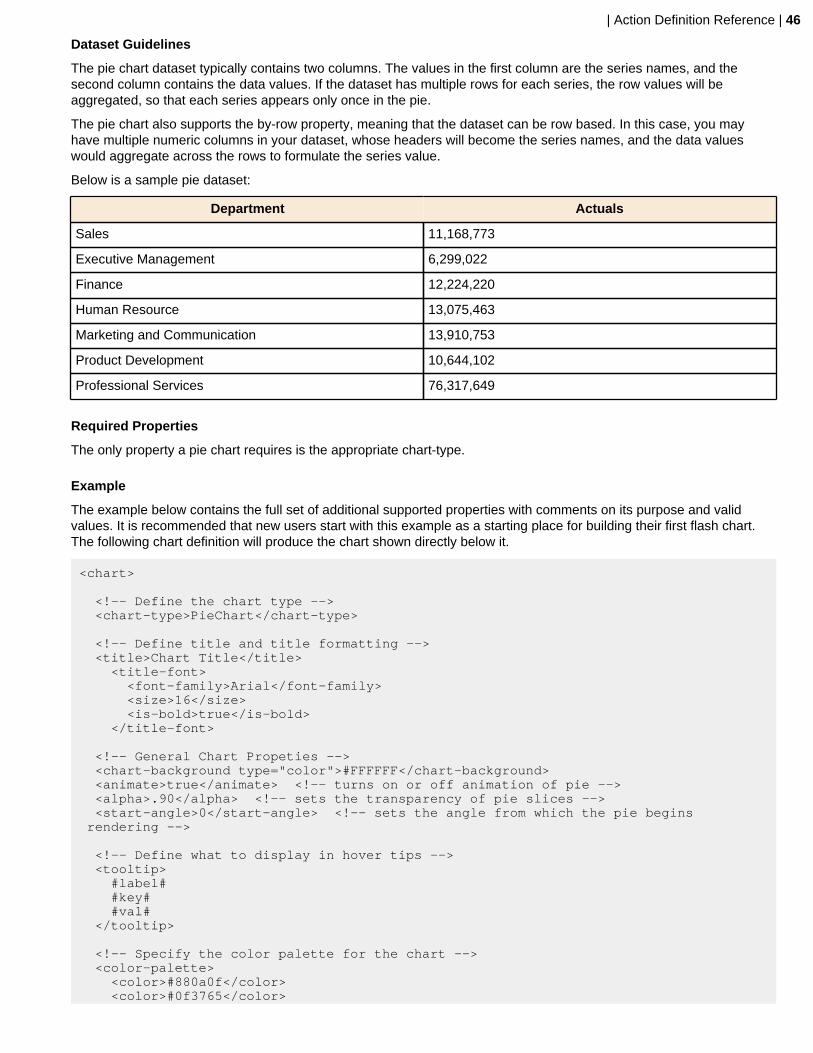
| Action Definition Reference | 46
Dataset Guidelines
The pie chart dataset typically contains two columns. The values in the first column are the series names, and thesecond column contains the data values. If the dataset has multiple rows for each series, the row values will beaggregated, so that each series appears only once in the pie.
The pie chart also supports the by-row property, meaning that the dataset can be row based. In this case, you mayhave multiple numeric columns in your dataset, whose headers will become the series names, and the data valueswould aggregate across the rows to formulate the series value.
Below is a sample pie dataset:
Department Actuals
Sales 11,168,773
Executive Management 6,299,022
Finance 12,224,220
Human Resource 13,075,463
Marketing and Communication 13,910,753
Product Development 10,644,102
Professional Services 76,317,649
Required Properties
The only property a pie chart requires is the appropriate chart-type.
Example
The example below contains the full set of additional supported properties with comments on its purpose and validvalues. It is recommended that new users start with this example as a starting place for building their first flash chart.The following chart definition will produce the chart shown directly below it.
<chart>
<!-- Define the chart type --> <chart-type>PieChart</chart-type>
<!-- Define title and title formatting --> <title>Chart Title</title> <title-font> <font-family>Arial</font-family> <size>16</size> <is-bold>true</is-bold> </title-font>
<!-- General Chart Propeties --> <chart-background type="color">#FFFFFF</chart-background> <animate>true</animate> <!-- turns on or off animation of pie --> <alpha>.90</alpha> <!-- sets the transparency of pie slices --> <start-angle>0</start-angle> <!-- sets the angle from which the pie begins rendering -->
<!-- Define what to display in hover tips --> <tooltip> #label# #key# #val# </tooltip>
<!-- Specify the color palette for the chart --> <color-palette> <color>#880a0f</color> <color>#0f3765</color>

| Action Definition Reference | 47
<color>#5d7e33</color> <color>#795687</color> <color>#AF3335</color> <color>#41747e</color> <color>#FDC446</color> <color>#5d7e33</color> <color>#1E8AD3</color> <color>#AA6611</color> <color>#772200</color> </color-palette>
</chart>
Pie Chart
Area Chart
The area chart plots a set of values on a line per series, and fills the background of the plot area with the series color foreach series in the given dataset. Unlike the ChartComponent (jFreeChart based), the Flash Area chart does not stackthe area.
Dataset Guidelines
This chart expects its data as a categorical dataset.
Required Properties
The only property an area chart requires is the appropriate chart-type.
Example
The example below contains the full set of additional supported properties with comments on its purpose and validvalues. It is recommended that new users start with this example as a starting place for building their first flash chart.The following chart definition will produce the chart shown directly below it.
<chart> <!-- Define the chart type --> <chart-type>AreaChart</chart-type>
<!-- Specify the title of the chart --> <title>Chart Title</title> <title-font>
| Action Definition Reference | 48
<font-family>Arial</font-family> <size>18</size> <is-bold>true</is-bold> </title-font>
<!-- Area Chart properties --> <line-width>2.0</line-width> <dot-style>hollow</dot-style> <!-- values: dot, normal, hollow --> <dot-width>5</dot-width> <alpha>.95</alpha>
<!-- General Chart Propeties --> <chart-background type="color">#FFFFFF</chart-background> <plot-background type="color">#FFFFFF</plot-background>
<!-- X-Axis properties (domain) --> <domain-title>Domain Title</domain-title> <domain-title-font> <font-family>Arial</font-family> <size>14</size> <is-bold>true</is-bold> </domain-title-font> <domain-color>#000000</domain-color> <!-- color of x-axis --> <domain-grid-color>#CCCCCC</domain-grid-color> <!-- color of vertical grid lines --> <domain-stroke>1</domain-stroke> <!-- thickness of x-axis -->
<!-- Y-Axis properties (range) --> <range-title>Range Title</range-title> <range-title-font> <font-family>Arial</font-family> <size>14</size> <is-bold>true</is-bold> </range-title-font> <range-minimum></range-minimum> <!-- defines minimum starting point for y-axis range --> <range-maximum></range-maximum> <!-- defines maximum ending point for y-axis range --> <range-color>#000000</range-color> <!-- color of y-axis --> <range-grid-color>#CCCCCC</range-grid-color> <!-- color of horizontal grid lines --> <range-stroke>1</range-stroke> <!-- thickness of y-axis --> <range-steps>8</range-steps> <!-- specify number of ticks, defaults to auto-calculated number -->
<!-- Specify the color palette for the chart --> <color-palette> <color>#DB0000</color> <color>#B09A6B</color> <color>#2C00A8</color> <color>#C52F0D</color> <color>#123D82</color> <color>#4A0866</color> <color>#445500</color> <color>#FFAA00</color> <color>#1E8AD3</color> <color>#AA6611</color> <color>#772200</color> <color>#0f3765</color> <color>#B09A6B</color> </color-palette>
</chart>
Flash Area Chart

| Action Definition Reference | 49
XY Dot Chart
The XY dot chart consists of pairs of values (plotted as points) drawn as marks for each series in the given dataset. Thischart will have two numeric axes.
Dataset Guidelines
This chart expects its data as an XY dataset.
Required PropertiesThe following properties are required:
chart-type
<chart-type>DotChart</chart-type>
dataset-type
<dataset-type>XYSeriesCollection</dataset-type>
Example
The example below contains the full set of additional supported properties with comments on its purpose and validvalues. It is recommended that new users start with this example as a starting place for building their first flash chart.The following chart definition will produce the chart shown directly below it.
<chart>
<!-- Define the chart type --> <chart-type>DotChart</chart-type>
<!-- Specify the title of the chart --> <title>Chart Title</title> <title-font> <font-family>Arial</font-family> <size>18</size> <is-bold>true</is-bold> </title-font>
<!-- General Chart Attributes --> <dataset-type>XYSeriesCollection</dataset-type>
| Action Definition Reference | 50
<dot-width>10</dot-width> <dot-label-content>{0},{1},{2}</dot-label-content> <!-- formatted label, using {0} - series name, {1} - x , {2} - y -->
<!-- General Chart Formatting Propeties --> <chart-background type="color">#FFFFFF</chart-background> <plot-background type="color">#FFFFFF</plot-background>
<!-- X-Axis properties (domain)--> <domain-title>Domain Title</domain-title> <domain-title-font> <font-family>Arial</font-family> <size>14</size> <is-bold>false</is-bold> </domain-title-font> <domain-minimum></domain-minimum> <!-- defines the minimum starting point for x-axis --> <domain-maximum></domain-maximum> <!-- defines the maximum ending point for x-axis --> <domain-color>#000000</domain-color> <!-- color of x-axis --> <domain-grid-color>#FFFFFF</domain-grid-color> <!-- color of vertical grid lines --> <domain-stroke>1</domain-stroke> <!-- thickness of the x-axis --> <domain-steps>6</domain-steps> <!-- specify the number of ticks, defaults to auto-calculated number -->
<!-- Y-Axis properties (range) --> <range-title>Range Title</range-title> <range-title-font> <font-family>Arial</font-family> <size>14</size> <is-bold>false</is-bold> </range-title-font> <range-minimum></range-minimum> <!-- defines minimum starting point for y-axis --> <range-maximum></range-maximum> <!-- defines maximum ending point for y-axis --> <range-color>#000000</range-color> <!-- color of y-axis --> <range-grid-color>#EAEAEA</range-grid-color> <!-- color of horizontal grid lines --> <range-stroke>1</range-stroke> <!-- thickness of y-axis --> <range-steps>6</range-steps> <!-- specify number of ticks, defaults to auto-calculated number -->
<!-- Specify the color palette for the chart --> <color-palette> <color>#0f3765</color> <color>#880a0f</color> <color>#B09A6B</color> <color>#772200</color> <color>#C52F0D</color> <color>#123D82</color> <color>#4A0866</color> <color>#445500</color> <color>#FFAA00</color> <color>#1E8AD3</color> <color>#AA6611</color> <color>#772200</color> <color>#8b2834</color> </color-palette>
</chart>
XY Dot Chart
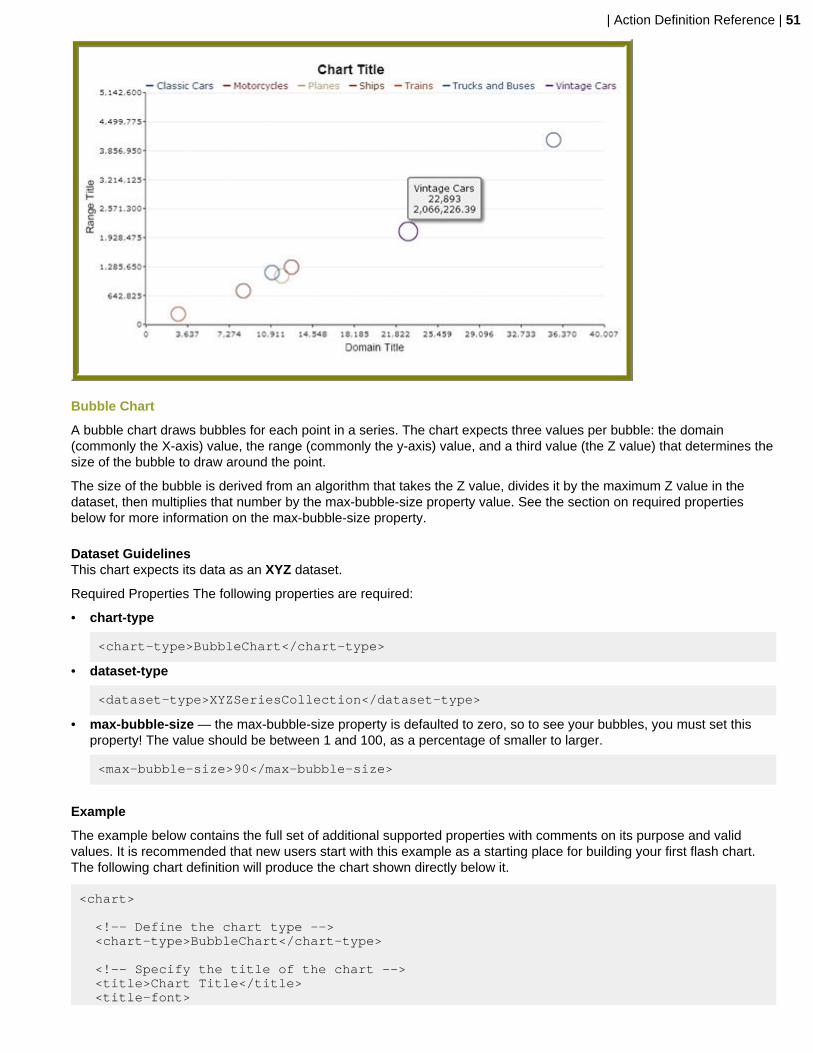
| Action Definition Reference | 51
Bubble Chart
A bubble chart draws bubbles for each point in a series. The chart expects three values per bubble: the domain(commonly the X-axis) value, the range (commonly the y-axis) value, and a third value (the Z value) that determines thesize of the bubble to draw around the point.
The size of the bubble is derived from an algorithm that takes the Z value, divides it by the maximum Z value in thedataset, then multiplies that number by the max-bubble-size property value. See the section on required propertiesbelow for more information on the max-bubble-size property.
Dataset GuidelinesThis chart expects its data as an XYZ dataset.
Required Properties The following properties are required:
• chart-type
<chart-type>BubbleChart</chart-type>
• dataset-type
<dataset-type>XYZSeriesCollection</dataset-type>
• max-bubble-size — the max-bubble-size property is defaulted to zero, so to see your bubbles, you must set thisproperty! The value should be between 1 and 100, as a percentage of smaller to larger.
<max-bubble-size>90</max-bubble-size>
Example
The example below contains the full set of additional supported properties with comments on its purpose and validvalues. It is recommended that new users start with this example as a starting place for building your first flash chart.The following chart definition will produce the chart shown directly below it.
<chart>
<!-- Define the chart type --> <chart-type>BubbleChart</chart-type>
<!-- Specify the title of the chart --> <title>Chart Title</title> <title-font>
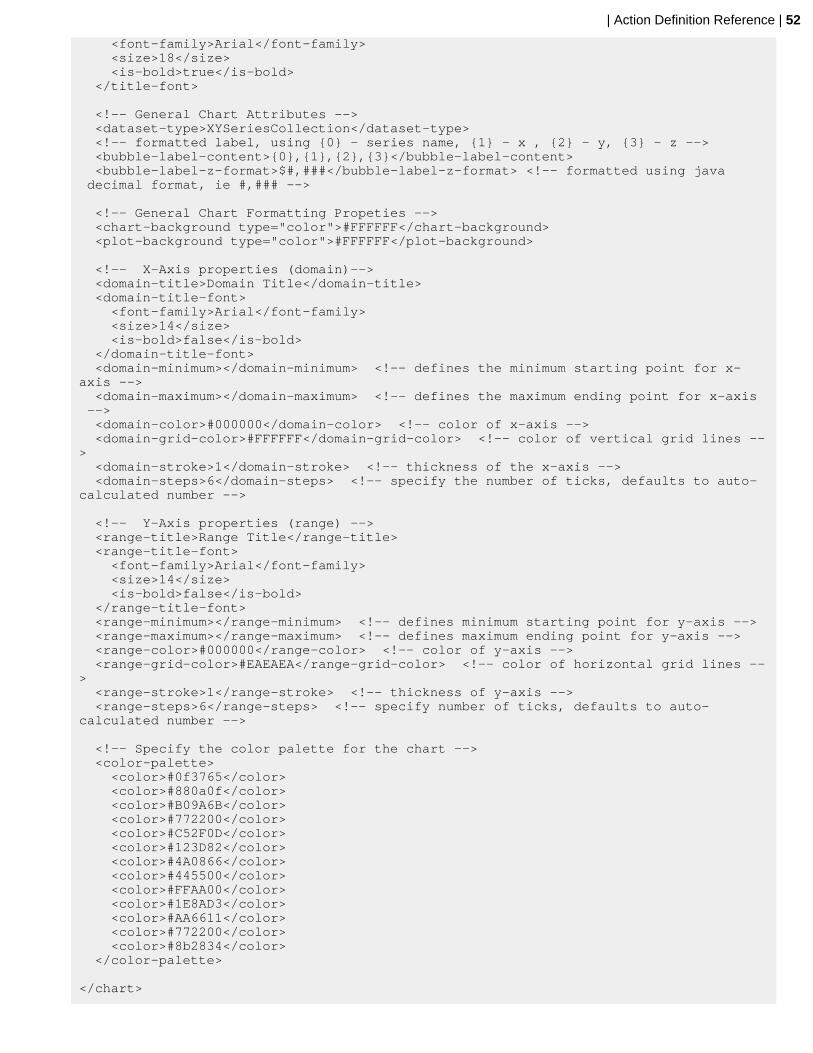
| Action Definition Reference | 52
<font-family>Arial</font-family> <size>18</size> <is-bold>true</is-bold> </title-font>
<!-- General Chart Attributes --> <dataset-type>XYSeriesCollection</dataset-type> <!-- formatted label, using {0} - series name, {1} - x , {2} - y, {3} - z --> <bubble-label-content>{0},{1},{2},{3}</bubble-label-content> <bubble-label-z-format>$#,###</bubble-label-z-format> <!-- formatted using java decimal format, ie #,### -->
<!-- General Chart Formatting Propeties --> <chart-background type="color">#FFFFFF</chart-background> <plot-background type="color">#FFFFFF</plot-background>
<!-- X-Axis properties (domain)--> <domain-title>Domain Title</domain-title> <domain-title-font> <font-family>Arial</font-family> <size>14</size> <is-bold>false</is-bold> </domain-title-font> <domain-minimum></domain-minimum> <!-- defines the minimum starting point for x-axis --> <domain-maximum></domain-maximum> <!-- defines the maximum ending point for x-axis --> <domain-color>#000000</domain-color> <!-- color of x-axis --> <domain-grid-color>#FFFFFF</domain-grid-color> <!-- color of vertical grid lines --> <domain-stroke>1</domain-stroke> <!-- thickness of the x-axis --> <domain-steps>6</domain-steps> <!-- specify the number of ticks, defaults to auto-calculated number -->
<!-- Y-Axis properties (range) --> <range-title>Range Title</range-title> <range-title-font> <font-family>Arial</font-family> <size>14</size> <is-bold>false</is-bold> </range-title-font> <range-minimum></range-minimum> <!-- defines minimum starting point for y-axis --> <range-maximum></range-maximum> <!-- defines maximum ending point for y-axis --> <range-color>#000000</range-color> <!-- color of y-axis --> <range-grid-color>#EAEAEA</range-grid-color> <!-- color of horizontal grid lines --> <range-stroke>1</range-stroke> <!-- thickness of y-axis --> <range-steps>6</range-steps> <!-- specify number of ticks, defaults to auto-calculated number -->
<!-- Specify the color palette for the chart --> <color-palette> <color>#0f3765</color> <color>#880a0f</color> <color>#B09A6B</color> <color>#772200</color> <color>#C52F0D</color> <color>#123D82</color> <color>#4A0866</color> <color>#445500</color> <color>#FFAA00</color> <color>#1E8AD3</color> <color>#AA6611</color> <color>#772200</color> <color>#8b2834</color> </color-palette>
</chart>

| Action Definition Reference | 53
Bubble Chart

| Editing Existing Action Sequences | 54
Editing Existing Action Sequences
If you used Design Studio to create an action sequence in a previous version of the Pentaho Business Analytics, thesame basic rules and practices apply to later releases. While very little has changed with the core set of components,there are some new plugins available to you like the PojoComponent, the result set burst component, and the Flashchart component.
Report Designer publishes reports in the PRPT format, which is an OpenDocument-compliant file archive. ReportDesigner has been entirely overhauled in an attempt to eliminate the need to hand-edit reports with Design Studio,but in previous versions, there were some functions (such as adding user-interactive parameters) that required hand-editing.
If you have already used Design Studio to customize a published report, it is likely that you will continue to have tofollow that process if you want to make changes to the report. Alternatively you could re-create the report in the newReport Designer and republish it to the BI Platform as a PRPT, or you could open the old Report Designer .reportfile with the new Report Designer, use its new and more powerful feature set to add in the custom changes that youformerly used Design Studio for, and publish it to the BI Platform.
Report Designer does not yet have equivalent functionality to the SecureFilterComponent, so if you need to put strictlimits on user parameters, you will have to generate the report by hand with Design Studio.
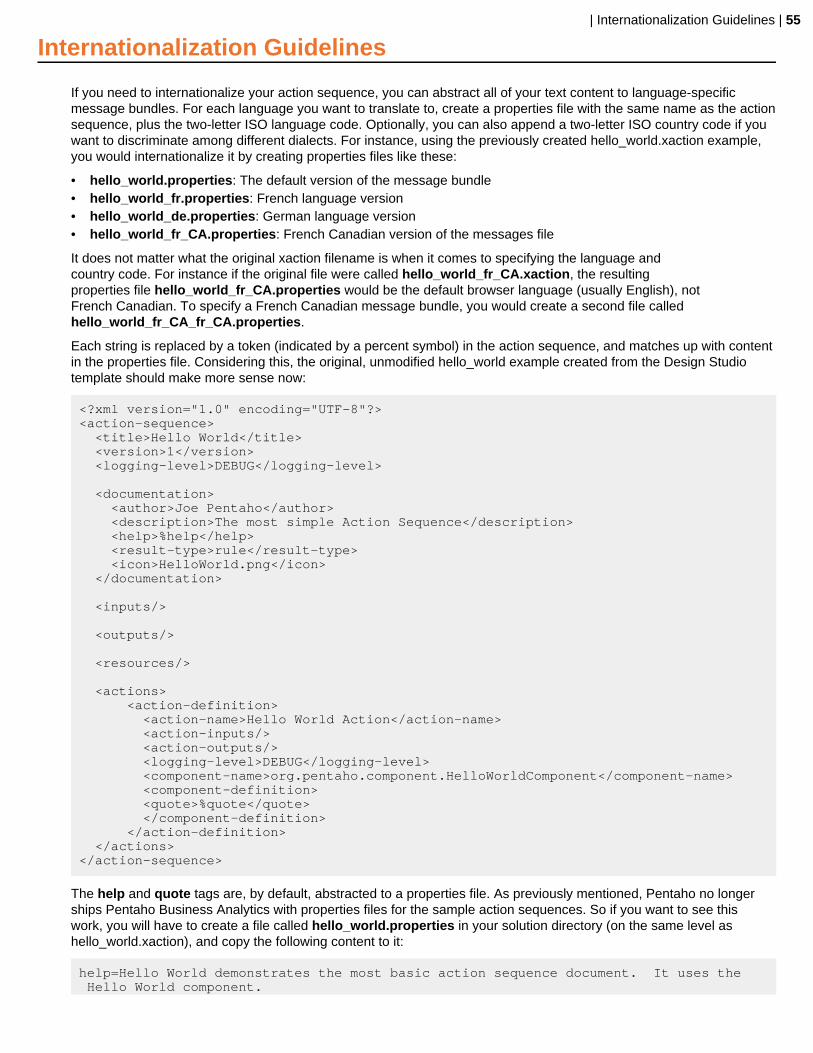
| Internationalization Guidelines | 55
Internationalization Guidelines
If you need to internationalize your action sequence, you can abstract all of your text content to language-specificmessage bundles. For each language you want to translate to, create a properties file with the same name as the actionsequence, plus the two-letter ISO language code. Optionally, you can also append a two-letter ISO country code if youwant to discriminate among different dialects. For instance, using the previously created hello_world.xaction example,you would internationalize it by creating properties files like these:
• hello_world.properties: The default version of the message bundle• hello_world_fr.properties: French language version• hello_world_de.properties: German language version• hello_world_fr_CA.properties: French Canadian version of the messages file
It does not matter what the original xaction filename is when it comes to specifying the language andcountry code. For instance if the original file were called hello_world_fr_CA.xaction, the resultingproperties file hello_world_fr_CA.properties would be the default browser language (usually English), notFrench Canadian. To specify a French Canadian message bundle, you would create a second file calledhello_world_fr_CA_fr_CA.properties.
Each string is replaced by a token (indicated by a percent symbol) in the action sequence, and matches up with contentin the properties file. Considering this, the original, unmodified hello_world example created from the Design Studiotemplate should make more sense now:
<?xml version="1.0" encoding="UTF-8"?><action-sequence> <title>Hello World</title> <version>1</version> <logging-level>DEBUG</logging-level>
<documentation> <author>Joe Pentaho</author> <description>The most simple Action Sequence</description> <help>%help</help> <result-type>rule</result-type> <icon>HelloWorld.png</icon> </documentation>
<inputs/>
<outputs/>
<resources/>
<actions> <action-definition> <action-name>Hello World Action</action-name> <action-inputs/> <action-outputs/> <logging-level>DEBUG</logging-level> <component-name>org.pentaho.component.HelloWorldComponent</component-name> <component-definition> <quote>%quote</quote> </component-definition> </action-definition> </actions></action-sequence>
The help and quote tags are, by default, abstracted to a properties file. As previously mentioned, Pentaho no longerships Pentaho Business Analytics with properties files for the sample action sequences. So if you want to see thiswork, you will have to create a file called hello_world.properties in your solution directory (on the same level ashello_world.xaction), and copy the following content to it:
help=Hello World demonstrates the most basic action sequence document. It uses the Hello World component.

| Internationalization Guidelines | 56
quote=Greetings from the Pentaho BI Platform.
Based on the above action sequence and properties file, the output of hello_world.xaction will be:
Hello World. Greetings from the Pentaho BI Platform.
The first part of the message is still pulled in from the global messages.properties file for the BI Platform. This file canalso be changed to internationalize the entirety of the Pentaho User Console and Pentaho Enterprise Console, but thattask is beyond the scope of this guide.

| Action Sequence Error Handling | 57
Action Sequence Error Handling
When an action sequence fails to execute, it will produce a generic error message. You can bring more specificity to theerror dialogue by pulling in selected details to construct the HTML error page, as explained below.
Customizing Error OutputTo customize your error response page, edit the /pentaho/server/biserver-ee/pentaho-solutions/system/ui/templates/viewActionErrorTemplate.html file and modify it accordingly. Any time an actionsequence fails, a message formatter is applied that will load the template HTML page and replace all the tokens listedin the next section with the appropriate text. That text may be a label, in which case the source of the text is a messageproperties file, or the text may be actual data pertinent to the error. See the next section for all the tokens that you canuse in your template file.
Note: You are not required to use any tokens at all. The HTML file you use can be as lean or as rich withmessages as you wish; you have full control over the content of the error page.
The default error page is shown here:
<html><head><title></title><link rel="stylesheet" type="text/css" href="/pentaho-style/active/default.css"></head><body><script language="javascript" type="text/javascript"><!--function showHide(shID) { if (document.getElementById(shID)) { if (document.getElementById(shID+'-show').style.display != 'none') { document.getElementById(shID+'-show').style.display = 'none'; document.getElementById(shID+'-hide').style.display = 'inline'; document.getElementById(shID).style.display = 'block'; } else { document.getElementById(shID+'-show').style.display = 'inline'; document.getElementById(shID+'-hide').style.display = 'none'; document.getElementById(shID).style.display = 'none'; } }} //--></script>
<div id="errorResponse"><div class="error"> <h1>%ERROR_HEADING%</h1><div class="summary"> <div class="item"><span class="label">%EXCEPTION_MESSAGES_LABEL%</span><pre>%EXCEPTION_MESSAGES%</pre></div> <div class="item"><span class="label">%ACTION_SEQUENCE_LABEL%</span>%ACTION_SEQUENCE%</div> <div class="item"><span class="label">%ACTION_SEQUENCE_EXECUTION_STACK_LABEL%</span><pre>%ACTION_SEQUENCE_EXECUTION_STACK%</pre></div> <div class="item"><span class="label">%LOOP_INDEX_LABEL%</span>%LOOP_INDEX%</div> <div class="item"><span class="label">%EXCEPTION_TIME_LABEL%</span>%EXCEPTION_TIME%</div>

| Action Sequence Error Handling | 58
<div class="item"><span class="label">%EXCEPTION_TYPE_LABEL%</span>%EXCEPTION_TYPE%</div> <div class="item"><span class="label">%SESSION_ID_LABEL%</span>%SESSION_ID%</div> <div class="item"><span class="label">%INSTANCE_ID_LABEL%</span>%INSTANCE_ID%</div> <div class="item"><span class="label">%ACTION_CLASS_LABEL%</span>%ACTION_CLASS%</div> <div class="item"><span class="label">%ACTION_DESC_LABEL%</span>%ACTION_DESC%</div> <!-- <div class="item"><span class="label">%STEP_NUM_LABEL%</span>%STEP_NUM%</div> --></div> <div id="controls"> <a href="#" id="details-show" class="showLink" onclick="showHide('details');return false;">View Details</a><a href="#" id="details-hide" class="hideLink" onclick="showHide('details');return false;">Hide Details</a></div>
<div id="details" class="details"><span class="label">%STACK_TRACE_LABEL%</span><pre class="stackTrace">%STACK_TRACE%<pre></div> </div> </div>
<div class="errorResponseFooter">%SERVER_INFO%</div> </body></html>
Error Token ReferenceBelow is a complete list of all tokens available to action sequence HTML error pages.
Note: The message bundle key corresponds to the MessageFormatter method that generates the message;this is useful for programmers who want to modify the way action sequences errors are generated anddisplayed.
Token Description Message bundle key
%ERROR_HEADING% The top heading on the HTMLpage. For instance, "The PentahoBI Platform reported an error whilerunning an action sequence."
RESPONSE_ERROR_HEADING
%EXCEPTION_MSG_LABEL% Label for the primary error. Forinstance, "Error Message:"
RESPONSE_EXCEPTION_MSG_LABEL
%EXCEPTION_MSG% Prints the topmost exception messagetext.
N/A
%EXCEPTION_TIME_LABEL% Label for the error timestamp. Forinstance, "Error Time:"
RESPONSE_EXCEPTION_TIME_LABEL
%EXCEPTION_TIME% The time the root cause exceptionoccurred.
N/A
%EXCEPTION_TYPE_LABEL% Label for the exception type. Forinstance, "Error Type:"
RESPONSE_EXCEPTION_TYPE_LABEL
%EXCEPTION_TYPE% The type of the topmost Javaexception.
N/A

| Action Sequence Error Handling | 59
Token Description Message bundle key
%SESSION_ID_LABEL% Label for the session ID. For instance,"Session ID:"
RESPONSE_EXCEPTION_SESSION_ID_LABEL
%SESSION_ID% The session name of the actionsequence's execution.
N/A
%INSTANCE_ID_LABEL% Label for the instance ID. Forexample, "Instance ID:"
RESPONSE_EXCEPTION_INSTANCE_ID_LABEL
%INSTANCE_ID% The unique identifier for the runtimesession that executed the actionsequence.
N/A
%ACTION_SEQUENCE_LABEL% Label for the action sequence name.For instance, "Action Sequence:"
RESPONSE_EXCEPTION_ACTION_SEQUENCE_LABEL
%ACTION_SEQUENCE% The name of the xaction file thatfailed.
N/A
%ACTION_SEQUENCE_EXECUTION_STACK_LABEL%
Label for the location of the error. Forinstance, "Execution Stack:"
RESPONSE_EXCEPTION_ACTION_SEQUENCE_EXECUTION_STACK_LABEL
%ACTION_SEQUENCE_EXECUTION_STACK%
A pointer into the place in the xactionfile's DOM where the error occurred.
N/A
%ACTION_CLASS_LABEL% Label for the component that failed.For instance, "Action Class:"
RESPONSE_EXCEPTION_ACTION_CLASS_LABEL
%ACTION_CLASS% The name of the component or actionthat failed, as described in the xactionfile.
N/A
%ACTION_DESC_LABEL% Label for the action-type description,if applicable. For instance, "ActionDesc:"
RESPONSE_EXCEPTION_ACTION_DESC_LABEL
%ACTION_DESC% If the xaction provides an "action-type" element, that descriptive textgoes here.
N/A
%STACK_TRACE_LABEL% Label for the Java stack trace. Forexample, "Stack Trace:"
RESPONSE_EXCEPTION_STACK_TRACE_LABEL
%STACK_TRACE% The full Java stack trace text (can beseveral dozen lines long).
N/A
%EXCEPTION_MESSAGES_LABEL%
Label for exception summaries. Forinstance, "Possible Causes:"
RESPONSE_EXCEPTION_MESSAGES_LABEL
%EXCEPTION_MESSAGES% An inverted (root cause first) summaryof the exceptions that occurred forquicker identification of the rootproblem.
N/A
%SERVER_INFO% The version of the BI Platform andother identifying information.
USER_SERVER_VERSION
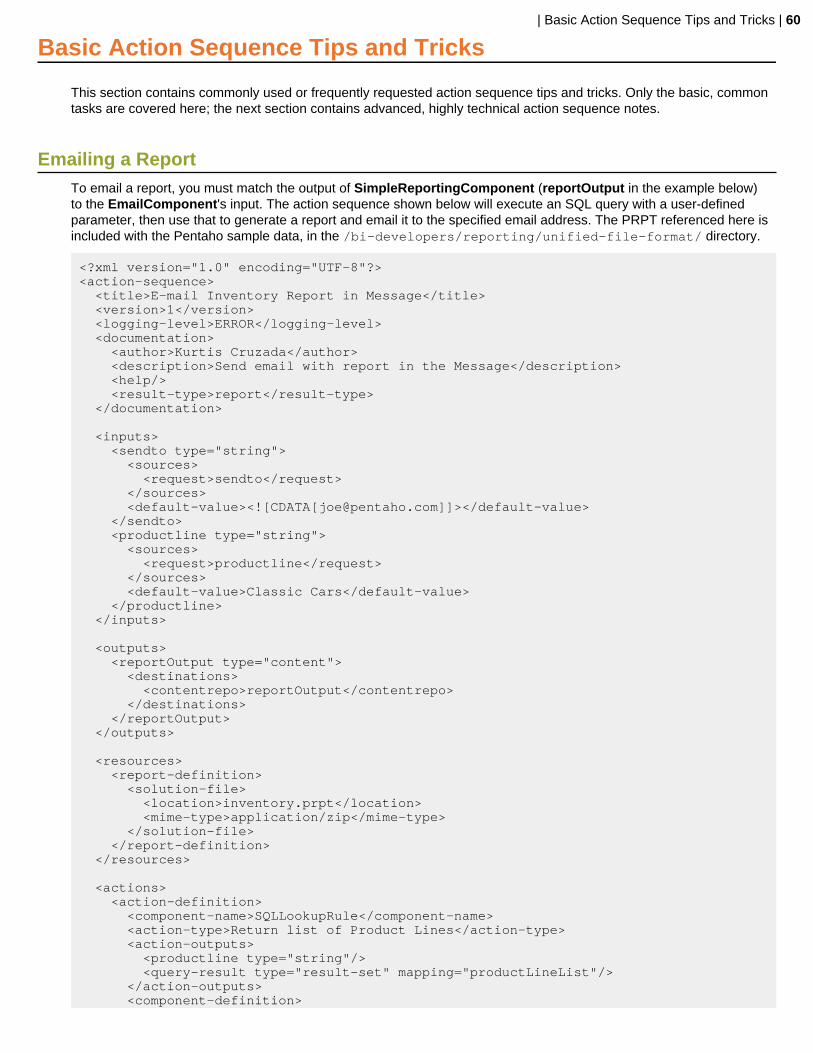
| Basic Action Sequence Tips and Tricks | 60
Basic Action Sequence Tips and Tricks
This section contains commonly used or frequently requested action sequence tips and tricks. Only the basic, commontasks are covered here; the next section contains advanced, highly technical action sequence notes.
Emailing a ReportTo email a report, you must match the output of SimpleReportingComponent (reportOutput in the example below)to the EmailComponent's input. The action sequence shown below will execute an SQL query with a user-definedparameter, then use that to generate a report and email it to the specified email address. The PRPT referenced here isincluded with the Pentaho sample data, in the /bi-developers/reporting/unified-file-format/ directory.
<?xml version="1.0" encoding="UTF-8"?><action-sequence> <title>E-mail Inventory Report in Message</title> <version>1</version> <logging-level>ERROR</logging-level> <documentation> <author>Kurtis Cruzada</author> <description>Send email with report in the Message</description> <help/> <result-type>report</result-type> </documentation>
<inputs> <sendto type="string"> <sources> <request>sendto</request> </sources> <default-value><![CDATA[[email protected]]]></default-value> </sendto> <productline type="string"> <sources> <request>productline</request> </sources> <default-value>Classic Cars</default-value> </productline> </inputs>
<outputs> <reportOutput type="content"> <destinations> <contentrepo>reportOutput</contentrepo> </destinations> </reportOutput> </outputs>
<resources> <report-definition> <solution-file> <location>inventory.prpt</location> <mime-type>application/zip</mime-type> </solution-file> </report-definition> </resources> <actions> <action-definition> <component-name>SQLLookupRule</component-name> <action-type>Return list of Product Lines</action-type> <action-outputs> <productline type="string"/> <query-result type="result-set" mapping="productLineList"/> </action-outputs> <component-definition>

| Basic Action Sequence Tips and Tricks | 61
<jndi>SampleData</jndi> <query><![CDATA[select distinct(productline) from PRODUCTS]]></query> </component-definition> </action-definition> <action-definition> <component-name>SecureFilterComponent</component-name> <action-type>Prompt for Line and Email Address</action-type> <action-inputs> <sendto type="string"/> <productline type="string"/> <productLineList type="result-set"/> </action-inputs> <component-definition> <selections> <productline style="list-multi"> <title>Select Product Line</title> <filter value-col-name="productline" display-col-name="productline">productLineList</filter> </productline> <sendto filter="none" style="text-box"> <title>Email To</title> </sendto> </selections> </component-definition> </action-definition> <action-definition> <component-name>SQLLookupRule</component-name> <action-type>SQL Query For Report Data</action-type> <action-inputs> <productline type="string"/> </action-inputs> <action-outputs> <query-result type="result-set" mapping="queryData"/> </action-outputs> <component-definition> <jndi>SampleData</jndi> <live>true</live> <query><![CDATA[SELECT PRODUCTS.PRODUCTLINE, PRODUCTS.PRODUCTVENDOR, PRODUCTS.PRODUCTCODE, PRODUCTS.PRODUCTNAME, PRODUCTS.PRODUCTSCALE, PRODUCTS.PRODUCTDESCRIPTION, PRODUCTS.QUANTITYINSTOCK, PRODUCTS.BUYPRICE, PRODUCTS.MSRP FROM PRODUCTS WHERE PRODUCTS.PRODUCTLINE IN ({PREPARE:productline}) ORDER BY PRODUCTLINE ASC, PRODUCTVENDOR ASC, PRODUCTCODE ASC]]></query> </component-definition> </action-definition> <action-definition> <component-name>SimpleReportingComponent</component-name> <action-type>Pentaho Report</action-type> <action-inputs> <queryData type="result-set"/> </action-inputs> <action-resources> <report-definition type="resource"/> </action-resources> <action-outputs> <outputstream type="content" mapping="reportOutput"/> </action-outputs> <component-definition> <useContentRepository><![CDATA[true]]></useContentRepository> <outputType><![CDATA[text/html]]></outputType> </component-definition> </action-definition> <action-definition> <component-name>EmailComponent</component-name> <action-type>E-Mail HTML</action-type> <action-inputs>

| Basic Action Sequence Tips and Tricks | 62
<to type="string" mapping="sendto"/> <message-html type="string" mapping="reportOutput"/> </action-inputs> <component-definition> <message-plain><![CDATA[Please see the report attached.]]></message-plain> <subject><![CDATA[Income Statement HTML]]></subject> </component-definition> </action-definition> </actions> </action-sequence>

| Advanced Action Sequence Tips and Tricks | 63
Advanced Action Sequence Tips and Tricks
The tips and tricks in this section apply to rare or specific cases; they highlight unusual and interesting ways to useaction sequences to automate complex tasks.
Using Java Virtual Machine Input ParametersIn an action sequence, you can specify the source of an input parameter as jvm and the Pentaho solution enginewill resolve the parameter from Java's native System.getProperty( ) functions. The Pentaho class that retrievesparameters from the Java Virtual Machine properties is org.pentaho.platform.util.JVMParameterProvider.
Here's an example action sequence fragment:
<java_version type="string"> <sources> <jvm>java.version</jvm> </sources></java_version>
For common JVM properties, refer to http://docs.oracle.com/javase/1.5.0/docs/api/java/lang/System.html#getProperties%28%29
Using Action Sequence Variables in Kettle/PDIIf you have variables in an action sequence that you want to access in a Kettle job or transformation, you must mapthem to command line arguments.
Modifying your ETL process
The first step is to edit your workflow so that accepts command line arguments, as shown in the example KTR belowwhich uses the Get System Info step to accomplish this. It then passes the parameters to a script step which setsvariables. You would call this KTR as the first part of a job, then go on to other transformations that use the variablevalues, e.g. use ${END_DATE} in a SQL step.
<?xml version="1.0" encoding="UTF-8"?><transformation> <info> <name>init</name> <description/> <extended_description/> <trans_version/> <directory>/</directory> <log> <read/> <write/> <input/> <output/> <update/> <rejected/> <connection/> <table/> <step_performance_table/> <use_batchid>Y</use_batchid> <use_logfield>N</use_logfield> </log> <maxdate> <connection/> <table/> <field/> <offset>0.0</offset> <maxdiff>0.0</maxdiff> </maxdate>

| Advanced Action Sequence Tips and Tricks | 64
<size_rowset>10000</size_rowset> <sleep_time_empty>50</sleep_time_empty> <sleep_time_full>50</sleep_time_full> <unique_connections>N</unique_connections> <feedback_shown>Y</feedback_shown> <feedback_size>50000</feedback_size> <using_thread_priorities>Y</using_thread_priorities> <shared_objects_file/> <capture_step_performance>N</capture_step_performance> <step_performance_capturing_delay>1000</step_performance_capturing_delay> <dependencies> </dependencies> <partitionschemas> </partitionschemas> <slaveservers> </slaveservers> <clusterschemas> </clusterschemas> <modified_user>-</modified_user> <modified_date>2008/10/15 14:28:18.337</modified_date> </info> <notepads> <notepad> <note>Get the period start and end date</note> <xloc>16</xloc> <yloc>74</yloc> <width>103</width> <heigth>32</heigth> </notepad> <notepad> <note>Change the format of the start and end date.Store the start dateas a variable</note> <xloc>147</xloc> <yloc>69</yloc> <width>105</width> <heigth>65</heigth> </notepad> </notepads> <order> <hop> <from>Get System Info</from><to>Process Parameters</to><enabled>Y</enabled> </hop> </order> <step> <name>Get System Info</name> <type>SystemInfo</type> <description/> <distribute>Y</distribute> <copies>1</copies> <partitioning> <method>none</method> <schema_name/> </partitioning> <fields> <field> <name>start_date_str</name> <type>command line argument 1</type> </field> <field> <name>end_date_str</name> <type>command line argument 2</type> </field> </fields> <cluster_schema/> <remotesteps> <input> </input> <output> </output> </remotesteps> <GUI> <xloc>43</xloc> <yloc>22</yloc>
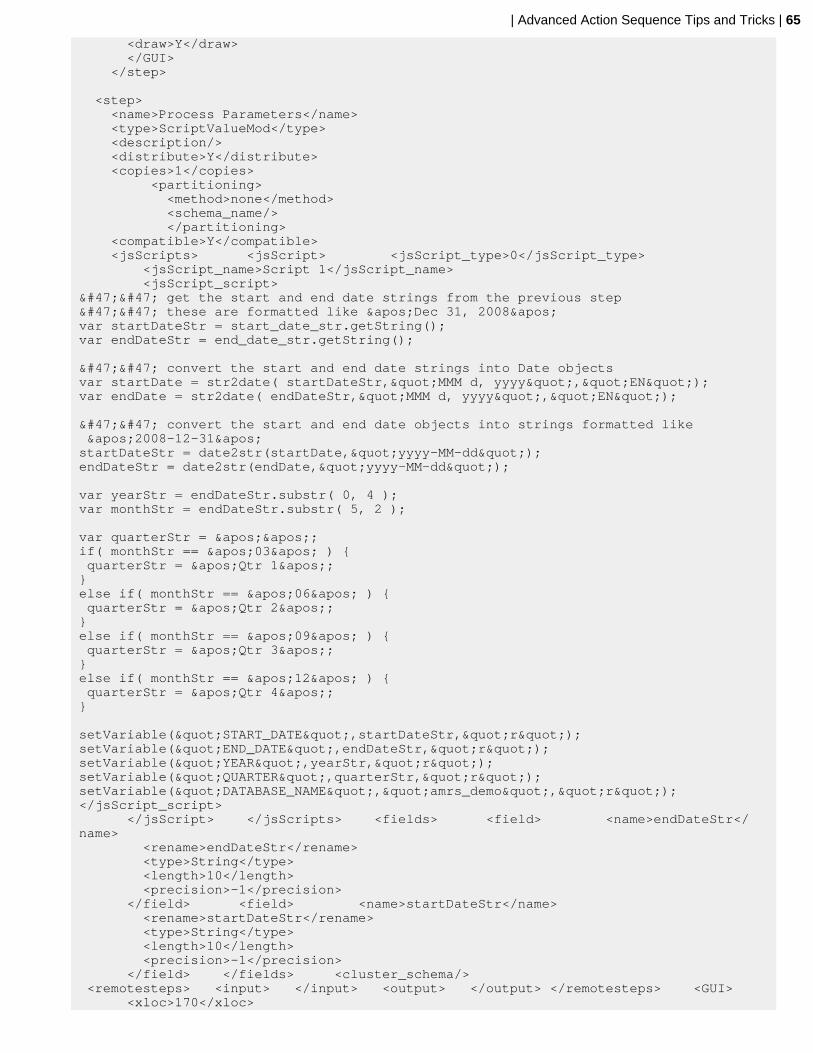
| Advanced Action Sequence Tips and Tricks | 65
<draw>Y</draw> </GUI> </step>
<step> <name>Process Parameters</name> <type>ScriptValueMod</type> <description/> <distribute>Y</distribute> <copies>1</copies> <partitioning> <method>none</method> <schema_name/> </partitioning> <compatible>Y</compatible> <jsScripts> <jsScript> <jsScript_type>0</jsScript_type> <jsScript_name>Script 1</jsScript_name> <jsScript_script>// get the start and end date strings from the previous step// these are formatted like 'Dec 31, 2008'var startDateStr = start_date_str.getString();var endDateStr = end_date_str.getString();
// convert the start and end date strings into Date objectsvar startDate = str2date( startDateStr,"MMM d, yyyy","EN");var endDate = str2date( endDateStr,"MMM d, yyyy","EN");
// convert the start and end date objects into strings formatted like '2008-12-31'startDateStr = date2str(startDate,"yyyy-MM-dd");endDateStr = date2str(endDate,"yyyy-MM-dd");
var yearStr = endDateStr.substr( 0, 4 );var monthStr = endDateStr.substr( 5, 2 );
var quarterStr = '';if( monthStr == '03' ) { quarterStr = 'Qtr 1';}else if( monthStr == '06' ) { quarterStr = 'Qtr 2';}else if( monthStr == '09' ) { quarterStr = 'Qtr 3';}else if( monthStr == '12' ) { quarterStr = 'Qtr 4';}
setVariable("START_DATE",startDateStr,"r");setVariable("END_DATE",endDateStr,"r");setVariable("YEAR",yearStr,"r");setVariable("QUARTER",quarterStr,"r");setVariable("DATABASE_NAME","amrs_demo","r");</jsScript_script> </jsScript> </jsScripts> <fields> <field> <name>endDateStr</name> <rename>endDateStr</rename> <type>String</type> <length>10</length> <precision>-1</precision> </field> <field> <name>startDateStr</name> <rename>startDateStr</rename> <type>String</type> <length>10</length> <precision>-1</precision> </field> </fields> <cluster_schema/> <remotesteps> <input> </input> <output> </output> </remotesteps> <GUI> <xloc>170</xloc>
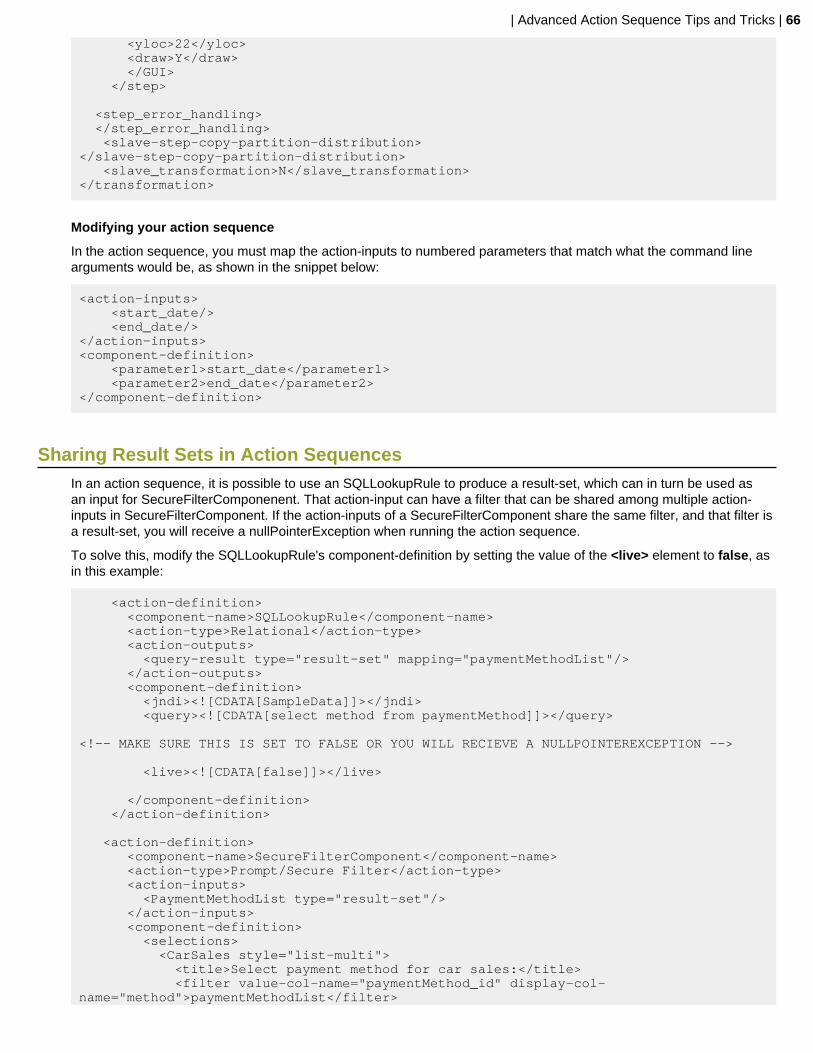
| Advanced Action Sequence Tips and Tricks | 66
<yloc>22</yloc> <draw>Y</draw> </GUI> </step>
<step_error_handling> </step_error_handling> <slave-step-copy-partition-distribution></slave-step-copy-partition-distribution> <slave_transformation>N</slave_transformation></transformation>
Modifying your action sequence
In the action sequence, you must map the action-inputs to numbered parameters that match what the command linearguments would be, as shown in the snippet below:
<action-inputs> <start_date/> <end_date/></action-inputs><component-definition> <parameter1>start_date</parameter1> <parameter2>end_date</parameter2></component-definition>
Sharing Result Sets in Action SequencesIn an action sequence, it is possible to use an SQLLookupRule to produce a result-set, which can in turn be used asan input for SecureFilterComponenent. That action-input can have a filter that can be shared among multiple action-inputs in SecureFilterComponent. If the action-inputs of a SecureFilterComponent share the same filter, and that filter isa result-set, you will receive a nullPointerException when running the action sequence.
To solve this, modify the SQLLookupRule's component-definition by setting the value of the <live> element to false, asin this example:
<action-definition> <component-name>SQLLookupRule</component-name> <action-type>Relational</action-type> <action-outputs> <query-result type="result-set" mapping="paymentMethodList"/> </action-outputs> <component-definition> <jndi><![CDATA[SampleData]]></jndi> <query><![CDATA[select method from paymentMethod]]></query>
<!-- MAKE SURE THIS IS SET TO FALSE OR YOU WILL RECIEVE A NULLPOINTEREXCEPTION -->
<live><![CDATA[false]]></live>
</component-definition> </action-definition>
<action-definition> <component-name>SecureFilterComponent</component-name> <action-type>Prompt/Secure Filter</action-type> <action-inputs> <PaymentMethodList type="result-set"/> </action-inputs> <component-definition> <selections> <CarSales style="list-multi"> <title>Select payment method for car sales:</title> <filter value-col-name="paymentMethod_id" display-col-name="method">paymentMethodList</filter>
| Advanced Action Sequence Tips and Tricks | 67
</CarSales> <BikeSales style="list-multi"> <title>Select payment method for bike sales:</title> <filter value-col-name="paymentMethod_id" display-col-name="method">paymentMethodList</filter> </BikeSales> </selections> </component-definition> </action-definition>
Essentially, if you are using a live result set (live = true), then once you use the result-set, and iterate through it, theresult-set has been used, and it is no longer available. Hence, the NPE. If you use an in-memory result-set (live = false),the result-set is stored in memory for later use.
Using Security Information In Action SequencesIn addition to providing access to security information within the Web application code, the BI Platform's security systemalso provides access to security information within action sequences. That security information then can be used inJavaScript rules, presented in reporting prompts, provided as input to SQL lookup rules, etc.
A typical action sequence inputs section is defined like this:
<inputs> <someInput type="string"> <sources> <request>someInput</request> </sources> </someInput></inputs>
In the above example, the input (called someInput) can be found by looking at the request (HttpServletRequest,PortletRequest, etc.) for a variable called someInput. Then, throughout the rest of the action sequence, specific actionscan reference that input. The Pentaho BI Platform extends the inputs to provide a unique type of input: The securityinput. This input presently supports the following input names:
Input Name Type Description
principalName string The name of the currentlyauthenticated user.
principalRoles string-list The roles that the currentlyauthenticated user is a member of.
principalAuthenticated string true if the user is authenticated, falseotherwise.
principalAdministrator string true if the user is considereda Pentaho Administrator, falseotherwise.
systemRoleNames string-list All the known roles in the system. Usecaution since this list could be quitelong.
systemUserNames string-list All the users known to the system.Use caution since this list could bequite long.
The following input section will get the list of the user's roles, and make it available to all the actionsin the action sequence:
<inputs> <principalRoles type="string-list"> <sources>
| Advanced Action Sequence Tips and Tricks | 68
<security>principalRoles</security> </sources> </principalRoles></inputs>
Content Linking in DashboardsAction sequences used as content in Pentaho Dashboards can broadcast values to other dashboard components in aprocess called, "Content Linking." To enable the dashboard to accept content links from an action sequence, add thecontent links to the outputs section.
<outputs> <!-- is-output-parameter="false" will prevent output from being shown to the user and allow it to be used for content link --> <territory type="string" is-output-parameter="false"> <default-value>NA</default-value> </territory></outputs>
The actual firing of content link events from your action sequence content is achieved by calling the followingJavaScript:
parent.Dashboards.fireChange('PARAM_NAME',parent.encode_prepare('{PARAM_VALUE}'));
The ChartComponent supports events when values are selected by a user. You can fire a content link by adding thefollowing to the Chart Definition in the action sequence:
<component-definition> <chart-attributes> <!-- update content link parameter's value on click --> <paramName>PARAM</paramName> <url-template>javascript:parent.Dashboards.fireChange('territory',parent.encode_prepare('{PARAM}'))</url-template> <url-target>_self</url-target> <use-base-url>false</use-base-url> .... </chart-attributes></component-definition>
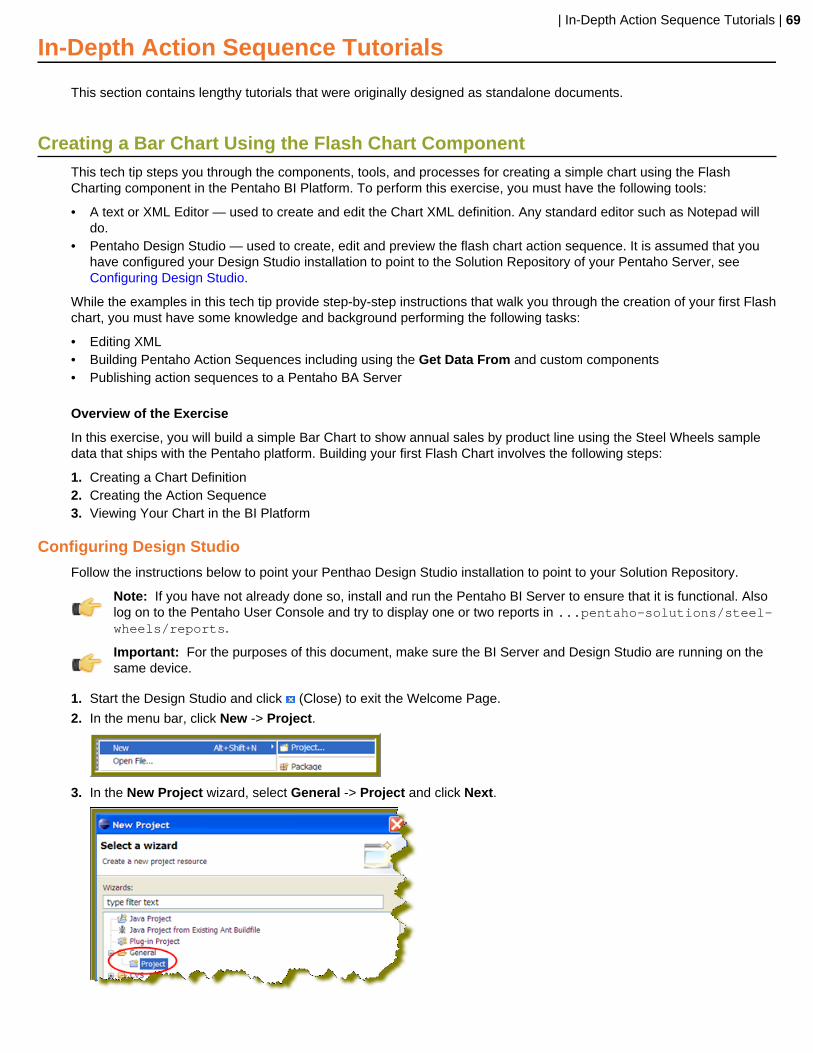
| In-Depth Action Sequence Tutorials | 69
In-Depth Action Sequence Tutorials
This section contains lengthy tutorials that were originally designed as standalone documents.
Creating a Bar Chart Using the Flash Chart ComponentThis tech tip steps you through the components, tools, and processes for creating a simple chart using the FlashCharting component in the Pentaho BI Platform. To perform this exercise, you must have the following tools:
• A text or XML Editor — used to create and edit the Chart XML definition. Any standard editor such as Notepad willdo.
• Pentaho Design Studio — used to create, edit and preview the flash chart action sequence. It is assumed that youhave configured your Design Studio installation to point to the Solution Repository of your Pentaho Server, seeConfiguring Design Studio.
While the examples in this tech tip provide step-by-step instructions that walk you through the creation of your first Flashchart, you must have some knowledge and background performing the following tasks:
• Editing XML• Building Pentaho Action Sequences including using the Get Data From and custom components• Publishing action sequences to a Pentaho BA Server
Overview of the Exercise
In this exercise, you will build a simple Bar Chart to show annual sales by product line using the Steel Wheels sampledata that ships with the Pentaho platform. Building your first Flash Chart involves the following steps:
1. Creating a Chart Definition2. Creating the Action Sequence3. Viewing Your Chart in the BI Platform
Configuring Design Studio
Follow the instructions below to point your Penthao Design Studio installation to point to your Solution Repository.
Note: If you have not already done so, install and run the Pentaho BI Server to ensure that it is functional. Alsolog on to the Pentaho User Console and try to display one or two reports in ...pentaho-solutions/steel-wheels/reports.
Important: For the purposes of this document, make sure the BI Server and Design Studio are running on thesame device.
1. Start the Design Studio and click (Close) to exit the Welcome Page.
2. In the menu bar, click New -> Project.
3. In the New Project wizard, select General -> Project and click Next.

| In-Depth Action Sequence Tutorials | 70
4. Enter Pentaho Solutions as the project name and disable Use default location.
5. Click Browse to located your pentaho-solutions directory as shown in the sample image above.
6. Click Finish.
Creating the Chart Definition
The chart definition can be defined in an XML document or passed as a string input directly into your action sequence.In this example, you will define the chart using an XML document. The chart definition defines the type of chart youwant to create along with properties formatting the chart such as colors, fonts, titles, and axis properties. The quickestapproach to building your first chart is to start with an existing Chart Definition template provided in Using the FlashChart Component, under Bar Chart.
Before you begin the exercise, copy and paste that bar chart definition template from Using the Flash ChartComponent, (under Bar Chart)into a document called sales_barchart.xml.
Customizing the Template
Follow the instructions below to customize the template
1. Change the title property to Annual Sales.
2. Change the is-glass property to true.
3. Change the domain-title property to Product Line.
4. Change the range-title to Total Sales ($).
5. Save your chart definition document into the Pentaho Solution Repository in the following location: ...\pentaho-solutions\steel-wheels\chartsYou should now have a Chart Definition document that looks like this:
<chart>
<!-- Define the chart type --> <chart-type>BarChart</chart-type>
<!-- Specify the title of the chart --> <title>Annual Sales</title> <title-font> <font-family>Arial</font-family> <size>18</size> <is-bold>true</is-bold> </title-font>
<!-- General Chart Attributes --> <orientation>vertical</orientation> <!-- valid values: vertical, horizontal --> <is-stacked>false</is-stacked> <!-- set to true for a stacked bar --> <is-3D>false</is-3D> <is-glass>true</is-glass> <!-- set to true to apply the 'glass' style to bars --> <is-sketch>false</is-sketch> <!-- set to true to apply the 'sketch' style to bars --> <!-- additional properties specific to sketch charts --> <fun-factor>10</fun-factor> <!-- defines the messiness of bars, 0-2 tame, 3-6 pretty fun, 7+ lots of fun --> <outline-color-palette> <!-- defines the colors to use for outlines of bars -->

| In-Depth Action Sequence Tutorials | 71
<color>#000000</color> <color>#000000</color> </outline-color-palette>
<!-- General Chart Formatting Properties --> <chart-background type="color">#FFFFFF</chart-background> <plot-background type="color">#FFFFFF</plot-background> <alpha>.70</alpha> <!-- sets the transparency level of bars -->
<!-- Define what to display in hover tips --> <!-- <tooltip> --> <!-- #top# --> <!-- #bottom# --> <!-- #val# --> <!-- #x_label# --> <!-- #key# --> <!-- </tooltip> -->
<!-- X-Axis properties (domain)--> <domain-title>Product Line</domain-title> <domain-title-font> <font-family>Arial</font-family> <size>14</size> <is-bold>false</is-bold> </domain-title-font> <domain-color>#000000</domain-color> <!-- color of x-axis --> <domain-grid-color>#FFFFFF</domain-grid-color> <!-- color of vertical grid lines --> <domain-stroke>1</domain-stroke> <!-- thickness of the x-axis -->
<!-- Y-Axis properties (range) --> <range-title>Total Sales ($)</range-title> <range-title-font> <font-family>Arial</font-family> <size>14</size> <is-bold>false</is-bold> </range-title-font> <range-minimum></range-minimum> <!-- defines minimum starting point for y-axis --> <range-maximum></range-maximum> <!-- defines maximum ending point for y-axis --> <range-color>#000000</range-color> <!-- color of y-axis --> <range-grid-color>#EAEAEA</range-grid-color> <!-- color of horizontal grid lines --> <range-stroke>1</range-stroke> <!-- thickness of y-axis --> <range-steps>6</range-steps> <!-- specify number of ticks, defaults to auto-calculated number -->
<!-- Specify the color palette for the chart --> <color-palette> <color>#0f3765</color> <color>#880a0f</color> <color>#B09A6B</color> <color>#772200</color> <color>#C52F0D</color> <color>#123D82</color> <color>#4A0866</color> <color>#445500</color> <color>#FFAA00</color> <color>#1E8AD3</color> <color>#AA6611</color> <color>#772200</color> <color>#8b2834</color> </color-palette>
</chart>

| In-Depth Action Sequence Tutorials | 72
Creating the Action Sequence
An action sequence is a document that defines what platform components you want to use what actions they willperform. In this example, you will be using the Relational Query and Open Flash Chart components.
Creating a New Action Sequence
Follow the instructions below to create a new action sequence:
1. In Design Studio, select BI Platform -> New Action Sequence from the menu.
2. Browse and select .../pentaho-solutions/steel-wheels/charts as your container location.
3. Enter annual_sales.xaction as your file name
4. Click Finish.
Defining General Properties
Follow the instructions below to define the General Properties in Design Studio:
1. Type Annual Sales by Product Line as the title of your action sequence
2. Specify a custom description for this action sequence. The description will be displayed in the hover tip whenmousing over the action sequence in the solution browser of the User Console. (optional)
3. In the lower portion of the General Properties page, click the 2. Define Process tab.
Defining Processes
Follow the instructions below to define the process actions in Design Studio:
1. Under Process Inputs, click (Add New Input) to add the sales_barchart.xml definition as a resource to the actionsequence
2. Type chart_definition as the name.
3. Browse to select sales_barchart.xml in the Location field.
4. Under Process Action, click (Add New Action) to add a relational query component. Click Get Data From ->Relational.

| In-Depth Action Sequence Tutorials | 73
5. Enter SampleData as the JNDI data source name.
6. Enter the following SQL in the Query section of the component definition:
SELECT PRODUCTS.PRODUCTLINE AS LINE, SUM(CASE ORDERFACT.YEAR_ID WHEN '2003' THEN (ORDERFACT.TOTALPRICE) ELSE 0 END) AS "2003", SUM(CASE ORDERFACT.YEAR_ID WHEN '2004' THEN (ORDERFACT.TOTALPRICE) ELSE 0 END) AS "2004", SUM(CASE ORDERFACT.YEAR_ID WHEN '2005' THEN (ORDERFACT.TOTALPRICE) ELSE 0 END) AS "2005"FROM PRODUCTS INNER JOIN ORDERFACT ON PRODUCTS.PRODUCTCODE = ORDERFACT.PRODUCTCODE INNER JOIN CUSTOMER_W_TER ON ORDERFACT.CUSTOMERNUMBER = CUSTOMER_W_TER.CUSTOMERNUMBERGROUP BY LINEORDER BY 2 DESC
7. Click the XML Source tab to add the Open Flash Chart component.
8. After the close tag (</action-definition>) for the query component, insert the following component definition for theOpen Flash Chart component.
<action-definition> <component-name>OpenFlashChartComponent</component-name> <action-type>Generate Chart</action-type> <action-inputs> <chart-data type="string" mapping="query_result"/> </action-inputs> <action-resources> <chart-attributes type="resource" mapping="chart_definition"/> </action-resources> <action-outputs> <image-tag type="content"/> </action-outputs>

| In-Depth Action Sequence Tutorials | 74
<component-definition/> </action-definition>
9. Click the Define Process tab.
10.Under Process Outputs, add the image-tag output from the Generate Chart process as an output of the actionsequence. Click (Add Output)-> image-tag.
11.Double-click image-tag (the output you just added under Process Output) section, and select response underOutput Destination on the right.
12.Change the name of the response output to content.
13.Save your action sequence.
You action sequence file should look like the sample below:
<?xml version="1.0" encoding="UTF-8"?><action-sequence> <title>Annual Sales by Product Line</title> <version>1</version> <logging-level>ERROR</logging-level> <documentation> <author>Jake Cornelius</author> <description>Empty blank action sequence document</description> <help/> <result-type/> <icon/> </documentation>
<inputs/>
<outputs> <image-tag type="content"> <destinations> <response>content</response> </destinations> </image-tag> </outputs>
<resources> <chart_definition> <solution-file> <location>sales_barchart.xml</location> <mime-type/> </solution-file> </chart_definition> </resources> <actions> <action-definition> <component-name>SQLLookupRule</component-name> <action-type>Relational</action-type> <action-outputs> <query-result type="result-set" mapping="query_result"/> </action-outputs> <component-definition> <jndi><![CDATA[SampleData]]></jndi>

| In-Depth Action Sequence Tutorials | 75
<query><![CDATA[SELECT PRODUCTS.PRODUCTLINE AS LINE, SUM(CASE ORDERFACT.YEAR_ID WHEN '2003' THEN (ORDERFACT.TOTALPRICE) ELSE 0 END) AS "2003", SUM(CASE ORDERFACT.YEAR_ID WHEN '2004' THEN (ORDERFACT.TOTALPRICE) ELSE 0 END) AS "2004", SUM(CASE ORDERFACT.YEAR_ID WHEN '2005' THEN (ORDERFACT.TOTALPRICE) ELSE 0 END) AS "2005"FROM PRODUCTS INNER JOIN ORDERFACT ON PRODUCTS.PRODUCTCODE = ORDERFACT.PRODUCTCODE INNER JOIN CUSTOMER_W_TER ON ORDERFACT.CUSTOMERNUMBER = CUSTOMER_W_TER.CUSTOMERNUMBERGROUP BY LINEORDER BY 2 DESC]]></query> <live><![CDATA[true]]></live> </component-definition> </action-definition> <action-definition> <component-name>OpenFlashChartComponent</component-name> <action-type>Generate Chart</action-type> <action-inputs> <chart-data type="string" mapping="query_result"/> </action-inputs> <action-resources> <chart-attributes type="resource" mapping="chart_definition"/> </action-resources> <action-outputs> <image-tag type="content"/> </action-outputs> <component-definition/> </action-definition> </actions> </action-sequence>
Viewing your Chart in the BI Platform
Follow the instructions below to view your chart in the BI Platform.
1. Log on to the Pentaho User Console using the credentials joe/password.
2. In the console menu bar, click Tools -> Refresh Repository Cache.
3. Browse to Steel Wheels -> Charts
4. Double-click on Annual Sales by Product Line to display the chart.

| In-Depth Action Sequence Tutorials | 76
Finding More Information
Congratulations, you have built your first Pentaho flash chart. For detailed information about the Open Flash ChartComponent including a list of all supported chart types and sample chart definitions, refer to the Open Flash ChartComponent reference.
| Troubleshooting | 77
Troubleshooting
This section contains known problems and solutions relating to the procedures covered in this guide.
Action Sequences That Call PDI Content Won't RunIf you've established an enterprise repository in PDI to store your jobs and transformations, and you attempt to usethat stored PDI content in an action sequence on the BA Server, the action sequence will not execute. This is becausethe BA Server needs specific connection information for the Data Integration (DI) Server in order to retrieve the job ortransformation.
Adding PDI Enterprise Repository Content Support to the BA Server
If you are using a Pentaho Data Integration (PDI) enterprise repository (through a Data Integration Server) to store PDIjobs and transformations, and you plan on using those jobs and transformations in action sequences that will be run onthe BA Server, you must install some BA Server plugins from the PDI client tool package. This is not a typical scenario,but there is no harm in performing it if you aren't sure of the details.
1. Download a PDI Enterprise Edition 4.4 client tool archive package from the Pentaho Customer Support Portal.
The package name (available in both tar.gz and zip formats) is: pdi-ee-client-4.4.0-GA
2. Unpack the archive to a temporary location.
3. Edit the /pentaho/server/biserver-ee/pentaho-solutions/system/kettle/settings.xml file.
4. Change the value of the <repository.type> node from files to rdbms.
5. Enter your enterprise repository connection information in the proper nodes.
6. Enter the location of your local repositories.xml file in the <repositories.xml.file> node.
Note: This file is created on your PDI client workstation when you establish a connection to anenterprise repository. Once you have made all of your repository connections on a workstation, copythe repositories.xml file to the ~/.kettle/ directory on the BA Server and DI Server machines. If theclient tool and servers are all on the same machine, you do not have to copy the file. If you have not yetestablished any repositories, you will have to revisit this procedure later when your PDI environment is fullyconfigured.
7. Copy the contents of /data-integration/plugins/ to the /pentaho/server/biserver-ee/pentaho-solutions/system/kettle/plugins/ directory.
cp -r /tmp/data-integration/plugins/* /home/pentaho/pentaho/server/biserver-ee/pentaho-solutions/system/kettle/plugins/
8. Remove the unpacked archive.
rm -rf /tmp/data-integration/
Your BA Server is now configured to run content stored in the DI Server.
Null Pointer Exception When Sharing Result SetsA null pointer exception error may occur in the Pentaho User Console when you share a relational result set(SQLLookupRule used multiple times) among inputs in a Secure Filter component. The error may be associated withResult Set Type in Pentaho Design Studio. If the Live Result Set, is enabled, (this is default behavior), the result setis available one time only; the data for the query is fetched once and cannot be reused. To solve the issue, enable In-Memory Result Set; this stores the data in memory so that it can be reused and prevents the error from occurring.


