Creating Activity-Based Costing System Tool Case: Service Company X Sayed Mehdi Kazemi Bachelor’s Thesis International Business 2015 brought to you by CORE View metadata, citation and similar papers at core.ac.uk provided by Theseus
Transcript
Creating Activity-Based Costing System Tool
Case: Service Company X
Sayed Mehdi Kazemi
Bachelor’s Thesis
International Business
2015
brought to you by COREView metadata, citation and similar papers at core.ac.uk
Report/thesis title Creating Activity Based Costing System Tool
Number of pages and appendix pages 44 +17
This product-based thesis is meant to create an Activity- Based costing system tool for com-pany X, which provides after-school care for children and is a sub-contractor of municipality of Y. The thesis aims to create costing information system mechanism for the case company in order to be used as a means to understand cost, costing issues and profitability of the cost objects in this case. Hence this thesis does not address the way of using information and analyzing it. As that is another issue and relates to the Activity based management. This study was started by meeting the manager of the company about the topic in February 2015. Then I started to study ABC’s system issues were then studied in view of theory. The process of creating the tool started by studying the income statement and interviewing the manager of the company to collect as much information as possible. During the process the nature and type of required information was revised and changed for many times. The final result is a tool which can be helpful to understand cost and profitability of the firm as a whole.
The idea of doing this project occurred to me by the time I was doing the managerial ac-
counting course. Science then I was looking for an opportunity to do such a project until I
talked with the manager of the company X and told him my Idea. He was quite enthusias-
tic about the project and accepted to offer me required information and support. This the-
sis will create value to the case company by making a cost measurement and manage-
ment system which is highly important in pricing and decision-making process.
The owner of the company saw an opportunity to make profit by providing after-school
care services for children and selling it to the municipality. There are two potential direc-
tions for the company to move towards to raise profit whether by increasing profit or de-
creasing cost. So, due to the pricing constraints profit-making would be impossible and
focus must be on the cost management and costing issues.
By using a cost management system, the company will be able to manage its resources
efficiently. It is not only about cost determination, but also involves decision-making about
the entire process such as cost allocation, and resourcing. Selecting the proper costing
tool for the company, product and service is highly important in cost management. There
are two classified methods of cost management: (Onat, Anitsal, I. & Anitsal, M. 2014,
150.)
1- Traditional costing methods: The focus of these methods is on volume and labor. It is mostly about direct allocation of overheads based on volume or direct labor which causes incorrect allocation and unsettled cost. Also, high volume activities are considered more important than low volume activities.
2- Contemporary costing methods: The focus of these methods is more on value and val-ue adding activities. Moreover service options and delivery times are considered important in service industries as well.
Hence, activity based costing system seems to be a proper way for creating a new costing
information system as it is established on cost classifications and allocating them to relat-
ed activities and cost objects by suitable identified cost drivers. The scope of this product
based thesis is to design and implement an ABC system for internal managerial purposes.
2
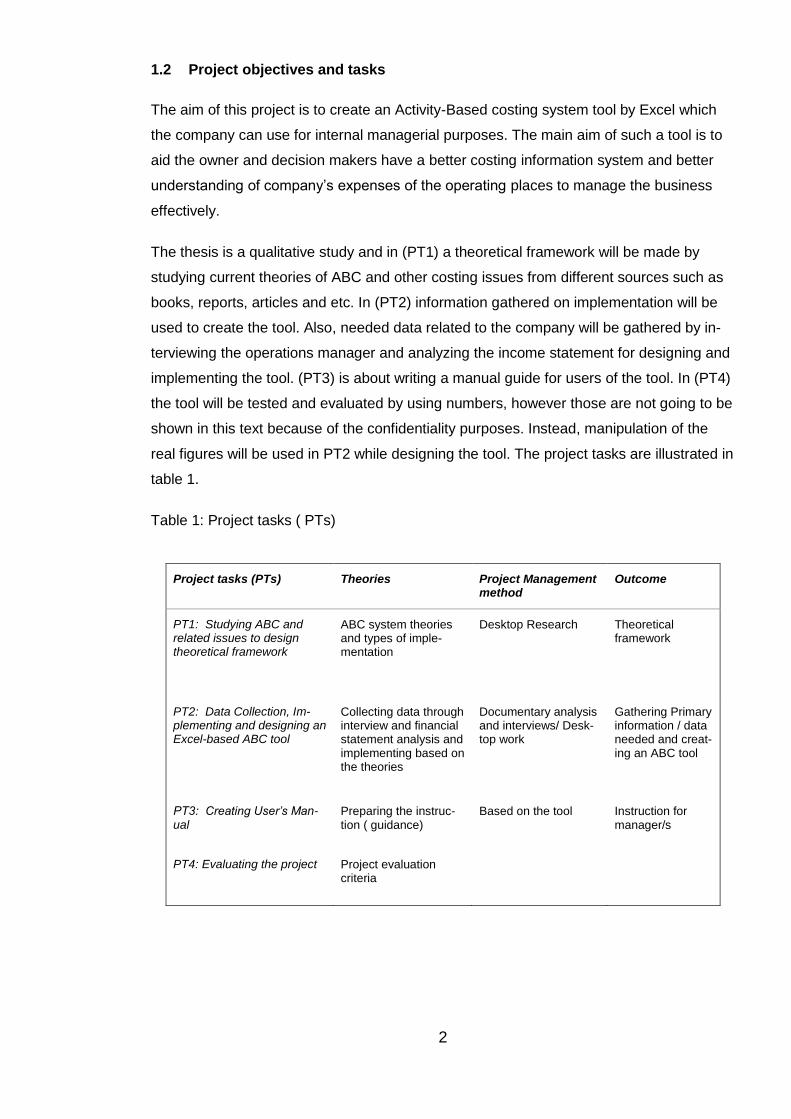
1.2 Project objectives and tasks
The aim of this project is to create an Activity-Based costing system tool by Excel which
the company can use for internal managerial purposes. The main aim of such a tool is to
aid the owner and decision makers have a better costing information system and better
understanding of company’s expenses of the operating places to manage the business
effectively.
The thesis is a qualitative study and in (PT1) a theoretical framework will be made by
studying current theories of ABC and other costing issues from different sources such as
books, reports, articles and etc. In (PT2) information gathered on implementation will be
used to create the tool. Also, needed data related to the company will be gathered by in-
terviewing the operations manager and analyzing the income statement for designing and
implementing the tool. (PT3) is about writing a manual guide for users of the tool. In (PT4)
the tool will be tested and evaluated by using numbers, however those are not going to be
shown in this text because of the confidentiality purposes. Instead, manipulation of the
real figures will be used in PT2 while designing the tool. The project tasks are illustrated in
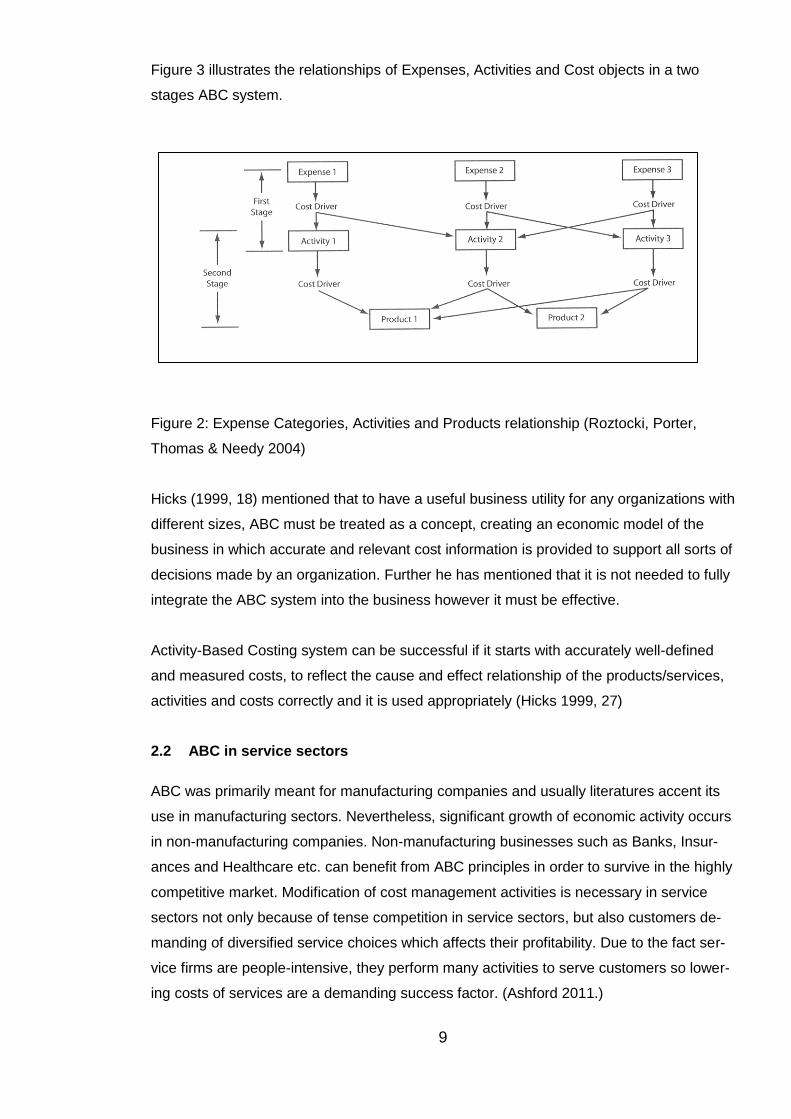
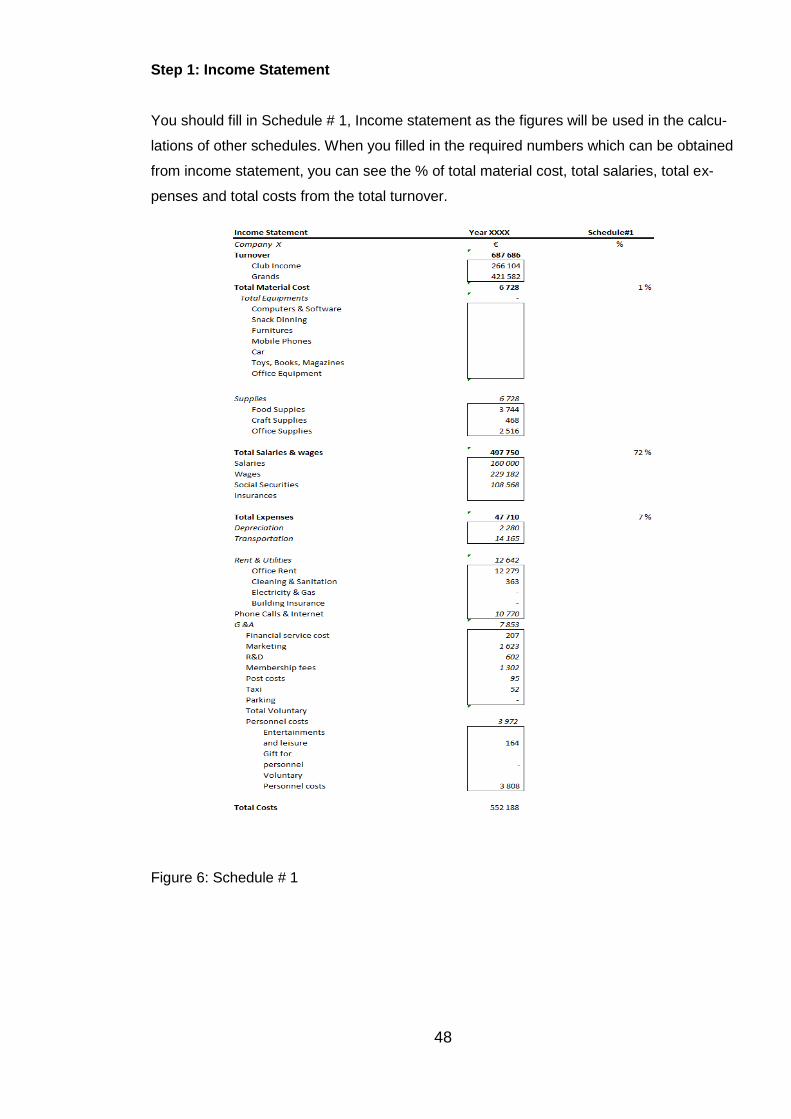
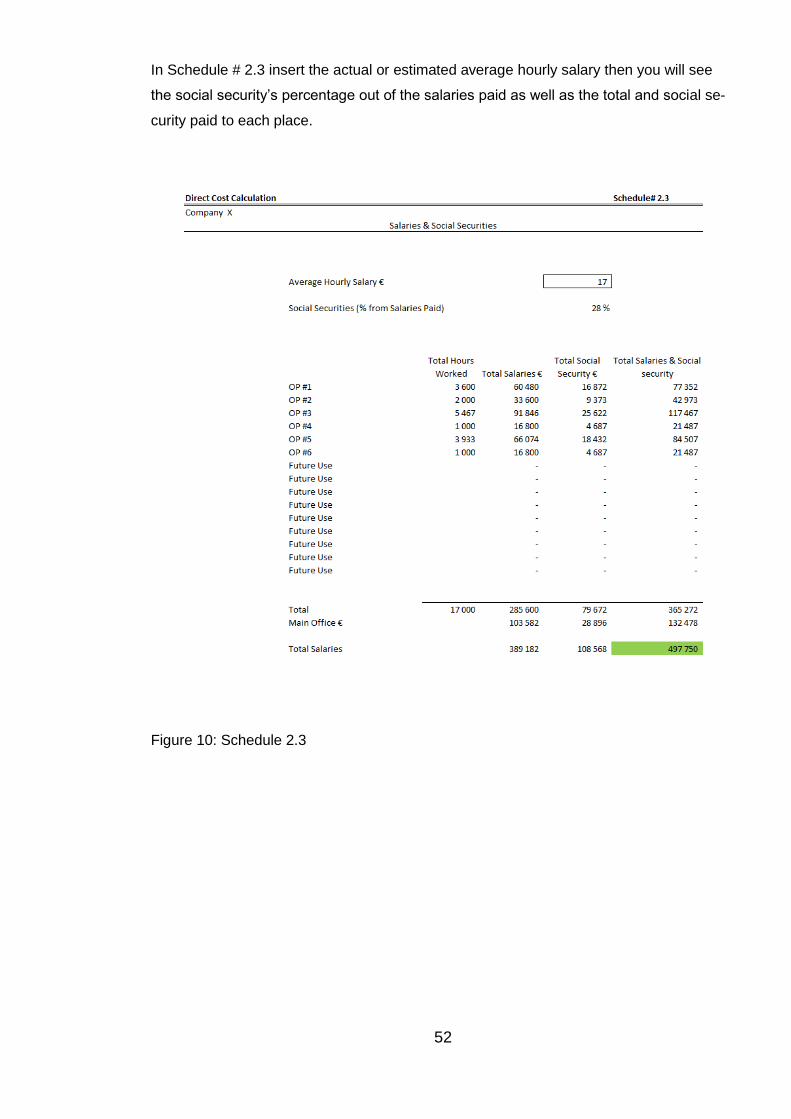
Figure 7 illustrates mixed costs as a combination of variable and fixed costs. In these
types, fixed costs remain the same, but variable costs change in the relevant range of
activity or volume level. Therefore, by increasing the number of activities or volume, the
total mixed costs increase as variable costs increase and they decrease because the fixed
costs’ components remain the same. (Braun & Tietz 2013, 325.)
Figure 4: Mixed Costs (Braun & Tietz 2013, 325)
13
2.5 Elements of Cost
Material, labor and expenses are three elements forming a cost which can be direct or
indirect (Arora, M 2009, 214).
Material Cost is the cost of supplying goods and materials of products or services. Those
material costs that can be traced directly to a cost object such as Leather in shoes, Steel
in Machines etc. are called Direct Materials. There are materials directly used, which are
not considered in this category because of difficulty in measuring e.g. nails, they are con-
sidered to be indirect materials. There are however materials which are difficult to be
traced directly to cost units or objects as they may not be very important or not used in the
finished products or services. (Arora, M 2009, 214.)
Labor Cost is the cost of employees working in the organizations such as wages, salaries,
commissions, bonuses etc. Those labor costs can be traced directly to a cost object for
converting raw materials to products or services which are called Direct Labors such costs
can be Machine operator, Shoe-maker, direct consulting and so on. There are however
Indirect Labors which are more general and cannot be traced to cost objects examples
can be supervisor, cleaner clerk etc. (Arora, M 2009, 214.)
There are other costs such as national costs of assets and service costs which are not
included into labor cost and material cost. These costs are identified as Expenses and can
be defined as Direct Expenses which incurs particularly for a cost object and are traceable
and Indirect Expenses that are difficult to be traced directly to a cost object. Usually these
types of expenses are common to all cost objects (Arora, M 2009, 214.)
2.5.1 Overheads
Overheads are the summation of all indirect costs and they can be classified based on
Functions, Elements and Behavior (Arora, M 2009, 215).
There are four types of functions used to classify overheads. Production overhead refers
to indirect costs of operations in producing products which are not clear like direct costs of
production e.g. depreciation, consumed energies, indirect wages. Administration overhead
refers to indirect costs such as controlling, administrating costs which are not traced di-
rectly to the cost objects e.g. General management’s salary, legal expenses, calls etc.
Selling overhead refers to the indirect costs of promoting and demand creating such over-
heads can be travelling expenses, bad debts and etc. Distribution Overhead refers to such
indirect costs related to distributing finished goods or services to final customers. (Arora,
M 2009, 215.)
14
Overheads can be classified based on the Elements and origins of expenses as well. The
classification is made based on the Indirect Materials, Indirect Wages and Indirect Ex-
penses. Moreover, overheads can be classified based on the Behavior of the costs which
are Fixed, Variable and Mixed. (Arora, M 2009, 215.) These terms have been already ex-
plained.
2.6 Sources of data collection
Information can be obtained by interviewing people who are directly involved in performing
activities, using general ledger (Income statement) to get elements of cost and IT system
which has all the required measurements and information about cost object. These
sources will be used to create an ABC system. Collected data is used to identify activities,
elements of cost, cause and effect relationship determination and identifying accurate cost
drivers for allocating expense resources to activities and activity costs to cost objects.
(Institute of Management Accountants 2006.)
2.7 Key components of Activity-Based Costing
Key components of Activity-Based Costing are Expenses resources, Cost drivers, Activi-
ties, Activity drivers and Cost objects (Bahnub 2010).
Expense resources are means and resources consumed by activities to achieve the goal.
They can be categorized and grouped in a logical way to form cost pools. (Bahnub 2010,
2.) Example of Expense resources are Administration, Depreciation, Rent & utilities, Office
expenses, Transport, Advertising, etc. (Roztocki & al. 2004).
Cost drivers are assessment indicators of the usage level of expense resources by activi-
ties. Cost drivers must be different for each costing pool otherwise it is possible to com-
bine costing pools (Bahnub 2010, 4.)
Activities are performed by people in an enterprise to add value to products and services
for serving customers and meeting their requirements (Investopedia 2015c). Therefore,
activities consume resources which are manageable. Each activity consists of certain
tasks representing the logical process model of the business. Moreover, to achieve a goal
related and interrelated activities are grouped together to form a process. (Bahnub 2010,
4.)
15
Activity drivers are assessment indicators of activities’ usage by cost objects. However if
activity drivers are the same for some activities it is possible to combine activities (Bahnub
2010, 4.)
Cost objects can be anything such as customers, departments, processes, etc. that use
activities performed in an organization (Bahnub 2010, 4).
2.8 Implementation Guidelines and Steps
The refined costing system (Activity-Based Costing) can be implemented by following the
three guidelines and seven steps (Horngren & al. 2012).
Required guidelines are (Horngren & al. 2012, 168):
1- Tracing direct costs: By identifying all relevant direct costs the amount of indirect costs classification will be minimized.
2- Creating Indirect cost pools: the aim is to gather indirect costs and create homogene-ous cost pools as many as possible. Homogeneous cost pools have a cause and ef-fect relationship with one of the cost drivers which will be used as the cost allocation base.
3- Identifying Cost allocation bases: cost drivers are used as cost allocation bases for every single homogeneous cost pools.
Required implementing steps are (Horngren & al.2012, 172):
1- Identifying cost objects: in this step cost objects must be identified based on the com-pany’s goal of calculating costs and allocating overheads.
2- Identifying direct costs of cost objects: in this step direct cost related to cost objects are identified so there is no need for them to be allocated by using allocation bases. Direct cost such as e.g. material cost, labor cost, maintenance costs, etc. can be iden-tified by analyzing financial statements (Roztocki 2001).
3- Identifying activities and allocation bases for allocating indirect costs to cost objects: in
this step activities are identified by analyzing the business process (Roztocki & al. 2004). Cost allocation base provides reliable data and measurement information about grouping homogeneous activities and costs which have the same cost drivers. If ob-taining data for the measurement is difficult, other complex measurements might be used. (Horngren & al. 2012.)
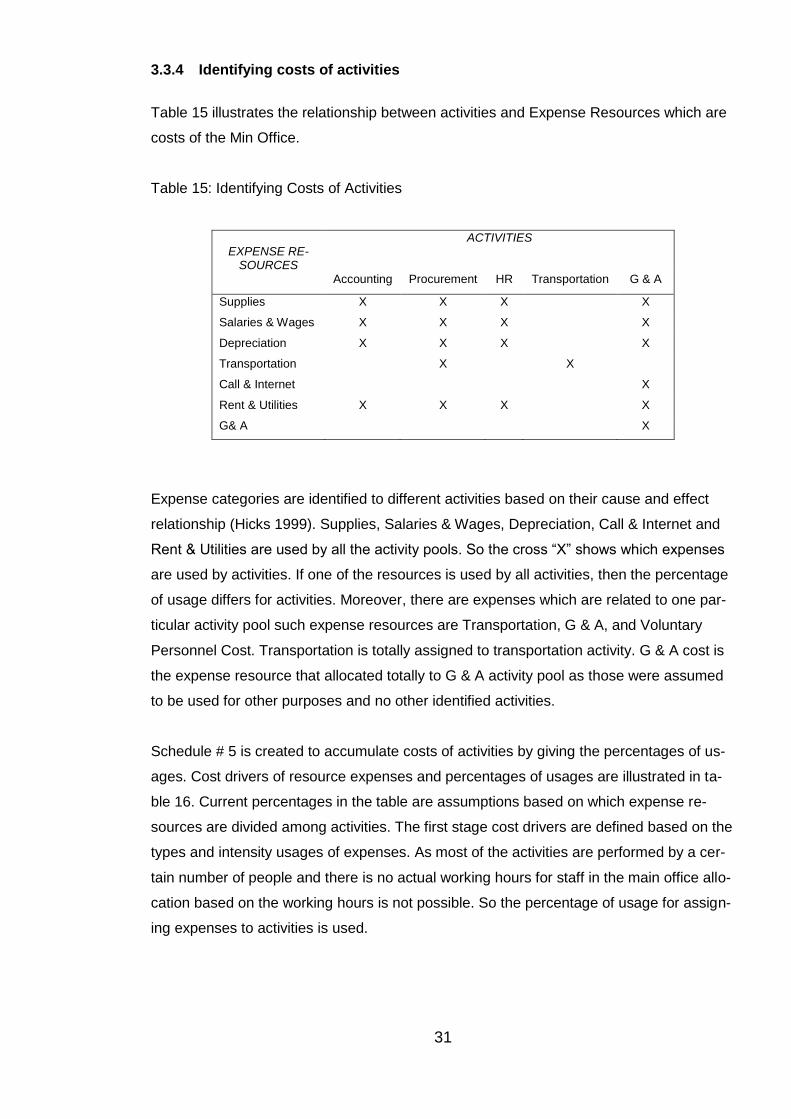
4- Identifying indirect costs of activities: in this step overheads (Indirect costs) are as-
signed to activities based on the cause and effect relationships between cost alloca-tion bases of costs and activities, however the relationship varies from one cost pool to another. Table 2 can be used to identify indirect costs of activities. The sign X in this
16
table illustrates the cause and effect relationship between expense resources and ac-tivities. (Roztocki & al. 2004).
E 1 x x x x E 2 x x x x E 3 x x x x E 4 x E 5 x x x x . x x x x . x . x
5- Computing the rate per unit of cost allocation bases: here the indirect costs’ rate per
unit are calculated by dividing the related indirect cost to the quantity of cost allocation base.
6- Computing indirect costs for each cost objects: in this step the calculated indirect costs’ rate are allocated to cost objects based on their usage of activities through ac-tivity drivers.
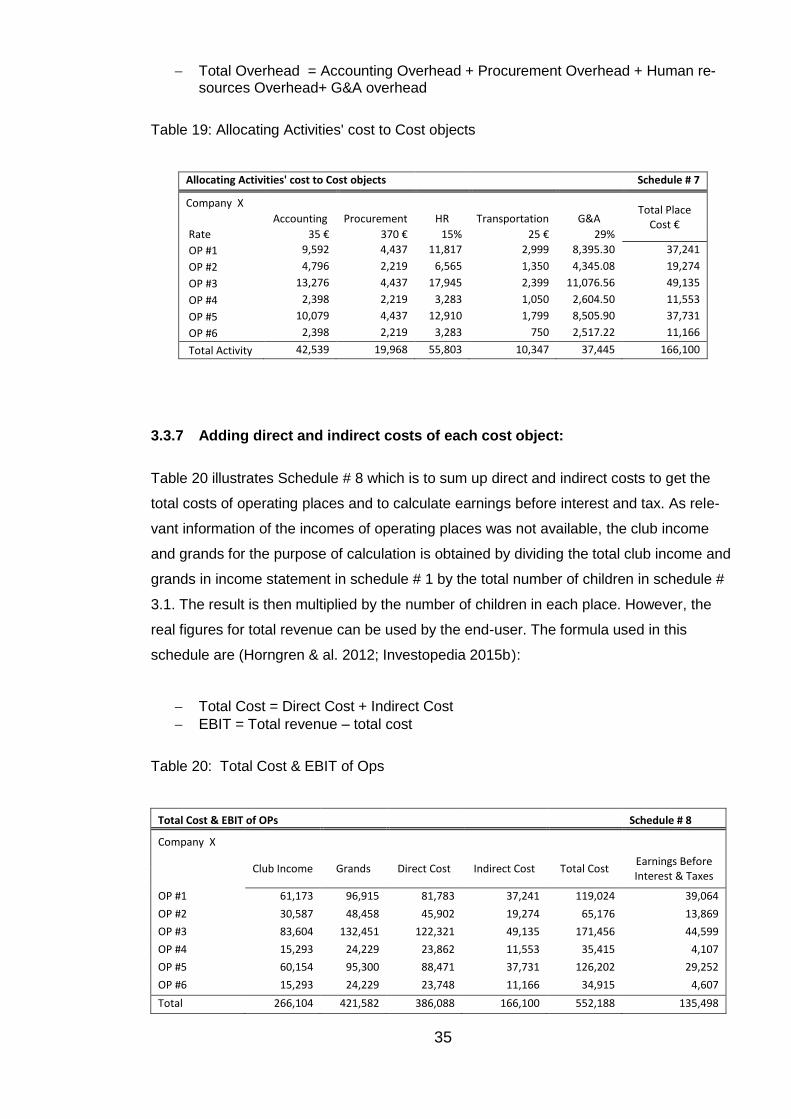
7- Adding direct and indirect costs of each cost object: in this step the calculated direct and indirect costs are summed up to get the total cost of cost objects.
17
3 Implementing ABC to the company X
This chapter explains the implementation process and testing the tool at the same time.
Tables are generated with manipulated numbers from income statement and interviewing
the Manager of the company.
The process begun with interviewing the general manager of the company, to understand
the company’s structure and requirements from the tool and the refined costing system.
There were four meetings which each of them last for 2 hours. After the first meeting the
process of gathering information and creating theoretical framework started. The other
three meeting sessions were about checking the outcome of analysis, informing the man-
ager about the progress of the processes and requiring more information. In order to un-
derstand the topic and creating theoretical framework a desktop study was conducted.
Then all information related to the topic was gathered and analyzed according to the ABC
implementation steps and requirements of the company. Afterward by analyzing gathered
data the required theories for creating an Activity-based costing system tool were picked
up and the goal of the project which is “understanding the cost structure and its relevancy
to operating places” were defined clearly.
3.1 Discussion
It has already been mentioned that the company is in the business of providing evening
after school services for children and is a sub-contractor of the municipality Y. The opera-
tions are performed in six different places and there is a main office from where all the
other places are managed. Activities of the company can be divided into instruction activi-
ties taken place in operating places and supporting managerial activities performed in the
main office. The activities performed in operating places are to instruct children and con-
sidered to be direct activities related to providing the service. Therefore, activities taking
place in the main office are considered to be Indirect activities. All activities are consuming
certain types of costs whether direct or indirect. This project aims to allocate costs occur-
ring in the main office which are considered to be overheads (Indirect costs) to each oper-
ating places to understand the real cost of running them and consequently analyzing prof-
itability of places and their contribution to the total revenue.
When the municipality Y decides to offer a school with such a service, it will request pro-
posals from different service providers such as the case company. Therefore each firm
provides the municipality with their proposals including types of services (Activities to en-
tertain and taking care of children) and quality of their services.
18
Over the past few years the company has expanded from one operating place with two
people to the current 6 operating places (Clubs) with 25 staffs and a main office. Reve-
nues from each operating place varies regarding the number of children, types of services
required such as services for normal students or special students as well as the amount of
the part-time or full-time customers.
Once providing services to an operating place is given to the company, managerial team
(consists of the owner and general manager) starts planning process to run the place.
Planning is necessary for budgeting, recruiting, identifying activities, required facilities and
etc.
By starting the educational season in the middle of August the managerial team in the
main office gets engaged with more activities in order to provide sufficient services to
each one of the places at hand. The performance of clubs is monitored on the daily basis
through responsive instructors (Director). Usually each club has one director plus other
instructors which the number is dependent on the amount of children in the club. The
company not only records working hours every day but also checks inventory to see if
anything is needed to be added in the purchase list. Moreover, accounting activity is in-
volved with some other tasks such as invoicing customers and municipality, twice a year,
payroll, bill paying, as well as sending information to tax office and the Insurance compa-
ny. Therefore, the total working hours spend on accounting activity is 684 hours for two
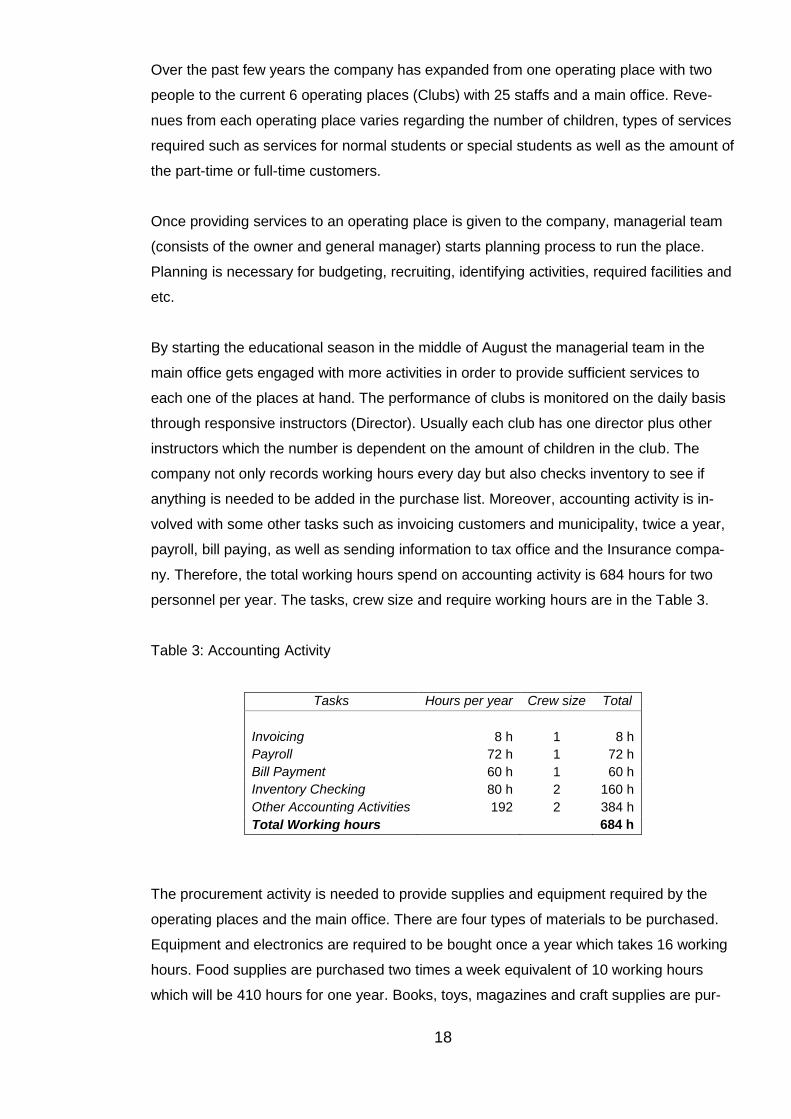
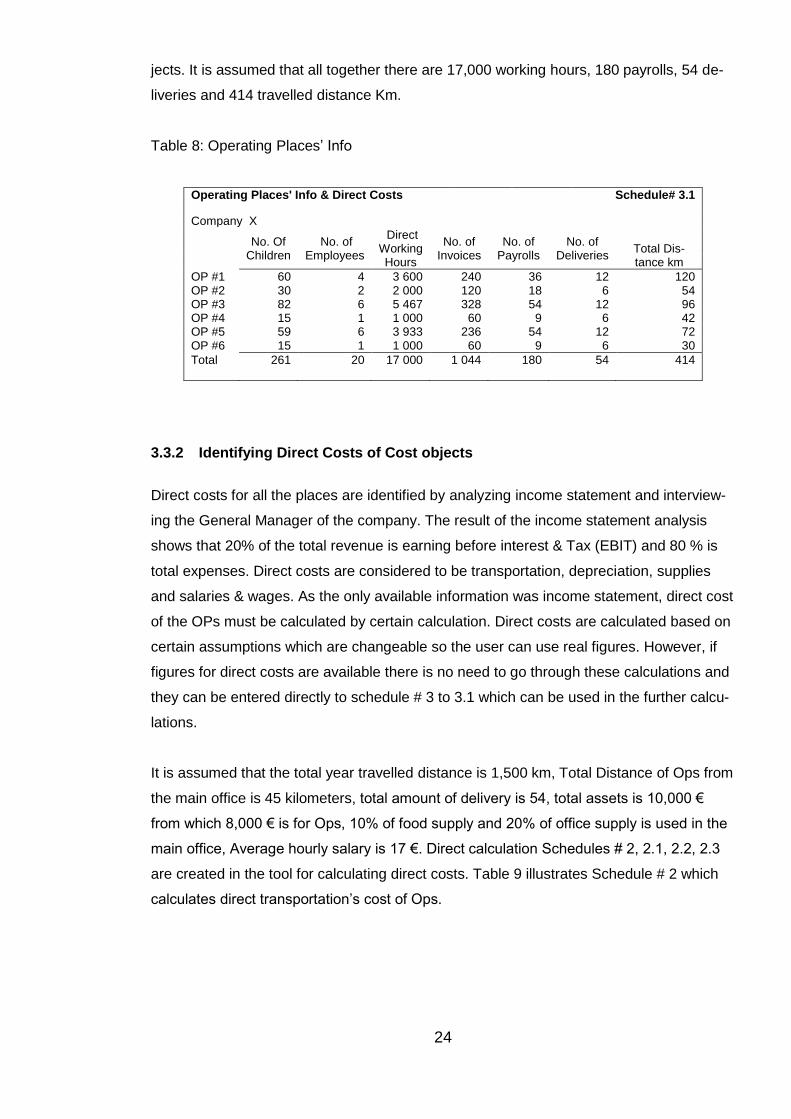
personnel per year. The tasks, crew size and require working hours are in the Table 3.
Table 3: Accounting Activity
Tasks Hours per year Crew size Total
Invoicing
8 h
1
8 h
Payroll 72 h 1 72 h
Bill Payment 60 h 1 60 h
Inventory Checking 80 h 2 160 h
Other Accounting Activities 192 2 384 h
Total Working hours 684 h
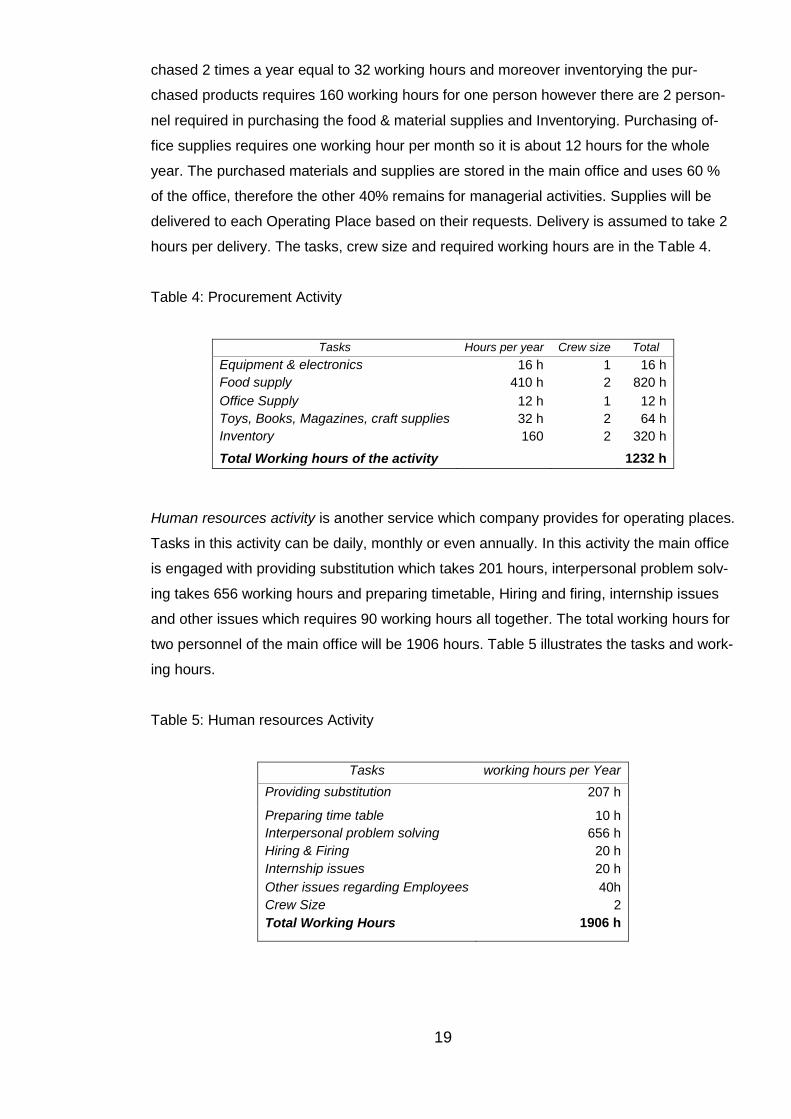
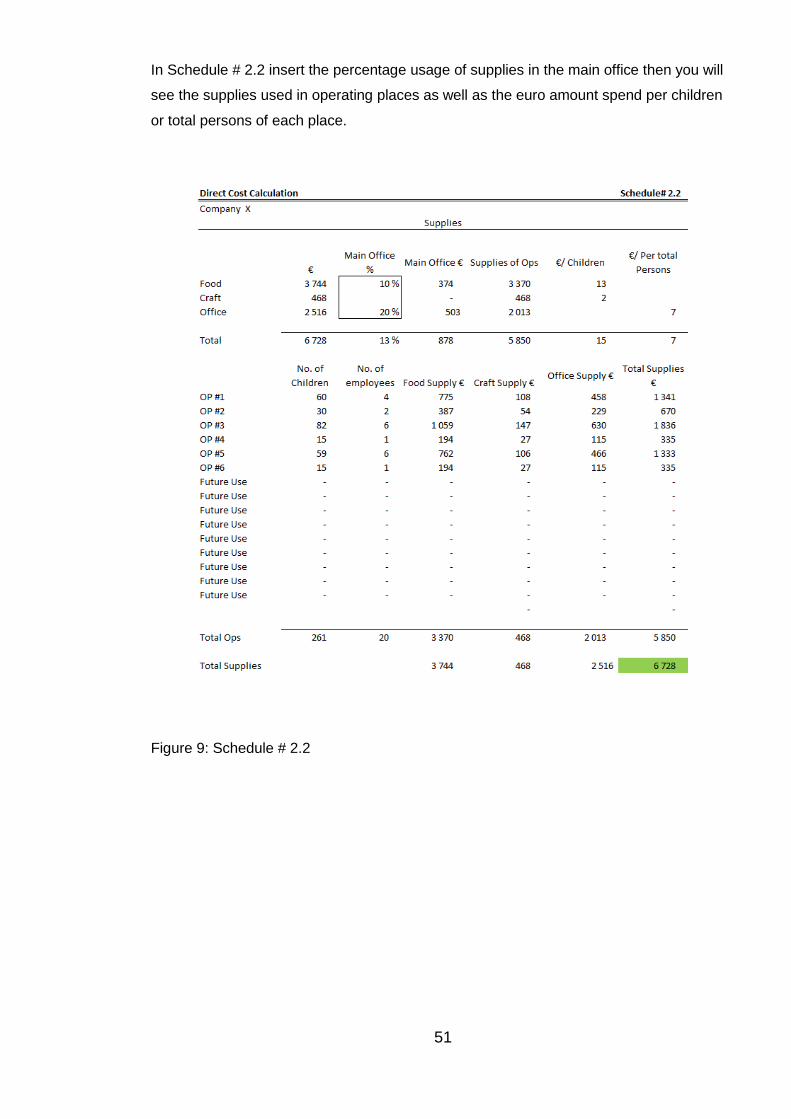
The procurement activity is needed to provide supplies and equipment required by the
operating places and the main office. There are four types of materials to be purchased.
Equipment and electronics are required to be bought once a year which takes 16 working
hours. Food supplies are purchased two times a week equivalent of 10 working hours
which will be 410 hours for one year. Books, toys, magazines and craft supplies are pur-
19
chased 2 times a year equal to 32 working hours and moreover inventorying the pur-
chased products requires 160 working hours for one person however there are 2 person-
nel required in purchasing the food & material supplies and Inventorying. Purchasing of-
fice supplies requires one working hour per month so it is about 12 hours for the whole
year. The purchased materials and supplies are stored in the main office and uses 60 %
of the office, therefore the other 40% remains for managerial activities. Supplies will be
delivered to each Operating Place based on their requests. Delivery is assumed to take 2
hours per delivery. The tasks, crew size and required working hours are in the Table 4.
Table 4: Procurement Activity
Tasks Hours per year Crew size Total
Equipment & electronics 16 h 1 16 h
Food supply 410 h 2 820 h
Office Supply 12 h 1 12 h
Toys, Books, Magazines, craft supplies 32 h 2 64 h
Inventory 160 2 320 h
Total Working hours of the activity 1232 h
Human resources activity is another service which company provides for operating places.
Tasks in this activity can be daily, monthly or even annually. In this activity the main office
is engaged with providing substitution which takes 201 hours, interpersonal problem solv-
ing takes 656 working hours and preparing timetable, Hiring and firing, internship issues
and other issues which requires 90 working hours all together. The total working hours for
two personnel of the main office will be 1906 hours. Table 5 illustrates the tasks and work-
ing hours.
Table 5: Human resources Activity
Tasks working hours per Year
Providing substitution 207 h
Preparing time table 10 h
Interpersonal problem solving 656 h
Hiring & Firing 20 h
Internship issues 20 h
Other issues regarding Employees 40h
Crew Size 2
Total Working Hours 1906 h
20
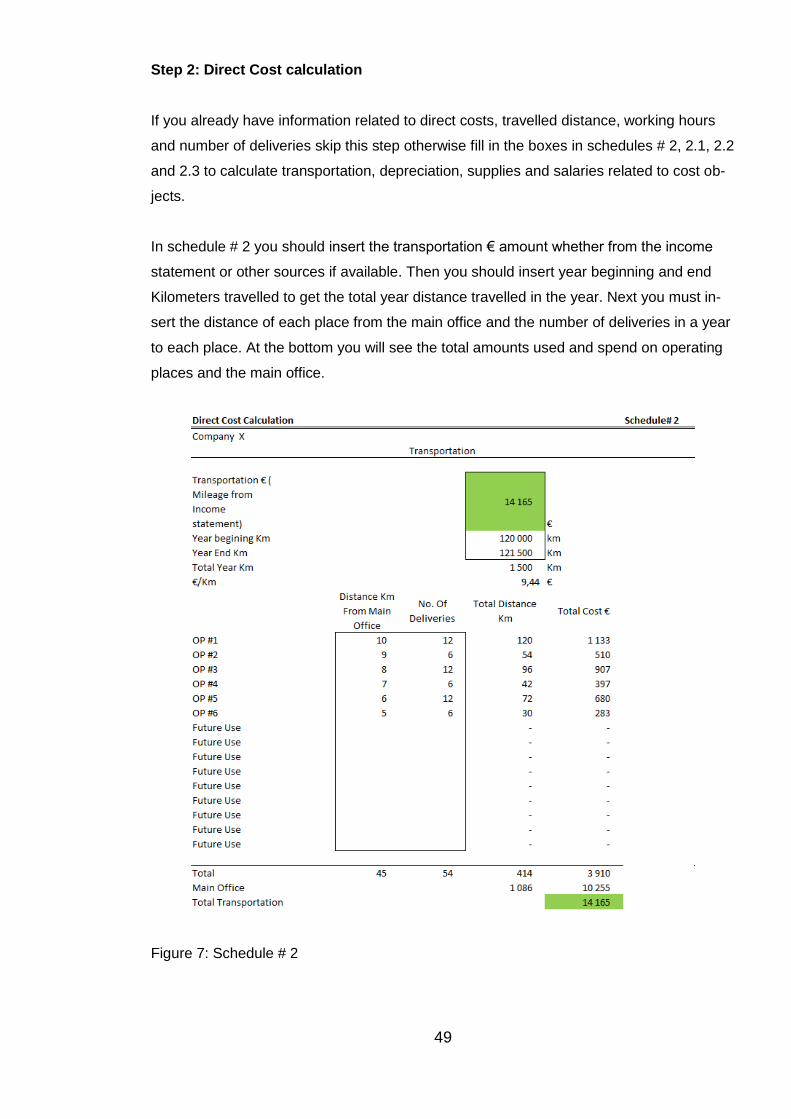
Transportation activity is required to deliver supplies to operating places and purchasing
of the supplies. Another purpose is to deliver employees from one place to another be-
cause of meetings for instance with families and municipality or internal meeting of the
company.
The educational season will end on 31 May. Then it is time to close the books, and to
open a new book for the next educational year. During the summer the operating places
are closed but the main office is open and the owner and the general manager are work-
ing on planning, scheduling and other business related issues. All of other possible activi-
ties like dealing with the municipality, banks, insurances and others are considered to be
included in General & Administration activity pool.
3.2 Cost and cost behavior of the company
Regarding the operations and providing services, different types of costs incur in the com-
pany. Costs of the company are categorized based on the elements of costs which are
Material, Labor and Expenses. Elements of Costs can be Direct or Indirect.
Direct costs are those that can be traced back directly to the operating places and Indirect
Costs are those costs incurring in the main office. It is important to mention some costs
such as interests and taxes as well as fixed material costs such as furniture, computers,
and mobile phones, snack dining, car, toys, books and magazines are not included into
the calculation of overheads to operating places. Those costs are business costs and are
not periodically used but they can get depreciated which is used into the calculations
(Hicks 1999, 34).
21
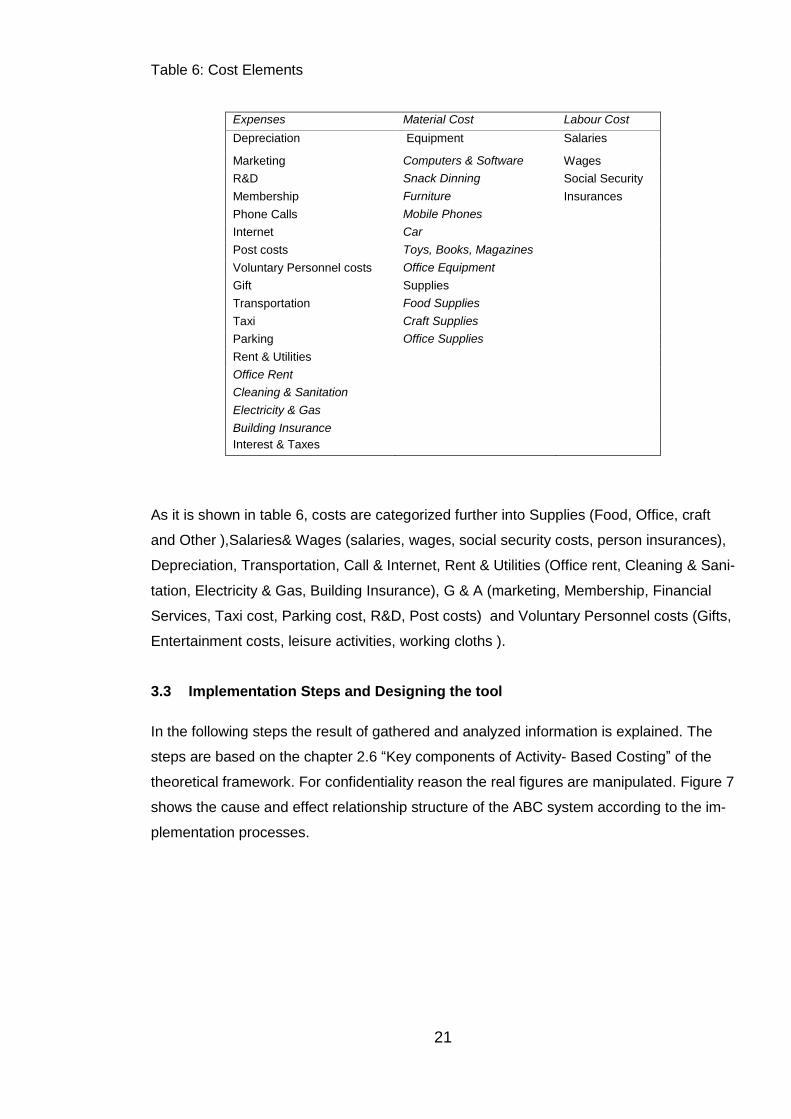
Table 6: Cost Elements
Expenses Material Cost Labour Cost
Depreciation Equipment Salaries
Marketing Computers & Software Wages
R&D Snack Dinning Social Security
Membership Furniture Insurances
Phone Calls Mobile Phones
Internet Car
Post costs Toys, Books, Magazines
Voluntary Personnel costs Office Equipment
Gift Supplies
Transportation Food Supplies
Taxi Craft Supplies
Parking Office Supplies
Rent & Utilities
Office Rent
Cleaning & Sanitation
Electricity & Gas
Building Insurance
Interest & Taxes
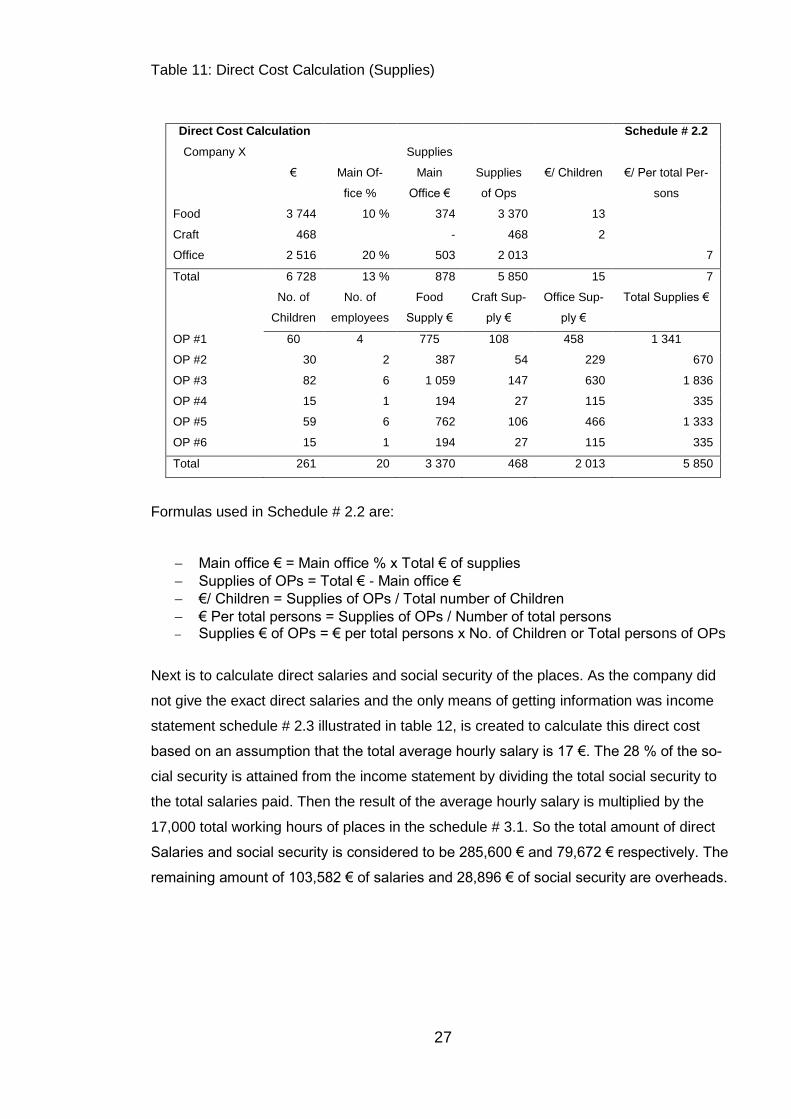
As it is shown in table 6, costs are categorized further into Supplies (Food, Office, craft
and Other ),Salaries& Wages (salaries, wages, social security costs, person insurances),
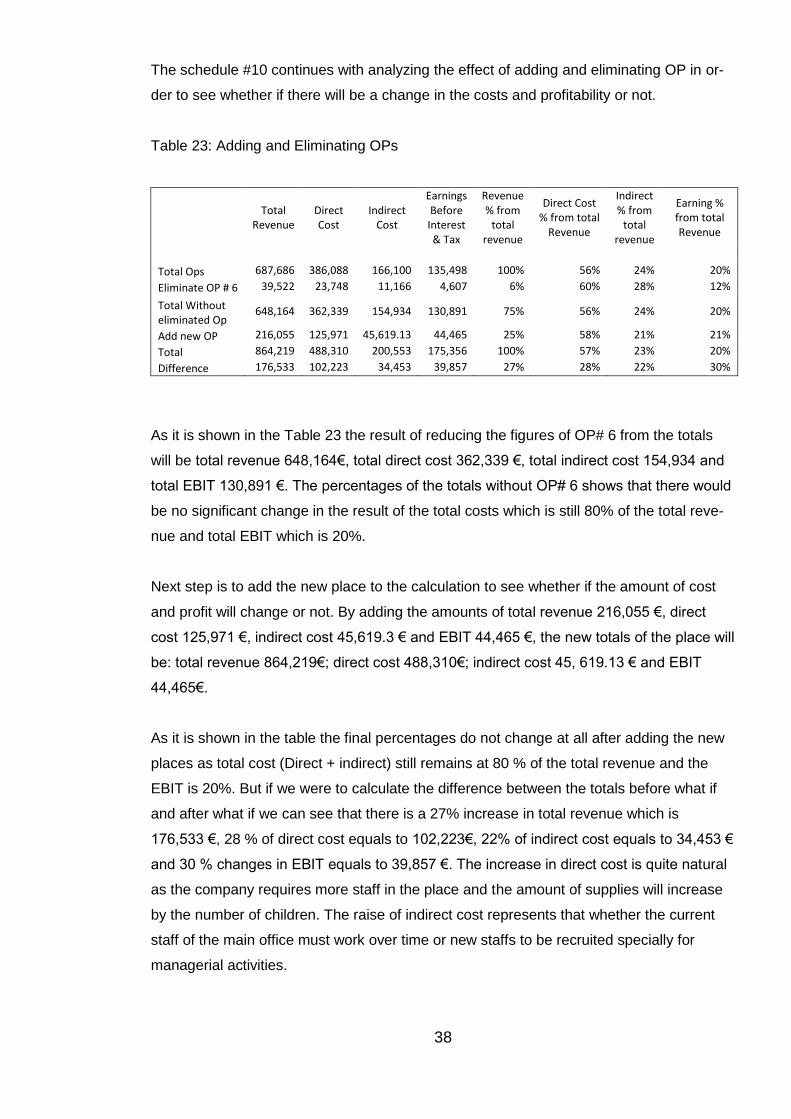
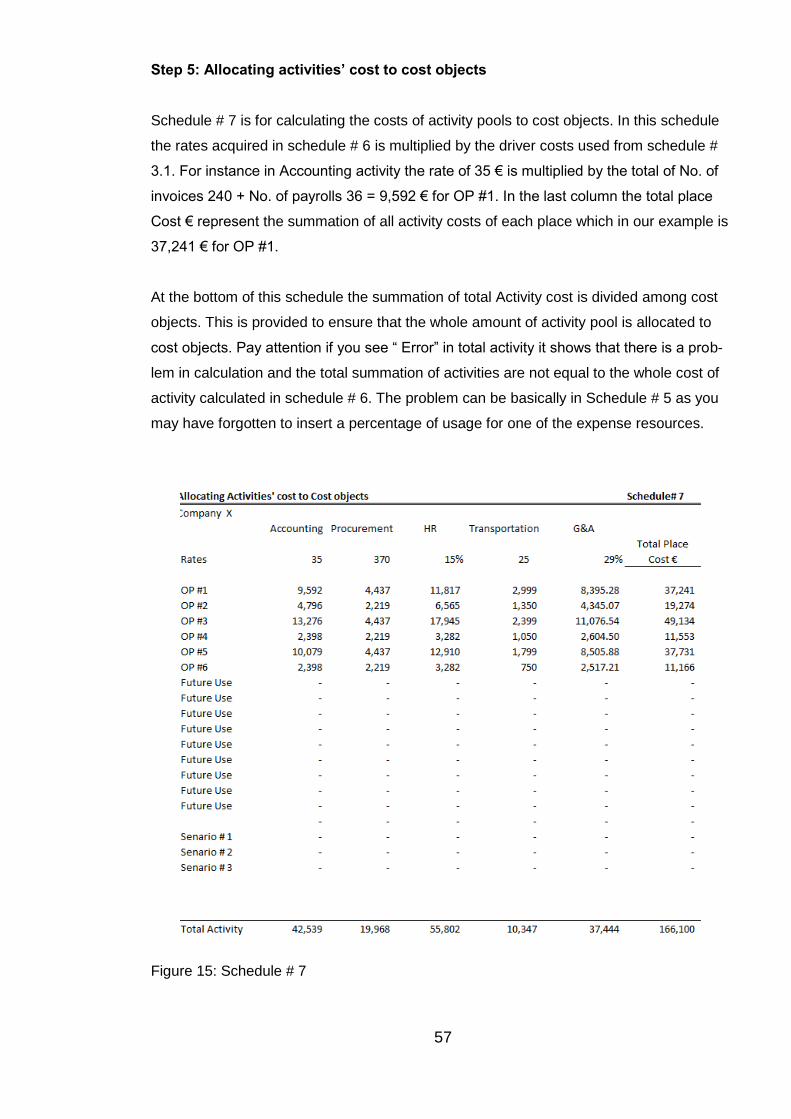
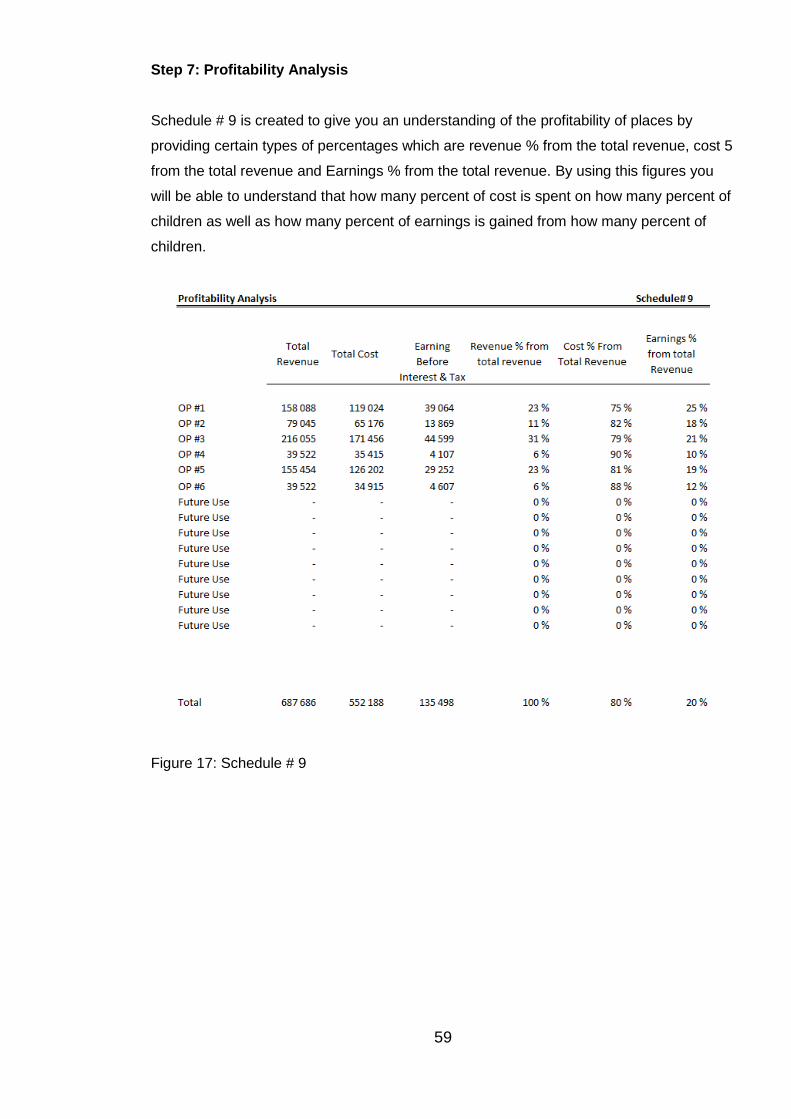
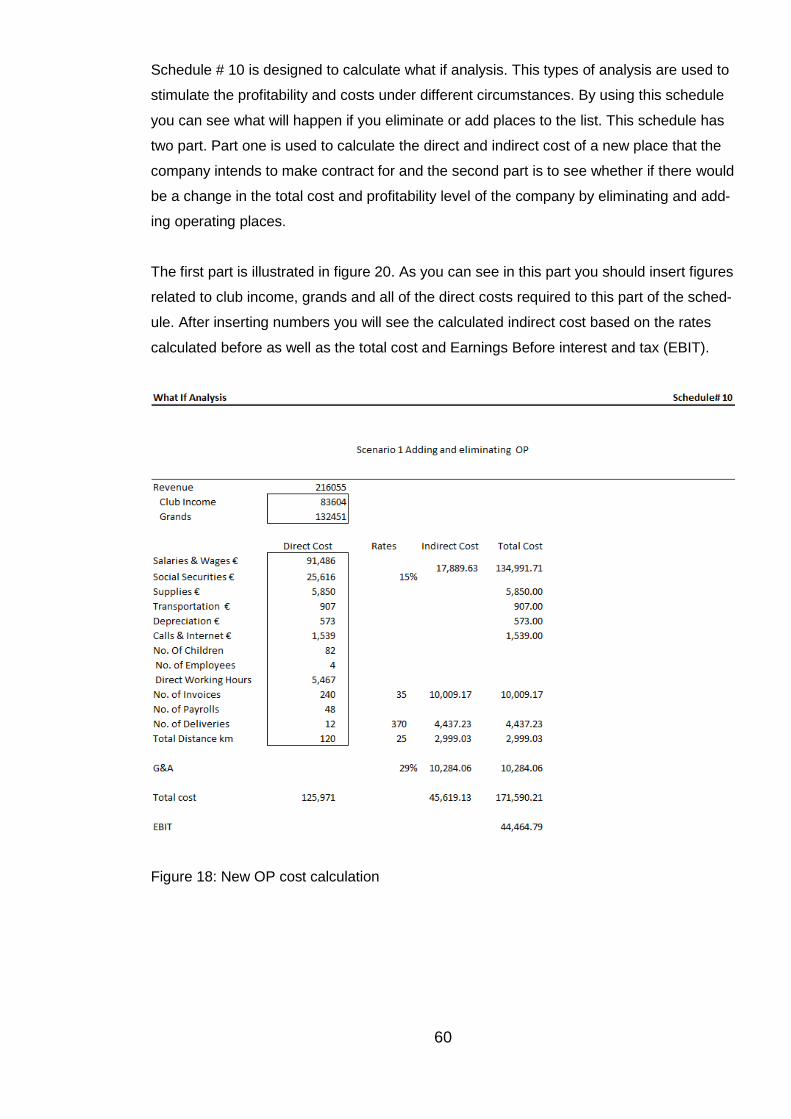
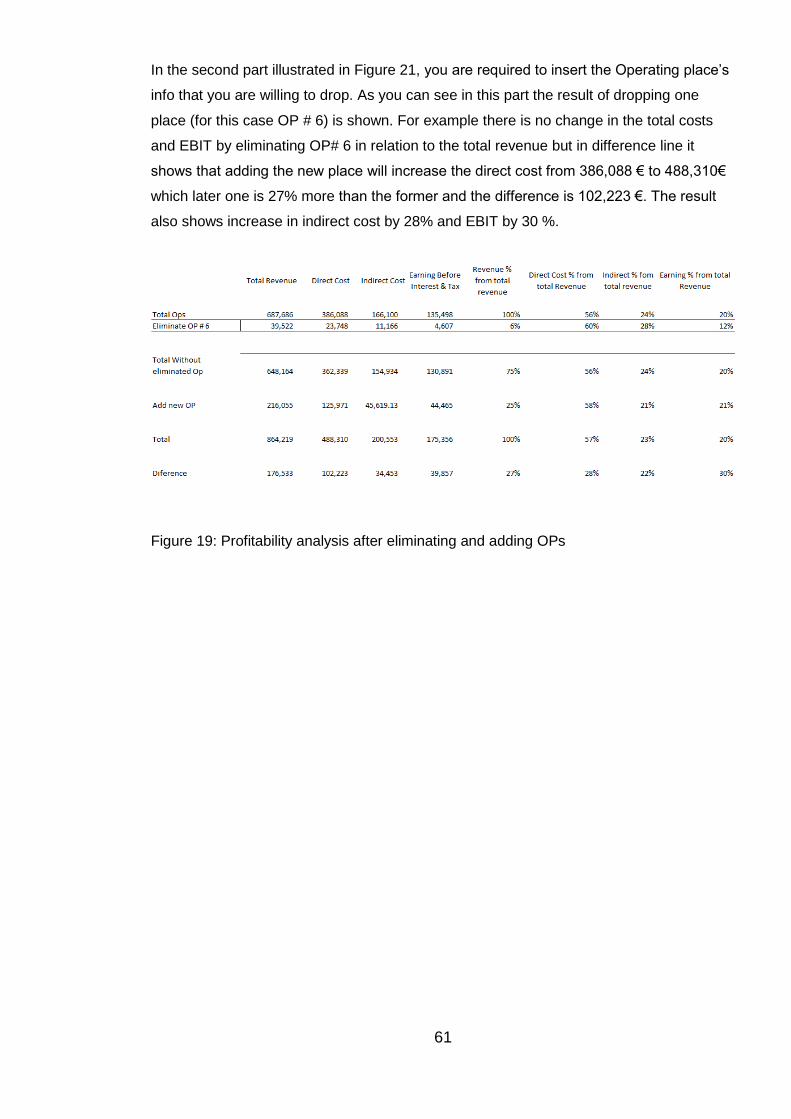
As it is shown in the Table 23 the result of reducing the figures of OP# 6 from the totals
will be total revenue 648,164€, total direct cost 362,339 €, total indirect cost 154,934 and
total EBIT 130,891 €. The percentages of the totals without OP# 6 shows that there would
be no significant change in the result of the total costs which is still 80% of the total reve-
nue and total EBIT which is 20%.
Next step is to add the new place to the calculation to see whether if the amount of cost
and profit will change or not. By adding the amounts of total revenue 216,055 €, direct
cost 125,971 €, indirect cost 45,619.3 € and EBIT 44,465 €, the new totals of the place will
be: total revenue 864,219€; direct cost 488,310€; indirect cost 45, 619.13 € and EBIT
44,465€.
As it is shown in the table the final percentages do not change at all after adding the new
places as total cost (Direct + indirect) still remains at 80 % of the total revenue and the
EBIT is 20%. But if we were to calculate the difference between the totals before what if
and after what if we can see that there is a 27% increase in total revenue which is
176,533 €, 28 % of direct cost equals to 102,223€, 22% of indirect cost equals to 34,453 €
and 30 % changes in EBIT equals to 39,857 €. The increase in direct cost is quite natural
as the company requires more staff in the place and the amount of supplies will increase
by the number of children. The raise of indirect cost represents that whether the current
staff of the main office must work over time or new staffs to be recruited specially for
managerial activities.
39
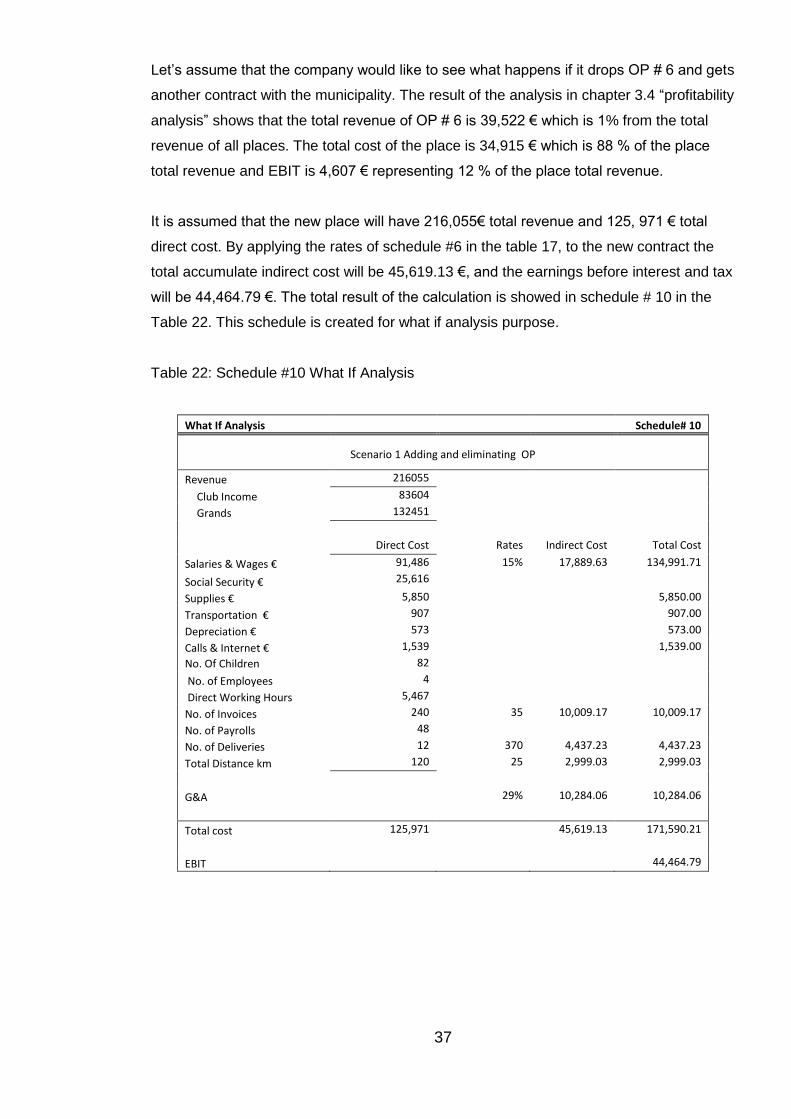
From the total results after what if analysis it can be concluded that the company must
revise its salaries & wages expenses if it intends to increase its profitability.
Formulas used in schedule # 10 are (Hicks, D.T. 1999):
Indirect cost = Rate x Direct cost
Total Cost = Direct cost + Indirect cost
G&A = Rate x total internal cost
EBIT = Total Revenue – Total Cost
Total without eliminated OP = Total Ops – Eliminate OP# 6 (In this case)
Total = Total without eliminate OP + Add new OP
Difference = Total – Total OPs
40
4 Summary and personal learning
Creating an accurate cost information system is a fundamental need for organizations to
be competitive in the market. However, it is not an easy job and requires time and invest-
ment to gather and analyze information to form the system. But companies can benefit by
understanding the cost structure so they can make proper decisions about the costs, prof-
itability, pricing and so many other issues. One of the commonly used and accurate cost-
ing system is Activity- Based Costing. As it was evident, the created ABC system tool
helped the case Company to have a better idea of its operating places costing issues.
After going through the process of creating the tool and analyzing the company’s activities
and business process, it is strongly recommended that the company use more tools such
as budgeting, internal accounting, and so on in order to trace the incurred costs of the
business.
Howbeit this tool can be improved even further and many other sheets can be added to
the tool for collecting and analyzing data to provide more accurate results for decision
making. Fields that can be added and improved are salary payment system, social securi-
ty and insurance calculation system, inventory and purchasing system, other legal issues,
calculation system and Activity Based Management system. Despite of Activity Based
Costing Which is just a tool for calculating and allocating overheads to costs objects Activ-
ity based management helps the company to reform its costing system and provides
managers with how to understand the result of the ABC system tool.
However, it is not possible to explain all of the learning and knowledge I gained by doing
this project but I will mention some of the main ones.
Planning: I realized that how it is important to plan a project beforehand and all the possible related issues must be identified and familiarized with to have a good plan.
Timing: It is of fundamental importance to be precise and make a deadline for each step of the project plan.
The importance of costing system: in the beginning creating a costing system looks easy as it is all about organizing information. But how to get information and which one is relevant is important therefore creating criteria for data selection is necessary in creating a tool. Companies may not have everything ready but they must be created by analyzing the whole business.
Cooperating issues: although the case company was very cooperative in the pro-cess of doing this project but I understood what sort of difficulties one can go through if required support is not provided by the personnel and the company in general.