12
Exploring emerging ICT-enabled governance models in European cities Mark Deakin & Alasdair Reid Edinburgh Napier University June, 2011 EXPGOV Project
| Date post: | 13-Jul-2015 |
| Category: |
Education |
| Upload: | smart-cities-project |
| View: | 629 times |
| Download: | 0 times |

Exploring emerging ICT-enabled governance models in European cities
Mark Deakin & Alasdair Reid
Edinburgh Napier University
June, 2011
EXPGOV Project
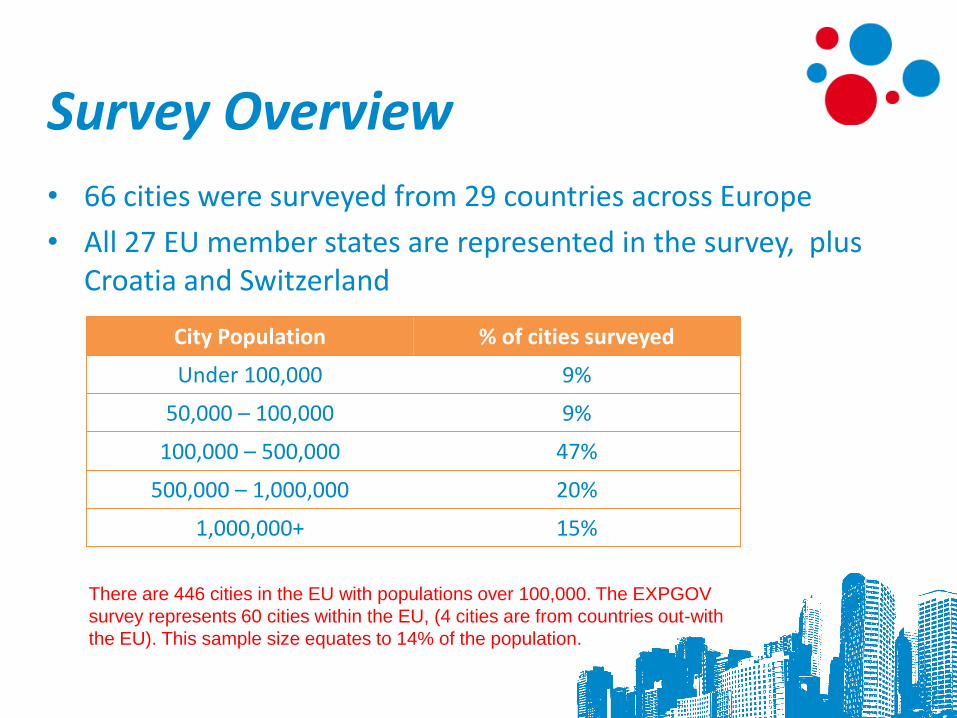
Survey Overview
• 66 cities were surveyed from 29 countries across Europe
• All 27 EU member states are represented in the survey, plus Croatia and Switzerland
City Population % of cities surveyed
Under 100,000 9%
50,000 – 100,000 9%
100,000 – 500,000 47%
500,000 – 1,000,000 20%
1,000,000+ 15%
There are 446 cities in the EU with populations over 100,000. The EXPGOV
survey represents 60 cities within the EU, (4 cities are from countries out-with
the EU). This sample size equates to 14% of the population.
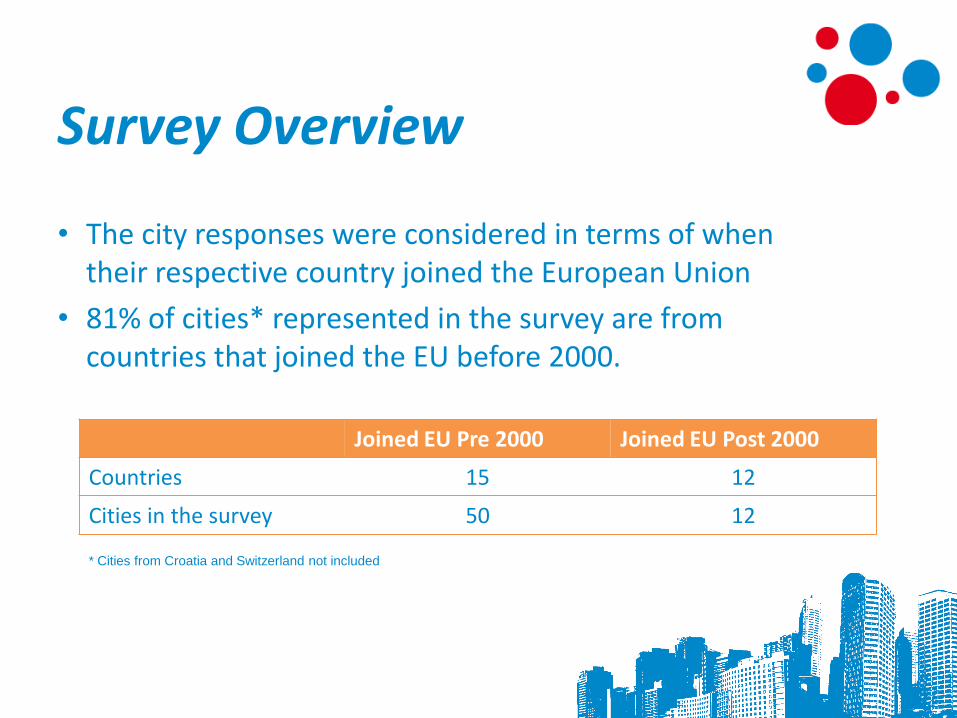
Survey Overview
• The city responses were considered in terms of when their respective country joined the European Union
• 81% of cities* represented in the survey are from countries that joined the EU before 2000.
Joined EU Pre 2000 Joined EU Post 2000
Countries 15 12
Cities in the survey 50 12
* Cities from Croatia and Switzerland not included

Respondent Profile
• Each respondent was asked to state the role they perform within their particular city
0% 5% 10% 15% 20% 25% 30% 35% 40%
City Government Official
Researcher
Advisor
Other / Not Specified
Policy Maker
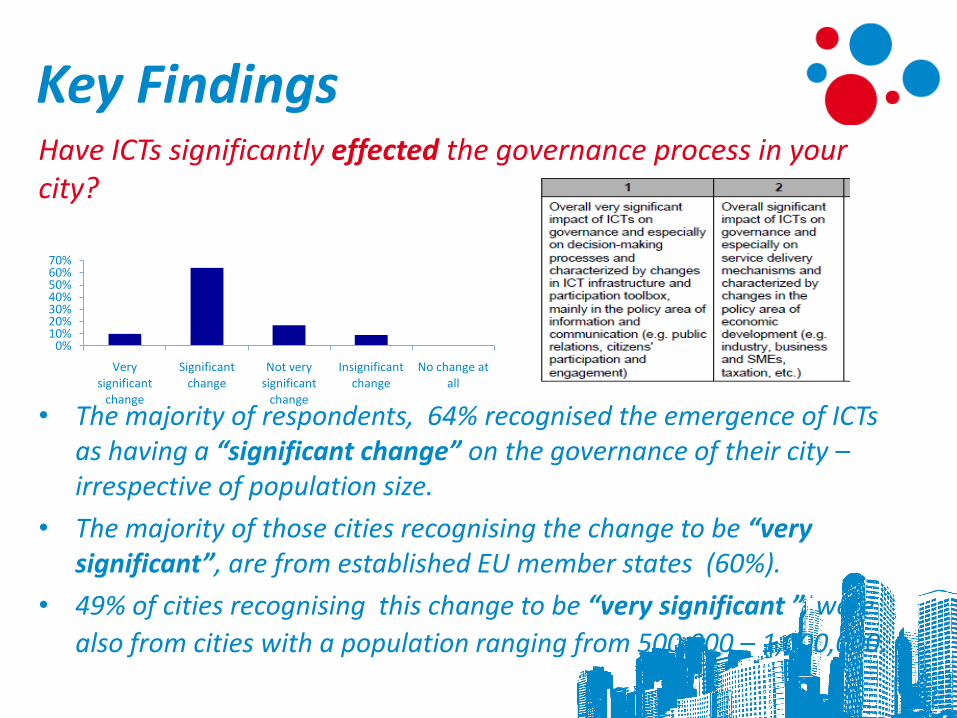
Key FindingsHave ICTs significantly effected the governance process in your city?
• The majority of respondents, 64% recognised the emergence of ICTs as having a “significant change” on the governance of their city –irrespective of population size.
• The majority of those cities recognising the change to be “very significant”, are from established EU member states (60%).
• 49% of cities recognising this change to be “very significant ”, were
also from cities with a population ranging from 500,000 – 1,000,000.
0%10%20%30%40%50%60%70%
Very significant
change
Significant change
Not very significant
change
Insignificant change
No change at all
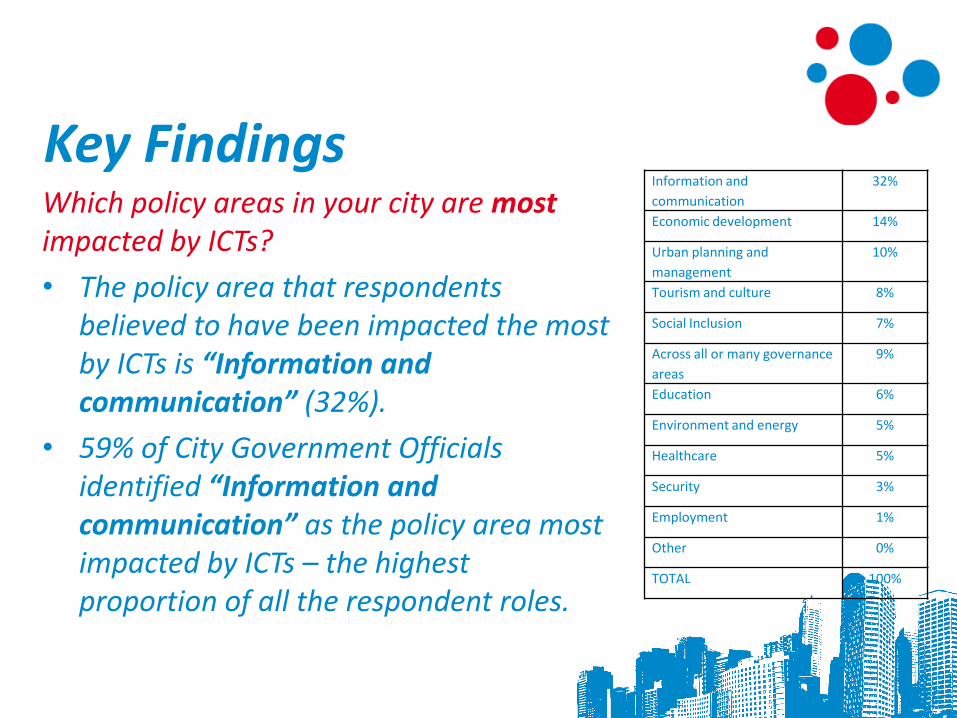
Key FindingsWhich policy areas in your city are mostimpacted by ICTs?
• The policy area that respondents believed to have been impacted the most by ICTs is “Information and communication” (32%).
• 59% of City Government Officials identified “Information and communication” as the policy area most impacted by ICTs – the highest proportion of all the respondent roles.
Information and
communication
32%
Economic development 14%
Urban planning and
management
10%
Tourism and culture 8%
Social Inclusion 7%
Across all or many governance
areas
9%
Education 6%
Environment and energy 5%
Healthcare 5%
Security 3%
Employment 1%
Other 0%
TOTAL 100%
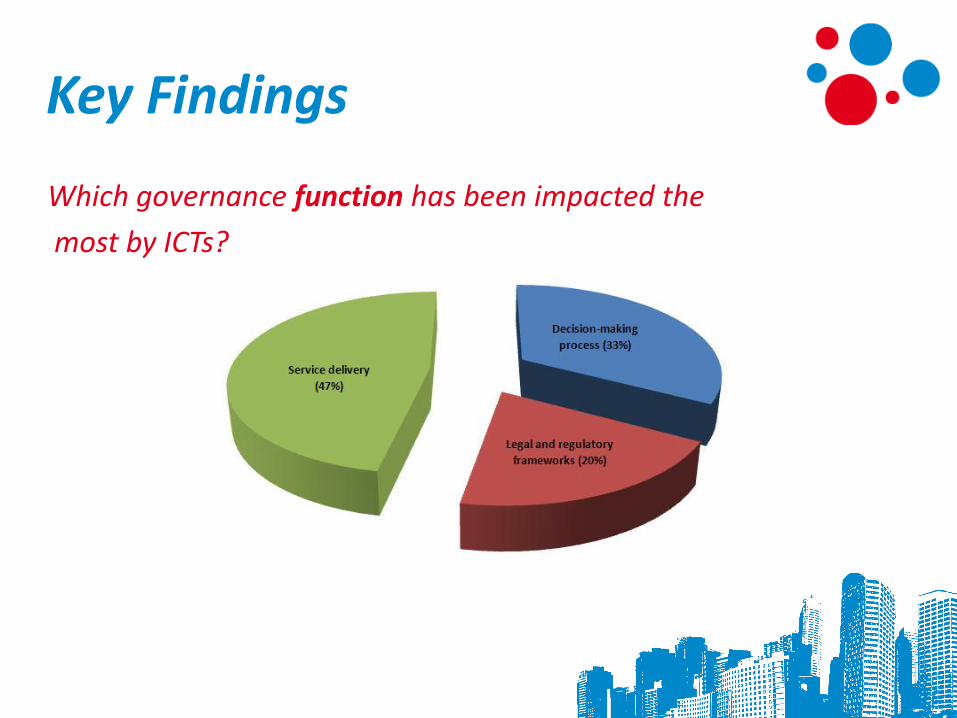
Key Findings
Which governance function has been impacted the
most by ICTs?

Key Findings
What specific institutional changes have emerged with the development of the city’s governance processes?*
• “Openness” was identified as the main driver (57%);
• 43% of responses related to “Performance”
*Here the “responses” were mapped against the respective Value Drivers
and Government Dimensions (see EXPGOV Concept Paper).The third
value driver – social inclusion received no response.
0%
10%
20%
30%
40%
50%
60%
Performance Openness
Key Findings
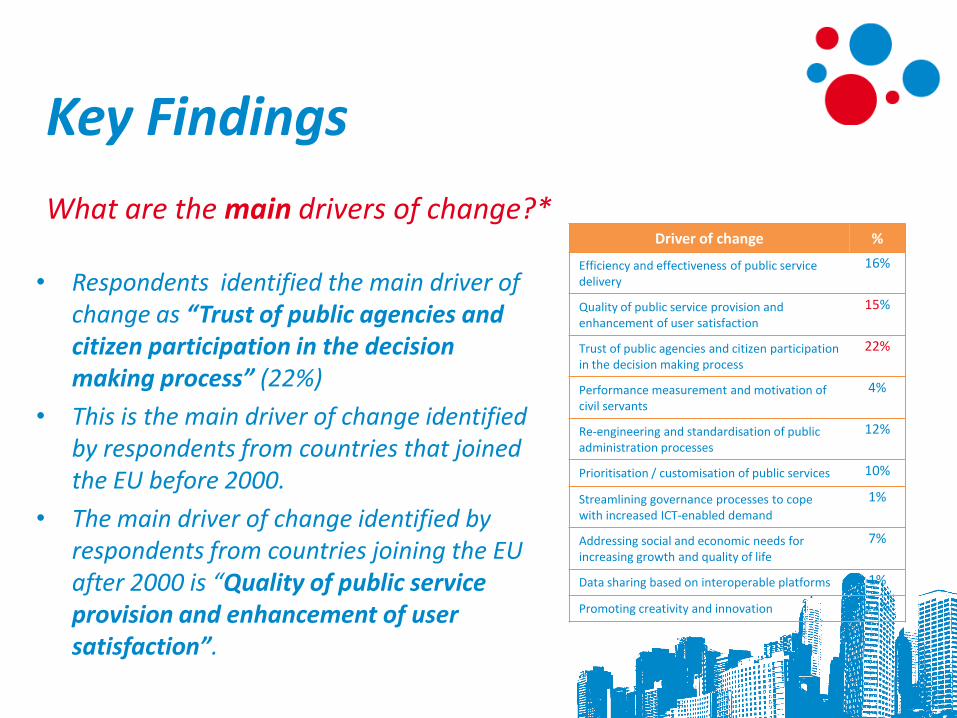
What are the main drivers of change?*
• Respondents identified the main driver of change as “Trust of public agencies and citizen participation in the decision making process” (22%)
• This is the main driver of change identified by respondents from countries that joined the EU before 2000.
• The main driver of change identified by respondents from countries joining the EU after 2000 is “Quality of public service provision and enhancement of user satisfaction”.
Driver of change %
Efficiency and effectiveness of public service delivery
16%
Quality of public service provision and enhancement of user satisfaction
15%
Trust of public agencies and citizen participation in the decision making process
22%
Performance measurement and motivation of civil servants
4%
Re-engineering and standardisation of public administration processes
12%
Prioritisation / customisation of public services 10%
Streamlining governance processes to cope with increased ICT-enabled demand
1%
Addressing social and economic needs for increasing growth and quality of life
7%
Data sharing based on interoperable platforms 1%
Promoting creativity and innovation 12%
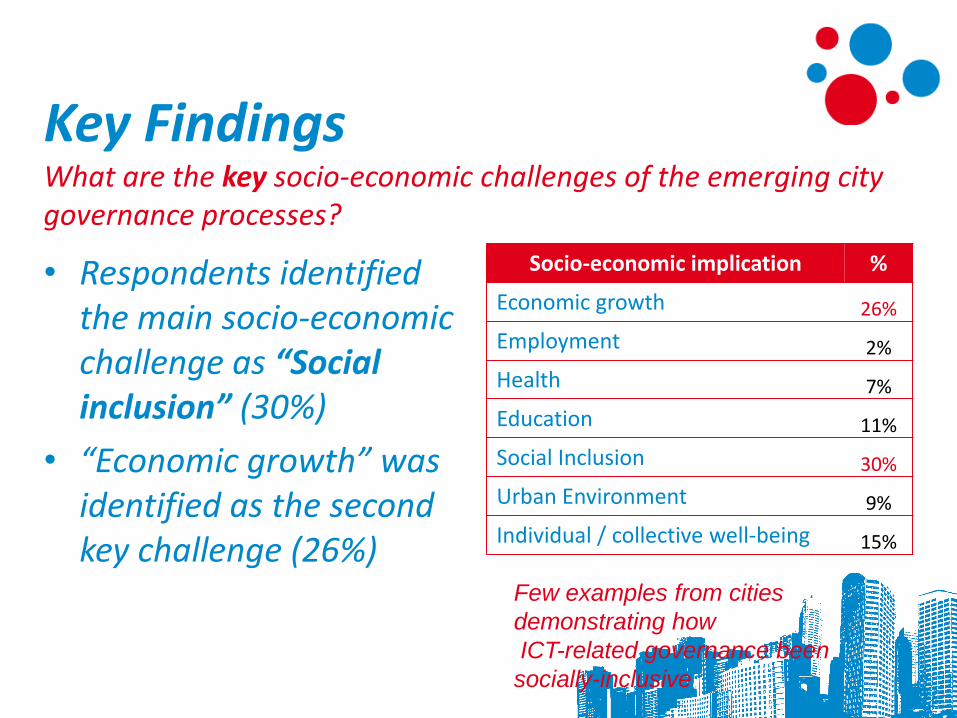
Key FindingsWhat are the key socio-economic challenges of the emerging city governance processes?
• Respondents identified the main socio-economic challenge as “Social inclusion” (30%)
• “Economic growth” was identified as the second key challenge (26%)
Socio-economic implication %
Economic growth 26%
Employment 2%
Health 7%
Education 11%
Social Inclusion 30%
Urban Environment 9%
Individual / collective well-being 15%
Few examples from cities
demonstrating how
ICT-related governance been
socially-inclusive

Key FindingsDo you think new forms of ICT-enabled governance are emerging in your city?
The majority (41%) responded: “Yes, to some extent”.
• The most common response from cities within countries members the EU before-2000 was: “Yes, to some extent”.
• The most common response from cities joining the EU after-2000 was: “I don’t know: it is too early to judge”.
• Respondents from cities with a population ranging between 500,000 – 1,000,000 provided the most positive response, with 38% selecting the statement “Yes, clearly”.
0% 5% 10% 15% 20% 25% 30% 35% 40% 45%
Yes, to some extent
I don't know: it is too early to judge
Yes, clearly
I don't know: it is impossible to tell
No
No answer
Critical Insights• The survey suggests ICTs are having an impact on city governance,
particularly in terms of improved information and communication services which enhance service provision.
• The search for “open government” is the main institutional change for established EU member states, whereas “levels of service performance” is key to the post-2000 member states.
• “Trust of public agencies” and “increased citizen participation in the decision-making process”, are identified as significant policy drivers.
• “Inclusion” (and economic growth) is the main social-economic challenge.
• Despite approximately 60% of those surveyed confirming ICTs are having a significant impact on city governance processes, the questionnaire provides insufficient evidence (41%) to suggest this is leading to the
development of new e-governance models.


