251
Creating Sustainable Value AIA Group Limited 友邦保險控股有限公司 Annual Report 2012 Stock code: 1299

Creating Sustainable
Value
AIA Group Limited友邦保險控股有限公司
Annual Report 2012
AIA
Gro
up Lim
ited 友邦保險控股有限公司
Annual R
epo
rt 2012
Stock code: 1299

VisionAIA is the pre-eminent life insurance provider in the Asia-Pacific region, differentiated from our competitors
by the combination of our Asia regional focus, the scale, quality and profitability of our operations across the
region, and the standards of service and benefits we deliver to our customers. Our vision is to grow our
business prudently and profitably in all the markets we serve in order to optimise returns for our shareholders
over time.
About AIAAIA Group Limited and its subsidiaries (collectively “AIA” or “the Group”) comprise the largest independent
publicly listed pan-Asian life insurance group. It has operations in 16 markets in Asia-Pacific – wholly-owned
branches and subsidiaries in Hong Kong, Thailand, Singapore, Malaysia, China, Korea, the Philippines,
Australia, Indonesia, Taiwan, Vietnam, New Zealand, Macau, Brunei, a 92 per cent subsidiary in Sri Lanka
and a 26 per cent joint venture in India.
The business that is now AIA was first established in Shanghai over 90 years ago. It is a market leader in the
Asia-Pacific region (ex-Japan) based on life insurance premiums and holds leading positions across the
majority of its markets. It had total assets of US$134,439 million as of 30 November 2012.
AIA meets the savings and protection needs of individuals by offering a range of products and services
including retirement savings plans, life insurance and accident and health insurance. The Group also
provides employee benefits, credit life and pension services to corporate clients. Through an extensive
network of agents and employees across Asia-Pacific, AIA serves the holders of more than 25 million
individual policies and over 13 million participating members of group insurance schemes.
AIA Group Limited is listed on the Main Board of The Stock Exchange of Hong Kong Limited under the stock
code “1299” with American Depositary Receipts (Level 1) traded on the over-the-counter market (ticker
symbol: “AAGIY”).
Notes:
(1) Explanations of certain terms and abbreviations used in this report are set forth in the Glossary.
(2) Unless otherwise specified, 2011 and 2012 refer to the financial year of AIA Group Limited, which ends on 30 November of the year indicated.
Creating Sustainable Value In 2012 AIA delivered another set of excellent results with record performance across all of our key metrics. We are well positioned for future growth as we create sustainable value for our customers and shareholders.

OVERVIEW
8 Financial Highlights
10 Chairman’s Statement
12 Group Chief Executive and President’s Report
FINANCIAL AND OPERATING REVIEW
18 Financial Review
34 Business Review
54 Risk Management
62 Our People
66 Corporate Social Responsibility
CORPORATE GOVERNANCE
74 Statement of Directors’ Responsibilities
75 Board of Directors and Executive Committee
80 Report of the Directors
85 Corporate Governance Report
94 Remuneration Report
FINANCIAL STATEMENTS
105 Independent Auditor’s Report
107 Consolidated Income Statement
108 Consolidated Statement of Comprehensive Income
109 Consolidated Statement of Financial Position
110 Consolidated Statement of Changes in Equity
111 Consolidated Statement of Cash Flows
112 Notes to the Consolidated Financial Statements
and Significant Accounting Policies
208 Financial Statements of the Company
211 Supplementary Embedded Value Information
ADDITIONAL INFORMATION
234 Information for Shareholders
236 Corporate Information
237 Glossary
Contents

Key Milestones
The first life insurance policy issued in Shanghai.
1919 1931
20001990
HONG KONG AND SINGAPOREMr. Cornelius Vander Starr founded International Assurance Company, Limited (INTASCO), in Shanghai.
INTASCO established branch offices in Hong Kong and Singapore.
THAILANDINTASCO entered Siam, later renamed Thailand, to write both life and general insurance.
2001INDIAA joint venture in India was established.
2008
1992
1998We celebrated the return to our former headquarters building at The Bund in Shanghai.
TAIWANOur operations in Taiwan were established as a branch of ALICO.
We re-established our presence in China through a branch office in Shanghai, the first foreign-owned life business to receive a licence in the country.
VIETNAMWe formed a subsidiary in Vietnam.
AIA broke the record as the life insurer with the highest number of MDRT qualifiers in Hong Kong.
AIA put down its corporate roots in Asia when the group founder Mr. Cornelius Vander Starr established an insurance agency in Shanghai.
1921SHANGHAIMr. Cornelius Vander Starr founded Asia Life Insurance Company, his first life insurance enterprise in Shanghai.
1938
AIA Group Limited Annual Report 2012
2

1947 1981 198719721957
2009 2011 20122010
The divestment by AIG of its remaining shareholding in AIA marked the end of our association with AIG.
1982MACAUWe entered Macau.
BRUNEIWe registered in Brunei.
AUSTRALIAWe formed a subsidiary in Australia.
NEW ZEALANDOur New Zealand operations began as a branch of American Life Insurance Company (ALICO).
KOREAKorean operations began.
ALICO Taiwan became our branch office.
Philam Life became an operating subsidiary of the Group.
We completed the reorganisation driven by AIG’s liquidity crisis in 2008, leading to the positioning of the Company for a public listing.
AIA Group Limited successfully listed on the Main Board of the Stock Exchange of Hong Kong Limited, the third largest IPO ever globally at the time.
AIA Group Limited became a constituent stock of the Hang Seng Index.
We launched a sponsored Level 1 American Depositary Receipt programme.
1948MALAYSIAWe entered Malaysia.
1969
We moved into a new office on Stubbs Road, Hong Kong.
PHILIPPINESThe Philippine American Life and General Insurance Company (Philam Life) was founded in the Philippines.
INTASCO moved its head office to Hong Kong and changed its name to American International Assurance Company, Limited (AIA Co.).
3
1984
INDONESIAWe entered Indonesia.

Hong Kong
Taiwan
Korea
New Zealand
Macau
Vietnam
The Philippines
Brunei
Singapore
Malaysia
Sri Lanka
Indonesia
Australia
China
Thailand
India
AIA Group Limited Annual Report 2012
Geographical MarketsWe have a diversified franchise across the Asia-Pacific region.
Our long experience in the region allows us to tailor our
strategies to the culture, demographics and insurance needs
of each market in which we operate.

Hong Kong
Taiwan
Korea
New Zealand
Macau
Vietnam
The Philippines
Brunei
Singapore
Malaysia
Sri Lanka
Indonesia
Australia
China
Thailand
India
5
AIA At-a-Glance (2)
History of over
90 yearsin Asia-Pacific
100 per cent ownership in 14 (1) out of
16 geographical markets
Serving the holders of more than
25 millionindividual policies and over
13 millionparticipating members of group insurance schemes
Embedded value of
US$31.4 billionTotal assets of
US$134.4 billionNotes:
(1) Including operations in the Philippines in which percentage holding is 99.78 per cent.
(2) All the above figures are as of 30 November 2012.

Right StrategyWith the

Advantaged Platform in Asia
AIA is making great strides as the leading pan-Asian insurer with advantaged positions in each of our 16 markets throughout the Asia-Pacific region.

AIA Group Limited Annual Report 2012
OVERVIEW8
Financial HighlightsOVERVIEW
2012 Results At-a-Glance*
Value of New Business (VONB) (1)
US$ millions US$ millions
US$ millions US$ millions
US$ millions US$ millions
Operating Pro�t After Tax (OPAT) Total Weighted Premium Income (TWPI) (3)
Embedded Value (EV) (4) Total Assets and Total Liabilities
Annualised New Premium (ANP) (2)
+27% +9%
+12% +6%
+15%
Total Assets
+17%Total Liabilities
+16%
2009 2010 2011 2012
400
0
800
1,200
545
667
932
1,18
8
2009 2010 2011 2012
1,000
0
2,000
3,000
1,87
8
2,02
5
2,47
2 2,69
6
2009 2010 2011 2012
1,200
600
0
1,800
2,400
1,43
8 1,69
9 1,92
2 2,15
9
2009 2010 2011 2012
8,000
4,000
0
12,000
16,000
11,6
32 13,0
13 14,4
42
15,3
60
2009 2010 2011 2012
10,000
0
20,000
30,000
20,9
66 24,7
48 27,2
39
31,4
08
2009 2010 2011 2012
50,000
0
100,000
150,000
90,6
59
75,7
00
107,
865
88,2
30
114,
461
93,0
46
134,
439
107,
611
* Percentages shown indicate changes in 2012 compared with 2011.

OV
ER
VIE
WFI
NA
NC
IAL
AN
D O
PE
RA
TIN
G R
EV
IEW
AD
DIT
ION
AL
INF
OR
MA
TIO
NF
INA
NC
IAL
ST
AT
EM
EN
TS
CO
RP
OR
AT
E G
OV
ER
NA
NC
E
9Financial Highlights
Notes:
(1) Value of new business (VONB) is the present value, measured at point of sale, of projected after-tax statutory profits emerging in the future from new business sold in the period less the cost of holding required capital in excess of regulatory reserves to support this business.
(2) Annualised new premium (ANP) is a measure of new business activity that is calculated as the sum of 100 per cent annualised first year premiums and 10 per cent of single premiums, before reinsurance ceded.
(3) Total weighted premium income (TWPI) consists of 100 per cent of renewal premiums, 100 per cent of first year premiums and 10 per cent of single premiums.
(4) Embedded value (EV) is an actuarially determined estimate of the economic value of a life insurance business based on a particular set of assumptions as to future experience, excluding any economic value attributable to future new business.
(5) Operating profit after tax (OPAT) percentages are shown after non-controlling interest.
(6) Based on local statutory basis and before unallocated Group Office expenses, VONB by segment includes corporate pension business.
(7) The results of our joint venture in India are accounted for using the equity method. For clarity, TWPI, ANP and VONB exclude any contribution from India.
2012 Breakdown by Segment
Value of New Business (VONB) (1), (6) Annualised New Premium (ANP) (2)
Operating Pro�t After Tax (OPAT) (5) Total Weighted Premium Income (TWPI) (3)
28%
22%
20%
12%6%
8%
9%
23%
22%17%
34%
22%
20%
13%
6%
10%
13%
16%
21%
15%
6%
7%
6%
10%1%
5%
10%
5%
13%
Hong Kong Thailand Singapore Malaysia
Group Corporate CentreChina Korea Other Markets (7)

AIA Group Limited Annual Report 2012
OVERVIEW10
“Over this time, a clear track record of strong and sustained performance has emerged in keeping with our confidence in the Group’s outstanding prospects for profitable growth.”
Edmund Sze-Wing TseNon-executive Chairman
Chairman’s StatementOVERVIEW

OV
ER
VIE
WFI
NA
NC
IAL
AN
D O
PE
RA
TIN
G R
EV
IEW
AD
DIT
ION
AL
INF
OR
MA
TIO
NF
INA
NC
IAL
ST
AT
EM
EN
TS
CO
RP
OR
AT
E G
OV
ER
NA
NC
E
11Chairman’s Statement
It is with great pleasure that I present my third annual
Statement since AIA became an independent listed company
in October 2010. Over this time, a clear track record of strong
and sustained performance has emerged in keeping with our
confidence in the Group’s outstanding prospects for
profitable growth.
The Group has delivered an excellent set of results in 2012
building on the momentum achieved in 2011, which was in
itself a record year. I would like to thank our leadership team,
employees, agents and partners for their hard work and
dedication in producing another significant uplift in profitability
and shareholder value.
Value of new business (VONB) now stands at US$1,188
million in 2012, a 27 per cent increase compared with 2011
and more than doubled the figure achieved in 2009.
Embedded value (EV) was up 15 per cent over the year and is
50 per cent higher than in 2009. It is a testament to the
quality of the Group’s in-force business and the active
management of its financial position that these levels of
profitable new business growth were achieved alongside an
improving solvency ratio.
In line with our stated goal to deliver prudent, sustainable and
progressive dividends to our shareholders, the Board has
recommended a final dividend of 24.67 Hong Kong cents per
share, subject to shareholders’ approval at the AGM.
This is an increase of 12 per cent compared with 2011.
AIA’s ability to finance growth and deliver a progressive
dividend is well recognised by our shareholders and the
maintenance of this balance is one to which your Directors
attach great importance.
I am also pleased to report that our share price has
outperformed the Hang Seng Index by over 70 per cent
since listing and that AIA is now the largest Hong Kong
headquartered and incorporated company in the Hang Seng
Index.
2012 was also noteworthy for the Group in that AIG disposed
of its final tranche of AIA’s shares via a private placement
valued at approximately US$6.45 billion in December 2012.
Globally, this was one of the largest secondary placings ever
undertaken. The tremendous speed and efficiency with which
the transaction was completed provide further testimony to
the level of support in the investment community for AIA and
the Group’s prospects. The share placing was also significant
as it brought to a close any remaining links between AIA and
AIG. This is an appropriate occasion to pay tribute to the
unfailing support AIA has received from AIG in the past in
building the businesses that now constitute the AIA Group,
and over the two years since our IPO. AIA is a truly Asian
organisation, directed from Hong Kong and operating solely in
the growth markets of the Asia-Pacific region.
The Corporate Governance and Risk Management sections in
this Annual Report demonstrate the great importance your
Board attaches to maintaining the highest standards of
professionalism in governance matters. A key aspect of
governance is the composition and balance of the Board and
during 2012 important steps were taken to further strengthen
the independence of the Board.
During the year one independent and two non-independent
directors left the Board. Three independent non-executive
directors were appointed in their place and a non-executive
director also qualified for redesignation as a further
independent director. Your Board is now made up of seven
independent non-executive directors plus the Executive
Director and myself. My initial appointment as Non-executive
Chairman was for two years from 1 January 2011. The Board
has invited me to remain as Chairman for a further two years
and I am honored to accept.
The outstanding results again demonstrate AIA’s momentum
for sustained growth and the Group’s exceptional attributes
that position us to take advantage of the abundant growth
opportunities across the Asia-Pacific region. We have clearly
defined strategies for growth focused at all times on
increasing shareholder value by delivering high-quality
products and services to an ever-widening community
of customers.
In closing, I would like to record my most sincere thanks to
your Group Chief Executive and President Mark Tucker and
his team for their great achievements in 2012. They are an
exceptional team who produce exceptional results.
Edmund Sze-Wing Tse
Non-executive Chairman
27 February 2013

AIA Group Limited Annual Report 2012
OVERVIEW12
“The execution of the growth strategy that we have put into place since our IPO has continued to deliver record results across all our major performance criteria.”
Mark Edward TuckerGroup Chief Executive and President
Group Chief Executive and President’s ReportOVERVIEW

OV
ER
VIE
WFI
NA
NC
IAL
AN
D O
PE
RA
TIN
G R
EV
IEW
AD
DIT
ION
AL
INF
OR
MA
TIO
NF
INA
NC
IAL
ST
AT
EM
EN
TS
CO
RP
OR
AT
E G
OV
ER
NA
NC
E
13Group Chief Executive and President’s Report
It gives me great pleasure to report that 2012, our second
complete financial year since our listing in October 2010, was
another very successful year for AIA.
The execution of the growth strategy that we have put into
place since our IPO has continued to deliver record results
across all our major performance criteria. Value of new
business (VONB) – our main measure of value creation –
increased by 27 per cent compared with 2011 to reach a
new high of US$1,188 million. IFRS operating profit after tax
grew 12 per cent and embedded value (EV) increased by
15 per cent, or US$4,169 million, to a record level of
US$31,408 million.
The growth levels we have achieved were built on a 2011
base that was itself a record year. AIA’s ability to achieve
growth of this magnitude against the challenging global
macro-economic background, and specifically the prevailing
low interest rate environment, demonstrates the resilience
of our strategy and the quality of AIA’s franchise and
business model.
DRIVERS OF GROWTH
AIA’s success is underpinned by the advantaged position we
enjoy across our markets. This includes our financial strength,
the considerable scale of revenue streams from our book of
in-force business, the widely-held respect for the AIA brand
across Asia and the regular personal interaction with our
customers that we are able to maintain, primarily through our
proprietary agency distribution.
AIA continues to make great strides as the leading pan-Asian
insurer. Today we are the largest company listed on the
Hong Kong Stock Exchange to be both incorporated and
headquartered in Hong Kong. Our exclusive focus on the
region means that we have the ability to better understand the
needs of our customers on the ground and are able to take
full advantage of the opportunities presented by the fast-
growing markets in which we operate without diluting our
results or distracting our focus by retaining a presence in
areas of the world with lower growth prospects and returns.
AIA’s significant advantages would not, by themselves,
generate the successful results that we are achieving if we
had not put in place a comprehensive strategy to deliver
growth on a sustained and profitable basis. Our success
comes from the hard work of many thousands of committed,
dedicated and professional employees, agents and
intermediaries – and from an applied depth of expertise
derived from the fact that we are Asia-based and
Asia-focused. Our objective is clear: to create shareholder
value through delivering high-value products and services to
our customers to promote their financial protection and social
well-being.
DISTRIBUTION
The unequivocal benefits of taking out adequate levels of
protection cover and building up regular long-term savings
need to be conveyed to potential consumers through the
provision of high standards of advice. Quality of distribution is
therefore critical, particularly in emerging markets where the
need for protection cover is significant.
AIA has large scale, highly effective agency distribution that
has been built up over many decades across the region.
We are committed to continually improving the quality and
professionalism of our agency training and management
processes through our Premier Agency strategy. We see this
as essential to the future preservation of our outstanding
customer franchise.
At the same time as we continue to strengthen our agency
distribution platform, we are developing profitable
relationships with local and regional banking partners, the
independent financial adviser (IFA) community and other
affinity channels through AIA Partners, the Group’s
partnership team. They are responsible for capturing material
growth opportunities through distribution channel expansion
but only where our required rates of return are attainable.
PRODUCTS
We have a similarly proactive approach to product innovation.
Insurance offers a broader and more reliable source of
protection against medical and other life contingencies than
reliance on self-funding. It is becoming recognised that a large
proportion of the population in the Asia-Pacific region has
inadequate protection cover. AIA has launched major
initiatives across our markets to promote the take-up of such
products and the share of our sales that is derived from
protection products has risen over the last two years. We look
for continued expansion into the future.

AIA Group Limited Annual Report 2012
OVERVIEW14
Group Chief Executive and President’s Report
In addition to our focus on protection, we continue to
enhance and develop our range of products to address our
customers’ long-term savings needs, including products that
offer more efficient access to investment funds and protect
the real value of savings, such as our new generation of
unit-linked products. We have also adopted a systematic
approach to advising our customers on the need to increase
their existing levels of cover to keep pace with their changing
financial circumstances.
ACqUISITIONS
Organic growth is the key driver of our strategy, but we have
been both watchful and well-equipped to review any value-
enhancing inorganic opportunities that arise in Asia ex-Japan.
In 2012, we completed two such acquisitions. In September,
we announced the acquisition of a 92 per cent shareholding
in one of the leading insurance companies in Sri Lanka, which
will position us well to develop a significant operation in the
expanding Sri Lankan market. In October, we announced the
acquisition of ING Malaysia, the third largest life insurer in
Malaysia, for a consideration of US$1.73 billion. The
acquisition presents AIA with a high calibre distribution force
of over 9,000 agents and a long-term bancassurance
partnership with a leading Malaysian banking group, Public
Bank. The transaction is expected to be immediately accretive
and takes AIA from fourth to first position in the Malaysian
market in terms of 2011 premium volumes. It provides
outstanding opportunities for synergies through integration of
the two operations. Such acquisitions are incremental to our
core strategy of organic growth, not an alternative.
CHANGES IN MANAGEMENT STRUCTURE
Last year’s annual report described in some detail the
Group’s management structure and the way in which the
relationships between the Group Office and local business
units are structured to support and empower local
management teams. Our approach has proved its
effectiveness in 2012 and is embedded in all levels of
the organisation.
An important reallocation of Group Office responsibilities took
place in August 2012, when Ng Keng Hooi, Regional Chief
Executive, received functional responsibility for product
development and Simeon Preston, Group Chief Strategy and
Operations Officer, became responsible for the Group’s IT
strategy. In December 2012, Bill Lisle, Group Chief Agency
Officer, who has extensive and successful experience of the
Malaysian market, took over responsibility for the integration
of the AIA and ING operations in Malaysia, while continuing to
lead our Premier Agency upgrade programme. His former
responsibility for supporting the development of
bancassurance and IFA partnerships has been transferred to
Gordon Watson, Regional Chief Executive.
ENGAGEMENT WITH EMPLOYEES AND AGENTS
AIA’s success is heavily dependent on the quality of people
we have working within the organisation and as agents in their
communities. We attach great importance to measures that
promote both commitment to the delivery of individual
performance goals and a wider spirit of “engagement” within
the AIA community. There are many facets to this, ranging
from the straightforward application of sound human
resources practices to innovative thinking on employee
welfare. I am particularly pleased that in 2012 we introduced a
share ownership scheme for agents equivalent to that already
introduced for employees.
One consequence of our IPO is that AIA now has
responsibility for many corporate areas that were previously
beyond its remit. It is important that we develop a strong,
distinctive culture as a group to support our drive for
excellence. We identified our Operating Philosophy as being
about “Doing the Right Thing, in the Right Way, with the
Right People”. Underlying this Operating Philosophy are
12 Operating Principles that help guide and shape our
employees’ actions and behaviours, informing how we
interact with one another and how we behave externally with
our customers, shareholders and other stakeholders,
including the community at large.

OV
ER
VIE
WFI
NA
NC
IAL
AN
D O
PE
RA
TIN
G R
EV
IEW
AD
DIT
ION
AL
INF
OR
MA
TIO
NF
INA
NC
IAL
ST
AT
EM
EN
TS
CO
RP
OR
AT
E G
OV
ER
NA
NC
E
15Group Chief Executive and President’s Report
In 2012, we committed significant resources to articulate both
the Operating Philosophy and the Operating Principles across
all of AIA’s markets. Workshops were held across the Group
to communicate the principles effectively to all levels of the
organisation. We will ensure that the Operating Principles are
embodied in all of our actions as we continue to create a
distinctive culture and provide opportunities for those new to
AIA to engage with the Group.
During the year, we continued to provide secondment
opportunities for employees to work in countries and in
positions that will broaden their experience with the ultimate
goal of enhancing their skills. In addition, a number of high
potential employees were selected to be transferred or
participate in initiatives within different markets and business
units to help develop their technical and leadership skills and
expand their career opportunities.
ENGAGEMENT WITH CUSTOMERS AND COMMUNITIES
Our core business as a life insurer is to promote the well-
being of customers and communities in the markets we
serve. We contribute to the social and economic development
of these territories and our employees and agents have
engaged in charitable and support activities with great
enthusiasm over the year. 2012 has also seen employee
participation in initiatives to promote “Healthy Living” which
we sponsor to generate awareness of the factors that can
make a difference to quality of life.
AIA is one of the best recognised and most respected brands
in the industry. Our positive operating experience, borne out
by the high persistency levels of our in-force book,
demonstrates the strong level of trust that exists between our
customers and our Group. We are endeavouring to build even
stronger ties through our brand promotion to ensure that AIA
continues to be seen as a company that provides financial
protection for our customers throughout their lives.
OUTLOOK
A clear theme underlies all of the developments I have
described: active executive management working to a
focused development programme and applying common
regional strategies which are customised by expert
and empowered local management teams to local
market conditions.
The progress of the global economy over 2012 remained
subdued and future growth prospects uncertain but there is a
clear differentiation in economic prospects emerging between
Asia and the West with the countries in which AIA operates
well positioned for continued growth.
AIA combines the presence, scale and dependability from a
long history of active engagement across the region with the
innovation, growth and energy of a recently established Asian
group. We believe that this combination of experience,
financial strength, vision and ambition will serve both our
customers and shareholders well in the years to come, as we
continue to grow and deliver value commensurate with the
significant market opportunities.
We have built the momentum: there is a lot more to come!
Mark Edward Tucker
Group Chief Executive and President
27 February 2013

Right Priorities
We have continued to make strong progress in delivering our clear strategic objectives and we are achieving real growth momentum in the business.

Right ThingDoing the

FINANCIAL AND OPERATING REVIEW
AIA Group Limited Annual Report 2012
18
“Our excellent financial results are a testament to the effective execution of our profitable growth strategy and the continuing application of rigorous financial discipline.”
Garth JonesGroup Chief Financial Officer
Financial ReviewFINANCIAL AND OPERATING REVIEW

FIN
AN
CIA
L A
ND
OP
ER
ATI
NG
RE
VIE
WO
VE
RV
IEW
AD
DIT
ION
AL
INF
OR
MA
TIO
NF
INA
NC
IAL
ST
AT
EM
EN
TS
CO
RP
OR
AT
E G
OV
ER
NA
NC
E
19Financial Review
AIA has made strong progress on its strategy of
delivering profitable growth and creating sustainable
value for shareholders with another year of excellent
financial performance.
The Group has continued to build on the outstanding results
achieved in 2011 by delivering growth on all of its key metrics
including a record VONB result – our main measure of value
creation – strong IFRS earnings growth and excellent
embedded value (EV) progression during the year. Our VONB
in 2012 has more than doubled since 2009 and our EV is up
by 50 per cent over the same period.
Our financial results, delivered during a time of global
economic uncertainty, are a testament to both the effective
execution of our profitable growth strategy and the continuing
application of rigorous financial discipline. Equally important,
we have maintained a very strong capital position throughout
this period, which we believe will provide a foundation for the
continuing execution of our strategy of delivering profitable
growth and sustainable value for shareholders.
Summary
VALUE CREATION
VONB grew by 27 per cent compared with 2011 to US$1,188
million net of tax. VONB margin increased by 6.4 percentage
points (pps) to 43.6 per cent and ANP grew by 9 per cent to
US$2,696 million compared with 2011. Underlying ANP
growth was 17 per cent excluding the contribution from the
previously announced single large Australian group insurance
scheme written in the third quarter of 2011.
The excellent VONB result was driven by the Group’s focus
on writing business that meets our profitability targets, while
providing customers with quality products that meet both
their increasing regular savings and protection needs. All of
our major markets contributed to the profitable growth for the
full year, with the exception of our Korean business, which we
continued to reposition over the year with positive results over
the second half of 2012.
EV grew by US$4.2 billion to US$31,408 million at
30 November 2012, an increase of 15 per cent from
US$27,239 million at 30 November 2011.
EV operating profit grew by 12 per cent to US$3,491 million
compared with 2011. The growth was the result of an
increase in the expected return on the higher opening EV to
US$2,192 million, a higher VONB of US$1,188 million and
overall positive operating experience variances and operating
assumption changes which totalled US$111 million.
Non-operating EV movements included positive investment
return variances, negative economic assumption changes and
negative other non-operating variances which totalled
US$715 million. This was partly offset by the payment of
dividends of US$530 million and negative other capital
movements of US$42 million. Foreign exchange movements
benefited the EV by US$535 million.
IFRS PROFIT
Operating profit after tax attributable to shareholders of AIA
Group Limited (OPAT) increased by 12 per cent compared
with 2011 to US$2,159 million. The increase was a result of
overall growth in the business, strong investment income,
effective expense management and a lower effective tax rate.
Net profit attributable to shareholders of AIA Group Limited
increased by 89 per cent compared with 2011 to US$3,019
million. It should be noted that AIA’s IFRS net profit definition
includes the mark-to-market movements from equity
investments. Equity markets in Asia rose significantly in the
second half of 2012 compared with the declines recorded
previously in the second half of 2011. Shareholders’ equity
attributable to shareholders of AIA Group Limited increased
by 25 per cent to US$26,697 million at 30 November 2012
from US$21,313 million at 30 November 2011.

FINANCIAL AND OPERATING REVIEW
AIA Group Limited Annual Report 2012
20
Financial Review
CAPITAL AND DIVIDENDS
At 30 November 2012, the total available regulatory capital for
AIA Co., our main regulated entity, was US$4,811 million,
resulting in a solvency ratio of 353 per cent under the HKICO
basis. This compares with 311 per cent reported at the end of
November 2011. The increase in the solvency ratio over the
full year was a result of positive retained earnings generated
over the year and a reduction in required capital following the
subsidiarisation of our branch operation in Singapore. This
VONB grew by 27 per cent to US$1,188 million, an increase
of US$256 million compared with US$932 million in 2011.
All major markets delivered strong double-digit growth in
VONB with the exception of Korea. We continued to
reposition our Korean business in 2012 and it reported
positive results over the second half of the year with VONB
growth of 9 per cent compared with the same period last
year. Performance in the Group’s Other Markets was
particularly strong with growth of 45 per cent driven by
Indonesia, the Philippines and Taiwan.
was partially offset by the payment of dividends to AIA Group
Limited. The local businesses remitted a net US$1,583 million
of dividends to the Group Corporate Centre in 2012.
The Board of Directors has recommended a final dividend of
24.67 Hong Kong cents per share, subject to shareholders’
approval at the AGM. This brings the total dividend for 2012
to 37.00 Hong Kong cents per share, an increase of 12 per
cent compared with 2011.
New Business Growth
Value of New Business (VONB) and VONB Margin by Segment
2012 2011
US$ millions, unless otherwise stated VONBVONB
Margin VONBVONB
MarginVONB
Change
Hong Kong 366 58.5% 305 56.1% 20%
Thailand 287 53.9% 227 48.8% 26%
Singapore 226 66.8% 164 62.3% 38%
Malaysia 68 45.2% 58 40.7% 17%
China 124 57.5% 102 47.2% 22%
Korea 68 28.4% 74 27.3% (8)%
Other Markets 162 26.3% 112 18.8% 45%
Subtotal 1,301 47.8% 1,042 41.6% 25%
Adjustment to reflect additional Hong Kong reserving and capital requirements (41) n/m (49) n/m n/m
After-tax value of unallocated Group Office expenses (72) n/m (61) n/m n/m
Total 1,188 43.6% 932 37.2% 27%

FIN
AN
CIA
L A
ND
OP
ER
ATI
NG
RE
VIE
WO
VE
RV
IEW
AD
DIT
ION
AL
INF
OR
MA
TIO
NF
INA
NC
IAL
ST
AT
EM
EN
TS
CO
RP
OR
AT
E G
OV
ER
NA
NC
E
21Financial Review
VONB margin improved by 6.4 pps to 43.6 per cent
compared with 37.2 per cent in 2011.
Product and portfolio mix improvements contributed 6.2 pps
of the increase and 1.1 pps came from positive changes in
geographical mix. Assumption changes and other items
reduced the margin by 0.9 pps.
The main drivers of the margin improvement were our
ongoing focus on pricing discipline, new product launches
and the continued shift in product mix towards higher-margin
regular savings, accident and health (A&H) and other
protection business.
The VONB of US$1,188 million is reported after deductions of
US$113 million of which US$41 million is for additional HKICO
reserving and capital requirements and US$72 million for
unallocated Group Office expenses.
Annualised New Premium (ANP) by Segment
US$ millions, unless otherwise stated 2012 2011 YoY
Hong Kong 604 522 16%
Thailand 532 465 14%
Singapore 339 264 28%
Malaysia 151 142 6%
China 215 215 –
Korea 237 270 (12)%
Other Markets 618 594 4%
Total 2,696 2,472 9%
ANP grew by 9 per cent to US$2,696 million compared with
US$2,472 million in 2011. The underlying ANP growth for the
Group was 17 per cent excluding the contribution from the
previously announced single large Australian group insurance
scheme written in 2011.
The ANP result benefited from double-digit growth in
Singapore, Hong Kong and Thailand.
Our focus on VONB growth has shifted our product mix
towards higher-margin A&H covers and other protection
products that typically have lower average ANP case sizes.
This was particularly evident in China where ANP growth
remained flat as a result of selling more of these protection
products and less lower-margin business. The Group’s overall
ANP growth rate was also impacted by the continued
repositioning of our distribution model in Korea.

FINANCIAL AND OPERATING REVIEW
AIA Group Limited Annual Report 2012
22
Financial Review
Embedded Value (EV)An analysis of the movements in EV is as follows:
2012
US$ millions, unless otherwise stated ANW VIF EV
Opening embedded value 10,906 16,333 27,239
Value of new business (924) 2,112 1,188
Expected return on EV 2,807 (615) 2,192
Operating experience variances (116) 256 140
Operating assumption changes (20) (9) (29)
EV operating profit 1,747 1,744 3,491
Investment return variances 554 379 933
Effect of changes in economic assumptions – (105) (105)
Other non-operating variances 410 (523) (113)
Total EV profit 2,711 1,495 4,206
Dividends (530) – (530)
Other capital movements (42) – (42)
Effect of changes in exchange rates 125 410 535
Closing embedded value 13,170 18,238 31,408
2011
US$ millions, unless otherwise stated ANW VIF EV
Opening embedded value 9,524 15,224 24,748
Value of new business (807) 1,739 932
Expected return on EV 2,643 (614) 2,029
Operating experience variances (141) 306 165
Operating assumption changes 5 (26) (21)
EV operating profit 1,700 1,405 3,105
Investment return variances (114) (183) (297)
Effect of changes in economic assumptions – (26) (26)
Other non-operating variances 116 (98) 18
Total EV profit 1,702 1,098 2,800
Dividends (170) – (170)
Other capital movements (89) – (89)
Effect of changes in exchange rates (61) 11 (50)
Closing embedded value 10,906 16,333 27,239

FIN
AN
CIA
L A
ND
OP
ER
ATI
NG
RE
VIE
WO
VE
RV
IEW
AD
DIT
ION
AL
INF
OR
MA
TIO
NF
INA
NC
IAL
ST
AT
EM
EN
TS
CO
RP
OR
AT
E G
OV
ER
NA
NC
E
23Financial Review
EV grew by US$4.2 billion to US$31,408 million at
30 November 2012, an increase of 15 per cent from
US$27,239 million at 30 November 2011.
EV operating profit grew by 12 per cent to US$3,491 million
compared with 2011. The growth was the result of an
increase in the expected return on the higher opening EV to
US$2,192 million, a higher VONB of US$1,188 million and
positive operating experience variances of US$140 million
offset by negative operating assumption changes of
US$29 million.
The positive operating experience variances of US$140 million
have arisen as a result of favourable actual experience in
mortality, morbidity, persistency and other variances of
US$163 million compared with the assumptions used in the
EV calculation. This was partly offset by an expense variance
of US$(23) million.
Non-operating EV movements included positive investment
return variances of US$933 million from strong capital market
performance partially offset by statutory reserve movements;
negative changes in economic assumptions of US$105 million
from lower interest rates; and negative other non-operating
variances of US$113 million. The EV also included the
dividend payment to shareholders of US$530 million, negative
other capital movements of US$42 million and positive foreign
exchange movements of US$535 million.
EV includes adjusted net worth (ANW) and the value of
in-force business (VIF). The ANW increased by 21 per cent to
US$13,170 million at 30 November 2012 from US$10,906
million at 30 November 2011. The ANW figure includes a
deduction of US$8,578 million for additional reserves for the
HKICO basis above local statutory requirements.
After the cost of holding required capital, VIF increased by
12 per cent to US$18,238 million at 30 November 2012,
compared with US$16,333 million at 30 November 2011.
Total undiscounted after-tax distributable earnings of
US$11,870 million are expected to emerge from the VIF over
the next five years from 2013 through to 2017.
The total EV includes a deduction of US$3,633 million to
reflect the effect of the additional HKICO reserving and capital
requirements above local statutory requirements and the
after-tax value of unallocated Group Office expenses.
IFRS Profit
IFRS Operating Profit Before Tax (OPBT) by Segment
US$ millions, unless otherwise stated 2012 2011 YoY
Hong Kong (1) 796 750 6%
Thailand 604 560 8%
Singapore 393 391 1%
Malaysia 186 166 12%
China 180 140 29%
Korea 164 153 7%
Other Markets 283 248 14%
Group Corporate Centre (1) 45 (27) n/m
Total 2,651 2,381 11%
Note:
(1) Results of certain internal reinsurance have been reclassified from the Hong Kong segment to the Group Corporate Centre in 2011 to conform to the current year presentation. As a result, operating profit before tax for the Hong Kong segment has decreased by US$42 million and the Group Corporate Centre has increased by US$42 million for 2011. The reclassification has no impact on the total operating profit before tax of the Group in 2011.

FINANCIAL AND OPERATING REVIEW
AIA Group Limited Annual Report 2012
24
Financial Review
The Group’s OPBT increased by 11 per cent to US$2,651
million compared with 2011 as a result of overall business
growth, favourable investment income and disciplined
expense management. OPBT growth in Hong Kong, Thailand
and Singapore was reduced by lower investment income
following dividends remitted to the Group Corporate Centre.
China’s OPBT increased by 29 per cent as a result of
underlying business growth, effective expense control and
increased investment income. Other Markets’ OPBT
increased by 14 per cent from strong growth in Indonesia and
the Philippines, partly offset by unfavourable claims
experience in Australia as disclosed previously.
The OPBT for the Group Corporate Centre has increased to
US$45 million compared with a loss of US$27 million in 2011
as a result of higher investment income on increased
dividends remitted from the local business units and
disciplined expense management.
IFRS Operating Profit After Tax (OPAT) (1) by Segment
US$ millions, unless otherwise stated 2012 2011 YoY
Hong Kong (2) 732 694 5%
Thailand 452 395 14%
Singapore 332 336 (1)%
Malaysia 142 133 7%
China 151 119 27%
Korea 125 124 1%
Other Markets 207 165 25%
Group Corporate Centre (2) 18 (44) n/m
Total 2,159 1,922 12%
Notes:
(1) Attributable to shareholders of AIA Group Limited.
(2) Results of certain internal reinsurance have been reclassified from the Hong Kong segment to the Group Corporate Centre in 2011 to conform to the current period presentation. As a result, operating profit after tax for the Hong Kong segment has decreased by US$42 million and the Group Corporate Centre has increased by US$42 million for 2011. The reclassification has no impact on the total operating profit after tax of the Group in 2011.
The Group’s OPAT increased by 12 per cent to US$2,159
million compared with 2011, largely attributable to the growth
in OPBT as discussed above, as well as a lower effective tax
rate primarily from a reduction in the corporate tax rate in
Thailand from 30 per cent to 23 per cent, partly offset by a
higher effective tax rate in Korea from 22 per cent to 24.2 per
cent. The corporate tax rate in Thailand is expected to further
reduce to 20 per cent for assessment years 2013 and 2014
and is assumed to be 30 per cent from assessment year
2015 onward.

FIN
AN
CIA
L A
ND
OP
ER
ATI
NG
RE
VIE
WO
VE
RV
IEW
AD
DIT
ION
AL
INF
OR
MA
TIO
NF
INA
NC
IAL
ST
AT
EM
EN
TS
CO
RP
OR
AT
E G
OV
ER
NA
NC
E
25Financial Review
Total Weighted Premium Income (TWPI) by Segment
US$ millions, unless otherwise stated 2012 2011 YoY
Hong Kong 3,372 3,142 7%
Thailand 3,119 2,976 5%
Singapore 2,035 1,949 4%
Malaysia 964 928 4%
China 1,446 1,313 10%
Korea 1,942 2,029 (4)%
Other Markets 2,482 2,105 18%
Total 15,360 14,442 6%
TWPI increased by 6 per cent to US$15,360 million, reflecting
growth in all our markets except in Korea where we continued
Investment Income (1)
US$ millions, unless otherwise stated 2012 2011 YoY
Interest income 3,864 3,574 8%
Dividend income 316 296 7%
Rental income 97 76 28%
Total 4,277 3,946 8%
Note:
(1) Excluding unit-linked contracts
Investment income increased by 8 per cent to US$4,277
million compared with 2011, reflecting the higher level of
invested assets at the start of 2012. Rental income increased
to reposition the business. Persistency remained strong and
stable at 94.2 per cent in 2012.
by 28 per cent as a result of the increase in investment
property held at the beginning of 2012 and higher rental yields
achieved over the year.

FINANCIAL AND OPERATING REVIEW
AIA Group Limited Annual Report 2012
26
Financial Review
Operating Expenses
US$ millions, unless otherwise stated 2012 2011 YoY
Operating expenses 1,340 1,253 7%
Operating expenses increased by 7 per cent to US$1,340
million compared with 2011. The expense ratio was
maintained at 8.7 per cent in 2012, reflecting effective
expense management across all regions.
Net Profit (1)
US$ millions, unless otherwise stated 2012 2011 YoY
OPAT 2,159 1,922 12%
Net gains/(losses) from equities, net of tax 787 (207) n/m
Other non-operating investment experience and other items, net of tax 73 (115) n/m
Total 3,019 1,600 89%
Note:
(1) Attributable to shareholders of AIA Group Limited.
Net profit attributable to shareholders of AIA Group Limited
increased by 89 per cent to US$3,019 million in 2012,
reflecting the growth in OPAT described above and the
significant gains from positive mark-to-market movements in
equity investments in 2012 compared with negative
movements in 2011.
SENSITIVITIES
Sensitivities to profit before tax and net assets arising from
foreign exchange rate, interest rate, and equity market risk are
included in note 36 to the financial statements.

FIN
AN
CIA
L A
ND
OP
ER
ATI
NG
RE
VIE
WO
VE
RV
IEW
AD
DIT
ION
AL
INF
OR
MA
TIO
NF
INA
NC
IAL
ST
AT
EM
EN
TS
CO
RP
OR
AT
E G
OV
ER
NA
NC
E
27Financial Review
Earnings Per Share – Diluted
Net Profit (1) OPAT (1)
2012 2011 2012 2011
Profit (US$m) 3,019 1,600 2,159 1,922
Weighted average number of ordinary shares (millions) (2) (3) 12,008 12,032 12,008 12,032
Diluted earnings per share (US cents) (3) 25.1 13.3 18.0 16.0
Notes:
(1) Attributable to shareholders of AIA Group Limited.
(2) The decrease in weighted average number of ordinary shares outstanding compared with 2011 was primarily a result of the purchase of shares held by employee share-based trusts.
(3) Diluted earnings per share including the dilutive effects, if any, of the awards of share options, restricted share units, restricted stock purchase units and restricted stock subscription units granted to eligible employees, directors, officers and agents under the share-based compensation plans as described in note 38 to the financial statements.
Earnings Per Share – Basic
Net Profit (1) OPAT (1)
2012 2011 2012 2011
Profit (US$m) 3,019 1,600 2,159 1,922
Weighted average number of ordinary shares (millions) (2) 11,997 12,031 11,997 12,031
Basic earnings per share (US cents) 25.2 13.3 18.0 16.0
Notes:
(1) Attributable to shareholders of AIA Group Limited.
(2) The decrease in weighted average number of ordinary shares outstanding compared with 2011 was primarily a result of the purchase of shares held by employee share-based trusts.
Earnings Per Share (EPS)EPS based on net profit attributable to shareholders of
AIA Group Limited increased to 25.2 US cents in 2012 from
13.3 US cents in 2011.
OPAT EPS increased to 18.0 US cents in 2012 from 16.0 US
cents in 2011.

FINANCIAL AND OPERATING REVIEW
AIA Group Limited Annual Report 2012
28
Financial Review
Balance Sheet
Consolidated Statement of Financial Position
US$ millions, unless otherwise stated
As at 30 November
2012
As at 30 November
2011 YoY
Assets
Financial investments 111,581 92,254 21%
Investment property 1,035 896 16%
Cash and cash equivalents 2,948 4,303 (31)%
Invested assets 115,564 97,453 19%
Deferred acquisition and origination costs 14,161 12,818 10%
Other assets 4,714 4,190 13%
Total assets 134,439 114,461 17%
Liabilities
Insurance and investment contract liabilities 99,439 87,112 14%
Borrowings 766 559 37%
Other liabilities 7,406 5,375 38%
Less total liabilities 107,611 93,046 16%
Equity
Total equity 26,828 21,415 25%
Less: non-controlling interests 131 102 28%
Total equity attributable to shareholders of AIA Group Limited 26,697 21,313 25%

FIN
AN
CIA
L A
ND
OP
ER
ATI
NG
RE
VIE
WO
VE
RV
IEW
AD
DIT
ION
AL
INF
OR
MA
TIO
NF
INA
NC
IAL
ST
AT
EM
EN
TS
CO
RP
OR
AT
E G
OV
ER
NA
NC
E
29Financial Review
ASSETS
Total assets grew by 17 per cent to US$134,439 million at
30 November 2012 compared with US$114,461 million as at
30 November 2011, reflecting the growth in the overall
business and positive capital market movements.
Cash and cash equivalents decreased to US$2,948 million at
30 November 2012 compared with US$4,303 million at
30 November 2011, reflecting increased investments in
financial assets and the payment of dividends totalling
US$530 million.
Deferred acquisition and origination costs increased to
US$14,161 million at 30 November 2012 compared with
US$12,818 million at 30 November 2011, reflecting the
growth in the business.
LIABILITIES
Total liabilities increased by 16 per cent to US$107,611 million
at 30 November 2012 compared with US$93,046 million at
30 November 2011. Insurance and investment contract
liabilities increased to US$99,439 million at 30 November 2012
compared with US$87,112 million at 30 November 2011,
reflecting the growth of the in-force portfolio.
Other liabilities increased by 38 per cent to US$7,406 million at
30 November 2012 mainly from the US$1,122 million increase
in obligations under securities lending and repurchase
agreements, US$419 million increase in deferred tax liabilities
primarily related to the increase in the valuation of the
investment portfolio, US$321 million increase in payables to
financial institutions in respect of cash collateral received from
derivative transactions and US$145 million increase in payables
from purchases of investments.
Details of contingencies are included in note 41 to the
financial statements.
Equity – Movement in Shareholders’ Equity of AIA Group Limited
US$ millions, unless otherwise stated 2012 2011
Opening shareholders’ equity 21,313 19,555
Net profit 3,019 1,600
Fair value gains on assets 2,565 500
Foreign currency translation adjustments 372 (83)
Purchase of shares held by employee share-based trusts (84) (105)
Dividends (530) (170)
Other capital movements 42 16
Total movement in shareholders’ equity 5,384 1,758
Closing shareholders’ equity 26,697 21,313
Shareholders’ equity excluding non-controlling interests
increased by 25 per cent over 2011 to US$26,697 million
at 30 November 2012 compared with US$21,313 million at
30 November 2011. This increase was mainly made up of
net profit of US$3,019 million, fair value gains on assets of
US$2,565 million primarily reflecting increased fixed income
asset values, an increase in foreign currency translation
reserves of US$372 million less the payment of dividends
totalling US$530 million.

FINANCIAL AND OPERATING REVIEW
AIA Group Limited Annual Report 2012
30
Financial Review
Total Invested Assets
US$ millions, unless otherwise stated
As at 30 November
2012Percentage
of total
As at 30 November
2011Percentage
of total
Total policyholder and shareholder 98,240 85% 82,284 84%
Total unit-linked contracts 17,324 15% 15,169 16%
Total invested assets 115,564 100% 97,453 100%
Details of the investment mix are as follows:
Policyholder and Shareholder Invested Assets
US$ millions, unless otherwise stated
As at 30 November
2012Percentage
of total
As at 30 November
2011Percentage
of total
Participating funds
Government and government agency bonds 6,011 6% 5,640 7%
Corporate bonds and structured securities 9,842 10% 8,097 10%
Loans and deposits 1,303 2% 1,026 1%
Subtotal – Fixed income investments 17,156 18% 14,763 18%
Equities 3,534 4% 2,777 3%
Cash and cash equivalents 316 – 481 1%
Derivatives 317 – 367 –
Investment property 15 – 11 –
Subtotal participating funds 21,338 22% 18,399 22%
Other policyholder and shareholder
Government and government agency bonds 32,072 33% 27,379 33%
Corporate bonds and structured securities 30,893 31% 24,445 30%
Loans and deposits 5,047 5% 3,396 4%
Subtotal – Fixed income investments 68,012 69% 55,220 67%
Equities 5,656 6% 4,388 6%
Cash and cash equivalents 1,897 2% 3,034 4%
Derivatives 317 – 358 –
Investment property 1,020 1% 885 1%
Subtotal other policyholder and shareholder 76,902 78% 63,885 78%
Total policyholder and shareholder 98,240 100% 82,284 100%
Invested AssetsThe carrying value of our invested assets, including financial
investments, investment property and cash and cash
equivalents, increased by 19 per cent to US$115,564 million
at 30 November 2012 compared with US$97,453 million
at 30 November 2011. Invested assets include total assets
held in respect of shareholders and policyholders, and
unit-linked contracts.

FIN
AN
CIA
L A
ND
OP
ER
ATI
NG
RE
VIE
WO
VE
RV
IEW
AD
DIT
ION
AL
INF
OR
MA
TIO
NF
INA
NC
IAL
ST
AT
EM
EN
TS
CO
RP
OR
AT
E G
OV
ER
NA
NC
E
31Financial Review
Unit-linked Contracts
US$ millions, unless otherwise stated
As at 30 November
2012Percentage
of total
As at 30 November
2011Percentage
of total
Unit-linked contracts
Debt securities 2,044 12% 2,391 16%
Loans and deposits 75 – 143 1%
Equities (1) 14,466 84% 11,847 78%
Cash and cash equivalents 735 4% 788 5%
Derivatives 4 – – –
Total unit-linked contracts 17,324 100% 15,169 100%
Note:
(1) Including third-party interests in equities.
Invested assets held in respect of policyholders and
shareholders increased to US$98,240 million at 30 November
2012 compared with US$82,284 million at 30 November 2011
mainly as a result of the growth in the portfolio and the
investment of operating cash flows arising from the business
over the year, and positive mark-to-market movements.
Fixed income investments, including debt securities,
loans, and term deposits, held in respect of policyholders
and shareholders, totalled US$85,168 million at
30 November 2012 compared with US$69,983 million at
30 November 2011.
Government and government agency bonds represented
45 per cent of our fixed income investments at 30 November
2012 compared with 47 per cent at 30 November 2011.
Corporate bonds and structured securities accounted for
48 per cent of fixed income investments at 30 November 2012
compared with 46 per cent at 30 November 2011.
Total equity securities held in respect of policyholders and
shareholders totalled US$9,190 million at 30 November 2012,
compared with US$7,165 million at 30 November 2011. The
increase in carrying value was attributable to new purchases
as well as an increase in market value. Equity securities
totalling US$3,534 million were held in participating funds.
Cash and cash equivalents held in respect of policyholders
and shareholders totalled US$2,213 million at 30 November
2012 compared with US$3,515 million at 30 November 2011.
Invested assets held in respect of unit-linked contracts
totalled US$17,324 million at 30 November 2012 compared
with US$15,169 million at 30 November 2011.
Capital
FREE SURPLUS GENERATION
The Group’s free surplus at 30 November 2012 represented
the excess of adjusted net worth over the required capital.
Free surplus increased to US$6,643 million at 30 November
2012, as a result of free surplus generation of US$2,845
million from our in-force book, less US$1,412 million of
investment in new business growth, US$148 million of
unallocated Group Office expenses and the payment of
dividends totalling US$530 million and other capital
movements of US$42 million.

FINANCIAL AND OPERATING REVIEW
AIA Group Limited Annual Report 2012
32
Financial Review
The following table shows the change in free surplus:
US$ millions, unless otherwise stated 2012 2011
Opening free surplus 5,930 4,992
Free surplus generated 2,845 2,485
Free surplus used to fund new business (1,412) (1,140)
Unallocated Group Office expenses (148) (148)
Dividends (530) (170)
Other capital movements (42) (89)
Closing free surplus 6,643 5,930
NET FUNDS TO GROUP CORPORATE CENTRE
Business units remitted US$1,583 million of net dividends to
the Group Corporate Centre. Working capital comprises debt
and equity securities, deposits and cash and cash equivalents
US$ millions, unless otherwise stated 2012 2011
Opening working capital 3,912 2,180
Group Corporate Centre net profit/(loss) (1) 26 (129)
Capital flows from business units
Hong Kong(1) 1,104 1,058
Thailand 503 401
Singapore 23 618
Malaysia 98 120
China (100) (80)
Other Markets (45) 26
Net funds remitted to Group Corporate Centre 1,583 2,143
Change in fair value reserve 217 (18)
Payment of dividends (530) (170)
Purchase of shares held by employee share-based trusts (84) (105)
Change in share-based compensation reserve 41 16
Other changes in working capital 20 (5)
Closing working capital 5,185 3,912
Note:
(1) Results of certain internal reinsurance have been reclassified from the Hong Kong segment to the Group Corporate Centre in 2011 to conform to the current year presentation. As a result, net loss in the Group Corporate Centre has reduced by US$42 million and the capital flow from the Hong Kong segment has decreased by US$42 million for 2011.
held by Group Corporate Centre. Working capital, after
payment of dividends, was US$5,185 million at 30 November
2012 compared with US$3,912 million at 30 November 2011.
The movements in working capital are summarised as follows:

FIN
AN
CIA
L A
ND
OP
ER
ATI
NG
RE
VIE
WO
VE
RV
IEW
AD
DIT
ION
AL
INF
OR
MA
TIO
NF
INA
NC
IAL
ST
AT
EM
EN
TS
CO
RP
OR
AT
E G
OV
ER
NA
NC
E
33Financial Review
Regulatory CapitalThe Group’s lead insurance regulator is the Hong Kong Office
of the Commissioner of Insurance (HKOCI). The Group’s
principal operating company is AIA Co., a Hong Kong-
domiciled insurer. At 30 November 2012, the total available
regulatory capital for AIA Co. amounted to US$4,811 million
as measured under the HKICO basis. AIA Co. has a solvency
ratio of 353 per cent of the minimum regulatory capital
requirement. This compares with 311 per cent reported as at
the end of November 2011.
The increase in the solvency ratio over the full year was a
result of the positive retained earnings generated over the
year and a reduction in required capital following the
subsidiarisation of our branch operation in Singapore.
This was partially offset by the payment of dividends to
AIA Group Limited.
A summary of the total available regulatory capital and
solvency ratios of AIA Co. is as follows:
US$ millions, unless otherwise stated
As at 30 November
2012
As at 30 November
2011
Total Available Regulatory Capital 4,811 6,168
Regulatory Minimum Required Capital (100%) 1,362 1,984
Solvency ratio (%) 353% 311%
AIA has given an undertaking to the HKOCI that it will
maintain a solvency ratio of not less than 150 per cent in each
of AIA Co. and AIA-B. The Group’s individual branches and
subsidiaries are also subject to supervision in the jurisdictions
in which they operate. This means that local operating units,
including branches and subsidiaries, must meet the regulatory
capital requirements of their local prudential regulators. The
various regulators overseeing the Group’s branches and
subsidiaries actively monitor their capital position. The local
operating units were in compliance with the capital
requirements of their respective local regulators in each of our
geographical markets at 30 November 2012.
Inaugural Offering of Medium Term NotesAt the time of the acquisition of ING Malaysia in October 2012
we stated that we intended to refinance the acquisition
through an efficient financing structure comprising a
combination of internal cash resources and debt issuance.
We established a US$2 billion Medium Term Note (MTN)
programme on 27 February 2013 and successfully completed
an inaugural offering of US$1 billion of senior unsecured fixed
rate notes in March 2013. The proceeds from the notes will
be used to refinance the unsecured credit facility associated
with the acquisition.
Credit RatingsAt 30 November 2012, AIA Co. has published financial
strength ratings of AA- (Very Strong) from Standard & Poor’s
with a stable outlook.
DividendsThe Board of Directors has recommended a final dividend of
24.67 Hong Kong cents per share, subject to shareholders’
approval at the AGM. This brings the total dividend for 2012
to 37.00 Hong Kong cents per share, an increase of 12 per
cent compared with 2011.

FINANCIAL AND OPERATING REVIEW
AIA Group Limited Annual Report 2012
34
Business ReviewFINANCIAL AND OPERATING REVIEW
Distribution
AGENCY
AIA’s proprietary tied agency channel is our core distribution
platform developed over AIA’s many decades of successful
operations in Asia. The regular personal interaction that our
agents have with our customers enables us to understand
and meet their evolving regular savings and financial
protection needs and is a fundamental competitive advantage
for the Group.
Agency generated US$939 million of VONB representing 73
per cent of the Group’s total in 2012. The growth in agency-
generated VONB reflected our strategy of improving agent
quality and activity levels. It also demonstrates our focus on
writing business that meets both our customers’ needs and
our return targets, as demonstrated by the 4.6 pps
improvement in agency VONB margin to 54.0 per cent
compared with 49.4 per cent in 2011.
Our principal agency distribution strategy is to develop
the Premier Agency force in Asia to achieve best-in-class
activity levels, scale, productivity and profitability through
market-leading recruitment and training. In 2012, AIA Premier
Academy, our local market agency education and
development facility, broadened its scope to support the
recruitment of high calibre candidates. Through AIA’s
strategic partnership with LIMRA, a worldwide leader in
training and recruitment selection for the insurance industry,
we have introduced profiling tools across nine of our markets
to identify and select leading candidates as well as further
strengthening new agent induction programmes in each
market. The overall result is a 7 per cent increase in the
number of active agents compared with 2011.
At the same time as improving the quality of recruitment
programmes, we have focused on driving increases in agent
activity and productivity. AIA Premier Academy has
implemented training roadmaps designed for each local
market to provide tailored and motivational development
opportunities for new, experienced and Premier Agents.
Training programmes have been deployed not only to give our
agents more advanced sales and advisory skills but also to
enhance the capabilities of our agency leaders.
The development of Premier Agents requires best-in-class
leadership. In 2012, we began to adopt a new structured
approach to this process by establishing a Leader
Assessment Centre, initially covering four markets, to identify
potential new leaders. We also launched a LIMRA Regional
Officers School to equip our agency officers with improved
management skills to motivate the agency force to achieve
higher productivity and recruitment levels. In addition,
selected Premier Agency leaders attended the inaugural
Premier Agency Leaders Summit in Bangkok in 2012 to
undertake a tailored learning and agency development
programme aimed at building their businesses.
AIA continued to roll out iPoS, its industry-leading interactive
point-of-sale technology, described in greater detail in the
Technology and Operations section. Through the use of iPad
mobile devices, iPoS enables our agents to provide
customers with an engaging and unique sales experience
using a medium with which customers are increasingly familiar
and comfortable.
Developing Million Dollar Round Table (MDRT)
qualifiers continues to be our benchmark for
the Premier Agency strategy as evidenced by
AIA’s continued Platinum sponsorship of the
“MDRT Experience” in Asia. We organised
additional regional events to recognise sales
excellence such as the inaugural President’s
Club Convention, hosted by AIA’s Group senior
executive team. This exclusive event is
designed for the top Premier Agency Leaders
and Premier Agents to recognise their
contribution and motivate them to develop
greater numbers of MDRTs. As a result of our
initiatives, our MDRT qualifiers grew by 11 per
cent compared with 2011.Selected Premier Agency leaders attended the inaugural Premier Agency Leaders Summit in Bangkok to undertake a tailored learning and agency development programme.

FIN
AN
CIA
L A
ND
OP
ER
ATI
NG
RE
VIE
WO
VE
RV
IEW
AD
DIT
ION
AL
INF
OR
MA
TIO
NF
INA
NC
IAL
ST
AT
EM
EN
TS
CO
RP
OR
AT
E G
OV
ER
NA
NC
E
35Business Review
AIA PARTNERS
AIA’s partnership team “AIA Partners” is responsible for
creating and expanding value through bancassurance, direct
marketing and other intermediated distribution channels. In
2012, AIA Partners continued to implement our strategy of
improving the quality of service and products to meet the
evolving needs of our customers and to improve the
economic returns for both our partners and AIA. We have
continued to pursue new growth opportunities that meet our
profitability targets, resulting in the expansion of certain
existing partnerships and the signing of a number of new
partnership agreements around the region.
Our comprehensive approach to building partnerships has
yielded strong results, with AIA’s partnership business
accounting for US$348 million of VONB or 27 per cent of the
Group’s VONB for 2012. This represents growth of 59 per
cent compared with 2011. The increase is a function of a
strong improvement in our VONB margin of 10.0 pps to 36.4
per cent and ANP growth of 15 per cent to US$958 million.
Bancassurance
AIA’s bancassurance platform reported a very strong
performance in 2012 with robust new business growth from
both our local partners and regional relationships. In addition
to building growth momentum with our existing bank
partners, we entered into significant new long-term
bancassurance agreements with Public Bank in Malaysia and
National Development Bank in Sri Lanka. We maintained our
financially disciplined approach to sales management in
collaboration with our bancassurance partners, producing a
VONB result of more than twice the amount reported in 2011.
Other Partnership Channels
Other partnership channels, including private banks,
independent financial advisers (IFAs), brokers and specialist
advisers, showed strong growth, particularly in the high-net-
worth (HNW) customer segment. As a leading independent
life risk specialist, AIA’s Australian business also experienced
significant year-on-year growth in the region’s largest IFA
market, through the launch of a new adviser value proposition
and with the introduction of an award-winning product.
Overall growth in our direct marketing channel remained
steady across the region as a result of continuing investment
in our people, processes and technologies, particularly in
Korea. The restructuring of our direct marketing operation in
Korea has been progressing to plan with the intention of
driving high-quality new business growth in the future. We
have also seen strong new sales growth in our direct
marketing business in Malaysia, Taiwan and Thailand.
GROUP INSURANCE
AIA has been supporting clients ranging from small-and-
medium sized enterprises (SME), local domestic and
multinational companies and their group members for over six
decades. We are a leading provider of group insurance in the
Asia-Pacific region, with over 100,000 corporate clients and
more than 13 million group insurance scheme members.
Rapid economic development in Asian labour markets
continued to drive demand for group insurance solutions as
employers seek to attract and retain the most talented
employees resulting in double-digit sector growth rates
across the Asia-Pacific region. Notwithstanding this recent
growth, overall penetration levels and coverage at this stage
of Asia’s development remain significantly behind those in
more developed markets such as the United States,
demonstrating the considerable potential for expansion of
this market.
In 2012, our focus was to reinforce AIA’s market-leading
positions in Australia and Singapore and to strengthen
significantly our capabilities in other markets. We expanded
our relationships with business partners by focusing on
best-in-class service through our Regional Employee Benefits
Partnership Platform and continuing to leverage AIA’s strong
agency distribution to increase our penetration in the
SME segment.
New simplified packaged products designed specifically for
the agency market were introduced to simplify the sales
process alongside training and incentives targeted at
leveraging agents’ relationships with SME business owners.
As a result, the number of agents selling group insurance
cases increased by 38 per cent and the success of our
initiatives resulted in VONB growth of 25 per cent compared
with 2011.
Note:
VONB and VONB margin by distribution channel are based on local statutory reserving and capital requirements and exclude corporate pension business.

FINANCIAL AND OPERATING REVIEW
AIA Group Limited Annual Report 2012
36
Business Review
MarketingAIA’s marketing philosophy reflects that of the wider
organisation, where our pan-Asian strength and technical
knowledge is leveraged to empower our local businesses
with the best practices and support they need in order to
deliver outstanding products, advice and levels of service to
our customers.
AIA is one of the strongest and most respected insurance
brands in the industry. During the year, we have worked
to ensure that the AIA brand continues to resonate in a
relevant way with our customers in support of AIA’s
significant growth opportunities.
ENHANCING THE CUSTOMER ExPERIENCE
One of our marketing objectives is to maintain a high level of
engagement with our customers. We have extended our
Customer Experience Programme, launched in 2011, to 10 of
our major markets. An important input to this programme has
been the creation of detailed customer and distributor
analytical tools, allowing us to gather information from our
customers, agents and partners that we integrate into
strategic initiatives such as the launch of iPoS.
Our increasingly sophisticated use of customer data helps us
to improve the areas of service that matter most to our
customers. Front-line staff development centres have been
established to drive service excellence in our call centres and
our branches. Our efforts were rewarded in China with The
Best Call Centre Award for the third consecutive year and in
Hong Kong with four awards from the Hong Kong Association
for Customer Service Excellence. The CURe Project industry
benchmarking report in Australia recognised AIA as the best
service provider for group insurance underwriting and claims
in the market.
In addition, training modules in customer relationship
management for our agents have also been developed.
Results show that this systematic focus on the customer
experience is already producing results with up to four times
as much additional new premium generated from highly
engaged customers as from those who are less engaged.
We systematically monitor our progress to ensure that
business improvement decisions are based on creating the
highest customer value in the most efficient way for AIA, our
agents and our partners.
OPTIMISING THE VALUE OF OUR CUSTOMER BASE
AIA’s large customer base of over 25 million individual policies
and over 13 million group insurance scheme members is a
key competitive advantage and source of future value for the
Group. A sizeable proportion of our new business premium in
2012 came from existing customers as our agents helped
them address their ongoing savings and protection needs.
During 2012, we undertook a series of marketing
programmes focused on helping our agents to identify
opportunities within our existing customer base. Using
customer analytics, our marketing teams generated customer
leads based on savings and protection product gap
opportunities.
By way of example, our Hong Kong team utilised an
advanced customer segmentation analysis to launch targeted
marketing campaigns to existing customers. The campaigns
generated conversion rates two-thirds higher than other
campaigns using a mass market, single communication
approach.
There is much more that we can do to optimise the value of
AIA’s large customer base but the initial results in 2012 were
positive with an additional 500,000 policies sold.
DELIVERING THE RIGHT PRODUCTS
In 2012, we continued to focus on raising awareness of the
protection gap – the difference between the amount of life
and health insurance coverage our customers’ need and the
amount that they actually have – in all of our markets across
the region. This message has been supported by the
development of innovative products to address these
protection needs.

FIN
AN
CIA
L A
ND
OP
ER
ATI
NG
RE
VIE
WO
VE
RV
IEW
AD
DIT
ION
AL
INF
OR
MA
TIO
NF
INA
NC
IAL
ST
AT
EM
EN
TS
CO
RP
OR
AT
E G
OV
ER
NA
NC
E
37Business Review
In addition to coverage for premature death, we have
highlighted the importance of protection against the financial
consequences of accidents, critical illnesses and disabilities.
We have developed several new standalone accident and
health plans to enhance our ability to meet our customers’
protection needs while also improving our margins. These
include a first-to-market cradle-to-grave critical illness plan in
Thailand; an early payment version of our market-leading
critical illness plan in Hong Kong; as well as a disability
income plan in Singapore with a number of distinct features
including an innovative rehabilitation benefit.
We do not focus solely on protection provision. We also see a
major aspect of our business as providing our customers with
products to meet their long-term wealth creation goals. We
offer a suite of medium- to long-term regular premium
products with a choice of traditional and participating
investment options. These are designed to target the range of
savings goals over our customers’ lifetimes from the provision
of education savings plans for young families to pre- and
post-retirement accumulation products to provide security in
older age. We continued to roll out and enhance our next
generation unit-linked products which combine efficient
regular savings with comprehensive coverage against death,
critical illness and disability.
EMBRACING SOCIAL MEDIA
We believe that AIA is well-positioned to align customers’
increasing use of social media with their important and
continuing desire for face-to-face advice and support
provided through our agency sales channel. As of the end of
2012, AIA had corporate social media sites in markets across
the region resulting in more than 100,000 Facebook friends.
One example of how we are using online channels as a
means of engaging with customers is an e-store we have
launched in China. In addition to offering customers the
choice and convenience of buying some products over the
Internet, the “e-store” provides customers with the
opportunity to be contacted by a sales agent.
Our aim is to integrate opportunities for customer
engagement through social and digital media within our total
channel offering, providing our customers with the widest
possible opportunity to engage with AIA.
We continued to develop innovative products to address the needs for protection and offer a suite of products to our customers to meet their long-term wealth creation goals.
We have launched e-Store in China offering customers the choice and convenience of buying some products over the Internet and providing them with the opportunity to be contacted by a sales agent.

FINANCIAL AND OPERATING REVIEW
AIA Group Limited Annual Report 2012
38
Business Review
Technology and OperationsIn 2012, we continued to deliver improved operating
efficiencies, customer experiences and economies of scale.
Key initiatives in technology and operations during the year
included:
• Enhancing the productivity and effectiveness of business
processes in many of our markets;
• Improving the efficiency and service quality of our shared
service operations in China and Malaysia;
• Empowering our agency force with advanced electronic
point-of-sale tools including electronic submission of policy
application and e-signature capabilities to enhance
customer experience and simplify the sales process; and
• Implementing an enterprise-wide social network for
employees to encourage collaboration and rapid
dissemination of best practices throughout the
organisation.
Even after taking into account our ongoing investment in
technology in 2012, these initiatives contributed to the
maintenance of our overall expense ratio at 8.7 per cent,
amongst the lowest expense ratios in the region in 2012.
OPERATIONAL TRANSFORMATION
AIA has improved efficiency through implementing innovative
systems, modernising facilities and processes, and
introducing more customer-centric services. We have seen
significant improvements in productivity and service speed,
quality and scope across the region as a result of these efforts
during 2012.
For example, a business process re-engineering initiative
helped reduce turnaround times of new policies issued in
Indonesia by 15 per cent; a similar initiative in China boosted
productivity by 13 per cent in underwriting, 25 per cent in
claims and 45 per cent in policyowner services.
To build on the new underwriting framework implemented in
2011, we commenced a group-wide programme in 2012 to
revise our underwriting guidelines to support our protection
strategy and help our customers receive the level of
protection they need. Initial work completed in Singapore,
Hong Kong and Thailand has resulted in over 60 initiatives
being implemented to improve our underwriting
competitiveness while maintaining our risk tolerances. This
ongoing programme has been actively supported by our
reinsurance partners.
SHARED SERVICE CENTRES
Our investments in low-cost shared service centres continued
to pay off through improvements in operating efficiency. Our
Technology Shared Service Centres in China boosted cost
effectiveness by introducing a new Software Factory
methodology. Configured to support the “agile” method of
software development, the Software Factory environment has
reduced application development time while improving
software quality.
Our Operations Shared Service Centre in Malaysia continued
to provide improved support to our business units.
Approximately 7.4 million transactions were processed at this
centre in 2012, an increase of 18 per cent over the previous
year. This was achieved with an overall improvement in
productivity while maintaining agreed service levels.
MOBILE TOOLS
Recognising the critical role that mobile devices can play in
supporting business initiatives and meeting customer needs,
the Group has made significant headway during 2012 in
equipping agents with industry-leading mobile sales tools that
enhance customer experience while maintaining privacy
and security.

FIN
AN
CIA
L A
ND
OP
ER
ATI
NG
RE
VIE
WO
VE
RV
IEW
AD
DIT
ION
AL
INF
OR
MA
TIO
NF
INA
NC
IAL
ST
AT
EM
EN
TS
CO
RP
OR
AT
E G
OV
ER
NA
NC
E
39Business Review
Our teams in Taiwan and Singapore led the way in pioneering
iPoS, AIA’s market-leading point-of-sale technology. Using
iPad mobile devices as the host device, iPoS improves the
sales experience and allows our agents to provide customers
with a comprehensive financial advisory process that covers
the total sales cycle from the completion of the customer’s
financial-needs analysis to proposal generation and secure
electronic submission of life insurance applications, reducing
the administrative workload. With iPoS, customers can
undertake the insurance consultation and purchase process
anytime and anywhere, and as a result of increased efficiency
are now able to obtain insurance coverage as fast as within a
single day.
The iPoS technology has now been deployed to and well
received by our agency forces in Singapore, Indonesia,
Malaysia and Taiwan and planning has commenced for the
roll-out of iPoS in other markets in 2013. Since deployment in
Singapore late in the third quarter of 2012, more than 44 per
cent of our active agents have adopted this technology. In
Hong Kong, AIA was the first MPF (Mandatory Provident
Fund) provider to deploy an e-Submit application for iPad
mobile devices, which allows agents to close MPF Personal
Account business at point of sale. Thanks to expedited
electronic submissions, turnaround times and administrative
workloads have been substantially reduced.
SOCIAL NETWORKING
In 2012, AIA introduced “Wave” as an internal enterprise
social network. Using the Jive Software platform, Wave helps
AIA staff connect with colleagues across the region and
enables them to collaborate and innovate faster. This new
engagement platform provides staff with the ability to share
documents, knowledge and ideas; post blogs; participate in
discussions; design and progress projects; identify and
approach subject-matter experts; keep up with the latest
company news; and build communities with colleagues.
The Group has made significant headway during 2012 in equipping agents with industry-leading mobile sales tools that enhance customer experience while maintaining privacy and security.

FINANCIAL AND OPERATING REVIEW
AIA Group Limited Annual Report 2012
40
Business Review
HONG KONG
Geographical Markets
Notes:
(1) VONB figures shown in the table are based on local statutory reserving and capital requirements and include corporate pension business.
(2) VONB margin excludes corporate pension business to be consistent with the definition of ANP used within the calculation.
US$ millions, unless otherwise stated 2012 2011 YoY
VONB (1) 366 305 20%
VONB margin (2) 58.5% 56.1% 2.4 pps
ANP 604 522 16%
TWPI 3,372 3,142 7%
Operating profit after tax 732 694 5%
AIA’s Hong Kong operation delivered a strong performance in
2012 as a direct result of the consistent roll-out of the Premier
Agency programme we began in 2011 and of the progress
we have made in building our Profitable Partnership model to
complement our agency channel growth. The foundation of
our sustained profitable growth has been the relentless
execution of our strategy of increasing the activity and
productivity levels of our market-leading agency distribution
channel and improving product mix through our integrated
customer-led product design and marketing approach. Hong
Kong continued to be the largest contributor to the Group’s
earnings accounting for 28 per cent of VONB and 34 per cent
of OPAT.
VONB and VONB Margin
VONB grew by 20 per cent compared with 2011 to US$366
million. The strong growth reflected an overall increase in new
business volumes with ANP up by 16 per cent to US$604
million from higher agency productivity accompanied by a
strong result from our partnership distribution channel. At the
same time as growing production, overall VONB margin
improved by 2.4 pps to 58.5 per cent as we continued to
reprice products and improve the quality of our product mix.
Distribution
AIA’s highly professional proprietary agency distribution is the
largest agency sales force in Hong Kong, with many years’
experience in advising our customers and providing solutions
to their growing savings and protection needs.
Agency recruitment continued to be a priority in 2012 as we
expanded our agency force to create the next generation of
Premier Agents. AIA Premier Academy continued to lead the
way by combining selective recruitment with first-class
training, resulting in a 16 per cent increase in the overall
number of active new agents compared with 2011.
A particularly effective programme through AIA Premier
Academy called “Road to MDRT” provides targeted training
and mentoring opportunities to high-potential recruits,
increasing our future pool of MDRT candidates and expanding
our leading market position in Hong Kong. Within its first 16
months of operation, over 450 graduates from the
programme have joined our sales force and results have been
promising, with graduates significantly more productive than
other new recruits in Hong Kong. AIA maintained its position
as leader in MDRT qualifiers in Hong Kong with over 10 per
cent of agents qualifying in 2012. The number of MDRT
qualifiers in Hong Kong increased by 9 per cent compared
with 2011.
AIA Premier Academy celebrates outstanding achievements of young insurance elites honoured for attaining MDRT qualification.

FIN
AN
CIA
L A
ND
OP
ER
ATI
NG
RE
VIE
WO
VE
RV
IEW
AD
DIT
ION
AL
INF
OR
MA
TIO
NF
INA
NC
IAL
ST
AT
EM
EN
TS
CO
RP
OR
AT
E G
OV
ER
NA
NC
E
41Business Review
Our focus on distributing group insurance through agents
continued to gain momentum as the number of agents selling
group insurance cases in 2012 increased by 44 per cent
compared with 2011.
While agency remains the dominant distribution channel in
Hong Kong, partnership distribution reported another
excellent year of growth. Driven by investments in new service
platforms, VONB from the IFA and bancassurance channels
more than doubled compared with 2011.
Products and Customers
AIA continued to launch products focused on addressing the
growing life and health protection requirements of Hong Kong
consumers. Protection against critical illness continued to be
at the forefront of our campaigns and we extended our
flagship critical illness range with the launch of our new early
stage critical illness product called “Prime Care Pro” in
August 2012.
We improved the customer analytics around our large book of
existing policyholders, a clear competitive advantage for
AIA’s Hong Kong business, to support focused marketing
campaigns. For example, we identified and targeted 120,000
customers who did not possess sufficient medical coverage
with a simple offer to extend their existing coverage and we
also launched products specifically designed to recapture
maturity payments from our customer base.
Our new early stage critical illness product “Prime Care Pro” was launched in Hong Kong as an extension of our flagship critical illness range.
Through “Road to MDRT” programme, we provide targeted training and mentoring opportunities to high-potential recruits and enriched our pool of future talents.
Operating Profit after Tax
Operating profit after tax increased by 5 per cent to US$732
million compared with 2011. Growth was partly offset by
lower investment income following dividends remitted to the
Group Corporate Centre.

FINANCIAL AND OPERATING REVIEW
AIA Group Limited Annual Report 2012
42
Business Review
THAILAND
Notes:
(1) VONB figures shown in the table are based on local statutory reserving and capital requirements and include corporate pension business.
(2) VONB margin excludes corporate pension business to be consistent with the definition of ANP used within the calculation.
US$ millions, unless otherwise stated 2012 2011 YoY
VONB (1) 287 227 26%
VONB margin (2) 53.9% 48.8% 5.1 pps
ANP 532 465 14%
TWPI 3,119 2,976 5%
Operating profit after tax 452 395 14%
AIA has a significant market leadership position in Thailand
and a distinct competitive advantage as a result of our
extensive nationwide agency network and market-leading
brand established over our long history in the country. AIA’s
Thai operation has built on this advantaged position to
produce impressive results in 2012 as we continued to
execute our Premier Agency strategy focused on improving
agency activity and productivity levels. Impacts on our
business from the floods that affected the country in late 2011
were limited to the first quarter of 2012.
VONB and VONB Margin
VONB grew by 26 per cent to US$287 million compared with
2011. The strong growth was a result of ongoing
improvements in agency productivity and our success in
promoting the sale of savings and protection products,
increased rider attachments and group insurance business
through our agency channel. This contributed to VONB
margin expansion of 5.1 pps to 53.9 per cent together with
ANP growth of 14 per cent in 2012.
Distribution
As part of our Premier Agency strategy in Thailand, AIA has
upgraded recruitment processes to enhance the quality of our
new recruits and ensure improved activity levels for new
agents. We have adopted a sophisticated candidate profiling
and psychometric testing approach in conjunction with LIMRA
to improve our recruitment efficiency and target those
individuals who are committed to a professional agency
career with AIA. The result is an increased proportion of
university graduate recruits and a significant uplift in the
activity levels of new agents recruited compared with 2011.
Further investment was made to upgrade our training
capabilities in 2012 to extend the productivity and profitability
gains we have achieved. One particular area of focus was on
training designed to enhance the effectiveness of our agents
in selling higher-margin protection products and increased
riders in order to capitalise on AIA’s leadership position in
the life and health market in Thailand. The result was a
higher-quality sales mix with VONB of new protection
business up 30 per cent compared with 2011.
In Thailand, AIA maintained its significant market leadership position and continued to be recognised by a series of awards in 2012, including the “Reader’s Digest Trusted Brand Award” for the ninth consecutive year.

FIN
AN
CIA
L A
ND
OP
ER
ATI
NG
RE
VIE
WO
VE
RV
IEW
AD
DIT
ION
AL
INF
OR
MA
TIO
NF
INA
NC
IAL
ST
AT
EM
EN
TS
CO
RP
OR
AT
E G
OV
ER
NA
NC
E
43Business Review
Our education and marketing campaigns were designed not
only to attract new customers but also to improve the
protection coverage of our existing customer base of over
7 million in-force policies. Our industry-leading whole-of-life
participating critical illness product, AIA Health Lifetime, was
introduced in April 2012 and became a top five product within
three months of launch, while the “Double Sum Assured”
campaign targeted existing customers whose protection
coverage was lower than average.
Operating Profit after Tax
Operating profit after tax grew by 14 per cent to US$452
million compared with 2011. The result benefited from a
reduction in the effective corporate tax rate in Thailand from
30 per cent to 23 per cent. The corporate tax rate in Thailand
is expected to further reduce to 20 per cent for assessment
years 2013 and 2014. We have assumed a return to 30 per
cent from assessment year 2015 onward.
We continued to reactivate or manage out those agents that
fell below our productivity standards. As a result of our
initiatives, we retained our number one MDRT ranking and
significant leadership position in the agency channel with
MDRT qualifiers in Thailand up by 26 per cent compared
with 2011.
Group insurance is an important emerging opportunity in
Thailand alongside the rapid development of the employment
market. We have made good progress in this area through
leveraging our proprietary agency distribution within the SME
segment. VONB from group insurance increased by over 90
per cent compared with the corresponding figure in 2011.
Products and Customers
AIA designated 2012 as the “Year of Protection” with the aim
of promoting awareness of the need for adequate protection
cover for our customers in Thailand. Recent studies by AIA
showed that 76 per cent of the Thai population does not have
any form of life insurance with many of the remainder having
insufficient coverage.
We introduced AIA Health Lifetime in 2012, an industry-leading whole-of-life participating critical illness product which became our top five product in Thailand within three months of launch.

FINANCIAL AND OPERATING REVIEW
AIA Group Limited Annual Report 2012
44
Business Review
SINGAPORE
Notes:
(1) VONB figures shown in the table are based on local statutory reserving and capital requirements and include corporate pension business.
(2) VONB margin excludes corporate pension business to be consistent with the definition of ANP used within the calculation.
US$ millions, unless otherwise stated 2012 2011 YoY
VONB (1) 226 164 38%
VONB margin (2) 66.8% 62.3% 4.5 pps
ANP 339 264 28%
TWPI 2,035 1,949 4%
Operating profit after tax 332 336 (1)%
Singapore achieved excellent new business growth in 2012.
Our strategic focus on growing our Premier Agency,
developing profitable partnership distribution and sustaining
our group insurance leadership position allowed AIA to build
on the previous year’s outstanding performance. We
supported our distribution initiatives in 2012 with product and
technological innovation to enable AIA to help our customers
meet their regular savings and protection goals. In January
2012, we completed the transfer of our business into a
Singapore-incorporated company, with an inaugural AA-
financial strength rating with stable outlook from Standard
and Poor’s.
VONB and VONB Margin
Singapore improved on a strong first-half performance to
deliver a VONB increase of 38 per cent to US$226 million
compared with 2011. Agency distribution was the main
growth driver complemented by an excellent performance
from partnership distribution and group insurance. VONB
margin for the year improved by 4.5 pps to 66.8 per cent
compared with 2011, as we continued to focus on higher-
margin term, critical illness and rider protection business and
repriced savings products. The margin improvement was in
addition to a strong increase in ANP of 28 per cent.
Distribution
We continued to implement
our Premier Agency strategy
in 2012 and introduced a
new agency structure that
reinforces the development
of skilled agency leaders
with the objective of
recruiting higher-quality
Premier Agents. Despite
some uncertainty around
new regulatory requirements
in 2012, our efforts to recruit
experienced candidates
from both financial and
non-financial sectors and AIA Premier Academy training
courses designed to promote the productivity of agents have
increased the number of active agents over the year
compared with 2011.
Our agents are at the forefront in driving AIA’s protection
proposition in Singapore. The launch of new and enhanced
protection solutions coupled with integrated agency sales
campaigns increased the mix of protection business in 2012
driving higher margins and strong growth in VONB.
Partnership distribution reported excellent growth, particularly
in the IFA and private bank channels targeting the more
affluent segment.
Our ongoing commitment to our customers and partners has garnered multiple awards in 2012, including the “Life Insurance Company of the Year 2012” award from Asia Insurance Review.

FIN
AN
CIA
L A
ND
OP
ER
ATI
NG
RE
VIE
WO
VE
RV
IEW
AD
DIT
ION
AL
INF
OR
MA
TIO
NF
INA
NC
IAL
ST
AT
EM
EN
TS
CO
RP
OR
AT
E G
OV
ER
NA
NC
E
45Business Review
Group insurance remains a key strength in Singapore where
AIA is the market leader. We continued to focus on our broker
partnerships and the SME segment through our Premier
Agency and, as a result of our concerted up-selling effort of
group life cover during contract renewals, VONB from group
insurance increased by 62 per cent compared with 2011.
The Financial Advisory Industry Review (FAIR) panel has
published its findings and recommendations to the Monetary
Authority of Singapore (MAS). AIA is supportive of measures
that serve to improve the quality of distribution in life insurance
and promote access to regular savings and protection
insurance, particularly to the mass market and lower income
sectors where encouragement to make regular savings and
advice on product suitability is most needed. Given AIA’s
financial strength, high-quality Premier Agency distribution
and strong governance principles, we believe that progress in
life insurance regulation in Asia will play to our strengths and
we are confident in our ability to implement the
recommendations of the panel.
Products and Customers
Throughout 2012, we continued to introduce products to help
Singaporean families bridge their protection gaps offering a
comprehensive range of protection benefits such as critical
illness, guaranteed renewable term life and innovative
disability income protection plans. We continued to
develop our next generation unit-linked products to further
address the combined regular savings and protection needs
of customers.
With over 80 years of history in Singapore, our in-force
customers represent a valuable potential source of new
business. In 2012, we initiated a number of integrated
marketing campaigns to help our in-force customers address
their protection needs. Our ongoing commitment to our
customers and partners has garnered multiple awards in
2012, including the “Life Insurance Company of the Year
2012” award from Asia Insurance Review.
Singapore is one of the markets in which we have already
introduced our innovative fully mobile and secure iPoS
system. The Protection iBook application was also introduced
to provide protection calculators, product information and
other useful information to enhance the overall customer
purchase experience.
Operating Profit after Tax
Operating profit after tax decreased by 1 per cent to US$332
million due to lower investment income following dividends
remitted to the Group Corporate Centre in respect of the
subsidiarisation of our Singaporean branch operation.
Throughout 2012, we continued to introduce products to help Singaporean families bridge their protection gaps offering a comprehensive range of protection benefits, including innovative disability income plans.

FINANCIAL AND OPERATING REVIEW
AIA Group Limited Annual Report 2012
46
Business Review
MALAYSIA
Notes:
(1) VONB figures shown in the table are based on local statutory reserving and capital requirements and include corporate pension business.
(2) VONB margin excludes corporate pension business to be consistent with the definition of ANP used within the calculation.
US$ millions, unless otherwise stated 2012 2011 YoY
VONB (1) 68 58 17%
VONB margin (2) 45.2% 40.7% 4.5 pps
ANP 151 142 6%
TWPI 964 928 4%
Operating profit after tax 142 133 7%
AIA’s Malaysian business delivered solid results over the year
with a 17 per cent increase in VONB compared with 2011.
The performance was driven by our focus on improving the
protection coverage of our customers and promoting regular
premium unit-linked sales with a combined protection and
savings content. Our Takaful business continued to make
good progress in its first full year of operation.
VONB and VONB Margin
VONB grew by 17 per cent to US$68 million compared with
2011. VONB margin improved by 4.5 pps to 45.2 per cent
reflecting AIA’s market-leading position in accident and health
protection business and increased unit-linked sales within the
product mix. ANP increased by 6 per cent to US$151 million
with lower growth in the second half of the year reflecting a
very successful up-selling campaign to existing customers in
the second half of 2011 as previously disclosed.
Distribution
Agency is the major distribution channel for AIA in Malaysia
and our priority is to develop our Premier Agency force
through the selective recruitment and training of our next
generation of Premier Agents. We launched improved
recruitment and selection processes in 2012 alongside
training programmes through AIA Premier Academy to
support the induction of new agents.
AIA Premier Academy has also enabled us to provide targeted
training programmes, according to agent experience, with the
aim of promoting increased protection and unit-linked sales
within the product mix, which has been a key driver of VONB
margin growth for 2012.
Partnership distribution continued to gain traction in 2012 with
our bancassurance and direct marketing channels reporting
strong growth compared with 2011. We continued to expand
our Takaful business through our multi-distribution platform
and it contributed positively in its first full year of operation
in 2012 providing over 10 per cent of the overall VONB
in Malaysia.
Products and Customers
We continued to focus our product development and
campaigns on increasing customer awareness of the need to
maintain adequate protection. Through ongoing coordinated
distribution training and targeted sales promotions, the VONB
from unit-linked business grew by 29 per cent compared
with 2011.

FIN
AN
CIA
L A
ND
OP
ER
ATI
NG
RE
VIE
WO
VE
RV
IEW
AD
DIT
ION
AL
INF
OR
MA
TIO
NF
INA
NC
IAL
ST
AT
EM
EN
TS
CO
RP
OR
AT
E G
OV
ER
NA
NC
E
47Business Review
Following on from the successful marketing campaign in the
second half of 2011, we launched customer marketing
programmes to help bridge the insurance protection gap of
our large in-force customer base in the first half of the year.
The two campaigns promoted protection products of term life
cover and critical illness respectively, and together
successfully generated over 55,000 new policies.
In line with the Malaysian government’s effort to develop a
long-term sustainable private retirement industry, AIA was the
only life insurance company approved as one of eight Private
Retirement Scheme (PRS) Providers. We are on track to
launch the venture by the first quarter of 2013 as a first step in
addressing the immense opportunity to serve Malaysia’s
growing retirement needs.
Operating Profit after Tax
Operating profit after tax increased by 7 per cent to US$142
million, mainly driven by the increase in TWPI.
Acquisition of ING Malaysia
AIA completed the acquisition of ING’s insurance and Takaful
businesses in Malaysia in December 2012, after the financial
year end. The transaction represents a highly attractive
opportunity with compelling strategic and financial benefits
through leveraging AIA’s track record of profitable growth
delivery and applying our product and distribution expertise to
the combined business. The Transitional Steering Committee
based in Malaysia has already made significant progress in
putting in place the integration process under the leadership
of Bill Lisle and the executive team. We are committed to
ensuring the smooth and efficient integration to optimise the
full potential of our enlarged business in this key market, and
to deliver a positive outcome for our shareholders, customers,
employees and agents.
We continued to help bridge the insurance protection gap by offering protection products of critical illness.
The successful completion of the acquisition has well placed AIA as the top life insurer in this important growth market.

FINANCIAL AND OPERATING REVIEW
AIA Group Limited Annual Report 2012
48
Business Review
CHINA
Notes:
(1) VONB figures shown in the table are based on local statutory reserving and capital requirements and include corporate pension business.
(2) VONB margin excludes corporate pension business to be consistent with the definition of ANP used within the calculation.
US$ millions, unless otherwise stated 2012 2011 YoY
VONB (1) 124 102 22%
VONB margin (2) 57.5% 47.2% 10.3 pps
ANP 215 215 –
TWPI 1,446 1,313 10%
Operating profit after tax 151 119 27%
AIA is the leading non-mainland life insurance company in
China. It has led the development of professional agency
distribution and product innovation in the Chinese life
insurance market over the last two decades. Since launching
our Premier Agency strategy at the end of 2010, we have
focused on taking this to the next level by recruiting and
developing best-in-class agents, offering high-quality advice
to Chinese families to provide them with the insurance cover
they need. This strategy has continued to deliver strong
financial results with a combination of profitable new business
growth and strong earnings progression.
VONB and VONB Margin
VONB increased by 22 per cent to US$124 million compared
with 2011 driven by positive changes in product mix and
increased agent activity. VONB margin increased by
10.3 pps from 47.2 per cent to 57.5 per cent with positive
improvements reported across all product classes. ANP was
flat overall with protection business growing by 17 per cent
within this figure, as we actively maintained our focus on
writing only quality business that meets our profitability
targets.
Distribution
Agency remained the core distribution channel for AIA’s new
business growth in China during 2012. Our strategy has
concentrated on enabling our agents to focus on providing
quality advice that meets the regular savings and protection
needs of our customers, while developing agency leaders
capable of recruiting the next generation of high-quality
agents to serve the increasingly sophisticated requirements of
consumers in China.
Our Premier Agency programme aims to achieve this through
offering best-in-class training and development opportunities
to increase the professionalism and activity levels of our
agents alongside a compensation scheme that grows average
incomes aligned with the interests of our customers and the
Group. We increased active agent numbers and profitability
per active agent at the same time as growing average income
levels over 2012.
As a result of our Premier Agency programme, AIA saw an increase in the number of MDRT qualifiers in China by 19 per cent compared with 2011.

FIN
AN
CIA
L A
ND
OP
ER
ATI
NG
RE
VIE
WO
VE
RV
IEW
AD
DIT
ION
AL
INF
OR
MA
TIO
NF
INA
NC
IAL
ST
AT
EM
EN
TS
CO
RP
OR
AT
E G
OV
ER
NA
NC
E
49Business Review
Our dual career path option awards equivalent status to
agents with ambitions to attain MDRT qualification and
become a Premier Agent, and to agency leaders looking to
build and manage teams that will be essential to sustaining
AIA’s profitable new business growth. As a result of our
programmes and sales management activities, the number of
MDRT qualifiers has increased by 19 per cent compared
with 2011.
While agency remained our major source of new business,
we continued to align our partnership distribution
business in China with the overall Group’s strategy of writing
higher-margin protection products with longer payment
periods, and reducing less profitable business.
Products and Customers
AIA has successfully positioned its brand as a leader in the
comprehensive protection insurance market in China as
demonstrated by the growth of this product category in 2012.
We continued to innovate through the increased use of
customer segmentation to offer differentiated products with
varying levels of protection cover at different price points to
broaden our market coverage. In addition to protection
products, we have also launched retirement savings products
targeted at the growing senior customer segment.
Operating Profit after Tax
Operating profit after tax grew by 27 per cent compared
with 2011 from improved expense efficiency, higher levels
of investment income and the substantial growth in
the business.
We stepped up in 2012 as the “Protection Expert” and continued to position the AIA brand as a leader in China’s comprehensive protection insurance market.

FINANCIAL AND OPERATING REVIEW
AIA Group Limited Annual Report 2012
50
Business Review
KOREA
Notes:
(1) VONB figures shown in the table are based on local statutory reserving and capital requirements and include corporate pension business.
(2) VONB margin excludes corporate pension business to be consistent with the definition of ANP used within the calculation.
US$ millions, unless otherwise stated 2012 2011 YoY
VONB (1) 68 74 (8)%
VONB margin (2) 28.4% 27.3% 1.1 pps
ANP 237 270 (12)%
TWPI 1,942 2,029 (4)%
Operating profit after tax 125 124 1%
The repositioning of our Korean business has progressed well
during 2012. We began with the restructuring of our agency
distribution channel in 2011, when we realigned remuneration
to shift the emphasis towards protection and regular savings
products that meet our customers’ needs and provide us with
the right platform to grow Premier Agency profitability in
Korea. The focus in 2012 has been to build on this platform
with the effective recruitment of quality agents that fit with our
Premier Agency culture and implementing a corresponding
strategy for our direct marketing channel. We have seen early
signs that the positive strategic decisions we have taken are
having the desired results and will flow through into
sustainable VONB growth.
VONB and VONB Margin
VONB has reduced by 8 per cent compared with 2011. The
decrease was driven by a reduction in ANP of 12 per cent
partially offset by an improvement in VONB margin of 1.1 pps.
However, the reduction in VONB for the full year was a result
of the decline reported in the first half of the year partially
offset by second-half growth in VONB of 9 per cent
compared with the same period last year.
In Korea, our extensive recruiting efforts were combined with a focus on improved training and a better overall sales management culture.

FIN
AN
CIA
L A
ND
OP
ER
ATI
NG
RE
VIE
WO
VE
RV
IEW
AD
DIT
ION
AL
INF
OR
MA
TIO
NF
INA
NC
IAL
ST
AT
EM
EN
TS
CO
RP
OR
AT
E G
OV
ER
NA
NC
E
51Business Review
Distribution
AIA’s management team has focused on growing the number
of high-quality agents over the second half of the year to
support sustainable profitable growth in our agency channel.
Our extensive recruiting efforts were combined with a focus
on improved training and a better overall sales management
culture. Our programmes contributed an improvement in
agency channel productivity in the second half of the year and
increased the number of active agents by 20 per cent
compared with the first half. 2012 is the first year of positive
growth in the agency force since the 2008 crisis. Importantly,
we increased the overall number of MDRT qualifiers by 40 per
cent compared with 2011, demonstrating the quality and
sustainability of the agency strategy in Korea.
The restructuring of our direct marketing channel in Korea
was a key priority for 2012. We opened four new call centres
and moved our recruitment centre from central Seoul to the
outskirts so that we could target new areas of the workforce
that meet our recruitment profile. A modern and flexible work
We launched an immensely popular nationwide marketing campaign to raise the awareness of families to protect the future of their children.
schedule was introduced and our recruitment processes were
revised to drive recruitment of new telesales representatives
(TSRs). Training programmes and product development have
focused on driving improvements in the product mix and
expanding core products to offer a more diversified product
range to raise TSR productivity levels.
Products and Customers
Aligned with a continued focus on protection, we launched
key product initiatives focused on expanding accident and
health coverage. We continued to embed insurance in our key
savings products and increase the use of riders to expand the
breadth of coverage for our customers. Our combined
product and marketing campaigns are concentrating on
different target segments including family cover and seniors.
For example, AIA launched a marketing campaign in Korea
aimed at raising the awareness of the need for families to
protect the future of their children and to increase the brand
awareness of AIA. This campaign was centred around an
engaging television commercial that has been viewed over
one million times on YouTube.
We will continue to implement our quality recruitment
programmes and drive further product innovation and
enhanced customer segmentation to revitalise our
Korean business.
Operating Profit after Tax
Operating profit after tax for 2012 increased by 1 per cent to
US$125 million compared with 2011 with the reduction in
TWPI and a higher effective tax rate from 22.0 per cent to
24.2 per cent offset by positive cost savings and product
margin improvements.

FINANCIAL AND OPERATING REVIEW
AIA Group Limited Annual Report 2012
52
Business Review
AIA’s Australian business achieved three “Life Company of the Year” industry awards in 2012 .
US$ millions, unless otherwise stated 2012 2011 YoY
VONB (1) 162 112 45%
VONB margin (2) 26.3% 18.8% 7.5 pps
ANP 618 594 4%
TWPI 2,482 2,105 18%
Operating profit after tax
207 165 25%
Notes:
(1) VONB figures shown in the table are based on local statutory reserving and capital requirements and include corporate pension business.
(2) VONB margin excludes corporate pension business to be consistent with the definition of ANP used within the calculation.
Other Markets refers to AIA’s operations in Australia, the
Philippines, Indonesia, Vietnam, Taiwan and New Zealand.
Our 26 per cent share of India’s financial results is included in
operating profit on an equity accounted basis.
VONB and VONB Margin
VONB increased by 45 per cent to US$162 million compared
with 2011. The result was driven mainly by strong
performances in Australia and the Philippines and outstanding
growth in Indonesia and Taiwan across both agency and
partnership channels. VONB margin expanded by 7.5 pps to
26.3 per cent and ANP volumes increased by 4 per cent.
Underlying ANP volumes were up 46 per cent excluding the
effect of the single large group insurance scheme written in
Australia in 2011.
Business Unit Performance
• Australia: AIA’s Australian business performed strongly in
2012 as we continued to build on our market-leading
group insurance franchise and successfully targeted the
retail IFA channel. AIA was recognised as the fastest-
growing life insurance company in Australia as we
leveraged our position as an independent risk specialist.
The year-on-year growth rate of our group insurance
business was distorted by the single large Australian
scheme written in the third quarter of 2011 and group
insurance VONB increased on an underlying basis
excluding the scheme. We achieved excellent VONB
growth from the retail IFA channel in 2012 as
improvements in production were accompanied by strong
margin expansion. This was a direct result of the
successful implementation of our Premier IFA model,
combining competitive products and best-in-class adviser
services to target an improved business mix, helping AIA’s
Australian business achieve three “Life Company of the
Year” industry awards in 2012.
• Indonesia: AIA’s Indonesian business achieved excellent
results in 2012 with outstanding VONB growth across both
agency and bancassurance distribution compared with
2011. Our agency channel delivered a very strong
performance through the execution of our Premier Agency
strategy. Our successful recruitment programme, coupled
with the launch of a new compensation scheme that
rewards activity, persistency and productivity, has resulted
in an increase in the number of active agents by 37 per
cent compared with 2011. Improved activity has been
accompanied by a major increase in the sales of protection
and unit-linked business with the introduction of our next
generation unit-linked products into Indonesia over
the year.
OTHER MARKETS
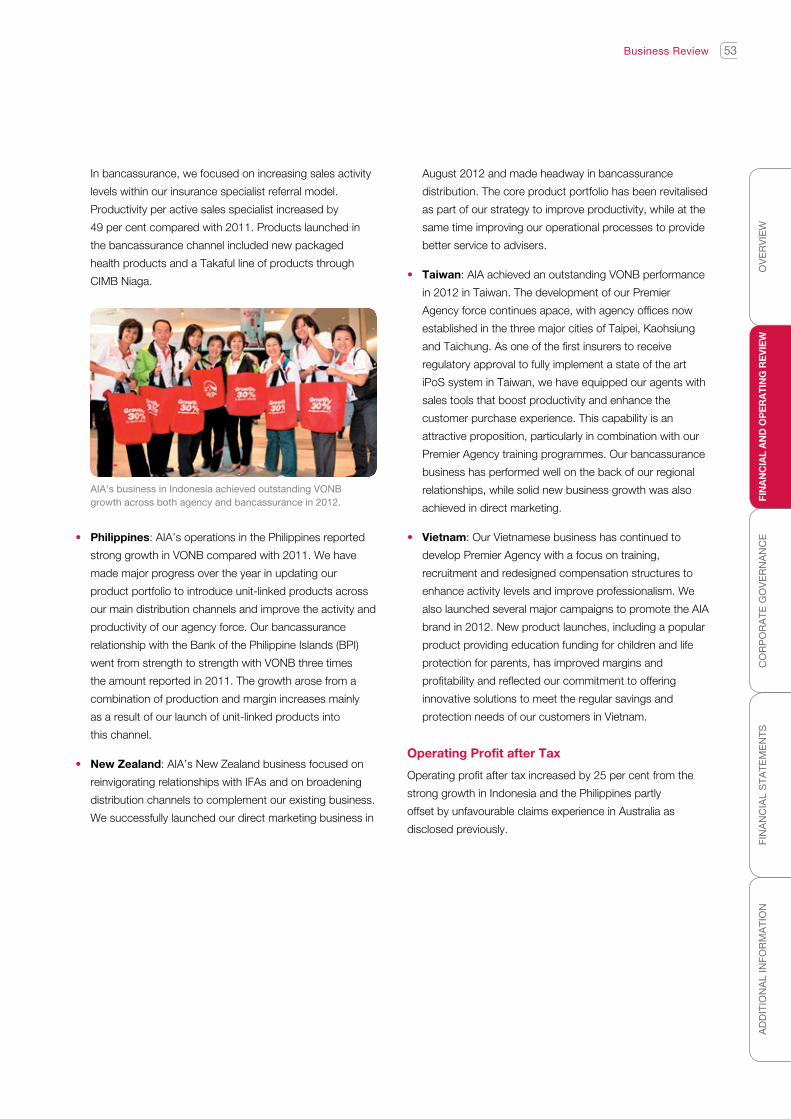
FIN
AN
CIA
L A
ND
OP
ER
ATI
NG
RE
VIE
WO
VE
RV
IEW
AD
DIT
ION
AL
INF
OR
MA
TIO
NF
INA
NC
IAL
ST
AT
EM
EN
TS
CO
RP
OR
AT
E G
OV
ER
NA
NC
E
53
In bancassurance, we focused on increasing sales activity
levels within our insurance specialist referral model.
Productivity per active sales specialist increased by
49 per cent compared with 2011. Products launched in
the bancassurance channel included new packaged
health products and a Takaful line of products through
CIMB Niaga.
Business Review
August 2012 and made headway in bancassurance
distribution. The core product portfolio has been revitalised
as part of our strategy to improve productivity, while at the
same time improving our operational processes to provide
better service to advisers.
• Taiwan: AIA achieved an outstanding VONB performance
in 2012 in Taiwan. The development of our Premier
Agency force continues apace, with agency offices now
established in the three major cities of Taipei, Kaohsiung
and Taichung. As one of the first insurers to receive
regulatory approval to fully implement a state of the art
iPoS system in Taiwan, we have equipped our agents with
sales tools that boost productivity and enhance the
customer purchase experience. This capability is an
attractive proposition, particularly in combination with our
Premier Agency training programmes. Our bancassurance
business has performed well on the back of our regional
relationships, while solid new business growth was also
achieved in direct marketing.
• Vietnam: Our Vietnamese business has continued to
develop Premier Agency with a focus on training,
recruitment and redesigned compensation structures to
enhance activity levels and improve professionalism. We
also launched several major campaigns to promote the AIA
brand in 2012. New product launches, including a popular
product providing education funding for children and life
protection for parents, has improved margins and
profitability and reflected our commitment to offering
innovative solutions to meet the regular savings and
protection needs of our customers in Vietnam.
Operating Profit after Tax
Operating profit after tax increased by 25 per cent from the
strong growth in Indonesia and the Philippines partly
offset by unfavourable claims experience in Australia as
disclosed previously.
AIA’s business in Indonesia achieved outstanding VONB growth across both agency and bancassurance in 2012.
• Philippines: AIA’s operations in the Philippines reported
strong growth in VONB compared with 2011. We have
made major progress over the year in updating our
product portfolio to introduce unit-linked products across
our main distribution channels and improve the activity and
productivity of our agency force. Our bancassurance
relationship with the Bank of the Philippine Islands (BPI)
went from strength to strength with VONB three times
the amount reported in 2011. The growth arose from a
combination of production and margin increases mainly
as a result of our launch of unit-linked products into
this channel.
• New Zealand: AIA’s New Zealand business focused on
reinvigorating relationships with IFAs and on broadening
distribution channels to complement our existing business.
We successfully launched our direct marketing business in

FINANCIAL AND OPERATING REVIEW
AIA Group Limited Annual Report 2012
54
Risk ManagementFINANCIAL AND OPERATING REVIEW
The core of AIA’s business is accepting, pooling and
managing risk for the benefit of both policyholders and
shareholders. Effective risk management is vital in any
organisation but especially in a life insurance business where
it is a key driver of value.
All business unit managers and executives are responsible for
ensuring their businesses understand the risks that are being
undertaken, operate within acceptable levels of risk tolerance
and achieve appropriate returns for these risks. This direct
accountability at the operational level is reinforced by a
second tier of financial, actuarial and underwriting monitoring
at the Group level and via the Group and local risk functions
as part of the Risk Management Framework (RMF) which is
described below.
Risks undertaken by the Group are backed by appropriate
levels of capital to support the ongoing business and protect
our policyholders. While AIA seeks capital efficiency, we do so
within acceptable levels of risk without compromising either
our financial strength or our requirement for appropriate
returns. We discuss below the principal risks and how they
are managed.
OVERVIEW
AIA operates a RMF with the following components:
• An efficient governance and reporting architecture that
facilitates escalation of key issues to appropriate levels of
management, oversees the administration of the risk
management framework at a local level, ensures swift and
effective responses to emerging issues, and provides
assurance to the Board as to the efficiency and robustness
of the decision-making process;
• Effective quantitative and qualitative risk measurement to
allow the Group’s risks to be clearly identified, and to
ensure that risk is contained within our Risk Appetite;
• Local risk managers in each country who report to local
management; the latter remaining accountable for the
management of risk in their business; and
• The Group Risk function, which works with local risk
functions to identify, measure and manage current and
emerging risks that pose a material economic or
reputational risk to the Group as a whole. The Group Risk
function is part of the Group Risk and Capital Management
department with the Group’s principal risk officer, the
Group Head of Risk and Capital Management, reporting to
the Group Chief Financial Officer.
Our Risk Appetite is the foundation of our RMF and risk
management culture, providing a consistent approach for risk
management and thereby reducing the likelihood of our
financial strength being damaged by unexpected events.
RISK APPETITE
AIA’s Risk Appetite is the nature and amount of risk we are
willing to take in pursuit of value. Our Risk Appetite Statement
(RAS) articulates this expectation and in doing so provides a
key input to strategy as well as defining the focus of the
organisation’s risk and capital management activities.
Our Risk Appetite is articulated through an overarching
statement which focuses on ensuring that the risks that AIA
accepts are consistent with our stakeholders’ expectations.
The amount of risk taken by AIA in the ordinary course of its
business will be sufficient to meet its customers’ reasonable
expectations for protection and benefits while ensuring that
the level and volatility of shareholder returns are in line with a
risk profile appropriate to a life insurance company focused on
Asia-Pacific, ex-Japan.
This statement is supported by our risk and capital
management priorities:
• Maintaining financial strength and regulatory solvency
sufficient to meet our liabilities as they fall due;
• Managing liquidity to ensure the Group can meet its
obligations and take advantage of business opportunities;
and
• Managing earnings volatility.
Our statement and priorities are in turn expressed as
qualitative statements and quantitative measures and policies
which together provide assurance to executive management
and the Board of our compliance with AIA’s Risk Appetite.

FIN
AN
CIA
L A
ND
OP
ER
ATI
NG
RE
VIE
WO
VE
RV
IEW
AD
DIT
ION
AL
INF
OR
MA
TIO
NF
INA
NC
IAL
ST
AT
EM
EN
TS
CO
RP
OR
AT
E G
OV
ER
NA
NC
E
55Risk Management
RISK GOVERNANCE AND REPORTING STRUCTURE
The Company’s Board has overall responsibility for oversight
of the Group’s risk management activities and ensuring
adequate capital to support the Group’s business. The Risk
Committee focuses on overseeing the Group’s risk
management and capital adequacy, and the Audit Committee
focuses on the maintenance of adequate controls, corporate
governance processes and structures.
Our risk governance structure is segregated along “three lines
of defence” as illustrated in the chart below:
Under the “first line of defence”, primary responsibility for risk
identification and management lies with the local businesses
supported by the local risk teams along with Group functions.
The “second line of defence” consists of two executive risk
committees, Group Compliance and Group Risk. The primary
responsibility of these committees and functions is to provide
oversight of the risk management activities conducted by the
“first line of defence”. The second line also provides support
to the Board via the Risk Committee to enable the Board
to discharge its responsibilities for setting the Group’s
overall risk appetite, agreeing the RMF and monitoring
group-wide risks.
The “third line of defence” is performed by Group Internal
Audit, which provides assurance to the Board via the Audit
Committee and to executive management as to the
effectiveness of internal controls. This helps the Board to
discharge its corporate governance responsibilities. This third
line includes reviews of the RMF, including the Group Risk
function and committees, which together constitute the
Group’s second line of defence.
Group Internal Audit coordinates with the Group Risk and
Group Compliance functions to ensure risks and their
management processes are identified and monitored on a
consistent basis, and to ensure there are no overlaps or gaps
in our risk assessment and control processes.
AIA Group Limited Board
Risk Committee
Executive RiskCommittees(Governance)
ExecutiveCommittee
Group Complianceand
Risk Functions
Oversight
Local BusinessUnits and
Group Functions
Executive Management
Audit Committee
GroupInternal Audit
Assurance
Board Level
ManagementLevel
1st Line of Defence 2nd Line of Defence 3rd Line of Defence

FINANCIAL AND OPERATING REVIEW
AIA Group Limited Annual Report 2012
56
Risk Management
In February 2012 the Company’s Board approved a new risk
governance and reporting structure. Under the new structure
the Company’s Board retains overall responsibility for
oversight of the Group’s risk management activities and
ensuring we have adequate capital to support the business of
the Group. In fulfilling these responsibilities the Board is
supported by the Risk Committee and two new executive risk
committees, namely the Operational Risk Committee (ORC)
and the Financial Risk Committee (FRC), the creation of which
was also approved by the Risk Committee. The new
governance structure is illustrated in the chart below:
Risk Committee
The objectives of the Risk Committee are to advise the Board
on any risk-related issues requiring Board attention. The Risk
Committee is also responsible for approving risk metrics used
in the context of the Group’s Risk Appetite. The members of
the Risk Committee are all Board directors, with the Chairman
required to be an Independent Non-Executive Director. The
Risk Committee meets at least four times a year.
In practice the Risk Committee has oversight over all risk
management activities in the Group. At each meeting it
considers the general risk environment, reviews the activities
of the Group’s executive risk committees and the Group’s
solvency. Thorough reviews are conducted into the Group’s
major risks. During the year, the Risk Committee reviews
included two reviews of market risk and credit risk in the
Group’s investment portfolios, a review of operational risk
management and the Group’s key balance sheet risks. The
Risk Committee also considered specifically the risk
implications of the Group’s acquisition of ING Groep NV’s
insurance business in Malaysia.
Operational Risk Committee
The ORC provides oversight of non-financial risk activities
within the Group. These include any activity that has the
potential to weaken our business whether strategic or
reputational, and may include issues related to our human,
physical or technology resources. The ORC approves Group
policies, processes and metrics related to the management of
Operational Risk. The members of the ORC are predominantly
members of the Group Executive Committee and the ORC is
chaired by the Group Chief Financial Officer. The ORC meets
at least four times a year.
During the year, the ORC met four times. At each meeting the
operational risk environment was reviewed based on the Group’s
defined key operating risks. Local business unit ORC reports
were reviewed and emerging issues considered, with mitigation
strategies for such items being discussed and agreed.
Financial Risk Committee
The FRC provides oversight of financial and insurance risk
activities within the Group. These include market and
insurance risks as well as the Group’s balance sheet, liquidity
and capital position. The FRC approves Group policies,
AIA Group LimitedBoard
RiskCommittee
AuditCommittee
RemunerationCommittee
NominationCommittee
Operational RiskCommittee
Non-Financial Risks(Operational, Strategic)
Financial RiskCommittee
Financial Risk(Credit, Market, Liquidity)
and Insurance Risk

FIN
AN
CIA
L A
ND
OP
ER
ATI
NG
RE
VIE
WO
VE
RV
IEW
AD
DIT
ION
AL
INF
OR
MA
TIO
NF
INA
NC
IAL
ST
AT
EM
EN
TS
CO
RP
OR
AT
E G
OV
ER
NA
NC
E
57Risk Management
processes and metrics related to the management of
Financial Risks and Insurance Risk. The members of the FRC
include our Group Chief Investment Officer and Group Chief
Financial Officer. The FRC is chaired by our Group Chief
Executive. The Committee meets at least four times a year.
During the year, the FRC met four times. At each meeting the
Group’s capital and balance sheet position was reviewed as
well as the risks in the Group’s investment portfolio including
asset-liability, foreign exchange and liquidity risks. Local
business unit FRC reports were also reviewed and emerging
issues considered, with mitigation strategies for such items
being discussed and agreed.
Where activities, proposals, and/or reports are relevant
to both the FRC and the ORC, the FRC is responsible
for coordination.
LOCAL AND GROUP RISK FUNCTIONS
Each country has a local risk function which reports to local
management. This is consistent with the empowered business
model that AIA has adopted and allows the local risk
management framework to support local regulatory and Board
requirements. Local risk functions are responsible for managing
the local risk management frameworks, identifying and
escalating emerging risks and control weaknesses to the Group.
Local business units have some discretion over their local risk
management frameworks, but are subject to an annual
assurance review by Group Risk and Group Internal Audit to
ensure that these are effective and to the required standard.
Day-to-day interactions between local and Group risk
functions together with a quarterly report to the Group’s risk
committees on items discussed at local committees ensures
that risk management remains aligned across the Group.
The Group Risk function oversees the Group’s RMF, including
the setting and monitoring of risk appetite in relation to
different risks. Consisting of risk professionals that focus on
integrated risk management and oversight, the function seeks
to identify, escalate and resolve risk issues with a Group
dimension as well as to develop risk models and approaches
to support performance and risk management. The function
supports the Group executive risk committees, proposes risk
management policies and methodologies, and exercises
oversight of risk management awareness and control
procedures, working closely with other Group functions.
The Group Risk function is part of the Group Risk and Capital
Management department, together with the Group Treasury
and Group Capital Management functions.
RISK CATEGORISATIONS, MANAGEMENT METHODOLOGIES AND TOOLS
Under the RMF, we adopt a common language in our
description of risks at both the Group and the local business
unit levels. We proactively manage a wide spectrum of
financial and non-financial risks as summarised in the
table below:
Risk Category Risk Type Description
Financial Risks 1. Credit Risk The risk that third parties fail to meet their obligations to the Group when they fall due
2. Market Risk The risk of loss from adverse movements in the value of assets owing to market factors, including changes in interest and foreign exchange rates, as well as movements in credit, equity and property prices
3. Liquidity Risk The risk of having insufficient cash available to meet payment obligations to counterparties when they fall due
Insurance Risk 4. Insurance Risk The potential loss resulting from inappropriate underwriting, mispricing, adverse expense, lapse, mortality and morbidity experiences
Non-financial Risks 5. Operational Risk The potential direct or indirect loss (including reputational loss) resulting from inadequate or failed internal processes, personnel and systems; or from external events
6. Strategic Risk The risk of unexpected changes in the regulatory, market and competitive environment in which the Group operates

FINANCIAL AND OPERATING REVIEW
AIA Group Limited Annual Report 2012
58
Risk Management
Risk Modeling
Fundamental to the risk management framework is the ability
to model risks and propose mitigating strategies. Group Risk
has a dedicated risk modeling function that works closely with
the Finance, Actuarial and Investment functions to develop
tools for assessing the various risks in the balance sheet.
There are four principal risk modeling activities:
Stress Testing: We perform regular stress testing to monitor
the potential impact of changing investment and economic
environment on the regulatory capital position of the Group
and the business units. These tests show how the risks
identified above behave individually and collectively. In
particular, AIA closely monitors the correlations between
financial risks across different countries, considering that the
ability to diversify risk is a key competitive advantage for a
geographically broadly-based financial institution.
Stress testing provides assurance that the Group and the
business units are adequately capitalised to withstand
adverse financial risk events and that the pursuit of business
strategies remains within acceptable risk tolerances.
Market Risk Modeling: Group Risk works closely with the
Investment Analytics team to develop and implement
quantitative techniques for managing AIA’s market risk. For
example, peak exposure analysis is used to determine credit
and liquidity limits and both deterministic scenarios and
stochastic models are used to assess interest rate, credit,
equity market and foreign exchange risks.
Operational Risk Modeling: Our Operational Risk team uses
scenario modeling to estimate the potential for losses arising
from our major strategic and operational risks, as well as the
expected maximum loss. Scenario modeling is a technique
used, where data is scarce, to try and approximate the loss
distribution associated with a particular operational or
strategic event.
Economic Capital: AIA is developing an internal economic
capital model that draws on industry best practices and takes
into account the environment in the Asia-Pacific region.
Principal Risks
The principal individual risks and our management of them are
discussed below with further information provided in note 36
to the financial statements.
Credit Risk
Credit risk occurs wherever we are relying on a third party to
satisfy their financial obligation to us. Although the primary
source of credit risk is the Group’s investment portfolio,
credit risk also arises in our reinsurance, settlement and
treasury activities.
Note 20 to the financial statements provides further details of
the Group’s financial investments in debt instruments, the
credit quality of those instruments and the basis on which
they are carried in the Financial Statements.
The management of credit risk occurs on two levels in AIA.
The Investment Credit Research team performs a detailed
analysis of individual counterparties and recommends a rating
within the internal ratings framework. The Group Risk function
manages the Group’s internal ratings framework and agrees
these recommendations. Internal ratings are then used to
determine our appetite for exposure to each counterparty.
A matrix of risk tolerances has been approved by the FRC
that ensures that credit risk in the investment portfolio is
contained within AIA’s risk appetite. These tolerances cover
individual counterparty, segmental concentration and cross-
border exposures. The Investment function has discretion to
shape the portfolio within those risk tolerances. Where the
Investment function wish to invest outside those tolerances,
further Group approvals are required. If certain investments
are technically within risk tolerances but there is a specific
concern, Group Risk may bring these to the attention of
the FRC.
Market Risk
Market risk arises from the possibility of financial loss caused
by changes in financial instruments’ fair values or future cash
flows due to fluctuations in key variables, including interest
rates, foreign exchange rates, equity and property market
prices. Note 36 to the financial statements provides further
detail relating to the market risks discussed below.
The FRC approves all policies and metrics associated with the
evaluation of market risk exposures.

FIN
AN
CIA
L A
ND
OP
ER
ATI
NG
RE
VIE
WO
VE
RV
IEW
AD
DIT
ION
AL
INF
OR
MA
TIO
NF
INA
NC
IAL
ST
AT
EM
EN
TS
CO
RP
OR
AT
E G
OV
ER
NA
NC
E
59Risk Management
Interest Rate Risk
The Group’s exposure to interest rate risk predominantly
arises from any difference between the tenor of the Group’s
liabilities and assets, or any difference between the return on
investments and the return required to meet the Group’s
commitments, predominantly its insurance liabilities. This
exposure can be heightened in products with inherent interest
rate options or guarantees.
Exposure to interest rate risks related to financial assets
and financial liabilities, split between variable, fixed and
non-interest bearing is summarised in note 36 to the
financial statements.
We seek to manage interest rate risk by ensuring appropriate
insurance product design and underlying assumptions as part
of the product approval process and by matching, to the
extent possible and appropriate, the duration of our
investment assets with the duration of our insurance policies.
For in-force policies, we regularly adjust the policyholder
bonus payout and crediting rates applicable to policyholder
account balances, considering amongst other things the
earned yields and policyholders’ reasonable expectations.
Foreign Exchange Rate Risk
At the Group level, foreign exchange rate risk arises mainly
from our operations in multiple geographical markets in the
Asia-Pacific region and the translation of multiple currencies
to US dollars for financial reporting purposes. Note 36 to the
financial statements shows the Group’s currency exposures
and the sensitivity of shareholders’ equity and profit to
movements in those currencies.
We manage foreign exchange rate risk at a Group level
through modeling and monitoring the currency of earnings
and Business Unit (BU) dividend remittances and other
earnings from our operations across the Asia-Pacific region,
and at a local level by matching our local liabilities and assets
by currency, including specifically the matching of US$ and
HK$ liabilities in Hong Kong. In this respect we will sometimes
use cross-currency swaps.
Equity Price Risk
Equity price risk arises from changes in the market value of
equity securities and equity funds. Investment in equity assets
on a long-term basis is expected to provide diversification
benefits and return enhancements which can improve the
portfolios’ risk-adjusted returns.
The extent of our exposure to equities at any time is at the
discretion of our Investment function operating within the
terms of the Group’s and local BUs’ strategic asset
allocations.
From a risk perspective, particular emphasis is placed on
managing concentrations and volatility in the Group’s equity
exposures. The Group’s “Margin of Safety Investment”
approach is designed to limit volatility and target value in our
equity selections and equity exposures are also included in
our aggregate credit exposure reports on individual
counterparties to ensure concentrations are avoided. Note 20
to the financial statements provides further details of the
Group’s financial investments in equity securities, including
the basis on which they are carried in the Financial
Statements. Note 36 to the financial statements indicates the
sensitivity of profit and net assets to changes in equity prices.
Property Price Risk
Property price risk arises from our interests in real estate
assets, which form part of our investment portfolios and are
subject to market value changes. A considerable number of
our real estate assets are self-occupied and used for own
business purposes. Real estate assets are expected to
provide useful diversification benefits and a long-term return
with some inflation protection.
The price risk in property can be driven by broader economic
and social factors, notably tenant supply and demand,
liquidity of individual buildings, evolving infrastructure and
government actions that may directly or indirectly influence
the market.
The Investment Committee oversees all major investment
activities in respect of real estate to ensure that these
additional risk factors are considered when making
investment decisions.

FINANCIAL AND OPERATING REVIEW
AIA Group Limited Annual Report 2012
60
Risk Management
Liquidity Risk
Liquidity risk refers to the risk that we have insufficient cash
available to meet our payment obligations to counterparties as
they fall due. We are subject to liquidity risk on insurance
products that permit surrender, withdrawal or other forms of
early termination for a cash surrender value. Note 36 to the
financial statements provides a maturity analysis of the Group’s
financial assets and its liabilities and insurance contracts.
At the local business unit level we seek to manage liquidity risk
through insurance product design and by matching our near-
term expected cash flows from our liabilities and assets. We
are assisted in this by the positive cash flows from our business
that provide an important source of liquidity. As disclosed in
note 20 to the financial statements, most of our assets are in
the form of marketable securities, which we can typically
convert to cash quickly should the need arise. At the AIA Group
Limited level we hold sufficient cash and liquid assets to cover
expected Group obligations and commitments.
Our policy is to remain as fully invested as prudent and we will
therefore occasionally use the bond repurchase markets to
manage our liquidity and to take advantage of market
opportunities.
Insurance Risk
The Group considers insurance risk to be a combination of
the following component risks:
• Product design risk;
• Underwriting and expense overrun risk;
• Lapse risk; and
• Claims risk.
Note 25 to the financial statements details our insurance
contract liabilities, the nature of insurance products and their
principal risks.
The Group manages its exposure to insurance risk across a
spectrum of components. We have significant underwriting
and actuarial resources and have implemented well-defined
underwriting and actuarial guidelines and practices. We have
accumulated substantial experience, which assists in the
evaluation, pricing and underwriting of our products.
Product Design Risk
Product design risk refers to potential defects in the
development of a particular insurance product or product
group. Our product development process is overseen by local
Product Development Committees working to Group
standards for product design, validation, pricing and risk
management. All aspects of a product are assessed through
pre-launch reviews conducted by the Group Product Actuarial
department supported by Group Operational Risk
Management. We closely monitor the performance of new
products and focus on actively managing each part of the
actuarial control cycle to minimise risk in both in-force policies
and new products.
Underwriting and Expense Overrun Risk
Underwriting and expense overrun risk refers to the possibility
of product-related income being inadequate to support future
obligations arising from an insurance product.
We seek to manage underwriting risk by adhering to our
Group underwriting guidelines. Each of our local operating
units maintains a team of professional underwriters who
review and select risks consistent with our risk appetite and
underwriting strategy. A second layer of underwriting review is
conducted at the Group level for complex and large risks, and
quality assurance of local underwriting capabilities is
performed.
In certain circumstances, such as when we enter new lines of
business, products or markets and do not have sufficient
experience data, we make use of reinsurance to reduce risks
and obtain product pricing and underwriting expertise.
To manage expense overrun risk we allow for an appropriate
level of expenses in our product pricing that reflects a realistic
medium- to long-term view of our cost structure and expense
inflation. In our daily operations, we adhere to a disciplined
expense budgeting and management process that controls
expenses within the product pricing allowances over the
medium to long term.
Lapse Risk
Lapse risk refers to the possibility of actual lapse experience
that diverges from the anticipated experience assumed when
products were priced. It includes the potential financial loss
incurred due to early termination of policies or contracts in

FIN
AN
CIA
L A
ND
OP
ER
ATI
NG
RE
VIE
WO
VE
RV
IEW
AD
DIT
ION
AL
INF
OR
MA
TIO
NF
INA
NC
IAL
ST
AT
EM
EN
TS
CO
RP
OR
AT
E G
OV
ER
NA
NC
E
61Risk Management
circumstances where the acquisition costs incurred are no
longer recoverable from future revenue. We carry out regular
reviews of persistency experience and the results are
assimilated into new and in-force product management. In
addition, many of our products include surrender charges that
entitle us to additional fees upon early termination by
policyholders, thereby reducing our exposure to lapse risk.
Claims Risk
Claims risk refers to the possibility that the frequency or
severity of claims arising from insurance products exceeds
the levels assumed when the products were priced. We seek
to mitigate claims risk by conducting regular experience
studies, including reviews of mortality and morbidity
experience, reviews of internal and external data, and
considering the impact of such information on reinsurance
needs, product design and pricing.
The Group has a broad geographical footprint across the
Asia-Pacific region, which provides a degree of natural
geographical diversification of claims experience. We mitigate
and manage this risk by adhering to the underwriting and
claims management policies and procedures that have been
developed based on our extensive historical experience. Our
broad product offering and large in-force product portfolio
also reduce our exposure to concentration risk. Finally, we
use reinsurance solutions to help reduce concentration and
volatility risk, especially with large policies or new risks, and as
protection against catastrophes.
Operational Risk
Operational risk is the risk of direct or indirect loss resulting
from inadequate or failed internal processes, personnel and
systems or from external events. Business unit managements
are responsible for managing their business and operational
risks, supported by their local risk management functions. The
Group’s Risk and Control Self-Assessment (RCSA) process is
used to identify and assess the impact of operational risks.
The RCSA is an exercise whereby management considers
possible or actual risk events, ascribes likelihood of
occurrence and potential severity, and then agrees mitigation
strategies to reduce these risks. These strategies are then
monitored and the exercise repeated, with the results stored
in a dedicated operational risk database.
At the Group level, agreed operational risks common to the
Group are measured using Key Risk Indicators (KRIs), with
each Key Risk assigned to a specific risk owner. Each
quarter, the operational risk team in Group Risk draws
together the results of this activity in a common framework
and reporting structure for consideration by the ORC, with
updates provided to the Risk Committee.
The ORC will also review new activities where there is
deemed to be a material operational risk. For all new
products, derivative instruments and “Restricted
Investments”, an operational risk checklist is completed
covering potential reputational issues, operational readiness,
technical dependencies, etc.
AIA protects itself against the financial losses by purchasing
insurance coverage against a range of operational loss events
including business disruption, property damage and internal
fraud. The attachment points and extent of coverage take
into consideration the results of scenario modeling as
described above.
Reputational Risk
Reputational risk is the potential risk that negative publicity
regarding a company’s business practices, whether true or
not, could have adverse consequences, including but not
limited to a loss of customers, brand damage, financial loss
and litigation. Consideration of reputational risk is a key
element in our operational risk checklists and is actively
monitored by our operational risk teams working closely with
Group Law, Group Compliance, Group Corporate
Communications and business unit management.
Strategic Risk
Strategic risk refers to adverse impacts from unexpected
changes to the Group’s operating and market environment.
Strategic risk is addressed as part of the business planning
process and ongoing monitoring of and response to
economic, political, regulatory, competitive and technical
changes that may impact AIA’s business.

FINANCIAL AND OPERATING REVIEW
AIA Group Limited Annual Report 2012
62
Our PeopleFINANCIAL AND OPERATING REVIEW
The quality and professionalism of our employees and agents
is paramount to us in ensuring that we are well positioned to
fulfil our goals, meet our customers’ needs and deliver value
to shareholders. Building an environment where high-quality
people are excited to work and motivated to achieve is
our priority.
In 2012, we continued to build on the strength of our
multicultural workforce with more than 20 nationalities
involved in management. We believe that this is reflective
of a work environment where merit leads to recognition
and advancement.
LAUNCH OF THE OPERATING PRINCIPLES
In 2012, we invested a great deal of time and energy to
articulate our “Operating Philosophy”. Employees across the
Group have rallied around the concept of “Doing the Right
Thing, in the Right Way, with the Right People”.
Underlying our Operating Philosophy are 12 Operating
Principles that help guide and shape our employees’ actions
and behaviours; informing how we interact with one another
and how we behave externally with our customers,
shareholders and other stakeholders, including the
community at large.
In 2012, these Operating Principles were launched in all of
AIA’s markets. Workshops were held across the Group to
ensure that the Principles were properly cascaded to all levels
of the organisation. We will continue to take action to ensure
that the Operating Principles are embodied in all of our
actions as we continue to create a very distinctive culture.
Employees across the Group have rallied around the Operating Philosophy of “Doing the Right Thing, in the Right Way, with the Right People”.
We held our Leadership Conference with the participation of around 300 top executives from across the Group and focused on the annual theme of “Doing the Right Thing, in the Right Way, with the Right People”.

FIN
AN
CIA
L A
ND
OP
ER
ATI
NG
RE
VIE
WO
VE
RV
IEW
AD
DIT
ION
AL
INF
OR
MA
TIO
NF
INA
NC
IAL
ST
AT
EM
EN
TS
CO
RP
OR
AT
E G
OV
ER
NA
NC
E
63Our People
EMPOWERING OUR OPERATIONS
We believe in empowering our local business units to run their
businesses with guidance from our Regional Chief Executives
and where appropriate our Group Office functions. The
long-term benefits emerging from a management structure of
empowered local teams include increased efficiency, better
and faster decision-making, better response times to
customers and improved levels of employee engagement. We
anticipate the benefits of this model will grow over time, which
will translate into further benefits to our customers,
shareholders and employees.
TRAINING AND DEVELOPMENT
In 2012, we maintained our commitment to providing a
comprehensive programme of tailored learning and
development for all employees. Our approach starts with a
thorough employee orientation programme and then identifies
regular opportunities provided throughout the employee’s
career in multiple formats, including on-the-job training,
coaching and mentoring and classroom learning. In 2012,
each of our employees was given the challenge to enhance
their capabilities through committing to undertaking at least
one learning action per year.
Included in our development programmes are extensive online
learning opportunities. Online learning modules provide
employees with a platform to learn and absorb new concepts
at their own pace. During the year, a wide range of modules
was made available and promoted to our employees,
including AIA Code of Conduct, Fraud Awareness, Anti-
Money Laundering, Performance Management, Equal
Employment Opportunity, Security and Safety, Prevention of
Insider Trading and Market Misconduct Policy, Handling of
Price Sensitive Information and Data Privacy.
Our two signature managerial programmes targeting middle
to senior managers – the “AIA Manager Programme” and
“AIA Manager As Coach Programme” – focus on helping
leaders understand their own strengths, how they can better
leverage those strengths to make a greater impact on teams
and the wider organisation, and ensuring their leadership
styles are conducive to performance delivery and
AIA’s long-term growth.
In order to ensure that we maximise the development of our
existing human capital, we provide secondment opportunities
for employees to work in different countries and in positions
that will broaden their experience with the ultimate goal of
enhancing their skills. In 2012, over 80 employees were
selected to be transferred to or participate in initiatives in
different markets and business units to help develop their
technical and leadership skills and expand their career
opportunities.
The AIA Mentoring programme pairs up experienced
managers and employees as an important additional support
and guidance channel.
As in previous years, our top executives from across the
Group (approximately 300 people) came together at a
Leadership Conference in Hong Kong. The theme in 2012
was “Doing the Right Thing, in the Right Way, with the Right
People” – in recognition of the critical importance of
embedding the Operating Principles into our culture as we
work to fulfil the Group’s growing potential. The Leadership
Conference focused on how AIA can best achieve the next
critical phase of growth, and provided updates on our
strategy, our people and our brand, as well as the innovative
thinking and actions taking place right across the business.
We maintained our commitment to providing a comprehensive programme of tailored learning and development for all employees.

FINANCIAL AND OPERATING REVIEW
AIA Group Limited Annual Report 2012
64
Our People
REWARDING PERFORMANCE
AIA is a meritocracy. We are committed to offering
compensation and benefits that are fair and competitive.
At the same time, we recognise the importance of creating
sustainable value for shareholders and therefore, our
compensation programmes ensure that employees are
rewarded based on both individual performance as well as
that of the Group.
Our Employee Share Purchase Plan allows employees to buy
AIA shares through a monthly allotment from their salary with
one additional matching share from the Company for every
two shares purchased by the individual, provided the
employee remains with the Company throughout the three-
year vesting period. Since its launch in 2011, the scheme has
been adopted in 13 locations across the region, with 25% of
eligible employees in 2012 enrolling in the scheme.
HEALTHY LIVING
The Group has a mission to promote healthy living for our
customers as well as our employees. In 2012 we implemented
a broad range of wellness initiatives to encourage good health
and well-being amongst our employees.
To help prevent illness we provided subsidised influenza
vaccinations. To encourage healthy eating, our canteen menu
was revised to provide a much greater selection of healthy
choices. Group Office’s Recreational Club organised a “Fruit
Monday” campaign whereby staff received a different piece of
fruit each Monday to encourage their regular consumption.
Our Inside AIA internal magazine was also revised to include a
To encourage healthy eating, our canteen menu was revised to provide a much greater selection of healthy choices.
Employees were encouraged to be active and were supported in taking up new activities.

FIN
AN
CIA
L A
ND
OP
ER
ATI
NG
RE
VIE
WO
VE
RV
IEW
AD
DIT
ION
AL
INF
OR
MA
TIO
NF
INA
NC
IAL
ST
AT
EM
EN
TS
CO
RP
OR
AT
E G
OV
ER
NA
NC
E
65Our People
Healthy Living section, which provided both nutritional
information and healthy recipes. This has proved popular with
our readers who now contribute their own Healthy Living
recipes for inclusion in the magazine.
Employees were also encouraged to be active and were
supported in taking up new activities. Sporting competitions
were organised right across the region, with employees
playing sports as diverse as badminton, basketball, football
and ten-pin bowling. These competitions have the added
benefit of allowing employees to get to know each other
better and enhance the sense of community amongst
employees. We also recognise the importance of mental
health and have introduced initiatives to enable employees to
have their stress levels measured and to receive advice on
managing and reducing stress.
Listening to our employees is an important starting point as we look to meet their expectations and help fulfil their potential.
LISTENING TO OUR EMPLOYEES
Listening to our 18,000 employees is an important starting
point as we look to meet their expectations and help fulfil their
potential. In 2011, we introduced the first Gallup Q12®
Employee Engagement survey to allow employees to share
their views on what makes AIA a great place to work. The
survey also helps our managers understand those areas
where employees think we could improve and allows us to
develop appropriate action plans to ensure that AIA continues
to engage employees. We conducted the survey again in
2012 with a very encouraging 95% employee response rate.
The results in 2012 have improved by 6.2% over 2011,
thanks to a number of tangible actions implemented in
response to employees’ feedback, such as increased clarity
around job roles and more effective two-way communication
at different levels of the Group.

FINANCIAL AND OPERATING REVIEW
AIA Group Limited Annual Report 2012
66
Corporate Social ResponsibilityFINANCIAL AND OPERATING REVIEW
Showing care for the communities which we serve as an
organisation has always been one of the key tenets of AIA’s
corporate values. Regardless of national boundaries and
cultures, the products and services we offer are designed to
serve a common purpose – to help people fulfil their hopes
and dreams for a better future for themselves and their
families. Doing what we can to help people lead longer,
healthier lives not only fits our business values, but also
complements the business activities we engage in every day.
Therefore, our Corporate Social Responsibility (CSR) activities
are guided by the following principles:
• Contribute positively to further the social and economic
development of the communities in which we operate;
• Show care for our customers, our employees and the
communities we serve and also extend our support to
those in need; and
• Contribute to the health and well-being of the people in our
markets across the region.
Our goal is to support local initiatives that encourage broad,
active participation at the grass roots level, eventually creating
a “multiplier effect” that would have the greatest positive
impact on the well-being of the people and communities
across Asia-Pacific.
FOCUS ON HEALTHY LIVING
Providing opportunities for people to engage in healthy activities
The importance of health and well-being to people across the
region was underscored by our landmark 2011 Healthy Living
Index Survey, which was conducted among over 10,000
adults in the 15 markets where we operate. The results
confirmed 98 per cent of adults believe “living a healthy life is
important”. However, their Healthy Living Index scores
averaged only 6.1 out of 10, which showed much room for
improvement. Our Healthy Living Index Survey also confirmed
healthy living extends beyond physical exercise to also include
eating healthier foods, having enough sleep, managing stress,
losing weight, getting regular check-ups and maintaining a
happy frame of mind.
In 2012, we were active supporters in a number of
good-for-health events with the capacity to attract large
numbers of participants.
In Thailand, the AIA-sponsored football clinics provided basic training and coaching to 4,660 youths.

FIN
AN
CIA
L A
ND
OP
ER
ATI
NG
RE
VIE
WO
VE
RV
IEW
AD
DIT
ION
AL
INF
OR
MA
TIO
NF
INA
NC
IAL
ST
AT
EM
EN
TS
CO
RP
OR
AT
E G
OV
ER
NA
NC
E
67Corporate Social Responsibility
In Hong Kong, we were active supporters of the Community
Chest Walk for Millions, which attracted more than 14,000
public participants and also raised funds for family and child
welfare services. AIA in Hong Kong was also the Corporate
Partner of Médecins Sans Frontières’ (MSF) annual
Orienteering Competition, the largest of its kind in Hong Kong,
attracting 2,800 participants.
In Singapore, AIA was a Presenting Sponsor of the
Jurong Lake Run 2012, an event that attracted more than
15,000 participants.
In Indonesia, we were the main partner of the Jakarta Race
2012 where over 3,000 participants ran, walked, jogged and
even used wheelchairs to complete the designated route to
support the Indonesian Cancer Foundation.
In India, Tata AIA sponsored two non-governmental
organisations (NGOs), namely Child Relief and You (CRY) and
Childline India Foundation, through participation in the Mumbai
Marathon 2012, which attracted a record 38,775 participants.
In Thailand, the AIA-sponsored football clinics provided basic
training and coaching to 4,660 youths.
In Australia, we were a major sponsor of Droptober, an annual
fundraising event aimed at combating the obesity crisis by
encouraging participants to lose two kilogrammes in weight in
October. In 2012, more than 550 people participated to mark
the beginning of their healthy living journey.
Since our Healthy Living Index Survey also confirmed the
importance of healthy living to our employees, we encouraged
our employees, agents and even their families to participate in
the various walkathons and marathons that we sponsored.
Our employees and agents lending a helping hand
Our employees and agents are generous in helping others
across the region. They showed great enthusiasm in
organising and participating in community events and
volunteering activities, many of which also raised money for
those in need.
To assist children with cancer, 40 employees and agents from
AIA in Singapore gamely shaved their heads and raised over
US$81,000 for Hair for Hope. In addition, 500 employees,
agents as well as their families and policyholders participated
in the Jurong Lake Run raising over US$130,000 for the
Children’s Cancer Fund.
In Hong Kong, we were active supporters of the Community Chest Walk for Millions, which attracted more than 14,000 public participants.
In Singapore, AIA was a Presenting Sponsor of the Jurong Lake Run 2012, an event that attracted more than 15,000 participants.

FINANCIAL AND OPERATING REVIEW
AIA Group Limited Annual Report 2012
68
Corporate Social Responsibility
More than 1,200 employees and agents from our offices in
Hong Kong and in Macau participated in the 2012 Walk for
Millions and raised over US$43,000 for the Community Chest.
This year, 550 of our Hong Kong employees and agents took
part in the MSF Orienteering Competition and raised over
US$75,000.
In Indonesia, some 500 employees and agents took part in
the Jakarta Race 2012 to raise funds for direct patient
support, cancer education and prevention. In Taiwan, 340
employees, agents and their families joined the AIA Healthy
Living Charity Hike and raised money to prepare healthy
lunches for 200 school children from low-income families.
In Thailand, our employees volunteered to provide healthy
lunches and basic check-ups for 150 school children. They
also built a gymnasium so disadvantaged children residing in
remote areas have a good place to exercise.
In Australia, our employees participated in a range of
volunteering activities that benefited 500 disadvantaged
young people, including students and the disabled. Such
initiatives ranged from refreshing a garden to supporting
literacy education.
In the Philippines, more than 350 employees took part in
volunteering events organised under Philam Life’s KaAkbay
Volunteer Programme. In addition to building houses for the
disadvantaged and reading bedside stories to paediatric
patients, our staff also made cash donations.
Our employees in Vietnam provided meals and financial
support to 1,500 inpatient children at the Ho Chi Minh City
Paediatric Hospital and also spent time with 300 handicapped
children in two outlying provinces.
Using healthy activities to commemorate special occasions
Further demonstrating their commitment to health and
well-being, some of our employees and agents also chose
to celebrate special occasions with meaningful healthy
living activities.
To commemorate the 25th anniversary of AIA in Korea, more
than 1,000 of our employees and telemarketers participated
in a 2.5-hour walkathon in Seoul, which raised US$23,000 for
the Korea Association for Children with Leukaemia and
Cancer. AIA in Korea also donated 300 bicycles to
disadvantaged children at the Happy Home School.
In China, our employees, customers and the general public
participated in a charity run to celebrate the 10th anniversary
of our presence in Suzhou. For each of the 816 participants,
AIA donated RMB10 to the China Children’s Teenager Fund
to assist children with cancer.
To celebrate the second anniversary of AIA’s public listing,
our colleagues from the Investment teams across the region
participated in various community activities such as visiting
elderly homes and orphanages.
Our employees in Vietnam provided meals and financial support to 1,500 inpatient children in Ho Chi Minh City, Vietnam.

FIN
AN
CIA
L A
ND
OP
ER
ATI
NG
RE
VIE
WO
VE
RV
IEW
AD
DIT
ION
AL
INF
OR
MA
TIO
NF
INA
NC
IAL
ST
AT
EM
EN
TS
CO
RP
OR
AT
E G
OV
ER
NA
NC
E
69Corporate Social Responsibility
PROMOTING HEALTHCARE HABITS
According to the AIA Healthy Living Index Survey, about nine
in 10 adults across the region agree “obesity among the
younger generation is a worrying trend.” In response to this,
AIA in Hong Kong engaged dietitians to help students in six
secondary schools reduce their weight via better eating
habits. In India, Tata AIA gave free body mass index (BMI)
tests to 1,774 students in Delhi, Mumbai, Kolkata and
Bangalore.
To raise awareness about life-threatening illnesses, AIA in
Indonesia organised two rounds of free cervical cancer
examinations for 2,500 women in Makassar and Surabaya.
In Malaysia, AIA hosted an event about heart health at the
country’s largest heart-health exhibition, which attracted
approximately 20,000 participants.
Under our Philam Paaralan Programme in the Philippines,
there is the Fit for School partnership scheme to promote
proper hygiene by providing a full year’s supply of soap,
toothpaste and toothbrushes to more than 500 students.
Tata AIA gave free BMI tests to 1,774 students in India.
AIA in Indonesia organised free cervical cancer examinations for 2,500 women.
Under our Philam Paaralan Programme in the Philippines, there is the Fit for School partnership scheme to promote proper hygiene to more than 500 students.
In Thailand, we provided fibreglass water tanks to
communities in remote areas benefiting over 7,800 people
in need of clean drinking water.
In 2012, we continued to support our long-standing
commitments that cover crucial surgeries for children in need.
In Thailand, we helped bring hope for a better future for
children with facial deformities through our Operation Smile
Project, a collaboration we have had with the Operation Smile
Foundation since 2000. In 2012, AIA funded operations for
another 170 young patients with cleft lips, cleft palates and
other facial deformities.
In Malaysia, AIA continued to support the AIA Have-A-Heart
Fund (HAHF) covering surgical costs for children with
congenital heart conditions. In 2012, the HAHF raised over
US$38,000 to cover the surgical costs of eight children
through a combination of donations from AIA in Malaysia and
its agents.
FINANCIAL AND OPERATING REVIEW
AIA Group Limited Annual Report 2012
70
Corporate Social Responsibility
CARING FOR THE ENVIRONMENT
With our deep roots in Asia and our commitment to improving
people’s health and well-being, we are naturally concerned
about environmental issues, which ultimately impact people’s
health. As such, we do our best to support environmentally
friendly initiatives.
To help raise awareness about the new environmental
challenge of electronic waste (e-waste), AIA in Hong Kong
and the Chinese University of Hong Kong (CUHK) launched a
landmark survey of 1,200 adults in Hong Kong, where
approximately 70,000 tonnes of electrical and electronic
waste are generated each year. With average ownership of
3.5 portable electronic devices (e-devices) among adults,
e-waste is a burgeoning challenge – and something the
people of Hong Kong agree also impacts their health.
The survey is part of a larger collaboration between AIA and
CUHK to raise awareness about e-waste, which was also
supported by the launch of the WeCareAboutEwaste.com
website in August 2012 and the distribution of over 3,500
“Breathe new life into your old e-devices” posters. The
posters encourage donation of old e-devices to a qualified
NGO where data can be purged and new software installed
for use by those less able to afford such devices.
Collaborating with CUHK – with its 20,000 students and
eventual access to hundreds of secondary schools – means
we are not just helping the next generation of business
leaders to become more environmentally conscious but also
the generation after that.
Our employees and agents across the region also engaged in
a variety of environmentally friendly “green initiatives”. In
China, our employees and their families helped plant trees in
the suburbs of Beijing for the fourth consecutive year, and in
Hong Kong and in Macau, we encouraged employees to
“go green” in their daily lives through regular “green tips”
reminders via the intranet.
AIA is also securing more recognition from green building
authorities. In China, our new AIA Financial Centre will be
the first commercial building in Foshan to be certified a
“green building” by the well-recognised green building
authority Leadership in Energy and Environmental Design
(LEED). In Thailand, the two commercial buildings AIA is
investing in – the AIA Capital Centre (to be completed in 2014)
and AIA Sathorn Tower in Bangkok (to be completed in 2015)
– are both designed to meet “green building” certification
by LEED.
In 2012, AIA Central, our headquarters building in Hong Kong
became the first Grade-A commercial building to receive the
Silver Certification for Existing Buildings: Operations &
Maintenance from LEED for its continued promotion of
environmentally friendly initiatives.
In general, we also try to conserve use of electricity and water
by motion-sensitive devices as well as reducing lift services
after office hours. In addition to recycling of paper, more
simply, we encourage double-sided and black-and-white
printing.
ExTENDING THE POWER OF EDUCATION
We are a firm believer in the power of education as a very
good way to develop future generations of responsible
individuals who will make positive contributions to society.
In China, we sponsored the construction of a new AIA Library
in a Guangdong Province primary school for 3,000 migrant
workers’ children, including donations for a computer room
and improvements for other facilities. Through its AIA
Scholarship Programme, AIA in China granted scholarships to
30 students majoring in insurance studies. Additionally, our
long-standing AIA Actuarial Centre sponsored 132 students
to take examinations to become qualified actuaries.
In the Philippines, we partnered with the Department of
Education through our Philam Paaralan Programme to build
fully furnished classrooms in underserved areas, while in
Thailand we built fully equipped libraries for schools to provide
educational opportunities for 1,500 children living in the
outlying communities.

FIN
AN
CIA
L A
ND
OP
ER
ATI
NG
RE
VIE
WO
VE
RV
IEW
AD
DIT
ION
AL
INF
OR
MA
TIO
NF
INA
NC
IAL
ST
AT
EM
EN
TS
CO
RP
OR
AT
E G
OV
ER
NA
NC
E
71Corporate Social Responsibility
In India, we gave scholarships to outstanding young people
through the Foundation for Academic Access and Excellence,
a Delhi-based organisation committed to providing
opportunities for economically disadvantaged groups to
access quality education.
Across Vietnam, we donated school supplies and books to
2,000 students and also granted scholarships to more than
400 disadvantaged children.
In Hong Kong, we continued to nurture future leaders through
the AIA Foundation’s Young Leaders Development
Programme – our 15th year of supporting this worthwhile
initiative. This programme aims to strengthen the leadership
skills of capable young men and women, highlighting the
importance of community service and personal integrity.
More than 400 university students have participated in the
programme since its inception in 1996. Separately, AIA
Foundation granted scholarships worth US$37,600 to
22 deserving students.
Over the past 15 years, over 400 university students have participated in our Young Leaders Development Programme.
OTHER COMMUNITY SUPPORT
We are committed to helping the local communities in times
of natural disasters but thankfully 2012 was not a year of
major disasters in the Asia-Pacific region. Nonetheless, we
extended special community support where there was need.
In China, we built the AIA Deyang Orphanage in Sichuan
Province to house 184 children.
In celebration of Philam Life’s 65th anniversary, for every
Philam Life policy sold between June 2012 and the end of
the year, we donated 65 pesos to the Philam Paaralan
Programme to help build more schools in underserved and
calamity-stricken areas in the Philippines.
In Thailand, we built police booths for 1,600 traffic police to
ensure their safety while also shielding them from extreme
weather conditions. AIA in Thailand also constructed a
multi-purpose town hall building for 200 people in the local
community.
To minimise paediatric drowning, one of the leading causes of
accidental deaths in Vietnam among children, AIA donated
more than 1,600 lifesaver (flotation) school bags to children in
10 provinces.
Embracing diversity of local cultures is also one of our key
business values. AIA in New Zealand sponsored a reality
television series called “Marae DIY” to highlight some of the
deep-rooted traditions for the Maori community.
SUMMARY
In 2012, we are proud to have helped provide good-health-
oriented activities for over 110,000 members of the general
public across the region, not counting participation by over
24,000 of our employees and agents. Our other caring
initiatives benefited over 15,000 children, students and adults
in need through active participation and efforts by over 2,400
of our employees and agents.
With our long and deep roots in the Asia-Pacific region, we
will continue to care for our customers, our employees, our
agents and the communities we serve as well as extend our
support to those in need – helping as many people as we can
achieve their hope for a better future which includes leading a
longer, healthier life.


Experienced Leadership
We have the right people to continue to deliver sustainable and profitable growth in the right way.
Right WayIn the

CORPORATE GOVERNANCE
AIA Group Limited Annual Report 2012
74
Statement of Directors’ ResponsibilitiesCORPORATE GOVERNANCE
The Directors are responsible for preparing the Company’s
consolidated financial statements in accordance with
applicable laws and regulations.
In preparing the consolidated financial statements of the
Company, the Directors are required to:
• Select suitable accounting policies and apply them
consistently;
• Make judgments and estimates that are reasonable and
prudent;
• State whether they have been prepared in accordance
with International Financial Reporting Standards and
Hong Kong Financial Reporting Standards; and
• Prepare the financial statements on a going concern basis,
unless it is not appropriate to make the presumption that
the Group will continue in business.
The Directors are responsible for keeping proper accounting
records that give a true and fair view of the state of the
Company’s affairs and explain its transactions.
The Directors are responsible for taking such steps as are
reasonably open to them to safeguard the assets of the
Group and to prevent and detect fraud and other irregularities.
Under applicable laws and regulations, the Directors are also
responsible for preparing a Report of the Directors and the
Corporate Governance Report on pages 80 to 93 of this
Annual Report.
The Directors confirm, to the best of their knowledge, that:
1. the consolidated financial statements of the Company,
prepared in accordance with International Financial
Reporting Standards and Hong Kong Financial Reporting
Standards, give a true and fair view of the assets, liabilities,
financial position, cash flows and results of the Company
and its undertakings included in the consolidated financial
statements taken as a whole; and
2. the section headed “Financial and Operating Review”
included in this Annual Report presents a fair review of the
development and performance of the business and the
position of the Company and the undertakings included in
the consolidated financial statements taken as a whole,
together with a description of the principal risks and
uncertainties they face.

CO
RP
OR
AT
E G
OV
ER
NA
NC
EO
VE
RV
IEW
FIN
AN
CIA
L A
ND
OP
ER
ATI
NG
RE
VIE
WA
DD
ITIO
NA
L IN
FO
RM
AT
ION
FIN
AN
CIA
L S
TA
TE
ME
NT
S
75
Board of Directors and Executive CommitteeCORPORATE GOVERNANCE
Dr. Qin Xiao Dr. Narongchai AkrasaneeMr. George Yong-Boon YeoMr. Barry Chun-Yuen CheungMr. John Barrie Harrison
Mr. Edmund Sze-Wing Tse Mr. Jack Chak-Kwong So Mr. Chung-Kong ChowMr. Mark Edward Tucker
NON-ExECUTIVE CHAIRMAN AND NON-ExECUTIVE DIRECTOR
Mr. Edmund Sze-Wing TseAged 75, is the Non-executive Chairman and a Non-executive
Director of the Company. He is also the Chairman of The
Philippine American Life and General Insurance Company.
Amongst Mr. Tse’s appointments during more than 40 years
with the Group, he served as Honorary Chairman of AIA Co.
from July 2009 to December 2010, Chairman and Chief
Executive Officer of AIA Co. from 2000 to June 2009 and its
President and Chief Executive Officer from 1983 to 2000.
Mr. Tse is a Non-executive Director of PCCW Limited and
PICC Property and Casualty Company Limited. He has also
been a Non-executive Director of PineBridge Investments
Limited since May 2012. In recognition of his outstanding
contributions to the development of Hong Kong’s insurance
industry, Mr. Tse was awarded the Gold Bauhinia Star by the
HKSAR Government in 2001. Mr. Tse received an honorary
fellowship and an honorary degree of Doctor of Social
Sciences from The University of Hong Kong in 1998 and 2002
respectively. In 2003, Mr. Tse was elected to the prestigious
Insurance Hall of Fame. Mr. Tse was appointed as a
Non-executive Director of the Company on 27 September
2010 and Non-executive Chairman on 1 January 2011.
ExECUTIVE DIRECTOR
Mr. Mark Edward TuckerAged 55, is an Executive Director and the Group Chief
Executive and President of the Company. For the period from
12 October 2010 to 31 December 2010, he served as Group
Executive Chairman and Group Chief Executive Officer of the
Company. Mr. Tucker joined the Group in July 2010 and is
also Chairman of AIA Co. and AIA-B. He is responsible for the
strategic direction and overall management and performance
of the Group. In addition to his responsibilities with the Group,
Mr. Tucker has been an Independent Director of The
Goldman Sachs Group, Inc. since 5 November 2012. Prior to
joining the Group, Mr. Tucker served as Group Chief
Executive of Prudential plc from 2005 to 2009. Amongst the
leadership positions that Mr. Tucker occupied during his time
at Prudential, he was the founder and Chief Executive of
Prudential Corporation Asia Limited from 1994 to 2003 and
an Executive Director of Prudential plc from 1999 to 2003.
During the period from 2004 to 2005, Mr. Tucker was Group
Finance Director of HBOS plc. Mr. Tucker was a
Non-executive Director of the Court of The Bank of England
from June 2009 to May 2012, also serving as a member of its
Financial Stability Committee and Audit and Risk Committee.
Mr. Tucker qualified as a Chartered Accountant (ACA) in 1985.

CORPORATE GOVERNANCE
AIA Group Limited Annual Report 2012
76
Board of Directors and Executive Committee
INDEPENDENT NON-ExECUTIVE DIRECTORS
Mr. Jack Chak-Kwong SoAged 67, is an Independent Non-executive Director of the
Company. From August 2007 to September 2010, Mr. So
served as an Independent Non-executive Director of AIA Co.,
a wholly-owned subsidiary of the Company. He is currently an
Independent Non-executive Director of Cathay Pacific Airways
Limited and an independent Senior Advisor to Credit Suisse.
Mr. So also served as an Executive Director of the Hong Kong
Trade Development Council from 1985 to 1992 and was
appointed as its Chairman in October 2007. He was also
appointed by the HKSAR Government as the Chairman of the
Film Development Council in 2007 and was awarded the Gold
Bauhinia Star in 2011. He has been a member of the Chinese
People’s Political Consultative Conference since 2008 and is a
member of the International Business Leader Advisory Council
for the Mayor of Beijing. Mr. So was appointed as a
Non-executive Director of the Company on 28 September
2010 and re-designated as an Independent Non-executive
Director of the Company on 26 September 2012.
Mr. Chung-Kong ChowAged 62, is an Independent Non-executive Director of the
Company. Mr. Chow is the Chairman of Hong Kong
Exchanges and Clearing Limited. He has been an Independent
Non-executive Director of Anglo American plc since 2008.
Mr. Chow was Chief Executive Officer of MTR Corporation
Limited, Hong Kong from 2003 to 2011 and Chief Executive
Officer of Brambles Industries plc, a global support services
company, from 2001 to 2003. From 1997 to 2001, Mr. Chow
was the Chief Executive of GKN plc, a leading engineering
company based in the United Kingdom. Mr. Chow has been
appointed as a non-official member of the Executive Council of
Hong Kong from 1 July 2012 and the Chairman of Advisory
Committee on Corruption, Independent Commission Against
Corruption from 1 January 2013. He is the Chairman of the
Hong Kong General Chamber of Commerce. He has also
been a Steward of The Hong Kong Jockey Club since March
2011. In 2000, Mr. Chow was knighted in the United Kingdom
for his contribution to industry. Mr. Chow was appointed as an
Independent Non-executive Director of the Company on
28 September 2010.
Dr. Qin XiaoAged 65, is an Independent Non-executive Director of the
Company. Dr. Qin served as Chairman of China Merchants
Bank Co., Ltd. from April 2001 to September 2010 and as
Chairman of China Merchants Group Limited from December
2000 to August 2010; President of China International Trust
and Investment Corporation (CITIC) from April 1995 to July
2000; Vice Chairman of CITIC from July 2000 to December
2001 and Chairman of CITIC Industrial Bank from 1998 to
2000. Dr. Qin has been appointed as Non-executive Chairman
of Amex Resources Limited since April 2012. He has served
as Independent Non-executive Director of HKR International
Limited since 2009 and of China Telecom Corporation Limited
and China World Trade Center Co., Ltd. since 2008 and 2010,
respectively. He has been a member of Lafarge’s International
Advisory Board since 2007, Chairman of the Asia Business
Council since 2009 and a member of the Financial Services
Development Council since 17 January 2013. Dr. Qin was
appointed as an Independent Non-executive Director of the
Company on 28 September 2010.
Mr. John Barrie HarrisonAged 56, is an Independent Non-executive Director of the
Company. Mr. Harrison is currently an Independent
Non-executive Director of Hong Kong Exchanges and Clearing
Limited and an Independent Non-executive Director of The
London Metal Exchange Limited. He is also an Independent
Non-executive Director of BW Group Limited. He has been a
member of the Asian Advisory Committee of AustralianSuper
Pty Ltd since 30 June 2012. Mr. Harrison is a council member,
standing committee member and honorary treasurer of The
Hong Kong University of Science and Technology. From 2008
to 2010, he was Deputy Chairman, KPMG International. In
2003, Mr. Harrison was elected Chairman of KPMG, China
and Hong Kong and Chairman of KPMG Asia Pacific.
Mr. Harrison began his career with KPMG in London in 1977
and was made a partner of KPMG Hong Kong in 1987.
Mr. Harrison is a Fellow of the Institute of Chartered
Accountants in England and Wales and a member of the
Hong Kong Institute of Certified Public Accountants.
Mr. Harrison was appointed as an Independent Non-executive
Director of the Company on 1 July 2011.

CO
RP
OR
AT
E G
OV
ER
NA
NC
EO
VE
RV
IEW
FIN
AN
CIA
L A
ND
OP
ER
ATI
NG
RE
VIE
WA
DD
ITIO
NA
L IN
FO
RM
AT
ION
FIN
AN
CIA
L S
TA
TE
ME
NT
S
77Board of Directors and Executive Committee
Mr. Barry Chun-Yuen CheungAged 55, is an Independent Non-executive Director of the
Company. Mr. Cheung is currently a non-official member of
the Executive Council of Hong Kong, Chairman of the Hong
Kong Mercantile Exchange Limited, Chairman of the Urban
Renewal Authority, and Chairman of the Standing Committee
on Disciplined Services Salaries and Conditions of Service. He
is a member of the Honours Committee, the Non-official
Justices of the Peace Selection Committee and the Long
Term Housing Strategy Steering Committee. He has served
as an Independent Non-executive Director of UC RUSAL Plc
since January 2010 and was elected as its Chairman from
March 2012 to September 2012. He is also an Independent
Non-executive Director of Gateway Energy & Resource
Holdings, Ltd. From 1987 to 1994, Mr. Cheung was with
McKinsey & Company, Inc. in Los Angeles and Hong Kong
during which time he advised major financial institutions in the
United States and Asia, and was seconded to the Hong Kong
Government’s Central Policy Unit as a full-time member.
Mr. Cheung was appointed as an Independent Non-executive
Director of the Company on 20 September 2012.
Mr. George Yong-Boon YeoAged 58, is an Independent Non-executive Director of the
Company. Mr. Yeo is currently the Vice-chairman of Kerry
Group Limited and the Chairman of Kerry Logistics Network
Limited. He is a member of the Foundation Board of the
World Economic Forum and the Nicolas Berggruen Institute’s
21st Century Council. In 2012 Mr. Yeo was presented with
the Order of Sikatuna by the Philippines Government and the
Padma Bhushan by the Indian Government, and became an
Honorary Officer of the Order of Australia. From 1988 to
2011, Mr. Yeo was a Member of the Singapore Parliament
and held various Cabinet positions, including Minister for
Foreign Affairs, Minister for Trade and Industry, Minister for
Health, Minister for Information and the Arts and Minister of
State for Finance. From 1972 to 1988, Mr. Yeo served in the
Singapore Armed Forces and attained the rank of Brigadier-
General in 1988 when he was Director of Joint Operations
and Planning in the Ministry of Defence. Mr. Yeo was
appointed as an Independent Non-executive Director of the
Company on 2 November 2012.
Dr. Narongchai Akrasanee Aged 67, is an Independent Non-executive Director of the
Company. Dr. Narongchai is a former Minister of Commerce
for Thailand and Senator and has acted as adviser to several
Thai Prime Ministers. He retired as Chairman of the Export-
Import Bank of Thailand in June 2010. Dr. Narongchai also
served as a Director of the Office of the Insurance
Commission of Thailand during the period from October 2007
to August 2012. He is currently a Director of the National
Economic and Social Development Board, Chairman of the
Thailand National Committee for the Pacific Economic
Cooperation Council and a member of the Monetary Policy
Committee of the Bank of Thailand. Dr. Narongchai also acts
as a director for certain entities listed on the Stock Exchange
of Thailand, including acting as Chairman of MFC Asset
Management Public Company Limited, Chairman of Ananda
Development Public Company Limited, Vice Chairman and an
independent director of Thai-German Products Public
Company Limited and as an independent director of Malee
Sampran Public Company Limited. He is also Chairman and
an independent director of The Brooker Group Public
Company Limited, which is listed on the Stock Exchange of
Thailand’s Market for Alternative Investment. Dr. Narongchai
was appointed as an Independent Non-executive Director of
the Company on 21 November 2012.

CORPORATE GOVERNANCE
AIA Group Limited Annual Report 2012
78
From left to right (back) : Ng Keng Hooi, Shulamite Khoo, Gordon Watson, William Lisle, Simeon Preston, Paul Groves, Huynh Thanh Phong
(front) : John Tai-Wo Chu, Mitchell New, Mark Edward Tucker, Garth Jones
Board of Directors and Executive Committee
ExECUTIVE COMMITTEE
Mr. Mark Edward Tucker Mr. Tucker’s biography is set out above.
Mr. Garth Jones Aged 50, is the Group Chief Financial Officer, responsible for
leading the Group in all aspects of finance and risk management
as well as managing relationships with key external stakeholders,
including regulators and rating agencies. He is also responsible
for the Annual Business Planning and Budgeting process and
the Group Corporate Transaction team which supports merger
and acquisition activity across the Group. He joined the Group in
April 2011. Prior to joining the Group, Mr. Jones was the
Executive Vice President of CPIC Life, the life insurance arm of
China Pacific Insurance (Group) Co., Ltd. (CPIC). He also held a
number of senior management positions during 12 years with
Prudential Corporation Asia Limited, including Chief Financial
Officer of the Asian life insurance operations. Prior to joining
Prudential, Mr. Jones led the development of reinsurer Swiss
Re’s Asia life business. Mr. Jones is a Fellow of the Institute of
Actuaries in the United Kingdom.
Mr. Ng Keng Hooi Aged 58, is the Regional Chief Executive responsible for the
Group’s businesses operating in Singapore, Brunei, Malaysia,
China and Taiwan as well as Group product strategy. He is a
director of various companies within the Group including
AIA Co. and AIA-B. He joined the Group in October 2010. Prior
to joining the Group, Mr. Ng was Group Chief Executive Officer
and Director of Great Eastern Holdings Limited from December
2008. Mr. Ng worked for Prudential plc from 1989 to 2008,
serving as a Managing Director of Insurance of Prudential
Corporation Asia Limited from 2005 to 2008 responsible for its
operations in Malaysia, Singapore, Indonesia and the
Philippines. He has been a Fellow of the Society of Actuaries
(U.S.) since 1985.
Mr. Huynh Thanh Phong Aged 46, is the Regional Chief Executive responsible for the
Group’s businesses operating in Thailand, Indonesia, Vietnam,
India and Sri Lanka. He is a director of various companies
within the Group including AIA Co. and AIA-B. He joined the
Group in October 2010. Prior to joining the Group, Mr. Huynh
was the Executive Vice President for Insurance of Fullerton
Financial Holdings Pte. Ltd. in Singapore from 2009. Mr. Huynh
worked for Prudential plc from 1996 to 2005, serving as the
founding Chief Executive Officer of Prudential Vietnam
Assurance Private Ltd. and as a Managing Director of
Insurance of Prudential Corporation Asia Limited from 2005 to
2008 responsible for its operations in China, India, Vietnam,
Thailand and the Middle East. Mr. Huynh is a qualified actuary
and a Fellow of both the Society of Actuaries (U.S.) and the
Canadian Institute of Actuaries.

CO
RP
OR
AT
E G
OV
ER
NA
NC
EO
VE
RV
IEW
FIN
AN
CIA
L A
ND
OP
ER
ATI
NG
RE
VIE
WA
DD
ITIO
NA
L IN
FO
RM
AT
ION
FIN
AN
CIA
L S
TA
TE
ME
NT
S
79Board of Directors and Executive Committee
Mr. Gordon WatsonAged 49, is the Regional Chief Executive responsible for the
Group’s businesses operating in Hong Kong, Macau, Korea,
the Philippines, Australia and New Zealand as well as the
Group Corporate Solutions business and the Group’s
partnership distribution. He is a director of various companies
within the Group including AIA Co. and AIA-B. Mr. Watson
rejoined the Group in January 2011. He has worked in various
parts of AIG (including within AIA) for over 27 years, during
which time he served as Global Vice Chairman of ALICO and
Chairman and Chief Executive Officer of ALICO Asia. He also
served as Global Chief Operating Officer and as Chairman of
ALICO Japan, driving the profitable growth of that major
business. He is a Fellow of the Chartered Insurance Institute
and Chartered Institute of Marketing.
Mr. John Tai-Wo ChuAged 73, is the Group Chief Investment Officer responsible for
providing oversight to the management of the investment
portfolios of the Group. He is a director of various companies
within the Group. Mr. Chu joined the Group in June 1993 as
Senior Vice President and Chief Investment Officer of AIA Co.
Prior to joining the Group, Mr. Chu spent 19 years with
Bank of America in various senior management positions,
including Country Senior Credit Officer, Head of Corporate
Banking in Hong Kong and Country Manager of Bank of
America in China.
Mr. Simeon PrestonAged 42, is the Group Chief Strategy and Operations Officer
responsible at the Group level for business strategy
development and execution, and since August 2012 also for
the Group’s technology and operations. He joined the Group
in September 2010. Prior to joining the Group, Mr. Preston
served as a senior partner in the financial services practice of
global management consultants Bain & Company, where he
specialised in the Asia life insurance sector. He previously
spent almost nine years with consulting firm Marakon
Associates and was named a partner in 2006.
Mr. William LisleAged 47, is the Group Chief Agency Officer responsible for
the Group Distribution function for Agency. He is also the
Chief Executive Officer of AIA Malaysia and has been leading
the integration of ING with the Group’s business in Malaysia
since the completion of the acquisition of ING Malaysia. He
joined the Group in January 2011. Prior to joining the Group,
Mr. Lisle was the Managing Director, South Asia of Aviva from
May 2009 until 2010. Mr. Lisle also occupied a number of
senior positions in Prudential Corporation Asia Limited,
including Chief Executive Officer in Malaysia (2008 to 2009)
and Korea (2005 to 2008), Chief Agency Officer for ICICI
Prudential from 2002 to 2004 and Director of Agency
Development, South Asia in 2001.
Ms. Shulamite KhooAged 51, is the Group Human Resources Director responsible
for the development of human capital strategies and their
implementation across the Group; as well as providing
support to human resources functions within country
operation. She is also responsible for the Group Corporate
Security and Facility functions. She joined the Group in
January 2011. Prior to joining the Group, Ms. Khoo was
Group Executive Vice President, Global Head of Human
Resources of the AXA Group, based in Paris. Prior to AXA,
she was Regional Head of Human Resources for Prudential
Corporation Asia Limited based in Hong Kong.
Mr. Paul GrovesAged 50, is the Group Chief Marketing Officer responsible for
Marketing and Communications at the Group level and in
providing support on marketing issues for country operations.
He joined the Group in January 2011. Prior to joining the
Group, Mr. Groves served as Senior Vice President, Head of
International Marketing & Direct to Consumer Channel of
MetLife International (formerly ALICO). Mr. Groves also
worked with GE Money where he served as Chief Marketing
Officer for the United Kingdom and Ireland. Mr. Groves spent
27 years with Barclays and Barclaycard in the United
Kingdom, serving latterly as Chief Marketing Officer of
Barclaycard International.
Mr. Mitchell New Aged 49, is the Group General Counsel, responsible for the
provision of legal services and company secretarial services
for the Group and providing support to legal and corporate
governance functions within country operations. He joined the
Group in April 2011. Prior to joining the Group, Mr. New
occupied various senior roles with Manulife Financial where he
was most recently Senior Vice President & Chief Legal Officer
for Asia, based in Hong Kong and with responsibility for
providing legal services to its operations in 10 countries in
Asia. He also managed several strategic initiatives including
Manulife’s demutualisation in Asia, which led to the listing by
Manulife of its shares on the stock exchanges of Hong Kong
and the Philippines. In addition to the Asia division, he was
also previously Senior Vice President and General Counsel to
Manulife’s Canadian division.

CORPORATE GOVERNANCE
AIA Group Limited Annual Report 2012
80
Report of the DirectorsCORPORATE GOVERNANCE
The Board is pleased to present this Annual Report and the
audited consolidated financial statements of the Company for
the year ended 30 November 2012.
PRINCIPAL ACTIVITIES
The Company is an investment holding company. The
principal activities of the Group are the provision of products
and services to individuals and businesses for their insurance,
protection, savings, investment and retirement needs.
Details of the activities and other particulars of the Company’s
principal subsidiaries are set out in note 42 to the financial
statements.
RESULTS
The results of the Group for the year ended 30 November
2012 and the state of the Group’s affairs at that date are set
out in the financial statements on pages 105 to 210 of this
Annual Report.
DIVIDEND
An interim dividend of 12.33 Hong Kong cents per share
(2011: 11.00 Hong Kong cents per share) was paid on
31 August 2012. The Board has recommended a final
dividend of 24.67 Hong Kong cents per share (2011: 22.00
Hong Kong cents per share) in respect of the year ended
30 November 2012. Together with the interim dividend
already paid, this will result in a total dividend of 37.00
Hong Kong cents per share (2011: 33.00 Hong Kong cents
per share) for the year ended 30 November 2012.
Under the Trust Deed of the Company’s Restricted Share Unit
Scheme (RSU Scheme), shares of the Company are held by
the trustee in either of two trust funds. These shares are held
against the future entitlements of scheme participants.
Provided the shares of the Company are held by the trustee
and no beneficial interest in those shares has been vested in
any beneficiary, the trustee shall waive any right to dividend
payments or other distributions in respect of those shares
(unless the Company determines otherwise).
As of 31 August 2012 (being the payment date of the interim
dividend), 52,831,920 shares were held by the trustee. The
amount of interim dividend waived was US$0.8 million.
Pursuant to the Trust Deed, the trustee will waive the right to
final dividend if it is declared.
Subject to shareholders’ approval at the AGM, the final dividend
will be payable on Thursday, 30 May 2013 to shareholders
whose names appear on the register of members of the
Company at the close of business on Wednesday, 15 May 2013.
DIRECTORS
The Directors of the Company during the year and up to the
date of this Annual Report are as follows:
Non-executive Chairman and Non-executive Director
Mr. Edmund Sze-Wing Tse
Executive Director
Mr. Mark Edward Tucker(Group Chief Executive and President)
Independent Non-executive Directors
Mr. Jack Chak-Kwong So (1)
Mr. Chung-Kong Chow (2)
Dr. Qin Xiao
Mr. John Barrie Harrison (2)
Mr. Barry Chun-Yuen Cheung
Mr. George Yong-Boon Yeo
Dr. Narongchai Akrasanee
Mr. Rafael Si-Yan Hui (3)
Non-executive Directors
Mr. Jeffrey Joy Hurd (3)
Mr. Jay Steven Wintrob (3)
Notes:
(1) Mr. So was appointed as Non-executive Director on 28 September 2010. Mr. So was re-elected as Non-executive Director by shareholders at the 2012 Annual General Meeting of the Company held on 8 May 2012. Mr. So was re-designated as Independent Non-executive Director with effect from 26 September 2012.
(2) Mr. Chow and Mr. Harrison were appointed as Independent Non-executive Directors on 28 September 2010 and 1 July 2011 respectively. Mr. Chow and Mr. Harrison were re-elected as Independent Non-executive Directors by shareholders at the 2012 Annual General Meeting of the Company held on 8 May 2012.
(3) Mr. Hui resigned as Independent Non-executive Director with effect from 29 March 2012. Mr. Hurd and Mr. Wintrob resigned as Non-executive Directors with effect from 8 March 2012.
During the year ended 30 November 2012, Mr. Barry
Chun-Yuen Cheung, Mr. George Yong-Boon Yeo and
Dr. Narongchai Akrasanee were appointed as Independent
Non-executive Directors on 20 September 2012, 2 November
2012 and 21 November 2012 respectively. Mr. Cheung,
Mr. Yeo and Dr. Narongchai will retire from office at the
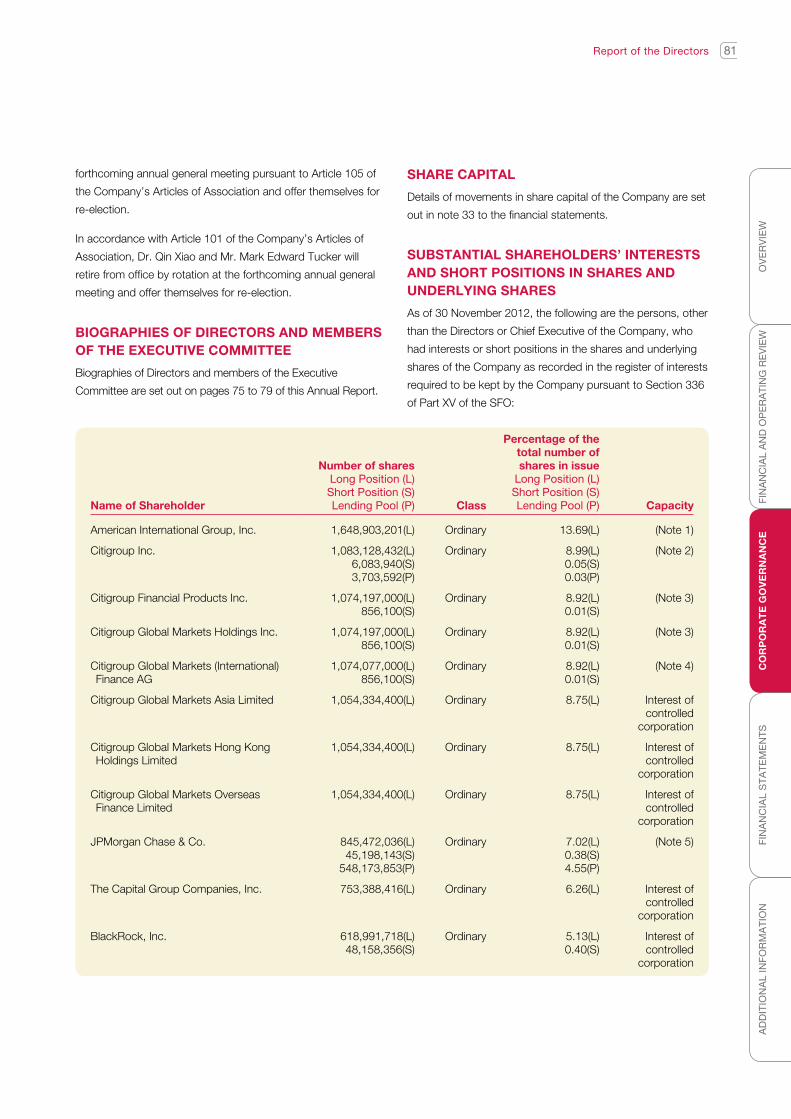
CO
RP
OR
AT
E G
OV
ER
NA
NC
EO
VE
RV
IEW
FIN
AN
CIA
L A
ND
OP
ER
ATI
NG
RE
VIE
WA
DD
ITIO
NA
L IN
FO
RM
AT
ION
FIN
AN
CIA
L S
TA
TE
ME
NT
S
81Report of the Directors
forthcoming annual general meeting pursuant to Article 105 of
the Company’s Articles of Association and offer themselves for
re-election.
In accordance with Article 101 of the Company’s Articles of
Association, Dr. Qin Xiao and Mr. Mark Edward Tucker will
retire from office by rotation at the forthcoming annual general
meeting and offer themselves for re-election.
BIOGRAPHIES OF DIRECTORS AND MEMBERS OF THE ExECUTIVE COMMITTEE
Biographies of Directors and members of the Executive
Committee are set out on pages 75 to 79 of this Annual Report.
SHARE CAPITAL
Details of movements in share capital of the Company are set
out in note 33 to the financial statements.
SUBSTANTIAL SHAREHOLDERS’ INTERESTS AND SHORT POSITIONS IN SHARES AND UNDERLYING SHARES
As of 30 November 2012, the following are the persons, other
than the Directors or Chief Executive of the Company, who
had interests or short positions in the shares and underlying
shares of the Company as recorded in the register of interests
required to be kept by the Company pursuant to Section 336
of Part XV of the SFO:
Name of Shareholder
Number of shares Long Position (L)Short Position (S)Lending Pool (P) Class
Percentage of the total number of shares in issue
Long Position (L)Short Position (S)Lending Pool (P) Capacity
American International Group, Inc. 1,648,903,201(L) Ordinary 13.69(L) (Note 1)
Citigroup Inc. 1,083,128,432(L)6,083,940(S)3,703,592(P)
Ordinary 8.99(L)0.05(S)0.03(P)
(Note 2)
Citigroup Financial Products Inc. 1,074,197,000(L)856,100(S)
Ordinary 8.92(L)0.01(S)
(Note 3)
Citigroup Global Markets Holdings Inc. 1,074,197,000(L)856,100(S)
Ordinary 8.92(L)0.01(S)
(Note 3)
Citigroup Global Markets (International) Finance AG
1,074,077,000(L)856,100(S)
Ordinary 8.92(L)0.01(S)
(Note 4)
Citigroup Global Markets Asia Limited 1,054,334,400(L) Ordinary 8.75(L) Interest of controlled
corporation
Citigroup Global Markets Hong Kong Holdings Limited
1,054,334,400(L) Ordinary 8.75(L) Interest ofcontrolled
corporation
Citigroup Global Markets Overseas Finance Limited
1,054,334,400(L) Ordinary 8.75(L) Interest ofcontrolled
corporation
JPMorgan Chase & Co. 845,472,036(L)45,198,143(S)
548,173,853(P)
Ordinary 7.02(L)0.38(S)4.55(P)
(Note 5)
The Capital Group Companies, Inc. 753,388,416(L) Ordinary 6.26(L) Interest ofcontrolled
corporation
BlackRock, Inc. 618,991,718(L)48,158,356(S)
Ordinary 5.13(L)0.40(S)
Interest ofcontrolled
corporation

CORPORATE GOVERNANCE
AIA Group Limited Annual Report 2012
82
Report of the Directors
Notes:
(1) American International Group, Inc. is a beneficial owner of 1,529,754,951 shares. 119,148,250 shares were held by a company controlled by American International Group, Inc. It has fully divested its entire holding of shares in the Company on 20 December 2012.
(2) The interests held by Citigroup Inc. were held in the following capacities:
Capacity Number of shares
(Long position)Number of shares
(Short position)
Interests held jointly with another person 1,054,334,400 –
Interests of controlled corporation 10,009,240 6,083,940
Custodian corporation/approved lending agent 3,703,592 –
Security interest in shares 15,081,200 –
(3) The interests held by each of Citigroup Financial Products Inc. and Citigroup Global Markets Holdings Inc. were held in the following capacities:
Capacity Number of shares
(Long position)Number of shares
(Short position)
Interest of controlled corporation 1,059,115,800 856,100
Security interest in shares 15,081,200 –
(4) The interests held by Citigroup Global Markets (International) Finance AG were held in the following capacities:
Capacity Number of shares
(Long position)Number of shares
(Short position)
Interest of controlled corporation 1,058,995,800 856,100
Security interest in shares 15,081,200 –
(5) The interests held by JPMorgan Chase & Co. were held in the following capacities:
Capacity Number of shares
(Long position)Number of shares
(Short position)
Beneficial owner 61,696,440 45,198,143
Investment manager 235,601,743 –
Custodian corporation / approved lending agent 548,173,853 –
Save as disclosed above, as at 30 November 2012, no
person, other than the Directors and Chief Executive of the
Company, whose interests are set out in the section
“Directors’ and Chief Executive’s Interests and Short Positions
in Shares and Underlying Shares” below, was recorded to
hold any interests or short positions in the shares or
underlying shares of the Company in the register required to
be kept pursuant to Section 336 of the SFO.
DIRECTORS’ AND CHIEF ExECUTIVE’S INTERESTS AND SHORT POSITIONS IN SHARES AND UNDERLYING SHARES
As of 30 November 2012, the Directors’ and Chief
Executive’s interests and short positions in the shares,
underlying shares or debentures of the Company and its
associated corporations as recorded in the register required
to be kept under Section 352 of the SFO, or as otherwise
notified to the Company pursuant to the Model Code,
are as follows:

CO
RP
OR
AT
E G
OV
ER
NA
NC
EO
VE
RV
IEW
FIN
AN
CIA
L A
ND
OP
ER
ATI
NG
RE
VIE
WA
DD
ITIO
NA
L IN
FO
RM
AT
ION
FIN
AN
CIA
L S
TA
TE
ME
NT
S
83Report of the Directors
(i) Interests and short positions in the shares and underlying shares of the Company:
Name of Director Number of shares ClassPercentage of the total
number of shares in issue Capacity
Mr. Mark Edward Tucker 11,838,218(L) Ordinary 0.10 Beneficial owner
Mr. Edmund Sze-Wing Tse 3,560,400(L) Ordinary 0.03 Interest of controlled corporation
Mr. Chung-Kong Chow 86,000(L) Ordinary < 0.01 Beneficial owner
(ii) Interests and short positions in the shares and underlying shares of associated corporations:
Name of DirectorAssociated
Corporation Number of
shares Class
Percentage of the total number of
shares in issue Capacity
Mr. Edmund Sze-Wing Tse Philam Life 1(L) Ordinary < 0.01 Trustee
Save as disclosed above, as at 30 November 2012, none of
the Directors and Chief Executive of the Company holds any
interests or short positions in the shares, underlying shares or
debentures of the Company and its associated corporations
as recorded in the register required to be kept under Section
352 of the SFO, or as otherwise notified to the Company
pursuant to the Model Code.
DIRECTORS’ BENEFITS FROM RIGHTS TO ACqUIRE SHARES OR DEBENTURES Under his service contract, Mr. Mark Edward Tucker (by virtue
of his role as Group Chief Executive and President) is entitled
to an annual discretionary earned incentive award, which
includes payment in the form of shares of the Company.
Details of Mr. Tucker’s incentive award are set out in the
Remuneration Report.
DIRECTORS’ INTERESTS IN CONTRACTSNo contracts of significance to which the Company or any of
its subsidiaries was a party, and in which any Director of the
Company had a material interest, subsisted at 30 November
2012 or at any time during the year.
PROPERTY, PLANT AND EqUIPMENT Details of acquisitions and other movements in property,
plant and equipment are set out in note 15 to the
financial statements.
RESERVES As at 30 November 2012, the aggregate amount of reserves
available for distribution to shareholders of the Company, as
calculated under the provision Section 79B of the Companies
Ordinance (Laws of Hong Kong, Chapter 32), was US$1,303
million (2011: US$593 million).
Details of the movements in the reserves of the Group
for the year ended 30 November 2012 are set out in the
Consolidated Statement of Changes in Equity on page 110
of this Annual Report.
BANK LOANS AND OTHER BORROWINGS Bank loans and other borrowings of the Group as at
30 November 2012 amounted to US$766 million
(2011: US$559 million). Particulars of the borrowings
are set out in note 28 to the financial statements.
CHARITABLE DONATIONSCharitable donations made by the Group during the year
amounted to US$1 million (2011: US$1 million).
SUBSIDIARIES AND ASSOCIATED COMPANIESDetails of the Company’s principal subsidiaries and
associated companies as at 30 November 2012 are set out in
note 42 and note 14 to the financial statements respectively.
CHANGES IN EqUITY Details of changes in equity of the Group during the year
ended 30 November 2012 are set out in the Consolidated
Statement of Changes in Equity on page 110 of this
Annual Report.
MAjOR CUSTOMERS AND SUPPLIERS During the year ended 30 November 2012, the percentage of
the aggregate purchases attributable to the Group’s five
largest suppliers was less than 30% of the Group’s total value
of purchases and the percentage of the aggregate sales
attributable to the Group’s five largest customers was less
than 30% of the Group’s total value of sales.

CORPORATE GOVERNANCE
AIA Group Limited Annual Report 2012
84
Report of the Directors
RETIREMENT SCHEMES
The Group operates a number of defined benefit plans and
defined contribution plans. Particulars of these plans are set
out in note 37 to the financial statements.
EVENTS AFTER THE REPORTING PERIOD
Details of significant events after the year ended 30 November
2012 are set out in note 43 to the financial statements.
SHARE-BASED INCENTIVE SCHEMES
Restricted Share Unit Scheme
During the year ended 30 November 2012, 22,348,056
restricted share units were awarded by the Company under
the Restricted Share Unit Scheme adopted by the Company
on 28 September 2010. Details of the awards are set out in
the Remuneration Report.
Share Option Scheme
During the year ended 30 November 2012, 7,816,367 share
options were awarded by the Company under the Share
Option Scheme adopted by the Company on 28 September
2010. Details of the awards are set out in the Remuneration
Report.
NON-ExEMPT CONNECTED TRANSACTIONS
During the year ended 30 November 2012, the Group had not
entered into any connected transactions which are not
exempt under either Rule 14A.31 or Rule 14A.33 of the
Listing Rules.
RELATED PARTY TRANSACTIONS
Details of the related party transactions undertaken by the
Group during the year in the ordinary course of business are
set out in note 40 to the financial statements. Such related
party transactions are all exempt connected transactions.
PURCHASE, SALE AND REDEMPTION OF THE SECURITIES OF THE COMPANY
Save for the purchase of 23,504,675 shares of the Company
under the Restricted Share Unit Scheme and the Employee
Share Purchase Plan at a total consideration of approximately
US$84 million, neither the Company nor any of its subsidiaries
purchased, sold or redeemed any of the Company’s listed
securities during the year ended 30 November 2012. These
purchases were made by the relevant scheme trustees on the
Hong Kong Stock Exchange. These shares are held on trust
for participants of the relevant schemes and therefore were
not cancelled. Please refer to note 38 to the financial
statements for details.
PUBLIC FLOAT
Based on information that is publicly available to the
Company and within the knowledge of the Directors, the
Company has maintained the amount of public float as
approved by the Hong Kong Stock Exchange and as
permitted under the Listing Rules as at the date of this
Annual Report.
COMPLIANCE WITH THE CORPORATE GOVERNANCE CODE
Details of the compliance by the Company with the Corporate
Governance Code are set out in the Corporate Governance
Report on page 85 of this Annual Report.
MODEL CODE
Details of the compliance by the Company with the Model
Code are set out in the Corporate Governance Report on
page 85 of this Annual Report.
AUDITOR
PricewaterhouseCoopers was re-appointed as auditor of the
Company in 2012.
PricewaterhouseCoopers will retire and, being eligible,
offer themselves for re-appointment. A resolution for the
re-appointment of PricewaterhouseCoopers as auditor of
the Company is to be proposed at the forthcoming annual
general meeting.
By Order of the Board
Edmund Sze-Wing Tse
Non-executive Chairman
27 February 2013

CO
RP
OR
AT
E G
OV
ER
NA
NC
EO
VE
RV
IEW
FIN
AN
CIA
L A
ND
OP
ER
ATI
NG
RE
VIE
WA
DD
ITIO
NA
L IN
FO
RM
AT
ION
FIN
AN
CIA
L S
TA
TE
ME
NT
S
85
Corporate Governance ReportC O R P O R A T E G O V E R N A N C E
CORE PRINCIPLES
The Board believes that strong corporate governance is
essential for delivering sustainable value, enhancing a
culture of business integrity and maintaining investor
confidence. The Board is ultimately responsible for the
sustainable performance of the Group, including the
consistent achievement of business plans and
compliance with statutory as well as corporate
obligations. The Board is also responsible for the
development and implementation of the Group’s
corporate governance practices. This Corporate
Governance Report explains the Company’s corporate
governance principles and practices, including how the
Board manages the business to deliver long-term
shareholder value and to promote the development of
the Group.
As a company listed on the Main Board of the Hong Kong
Stock Exchange, the Company is committed to high
standards of corporate governance and sees the
maintenance of good corporate governance practices as
essential to its sustainable growth. To promote effective
governance across all of its operations, the Board has
approved a governance framework, which maps out the
internal approval processes and those matters which may be
delegated. It is vital that Board members, in aggregate, have
their requisite skills and expertise supported by a structure
that enables delegation, where appropriate, between the
Board, its committees and management, whilst ensuring that
the Board retains overall control.
Throughout the year ended 30 November 2012, the
Company complied with all the applicable code provisions
set out in the Corporate Governance Code save as
disclosed below:
(i) Code Provision A.4.1 provides that the non-executive
directors should be appointed for a specific term, subject
to re-election. Mr. Jeffrey Joy Hurd and Mr. Jay Steven
Wintrob, who resigned as Non-executive Directors of the
Company with effect from 8 March 2012, were not
appointed for a specific term but were subject to
retirement by rotation and re-election at the annual
general meeting in accordance with the Articles of
Association of the Company. Subsequent to the
resignation of Mr. Hurd and Mr. Wintrob, the Company
has been in compliance with Code Provision A.4.1.
(ii) Code Provision A.5.1 provides that the Nomination
Committee should comprise a majority of independent
non-executive directors. As a result of the resignation of
Mr. Rafael Si-Yan Hui on 29 March 2012 as Independent
Non-executive Director of the Company and therefore as
a member of the Nomination Committee, the then
Nomination Committee comprised four members: two
Independent Non-executive Directors (Mr. Chung-Kong
Chow and Dr. Qin Xiao) and two Non-executive Directors
(Mr. Jack Chak-Kwong So and Mr. Edmund Sze-Wing
Tse). Following the re-designation of Mr. So as
Independent Non-executive Director on 26 September
2012, the Company has been in compliance with Code
Provision A.5.1.
(iii) Code Provision A.6.7 provides that independent
non-executive directors should attend general meetings
of the company. Due to an unexpected business
engagement external to the Company, Dr. Qin Xiao was
unable to attend the 2012 Annual General Meeting of the
Company held on 8 May 2012.
(iv) Code Provision F.1.3 provides that the company secretary
should report to the chairman of the board and/or the
chief executive. The Company operates under a variant of
this model whereby the Company Secretary reports to the
Group General Counsel who is ultimately accountable for
the Company Secretarial function and who in turn reports
directly to the Group Chief Executive.
The Company has also adopted its own Directors’ and Chief
Executives’ Dealing Policy on terms no less exacting than
those set out in the Model Code in respect of dealings by the
Directors in the securities of the Company. All of the Directors
confirmed, following specific enquiry by the Company, that
they have complied with the required standards set out in the
Model Code and the Directors’ and Chief Executives’ Dealing
Policy throughout the year ended 30 November 2012.
BOARD OF DIRECTORS
Roles and Responsibilities
The Board is accountable to shareholders for the affairs of the
Company. It meets these obligations by ensuring the
maintenance of high standards of governance in all aspects of
the Company’s business, setting the strategic direction for the
Group and maintaining appropriate levels of review, challenge
and guidance to management. It is also the ultimate decision-
making body for all matters considered material to the Group

CORPORATE GOVERNANCE
AIA Group Limited Annual Report 2012
86
and is responsible for ensuring that, as a collective body, it
has the appropriate skills, knowledge and experience to
perform its role effectively.
The Board is therefore responsible for the sustainable
performance of the Group, including the consistent
achievement of business plans. The Board is also responsible
for the implementation of the Group’s corporate governance
practices and compliance with statutory as well as corporate
obligations. During the year ended 30 November 2012, the
Board conducted a review of the Group’s corporate
governance framework and updated the Board Charter and
terms of reference of the Board Committees by reference to
the latest amendments to the Listing Rules and reviewed the
Corporate Governance Report included in the 2011 Annual
Report of the Company.
In these matters, the Board provides leadership to the
Company through the Group Chief Executive, who is
authorised to act on behalf of the Board in the executive
management of the Company. Any responsibilities not so
delegated by the Board to the Group Chief Executive remain
the responsibility of the Board.
Board Composition
As of the end of the financial period, the Board consists of nine
members, comprising one Executive Director and eight Non-
executive Directors, seven of whom are Independent Non-
executive Directors. All Directors are expressly identified by
reference to such categories in all corporate communications
that disclose their names. The composition of the Board is
well balanced with each Director having sound experience
and expertise relevant to the business operations and
development of the Group. Biographies of the Directors are
set out on pages 75 to 77 of this Annual Report.
Board Independence
Each of the Independent Non-executive Directors of the
Company meets the independence guidelines set out in Rule
3.13 of the Listing Rules and has provided to the Company
the requisite annual confirmation as to his independence.
None of the Independent Non-executive Directors of the
Company has any business or significant financial interests
with the Company or its subsidiaries and therefore all the
Independent Non-executive Directors continue to be
considered by the Company to be independent.
No Director has any family relationship with another Director.
Board Meetings
During the period under review, there were seven scheduled
Board meetings, all of which were convened in accordance
with the Articles of Association of the Company and attended
by the Directors either in person or through electronic means
of communication.
The attendance records of individual Directors are as follows:
Name of Director
No. of Board Meetings
Attended / Eligible to
Attend
Non-executive Chairman and Non-executive Director
Mr. Edmund Sze-Wing Tse 7/7
Executive Director
Mr. Mark Edward Tucker 7/7
Independent Non-executive Directors
Mr. Jack Chak-Kwong So 7/7
Mr. Chung-Kong Chow 7/7
Dr. Qin Xiao 5/7
Mr. John Barrie Harrison 7/7
Mr. Barry Chun-Yuen Cheung (1) 1/1
Mr. George Yong-Boon Yeo (1) 1/1
Dr. Narongchai Akrasanee (2) n/a
Mr. Rafael Si-Yan Hui (3) 1/1
Non-executive Directors
Mr. Jeffrey Joy Hurd (3) 1/1
Mr. Jay Steven Wintrob (3) 1/1
Notes:
(1) Mr. Cheung and Mr. Yeo were appointed as Independent Non-executive Directors of the Company on 20 September 2012 and 2 November 2012 respectively. They have attended the sole Board meeting held during the period from their respective date of appointment to 30 November 2012.
(2) Dr. Narongchai was appointed as Independent Non-executive Director of the Company on 21 November 2012. No Board meeting was held during the period from the date of his appointment to 30 November 2012.
(3) Mr. Hurd and Mr. Wintrob resigned as Non-executive Directors of the Company with effect from 8 March 2012 and Mr. Hui resigned as Independent Non-executive Director of the Company with effect from 29 March 2012. They each attended the sole Board meeting held during the period from December 2011 to the date of their respective resignations.
Corporate Governance Report

CO
RP
OR
AT
E G
OV
ER
NA
NC
EO
VE
RV
IEW
FIN
AN
CIA
L A
ND
OP
ER
ATI
NG
RE
VIE
WA
DD
ITIO
NA
L IN
FO
RM
AT
ION
FIN
AN
CIA
L S
TA
TE
ME
NT
S
87Corporate Governance Report
Board Process
Board meetings will be held at least four times a year to
determine overall strategies, receive management updates,
approve business plans as well as interim and annual results
and to consider other significant matters. During the year
ended 30 November 2012, the Board has engaged an
independent consultant to conduct an evaluation of the
Board’s performance.
Minutes of the meetings of the Board and all committees are
kept by the Company Secretary. Such minutes are open for
inspection on reasonable notice by any Director.
Chairman and Group Chief Executive
Mr. Edmund Sze-Wing Tse, Non-executive Chairman of the
Company, plays the critical role of leading the Board in its
responsibilities. With the support of the Group Chief Executive
and President and senior management, Mr. Tse seeks to
ensure that all Directors are properly briefed on issues arising
at Board meetings and that they receive adequate and reliable
information in a timely manner. He is also responsible for
making sure that good corporate governance practices and
procedures are followed.
Mr. Mark Edward Tucker, Group Chief Executive and
President of the Company, reports to the Board and is
responsible for the overall leadership, strategic and executive
management and profit performance of the Group, including
all day-to-day operations and administration. Mr. Tucker
discharges his responsibilities within the framework of the
Company’s policies, reserved powers and routine reporting
requirements and is advised and assisted by the Executive
Committee of the Group.
Appointment of Directors
The Company uses a formal and transparent procedure for
the appointment of new Directors. Recommendations for the
appointment of new Directors are received by the Board from
the Nomination Committee. The Board then deliberates over
such recommendations prior to approval.
Save for Mr. Jeffrey Joy Hurd and Mr. Jay Steven Wintrob
who resigned as Non-executive Directors during the period
under review, the other Non-executive Director and all the
Independent Non-executive Directors of the Company were
appointed for a specific term, subject to re-nomination and
re-election when appropriate in a general meeting in
accordance with the Articles of Association of the Company.
The terms of appointment of the Non-executive Directors and
Independent Non-executive Directors are as follows:
Name of DirectorTerm of
Appointment
Non-executive Chairman and Non-executive Director
Mr. Edmund Sze-Wing Tse (Note 1)
IndependentNon-executive Directors
Mr. Jack Chak-Kwong So 3 years (Note 2)
Mr. Chung-Kong Chow 3 years (Note 3)
Dr. Qin Xiao 3 years (Note 3)
Mr. John Barrie Harrison (Note 4)
Mr. Barry Chun-Yuen Cheung 3 years (Note 5)
Mr. George Yong-Boon Yeo 3 years (Note 6)
Dr. Narongchai Akrasanee 3 years (Note 7)
Mr. Rafael Si-Yan Hui (Note 8)
Non-executive Directors
Mr. Jeffrey Joy Hurd (Note 8)
Mr. Jay Steven Wintrob (Note 8)
Notes:
(1) Mr. Tse was appointed as Non-executive Director for a term of three years from 27 September 2010. Mr. Tse was elected as Non-executive Chairman for a term of two years from 1 January 2011 and has been re-elected for a further term of two years from 1 January 2013.
(2) Mr. So was appointed as Non-executive Director on 28 September 2010 for a term of three years. Mr. So was re-designated as Independent Non-executive Director on 26 September 2012. Subject to any renewal, Mr. So’s service contract expires on 27 September 2013.
(3) Mr. Chow and Dr. Qin were appointed as Independent Non-executive Directors for a term of three years from 28 September 2010 to 27 September 2013.
(4) Mr. Harrison was appointed as Independent Non-executive Director for a period from 1 July 2011 to 27 September 2013.
(5) Mr. Cheung was appointed as Independent Non-executive Director for a term of three years from 20 September 2012 to 19 September 2015.
(6) Mr. Yeo was appointed as Independent Non-executive Director for a term of three years from 2 November 2012 to 1 November 2015.
(7) Dr. Narongchai was appointed as Independent Non-executive Director for a term of three years from 21 November 2012 to 20 November 2015.
(8) Mr. Hurd and Mr. Wintrob resigned as Non-executive Directors of the Company with effect from 8 March 2012 and Mr. Hui resigned as Independent Non-executive Director of the Company with effect from 29 March 2012.

CORPORATE GOVERNANCE
AIA Group Limited Annual Report 2012
88
Corporate Governance Report
Induction and Ongoing Development
The Company provides each Director with personalised
induction, training and development. On appointment, each
Director receives a comprehensive and tailored induction
covering, amongst other things, the principal basis of
accounting for the Group’s results, the role of the Board and
its key committees, and the ambit of the internal audit and risk
management functions.
Each Director receives detailed briefings on the Group’s
principal businesses, the markets in which it operates and the
overall competitive environment. Other areas addressed
include legal and compliance issues affecting directors of
financial services companies, the Group’s governance
arrangements, its investor relations programme and its
remuneration policies. The Directors are continually updated
Types of Training
Name of Director
Reading regulatory
updates
Attending / hosting briefings / seminars / conferences relevant
to regulatoryupdates / corporate
governance
Attendingcorporate events / briefings relevant
to the Group’s business
Non-executive Chairman and Non-executive Director
Mr. Edmund Sze-Wing Tse √ √ √
Executive Director, Group Chief Executive and President
Mr. Mark Edward Tucker √ √ √
Independent Non-executive Directors
Mr. Jack Chak-Kwong So √ √ √
Mr. Chung-Kong Chow √ √ √
Dr. Qin Xiao √ √ √
Mr. John Barrie Harrison √ √ √
Mr. Barry Chun-Yuen Cheung – √ –
Mr. George Yong-Boon Yeo – √ –
Dr. Narongchai Akrasanee (Note) – – –
Note:
Dr. Narongchai was appointed as Independent Non-executive Director of the Company on 21 November 2012 and did not participate in any professional training during the 10-day period from his appointment to 30 November 2012.
on the Group’s business and the latest developments to the
Listing Rules and other applicable statutory requirements to
ensure compliance and continuous good corporate
governance practice. During the period under review, the
Company provided an update on the new amendments to the
Corporate Governance Code and associated Listing Rules
and a briefing on the new Hong Kong Competition Law for
the Directors. A Board Strategy Day was also held for the
Directors to review the strategies of the Group.
All Directors are encouraged to participate in continuous
professional development to develop and refresh their
knowledge and skills. All Directors provided their training
records during the year to the Company. The training
received by the Directors during the period under review since
1 April 2012 is summarised as follows:

CO
RP
OR
AT
E G
OV
ER
NA
NC
EO
VE
RV
IEW
FIN
AN
CIA
L A
ND
OP
ER
ATI
NG
RE
VIE
WA
DD
ITIO
NA
L IN
FO
RM
AT
ION
FIN
AN
CIA
L S
TA
TE
ME
NT
S
89Corporate Governance Report
COMMITTEES OF THE BOARD
The Company’s corporate governance is implemented
through a structured hierarchy, which includes the Board of
Directors and four committees of the Board established by
resolutions of the Board, namely the Audit Committee, the
Nomination Committee, the Remuneration Committee and the
Risk Committee. In addition, the Group Chief Executive has
established a number of management committees including,
among others, an Executive Committee and Financial and
Operational Risk Committees.
Subsequent to the appointment of Mr. Cheung, Mr. Yeo and
Dr. Narongchai to the Board and the re-designation of Mr. So
as Independent Non-executive Director, the Board reviewed
and restructured the composition of the committees of the
Board to enhance efficiency and to take advantage of the
range of experience of the Board members during the period
under review. Further details of the roles and functions and
the composition of the committees of the Board are set
out below.
Audit Committee
The Audit Committee consists of five members. This includes
four Independent Non-executive Directors: Mr. Harrison, who
serves as chairman of the Committee, Mr. So, Mr. Cheung
and Mr. Yeo as well as the Non-executive Director, Mr. Tse
who became a member on 25 February 2013. Dr. Qin was a
member of the Audit Committee until 24 February 2013.
Mr. Hui was also a member of the Audit Committee until the
date of his resignation. The primary duties performed by the
Audit Committee during the year included the oversight of the
Group’s financial reporting system and internal control
procedures, monitoring the integrity of preparation of the
Company’s financial information including interim and annual
results of the Group, providing oversight for and management
of the relationship with the Group’s external auditor, including
reviewing and monitoring the external auditor’s independence
and objectivity and the effectiveness of the audit process in
accordance with applicable standards, reviewing the Group’s
financial and accounting policies and practices, reviewing
whistle-blowing arrangements and providing oversight of the
internal audit process carried out by the internal audit
department of the Group.
Four meetings were held by the Audit Committee during the
year ended 30 November 2012. The attendance records of
Audit Committee members are as follows:
Name of AuditCommittee Member
No. of Meetings Attended /
Eligible to Attend
Mr. John Barrie Harrison (Chairman) 4/4
Mr. Jack Chak-Kwong So (1) 4/4
Dr. Qin Xiao 4/4
Mr. Barry Chun-Yuen Cheung (2) n/a
Mr. George Yong-Boon Yeo (2) n/a
Mr. Rafael Si-Yan Hui (3) 1/1
Notes:
(1) Mr. So was re-designated as Independent Non-executive Director with effect from 26 September 2012.
(2) Mr. Cheung and Mr. Yeo were appointed as members of the Audit Committee on 9 November 2012. No meeting of the Committee was held during November 2012.
(3) Mr. Hui ceased to be a member of the Audit Committee as a result of his resignation as Independent Non-executive Director of the Company with effect from 29 March 2012.
Nomination Committee
The Nomination Committee consists of eight members. This
includes the Non-executive Chairman, Mr. Tse, chairman of
the Committee since 9 November 2012, and seven
Independent Non-executive Directors: Mr. Chow, who served
as chairman of the Committee until 8 November 2012,
Mr. So, Dr. Qin, Mr. Harrison, Mr. Cheung, Mr. Yeo and
Dr. Narongchai. Mr. Hui was also a member of the Committee
until the date of his resignation. The primary duties of the
Nomination Committee are to make recommendations to
the Board on the structure, size and composition of the
Board, the selection of new directors, succession
planning for directors and determining the membership
of Board committees.
The Committee’s processes and criteria for selection and
recommendation of Board members are designed to satisfy
high standards of corporate governance. These processes
meet or exceed the Hong Kong Stock Exchange requirement
to ensure that every director of the Company has the requisite
character, experience and integrity and is able to demonstrate
a standard of competence, commensurate with his position
as a director of a listed issuer, and where the nomination of
Independent Non-executive Directors is under consideration
that the requirements of Rule 3.13 of the Listing Rules
are satisfied.

CORPORATE GOVERNANCE
AIA Group Limited Annual Report 2012
90
Corporate Governance Report
One meeting was held by the Nomination Committee during
the year ended 30 November 2012. The attendance records
of the Nomination Committee members are as follows:
Name of Nomination Committee Member
No. of Meetings Attended /
Eligible to Attend
Mr. Edmund Sze-Wing Tse (Chairman) (1)
1/1
Mr. Chung-Kong Chow (1) 1/1
Mr. Jack Chak-Kwong So (2) 1/1
Dr. Qin Xiao 0/1
Mr. John Barrie Harrison (3) n/a
Mr. Barry Chun-Yuen Cheung (3) n/a
Mr. George Yong-Boon Yeo (3) n/a
Dr. Narongchai Akrasanee (3) n/a
Mr. Rafael Si-Yan Hui (4) 1/1
Notes:
(1) Mr. Tse was appointed as Chairman of the Nomination Committee in place of Mr. Chow on 9 November 2012.
(2) Mr. So was re-designated as Independent Non-executive Director with effect from 26 September 2012.
(3) Mr. Harrison, Mr. Cheung and Mr. Yeo were each appointed to the Nomination Committee on 9 November 2012 and Dr. Narongchai was appointed a member of the Nomination Committee on 21 November 2012. No meeting was held by the Committee during November 2012.
(4) Mr. Hui ceased to be a member of the Nomination Committee as a result of his resignation as a director of the Company with effect from 29 March 2012.
Remuneration Committee
The Remuneration Committee consists of four members. This
includes three Independent Non-executive Directors: Mr. So,
appointed chairman of the Committee on 9 November 2012,
Dr. Qin and Mr. Cheung. The lone Executive Director, Mr.
Tucker, rounds out the Committee’s membership. Mr. Chow
was a member and Dr. Qin acted as chairman of the
Committee until 8 November 2012. Mr. Hui was also the
Chairman and a member of the Committee until the date of
his resignation. The primary duties of the Remuneration
Committee are to evaluate and make recommendations to
the Board on the remuneration policy covering the Directors
and senior management of the Group. Mr. Tucker is not
present at or involved in discussion of his own remuneration.
Four meetings were held by the Remuneration Committee
during the year ended 30 November 2012. Details of the
attendance records and key activities performed by the
Remuneration Committee during the year have been set out
in the Remuneration Report, which forms part of this
Corporate Governance Report.
Risk Committee
The Risk Committee consists of five members. Three of the
members are Independent Non-executive Directors including
the Committee chairman Mr. Chow, Mr. Harrison and
Dr. Narongchai. Also included on the Risk Committee are
Non-executive Director, Mr. Tse; and Executive Director,
Mr. Tucker. Mr. So and Dr. Qin were members of the Risk
Committee until 8 November 2012. The primary duties
performed by the Risk Committee during the year included
provision of advice to the Board on the risk profile and risk
management strategy of the Group, considering, reviewing
and approving risk management policies and guidelines,
deciding on risk levels and considering, among other things,
the Company’s risk governance structure and major risks,
including capital adequacy, asset-liability management and
operational risks.
During the year ended 30 November 2012, four meetings
were held by the Risk Committee. The attendance records of
the Risk Committee members are as follows:
Name of RiskCommittee Member
No. of Meetings Attended /
Eligible to Attend
Mr. Chung-Kong Chow (Chairman) 4/4
Mr. John Barrie Harrison 4/4
Dr. Narongchai Akrasanee (1) n/a
Mr. Edmund Sze-Wing Tse 4/4
Mr. Mark Edward Tucker 4/4
Mr. Jack Chak-Kwong So (2) 4/4
Dr. Qin Xiao (2) 4/4
Notes:
(1) Dr. Narongchai was appointed as a member of the Risk Committee on 21 November 2012. No meeting was held by the Committee during November 2012.
(2) Mr. So and Dr. Qin ceased to be members of the Risk Committee on 9 November 2012.

CO
RP
OR
AT
E G
OV
ER
NA
NC
EO
VE
RV
IEW
FIN
AN
CIA
L A
ND
OP
ER
ATI
NG
RE
VIE
WA
DD
ITIO
NA
L IN
FO
RM
AT
ION
FIN
AN
CIA
L S
TA
TE
ME
NT
S
91Corporate Governance Report
REMUNERATION OF DIRECTORS AND SENIOR MANAGEMENT
The Level and Make-Up of Remuneration and Disclosure
The Company has established a Remuneration Committee
with written terms of reference. Further information regarding
the Remuneration Committee is set out in the Remuneration
Report. In particular, the Remuneration Committee is
delegated with the specific task of ensuring that no
Director or any of his associates is involved in deciding his
own remuneration.
A description of the remuneration policy and long-term
incentive schemes of the Group, as well as the basis of
determining the remuneration payable to the Directors, has
been set out in the Remuneration Report, which forms part of
this Corporate Governance Report.
AUDITOR’S REMUNERATION
The external auditor of the Company is
PricewaterhouseCoopers. For the year ended
30 November 2012, the total remuneration paid by
the Company to PricewaterhouseCoopers was
approximately US$14.3 million (2011: US$11.0 million),
an analysis of which is set out below:
US$ millions 2012 2011
Audit services 10.0 10.0
Non-audit services 4.3 1.0
Total 14.3 11.0
The Audit Committee is responsible for making
recommendations to the Board as to the appointment,
re-appointment and removal of the external auditor, which is
subject to the approval by the Board and at the general
meetings of the Company by its shareholders. In assessing
the external auditor, the Audit Committee will take into
account audit performance, objectivity and independence of
the auditor.
ACCOUNTABILITY AND AUDIT
Financial Report
The annual results of the Company and other financial
information were published in accordance with the
requirements of the Listing Rules and other applicable
regulations and industry best practice. When preparing the
Company’s financial reports, the Board of Directors had in
mind the shareholders of the Company as the recipient and
end user and endeavoured to present such information in a
comprehensible, informative and user-friendly manner.
The Directors acknowledge their responsibility for preparing
the Company’s consolidated financial statements and
ensuring that the preparation of the Company’s consolidated
financial statements is in accordance with the relevant
requirements and applicable standards.
The statement of the Company’s auditor concerning its
reporting responsibilities on the Company’s consolidated
financial statements is set out in the Independent Auditor’s
Report on pages 105 and 106 of this Annual Report.
Internal Control
Throughout this Corporate Governance Report, the Board of
Directors seeks to set out the Company’s corporate
governance structure and policies, inform shareholders of the
corporate governance undertakings of the Company and
demonstrate to shareholders the value of such practices.
The Board of Directors has, through the Audit Committee,
reviewed and is generally satisfied with the effectiveness of
the Group’s internal control system, including the adequacy of
resources, qualifications and experience of staff of the
Company’s accounting and financial reporting function.

CORPORATE GOVERNANCE
AIA Group Limited Annual Report 2012
92
Corporate Governance Report
COMMUNICATIONS WITH SHAREHOLDERS
The Board recognises the importance of communication
and undertakes to maintain an ongoing dialogue with the
shareholders of the Company through general meetings,
releases, announcements and corporate communications
such as annual report, interim report and circular. The Board
is committed to the timely disclosure of information. The latest
information regarding the Group’s activities, announcements,
results presentation, webcasts and corporate
communications are made available on the Company’s
website at www.aia.com in a timely manner. The financial
calendar highlighting the key dates for shareholders are set
out on page 234 of this Annual Report.
The Board welcomes views, questions and concerns from
shareholders and stakeholders. Shareholders and
stakeholders may at any time send their enquiries and
concerns to the Board. The contact details are set out on
pages 235 to 236 of this Annual Report.
2012 Annual General Meeting
The most recent general meeting of the Company was the
2012 Annual General Meeting of the Company (2012 AGM)
held at The Grand Ballroom, Kowloon Shangri-La,
Hong Kong, 64 Mody Road, Tsim Sha Tsui East, Kowloon,
Hong Kong on 8 May 2012 at 11:00 a.m. Except for Dr. Qin
who was unable to attend the 2012 AGM due to an
unexpected business engagement external to the Company,
the Chairman and all other members of the Board of
Directors, together with the senior management and external
auditor, attended the 2012 AGM. The major items resolved at
the 2012 AGM are set out below:
• Received the audited consolidated financial statements of
the Company, Report of the Directors and the Independent
Auditor’s Report for the year ended 30 November 2011;
• Declaration of a final dividend of 22 Hong Kong cents per
share for the year ended 30 November 2011;
• Re-election of Mr. So as Non-executive Director and
Mr. Chow and Mr. Harrison as Independent Non-executive
Directors;
• General mandate to Directors to cause the Company to
issue additional shares of the Company, not exceeding 10
per cent of the issued share capital of the Company at the
date of the 2012 AGM and the discount for any shares to
be issued shall not exceed 15% to the benchmarked price;
• General mandate to Directors to cause the Company to
repurchase shares of the Company, not exceeding 10 per
cent of the issued share capital of the Company at the
date of the 2012 AGM; and
• General mandate to Directors to cause the Company to
issue additional shares of the Company, not exceeding
2.5 per cent of the issued share capital of the Company
at the date of the 2012 AGM under the restricted share
unit scheme.
All resolutions put to shareholders were passed at the 2012
AGM and the poll voting results are available on the website
of the Company.
The forthcoming annual general meeting of the Company will
be held on Friday, 10 May 2013. Further details will be set out
in the circular to the shareholders of the Company to be sent
together with this Annual Report.
SHAREHOLDERS’ RIGHTS
Extraordinary General Meeting
Shareholder(s) holding not less than one-twentieth of the
paid-up capital of the Company can make a written request
to convene an extraordinary general meeting pursuant to
Section 113 of the Hong Kong Companies Ordinance. The
written request must state the objects of the meeting, and
must be signed by the relevant shareholder(s) and may
consist of several documents in like form, each signed by one
or more of those shareholder(s). Such written request must be
deposited at the registered office of the Company at 35/F,
AIA Central, No. 1 Connaught Road Central, Hong Kong for
the attention of the Company Secretary.

CO
RP
OR
AT
E G
OV
ER
NA
NC
EO
VE
RV
IEW
FIN
AN
CIA
L A
ND
OP
ER
ATI
NG
RE
VIE
WA
DD
ITIO
NA
L IN
FO
RM
AT
ION
FIN
AN
CIA
L S
TA
TE
ME
NT
S
93Corporate Governance Report
If the Directors do not within 21 days from the date of deposit
of the written request proceed duly to convene a meeting for a
day not more than 28 days after the date on which the notice
convening the meeting is given, the relevant shareholder(s), or
any of them representing more than one-half of the total voting
rights of all of them, may themselves convene a meeting, but
any meeting so convened shall not be held after the expiration
of three months from the said date.
Moving a Resolution at Annual General Meeting
Shareholder(s) can deposit a written request to move a
resolution at an annual general meeting pursuant to Section
115A of the Hong Kong Companies Ordinance. The
shareholder(s) necessary for a requisition shall be:
(a) Representing not less than one-fortieth of the total voting
rights of all shareholders having at the date of the
requisition a right to vote at the annual general meeting; or
(b) Not less than 50 members holding shares in the Company
on which there has been paid up an average sum, per
shareholder, of not less than HK$2,000.
The written request must state the resolution, accompanied
by a statement of not more than 1,000 words with respect to
the matter referred to in the proposed resolution or the
business to be dealt with at the annual general meeting
and signed by all the relevant shareholder(s). Such written
request must be deposited at the registered office of the
Company at 35/F, AIA Central, No. 1 Connaught Road
Central, Hong Kong for the attention of the Company
Secretary, in case of a requisition requiring notice of a
resolution, not less than six weeks before the meeting and in
case of any other requisition, not less than one week before
the meeting with a sum reasonably sufficient to meet the
Company’s expenses in serving the notice of the proposed
resolution and circulating the statement to all shareholders as
required by the applicable laws and rules.
Proposing a Person for Election as A Director
Shareholders can propose a person (other than a retiring
Director or himself/herself) for election as a director at a
general meeting of the Company. Relevant procedures are
available on the Company’s website at www.aia.com.
CONSTITUTIONAL DOCUMENTS
During the year, amendments to the Articles of Association of
the Company for the removal of the exemption of voting by a
director on a board resolution in which he or his associates
has an interest of less than 5% were approved by the
shareholders at the 2012 AGM. Details of the amendments
were set out in the 2012 AGM notice to the shareholders
dated 23 March 2012. An updated version of the
Memorandum and Articles of Association of the Company is
available on the Company’s website at www.aia.com.
By Order of the Board
Lai Wing Nga
Company Secretary
27 February 2013

CORPORATE GOVERNANCE
AIA Group Limited Annual Report 2012
94
Remuneration ReportCORPORATE GOVERNANCE
REMUNERATION COMMITTEE
The Remuneration Committee is responsible for determining
the specific remuneration packages of the Executive Director
and Key Management Personnel (senior executives who, by
the nature and accountabilities of their respective positions,
participate directly in the development, monitoring and
reporting of the overall business strategies of the Group) and
making recommendations to the Board on the remuneration
policy and structure to be applied for the Chairman and
Non-executive Directors.
The Remuneration Committee is also responsible for
establishing formal and transparent procedures for developing
such remuneration policies and structures. In making its
determinations and recommendations, the Remuneration
Committee considers such factors as the responsibilities of
the Executive Director and Key Management Personnel, the
remuneration paid by comparable companies, remuneration
levels within the Group and the application of performance-
based remuneration programmes. The Remuneration
Committee also oversees the operation of the Company’s
share option scheme and other equity schemes,
recommending employee awards to the Board for approval,
and amending terms of the schemes as may be required.
The Remuneration Committee is authorised by the Board to
discharge its duties as outlined in its terms of reference. It is
also authorised to seek any remuneration information it
requires from the Executive Director and/or Key Management
Personnel and may obtain external independent professional
advice if necessary.
The full terms of reference of the Remuneration Committee
can be accessed at www.aia.com.
Meetings in 2012
As at 30 November 2012, the Committee consisted of four
members: three Independent Non-executive Directors, being
Mr. Jack Chak-Kwong So, who has served as the Chairman
of the Committee since 9 November 2012, Dr. Qin Xiao, who
served as the Chairman of the Committee from 29 March
2012 to 8 November 2012, and Mr. Barry Chun-Yuen
Cheung; and one Executive Director, being Mr. Mark Edward
Tucker. Mr. Rafael Si-Yan Hui was the Chairman and a
member of the Committee until the date of his resignation and
Mr. Chung-Kong Chow was also a member of the Committee
until 8 November 2012.
During the year ended 30 November 2012, four meetings
were held by the Remuneration Committee. The attendance
records of the Remuneration Committee members are
as follows:
Name of Remuneration Committee Member
No. of Meetings Attended /
Eligible to Attend
Mr. Jack Chak-Kwong So (Chairman) (1)
1/1
Dr. Qin Xiao (2) 2/2
Mr. Barry Chun-Yuen Cheung (3) 1/1
Mr. Mark Edward Tucker 4/4
Mr. Chung-Kong Chow (4) 3/3
Mr. Rafael Si-Yan Hui (5) 2/2
Notes:
(1) Mr. So was appointed as Chairman and a member of the Remuneration Committee with effect from 9 November 2012.
(2) Dr. Qin was appointed as a member of the Remuneration Committee with effect from 29 March 2012 and acted as its Chairman until 8 November 2012.
(3) Mr. Cheung was appointed as a member of the Remuneration Committee with effect from 9 November 2012.
(4) Mr. Chow ceased to be a member of the Remuneration Committee with effect from 9 November 2012.
(5) Mr. Hui ceased to be Chairman and a member of the Remuneration Committee as a result of his resignation from the Board with effect from 29 March 2012.
During the year, major activities performed by the
Remuneration Committee in relation to the Executive Director,
Key Management Personnel, Chairman and Non-Executive
Director remuneration are as follows:
• Reviewed the executive benchmark results and approved
the 2012 remuneration packages for the Executive Director
and Key Management Personnel (the Executive Director
was not involved in discussion of his own remuneration
and the long-term incentive awards for the Executive
Director were approved by the Independent Non-executive
Directors);
• Reviewed and approved the performance measures to be
used for the short-term incentive plan and 2011 short-term
incentive payout;
• Reviewed and approved the vesting level of the 2010
long-term incentive award, the performance measures to
be used in long-term incentive awards, and the 2012
long-term incentive award;

CO
RP
OR
AT
E G
OV
ER
NA
NC
EO
VE
RV
IEW
FIN
AN
CIA
L A
ND
OP
ER
ATI
NG
RE
VIE
WA
DD
ITIO
NA
L IN
FO
RM
AT
ION
FIN
AN
CIA
L S
TA
TE
ME
NT
S
95Remuneration Report
• Reviewed fee benchmarking results for the Chairman and
Non-Executive Directors and recommended no change to
the current arrangement;
• Recommended the fees of the newly appointed Directors
to the Board for approval; and
• Reviewed and approved the 2011 remuneration report.
REMUNERATION POLICY
Objectives
The Company’s executive remuneration policy is based on
the principle of providing an equitable, motivating and
competitive remuneration package to foster a strong
performance-oriented culture within an appropriate overall risk
management framework. The policy aims to ensure that
rewards and incentives relate directly to the performance of
individuals, the operations and functions in which they work or
for which they are responsible, and the overall performance of
the Group.
Main Components of Remuneration
The table below summarises the Company’s remuneration
policies regarding the elements of the remuneration structure
as it applied to the Executive Director and Key Management
Personnel during the year.
Element Purpose Basis of determination Notes on practices
Base salary Fixed cash element of remuneration to recruit and retain talent
Base salary is determined with reference to the specific roles and responsibilities of the position, internal relativities, market practice, individual experience, performance and other factors to attract and retain employees with required capabilities to achieve the Group’s business objectives
The Remuneration Committee reviews salaries annually for the Executive Director against a peer group of publicly listed insurance companies, and Key Management Personnel against relevant industry survey sources
Salary increases, if any, typically take effect from 1 March
Short-term incentive
Short-term incentives are delivered in the form of a performance-based cash award to recognise and reward achievement of the Group’s objectives and individual contribution
Short-term incentive target and maximum opportunities are determined with reference to the market appropriateness of total compensation and the role and responsibilities of the individual
Annual short-term incentive based on the achievement of financial performance measures and relevant strategic objectives, as well as individual contribution
Long-term incentive
Long-term incentive plans focus key contributors on the long-term success of the Group and are used to align the interests of executives with those of shareholders using a range of share-based awards and share options to deliver a balanced mix of ownership and incentives
Long-term incentive target awards are determined with reference to the competitiveness of the total compensation package and the role and responsibilities of the individual
Awards are discretionary and determined on an annual basis
Awards are made in Restricted Share Units (RSU) and/or Share Options (SO), and generally vest after a three-year period, subject to performance and eligibility requirements
Benefits Benefits form part of the long-term employment relationship and contribute to the value of total remuneration provided at market competitive levels
The benefits programme is determined such that it is market competitive. It remains fully compliant with local regulations
The Executive Director and Key Management Personnel receive certain benefits, for example participation in pension schemes, medical and life insurance, use of company car and/or driver
Employee share purchase plan (ESPP)
Share purchase plan with matching offer to facilitate and encourage AIA share ownership by employees, and provide a long-term retention mechanism
The ESPP is open to all employees who have completed probation and subject to a maximum contribution indicated as a percentage of base salary or the plan maximum limit
Participants receive matching shares for shares purchased at a rate approved by the Remuneration Committee
Matching shares vest after three years

CORPORATE GOVERNANCE
AIA Group Limited Annual Report 2012
96
Remuneration Report
SHORT-TERM INCENTIVES
For 2012, short-term incentive targets were determined and
communicated to the Executive Director and Key
Management Personnel at the beginning of the year. The
performance measures for 2012 short-term incentive were:
• Value of new business;
• Excess embedded value growth; and
• Operating profit after tax.
Value of new business (VONB) is an estimate of the economic
value of one year’s sales as published by the Company.
Excess embedded value growth (EEV Growth) is the sum of the
operating experience variances (current year performance
against the operating assumptions for calculating embedded
value or EV) and operating assumption changes (value of future
operating outperformance considered permanent enough for
recognition in the current year) in the EV operating profit.
Operating profit after tax (OPAT) is the IFRS operating profit
after tax based on the IFRS results published by the Company.
The weighting of the three performance measures described
above is 60 per cent, 15 per cent, and 25 per cent, for VONB,
EEV Growth, and OPAT respectively. Based on the level of
achievement of the performance measures, short-term
incentive awards in respect of 2012 will be paid to the
Executive Director and Key Management Personnel in March
2013. The total value of short-term incentive awards accrued
for the Executive Director and Key Management Personnel for
the financial year ended 30 November 2012 is
US$12,099,300. Such amount is included in note 39 to the
financial statements as the Bonuses to the Executive Director
and as part of the “Salaries and other short-term employee
benefits” to the Key Management Personnel.
LONG-TERM INCENTIVE (LTI) PLANS
Legacy LTI Plans
The Remuneration Committee continues to operate the two
cash-based long-term incentive plans for 2009 and 2010 in
order to facilitate payments under the plans to eligible
participants, after which time the plans will cease to operate.
No further awards have been made under these plans since
the date of listing of the Company and no further award will
be made in the future. Only one existing member of the Key
Management Personnel has an outstanding award. Such
award will vest in 2013 subject to the member’s continued
employment with the Group.
50 per cent of the 2009 LTI award was vested and paid in
April 2011; 25 per cent was vested and paid in January 2012;
and the remaining 25 per cent vested on 1 January 2013.
2010 LTI award vested one-third in December 2011
and paid in March 2012; another one-third vested on
1 December 2012; and the remaining one-third will vest
on 1 December 2013.
AIA LTI Plans
The Restricted Share Unit Scheme and the Share Option
Scheme were adopted on 28 September 2010 and have a life
of 10 years from the date of adoption. Summary details are
provided in the pages that follow and in detail in note 38 to
the financial statements. In future periods, the Remuneration
Committee will continue to determine the appropriate awards
and performance conditions for the Executive Director and
Key Management Personnel under these schemes.

CO
RP
OR
AT
E G
OV
ER
NA
NC
EO
VE
RV
IEW
FIN
AN
CIA
L A
ND
OP
ER
ATI
NG
RE
VIE
WA
DD
ITIO
NA
L IN
FO
RM
AT
ION
FIN
AN
CIA
L S
TA
TE
ME
NT
S
97Remuneration Report
Restricted Share Unit Scheme
Under the Restricted Share Unit Scheme, the Company may
award restricted share units to employees, directors
(excluding independent non-executive directors) or officers of
the Company or any of its subsidiaries. The objectives of the
Restricted Share Unit Scheme are to retain participants, align
their interests with those of the Company’s investors and
reward the creation of value for shareholders through the
award of share units to participants.
During the year ended 30 November 2012, 22,348,056
restricted share units were awarded by the Company under
the Restricted Share Unit Scheme. Movements in restricted
share unit awards are summarised below:
Executive Director, Key Management Personnel, and other eligible employees
Date of grant (day/month/
year) (1)
Vestingdate(s)
(day/month/year)
Restricted share units
outstanding as at
1 December 2011
Restricted share units
awarded during the
year ended 30 November
2012
Restricted share units
vested during the year
ended30 November
2012
Restricted share units cancelled/
lapsedduring the
year ended 30 November
2012 (7)
Restricted share units
outstanding as at
30 November 2012
Executive Director
Mr. Mark Edward Tucker
1/6/2011 See note (2) 984,087 – 246,021 – 738,066
1/6/2011 1/4/2014(3) 1,433,149 – – – 1,433,149
1/6/2011 See note (4) 806,147 – – – 806,147
15/3/2012 15/3/2015(3) – 1,434,842 – – 1,434,842
Key Management Personnel (excluding Executive Director)
1/6/2011 1/4/2014(3) 2,958,575 – – – 2,958,575
1/6/2011 See note (4) 5,246,778 – – – 5,246,778
15/3/2012 15/3/2015(3) – 2,645,704 – – 2,645,704
Other eligible employees
1/6/2011 See note (4) 1,989,145 – – – 1,989,145
1/6/2011 See note (5) 151,738 – 120,659 – 31,079
1/6/2011 1/4/2014(3) 16,292,777 – – 1,921,139 14,371,638
18/10/2011 1/8/2014(3) 146,193 – – – 146,193
18/10/2011 18/10/2014(3) 1,134,649 – – 103,180 1,031,469
18/10/2011 18/10/2014(6) 59,581 – – – 59,581
15/3/2012 15/3/2015(3) – 17,967,015 – 709,245 17,257,770
15/3/2012 15/3/2015(6) – 81,831 – – 81,831
6/9/2012 6/9/2015(3) – 218,664 – – 218,664
Notes:
(1) The measurement dates for awards made in 2011 were determined to be 15 June 2011 and 2 November 2011. The measurement dates for awards made in 2012 were determined to be 15 March 2012 and 6 September 2012. The measurement dates were determined in accordance with IFRS 2.
(2) The vesting of these restricted share units is service-based only (meaning there are no further performance conditions attached). 25 per cent of the restricted share units (246,021 restricted share units) vested on 1 June 2012; 25 per cent vest on 1 June 2013; and 50 per cent vest on 1 June 2014.
(3) The vesting of these restricted share units is subject to the achievement of performance conditions.
(4) The vesting of these restricted share units is service-based only. One-third of restricted share units vest on 1 April 2014; one-third vest on 1 April 2015; and one-third vest on 1 April 2016.
(5) The vesting of these restricted share units is service-based only. 48,812 restricted share units vested on 1 April 2012; 71,847 restricted share units vested on 1 August 2012; and the remaining vest on 1 April 2013.
(6) The vesting of these restricted share units is service-based only.
(7) These restricted share units lapsed during the year ended 30 November 2012. There are no cancelled restricted share units during the year.

CORPORATE GOVERNANCE
AIA Group Limited Annual Report 2012
98
Remuneration Report
Performance Measures and Vesting
Vesting of performance-based restricted share unit awards
will be contingent on the extent of achievement of three-year
performance targets as outlined below for the following
metrics:
• Value of new business;
• Embedded value; and
• Total shareholder return.
Value of new business (VONB) is an estimate of the economic
value of one year’s sales.
Embedded value (EV) is an estimate of the economic value of
in-force life insurance business, including the net worth on the
Group’s balance sheet but excluding any economic value
attributable to future new business.
Value of new business and embedded value performance are
based on the Group value of new business and embedded
value results published by the Group.
Total shareholder return (TSR) is the compound annual return
from the ownership of a share over a period of time,
measured by calculating the change in the share price and
the gross value of dividends received (and reinvested) during
that period. AIA‘s TSR will be calculated in the same way and
compared with the TSR of companies in the Dow Jones
Insurance Titans 30 Index over the performance period.
The three performance measures are equally weighted.
Achievement of each performance measure will independently
determine the vesting of one-third of the award. Threshold
performance levels are required for restricted share units to
vest; at target performance levels (for TSR, median relative
performance measured against the TSR of the constituents of
the index) 50 per cent of the restricted share units will vest;
and at maximum performance levels (for TSR, top quartile
relative performance measured against the TSR of the
constituents of the index) the full allocation of restricted share
units will vest.
Share Option Scheme
The objective of the Share Option Scheme is to align
participants’ interests with those of the Company’s
shareholders by allowing participants to share in the value
created at the point they exercise their share options. Under
the Share Option Scheme, the Company may award share
options to employees, directors (excluding independent
non-executive directors) or officers of the Company or any of
its subsidiaries. During the year ended 30 November 2012,
7,816,367 share options were awarded by the Company
under the Share Option Scheme to employees and officers of
the Company and employees, officers and directors of a
number of its subsidiaries. The exercise price of such share
options was determined by applying the highest of (i) the
closing price of the shares on the date of grant, (ii) the
average closing price of the shares for the five business days
immediately preceding the date of grant, and (iii) the nominal
value of a share.
The Share Option Scheme has a life of 10 years from the date
of adoption. No amount is payable by the eligible participants
on the acceptance of a share option.
The total number of share options that can be awarded under
the scheme is 301,100,000, representing 2.5 per cent of the
number of shares in issue as at the date of this annual report.
Unless shareholders’ approval is obtained in accordance with
the relevant procedural requirements under the Listing Rules,
the maximum number of shares under options that may be
awarded to any employee in any 12-month period up to and
including a proposed date of grant is 0.25 per cent of the
number of shares in issue as of the proposed date of grant.
No share options have been awarded to substantial
shareholders, or in excess of the individual limit.
The share option awards in year 2012 will be vested entirely
on 15 March 2015. In order to be eligible to receive the
vested awards, participants are required to remain in
employment with the Group as of the vesting date. The share
options awarded expire 10 years from the date of grant and
each share option entitles the eligible participant to subscribe
for one ordinary share. Movements in share options awards
are summarised on the next page:

CO
RP
OR
AT
E G
OV
ER
NA
NC
EO
VE
RV
IEW
FIN
AN
CIA
L A
ND
OP
ER
ATI
NG
RE
VIE
WA
DD
ITIO
NA
L IN
FO
RM
AT
ION
FIN
AN
CIA
L S
TA
TE
ME
NT
S
99Remuneration Report
Executive Director, Key Management Personnel, and other eligible employees
Date of grant (day/
month/ year) (1)
Period duringwhich share options
exercisable (day/month/year)
Share options
outstanding as at
1 December 2011
Shareoptions
awarded during the
year ended 30 November
2012
Shareoptions vested
during the year ended
30 November 2012
Shareoptions
cancelled/ lapsed
during theyear ended
30 November 2012 (5)
Shareoptions
exercised during the
year ended30 November
2012
Exercise price(HK$)
Share options outstanding
as at 30 November
2012
Closing price of shares
immediately before the
date onwhich share
options were awarded
(HK$)
Executive Director
Mr. Mark Edward Tucker
1/6/2011 1/4/2014 – 31/5/2021(2) 2,149,724 – – – – 27.35 2,149,724 27.45
1/6/2011 1/4/2014 – 31/5/2021(3) 2,418,439 – – – – 27.35 2,418,439 27.45
15/3/2012 15/3/2015 – 14/3/2022(4) – 2,152,263 – – – 28.40 2,152,263 27.95
Key Management Personnel (excluding Executive Director)
1/6/2011 1/4/2014 – 31/5/2021(2) 4,437,861 – – – – 27.35 4,437,861 27.45
1/6/2011 1/4/2014 – 31/5/2021(3) 6,831,120 – – – – 27.35 6,831,120 27.45
15/3/2012 15/3/2015 – 14/3/2022(4) – 3,968,554 – – – 28.40 3,968,554 27.95
Other eligible employees
1/6/2011 1/4/2014 – 31/5/2021(2) 1,534,327 – – 71,629 – 27.35 1,462,698 27.45
1/6/2011 1/4/2014 – 31/5/2021(3) 3,055,048 – – – – 27.35 3,055,048 27.45
15/3/2012 15/3/2015 – 14/3/2022(4) – 1,695,550 – – – 28.40 1,695,550 27.95
Notes:
(1) The measurement date for awards made in 2011 was determined to be 15 June 2011. The measurement date for awards made in 2012 was determined to be 15 March 2012. The measurement dates were determined in accordance with IFRS 2.
(2) The vesting of share options is service-based only and has no further performance conditions. All share options vest on 1 April 2014.
(3) The vesting of share options is service-based only and has no further performance conditions. One-third of share options vest on 1 April 2014; one-third vest on 1 April 2015; and one-third vest on 1 April 2016.
(4) The vesting of share options is service-based only and has no further performance conditions. All share options vest on 15 March 2015.
(5) These options lapsed during the year ended 30 November 2012. There are no cancelled options during this period.
Performance Measures and Vesting
Share options awarded under the Share Option Scheme have
a life of 10 years before expiry. Generally, share options
become exercisable three years after the grant date and
remain exercisable for another seven years, subject to
participants’ continued employment in good standing.
There are no performance conditions attached to the
vesting of share options. Benefits are realised only to the
extent that share price exceeds exercise price. Details of
the valuation of the share options are set out in note 38 to
the financial statements.

CORPORATE GOVERNANCE
AIA Group Limited Annual Report 2012
100
Remuneration Report
The table below provides details of target remuneration for the
Group Chief Executive during the years of 2011 and 2012.
Details of remuneration cost incurred to the Company during
the period from 1 December 2011 to 30 November 2012 are
included in note 39 to the financial statements.
DIRECTORS AND KEY MANAGEMENT PERSONNEL EMOLUMENTS
Executive Director
The Group Chief Executive and President, Mr. Mark Edward
Tucker, is the sole Executive Director on the Company’s
Board. He receives his remuneration exclusively for his role as
Group Chief Executive and receives no separate fees for his
role as a Board Director.
US$ Base salary
Targetshort-term
incentive
Targetlong-termincentive Total
Executive Director
Mr. Mark Edward Tucker
Year 2012 1,308,100 1,962,150 5,232,400 8,502,650
Year 2011 1,257,800 1,886,700 5,031,200 8,175,700
Non-executive Directors
The remuneration of the Non-executive Directors and
Independent Non-executive Directors of the Company
during the year ended 30 November 2012 is included in
the table on the next page.
Remuneration for the Non-executive Directors and
Independent Non-executive Directors was paid in respect of
the period from 1 December 2011 to 30 November 2012.
Mr. Rafael Si-Yan Hui resigned as a director of the Company
with effect from 29 March 2012 and his remuneration was
paid in respect of the period from 1 December 2011 to
28 March 2012. Mr. Barry Chun-Yuen Cheung, Mr. George
Yong-Boon Yeo and Dr. Narongchai Akrasanee were
appointed as Independent Non-executive Director on
20 September 2012, 2 November 2012 and 21 November
2012 respectively and their remuneration was paid in respect
of the period from their respective date of appointment to
30 November 2012. Mr. Jack Chak-Kwong So was
re-designated as Independent Non-executive Director with
effect from 26 September 2012 and his remuneration was
governed by a service contract dated 28 September 2010,
as amended. The remuneration paid to the Non-executive
Directors and Independent Non-executive Directors included
the fees for their services provided to the Board Committees.
During the period under review, the Board reviewed and
restructured the Board Committees. Details of the changes
have been set out on pages 89 to 90 of this Annual Report.
CORPORATE GOVERNANCE
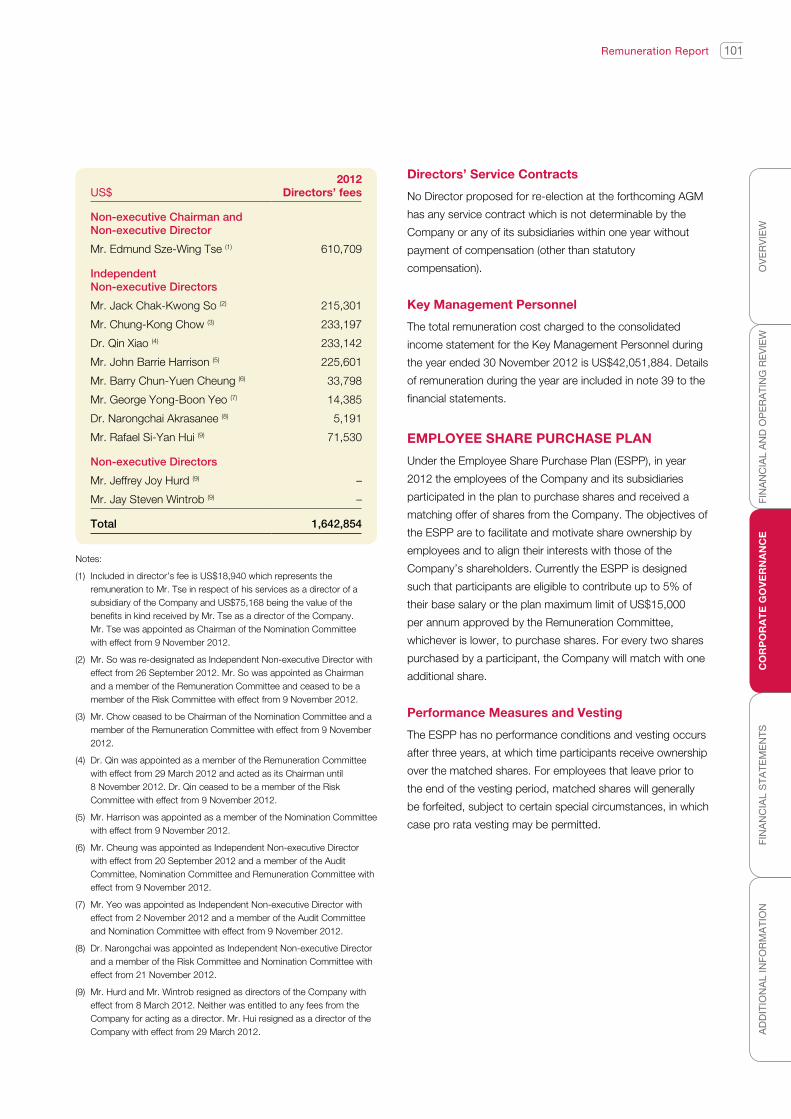
CO
RP
OR
AT
E G
OV
ER
NA
NC
EO
VE
RV
IEW
FIN
AN
CIA
L A
ND
OP
ER
ATI
NG
RE
VIE
WA
DD
ITIO
NA
L IN
FO
RM
AT
ION
FIN
AN
CIA
L S
TA
TE
ME
NT
S
101
US$2012
Directors’ fees
Non-executive Chairman and Non-executive Director
Mr. Edmund Sze-Wing Tse (1) 610,709
Independent Non-executive Directors
Mr. Jack Chak-Kwong So (2) 215,301
Mr. Chung-Kong Chow (3) 233,197
Dr. Qin Xiao (4) 233,142
Mr. John Barrie Harrison (5) 225,601
Mr. Barry Chun-Yuen Cheung (6) 33,798
Mr. George Yong-Boon Yeo (7) 14,385
Dr. Narongchai Akrasanee (8) 5,191
Mr. Rafael Si-Yan Hui (9) 71,530
Non-executive Directors
Mr. Jeffrey Joy Hurd (9) –
Mr. Jay Steven Wintrob (9) –
Total 1,642,854
Notes:
(1) Included in director’s fee is US$18,940 which represents the remuneration to Mr. Tse in respect of his services as a director of a subsidiary of the Company and US$75,168 being the value of the benefits in kind received by Mr. Tse as a director of the Company. Mr. Tse was appointed as Chairman of the Nomination Committee with effect from 9 November 2012.
(2) Mr. So was re-designated as Independent Non-executive Director with effect from 26 September 2012. Mr. So was appointed as Chairman and a member of the Remuneration Committee and ceased to be a member of the Risk Committee with effect from 9 November 2012.
(3) Mr. Chow ceased to be Chairman of the Nomination Committee and a member of the Remuneration Committee with effect from 9 November 2012.
(4) Dr. Qin was appointed as a member of the Remuneration Committee with effect from 29 March 2012 and acted as its Chairman until 8 November 2012. Dr. Qin ceased to be a member of the Risk Committee with effect from 9 November 2012.
(5) Mr. Harrison was appointed as a member of the Nomination Committee with effect from 9 November 2012.
(6) Mr. Cheung was appointed as Independent Non-executive Director with effect from 20 September 2012 and a member of the Audit Committee, Nomination Committee and Remuneration Committee with effect from 9 November 2012.
(7) Mr. Yeo was appointed as Independent Non-executive Director with effect from 2 November 2012 and a member of the Audit Committee and Nomination Committee with effect from 9 November 2012.
(8) Dr. Narongchai was appointed as Independent Non-executive Director and a member of the Risk Committee and Nomination Committee with effect from 21 November 2012.
(9) Mr. Hurd and Mr. Wintrob resigned as directors of the Company with effect from 8 March 2012. Neither was entitled to any fees from the Company for acting as a director. Mr. Hui resigned as a director of the Company with effect from 29 March 2012.
Directors’ Service Contracts
No Director proposed for re-election at the forthcoming AGM
has any service contract which is not determinable by the
Company or any of its subsidiaries within one year without
payment of compensation (other than statutory
compensation).
Key Management Personnel
The total remuneration cost charged to the consolidated
income statement for the Key Management Personnel during
the year ended 30 November 2012 is US$42,051,884. Details
of remuneration during the year are included in note 39 to the
financial statements.
EMPLOYEE SHARE PURCHASE PLAN
Under the Employee Share Purchase Plan (ESPP), in year
2012 the employees of the Company and its subsidiaries
participated in the plan to purchase shares and received a
matching offer of shares from the Company. The objectives of
the ESPP are to facilitate and motivate share ownership by
employees and to align their interests with those of the
Company’s shareholders. Currently the ESPP is designed
such that participants are eligible to contribute up to 5% of
their base salary or the plan maximum limit of US$15,000
per annum approved by the Remuneration Committee,
whichever is lower, to purchase shares. For every two shares
purchased by a participant, the Company will match with one
additional share.
Performance Measures and Vesting
The ESPP has no performance conditions and vesting occurs
after three years, at which time participants receive ownership
over the matched shares. For employees that leave prior to
the end of the vesting period, matched shares will generally
be forfeited, subject to certain special circumstances, in which
case pro rata vesting may be permitted.
Remuneration Report

Proven Execution
We have achieved record financial performance across our key metrics through effective execution of our growth strategy and focus on shareholder value.

Right PeopleWith the

AIA Group Limited Annual Report 2012
FINANCIAL STATEMENTS104 FINANCIAL STATEMENTS
105 Independent Auditor’s Report
107 Consolidated Income Statement
108 Consolidated Statement of Comprehensive Income
109 Consolidated Statement of Financial Position
110 Consolidated Statement of Changes in Equity
111 Consolidated Statement of Cash Flows
112 Notes to the Consolidated Financial Statements
and Significant Accounting Policies
1. Corporate information
2. Significant accounting policies
3. Critical accounting estimates and judgements
4. Exchange rates
5. Operating profit before tax
6. Total weighted premium income and annualised
new premium
7. Segment information
8. Revenue
9. Expenses
10. Income tax
11. Earnings per share
12. Dividends
13. Intangible assets
14. Investments in associates
15. Property, plant and equipment
16. Investment property
17. Fair value of investment property and property held
for use
18. Reinsurance assets
19. Deferred acquisition and origination costs
20. Financial investments
21. Derivative financial instruments
22. Fair value of financial instruments
23. Other assets
24. Cash and cash equivalents
25. Insurance contract liabilities
26. Investment contract liabilities
27. Effect of changes in assumptions and estimates
28. Borrowings
29. Obligations under securities lending and
repurchase agreements
30. Impairment of financial assets
31. Provisions
32. Other liabilities
33. Share capital and reserves
34. Non-controlling interests
35. Group capital structure
36. Risk management
37. Employee benefits
38. Share-based compensation
39. Remuneration of directors and
key management personnel
40. Related party transactions
41. Commitments and contingencies
42. Subsidiaries
43. Events after the reporting period
208 Financial Statements of the Company
Statement of Financial Position of the Company
Notes to Financial Statements of the Company
211 Supplementary Embedded Value Information
Contents

AD
DIT
ION
AL
INF
OR
MA
TIO
NF
INA
NC
IAL
ST
AT
EM
EN
TS
105
CO
RP
OR
AT
E G
OV
ER
NA
NC
EO
VE
RV
IEW
FIN
AN
CIA
L A
ND
OP
ER
ATI
NG
RE
VIE
W
Independent Auditor’s ReportFINANCIAL STATEMENTS
To The shareholders of aIa Group lImITed
(incorporated in Hong Kong with limited liability)
We have audited the consolidated financial statements of AIA Group Limited (the Company) and its subsidiaries (together, “the
Group”) set out on pages 107 to 210, which comprise the consolidated and company statements of financial position as at 30
November 2012 and the consolidated income statement, the consolidated statement of comprehensive income, the consolidated
statement of changes in equity and the consolidated statement of cash flows for the year then ended, and a summary of significant
accounting policies and other explanatory information.
dIrecTors’ responsIbIlITy for The consolIdaTed fInancIal sTaTemenTs
The directors of the Company are responsible for the preparation of consolidated financial statements that give a true and fair view
in accordance with Hong Kong Financial Reporting Standards issued by the Hong Kong Institute of Certified Public Accountants
(HKICPA), and with the International Financial Reporting Standards as issued by the International Accounting Standards Board (IASB)
and the Hong Kong Companies Ordinance, and for such internal control as the directors determine is necessary to enable the
preparation of consolidated financial statements that are free from material misstatement, whether due to fraud or error.
audITor’s responsIbIlITy
Our responsibility is to express an opinion on these consolidated financial statements based on our audit and to report our opinion
solely to you, as a body, in accordance with section 141 of the Hong Kong Companies Ordinance and for no other purpose. We
do not assume responsibility towards or accept liability to any other person for the contents of this report.
We conducted our audit in accordance with Hong Kong Standards on Auditing issued by the HKICPA. Those standards require
that we comply with ethical requirements and plan and perform the audit to obtain reasonable assurance about whether the
consolidated financial statements are free from material misstatement.
An audit involves performing procedures to obtain audit evidence about the amounts and disclosures in the consolidated financial
statements. The procedures selected depend on the auditor’s judgment, including the assessment of the risks of material
misstatement of the consolidated financial statements, whether due to fraud or error. In making those risk assessments, the auditor
considers internal control relevant to the entity’s preparation of consolidated financial statements that give a true and fair view
in order to design audit procedures that are appropriate in the circumstances, but not for the purpose of expressing an opinion
on the effectiveness of the entity’s internal control. An audit also includes evaluating the appropriateness of accounting policies
used and the reasonableness of accounting estimates made by the directors, as well as evaluating the overall presentation of the
consolidated financial statements.
We believe that the audit evidence we have obtained is sufficient and appropriate to provide a basis for our audit opinion.

AIA Group Limited Annual Report 2012
106 FINANCIAL STATEMENTS
Independent Auditor’s Report
OpiniOn
In our opinion, the consolidated financial statements give a true and fair view of the state of affairs of the Company and of the
Group as at 30 November 2012 and of the Group’s profit and cash flows for the year then ended in accordance with both Hong
Kong Financial Reporting Standards issued by the HKICPA and with International Financial Reporting Standards issued by the
IASB and have been properly prepared in accordance with the Hong Kong Companies Ordinance.
PricewaterhouseCoopers
Certified Public Accountants
Hong Kong
27 February 2013

AD
DIT
ION
AL
INF
OR
MA
TIO
NF
INA
NC
IAL
ST
AT
EM
EN
TS
107
CO
RP
OR
AT
E G
OV
ER
NA
NC
EO
VE
RV
IEW
FIN
AN
CIA
L A
ND
OP
ER
ATI
NG
RE
VIE
W
FINANCIAL STATEMENTS
Consolidated Income Statement
US$m Notes
year ended30 november
2012
Year ended30 November
2011
RevenueTurnoverPremiums and fee income 13,816 12,935Premiums ceded to reinsurers (762) (634)
Net premiums and fee income 13,054 12,301Investment return 8 7,206 1,973Other operating revenue 8 127 114
Total revenue 20,387 14,388
ExpensesInsurance and investment contract benefits 14,077 9,601Insurance and investment contract benefits ceded (703) (529)
net insurance and investment contract benefits 13,374 9,072Commission and other acquisition expenses 1,641 1,649Operating expenses 1,340 1,253Restructuring and other non-operating costs 80 50Investment management expenses 233 225Finance costs 19 12Change in third-party interests in consolidated investment funds 2 (29)
Total expenses 9 16,689 12,232
profit before share of profit from associates 3,698 2,156Share of profit from associates 14 16 12
profit before tax 3,714 2,168
Income tax expense attributable to policyholders’ returns (104) (47)
profit before tax attributable to shareholders’ profits 3,610 2,121
Tax expense 10 (685) (560)Tax attributable to policyholders’ returns 104 47Tax expense attributable to shareholders’ profits (581) (513)
net profit 3,029 1,608
Net profit attributable to:
shareholders of aIa Group limited 3,019 1,600Non-controlling interests 10 8
Earnings per share (US$)Basic 11 0.25 0.13Diluted 11 0.25 0.13
Dividends to shareholders of the Company attributable to the year:
US$m Notes
year ended30 november
2012
Year ended30 November
2011
Interim dividend declared and paid of 12.33 Hong Kong cents per share(2011: 11.00 Hong Kong cents per share) 12 191 170
Final dividend proposed after the reporting date of 24.67 Hong Kong cents per share (2011: 22.00 Hong Kong cents per share) 12 382 339
573 509

AIA Group Limited Annual Report 2012
108
Consolidated Statement of Comprehensive IncomeFINANCIAL STATEMENTS
year ended30 november
Year ended30 November
US$m 2012 2011
Net profit 3,029 1,608Fair value gains on available for sale financial assets
(net of tax of: 2012: US$(211)m; 2011: US$(69)m) 2,617 558Fair value gains on available for sale financial assets
transferred to income on disposal(net of tax of: 2012: US$3m; 2011: US$3m) (47) (36)
Foreign currency translation adjustments 377 (75)Share of other comprehensive income/(expense) from associates 12 (24)
Other comprehensive income 2,959 423
Total comprehensive income 5,988 2,031
Total comprehensive income attributable to:
Shareholders of AIA Group Limited 5,956 2,017Non-controlling interests 32 14

AD
DIT
ION
AL
INF
OR
MA
TIO
NF
INA
NC
IAL
ST
AT
EM
EN
TS
109
CO
RP
OR
AT
E G
OV
ER
NA
NC
EO
VE
RV
IEW
FIN
AN
CIA
L A
ND
OP
ER
ATI
NG
RE
VIE
W
FINANCIAL STATEMENTS
Consolidated Statement of Financial Position
US$m Notes
as at30 november
2012
As at30 November
2011
AssetsIntangible assets 13 272 276Investments in associates 14 91 61Property, plant and equipment 15 412 359Investment property 16, 17 1,035 896Reinsurance assets 18 1,153 858Deferred acquisition and origination costs 19 14,161 12,818Financial investments: 20, 22
Loans and deposits 6,425 4,565Available for sale
Debt securities 62,268 51,018At fair value through profit or loss
Debt securities 18,594 16,934Equity securities 23,656 19,012Derivative financial instruments 21 638 725
111,581 92,254Deferred tax assets 10 5 4Current tax recoverable 46 44Other assets 23 2,735 2,588Cash and cash equivalents 24 2,948 4,303
Total assets 134,439 114,461
LiabilitiesInsurance contract liabilities 25 90,574 78,752Investment contract liabilities 26 8,865 8,360Borrowings 28 766 559Obligations under securities lending and repurchase agreements 29 1,792 670Derivative financial instruments 21 41 38Provisions 31 204 180Deferred tax liabilities 10 2,229 1,810Current tax liabilities 328 290Other liabilities 32 2,812 2,387
Total liabilities 107,611 93,046
EquityIssued share capital 33 12,044 12,044Share premium 33 1,914 1,914Employee share-based trusts 33 (188) (105)Other reserves 33 (12,060) (12,101)Retained earnings 17,843 15,354
Fair value reserve 33 5,979 3,414Foreign currency translation reserve 33 1,165 793
Amounts reflected in other comprehensive income 7,144 4,207Total equity attributable to:
Shareholders of AIA Group Limited 26,697 21,313Non-controlling interests 34 131 102
Total equity 26,828 21,415
Total liabilities and equity 134,439 114,461
Approved and authorised for issue by the Board of Directors on 27 February 2013.
Mark Edward Tucker Edmund Sze-Wing Tse Director Director

AIA Group Limited Annual Report 2012
110
Consolidated Statement of Changes in EquityFINANCIAL STATEMENTS
US$m Notes
Issuedshare
capitaland sharepremium
Employeeshare-basedtrusts
Otherreserves
Retainedearnings
Fairvalue
reserve
Foreigncurrency
translationreserve
Non-controlling
interestsTotal
equity
Balance at 1 December 2010 13,958 – (12,117) 13,924 2,914 876 80 19,635
Net profit – – – 1,600 – – 8 1,608Fair value gains on
available for sale financial assets – – – – 554 – 4 558
Fair value gains on available for sale financial assetstransferred to incomeon disposal – – – – (36) – – (36)
Foreign currency translationadjustments – – – – – (77) 2 (75)
Share of other comprehensiveexpense from associates – – – – (18) (6) – (24)
Total comprehensiveincome/(expense) for the year – – – 1,600 500 (83) 14 2,031
Capital contributions – – – – – – 10 10Dividends 12 – – – (170) – – (2) (172)Share-based
compensation – – 16 – – – – 16Purchase of shares
held by employee share-based trusts – (105) – – – – – (105)
Balance at 30 November 2011 13,958 (105) (12,101) 15,354 3,414 793 102 21,415
Net profit – – – 3,019 – – 10 3,029Fair value gains on
available for sale financial assets – – – – 2,599 – 18 2,617
Fair value gains on available for sale financial assetstransferred to incomeon disposal – – – – (47) – – (47)
Foreign currency translationadjustments – – – – – 373 4 377
Share of other comprehensiveincome/(expense) from associates – – – – 13 (1) – 12
Total comprehensive income for the year – – – 3,019 2,565 372 32 5,988
Dividends 12 – – – (530) – – (3) (533)Share-based
compensation – – 41 – – – – 41Purchase of shares
held by employee share-based trusts – (84) – – – – – (84)
Transfer of vested shares from employee share-based trusts – 1 – – – – – 1
Balance at 30 November 2012 13,958 (188) (12,060) 17,843 5,979 1,165 131 26,828

AD
DIT
ION
AL
INF
OR
MA
TIO
NF
INA
NC
IAL
ST
AT
EM
EN
TS
111
CO
RP
OR
AT
E G
OV
ER
NA
NC
EO
VE
RV
IEW
FIN
AN
CIA
L A
ND
OP
ER
ATI
NG
RE
VIE
W
FINANCIAL STATEMENTS
Consolidated Statement of Cash Flows
Cash flows presented in this statement cover all the Group’s activities and include flows from unit-linked contracts, participating
funds, and other policyholder and shareholder activities.
US$m Notes
year ended30 november
2012
Year ended30 November
2011
Cash flows from operating activitiesProfit before tax 3,714 2,168Adjustments for:
Financial instruments 20 (13,856) (2,963)Insurance and investment contract liabilities 8,613 3,823Obligations under securities lending and repurchase agreements 29 1,081 (441)Other non-cash operating items, including investment income (3,665) (3,665)Operating cash items:
Interest received 3,848 3,476Dividends received 387 336Interest paid (24) (11)Tax paid (510) (601)
Net cash (used in)/provided by operating activities (412) 2,122
Cash flows from investing activitiesDistribution from investments in associates 14 4 –Payments for investment property and property, plant and equipment 15, 16 (302) (88)Payments for leasehold land 23 (104) –Proceeds from sale of investment property and property, plant and equipment – 23Payments for intangible assets 13 (58) (54)
Net cash used in investing activities (460) (119)
Cash flows from financing activitiesDividends paid during the year (533) (172)Proceeds from borrowings 28 490 –Repayment of borrowings 28 (453) (39)Purchase of shares held by employee share-based trusts (84) (105)Capital contributions from non-controlling interests – 10
Net cash used in financing activities (580) (306)
Net (decrease)/increase in cash and cash equivalents (1,452) 1,697Cash and cash equivalents at beginning of the financial year 4,303 2,595Effect of exchange rate changes on cash and cash equivalents 97 11
Cash and cash equivalents at end of the financial year 24 2,948 4,303

AIA Group Limited Annual Report 2012
112
Notes to the Consolidated Financial Statements and Significant Accounting Policies
FINANCIAL STATEMENTS
1. corporaTe InformaTIon
AIA Group Limited (the Company) was established as a company with limited liability incorporated in Hong Kong on 24 August
2009. The address of its registered office is 35/F, AIA Central, No. 1 Connaught Road Central, Hong Kong.
AIA Group Limited is listed on the Main Board of The Stock Exchange of Hong Kong Limited under the stock code “1299” with
American Depositary Receipts (Level 1) being traded on the over-the-counter market (ticker symbol: “AAGIY”).
AIA Group Limited and its subsidiaries (collectively “AIA” or “the Group”) is a life insurance based financial services provider
operating in 15 jurisdictions throughout the Asia-Pacific region. The Group extended its footprint into a 16th jurisdiction through
an acquisition in Sri Lanka subsequent to the year end (see note 43). The Group’s principal activity is the writing of life insurance
business, providing life, pension and accident and health insurance throughout Asia, and distributing related investment and other
financial services products to its customers.
2. sIGnIfIcanT accounTInG polIcIes
2.1 basis of preparation and statement of compliance
The consolidated financial statements have been prepared in accordance with International Financial Reporting Standards (IFRS),
Hong Kong Financial Reporting Standards (HKFRS) and the Hong Kong Companies Ordinance. HKFRS is substantially consistent
with IFRS and the accounting policy selections that the Group has made in preparing these consolidated financial statements
are such that the Group is able to comply with both IFRS and HKFRS. References to IFRS, International Accounting Standards
(IAS) and Interpretation developed by the International Financial Reporting Interpretation Committee (IFRIC) in these consolidated
financial statements should be read as referring to the equivalent HKFRS, Hong Kong Accounting Standards (HKAS) and Hong
Kong (IFRIC) Interpretations (HK(IFRIC) – Int) as the case may be. Accordingly, there are no differences of accounting practice
between IFRS and HKFRS affecting these consolidated financial statements.
The consolidated financial statements have been approved for issue by the Board of Directors on 27 February 2013.
The consolidated financial statements have been prepared using the historical cost convention, as modified by the revaluation of
available for sale financial assets, certain financial assets and liabilities designated at fair value through profit or loss and derivative
financial instruments, all of which are carried at fair value.
Items included in the consolidated financial statements of each of the Group’s entities are measured in the currency of the primary
economic environment in which that entity operates (the functional currency). The consolidated financial statements are presented
in millions of US dollars (US$m) unless otherwise stated, which is the Company’s functional currency, and the presentation
currency of the Company and the Group.
The accounting policies adopted are consistent with those of the previous financial year, except as described below.
(a) The following amendments to standards and interpretation are mandatory for the first time for the financial year beginning 1
December 2011 and have no material impact for the Group:
• IAS24,RelatedPartyDisclosures,Reviseddefinitionofrelatedparties(asrevisedin2009);
• AmendmenttoIAS1,PresentationofFinancialStatements,Clarificationofstatementofchangesinequity;
• AmendmentstoIFRS7,FinancialInstruments:Disclosures,Clarificationofdisclosures;
• AmendmentstoIFRS7,FinancialInstruments:Disclosures,Enhancingdisclosuresabouttransfersoffinancialassets;and
• AmendmenttoIFRICInt–14,Prepaymentsofaminimumfundingrequirement.

AD
DIT
ION
AL
INF
OR
MA
TIO
NF
INA
NC
IAL
ST
AT
EM
EN
TS
113
CO
RP
OR
AT
E G
OV
ER
NA
NC
EO
VE
RV
IEW
FIN
AN
CIA
L A
ND
OP
ER
ATI
NG
RE
VIE
W
Notes to the Consolidated Financial Statements and Significant Accounting Policies
2. sIGnIfIcanT accounTInG polIcIes (continued)
2.1 basis of preparation and statement of compliance (continued)
(b) The following new standards and amendments to standards have been issued but are not effective for the financial year ended
30 November 2012 and 2011 and have not been early adopted (the financial years for which the adoption is planned and
required are stated in parenthesis). The Group is yet to assess the full impact of these new standards on its financial position
and results of operations; however, they are not expected to have a material impact on the financial position or results of
operations of the Group but may require additional disclosures:
• IFRS11,JointArrangements(2014);
• IFRS12,DisclosureofInterestsinOtherEntities(2014);
• IAS27,SeparateFinancialStatements(asrevisedin2011)(2014);
• IAS28,InvestmentsinAssociatesandJointVentures(asrevisedin2011)(2014);
• AmendmenttoIAS1,PresentationofItemsofOtherComprehensiveIncome(2013);
• AmendmentstoIAS1,PresentationofFinancialStatements,Clarificationoftherequirementsforcomparativeinformation
(2014);
• AmendmentstoIAS12,IncomeTaxes,Recoveryofunderlyingassets(2013);
• AmendmentstoIAS32,FinancialInstruments:Presentationonoffsettingfinancialassetsandfinancialliabilities(2015);
• AmendmentstoIAS32,FinancialInstruments:Presentation,Taxeffectofdistributionstoholdersofequityinstruments
(2014);
• AmendmentstoIFRS7,FinancialInstruments:Disclosuresonoffsettingfinancialassetsandfinancialliabilities(2014);
• AmendmentstoIFRS10,IFRS11andIFRS12:ConsolidatedFinancialStatements,JointArrangementsandDisclosureof
Interests in Other Entities: Transition Guidance (2014); and
• AmendmentstoIFRS10,IFRS12andIAS27:InvestmentEntities(2015).
(c) The following new standards and amendments to standards have been issued but are not effective for the financial year ended
30 November 2012 and 2011 and have not been early adopted (the financial years for which the adoption is planned and
required are stated in parenthesis). The Group is yet to assess the full impact of these new standards on its financial position
and results of operations; however, they may have a material impact on the financial position or results of operations of the
Group and require additional disclosures:
• IFRS9,FinancialInstruments(2016);
• IFRS10,ConsolidatedFinancialStatements(2014);
• IFRS13,FairValueMeasurement(2014);and
• IAS19,EmployeeBenefits(asrevisedin2011)(2014).
All key items are defined upon the first time they are used and included in the glossary.
The significant accounting policies adopted in the preparation of the Group’s consolidated financial statements are set out below.
These policies have been applied consistently in all periods presented.

AIA Group Limited Annual Report 2012
114
Notes to the Consolidated Financial Statements and Significant Accounting Policies
FINANCIAL STATEMENTS
2. sIGnIfIcanT accounTInG polIcIes (continued)
2.2 operating profitThe long-term nature of much of the Group’s operations means that, for management’s decision-making and internal performance management purposes, the Group evaluates its results and its operating segments using a financial performance measure referred to as “operating profit”. The Group defines operating profit before and after tax respectively as profit excluding the following non-operating items:
• investmentexperience(whichconsistsofrealisedgainsandlosses,foreignexchangegainsandlosses,impairmentsandunrealised gains and losses on investments held at fair value through profit or loss);
• investmentincomerelatedtounit-linkedcontracts(consistingofdividends,interestincomeandrentalincome);
• investmentmanagementexpensesrelatedtounit-linkedcontracts;
• correspondingchangesininsuranceandinvestmentcontractliabilitiesinrespectofunit-linkedcontractsandparticipatingfunds (see note 2.4) and changes in third-party interests in consolidated investment funds;
• policyholders’shareoftaxrelatingtochangesininsuranceandinvestmentcontractliabilities;and
• othersignificantitemsthatmanagementconsiderstobenon-operatingincomeandexpenses.
Whilst these excluded non-operating items are significant components of the Group’s profit, the Group considers that the presentation of operating profit enhances the understanding and comparability of its performance and that of its operating segments. The Group considers that trends can be more clearly identified without the fluctuating effects of these non-operating items, many of which are largely dependent on market factors.
Operating profit is provided as additional information to assist in the comparison of business trends in different reporting periods on a consistent basis and enhance overall understanding of financial performance.
2.3 basis of consolidation
subsidiariesSubsidiaries are those entities (including special purpose entities) over which the Group, directly or indirectly, has power to exercise control over financial and operating policies in order to gain economic benefits. Subsidiaries are consolidated from the date on which control is transferred to the Group and are excluded from consolidation from the date at which the Group no longer has control. Intercompany transactions are eliminated.
The Group utilises the purchase method of accounting to account for the acquisition of subsidiaries, unless the acquisition forms part of the Group reorganisation of entities under common control. Under this method, the cost of an acquisition is measured as the fair value of consideration payable, shares issued or liabilities assumed at the date of acquisition. The excess of the cost of acquisition over the fair value of the net assets of the subsidiary acquired is recorded as goodwill (see note 2.10 below). Any surplus of the acquirer’s interest in the subsidiary’s net assets over the cost of acquisition is credited to the consolidated income statement.
The consolidated financial statements of the Group include the assets, liabilities and results of the Company and subsidiaries in which AIA Group Limited has a controlling interest, using accounts drawn up to the reporting date.
Investment fundsIn several countries, the Group has invested in investment funds, such as mutual funds and unit trusts. These invest mainly in equities, debt securities and cash and cash equivalents. The Group’s percentage ownership in these funds can fluctuate from day to day according to the Group’s and third-party participation in them. Where the Group is deemed to control such funds, with control determined based on an analysis of the guidance in IAS 27 and SIC 12, they are consolidated, with the interests of parties other than the Group being classified as liabilities because there is a contractual obligation for the issuer to repurchase or redeem units in such funds for cash. These are presented as “Third-party interests in consolidated investment funds” within other liabilities in the consolidated statement of financial position. In instances where the Group’s ownership of investment funds declines marginally below 50 per cent and, based on historical analysis and future expectations, the decline in ownership is expected to be temporary, the funds continue to be consolidated as subsidiaries under IAS 27. Likewise, marginal increases in ownership of investment funds above 50 per cent which are expected to be temporary are not consolidated. Where the Group does not control such funds, they are not accounted for as associates and are, instead, carried at fair value through profit or loss within financial investments in the consolidated statement of financial position.

AD
DIT
ION
AL
INF
OR
MA
TIO
NF
INA
NC
IAL
ST
AT
EM
EN
TS
115
CO
RP
OR
AT
E G
OV
ER
NA
NC
EO
VE
RV
IEW
FIN
AN
CIA
L A
ND
OP
ER
ATI
NG
RE
VIE
W
Notes to the Consolidated Financial Statements and Significant Accounting Policies
2. sIGnIfIcanT accounTInG polIcIes (continued)
2.3 basis of consolidation (continued)
employee share-based trusts
Trusts are set up to acquire shares of the Company for distribution to participants in future periods through the share-based
compensation schemes. The consolidation of these trusts is evaluated in accordance with SIC 12; where the Group is deemed to
control the trusts, they are consolidated. Shares acquired by the trusts to the extent not provided to the participants upon vesting
are carried at cost and reported as “employee share-based trusts” in the consolidated statement of financial position.
non-controlling interests
Non-controlling interests are presented within equity except when they arise through the minority’s interest in puttable liabilities
such as the unit holders’ interest in consolidated investment funds, when they are recognised as a liability, reflecting the net assets
of the consolidated entity.
Acquisitions and disposals of non-controlling interests, except when they arise through the minority’s interest in puttable liabilities,
are treated as transactions between equity holders. As a result, any difference between the acquisition cost or sale price of the
non-controlling interest and the carrying value of the non-controlling interest is recognised as an increase or decrease in equity.
associates and joint ventures
Associates are entities over which the Group has significant influence, but which it does not control. Generally, it is presumed
thattheGrouphassignificantinfluenceifithasbetween20percentand50percentofvotingrights.Jointventuresareentities
whereby the Group and other parties undertake an economic activity which is subject to joint control arising from a contractual
agreement.
Gains on transactions between the Group and its associates and joint ventures are eliminated to the extent of the Group’s interest
in the associates and joint ventures. Losses are also eliminated, unless the transaction provides evidence of an impairment of an
asset transferred between entities.
Investments in associates are accounted for using the equity method of accounting. Under this method, the cost of the investment
in an associate, together with the Group’s share of that entity’s post-acquisition changes to equity, is included as an asset in the
consolidated statement of financial position. Cost includes goodwill arising on acquisition. The Group’s share of post-acquisition
profits or losses is recognised in the consolidated income statement and its share of post-acquisition movement in equity is
recognised in equity. Equity accounting is discontinued when the Group no longer has significant influence over the investment. If
the Group’s share of losses in an associate equals or exceeds its interest in the undertaking, additional losses are provided for, and
a liability recognised, only to the extent that the Group has incurred legal or constructive obligations or made payments on behalf
of the associate. The Group also accounts for investments in joint ventures that are subject to joint control using the equity method
of accounting.
The company’s investments
In the Company’s statement of financial position, subsidiaries, associates and joint ventures are stated at cost, unless impaired.
The Company’s interests in investment funds such as mutual funds and unit trusts are designated at fair value through profit or
loss.
2.4 Insurance and investment contracts
Consistent accounting policies for the measurement and recognition of insurance and investment contracts have been adopted
throughout the Group to substantially all of its business.
In a limited number of cases, the Group measures insurance contract liabilities with reference to statutory requirements in the
applicable jurisdiction, without deferral of acquisition costs.

AIA Group Limited Annual Report 2012
116
Notes to the Consolidated Financial Statements and Significant Accounting Policies
FINANCIAL STATEMENTS
2. sIGnIfIcanT accounTInG polIcIes (continued)
2.4 Insurance and investment contracts (continued)
product classificationThe Group classified its contracts written as either insurance contracts or investment contracts, depending on the level of insurance risk. Insurance contracts are those contracts that transfer significant insurance risk, while investment contracts are those contracts without significant insurance risk. Some insurance and investment contracts, referred to as participating business, have discretionary participation features, or DPF, which may entitle the customer to receive, as a supplement to guaranteed benefits, additional non-guaranteed benefits, such as policyholder dividends or bonuses. The Group applies the same accounting policies for the recognition and measurement of obligations arising from investment contracts with DPF as it does for insurance contracts.
In the event that a scenario (other than those lacking commercial substance) exists in which an insured event would require the Group to pay significant additional benefits to its customers, the contract is accounted for as an insurance contract. For investment contracts that do not contain DPF, IAS 39, Financial Instruments: Measurement and Recognition, and, if the contract includes an investment management element, IAS 18, Revenue Recognition, are applied. IFRS 4 permits the continued use of previously applied accounting policies for insurance contracts and investment contracts with DPF, and this basis has been adopted by the Group in accounting for such contracts. Once a contract has been classified as an insurance or investment contract no reclassification is subsequently performed, unless the terms of the agreement are later amended.
Certain contracts with DPF supplement the amount of guaranteed benefits due to policyholders. These contracts are distinct from other insurance and investment contracts as the Group has discretion in the amount and/or timing of the benefits declared, and how such benefits are allocated between groups of policyholders. Customers may be entitled to receive, as a supplement to guaranteed benefits, additional benefits or bonuses:
• thatarelikelytobeasignificantportionofthetotalcontractualbenefits;
• whoseamountortimingiscontractuallyatthediscretionoftheGroup;and
• thatarecontractuallybasedon:
– the performance of a specified pool of contracts or a specified type of contract;
– realised and/or unrealised investment returns on a specified pool of assets held by the issuer; or
– the profit or loss of the company, fund or other entity that issues the contract.
The Group applies the same accounting policies for the recognition and measurement of obligations and the deferral of acquisition costs arising from investment contracts with DPF as it does to insurance contracts. The Group refers to such contracts as participating business.
In some jurisdictions participating business is written in a participating fund which is distinct from the other assets of the company or branch. The allocation of benefits from the assets held in such participating funds is subject to minimum policyholder participation mechanisms which are established by regulation. The extent of such policy participation may change over time. The current policyholder participation in declared dividends for locations with participating funds is set out below:
Country Current policyholder participation
Singapore 90%Malaysia 90%China 70%Australia 80%Brunei 80%
In some jurisdictions participating business is not written in a distinct fund and the Group refers to this as other participating business.
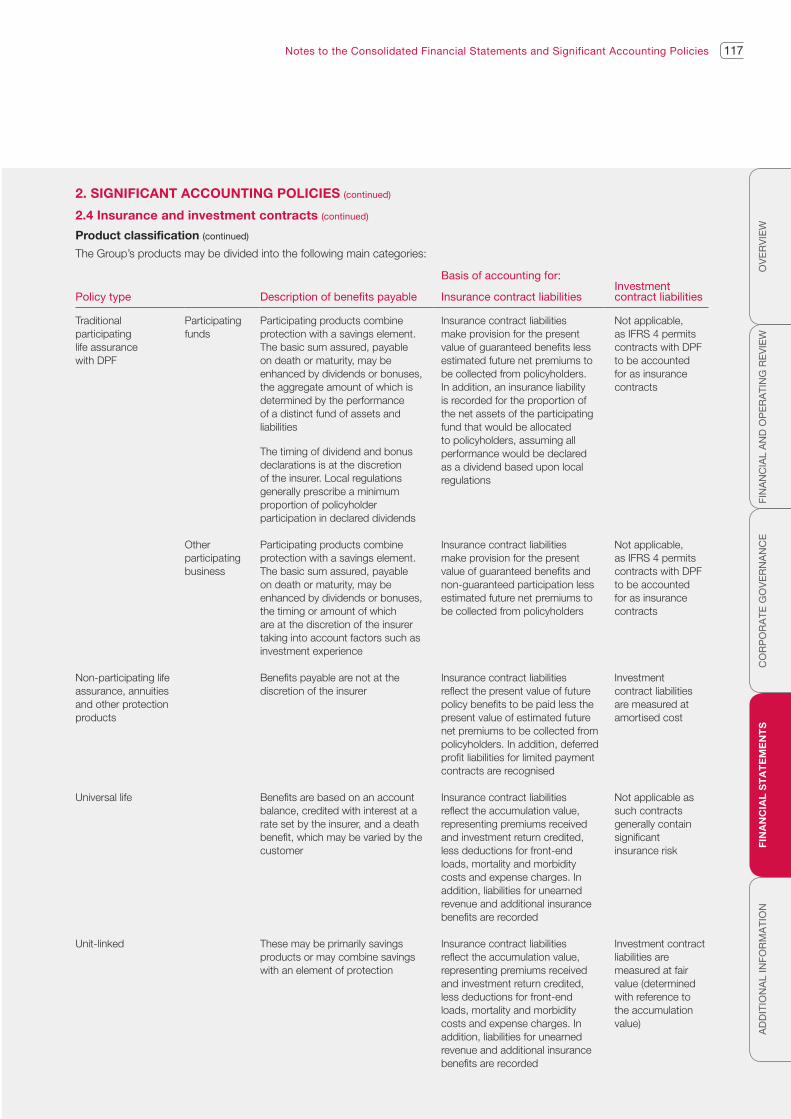
AD
DIT
ION
AL
INF
OR
MA
TIO
NF
INA
NC
IAL
ST
AT
EM
EN
TS
117
CO
RP
OR
AT
E G
OV
ER
NA
NC
EO
VE
RV
IEW
FIN
AN
CIA
L A
ND
OP
ER
ATI
NG
RE
VIE
W
Notes to the Consolidated Financial Statements and Significant Accounting Policies
2. sIGnIfIcanT accounTInG polIcIes (continued)
2.4 Insurance and investment contracts (continued)
product classification (continued)
The Group’s products may be divided into the following main categories:
Basis of accounting for:
Policy type Description of benefits payable Insurance contract liabilitiesInvestment contract liabilities
Traditional participatinglife assurance with DPF
Participating funds
Participating products combine protection with a savings element. The basic sum assured, payable on death or maturity, may be enhanced by dividends or bonuses, the aggregate amount of which is determined by the performance of a distinct fund of assets and liabilities
The timing of dividend and bonus declarations is at the discretion of the insurer. Local regulations generally prescribe a minimum proportion of policyholder participation in declared dividends
Insurance contract liabilities make provision for the present value of guaranteed benefits less estimated future net premiums to be collected from policyholders. In addition, an insurance liability is recorded for the proportion of the net assets of the participating fund that would be allocated to policyholders, assuming all performance would be declared as a dividend based upon local regulations
Not applicable, as IFRS 4 permits contracts with DPF to be accounted for as insurance contracts
Other participatingbusiness
Participating products combine protection with a savings element. The basic sum assured, payable on death or maturity, may be enhanced by dividends or bonuses, the timing or amount of which are at the discretion of the insurer taking into account factors such as investment experience
Insurance contract liabilities make provision for the present value of guaranteed benefits and non-guaranteed participation less estimated future net premiums to be collected from policyholders
Not applicable, as IFRS 4 permits contracts with DPF to be accounted for as insurance contracts
Non-participating lifeassurance, annuitiesand other protectionproducts
Benefits payable are not at the discretion of the insurer
Insurance contract liabilities reflect the present value of future policy benefits to be paid less the present value of estimated future net premiums to be collected from policyholders. In addition, deferred profit liabilities for limited payment contracts are recognised
Investment contract liabilities are measured at amortised cost
Universal life Benefits are based on an account balance, credited with interest at a rate set by the insurer, and a death benefit, which may be varied by the customer
Insurance contract liabilities reflect the accumulation value, representing premiums received and investment return credited, less deductions for front-end loads, mortality and morbidity costs and expense charges. In addition, liabilities for unearned revenue and additional insurance benefits are recorded
Not applicable as such contracts generally contain significant insurance risk
Unit-linked These may be primarily savings products or may combine savings with an element of protection
Insurance contract liabilities reflect the accumulation value, representing premiums received and investment return credited, less deductions for front-end loads, mortality and morbidity costs and expense charges. In addition, liabilities for unearned revenue and additional insurance benefits are recorded
Investment contract liabilities are measured at fair value (determined with reference to the accumulation value)

AIA Group Limited Annual Report 2012
118
Notes to the Consolidated Financial Statements and Significant Accounting Policies
FINANCIAL STATEMENTS
2. sIGnIfIcanT accounTInG polIcIes (continued)
2.4 Insurance and investment contracts (continued)
product classification (continued)
In the notes to the financial statements, unit-linked contracts are presented together with pension contracts for disclosure
purposes.
The basis of accounting for insurance and investment contracts is discussed in notes 2.4.1 and 2.4.2 below.
2.4.1 Insurance contracts and investment contracts with dpf
Premiums
Premiums from life insurance contracts, including participating policies and annuity policies with life contingencies, are recognised
as revenue when due from the policyholder. Benefits and expenses are provided in respect of such revenue so as to recognise
profits over the estimated life of the policies. For limited pay contracts, premiums are recognised in profit or loss when due, with
any excess profit deferred and recognised in income in a constant relationship to the insurance in-force or, for annuities, the
amount of expected benefit payments.
Amounts collected as premiums from insurance contracts with investment features but with sufficient insurance risk to be
considered insurance contracts, such as universal life, and certain unit-linked contracts, are accumulated as deposits. Revenue
from these contracts consists of policy fees for the cost of insurance, administration, and surrenders during the period.
Upfront fees are recognised over the estimated life of the contracts to which they relate. Policy benefits and claims that are
charged to expenses include benefit claims incurred in the period in excess of related policyholder contract deposits and interest
credited to policyholder deposits.
Unearned revenue liability
Unearned revenue liability arising from insurance contracts representing upfront fees and other non-level charges is deferred and
released to the consolidated income statement over the estimated life of the business.
Deferred acquisition costs
The costs of acquiring new insurance contracts, including commissions, underwriting and other policy issue expenses which vary
with and are primarily related to the production of new business or renewal of existing business, are deferred as an asset. Deferred
acquisition costs are assessed for recoverability in the year of policy issue to ensure that these costs are recoverable out of the
estimated future margins to be earned on the policy. Deferred acquisition costs are assessed for recoverability at least annually
thereafter. Future investment income is also taken into account in assessing recoverability. To the extent that acquisition costs are
not considered to be recoverable at inception or thereafter, these costs are expensed in the consolidated income statement.
Deferred acquisition costs for life insurance and annuity policies are amortised over the expected life of the contracts as a constant
percentage of expected premiums. Expected premiums are estimated at the date of policy issue and are consistently applied
throughout the life of the contract unless a deficiency occurs when performing liability adequacy testing (see below).
Deferred acquisition costs for universal life and unit-linked contracts are amortised over the expected life of the contracts based on
a constant percentage of the present value of estimated gross profits expected to be realised over the life of the contract or on a
straight-line basis. Estimated gross profits include expected amounts to be assessed for mortality, administration, investment and
surrenders, less benefit claims in excess of policyholder balances, administrative expenses and interest credited. Estimated gross
profits are revised regularly. The interest rate used to compute the present value of revised estimates of expected gross profits is
the latest revised rate applied to the remaining benefit period. Deviations of actual results from estimated experience are reflected
in earnings.
AD
DIT
ION
AL
INF
OR
MA
TIO
NF
INA
NC
IAL
ST
AT
EM
EN
TS
119
CO
RP
OR
AT
E G
OV
ER
NA
NC
EO
VE
RV
IEW
FIN
AN
CIA
L A
ND
OP
ER
ATI
NG
RE
VIE
W
Notes to the Consolidated Financial Statements and Significant Accounting Policies
2. sIGnIfIcanT accounTInG polIcIes (continued)
2.4 Insurance and investment contracts (continued)
2.4.1 Insurance contracts and investment contracts with dpf (continued)
Deferred sales inducements
Deferred sales inducements, consisting of day one bonuses, persistency bonuses and enhanced crediting rates are deferred and
amortised using the same methodology and assumptions used to amortise acquisition costs when:
• thesalesinducementsarerecognisedaspartofinsurancecontractliabilities;
• theyareexplicitlyidentifiedinthecontractoninception;
• theyareincrementaltoamountscreditedonsimilarcontractswithoutsalesinducements;and
• theyarehigherthantheexpectedongoingcreditingratesforperiodsaftertheinducement.
Unbundling
The deposit component of an insurance contract is unbundled when both of the following conditions are met:
• thedepositcomponent(includinganyembeddedsurrenderoption)canbemeasuredseparately(i.e.withouttakinginto
account the insurance component); and
• theGroup’saccountingpoliciesdonototherwiserequiretherecognitionofallobligationsandrightsarisingfromthedeposit
component.
Bifurcation
To the extent that certain of the Group’s insurance contracts include embedded derivatives that are not clearly and closely related
to the host contract, these are bifurcated from the insurance contracts and accounted for as derivatives.
Benefits and claims
Insurance contract benefits reflect the cost of all maturities, surrenders, withdrawals and claims arising during the year, as well as
policyholder dividends accrued in anticipation of dividend declarations.
Accident and health claims incurred include all losses occurring during the year, whether reported or not, related handling costs, a
reduction for recoveries, and any adjustments to claims outstanding from previous years.
Claims handling costs include internal and external costs incurred in connection with the negotiation and settlement of claims, and
are included in operating expenses.
Insurance contract liabilities (including liabilities in respect of investment contracts with DPF)
Insurance contract liabilities represent the estimated future policyholder benefit liability for life insurance policies.
Future policy benefits for life insurance policies are calculated using a net level premium valuation method which represents the
present value of estimated future policy benefits to be paid, less the present value of estimated future net premiums to be collected
from policyholders.
For contracts with an explicit account balance, such as universal life and unit-linked contracts, insurance contract liabilities
are equal to the accumulation value, which represents premiums received and investment returns credited to the policy less
deductions for mortality and morbidity costs and expense charges.

AIA Group Limited Annual Report 2012
120
Notes to the Consolidated Financial Statements and Significant Accounting Policies
FINANCIAL STATEMENTS
2. sIGnIfIcanT accounTInG polIcIes (continued)
2.4 Insurance and investment contracts (continued)
2.4.1 Insurance contracts and investment contracts with dpf (continued)
Insurance contract liabilities (including liabilities in respect of investment contracts with DPF) (continued)
Settlement options are accounted for as an integral component of the underlying insurance or investment contract unless they provide annuitisation benefits, in which case an additional liability is established to the extent that the present value of expected annuitisation payments at the expected annuitisation date exceeds the expected account balance at that date. Where settlement options have been issued with guaranteed rates less than market interest rates, the insurance or investment contract liability does not reflect any provision for subsequent declines in market interest rates unless a deficiency is identified through liability adequacy testing.
The Group accounts for participating policies within participating funds by establishing a liability for the present value of guaranteed benefits less estimated future net premiums to be collected from policyholders. In addition, an insurance liability is recorded for the proportion of the net assets of the participating fund that would be allocated to policyholders assuming all performance were to be declared as a dividend based upon local regulations. The Group accounts for other participating business by establishing a liability for the present value of guaranteed benefits and non-guaranteed participation, less estimated future net premiums to be collected from policyholders.
Liability adequacy testingThe adequacy of liabilities is assessed by portfolio of contracts, in accordance with the Group’s manner of acquiring, servicing and measuring the profitability of its insurance contracts. Liability adequacy testing is performed for each geographical market.
For traditional life insurance contracts, insurance contract liabilities reduced by deferred acquisition costs and value of business acquired on acquired insurance contracts, are compared to the gross premium valuation calculated on a best estimate basis, as of the valuation date. If there is a deficiency, the unamortised balance of deferred acquisition cost and value of business acquired on acquired insurance contracts are written down to the extent of the deficiency. If, after writing down the unamortised balance for the specific portfolio of contracts to nil, a deficiency still exists, the net liability is increased by the amount of the remaining deficiency.
For universal life and investment contracts, deferred acquisition costs, net of unearned revenue liabilities, are compared to estimated gross profits. If a deficiency exists, deferred acquisition costs are written down.
Financial guaranteesFinancial guarantees are regarded as insurance contracts. Liabilities in respect of such contracts are recognised as incurred.
2.4.2 Investment contractsInvestment contracts do not contain sufficient insurance risk to be considered insurance contracts and are accounted for as a financial liability, other than investment contracts with DPF which are excluded from the scope of IAS 39 and are accounted for as insurance contracts.
Revenue from these contracts consists of various charges (policy fees, handling fees, management fees and surrender charges) made against the contract for the cost of insurance, expenses and early surrender. First year charges are amortised over the life of the contract as the services are provided.
Investment contract fee revenueCustomers are charged fees for policy administration, investment management, surrenders or other contract services. The fees may be fixed amounts or vary with the amounts being managed, and will generally be charged as an adjustment to the policyholder’s account balance. The fees are recognised as revenue in the period in which they are received unless they relate to services to be provided in future periods, in which case they are deferred and recognised as the service is provided.
Origination and other “upfront” fees (fees that are assessed against the account balance as consideration for origination of the contract) are charged on some non-participating investment and pension contracts. Where the investment contract is recorded at amortised cost, these fees are amortised and recognised over the expected term of the policy as an adjustment to the effective yield. Where the investment contract is measured at fair value, the front-end fees that relate to the provision of investment management services are amortised and recognised as the services are provided.

AD
DIT
ION
AL
INF
OR
MA
TIO
NF
INA
NC
IAL
ST
AT
EM
EN
TS
121
CO
RP
OR
AT
E G
OV
ER
NA
NC
EO
VE
RV
IEW
FIN
AN
CIA
L A
ND
OP
ER
ATI
NG
RE
VIE
W
Notes to the Consolidated Financial Statements and Significant Accounting Policies
2. sIGnIfIcanT accounTInG polIcIes (continued)
2.4 Insurance and investment contracts (continued)
2.4.2 Investment contracts (continued)
Deferred origination costs
The costs of acquiring investment contracts with investment management services, including commissions and other incremental
expenses directly related to the issue of each new contract, are deferred and amortised over the period that services are provided.
Deferred origination costs are tested for recoverability at each reporting date.
The costs of acquiring new investment contracts without investment management services are included as part of the effective
interest rate used to calculate the amortised cost of the related investment contract liabilities.
Investment contract liabilities
Deposits received in respect of investment contracts are not accounted for through the consolidated income statement, except for
the investment income and fees attributable to those contracts, but are accounted for directly through the consolidated statement
of financial position as an adjustment to the investment contract liability, which reflects the account balance.
The majority of the Group’s contracts classified as investment contracts are unit-linked contracts. These represent investment
portfolios maintained to meet specific investment objectives of policyholders who generally bear the credit and market risks on
those investments. The liabilities are carried at fair value determined with reference to the accumulation value (current unit value)
with changes recognised in income. The costs of policy administration, investment management, surrender charges and certain
policyholder taxes assessed against customers’ account balances are included in revenue, and accounted for as described under
“Investment contract fee revenue” above.
Non unit-linked investment contract liabilities are carried at amortised cost, being the fair value of consideration received at the
date of initial recognition, less the net effect of principal payments such as transaction costs and front-end fees, plus or minus the
cumulative amortisation using the effective interest method of any difference between that initial amount and the maturity value,
and less any write-down for surrender payments. The effective interest rate equates the discounted cash payments to the initial
amount. At each reporting date, the unearned revenue liability is determined as the value of the future best estimate cash flows
discounted at the effective interest rate. Any adjustment is immediately recognised as income or expense in the consolidated
income statement.
The amortised cost of the financial liability is never recorded at less than the amount payable on surrender, discounted for the time
value of money where applicable, if the investment contract is subject to a surrender option.
2.4.3 Insurance and investment contracts
Reinsurance
The Group cedes reinsurance in the normal course of business, with retentions varying by line of business. The cost of reinsurance
is accounted for over the life of the underlying reinsured policies, using assumptions consistent with those used to account for
such policies.
Premiums ceded and claims reimbursed are presented on a gross basis in the consolidated income statement and statement of
financial position.
Reinsurance assets consist of amounts receivable in respect of ceded insurance liabilities. Amounts recoverable from reinsurers are
estimated in a manner consistent with the reinsured insurance or investment contract liabilities or benefits paid and in accordance
with the relevant reinsurance contract.
To the extent that reinsurance contracts principally transfer financial risk (as opposed to insurance risk) they are accounted for
directly through the consolidated statement of financial position and are not included in reinsurance assets or liabilities. A deposit
asset or liability is recognised, based on the consideration paid or received less any explicitly identified premiums or fees to be
retained by the reinsured.

AIA Group Limited Annual Report 2012
122
Notes to the Consolidated Financial Statements and Significant Accounting Policies
FINANCIAL STATEMENTS
2. sIGnIfIcanT accounTInG polIcIes (continued)
2.4 Insurance and investment contracts (continued)
2.4.3 Insurance and investment contracts (continued)
Reinsurance (continued)
If a reinsurance asset is impaired, the Group reduces the carrying amount accordingly and recognises that impairment loss in the
consolidated income statement. A reinsurance asset is impaired if there is objective evidence, as a result of an event that occurred
after initial recognition of the reinsurance asset, that the Group may not receive all amounts due to it under the terms of the
contract, and the impact on the amounts that the Group will receive from the reinsurer can be reliably measured.
Value of business acquired (VOBA)
TheVOBAinrespectofaportfoliooflong-terminsuranceandinvestmentcontracts,eitherdirectlyorthroughthepurchaseof
a subsidiary, is recognised as an asset. If this results from the acquisition of an investment in a joint venture or an associate,
theVOBAisheldwithinthecarryingamountofthatinvestment.Inallcases,theVOBAisamortisedovertheestimatedlife
of the contracts in the acquired portfolio on a systematic basis. The rate of amortisation reflects the profile of the value of
in-forcebusinessacquired.ThecarryingvalueofVOBAisreviewedannuallyforimpairmentandanyreductionischargedtothe
consolidated income statement.
Shadow accounting
Shadow accounting is applied to insurance and certain investment contracts with discretionary participation feature where financial
assets backing insurance and investment contract liabilities are classified as available for sale. Shadow accounting is applied to
deferredacquisitioncosts,VOBA,deferredoriginationcostsandthecontractliabilitiesforinvestmentcontractswithDPFtotake
into account the effect of unrealised gains or losses on insurance liabilities or assets that are recognised in equity in the same
way as for a realised gain or loss recognised in the consolidated income statement. Such assets or liabilities are adjusted with
corresponding charges or credits recognised directly in shareholders’ equity as a component of the related unrealised gains and
losses.
Other assessments and levies
The Group is potentially subject to various periodic insurance-related assessments or guarantee fund levies. Related provisions are
established where there is a present obligation (legal or constructive) as a result of a past event. Such amounts are not included in
insurance or investment contract liabilities but are included under “Provisions” in the consolidated statement of financial position.
2.5 financial instruments
2.5.1 classification of and designation of financial instruments
Financial instruments at fair value through profit or loss
Financial instruments at fair value through profit or loss comprise two categories:
• financialassetsdesignatedatfairvaluethroughprofitorloss;and
• financialinstrumentsclassifiedasheldfortrading.
Management designates financial assets at fair value through profit or loss if this eliminates a measurement inconsistency or if the
related assets and liabilities are actively managed on a fair value basis, including:
• financialassetsheldtobackunit-linkedcontractsandparticipatingfunds;
• otherfinancialassetsmanagedonafairvaluebasis;consistingoftheGroup’sequityportfolioandinvestmentsheldbythe
Group’s fully consolidated investment funds; and
• compoundinstrumentscontaininganembeddedderivative,wheretheembeddedderivativewouldotherwiserequire
bifurcation.

AD
DIT
ION
AL
INF
OR
MA
TIO
NF
INA
NC
IAL
ST
AT
EM
EN
TS
123
CO
RP
OR
AT
E G
OV
ER
NA
NC
EO
VE
RV
IEW
FIN
AN
CIA
L A
ND
OP
ER
ATI
NG
RE
VIE
W
Notes to the Consolidated Financial Statements and Significant Accounting Policies
2. sIGnIfIcanT accounTInG polIcIes (continued)
2.5 financial instruments (continued)
2.5.1 classification of and designation of financial instruments (continued)
Financial instruments at fair value through profit or loss (continued)
Financial instruments classified as held for trading include financial assets acquired principally for the purpose of selling them in the
near future and those that form part of a portfolio of financial assets in which there is evidence of short-term profit taking, as well
as derivative assets and liabilities.
Dividend income from equity instruments designated at fair value through profit or loss is recognised in investment income in the
consolidated income statement, generally when the security becomes ex-dividend. Interest income is recognised on an accrued
basis. For all financial assets designated at fair value through profit or loss, changes in fair value are recognised in investment
experience.
Transaction costs in respect of financial instruments at fair value through profit or loss are expensed as they are incurred.
Available for sale financial assetsFinancial assets, other than those at fair value through profit or loss, and loans and receivables, are classified as available for sale.
The available for sale category is used where the relevant investments backing insurance and investment contract liabilities
and shareholders’ equity are not managed on a fair value basis. These principally consist of the Group’s debt securities (other
than those backing participating funds and unit-linked contracts). Available for sale financial assets are initially recognised at fair
value plus attributable transaction costs. For available for sale debt securities, the difference between their cost and par value is
amortised. Available for sale financial assets are subsequently measured at fair value. Interest income from debt securities classified
as available for sale is recognised in investment income in the consolidated income statement using the effective interest method.
Unrealised gains and losses on securities classified as available for sale are analysed between differences resulting from
foreign currency translation, and other fair value changes. Foreign currency translation differences on monetary available for
sale investments, such as debt securities are calculated as if they were carried at amortised cost and so are recognised in the
consolidated income statement as investment experience. For impairments of available for sale financial assets, reference is made
to the section “Impairment of financial assets”.
Changes in the fair value of securities classified as available for sale, except for impairment losses and relevant foreign exchange
gains and losses, are recognised in other comprehensive income and accumulated in a separate fair value reserve within equity.
Impairment losses and relevant foreign exchange gains and losses are recognised in the income statement.
Realised gains and losses on financial assetsRealised gains and losses on available for sale financial assets are determined as the difference between the sale proceeds and
amortised cost. Cost is determined by specific identification.
Recognition of financial instrumentsPurchases and sales of financial instruments are recognised on the trade date, which is the date at which the Group commits to
purchase or sell the assets.
Derecognition and offset of financial assetsFinancial assets are derecognised when the rights to receive cash flows from the financial assets have expired or where the Group
has transferred substantially all risks and rewards of ownership. If the Group neither transfers nor retains substantially all the
risks and rewards of ownership of a financial asset, it derecognises the financial asset if it no longer has control over the asset.
In transfers where control over the asset is retained, the Group continues to recognise the asset to the extent of its continuing
involvement. The extent of continuing involvement is determined by the extent to which the Group is exposed to changes in the fair
value of the asset.
Financial assets and liabilities are offset and the net amount reported in the consolidated statement of financial position only when
there is a legally enforceable right to offset the recognised amounts and there is an intention to settle on a net basis, or realise the
asset and settle the liability simultaneously.

AIA Group Limited Annual Report 2012
124
Notes to the Consolidated Financial Statements and Significant Accounting Policies
FINANCIAL STATEMENTS
2. sIGnIfIcanT accounTInG polIcIes (continued)
2.5 financial instruments (continued)
2.5.1 classification of and designation of financial instruments (continued)
Loans and receivables
Loans and receivables are non-derivative financial assets with fixed or determinable payments that are not quoted in an active
market. They are initially recognised at fair value plus transaction costs. Subsequently, they are carried at amortised cost using
the effective interest method less any impairment losses. Interest income from loans and receivables is recognised in investment
income in the consolidated income statement using the effective interest method.
Term deposits
Deposits include time deposits with financial institutions which do not meet the definition of cash and cash equivalents as their
maturity at acquisition exceeds three months. Certain of these balances are subject to regulatory or other restriction as disclosed
in note 20 Loans and Deposits. Deposits are stated at face value.
Cash and cash equivalents
Cash and cash equivalents include cash in hand, deposits held at call with banks and other short-term highly liquid investments
with maturities at acquisition of three months or less, which are held for cash management purposes. Cash and cash equivalents
also include cash received as collateral for securities lending as well as cash and cash equivalents held for the benefit of
policyholders in connection with unit-linked products. Cash and cash equivalents are stated at face value.
2.5.2 fair values of non-derivative financial assets
The fair value of a financial instrument is the amount that would be received to sell an asset or paid to transfer a liability in an
orderly transaction between market participants at the measurement date, having regard to the specific characteristics of the asset
or liability concerned, assuming that the transfer takes place in the most advantageous market to which the Group has access.
The fair values of financial instruments traded in active markets (such as financial instruments at fair value through profit or loss
and available for sale securities) are based on quoted market prices at the date of the consolidated statement of financial position.
The quoted market price used for financial assets held by the Group is the current bid price. The fair values of financial instruments
that are not traded in active markets are determined using valuation techniques. The Group uses a variety of methods and makes
assumptions that are based on market conditions at the date of each consolidated statement of financial position. The objective of
using a valuation technique is to estimate the price at which an orderly transaction would take place between market participants
at the date of the consolidated statement of financial position.
Financial instruments carried at fair value are measured using a fair value hierarchy described in note 22.
2.5.3 Impairment of financial assets
General
Financial assets are assessed for impairment on a regular basis. The Group assesses at each reporting date whether there is
objective evidence that a financial asset or group of financial assets is impaired. A financial asset, or group of financial assets, is
impaired and impairment losses are incurred only if there is objective evidence of impairment as a result of one or more events that
have occurred after the initial recognition of the asset (a loss event) and that loss event (or events) has an impact on the estimated
future cash flows of the financial asset or group of financial assets that can be reliably estimated.
For loans and receivables, the Group first assesses whether objective evidence of impairment exists for financial assets that are
individually significant. If the Group determines that no objective evidence of impairment exists for an individually assessed financial
asset, whether significant or not, it includes the asset in a group of financial assets with similar credit risk characteristics and
collectively assesses them for impairment. Assets that are individually assessed for impairment and for which an impairment loss is
or continues to be recognised are not included in a collective assessment of impairment.

AD
DIT
ION
AL
INF
OR
MA
TIO
NF
INA
NC
IAL
ST
AT
EM
EN
TS
125
CO
RP
OR
AT
E G
OV
ER
NA
NC
EO
VE
RV
IEW
FIN
AN
CIA
L A
ND
OP
ER
ATI
NG
RE
VIE
W
Notes to the Consolidated Financial Statements and Significant Accounting Policies
2. sIGnIfIcanT accounTInG polIcIes (continued)
2.5 financial instruments (continued)
2.5.3 Impairment of financial assets (continued)
Available for sale financial instruments
When a decline in the fair value of an available for sale asset has been recognised in other comprehensive income and there is
objective evidence that the asset is impaired, the cumulative loss already recognised directly in other comprehensive income is
recognised in current period profit or loss.
If the fair value of a debt instrument classified as available for sale increases in a subsequent period, and the increase can be
objectively related to an event occurring after the impairment loss was recognised in income, the impairment loss is reversed
through profit or loss. Where, following the recognition of an impairment loss in respect of an available for sale debt security, the
asset suffers further falls in value, such further falls are recognised as an impairment only in the case when objective evidence
exists of a further impairment event to which the losses can be attributed.
Loans and receivables
For loans and receivables, impairment is considered to have taken place if it is probable that the Group will not be able to
collect principal and/or interest due according to the contractual terms of the instrument. When impairment is determined to
have occurred, the carrying amount is decreased through a charge to profit or loss. The carrying amount of mortgage loans or
receivables is reduced through the use of an allowance account, and the amount of any allowance is recognised as an impairment
loss in profit or loss.
2.5.4 derivative financial instruments
Derivative financial instruments primarily include foreign exchange contracts and interest rate swaps that derive their value mainly
from underlying foreign exchange rates and interest rates. All derivatives are initially recognised in the consolidated statement of
financial position at their fair value, which represents their cost excluding transaction costs, which are expensed, giving rise to a
day one loss. They are subsequently remeasured at their fair value, with movements in this value recognised in profit or loss. Fair
values are obtained from quoted market prices or, if these are not available, by using valuation techniques such as discounted
cash flow models or option pricing models. All derivatives are carried as assets when the fair values are positive and as liabilities
when the fair values are negative.
Derivative instruments for economic hedging
Whilst the Group enters into derivative transactions to provide economic hedges under the Group’s risk management framework,
it does not currently apply hedge accounting to these transactions. This is either because the transactions would not meet the
specific IFRS rules to be eligible for hedge accounting or the documentation requirements to meet hedge accounting criteria
would be unduly onerous. These transactions are therefore treated as held for trading and fair value movements are recognised
immediately in investment experience.
Embedded derivatives
Embedded derivatives are derivatives embedded within other non-derivative host financial instruments to create hybrid
instruments. Where the economic characteristics and risks of the embedded derivatives are not closely related to the economic
characteristics and risks of the host instrument, and where the hybrid instrument is not measured at fair value with changes in fair
value recognised in profit or loss, the embedded derivative is bifurcated and carried at fair value as a derivative in accordance with
IAS 39.
2.6 segment reporting
An operating segment is a component of the Group that engages in business activity from which it earns revenues and incurs
expenses and, for which, discrete financial information is available, and whose operating results are regularly reviewed by the
Group’s chief operating decision-maker, considered to be the Executive Committee of the Group (Exco).

AIA Group Limited Annual Report 2012
126
Notes to the Consolidated Financial Statements and Significant Accounting Policies
FINANCIAL STATEMENTS
2. sIGnIfIcanT accounTInG polIcIes (continued)
2.7 foreign currency translationIncome statements and cash flows of foreign entities are translated into the Group’s presentation currency at average exchange rates for the year as this approximates to the exchange rates prevailing at the transaction date. Their statements of financial position are translated at year or period end exchange rates. Exchange differences arising from the translation of the net investment in foreign operations, are taken to the currency translation reserve within equity. On disposal of a foreign operation, such exchange differences are transferred out of this reserve and are recognised in the consolidated income statement as part of the gain or loss on sale.
Foreign currency transactions are accounted for at the exchange rates prevailing at the date of the transactions. Gains and losses resulting from the settlement of such transactions, and from the translation of monetary assets and liabilities denominated in foreign currencies into functional currency, are recognised in the consolidated income statement.
Translation differences on financial assets designated at fair value through profit or loss are included in investment experience. For monetary financial assets classified as available for sale, translation differences are calculated as if they were carried at amortised cost and so are recognised in the consolidated income statement. Foreign exchange movements on non-monetary equities that are accounted for as available for sale are included in the fair value reserve.
2.8 property, plant and equipmentProperty, plant and equipment is stated at historical cost less accumulated depreciation and any accumulated impairment losses. Historical cost includes expenditure that is directly attributable to the acquisition of the items. Depreciation is calculated using the straight-line method to allocate cost less any residual value over the estimated useful life, generally:
Furniture, fixtures and office equipment 5 yearsBuildings 20-40 yearsOther assets 3-5 yearsFreehold land No depreciation
Subsequent costs are included in the carrying amount or recognised as a separate asset, as appropriate, when it is probable that future economic benefits will flow to the Group. Repairs and maintenance are charged to the consolidated income statement during the financial period in which they are incurred.
Residual values and useful lives are reviewed and adjusted, if applicable, at each reporting date. An asset is written down to its recoverable amount if the carrying value is greater than the estimated recoverable amount.
Any gain and loss arising on disposal of property, plant and equipment is measured as the difference between the net sale proceeds and the carrying amount of the relevant asset, and is recognised in the consolidated income statement.
Where the cost of the Group’s leasehold land is known, or can be reliably determined at the inception of the lease, the Group records its interest in leasehold land and land use rights separately as operating leases or finance leases depending on whether substantially all the risks and rewards incidental to ownership of the land are transferred to the Group. These leases are recorded at original cost and amortised over the term of the lease (see note 2.18).
2.9 Investment propertyProperty held for long-term rental that is not occupied by the Group is classified as investment property, and is carried at cost less accumulated depreciation and any accumulated impairment losses.
Investment property comprises freehold or leasehold land and buildings. Buildings located on leasehold land are classified as investment property if held for long-term rental and not occupied by the Group. Where the cost of the land is known, or can be reliably determined at the inception of the lease, the Group records its interest in leasehold land and land use rights separately as operating leases or finance leases depending on whether substantially all the risks and rewards incidental to ownership of the land are transferred to the Group (see note 2.18). These leases are recorded at original cost and amortised over the term of the lease. Buildings that are held as investment properties are amortised on a straight-line basis over their estimated useful lives of 20 to 40 years.

AD
DIT
ION
AL
INF
OR
MA
TIO
NF
INA
NC
IAL
ST
AT
EM
EN
TS
127
CO
RP
OR
AT
E G
OV
ER
NA
NC
EO
VE
RV
IEW
FIN
AN
CIA
L A
ND
OP
ER
ATI
NG
RE
VIE
W
Notes to the Consolidated Financial Statements and Significant Accounting Policies
2. sIGnIfIcanT accounTInG polIcIes (continued)
2.9 Investment property (continued)
If an investment property becomes held for use, it is reclassified as property, plant and equipment. Where a property is partly used
as an investment property and partly for the use of the Group, these elements are recorded separately within property, plant and
equipment and investment property respectively, where the component used as investment property would be capable of separate
sale or finance lease.
The fair value of investment properties and property held for use is disclosed under note 17. It is the Group’s policy to perform
external property valuation annually except in the case a discrete event occurs in the interim that has a significant impact on the
fair value of the properties.
2.10 Goodwill and other intangible assets
Goodwill
Goodwill represents the excess of the cost of an acquisition over the fair value of the Group’s share of the net identifiable assets
of the acquired subsidiary, associate or joint venture at the date of acquisition. Goodwill on acquisitions prior to 1 December 2006
(the date of transition to IFRS) is carried at book value (original cost less cumulative amortisation) on that date, less any impairment
subsequently incurred. Goodwill arising on the Group’s investment in subsidiaries since that date is shown as a separate asset
and is carried at cost less any accumulated impairment losses, whilst that on associates and joint ventures is included within
the carrying value of those investments. With effect from the date of adoption of IFRS 3 (Revised) from 1 December 2009, all
acquisition-related costs are expensed as incurred.
other intangible assets
Other intangible assets consist primarily of acquired computer software and contractual relationships, such as access to
distribution networks, and are amortised over their estimated useful lives.
Acquired computer software licences are capitalised on the basis of the costs incurred to acquire and bring to use the specific
software. Costs directly associated with the internal production of identifiable and unique software by the Group that will generate
economic benefits exceeding those costs over a period greater than a year, are recognised as intangible assets. All other costs
associated with developing or maintaining computer software programmes are recognised as an expense as incurred. Costs
of acquiring computer software licences and incurred in the internal production of computer software are amortised using the
straight-line method over the estimated useful life of the software, which does not generally exceed a period of 3 to 15 years.
The amortisation charge for the year is included in the consolidated income statement under “Operating expenses”.
2.11 Impairment of non-financial assets
Property, plant and equipment, goodwill and other non-financial assets are reviewed for impairment whenever events or changes
in circumstances indicate that the carrying amount may not be recoverable. An impairment loss is recognised to the extent that
the carrying amount of the asset exceeds its recoverable amount, which is the higher of the asset’s net selling price and value in
use. For the purposes of assessing impairment, assets are grouped into cash-generating units at the level of the Group’s operating
segments, the lowest level for which separately identifiable cash flows are reported. The carrying values of goodwill and intangible
assets with indefinite useful lives are reviewed at least annually or when circumstances or events indicate that there may be
uncertainty over this value.
The Group assesses at the end of each reporting period whether there is any objective evidence that its investments in associates
are impaired. Such objective evidence includes whether there has been any significant adverse changes in the technological,
market, economic or legal environment in which the associates operate or whether there has been a significant or prolonged
decline in value below their cost. If there is an indication that an interest in an associate is impaired, the Group assesses whether
the entire carrying amount of the investment (including goodwill) is recoverable. An impairment loss is recognised in profit or loss
for the amount by which the carrying amount is lower than the higher of the investment’s fair value less costs to sell or value in use.
Any reversal of such impairment loss in subsequent periods is reversed through profit or loss.

AIA Group Limited Annual Report 2012
128
Notes to the Consolidated Financial Statements and Significant Accounting Policies
FINANCIAL STATEMENTS
2. sIGnIfIcanT accounTInG polIcIes (continued)
2.11 Impairment of non-financial assets (continued)
Impairment testing of the investments in subsidiaries and associates is required upon receiving dividends from these investments if
the dividend exceeds the total comprehensive income of the subsidiaries or associates in the period the dividend is declared or if
the carrying amount of the relevant investment in the Company’s statement of financial position exceeds its carrying amount in the
consolidated financial statements of the investees’ net assets including goodwill.
2.12 securities lending including repurchase agreements
The Group has been a party to various securities lending agreements under which securities are loaned to third parties on a
short-term basis. The loaned securities are not derecognised and so they continue to be recognised within the appropriate
investment classification.
assets sold under repurchase agreements (repos)
Assets sold under repurchase agreements continue to be recognised and a liability is established for the consideration received.
The Group may be required to provide additional collateral based on the fair value of the underlying assets, and such collateral
assets remain on the consolidated statement of financial position.
assets purchased under agreements to resell (reverse repos)
The Group enters into purchases of assets under agreements to resell (reverse repos). Reverse repos are initially recorded at the
cost of the loan or collateral advanced within the caption “Other assets” in the consolidated statement of financial position. In the
event of failure by the counterparty to repay the loan, the Group has the right to the underlying assets.
collateral
The Group receives and pledges collateral in the form of cash or non-cash assets in respect of securities lending transactions,
and repo and reverse repo transactions, in order to reduce the credit risk of these transactions. The amount and type of collateral
depends on an assessment of the credit risk of the counterparty. Collateral received in the form of cash, which is not legally
segregated from the Group, is recognised as an asset in the consolidated statement of financial position with a corresponding
liability for the repayment. Non-cash collateral received is not recognised on the consolidated statement of financial position unless
the Group either sells or repledges these assets in the absence of default, at which point the obligation to return this collateral is
recognised as a liability. To further minimise credit risk, the financial condition of counterparties is monitored on a regular basis.
Collateral pledged in the form of cash which is legally segregated from the Group is derecognised from the consolidated statement
of financial position and a corresponding receivable established for its return. Non-cash collateral pledged is not derecognised
(except in the event of default) and therefore continues to be recognised in the consolidated statement of financial position within
the appropriate financial instrument classification.
2.13 borrowings
Borrowings are recognised initially at their issue proceeds less transaction costs incurred. Subsequently, borrowings are stated
at amortised cost, and any difference between net proceeds and redemption value is recognised in the consolidated income
statement over the period of the borrowings using the effective interest method. All borrowing costs are expensed as they are
incurred, except for borrowing costs directly attributable to the development of investment properties and other qualifying assets,
which are capitalised as part of the cost of the asset.
2.14 Income taxes
The current tax expense is based on the taxable profits for the year, including any adjustments in respect of prior years. Tax is
allocated to profit or loss before taxation and amounts charged or credited to equity as appropriate.
Deferred tax is recognised in respect of temporary differences between the tax bases of assets and liabilities and their carrying
amounts in the consolidated financial statements, except as described below.

AD
DIT
ION
AL
INF
OR
MA
TIO
NF
INA
NC
IAL
ST
AT
EM
EN
TS
129
CO
RP
OR
AT
E G
OV
ER
NA
NC
EO
VE
RV
IEW
FIN
AN
CIA
L A
ND
OP
ER
ATI
NG
RE
VIE
W
Notes to the Consolidated Financial Statements and Significant Accounting Policies
2. sIGnIfIcanT accounTInG polIcIes (continued)
2.14 Income taxes (continued)
The principal temporary differences arise from the basis of recognition of insurance and investment contract liabilities, revaluation
of certain financial assets and liabilities including derivative contracts, deferred acquisition costs and the future taxes arising on the
surplus in life funds where the relevant local tax regime is distributions-based. The rates enacted or substantively enacted at the
date of the consolidated statement of financial position are used to determine deferred tax.
Deferred tax assets are recognised to the extent that it is probable that future taxable profit will be available against which the
temporary differences can be utilised. In countries where there is a history of tax losses, deferred tax assets are only recognised in
excess of deferred tax liabilities if there is evidence that future profits will be available.
Deferred taxes are not provided in respect of temporary differences arising from the initial recognition of goodwill or from goodwill
for which amortisation is not deductible for tax purposes, or from the initial recognition of an asset or liability in a transaction which
is not a business combination and which affects neither accounting nor taxable profit or loss at the time of the transaction.
Deferred tax related to fair value remeasurement of available for sale investments and other amounts taken directly to equity, is
recognised initially within the applicable component of equity. It is subsequently recognised in the consolidated income statement,
together with the gain or loss arising on the underlying item.
In addition to paying tax on shareholders’ profits, certain of the Group’s life insurance businesses pay tax on policyholders’
investment returns (policyholder tax) at policyholder tax rates. Policyholder tax is accounted for as an income tax and is included in
the total tax expense and disclosed separately.
2.15 revenue
Investment returnInvestment income consists of dividends, interest and rents receivable for the reporting period. Investment experience comprises
realised gains and losses, impairments and unrealised gains and losses on investments held at fair value through profit or loss.
Interest income is recognised as it accrues, taking into account the effective yield on the investment. Rental income on investment
property is recognised on an accrual basis. Investment return consists of investment income and investment experience.
The realised gain or loss on disposal of an investment is the difference between the proceeds received, net of transaction costs,
and its original cost or amortised cost as appropriate. Unrealised gains and losses represent the difference between the carrying
value at the year end and the carrying value at the previous year end or purchase price if purchased during the year, less the
reversal of previously recognised unrealised gains and losses in respect of disposals made during the year.
other fee and commission incomeOther fee and commission income consists primarily of fund management fees, income from any incidental non-insurance
activities, distribution fees from mutual funds, commissions on reinsurance ceded and commission revenue from the sale of mutual
fund shares. Reinsurance commissions receivable are deferred in the same way as acquisition costs. All other fee and commission
income is recognised as the services are provided.
2.16 employee benefits
annual leave and long service leaveEmployee entitlements to annual leave and long service leave are recognised when they accrue to employees. A provision is made
for the estimated liability for annual leave and long service leave as a result of services rendered by employees up to the reporting
date.
post-retirement benefit obligationsThe Group operates a number of funded and unfunded post-retirement employee benefit schemes, whose members receive
benefits on either a defined benefit basis (generally related to salary and length of service) or a defined contribution basis (generally
related to the amount invested, investment return and annuity rates), the assets of which are generally held in separate trustee
administered funds. The defined benefit plans provide life and medical benefits for employees after retirement and a lump sum
benefit on cessation of employment, and the defined contribution plans provide post-retirement pension benefits.

AIA Group Limited Annual Report 2012
130
Notes to the Consolidated Financial Statements and Significant Accounting Policies
FINANCIAL STATEMENTS
2. sIGnIfIcanT accounTInG polIcIes (continued)
2.16 employee benefits (continued)
post-retirement benefit obligations (continued)
For defined benefit plans, the costs are assessed using the projected unit credit method. Under this method, the cost of providing
benefits is charged to the consolidated income statement so as to spread the regular cost over the service lives of employees, in
accordance with the advice of qualified actuaries. The obligation is measured as the present value of the estimated future cash
outflows, using a discount rate based on market yields for high-quality corporate bonds that are denominated in the currency
in which the benefits will be paid and that have terms to maturity approximating to the terms of the related liability. The resulting
scheme surplus or deficit appears as an asset or liability in the consolidated statement of financial position.
For each plan, the Group recognises a portion of its actuarial gains and losses in income or expense if the unrecognised actuarial
net gain or loss at the end of the previous reporting period exceeds the greater of:
• 10percentoftheprojectedbenefitobligationsatthatdate;or
• 10percentofthefairvalueofanyplanassetsatthatdate.
Any recognised actuarial net gain or loss exceeding the greater of these two values is generally recognised in the consolidated
income statement over the expected average remaining service periods of the employees participating in the plans.
For defined contribution plans, the Group pays contributions to publicly or privately administered pension plans. Once the
contributions have been paid, the Group, as employer, has no further payment obligations. The Group’s contributions are charged
to the consolidated income statement in the reporting period to which they relate and are included in staff costs.
share-based compensation and cash incentive plans
Following the public listing of the Group on the Stock Exchange of Hong Kong and the divestiture by AIG of more than 50 per cent
of the Group on 29 October 2010, the Group launched a number of share-based compensation plans, under which the Group
receives services from the agents, employees, directors and officers as consideration for the shares and/or share options of the
Company. These share-based compensation plans comprise the Share Option Scheme (SO Scheme), the Restricted Share Unit
Scheme (RSU Scheme), the Employee Share Purchase Plan (ESPP) and the Agency Share Purchase Plan (ASPP).
The Group’s share-based compensation plans are predominantly equity-settled plans. Under equity-settled share-based
compensation plan, the fair value of the employee services received in exchange for the grant of shares and/or share options is
recognised as an expense in profit or loss over the vesting period with a corresponding amount recorded in equity.
The total amount to be expensed over the vesting period is determined by reference to the fair value of the share and/or share
options awarded. Non-market vesting conditions are included in assumptions about the number of shares and/or share options
that are expected to be vested. At each period end, the Group revises its estimates of the number of shares and/or share options
that are expected to be vested. Any impact of the revision to original estimates is recognised in profit or loss with a corresponding
adjustment to equity. Where awards of share-based payment arrangements have graded vesting terms, each tranche is recognised
as a separate award, and therefore the fair value of each tranche is recognised over the applicable vesting period.
The Group estimates the fair value of share options using a binomial lattice model. This model requires inputs such as share price,
implied volatility, risk-free interest rate, expected dividend rate and the expected life of the share option.
Where modification or cancellation of an equity-settled share-based compensation plan occurs, the grant date fair value continues
to be recognised, together with any incremental value arising on the date of modification if non-market conditions are met.
For cash-settled share-based compensation plans, the fair value of the employee services in exchange for the grant of cash-settled
award is recognised as an expense in profit or loss, with a corresponding amount recognised in liability. At the end of each
reporting period, any unsettled award is remeasured based on the change in fair value of the underlying asset and the liability and
expense are adjusted accordingly.

AD
DIT
ION
AL
INF
OR
MA
TIO
NF
INA
NC
IAL
ST
AT
EM
EN
TS
131
CO
RP
OR
AT
E G
OV
ER
NA
NC
EO
VE
RV
IEW
FIN
AN
CIA
L A
ND
OP
ER
ATI
NG
RE
VIE
W
Notes to the Consolidated Financial Statements and Significant Accounting Policies
2. sIGnIfIcanT accounTInG polIcIes (continued)
2.17 provisions and contingencies
Provisions are recognised when the Group has a present legal or constructive obligation as a result of past events, it is probable
that an outflow of economic resources will be required to settle the obligation, and a reliable estimate of the amount of the
obligation can be made. Where the Group expects a provision to be reimbursed, for example under an insurance contract held,
the reimbursement is recognised as a separate asset only when the reimbursement is virtually certain.
The Group recognises a provision for onerous contracts when the expected benefits to be derived from a contract are less than
the unavoidable costs of meeting the obligations under the contract.
Contingencies are disclosed if material and if there is a possible future obligation as a result of a past event, or if there is a present
obligation as a result of a past event, but either a payment is not probable or the amount cannot be reliably estimated.
2.18 leases
Leases, where a significant portion of the risks and rewards of ownership is retained by the Group as a lessor, are classified as
operating leases. Assets subject to such leases are included in property, plant and equipment or investment property, and are
depreciated to their residual values over their estimated useful lives. Rentals from such leases are credited to the consolidated
income statement on a straight-line basis over the period of the relevant lease. Payments made by the Group as lessee under
operating leases (net of any incentives received from the lessor) are charged to the consolidated income statement on a
straight-line basis over the period of the relevant lease. The Group classifies amounts paid to acquire leasehold land either as an
operating lease prepayment or as a component of property, plant and equipment or investment property depending on whether
substantially all the risks and rewards incidental to the ownership of the land are transferred to the Group.
There are no freehold land interests in Hong Kong. The Group classifies the amounts paid to acquire leasehold land under
operating leases and finance leases as operating lease prepayments and property, plant and equipment or investment property
respectively. Operating lease prepayments are included within “Other assets”. Amortisation is calculated to write off the cost of the
land on a straight-line basis over the terms of the lease.
2.19 share capital
Issued capital represents the nominal value of shares issued plus any share premium received from the issue of share capital.
share issue costs
Incremental external costs directly attributable to the issue of new shares are shown in equity as a deduction, net of tax, from the
proceeds of the issue.
dividends
Interim dividends on ordinary shares are recognised when they have been paid. Final dividends on ordinary shares are recognised
when they have been approved by shareholders.
2.20 presentation of the consolidated statement of financial position
The Group’s insurance and investment contract liabilities and related assets are realised and settled over periods of several years,
reflecting the long-term nature of the Group’s products. Accordingly, the Group presents the assets and liabilities in its consolidated
statement of financial position in approximate order of liquidity, rather than distinguishing current and non-current assets and
liabilities. The Group regards its intangible assets, investments in associates and joint ventures, property, plant and equipment,
investment property and deferred acquisition and origination costs as non-current assets as these are held for the longer-term use
of the Group.

AIA Group Limited Annual Report 2012
132
Notes to the Consolidated Financial Statements and Significant Accounting Policies
FINANCIAL STATEMENTS
2. sIGnIfIcanT accounTInG polIcIes (continued)
2.21 earnings per share
Basic earnings per share is calculated by dividing net profit available to ordinary shareholders by the weighted average number of
ordinary shares in issue during the year.
Earnings per share has also been calculated on the operating profit before adjusting items, attributable to ordinary shareholders, as
the Directors believe this figure provides a better indication of operating performance.
For diluted earnings per share, the weighted average number of ordinary shares in issue is adjusted to assume conversion of all
dilutive potential ordinary shares, such as share options granted to employees.
Potential or contingent share issuances are treated as dilutive when their conversion to shares would decrease net earnings per
share.
2.22 fiduciary activities
Assets and income arising from fiduciary activities, together with related undertakings to return such assets to customers, are
excluded from these consolidated financial statements where the Group has no contractual rights to the assets and acts in a
fiduciary capacity such as nominee, trustee or agent.
2.23 consolidated statement of cash flow
The consolidated statement of cash flow presents movements in cash and cash equivalents as shown in the consolidated
statement of financial position.
Purchases and sales of financial investments are included in operating cash flows as the purchases are funded from cash flows
associated with the origination of insurance and investment contracts, net of payments of related benefits and claims. Purchases
and sales of investment property are included within cash flows from investing activities.
2.24 related party transactions
Transactions with related parties are recorded at amounts mutually agreed and transacted between the parties to the arrangement.
3. crITIcal accounTInG esTImaTes and judGemenTs
The Group makes estimates and assumptions that affect the reported amounts of assets, liabilities, and revenue and expenses. All
estimates are based on management’s knowledge of current facts and circumstances, assumptions based on that knowledge and
predictions of future events and actions. Actual results can always differ from those estimates, possibly significantly.
Items that are considered particularly sensitive to changes in estimates and assumptions, and the relevant accounting policies
are those which relate to product classification, insurance contract liabilities (including liabilities in respect of investment contracts
with DPF), deferred acquisition and origination costs, liability adequacy testing, fair value of financial assets, impairment of financial
assets and share-based compensation.
3.1 product classification
The Group issues contracts that transfer insurance risk or financial risk or both. Insurance contracts are those contracts that
transfer significant insurance risk, while investment contracts are those contracts without significant insurance risk. The Group
exercises significant judgement to determine whether there is a scenario (other than those lacking commercial substance) in which
an insured event would require the Group to pay significant additional benefits to its customers. In the event the Group has to pay
significant additional benefits to its customers, the contract is accounted for as an insurance contract. The judgments exercised
in determining the level of insurance risk in product classification affect the amounts recognised in the consolidated financial
statements as insurance and investment contract liabilities and deferred acquisition and origination costs. The accounting policy
on product classification is described in note 2.4.

AD
DIT
ION
AL
INF
OR
MA
TIO
NF
INA
NC
IAL
ST
AT
EM
EN
TS
133
CO
RP
OR
AT
E G
OV
ER
NA
NC
EO
VE
RV
IEW
FIN
AN
CIA
L A
ND
OP
ER
ATI
NG
RE
VIE
W
Notes to the Consolidated Financial Statements and Significant Accounting Policies
3. crITIcal accounTInG esTImaTes and judGemenTs (continued)
3.2 Insurance contract liabilities (including liabilities in respect of investment contracts with dpf)
The Group calculates the insurance contract liabilities for traditional life insurance using a net level premium valuation method,
whereby the liability represents the present value of estimated future policy benefits to be paid, less the present value of estimated
future net premiums to be collected from policyholders. This method uses best estimate assumptions at inception adjusted for
a provision for the risk of adverse deviation for mortality, morbidity, expected investment yields, policyholder dividends (for other
participating business), surrenders and expenses set at the policy inception date. These assumptions remain locked in thereafter,
unless a deficiency arises on liability adequacy testing. Interest rate assumptions can vary by geographical market, year of issuance
and product. Mortality, surrender and expense assumptions are based on actual experience by each geographical market,
modified to allow for variations in policy form. The Group exercises significant judgment in making appropriate assumptions.
For contracts with an explicit account balance, such as universal life and unit-linked contracts, insurance contract liabilities
represent the accumulation value, which represents premiums received and investment returns credited to the policy less
deductions for mortality and morbidity costs and expense charges. Significant judgment is exercised in making appropriate
estimates of gross profits which are based on historical and anticipated future experiences, these estimates are regularly reviewed
by the Group.
The Group accounts for insurance contract liabilities for participating business written in participating funds by establishing a liability
for the present value of guaranteed benefits less estimated future net premiums to be collected from policyholders. In addition, an
insurance liability is recorded for the proportion of the net assets of the participating fund that would be allocated to policyholders
assuming all relevant surplus at the date of the consolidated statement of financial position were to be declared as a policyholder
dividend based upon applicable regulations. Establishing these liabilities requires the exercise of significant judgment. In addition,
the assumption that all relevant performance is declared as a policyholder dividend may not be borne out in practice. The Group
accounts for other participating business by establishing a liability for the present value of guaranteed benefits and non-guaranteed
participation, less estimated future net premiums to be collected from policyholders.
The judgments exercised in the valuation of insurance contract liabilities (including contracts with DPF) affect the amounts
recognised in the consolidated financial statements as insurance contract benefits and insurance contract liabilities. Further details
of the related accounting policy, key risk and variables, and the sensitivities of assumptions to the key variables in respect of
insurance contract liabilities are provided in notes 2.4, 25 and 27.
3.3 deferred acquisition and origination costs
The judgments exercised in the deferral and amortisation of acquisition and origination costs affect amounts recognised in the
consolidated financial statements as deferred acquisition and origination costs and insurance and investment contract benefits.
As noted in note 2.4.1, deferred acquisition costs for traditional life insurance and annuity policies are amortised over the expected
life of the contracts as a constant percentage of expected premiums. Expected premiums are estimated at the date of policy
issue and are applied consistently throughout the life of the contract unless a deficiency occurs when performing liability adequacy
testing.
As noted in note 2.4.1, deferred acquisition costs for universal life and unit-linked contracts are amortised over the expected life
of the contracts based on a constant percentage of the present value of estimated gross profits to be realised over the life of the
contract or on a straight-line basis. As noted in note 3.2, significant judgment is exercised in making appropriate estimates of
gross profits. The expensing of acquisition costs is accelerated following adverse investment performance. Likewise, in periods
of favourable investment performance, previously expensed acquisition costs are reversed, not exceeding the amount initially
deferred.
Additional details of deferred acquisition and origination costs are provided in notes 2.4 and 19.

AIA Group Limited Annual Report 2012
134
Notes to the Consolidated Financial Statements and Significant Accounting Policies
FINANCIAL STATEMENTS
3. crITIcal accounTInG esTImaTes and judGemenTs (continued)
3.4 liability adequacy testing
The Group evaluates the adequacy of its insurance and investment contract liabilities with DPF at least annually. Significant
judgment is exercised in determining the level of aggregation at which liability adequacy testing is performed and in selecting best
estimate assumptions. Liability adequacy is assessed by portfolio of contracts in accordance with the Group’s manner of acquiring,
servicing and measuring the profitability of its insurance contracts. The Group performs liability adequacy testing separately for
each geographical market in which it operates.
The judgments exercised in liability adequacy testing affect amounts recognised in the consolidated financial statements as
commission and other acquisition expenses, deferred acquisition costs, insurance contract benefits and insurance and investment
contract liabilities.
3.5 fair values of financial assets
The Group determines the fair values of financial assets traded in active markets using quoted bid prices as of each reporting
date. The fair values of financial assets that are not traded in active markets are typically determined using a variety of other
valuation techniques, such as prices observed in recent transactions and values obtained from current bid prices of comparable
investments. More judgment is used in measuring the fair value of financial assets for which market observable prices are not
available or are available only infrequently.
The degree of judgment used in measuring the fair value of financial instruments generally correlates with the level of pricing
observability. Pricing observability is affected by a number of factors, including the type of financial instrument, whether the
financial instrument is new to the market and not yet established, the characteristics specific to the transaction and general market
conditions.
Changes in the fair value of financial assets held by the Group’s participating funds affect not only the value of financial assets, but
are also reflected in corresponding movements in insurance and investment contract liabilities. This is due to an insurance liability
being recorded for the proportion of the net assets of the participating funds that would be allocated to policyholders if all relevant
surplus at the date of the consolidated statement of financial position were to be declared as a policyholder dividend based on
current local regulations. Both of the foregoing changes are reflected in the consolidated income statement.
Changes in the fair value of financial assets held to back the Group’s unit-linked contracts result in a corresponding change
in insurance and investment contract liabilities. Both of the foregoing changes are also reflected in the consolidated income
statement.
Further details of the fair value of financial assets and the sensitivity analysis to interest rates and equity prices are provided in
notes 22 and 36.
3.6 Impairment of financial assets
Financial assets, other than those at fair value through profit or loss, are assessed for impairment regularly. This requires the
exercise of significant judgment. The Group assesses at each reporting date whether there is objective evidence that a financial
asset or a group of financial assets is impaired. Objective evidence that a financial asset, or group of assets, is impaired includes
observable data that comes to the attention of the Group about the following events:
• significantfinancialdifficultyoftheissuerordebtor;
• abreachofcontract,suchasadefaultordelinquencyinpayments;
• itbecomesprobablethattheissuerordebtorwillenterbankruptcyorotherfinancialreorganisation;
• thedisappearanceofanactivemarketforthatfinancialassetbecauseoffinancialdifficulties;or

AD
DIT
ION
AL
INF
OR
MA
TIO
NF
INA
NC
IAL
ST
AT
EM
EN
TS
135
CO
RP
OR
AT
E G
OV
ER
NA
NC
EO
VE
RV
IEW
FIN
AN
CIA
L A
ND
OP
ER
ATI
NG
RE
VIE
W
Notes to the Consolidated Financial Statements and Significant Accounting Policies
3. crITIcal accounTInG esTImaTes and judGemenTs (continued)
3.6 Impairment of financial assets (continued)
• observabledata,includingmarketprices,indicatingthatthereisapotentialdecreaseintheestimatedfuturecashflowssince
the initial recognition of those assets, including:
– adverse changes in the payment status of issuers; or
– national or local economic conditions that correlate with increased default risk.
For loans and receivables, impairment loss is determined using an analytical method based on knowledge of each loan group or
receivable. The method is usually based on historical statistics, adjusted for trends in the group of financial assets or individual
accounts.
Further details of the impairment of financial assets during the year are provided in note 30.
3.7 share-based compensation
The Group has adopted a number of share-based compensation plans to retain, motivate and align the interests of eligible
employees, directors, officers and agents with those of the Group. These share-based compensation plans are predominantly
accounted for as equity-settled plans under which shares or options to purchase shares are awarded. The Group utilises a
binomial lattice model to calculate the fair value of the share option grants, a Monte-Carlo simulation model and/or discounted
cash flow technique to calculate the fair value of the other share awards. These models require assumption inputs that may differ
from actual results due to changes in economic conditions. Further details of share-based compensation are provided in notes 2.16
and 38.
4. exchanGe raTes
The Group’s principal overseas operations during the reporting period were located within the Asia-Pacific region. The results and
cash flows of these operations have been translated into US dollars at the following average rates:
US dollar exchange rates
year ended30 november
Year ended30 November
2012 2011
Hong Kong 7.76 7.78Thailand 31.12 30.40Singapore 1.26 1.26Malaysia 3.10 3.06China 6.32 6.49Korea 1,132.50 1,107.01
Assets and liabilities have been translated at the following year-end rates:
US dollar exchange rates
as at30 november
As at30 November
2012 2011
Hong Kong 7.75 7.79Thailand 30.68 31.21Singapore 1.22 1.30Malaysia 3.04 3.18China 6.23 6.37Korea 1,082.25 1,145.48
Exchange rates are expressed in units of local currency per US$1.

AIA Group Limited Annual Report 2012
136
Notes to the Consolidated Financial Statements and Significant Accounting Policies
FINANCIAL STATEMENTS
5. operaTInG profIT before TaxOperating profit before tax may be reconciled to net profit as follows:
year ended30 november
Year ended30 November
US$m Note 2012 2011
Operating profit before tax 7 2,651 2,381Non-operating investment return:
Investment experience 2,743 (2,177)Investment income related to unit-linked contracts 186 204Investment management expenses related to unit-linked contracts (86) (98)Other investment management expenses (20) (15)Corresponding changes in insurance and investment contract liabilities for
unit-linked contracts (1,147) 1,622Corresponding changes in insurance contract liabilities for participating funds (578) 213Corresponding changes in third-party interests in consolidated investment funds (2) 29
Non-operating investment return 1,096 (222)Other non-operating items:
Changes in insurance and investment contract liabilities for policyholders’ tax on operating profit before tax 47 59
Restructuring and other non-operating costs (80) (50)
Non-operating items 1,063 (213)
Profit before tax 3,714 2,168
Tax on operating profit before tax (482) (451)Non-operating tax expense (156) (50)Policyholders’ tax on operating profit before tax (47) (59)
Tax expense (685) (560)
Net profit 3,029 1,608
Net profit attributable to:
Shareholders of AIA Group Limited 3,019 1,600Non-controlling interests 10 8
Operating profit before tax 2,651 2,381Tax on operating profit before tax (482) (451)
Operating profit after tax 2,169 1,930
Operating profit after tax attributable to:
Shareholders of AIA Group Limited 2,159 1,922Non-controlling interests 10 8
Restructuring costs represent costs related to restructuring programmes and are primarily comprised of redundancy and contract termination costs. Other non-operating costs primarily consist of due diligence and acquisition-related expenses.
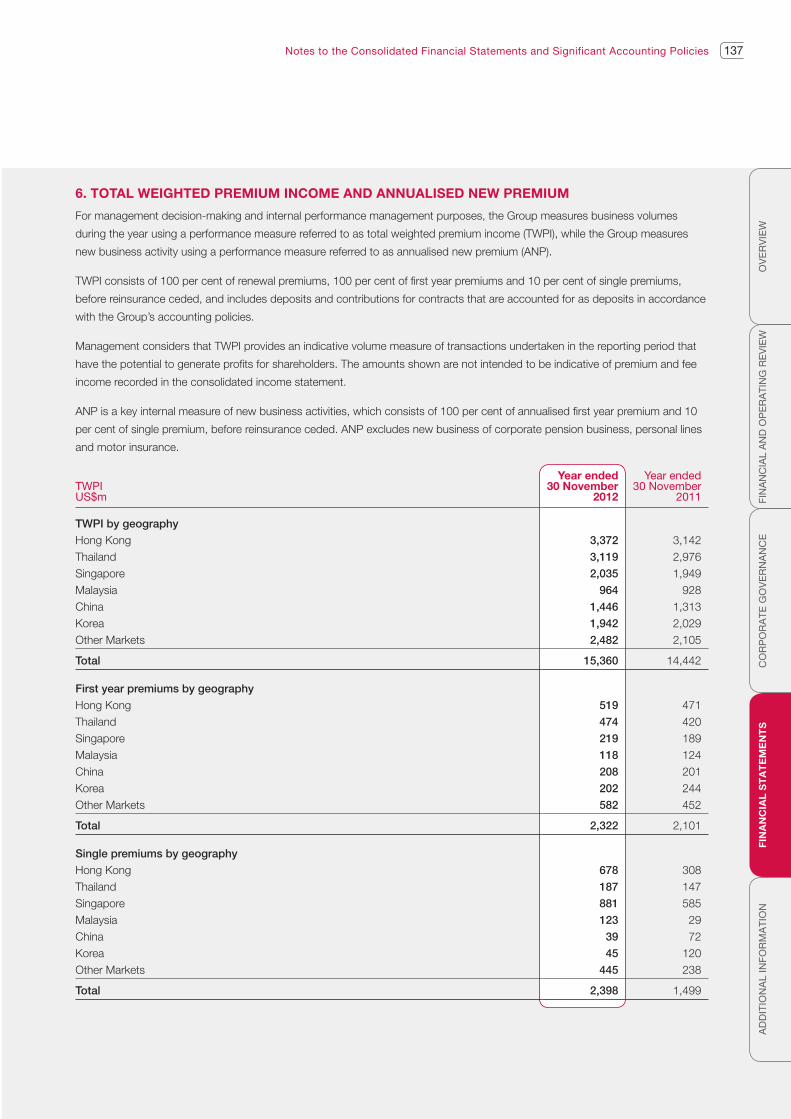
AD
DIT
ION
AL
INF
OR
MA
TIO
NF
INA
NC
IAL
ST
AT
EM
EN
TS
137
CO
RP
OR
AT
E G
OV
ER
NA
NC
EO
VE
RV
IEW
FIN
AN
CIA
L A
ND
OP
ER
ATI
NG
RE
VIE
W
Notes to the Consolidated Financial Statements and Significant Accounting Policies
6. ToTal weIGhTed premIum Income and annualIsed new premIum
For management decision-making and internal performance management purposes, the Group measures business volumes
during the year using a performance measure referred to as total weighted premium income (TWPI), while the Group measures
new business activity using a performance measure referred to as annualised new premium (ANP).
TWPI consists of 100 per cent of renewal premiums, 100 per cent of first year premiums and 10 per cent of single premiums,
before reinsurance ceded, and includes deposits and contributions for contracts that are accounted for as deposits in accordance
with the Group’s accounting policies.
Management considers that TWPI provides an indicative volume measure of transactions undertaken in the reporting period that
have the potential to generate profits for shareholders. The amounts shown are not intended to be indicative of premium and fee
income recorded in the consolidated income statement.
ANP is a key internal measure of new business activities, which consists of 100 per cent of annualised first year premium and 10
per cent of single premium, before reinsurance ceded. ANP excludes new business of corporate pension business, personal lines
and motor insurance.
TWPIyear ended
30 novemberYear ended
30 NovemberUS$m 2012 2011
TWPI by geography
Hong Kong 3,372 3,142Thailand 3,119 2,976Singapore 2,035 1,949Malaysia 964 928China 1,446 1,313Korea 1,942 2,029Other Markets 2,482 2,105
Total 15,360 14,442
First year premiums by geography
Hong Kong 519 471Thailand 474 420Singapore 219 189Malaysia 118 124China 208 201Korea 202 244Other Markets 582 452
Total 2,322 2,101
Single premiums by geography
Hong Kong 678 308Thailand 187 147Singapore 881 585Malaysia 123 29China 39 72Korea 45 120Other Markets 445 238
Total 2,398 1,499

AIA Group Limited Annual Report 2012
138
Notes to the Consolidated Financial Statements and Significant Accounting Policies
FINANCIAL STATEMENTS
6. ToTal weIGhTed premIum Income and annualIsed new premIum (continued)
TWPIyear ended
30 novemberYear ended
30 NovemberUS$m 2012 2011
Renewal premiums by geography
Hong Kong 2,785 2,640Thailand 2,627 2,541Singapore 1,728 1,702Malaysia 834 801China 1,234 1,105Korea 1,735 1,773Other Markets 1,856 1,629
Total 12,799 12,191
ANPyear ended
30 novemberYear ended
30 NovemberUS$m 2012 2011
ANP by geography
Hong Kong 604 522Thailand 532 465Singapore 339 264Malaysia 151 142China 215 215Korea 237 270Other Markets 618 594
Total 2,696 2,472

AD
DIT
ION
AL
INF
OR
MA
TIO
NF
INA
NC
IAL
ST
AT
EM
EN
TS
139
CO
RP
OR
AT
E G
OV
ER
NA
NC
EO
VE
RV
IEW
FIN
AN
CIA
L A
ND
OP
ER
ATI
NG
RE
VIE
W
Notes to the Consolidated Financial Statements and Significant Accounting Policies
7. seGmenT InformaTIon
The Group’s operating segments, based on the reports received by the Exco, are each of the geographical markets in which
the Group operates. Each of the reportable segments, other than the “Group Corporate Centre” segment, writes life insurance
business, providing life, pension and accident and health products to customers in its local market, and distributes related
investment and other financial services products. The reportable segments, as required to be disclosed separately under IFRS
8, are Hong Kong, Thailand, Singapore, Malaysia, China, Korea, Other Markets and Group Corporate Centre. The Group’s Hong
Kong reportable segment includes Macau. The Group’s Singapore reportable segment includes Brunei. Other Markets primarily
includestheGroup’soperationsinthePhilippines,Indonesia,Vietnam,India,Australia,NewZealandandTaiwan.Theactivitiesof
the Group Corporate Centre segment consist of the Group’s corporate functions, shared services, certain internal reinsurance and
eliminations of intragroup transactions.
Because each reportable segment other than the Group Corporate Centre segment focuses on serving the life insurance needs of
its local market, there are limited transactions between reportable segments. The key performance indicators reported in respect
of each segment are:
• ANP;
• TWPI;
• investmentincome(excludinginvestmentincomeinrespectofunit-linkedcontracts);
• operatingexpenses;
• operatingprofitaftertax(seenote5);
• expenseratio,measuredasoperatingexpensesdividedbyTWPI;
• operatingmargin,measuredasoperatingprofitbeforetax(seeabove)expressedasapercentageofTWPI;and
• operatingreturnonallocatedequity,measuredasoperatingprofitaftertaxattributabletoshareholdersofAIAGroupLimited
expressed as a percentage of the simple average of opening and closing allocated segment equity (being the segment assets
less segment liabilities in respect of each reportable segment less non-controlling interests, fair value and foreign currency
translation reserves, and adjusted for subordinated intercompany debt).
In presenting net capital in/(out) flows to reportable segments, capital outflows consist of dividends and profit distributions to the
Group Corporate Centre segment and capital inflows consist of capital injections into reportable segments by the Group Corporate
Centre segment. For the Group, net capital in/(out) flows reflect the net amount received from shareholders by way of capital
contributions less amounts distributed by way of dividends.
Business volumes in respect of the Group’s five largest customers are less than 30 per cent of premiums and fee income.

AIA Group Limited Annual Report 2012
140
Notes to the Consolidated Financial Statements and Significant Accounting Policies
FINANCIAL STATEMENTS
7. seGmenT InformaTIon (continued)
Key markets
US$mhongKong Thailand singapore malaysia china Korea
othermarkets
Groupcorporate
centre Total
Year ended 30 November 2012
ANP 604 532 339 151 215 237 618 – 2,696
TWPI 3,372 3,119 2,035 964 1,446 1,942 2,482 – 15,360
Net premiums, fee income and other operating revenue (net of reinsurance ceded) 2,818 3,176 1,947 845 1,352 1,443 1,539 61 13,181
Investment income(1) 999 885 718 292 364 355 522 142 4,277
Total revenue 3,817 4,061 2,665 1,137 1,716 1,798 2,061 203 17,458
Net insurance and investment contract benefits(2) 2,476 2,801 1,925 776 1,217 1,304 1,184 13 11,696
Commission and other acquisitionexpenses 299 448 194 88 127 199 281 5 1,641
Operating expenses 212 173 139 81 180 127 299 129 1,340
Investment management expenses and finance costs(3) 34 34 14 6 12 4 31 11 146
Total expenses 3,021 3,456 2,272 951 1,536 1,634 1,795 158 14,823
Share of profit/(loss) from associates – (1) – – – – 17 – 16
Operating profit before tax 796 604 393 186 180 164 283 45 2,651
Tax on operating profit before tax (60) (152) (61) (45) (29) (39) (69) (27) (482)
Operating profit after tax 736 452 332 141 151 125 214 18 2,169
Operating profit after
tax attributable to:
Shareholders of AIA Group
Limited 732 452 332 142 151 125 207 18 2,159
Non-controlling interests 4 – – (1) – – 7 – 10
Key operating ratios:
Expense ratio 6.3% 5.5% 6.8% 8.4% 12.4% 6.5% 12.0% – 8.7%
Operating margin 23.6% 19.4% 19.3% 19.3% 12.4% 8.4% 11.4% – 17.3%
Operating return on allocated equity 18.9% 11.8% 22.8% 24.2% 16.7% 8.0% 12.3% – 11.8%
Operating profit before tax includes:
Finance costs 6 3 2 1 7 – 3 (3) 19
Depreciation and amortisation 9 9 12 8 10 6 21 13 88
Notes:
(1) Excludes investment income related to unit-linked contracts.
(2) Excludes corresponding changes in insurance and investment contract liabilities from investment experience for unit-linked contracts and participating funds and investment income and investment management expenses related to unit-linked contracts. It also excludes policyholders’ share of tax relating to the change in insurance and investment contract liabilities.
(3) Excludes investment management expenses related to unit-linked contracts.

AD
DIT
ION
AL
INF
OR
MA
TIO
NF
INA
NC
IAL
ST
AT
EM
EN
TS
141
CO
RP
OR
AT
E G
OV
ER
NA
NC
EO
VE
RV
IEW
FIN
AN
CIA
L A
ND
OP
ER
ATI
NG
RE
VIE
W
Notes to the Consolidated Financial Statements and Significant Accounting Policies
7. seGmenT InformaTIon (continued)
Operating profit before tax may be reconciled to net profit as follows:
Key markets
US$mhongKong Thailand singapore malaysia china Korea
othermarkets
Groupcorporate
centre Total
Year ended 30 November 2012
Operating profit before tax 796 604 393 186 180 164 283 45 2,651
Non-operating items 215 656 167 19 (70) 4 59 13 1,063
Profit before tax 1,011 1,260 560 205 110 168 342 58 3,714
Tax on operating profit before tax (60) (152) (61) (45) (29) (39) (69) (27) (482)
Policyholders’ tax on operating profit before tax – – (29) (14) – – (4) – (47)
Non-operating tax expense – (91) (36) (12) 17 (17) (12) (5) (156)
Tax expense (60) (243) (126) (71) (12) (56) (85) (32) (685)
Net profit 951 1,017 434 134 98 112 257 26 3,029
Net profit attributable to:
Shareholders of AIA Group
Limited 947 1,017 434 135 98 112 250 26 3,019
Non-controlling interests 4 – – (1) – – 7 – 10
Allocated equity may be analysed as follows:
Key markets
US$mhongKong Thailand(4) singapore malaysia china Korea
othermarkets(4)
Groupcorporate
centre(4) Total
30 November 2012
Assets before investments in associates 32,869 24,197 27,234 8,589 10,587 11,615 13,598 5,659 134,348
Investments in associates – – 1 8 – – 82 – 91
Total assets 32,869 24,197 27,235 8,597 10,587 11,615 13,680 5,659 134,439
Total liabilities(4) 26,121 18,834 24,724 7,844 9,511 9,539 10,315 723 107,611
Total equity 6,748 5,363 2,511 753 1,076 2,076 3,365 4,936 26,828
Non-controlling interests 11 – – 9 – – 107 4 131
Amounts reflected in other comprehensive income:Fair value reserve 2,936 798 463 42 (59) 524 1,274 1 5,979
Foreign currency translation reserve – 463 389 96 132 (65) 145 5 1,165
Allocated equity 3,801 4,102 1,659 606 1,003 1,617 1,839 4,926 19,553
Net capital (out)/in flows (1,104) (503) (23) (98) 100 – 45 1,011 (572)
Note:
(4) Group Corporate Centre, Thailand and Other Markets adjusted for subordinated intercompany debt provided to Thailand and Other Markets of US$13m and US$29m, respectively.

AIA Group Limited Annual Report 2012
142
Notes to the Consolidated Financial Statements and Significant Accounting Policies
FINANCIAL STATEMENTS
7. seGmenT InformaTIon (continued)
Segment information may be reconciled to the consolidated income statement as shown below:
related changes ininsurance and investment
contract benefits
US$msegment
informationInvestmentexperience
Investmentincome
related tounit-linkedcontracts
Investmentmanagement
expensesrelated to
unit-linkedcontracts
unit-linkedcontracts
participatingfunds
Third-partyinterests in
consolidatedinvestment
funds
other non-operating
items
consolidatedincome
statement
Year ended 30 November 2012
Total revenue 17,458 2,743 186 – – – – – 20,387 Total revenue
Of which: Of which:Net premiums, fee
income and other operating revenue 13,181 – – – – – – – 13,181
Net premiums, fee income and other operating revenue
Investment return 4,277 2,743 186 – – – – – 7,206 Investment return
Total expenses 14,823 – – 86 1,147 578 2 53 16,689 Total expenses
Of which: Of which:Net insurance and
investment contract benefits 11,696 – – – 1,147 578 – (47) 13,374
Net insuranceand investment
contract benefitsRestructuring
and other non-operating costs – – – – – – – 80 80
Restructuringand other
non-operatingcosts
Investment managementexpenses and finance costs 146 – – 86 – – – 20 252
Investmentmanagement
expenses and finance costs
Change in third-party interests in consolidated investment funds – – – – – – 2 – 2
Change in third-party interests
in consolidatedinvestment funds
Share of profit from associates 16 – – – – – – – 16
Share of profit from associates
Operating profit before tax 2,651 2,743 186 (86) (1,147) (578) (2) (53) 3,714 Profit before tax
Other non-operating items in 2012 consist of restructuring and other non-operating costs of US$80m (see note 5).

AD
DIT
ION
AL
INF
OR
MA
TIO
NF
INA
NC
IAL
ST
AT
EM
EN
TS
143
CO
RP
OR
AT
E G
OV
ER
NA
NC
EO
VE
RV
IEW
FIN
AN
CIA
L A
ND
OP
ER
ATI
NG
RE
VIE
W
Notes to the Consolidated Financial Statements and Significant Accounting Policies
7. seGmenT InformaTIon (continued)
Key markets
US$mHongKong(4) Thailand Singapore Malaysia China Korea
OtherMarkets
GroupCorporate
Centre(4) Total
Year ended 30 November 2011
ANP 522 465 264 142 215 270 594 – 2,472TWPI 3,142 2,976 1,949 928 1,313 2,029 2,105 – 14,442Net premiums, fee income and
other operating revenue (net of reinsurance ceded) 2,483 3,027 1,921 813 1,245 1,517 1,343 66 12,415
Investment income(1) 904 835 720 288 299 342 486 72 3,946
Total revenue 3,387 3,862 2,641 1,101 1,544 1,859 1,829 138 16,361
Net insurance and investment contract benefits(2) 2,132 2,670 1,878 769 1,120 1,331 1,049 17 10,966
Commission and other acquisition expenses 307 432 223 87 97 246 251 6 1,649
Operating expenses 192 167 131 75 178 125 263 122 1,253Investment management expenses
and finance costs(3) 6 33 19 7 9 4 26 20 124
Total expenses 2,637 3,302 2,251 938 1,404 1,706 1,589 165 13,992
Share of profit from associates – – 1 3 – – 8 – 12Operating profit/(loss) before tax 750 560 391 166 140 153 248 (27) 2,381Tax on operating profit/(loss) before
tax (52) (165) (55) (34) (21) (29) (78) (17) (451)
Operating profit/(loss) after tax 698 395 336 132 119 124 170 (44) 1,930
Operating profit/(loss) after tax
attributable to:
Shareholders of AIA Group
Limited 694 395 336 133 119 124 165 (44) 1,922Non-controlling interests 4 – – (1) – – 5 – 8
Key operating ratios:
Expense ratio 6.1% 5.6% 6.7% 8.1% 13.6% 6.2% 12.5% – 8.7%Operating margin 23.9% 18.8% 20.1% 17.9% 10.7% 7.5% 11.8% – 16.5%Operating return on allocated equity 16.4% 11.1% 24.2% 23.6% 15.7% 8.6% 11.3% – 11.7%
Operating profit/(loss) before tax includes:
Finance costs 3 1 4 1 3 – 1 (1) 12Depreciation and amortisation 10 9 11 9 11 13 19 9 91
Notes:
(1) Excludes investment income related to unit-linked contracts.
(2) Excludes corresponding changes in insurance and investment contract liabilities from investment experience for unit-linked contracts and participating funds and investment income and investment management expenses related to unit-linked contracts. It also excludes policyholders’ share of tax relating to the change in insurance and investment contract liabilities.
(3) Excludes investment management expenses related to unit-linked contracts.
(4) Results of certain internal reinsurance have been reclassified from Hong Kong segment to Group Corporate Centre segment to conform to current year presentation. As a result, operating profit before and after tax of Hong Kong segment have been decreased by US$42m. The reclassification has no impact to the operating profit before and after tax, allocated equity and net capital outflow of the Group as of 30 November 2011.

AIA Group Limited Annual Report 2012
144
Notes to the Consolidated Financial Statements and Significant Accounting Policies
FINANCIAL STATEMENTS
7. seGmenT InformaTIon (continued)
Operating profit/(loss) before tax may be reconciled to net profit/(loss) as follows:
Key markets
US$mHongKong(4) Thailand Singapore Malaysia China Korea
OtherMarkets
GroupCorporate
Centre(4) Total
Year ended 30 November 2011
Operating profit/(loss) before tax 750 560 391 166 140 153 248 (27) 2,381Non-operating items (196) 103 21 15 (136) (11) 72 (81) (213)
Profit/(loss) before tax 554 663 412 181 4 142 320 (108) 2,168Tax on operating profit/(loss) before tax (52) (165) (55) (34) (21) (29) (78) (17) (451)Policyholders’ tax on operating profit before tax – – (40) (14) – – (5) – (59)Non-operating tax expense – (46) 19 (2) 34 2 (53) (4) (50)
Tax expense (52) (211) (76) (50) 13 (27) (136) (21) (560)
Net profit/(loss) 502 452 336 131 17 115 184 (129) 1,608
Net profit/(loss) attributable to:
Shareholders of AIA Group
Limited 498 452 336 132 17 115 179 (129) 1,600Non-controlling interests 4 – – (1) – – 5 – 8
Allocated equity may be analysed as follows:
Key markets
US$mHongKong(4) Thailand Singapore Malaysia China Korea
OtherMarkets(5)
GroupCorporate
Centre(4)(5) Total
30 November 2011
Assets before investments in associates 28,030 21,519 23,215 7,601 8,850 9,827 11,021 4,337 114,400
Investments in associates – 1 1 12 – – 47 – 61
Total assets 28,030 21,520 23,216 7,613 8,850 9,827 11,068 4,337 114,461Total liabilities(5) 22,700 16,724 21,449 6,931 8,000 8,137 8,518 587 93,046
Total equity 5,330 4,796 1,767 682 850 1,690 2,550 3,750 21,415Non-controlling interests 9 – – 9 – – 81 3 102Amounts reflected in other
comprehensive income:Fair value reserve 1,364 815 250 38 (61) 334 827 (153) 3,414Foreign currency translation
reserve (1) 393 269 66 106 (149) 104 5 793
Allocated equity 3,958 3,588 1,248 569 805 1,505 1,538 3,895 17,106
Net capital (out)/in flows(4) (1,058) (401) (618) (120) 80 – (26) 1,884 (259)
Notes:
(4) Results of certain internal reinsurance have been reclassified from Hong Kong segment to Group Corporate Centre segment to conform to current year presentation. As a result, operating profit before and after tax of Hong Kong segment have been decreased by US$42m. The reclassification has no impact to the operating profit before and after tax, allocated equity and net capital outflow of the Group as of 30 November 2011.
(5) Group Corporate Centre and Other Markets adjusted for subordinated intercompany debt provided to Other Markets of US$27m.

AD
DIT
ION
AL
INF
OR
MA
TIO
NF
INA
NC
IAL
ST
AT
EM
EN
TS
145
CO
RP
OR
AT
E G
OV
ER
NA
NC
EO
VE
RV
IEW
FIN
AN
CIA
L A
ND
OP
ER
ATI
NG
RE
VIE
W
Notes to the Consolidated Financial Statements and Significant Accounting Policies
7. seGmenT InformaTIon (continued)
Segment information may be reconciled to the consolidated income statement as shown below:
Related changes ininsurance and investment
contract benefits
US$mSegment
informationInvestmentexperience
Investmentincome
related tounit-linkedcontracts
Investmentmanagement
expensesrelated to
unit-linkedcontracts
Unit-linkedcontracts
Participatingfunds
Third-partyinterests in
consolidatedinvestment
funds
Other non-operating
items
Consolidatedincome
statement
Year ended 30 November 2011
Total revenue 16,361 (2,177) 204 – – – – – 14,388 Total revenue
Of which: Of which:Net premiums, fee
income and other operating revenue 12,415 – – – – – – – 12,415
Net premiums, feeincome and otheroperating revenue
Investment return 3,946 (2,177) 204 – – – – – 1,973 Investment return
Total expenses 13,992 – – 98 (1,622) (213) (29) 6 12,232 Total expenses
Of which: Of which:Net insurance and
investment contract benefits 10,966 – – – (1,622) (213) – (59) 9,072
Net insurance and
investment contract benefits
Restructuring and other non-operating costs – – – – – – – 50 50
Restructuring and other
non-operating costs
Investment managementexpenses and finance costs 124 – – 98 – – – 15 237
Investment management expenses and finance costs
Change in third-party interests in consolidated investment funds – – – – – – (29) – (29)
Change inthird-party interests
in consolidatedinvestment funds
Share of profit from associates 12 – – – – – – – 12
Share of profitfrom associates
Operating profit before tax 2,381 (2,177) 204 (98) 1,622 213 29 (6) 2,168 Profit before tax
Other non-operating items in 2011 consist of restructuring and other non-operating costs of US$50m (see note 5).

AIA Group Limited Annual Report 2012
146
Notes to the Consolidated Financial Statements and Significant Accounting Policies
FINANCIAL STATEMENTS
8. revenue
Investment return
year ended30 november
Year ended30 November
US$m 2012 2011
Interest income 3,957 3,685Dividend income 409 389Rental income 97 76
Investment income 4,463 4,150Available for sale
Net realised gains from debt securities 50 39
Net gains of available for sale financial assets reflected in the consolidated
income statement 50 39At fair value through profit or loss
Net gains/(losses) of financial assets designated at fair value through profit or loss
Net gains of debt securities 579 44Net gains/(losses) of equity securities 2,328 (2,181)Net gains of financial instruments held for trading
Net gains of debt investments 1 –Net fair value movement on derivatives 140 47
Net gains/(losses) in respect of financial instruments at fair value through profit or loss 3,048 (2,090)Net foreign exchange losses (287) (129)Other net realised (losses)/gains (68) 3
Investment experience 2,743 (2,177)
Investment return 7,206 1,973
Other net realised (losses)/gains include impairment of intangible assets of US$62m (2011: US$3m).
Foreign currency movements resulted in the following losses recognised in the consolidated income statement (other than gains
and losses arising on items measured at fair value through profit or loss):
year ended30 november
Year ended30 November
US$m 2012 2011
Foreign exchange losses (55) (57)
other operating revenue
The balance of other operating revenue largely consists of asset management fees.

AD
DIT
ION
AL
INF
OR
MA
TIO
NF
INA
NC
IAL
ST
AT
EM
EN
TS
147
CO
RP
OR
AT
E G
OV
ER
NA
NC
EO
VE
RV
IEW
FIN
AN
CIA
L A
ND
OP
ER
ATI
NG
RE
VIE
W
Notes to the Consolidated Financial Statements and Significant Accounting Policies
9. expenses
year ended30 november
Year ended30 November
US$m 2012 2011
Insurance contract benefits 7,879 7,036Change in insurance contract liabilities 5,658 3,426Investment contract benefits 540 (861)
Insurance and investment contract benefits 14,077 9,601Insurance and investment contract benefits ceded (703) (529)
Insurance and investment contract benefits, net of ceded reinsurance 13,374 9,072Commission and other acquisition expenses incurred 2,840 2,506Deferral and amortisation of acquisition costs (1,199) (857)
Commission and other acquisition expenses 1,641 1,649Employee benefit expenses 858 812Depreciation 64 65Amortisation 24 26Operating lease rentals 99 101Other operating expenses 295 249
Operating expenses 1,340 1,253Restructuring and other non-operating costs 80 50Investment management expenses 233 225Finance costs 19 12Change in third-party interests in consolidated investment funds 2 (29)
Total 16,689 12,232
Other operating expenses include auditors’ remuneration of US$14m (2011: US$11m).
Investment management expenses may be analysed as:
year ended30 november
Year ended30 November
US$m 2012 2011
Investment management expenses including fees paid to related parties 224 221Depreciation on investment property 9 4
Total 233 225
Finance costs may be analysed as:
year ended30 november
Year ended30 November
US$m 2012 2011
Securities lending and repurchase agreements (see note 29 for details) 14 8Bank and other loans 5 4
Total 19 12
Finance costs include interest expense of US$5m (2011: US$4m) on bank loans, overdrafts and related party loans wholly
repayable within five years.

AIA Group Limited Annual Report 2012
148
Notes to the Consolidated Financial Statements and Significant Accounting Policies
FINANCIAL STATEMENTS
9. expenses (continued)
Employee benefit expenses consist of:
year ended30 november
Year ended30 November
US$m 2012 2011
Wages and salaries 682 683Share-based compensation 45 16Pension costs – defined contribution plans 46 41Pension costs – defined benefit plans 16 11Other employee benefit expenses 69 61
Total 858 812
10. Income Tax
year ended 30 november
Year ended 30 November
US$m 2012 2011
Tax charged/(credited) in the consolidated income statement
Current income tax – Hong Kong Profits Tax 54 44Current income tax – overseas 479 538Deferred income tax on temporary differences 152 (22)
Total 685 560
The tax benefit or expense attributable to Singapore, Brunei, Malaysia, Indonesia, Australia and the Philippines life insurance
policyholder returns is included in the tax charge or credit and is analysed separately in the consolidated income statement in order
to permit comparison of the underlying effective rate of tax attributable to shareholders from year to year. The tax attributable to
policyholders’ returns included above is US$104m (2011: US$47m).
The provision for Hong Kong Profits Tax is calculated at 16.5 per cent. Taxation for overseas subsidiaries and branches is charged
at the appropriate current rates of taxation ruling in the relevant jurisdictions of which the most significant jurisdictions are outlined
below.
year ended 30 november
Year ended 30 November
2012 2011
Thailand 23% 30%Singapore 17% 17%Korea 24.2% 24.2%Malaysia 25% 25%China 25% 25%Hong Kong 16.5% 16.5%Other 17% – 30% 17% – 30%

AD
DIT
ION
AL
INF
OR
MA
TIO
NF
INA
NC
IAL
ST
AT
EM
EN
TS
149
CO
RP
OR
AT
E G
OV
ER
NA
NC
EO
VE
RV
IEW
FIN
AN
CIA
L A
ND
OP
ER
ATI
NG
RE
VIE
W
Notes to the Consolidated Financial Statements and Significant Accounting Policies
10. Income Tax (continued)
The table above reflects the principal rate of corporate income taxes, as at the end of each year. The rate changes reflect changes
to the enacted or substantively enacted corporate tax rates throughout the year in each jurisdiction.
During the year, Thailand and Korea enacted changes in corporate tax rates. For Thailand, the corporate income tax rate reduced
to 23 per cent for assessment year 2012 and will reduce to 20 per cent for assessment years 2013 and 2014 and is assumed to
be 30 per cent from assessment year 2015 onward. This change resulted in a reduction in deferred tax liabilities of US$72m, which
is recognised as a non-operating item.
For Korea, the corporate income tax rate was previously reduced to 22 per cent for the assessment years beginning April 2012.
After the change in tax rate, the corporate tax rate on the portion of assessable profits exceeding 20 billion Korean Won increased
from 22 per cent to 24.2 per cent for the assessment years beginning April 2012. The increase in tax rate resulted in an increase
of deferred tax liability of US$26m, of which US$16m is recognised as a non-operating item and US$10m is recognised in other
comprehensive income.
year ended 30 november
Year ended 30 November
US$m 2012 2011
Income tax reconciliation
Profit before income tax 3,714 2,168Tax calculated at domestic tax rates applicable to profits/(losses) in the respective jurisdictions 720 479Reduction in tax payable from:
Exempt investment income (66) (68)Amount over-provided in prior years (6) –Changes in tax rate and law (56) –Other (93) (39)
(221) (107)Increase in tax payable from:
Life insurance tax(1) 35 48Withholding taxes 31 20Disallowed expenses 18 18Amounts under-provided in prior years – 6Unrecognised deferred tax assets 40 38Provisions for uncertain tax positions 62 58
186 188
Total income tax expense 685 560
Note:
(1) Life insurance tax refers to the permanent differences which arise where the tax regime specific to the life insurance business does not adopt net income as the basis for calculating taxable profit, for example Hong Kong, where life business taxable profit is derived from life premiums.

AIA Group Limited Annual Report 2012
150
Notes to the Consolidated Financial Statements and Significant Accounting Policies
FINANCIAL STATEMENTS
10. Income Tax (continued)
The movement in net deferred tax liabilities in the period may be analysed as set out below:
(charged)/credited to other comprehensive income
US$m
net deferred tax asset/(liability)
at 1 december
(charged)/credited to the income statement
fair value reserve(2)
foreign exchange
net deferred tax asset/(liability)
at year end
30 November 2012
Revaluation of financial instruments (924) (73) (208) (5) (1,210)
Deferred acquisition costs (1,836) (209) – (54) (2,099)
Insurance and investment contract liabilities 1,495 146 – 37 1,678
Withholding taxes (95) (15) – (5) (115)
Provision for expenses 99 18 – 2 119
Losses available for offset against future taxable income 6 19 – – 25
Life surplus(1) (441) (48) – (28) (517)
Other (110) 10 – (5) (105)
Total (1,806) (152) (208) (58) (2,224)
30 November 2011
Revaluation of financial instruments (959) 90 (66) 11 (924)
Deferred acquisition costs (1,620) (234) – 18 (1,836)Insurance and investment
contract liabilities 1,390 139 – (34) 1,495Withholding taxes (85) (10) – – (95)Provision for expenses (24) 124 – (1) 99Losses available for
offset against future taxable income 2 5 – (1) 6
Life surplus(1) (431) (5) – (5) (441)Other (25) (87) – 2 (110)
Total (1,752) 22 (66) (10) (1,806)
Notes:
(1) Life surplus relates to the temporary difference which arises where the taxable profits are based on actual distributions from the long-term fund. This primarily relates to Singapore and Malaysia.
(2) Of the fair value reserve deferred tax charge/(credit) of US$208m (2011: US$66m) for 2012, US$211m (2011: US$69m) relates to fair value gains and losses on available for sale financial assets and US$(3)m (2011: US$(3)m) relates to fair value gains and losses on available for sale financial assets transferred to income on disposal.
Deferred tax assets are recognised to the extent that sufficient future taxable profits will be available for realisation. The Group has
not recognised deferred tax assets on tax losses and the temporary difference on insurance and investment contract liabilities
arising from different accounting and statutory/tax reserving methodology for certain branches and subsidiaries on the basis that
they have histories of tax losses and there is insufficient evidence that future profits will be available.

AD
DIT
ION
AL
INF
OR
MA
TIO
NF
INA
NC
IAL
ST
AT
EM
EN
TS
151
CO
RP
OR
AT
E G
OV
ER
NA
NC
EO
VE
RV
IEW
FIN
AN
CIA
L A
ND
OP
ER
ATI
NG
RE
VIE
W
Notes to the Consolidated Financial Statements and Significant Accounting Policies
10. Income Tax (continued)
Temporary differences not recognised in the consolidated statement of financial position are:
year ended 30 november
Year ended 30 November
US$m 2012 2011
Tax losses 100 158Insurance and investment contract liabilities 32 24
Total 132 182
The Group has not provided deferred tax liabilities of US$51m (2011: US$53m) in respect of unremitted earnings of operations
in one jurisdiction from which a withholding tax charge would be incurred upon distribution as the Group does not consider it
probable that this portion of accumulated earnings will be remitted in the foreseeable future.
The Group has unused income tax losses carried forward in Hong Kong, Malaysia, Macau, the Philippines, Indonesia, China,
Thailand, Korea and Taiwan. The tax losses of Hong Kong and Malaysia can be carried forward indefinitely. The tax losses of the
remaining branches and subsidiaries are due to expire within the periods ending 2015 (Macau and the Philippines), 2016 (Indonesia),
2017 (China and Thailand) and 2022 (Korea and Taiwan).
11. earnInGs per share
basic
Basic earnings per share is calculated by dividing the net profit attributable to shareholders of AIA Group Limited by the weighted
average number of ordinary shares in issue during the year. The shares held by employee share-based trusts are not considered to
be outstanding from the date of the purchase for purposes of computing basic and diluted earnings per share.
year ended 30 november
Year ended 30 November
2012 2011
Net profit attributable to shareholders of AIA Group Limited (US$m) 3,019 1,600Weighted average number of ordinary shares in issue (million) 11,997 12,031Basic earnings per share (US cents per share) 25.2 13.3
diluted
Diluted earnings per share is calculated by adjusting the weighted average number of ordinary shares outstanding to assume
conversion of all dilutive potential ordinary shares. As of 30 November 2012 and 2011, the Group has potentially dilutive
instruments which are the share options, restricted share units, restricted stock purchase units and restricted stock subscription
units granted to eligible employees, directors, officers and agents under various share-based compensation plans as described in
note 38.
year ended 30 november
Year ended 30 November
2012 2011
Net profit attributable to shareholders of AIA Group Limited (US$m) 3,019 1,600Weighted average number of ordinary shares in issue (million) 11,997 12,031Adjustment for restricted share units, restricted stock purchase units and
restricted stock subscription units granted under share-based compensation plans 11 1
Weighted average number of ordinary shares for diluted earnings per share (million) 12,008 12,032Diluted earnings per share (US cents per share) 25.1 13.3
At 30 November 2012, 28,171,257 share options (2011: 20,426,519) were excluded from the diluted weighted average number of
ordinary shares calculation as their effect would have been anti-dilutive.

AIA Group Limited Annual Report 2012
152
Notes to the Consolidated Financial Statementsand Significant Accounting Policies
FINANCIAL STATEMENTS
11. earnInGs per share (continued)
operating profit after tax per share
Operating profit after tax (see note 5) per share is calculated by dividing the operating profit after tax attributable to shareholders
of AIA Group Limited by the weighted average number of ordinary shares in issue during the year. As of 30 November 2012 and
2011, the Group has potentially dilutive instruments which are the share options, restricted share units, restricted stock purchase
units and restricted stock subscription units granted to eligible employees, directors, officers and agents under various share-
based compensation plans as described in note 38.
year ended 30 november
Year ended 30 November
2012 2011
Basic (US cents per share) 18.0 16.0Diluted (US cents per share) 18.0 16.0
12. dIvIdends
Dividends to shareholders of the Company attributable to the year:
year ended 30 november
Year ended 30 November
US$m 2012 2011
Interim dividend declared and paid of 12.33 Hong Kong cents per share (2011: 11.00 Hong Kong cents per share) 191 170
Final dividend proposed after the reporting date of 24.67 Hong Kong cents per share (2011: 22.00 Hong Kong cents per share)(1) 382 339
573 509
Note:
(1) Based upon shares outstanding at 30 November 2012 and 2011 that are entitled to a dividend, other than those held by employee share-based trusts.
The above final dividend was proposed by the Board on 27 February 2013 subject to shareholders’ approval at the AGM to be
held on 10 May 2013. The proposed final dividend has not been recognised as a liability at the reporting date.
Dividends to shareholders of the Company attributable to the previous financial year, approved and paid during the year:
year ended 30 november
Year ended 30 November
US$m 2012 2011
Final dividend in respect of the previous financial year, approved and paid during the year of 22.00 Hong Kong cents per share (2011: nil) 339 –

AD
DIT
ION
AL
INF
OR
MA
TIO
NF
INA
NC
IAL
ST
AT
EM
EN
TS
153
CO
RP
OR
AT
E G
OV
ER
NA
NC
EO
VE
RV
IEW
FIN
AN
CIA
L A
ND
OP
ER
ATI
NG
RE
VIE
W
Notes to the Consolidated Financial Statements and Significant Accounting Policies
13. InTanGIble asseTs
US$m GoodwillComputer
software
Distribution and other
rights Total
CostAt 1 December 2010 126 151 44 321
Additions – 44 10 54Disposals – (3) (1) (4)Foreign exchange movements – 1 1 2
At 30 November 2011 126 193 54 373
Additions – 67 10 77Disposals – (4) – (4)Foreign exchange movements – 7 2 9
At 30 November 2012 126 263 66 455
Accumulated amortisation and impairmentAt 1 December 2010 (6) (61) (2) (69)
Amortisation charge for the year – (24) (2) (26)Impairment – – (3) (3)Disposals – 1 – 1Foreign exchange movements – – – –
At 30 November 2011 (6) (84) (7) (97)
Amortisation charge for the year – (22) (2) (24)Impairment – (57) (5) (62)Disposals – 3 – 3Foreign exchange movements – (3) – (3)
At 30 November 2012 (6) (163) (14) (183)
Net book valueAt 30 November 2011 120 109 47 276
At 30 November 2012 120 100 52 272
Of the above, US$248m (2011: US$250m) is expected to be recovered more than 12 months after the end of the reporting period.
Goodwill arises primarily in respect of the Group’s insurance businesses. Impairment testing is performed by comparing the
carrying value of goodwill with the present value of expected future cash flows plus a multiple of the present value of the new
business generated.

AIA Group Limited Annual Report 2012
154
Notes to the Consolidated Financial Statementsand Significant Accounting Policies
FINANCIAL STATEMENTS
14. InvesTmenTs In assocIaTes
year ended 30 november
Year ended 30 November
US$m 2012 2011
Group
At beginning of financial year 61 69Distribution from associates (4) –Share of net profit 16 12Others 19 (14)Foreign exchange movements (1) (6)
At end of financial year 91 61
The Group’s interest in its principal associates is as follows:
Place of incorporation
Type of shares held
Principal activity
as at 30 november
2012
As at 30 November
2011
Tata AIA Life Insurance Company Limited (formerly known as Tata AIG Life Insurance Company Limited) India Ordinary Insurance 26% 26%
All associates are unlisted.
aggregated financial information of associatesyear ended
30 novemberYear ended
30 NovemberUS$m 2012 2011
Share of income 144 131Share of expenses (128) (119)
Share of net profit 16 12
as at 30 november
As at 30 November
US$m 2012 2011
Share of total assets 854 818Share of total liabilities (763) (757)
Share of net assets 91 61
Investments in associates are held for their long-term contribution to the Group’s performance and so all amounts are expected to
be realised more than 12 months after the end of the reporting period.
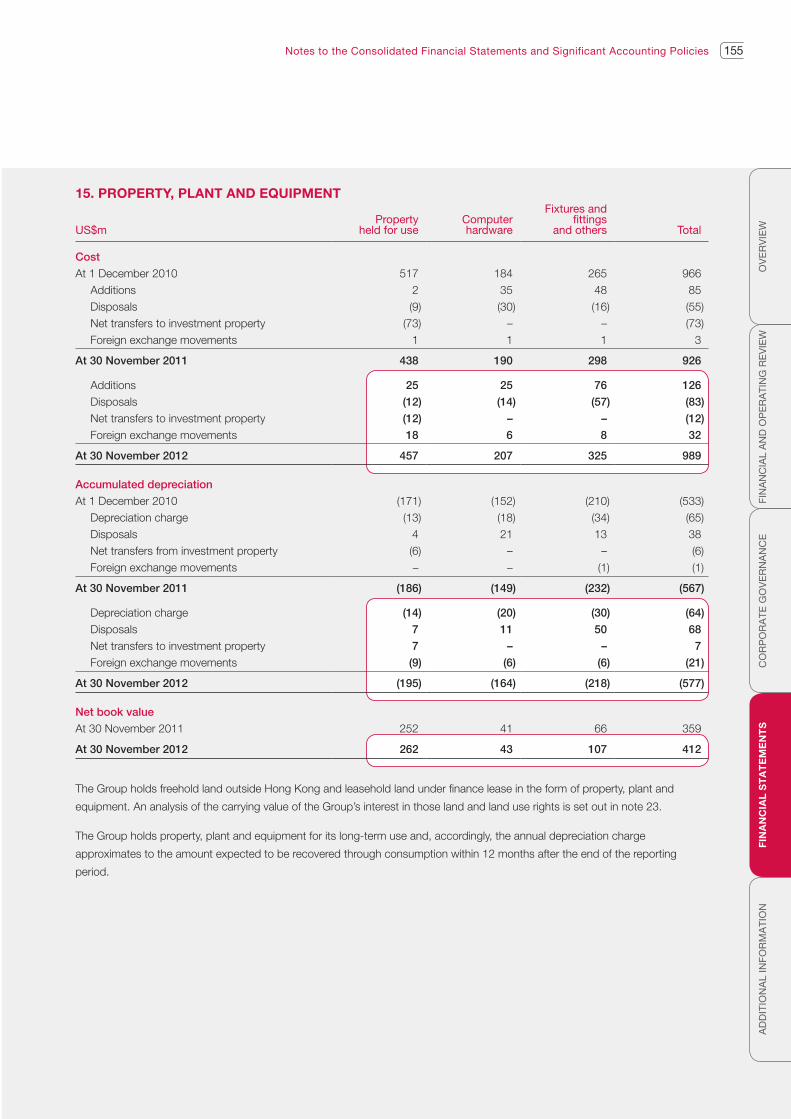
AD
DIT
ION
AL
INF
OR
MA
TIO
NF
INA
NC
IAL
ST
AT
EM
EN
TS
155
CO
RP
OR
AT
E G
OV
ER
NA
NC
EO
VE
RV
IEW
FIN
AN
CIA
L A
ND
OP
ER
ATI
NG
RE
VIE
W
Notes to the Consolidated Financial Statements and Significant Accounting Policies
15. properTy, planT and equIpmenT
US$mProperty
held for useComputer hardware
Fixtures and fittings
and others Total
Cost
At 1 December 2010 517 184 265 966Additions 2 35 48 85Disposals (9) (30) (16) (55)Net transfers to investment property (73) – – (73)Foreign exchange movements 1 1 1 3
At 30 November 2011 438 190 298 926
Additions 25 25 76 126
Disposals (12) (14) (57) (83)
Net transfers to investment property (12) – – (12)
Foreign exchange movements 18 6 8 32
At 30 November 2012 457 207 325 989
Accumulated depreciation
At 1 December 2010 (171) (152) (210) (533)Depreciation charge (13) (18) (34) (65)Disposals 4 21 13 38Net transfers from investment property (6) – – (6)Foreign exchange movements – – (1) (1)
At 30 November 2011 (186) (149) (232) (567)
Depreciation charge (14) (20) (30) (64)
Disposals 7 11 50 68
Net transfers to investment property 7 – – 7
Foreign exchange movements (9) (6) (6) (21)
At 30 November 2012 (195) (164) (218) (577)
Net book value
At 30 November 2011 252 41 66 359
At 30 November 2012 262 43 107 412
The Group holds freehold land outside Hong Kong and leasehold land under finance lease in the form of property, plant and
equipment. An analysis of the carrying value of the Group’s interest in those land and land use rights is set out in note 23.
The Group holds property, plant and equipment for its long-term use and, accordingly, the annual depreciation charge
approximates to the amount expected to be recovered through consumption within 12 months after the end of the reporting
period.

AIA Group Limited Annual Report 2012
156
Notes to the Consolidated Financial Statementsand Significant Accounting Policies
FINANCIAL STATEMENTS
16. InvesTmenT properTy
US$m
Cost
At 1 December 2010 882Additions 3Disposals (12)Net transfers from property, plant and equipment 73Foreign exchange movements (4)
At 30 November 2011 942
Additions 133
Disposals (1)
Net transfers from property, plant and equipment 12
Foreign exchange movements 14
At 30 November 2012 1,100
Accumulated depreciation
At 1 December 2010 (54)Charge for the year (4)Disposals 6Net transfers to property, plant and equipment 6Foreign exchange movements –
At 30 November 2011 (46)
Charge for the year (9)
Disposals –
Net transfers from property, plant and equipment (7)
Foreign exchange movements (3)
At 30 November 2012 (65)
Net book value
At 30 November 2011 896
At 30 November 2012 1,035
The Group holds investment property for long-term use, and so the annual amortisation charge approximates to the amount
expected to be recovered within 12 months after the reporting period.
The Group leases out its investment property under operating leases. The leases typically run for an initial period of one to twelve
years, with an option to renew the lease based on future negotiations. Lease payments are usually negotiated every two years
to reflect market rentals. None of the leases include contingent rentals. Rental income generated from investment properties
amounted to US$97m (2011: US$76m). Direct operating expenses (including repair and maintenance) on investment property that
generates rental income amounted to US$15m (2011: US$9m).
The Group owns investment property in the form of freehold land outside Hong Kong and leasehold land under finance lease. The
Group does not hold freehold land in Hong Kong. An analysis of the carrying value of the Group’s interest in those land and land
use right is set out in note 23.

AD
DIT
ION
AL
INF
OR
MA
TIO
NF
INA
NC
IAL
ST
AT
EM
EN
TS
157
CO
RP
OR
AT
E G
OV
ER
NA
NC
EO
VE
RV
IEW
FIN
AN
CIA
L A
ND
OP
ER
ATI
NG
RE
VIE
W
Notes to the Consolidated Financial Statements and Significant Accounting Policies
16. InvesTmenT properTy (continued)
The future minimum operating lease rental income under non-cancellable operating leases that the Group expects to receive in
future periods may be analysed as follows:
as at 30 november
As at 30 November
US$m 2012 2011
Leases of investment property
Expiring no later than one year 78 55Expiring later than one year and no later than five years 78 97Expiring after five years or more 2 6
Total 158 158
17. faIr value of InvesTmenT properTy and properTy held for use
as at 30 november
As at 30 November
US$m 2012 2011
Carrying value(1)
Investment property 1,035 896Property held for use (classified as property, plant and equipment) 262 252Leasehold land under operating lease (classified as prepayments in other assets) 168 64
Total 1,465 1,212
Fair value(1)
Investment property (including land) 2,773 2,477Property held for use (including land) 1,153 1,054
Total 3,926 3,531
Note:
(1) Carrying and fair values are presented before non-controlling interests and, for assets held in participating funds, before allocation to policyholders.
18. reInsurance asseTs
as at 30 november
As at 30 November
US$m 2012 2011
Amounts recoverable from reinsurers 95 100Ceded insurance and investment contract liabilities 1,058 758
Total 1,153 858

AIA Group Limited Annual Report 2012
158
Notes to the Consolidated Financial Statementsand Significant Accounting Policies
FINANCIAL STATEMENTS
19. deferred acquIsITIon and orIGInaTIon cosTs
as at 30 november
As at 30 November
US$m 2012 2011
Carrying amount
Deferred acquisition costs on insurance contracts 13,484 12,063Deferred origination costs on investment contracts 677 755
Total 14,161 12,818
US$m
year ended 30 november
2012
Year ended 30 November
2011
Movements in the year
At beginning of financial year 12,818 12,006Deferral and amortisation of acquisition costs 1,210 869Foreign exchange movements 356 (24)Impact of assumption changes (11) (12)Other movements (212) (21)
At end of financial year 14,161 12,818
Deferred acquisition and origination costs are expected to be recoverable over the mean term of the Group’s insurance and
investment contracts, and liability adequacy testing is performed at least annually to confirm their recoverability. Accordingly,
the annual amortisation charge, which varies with investment performance for certain universal life and unit-linked products,
approximates to the amount which is expected to be realised within 12 months of the end of the reporting period.
20. fInancIal InvesTmenTs
The following tables analyse the Group’s financial investments by type and nature. The Group manages its financial investments in
two distinct categories: Unit-linked Investments and Policyholder and Shareholder Investments. The investment risk in respect of
Unit-linked Investments is generally wholly borne by our customers, and does not directly affect the profit for the year before tax.
Furthermore, unit-linked contract holders are responsible for allocation of their policy values amongst investment options offered
by the Group. Although profit for the year before tax is not affected by Unit-linked Investments, the investment return from such
financial investments is included in the Group’s profit for the year before tax, as the Group has elected the fair value option for
all Unit-linked Investments with corresponding changes in insurance and investment contract liabilities for unit-linked contracts.
Policyholder and Shareholder Investments include all financial investments other than Unit-linked Investments. The investment risk
in respect of Policyholder and Shareholder Investments is partially or wholly borne by the Group.
Policyholder and Shareholder Investments are further categorised as Participating Funds and Other Policyholder and Shareholder.
The Group has elected to separately analyse financial investments held by Participating Funds within Policyholder and Shareholder
Investments as they are subject to local regulations that generally prescribe a minimum proportion of policyholder participation in
declared dividends. The Group has elected the fair value option for debt and equity securities of Participating Funds. The Group’s
accounting policy is to record an insurance liability for the proportion of net assets of the Participating Fund that would be allocated
to policyholders assuming all performance would be declared as a dividend based upon local regulations as at the date of the
statement of financial position. As a result the Group’s net profit for the year before tax is impacted by the proportion of investment
return that would be allocated to shareholders as described above.

AD
DIT
ION
AL
INF
OR
MA
TIO
NF
INA
NC
IAL
ST
AT
EM
EN
TS
159
CO
RP
OR
AT
E G
OV
ER
NA
NC
EO
VE
RV
IEW
FIN
AN
CIA
L A
ND
OP
ER
ATI
NG
RE
VIE
W
Notes to the Consolidated Financial Statements and Significant Accounting Policies
20. fInancIal InvesTmenTs (continued)
Other Policyholder and Shareholder Investments are distinct from Unit-linked Investments and Participating Funds as there is no
direct contractual or regulatory requirement governing the amount, if any, for allocation to policyholders. The Group has elected
to apply the fair value option for equity securities in this category and the available for sale classification in respect of the majority
of debt securities in this category. The investment risk from investments in this category directly impacts the Group’s financial
statements. Although a proportion of investment return may be allocated to policyholders through policyholder dividends, the
Group’s accounting policy for insurance and certain investment contract liabilities utilises a net level premium methodology that
includes best estimates as at the date of issue for non-guaranteed participation. To the extent investment return from these
investments either is not allocated to participating contracts or varies from the best estimates, it will impact the Group’s profit
before tax.
Inthefollowingtables,“FVTPL”indicatesfinancialinvestmentsclassifiedatfairvaluethroughprofitorlossand“AFS”indicates
financial investments classified as available for sale.
debt securities
In compiling the tables, external ratings have been used where available. Where external ratings are not readily available an internal
rating methodology has been adopted. The following conventions have been adopted to conform the various ratings.
External ratings Standard and Poor’s Moody’s Internal ratings Reported as
AAA Aaa 1 AAAAA+ to AA- Aa1 to Aa3 2+ to 2- AA
A+ to A- A1 to A3 3+ to 3- ABBB+ to BBB- Baa1 to Baa3 4+ to 4- BBB
BB+ and below Ba1 and below 5+ and below Below investment grade(1)
Note:
(1) Unless otherwise identified individually.

AIA Group Limited Annual Report 2012
160
Notes to the Consolidated Financial Statementsand Significant Accounting Policies
FINANCIAL STATEMENTS
20. fInancIal InvesTmenTs (continued)
debt securities (continued)
Debt securities by type comprise the following:
policyholder and shareholder
participating funds
other policyholder and shareholder unit-linked
US$m Rating fvTpl fvTpl afs subtotal fvTpl Total
30 November 2012
Government bonds
– issued in local
currency
Singapore AAA 1,864 – 1,230 3,094 216 3,310
Thailand A – – 10,568 10,568 – 10,568
Philippines BB – – 2,901 2,901 43 2,944
Malaysia A 1,352 – 288 1,640 – 1,640
China AA 407 – 2,325 2,732 – 2,732
Indonesia BB 2 – 870 872 145 1,017
Korea AA – – 3,044 3,044 128 3,172
Other(1) 15 10 406 431 3 434
Subtotal 3,640 10 21,632 25,282 535 25,817
Government bonds
– foreign currency
Mexico BBB 8 19 203 230 2 232
South Africa BBB – 5 180 185 2 187
Philippines BB 7 14 474 495 115 610
Malaysia A 77 – 105 182 2 184
Indonesia BB 68 18 293 379 2 381
Korea A 20 – 232 252 4 256
China AA – – 18 18 2 20
Other(1) 51 135 456 642 7 649
Subtotal 231 191 1,961 2,383 136 2,519
Government agency
bonds(2)
AAA 1,238 – 1,000 2,238 118 2,356
AA 358 – 1,147 1,505 46 1,551
A 433 – 4,731 5,164 24 5,188
BBB 111 – 1,313 1,424 2 1,426
Below investment grade – – 87 87 – 87
Not rated – – – – – –
Subtotal 2,140 – 8,278 10,418 190 10,608
Notes:
(1) Of the total government bonds listed as “Other” at 30 November 2012, 86 per cent are rated as investment grade and a further 11 per cent are rated BB- and above. The balance is rated below BB- or not rated.
(2) Government agency bonds comprise bonds issued by government-sponsored institutions such as national, provincial and municipal authorities; government-related entities; multilateral development banks and supranational organisations.

AD
DIT
ION
AL
INF
OR
MA
TIO
NF
INA
NC
IAL
ST
AT
EM
EN
TS
161
CO
RP
OR
AT
E G
OV
ER
NA
NC
EO
VE
RV
IEW
FIN
AN
CIA
L A
ND
OP
ER
ATI
NG
RE
VIE
W
Notes to the Consolidated Financial Statements and Significant Accounting Policies
20. fInancIal InvesTmenTs (continued)
debt securities (continued)
policyholder and shareholder
participating funds
other policyholder and shareholder unit-linked
US$m fvTpl fvTpl afs subtotal fvTpl Total
30 November 2012
Corporate bonds
AAA 80 – 128 208 16 224
AA 905 38 2,583 3,526 117 3,643
A 3,810 224 13,273 17,307 495 17,802
BBB 4,171 102 12,171 16,444 389 16,833
Below investment grade 455 2 1,349 1,806 48 1,854
Not rated 19 14 87 120 113 233
Subtotal 9,440 380 29,591 39,411 1,178 40,589
Structured securities(3)
AAA 4 – – 4 – 4
AA – – 7 7 – 7
A 43 18 657 718 – 718
BBB 285 – 131 416 3 419
Below investment grade 34 73 – 107 – 107
Not rated 36 25 11 72 2 74
Subtotal 402 116 806 1,324 5 1,329
Total 15,853 697 62,268 78,818 2,044 80,862
Notes:
(3) Structured securities include collateralised debt obligations, mortgage-backed securities and other asset-backed securities.
(4) Debt securities of US$1,967m are restricted due to local regulatory requirements or other pledge restrictions.

AIA Group Limited Annual Report 2012
162
Notes to the Consolidated Financial Statementsand Significant Accounting Policies
FINANCIAL STATEMENTS
20. fInancIal InvesTmenTs (continued)
debt securities (continued)Policyholder and shareholder
Participating funds
Other policyholder and shareholder Unit-linked
US$m Rating FVTPL FVTPL AFS Subtotal FVTPL Total
30 November 2011
Government bonds
– issued in local
currency
Singapore AAA 1,486 – 1,004 2,490 116 2,606Thailand A – – 9,702 9,702 – 9,702Philippines BB – 1 2,347 2,348 33 2,381Malaysia A 1,514 – 307 1,821 15 1,836China AA 407 – 1,495 1,902 31 1,933Indonesia BB – – 760 760 142 902Korea A – – 2,361 2,361 78 2,439Other(1) 20 13 321 354 – 354
Subtotal 3,427 14 18,297 21,738 415 22,153
Government bonds
– foreign currency
Mexico BBB 7 15 184 206 2 208South Africa BBB – 7 194 201 2 203Philippines BB – 11 430 441 105 546Malaysia A 76 – 102 178 2 180Indonesia BB 61 13 221 295 2 297Korea A 18 – 242 260 4 264China AA – – 15 15 2 17Other(1) 48 148 442 638 19 657
Subtotal 210 194 1,830 2,234 138 2,372
Government agency
bonds(2)
AAA 1,100 – 998 2,098 117 2,215AA 4 – 250 254 – 254A 772 – 4,389 5,161 209 5,370BBB 127 – 1,324 1,451 1 1,452Below investment grade – 3 80 83 – 83Not rated – – – – – –
Subtotal 2,003 3 7,041 9,047 327 9,374
Notes:
(1) Of the total government bonds listed as “Other” at 30 November 2011, 88 per cent are rated as investment grade and a further 8 per cent are rated BB- and above. The balance is rated below BB- or not rated.
(2) Government agency bonds comprise bonds issued by government-sponsored institutions such as national, provincial and municipal authorities; government-related entities; multilateral development banks and supranational organisations.

AD
DIT
ION
AL
INF
OR
MA
TIO
NF
INA
NC
IAL
ST
AT
EM
EN
TS
163
CO
RP
OR
AT
E G
OV
ER
NA
NC
EO
VE
RV
IEW
FIN
AN
CIA
L A
ND
OP
ER
ATI
NG
RE
VIE
W
Notes to the Consolidated Financial Statements and Significant Accounting Policies
20. fInancIal InvesTmenTs (continued)
debt securities (continued)Policyholder and shareholder
Participating funds
Other policyholder and shareholder Unit-linked
US$m FVTPL FVTPL AFS Subtotal FVTPL Total
30 November 2011
Corporate bonds
AAA 7 – 226 233 114 347AA 1,206 67 2,332 3,605 195 3,800A 3,133 123 10,978 14,234 673 14,907BBB 2,997 303 8,301 11,601 245 11,846Below investment grade 378 2 1,344 1,724 68 1,792Not rated 6 9 37 52 208 260
Subtotal 7,727 504 23,218 31,449 1,503 32,952
Structured securities(3)
AAA – 17 – 17 – 17AA 4 – – 4 – 4A 20 – 515 535 – 535BBB 286 – 93 379 6 385Below investment grade 49 74 17 140 – 140Not rated 11 – 7 18 2 20
Subtotal 370 91 632 1,093 8 1,101
Total 13,737 806 51,018 65,561 2,391 67,952
Notes:
(3) Structured securities include collateralised debt obligations, mortgage-backed securities and other asset-backed securities.
(4) Debt securities of US$3,248m are restricted due to local regulatory requirements or other pledge restrictions.
The Group’s debt securities classified at fair value through profit or loss can be analysed as follows:
as at 30 november
As at 30 November
US$m 2012 2011
Debt securities – FVTPL
Designated at fair value through profit or loss 18,545 16,934Held for trading 49 –
Total 18,594 16,934

AIA Group Limited Annual Report 2012
164
Notes to the Consolidated Financial Statementsand Significant Accounting Policies
FINANCIAL STATEMENTS
20. fInancIal InvesTmenTs (continued)
equity securities
Equity securities by type comprise the following:
policyholder and shareholder
participating funds
other policyholder
and shareholder unit-linked
Third-party interest
US$m fvTpl fvTpl subtotal fvTpl fvTpl Total
30 November 2012
Ordinary shares 2,246 4,708 6,954 3,077 – 10,031
Interests in investment funds 1,288 948 2,236 11,157 232 13,625
Total 3,534 5,656 9,190 14,234 232 23,656
Policyholder and shareholder
Participating funds
Other policyholder
and shareholder Unit-linked
Third-party interest
US$m FVTPL FVTPL Subtotal FVTPL FVTPL Total
30 November 2011
Ordinary shares 1,972 3,216 5,188 2,625 – 7,813Interests in investment funds 805 1,172 1,977 8,963 259 11,199
Total 2,777 4,388 7,165 11,588 259 19,012
debt and equity securities
as at 30 november
As at 30 November
US$m 2012 2011
Debt securities
ListedHong Kong 3,345 1,877Overseas 55,051 43,228
58,396 45,105Unlisted 22,466 22,847
Total 80,862 67,952
Equity securities
ListedHong Kong 815 276Overseas 10,749 8,373
11,564 8,649Unlisted 12,092 10,363
Total 23,656 19,012

AD
DIT
ION
AL
INF
OR
MA
TIO
NF
INA
NC
IAL
ST
AT
EM
EN
TS
165
CO
RP
OR
AT
E G
OV
ER
NA
NC
EO
VE
RV
IEW
FIN
AN
CIA
L A
ND
OP
ER
ATI
NG
RE
VIE
W
Notes to the Consolidated Financial Statements and Significant Accounting Policies
20. fInancIal InvesTmenTs (continued)
loans and deposits
as at 30 november
As at 30 November
US$m 2012 2011
Policy loans 1,998 1,837Mortgage loans on residential real estate 433 427Mortgage loans on commercial real estate 16 17Other loans 674 683Allowance for loan losses (7) (21)
Loans 3,114 2,943Term deposits 1,632 1,334Promissory notes(1) 1,679 288
Total 6,425 4,565
Note:
(1) The promissory notes are issued by government.
Certain term deposits with financial institutions and promissory notes are restricted due to local regulatory requirements or other
pledge restrictions. The restricted balance held within term deposits and promissory notes is US$1,073m (2011: US$130m).
21. derIvaTIve fInancIal InsTrumenTs
The Group’s non-hedge derivative exposure was as follows:
fair value
US$m notional amount assets liabilities
30 November 2012Foreign exchange contracts
Forwards 5,038 15 –Cross-currency swaps 8,371 596 (41)Currency options 26 – –
Total foreign exchange contracts 13,435 611 (41)Interest rate contracts
Interest rate swaps 666 18 –Other
Warrants and options 125 9 –Equity index futures 183 – –
Netting (183) – –
Total 14,226 638 (41)
30 November 2011Foreign exchange contracts
Forwards 846 1 (8)Cross-currency swaps 8,875 706 (30)Currency options 7 – –
Total foreign exchange contracts 9,728 707 (38)Interest rate contracts
Interest rate swaps 1,114 14 –Other
Warrants and options 81 4 –Credit default swap 59 – –
Total 10,982 725 (38)

AIA Group Limited Annual Report 2012
166
Notes to the Consolidated Financial Statementsand Significant Accounting Policies
FINANCIAL STATEMENTS
21. derIvaTIve fInancIal InsTrumenTs (continued)
Both pay and receive legs of the transaction have been disclosed in the column “notional amount”.
Of the total derivatives, US$3m (2011: US$1m) are listed in exchange or dealer markets and the rest are over-the-counter (OTC)
derivatives. OTC derivative contracts are individually negotiated between contracting parties and include forwards and swaps.
Derivatives are subject to various risks including market, liquidity and credit risk, similar to those related to the underlying financial
instruments.
Derivative assets and derivative liabilities are recognised in the consolidated statement of financial position as financial assets
at fair value through profit or loss and derivative financial liabilities respectively. The Group does not employ hedge accounting,
although most of its derivative holdings may have the effect of an economic hedge of other exposures. The notional or contractual
amounts associated with derivative financial instruments are not recorded as assets or liabilities in the consolidated statement of
financial position as they do not represent the fair value of these transactions. The notional amounts in the previous table reflect the
aggregate of individual derivative positions on a gross basis and so give an indication of the overall scale of derivative transactions.
foreign exchange contracts
Forward exchange contracts represent agreements to exchange the currency of one country for the currency of another country
at an agreed price and settlement date. Currency options are agreements that give the buyer the right to exchange the currency
of one country for the currency of another country at agreed prices and settlement dates. Currency swaps are contractual
agreements that involve the exchange of both periodic and final amounts in two different currencies. Exposure to gain and loss
on the foreign exchange contracts will increase or decrease over their respective lives as a function of maturity dates, interest and
foreign exchange rates, implied volatilities of the underlying indices, and the timing of payments.
Interest rate swaps
Interest rate swaps are contractual agreements between two parties to exchange periodic payments in the same currency, each
of which is computed on a different interest rate basis, on a specified notional amount. Most interest rate swaps involve the net
exchange of payments calculated as the difference between the fixed and floating rate interest payments.
other derivatives
Warrants and options are option agreements that give the owner the right to buy or sell securities at an agreed price and
settlement date. Credit default swaps (CDS) represent agreements that allow the transfer of third-party credit risk from the
protection buyer to the seller. The Group purchased the CDS as a protection on the specific corporate debt portfolio by making
a series of payments to the seller of the CDS. The Group will be compensated if the reference corporate debt defaults during the
CDS contract period. Equity index futures contracts are exchange-traded cash-settled contracts on the value of particular stock
market index. The Group entered into equity index futures contracts to manage its equity market exposure. The netting adjustment
is related to futures contracts executed through clearing house where the settlement arrangement satisfied the IFRS netting
criteria.
collateral and pledges under derivative transactions
At 30 November 2012, the Group had pledged debt securities with carrying value of US$12m (2011: nil) for liabilities and held
cash collateral of US$321m (2011: nil) in respect of over-the-counter derivative transactions. These transactions are conducted
under terms that are usual and customary to collateralised transactions including, where relevant, standard securities lending and
repurchase agreement.
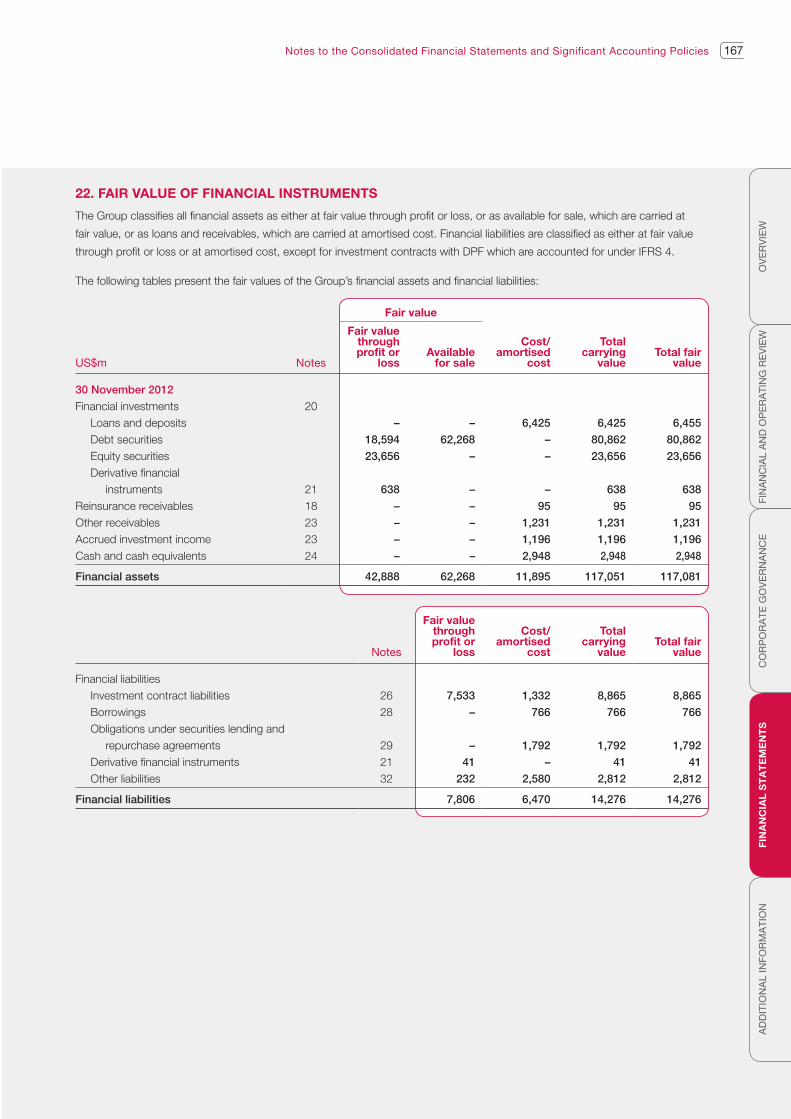
AD
DIT
ION
AL
INF
OR
MA
TIO
NF
INA
NC
IAL
ST
AT
EM
EN
TS
167
CO
RP
OR
AT
E G
OV
ER
NA
NC
EO
VE
RV
IEW
FIN
AN
CIA
L A
ND
OP
ER
ATI
NG
RE
VIE
W
Notes to the Consolidated Financial Statements and Significant Accounting Policies
22. faIr value of fInancIal InsTrumenTs
The Group classifies all financial assets as either at fair value through profit or loss, or as available for sale, which are carried at
fair value, or as loans and receivables, which are carried at amortised cost. Financial liabilities are classified as either at fair value
through profit or loss or at amortised cost, except for investment contracts with DPF which are accounted for under IFRS 4.
The following tables present the fair values of the Group’s financial assets and financial liabilities:
fair value
US$m Notes
fair value through profit or
lossavailable
for sale
cost/ amortised
cost
Total carrying
valueTotal fair
value
30 November 2012
Financial investments 20Loans and deposits – – 6,425 6,425 6,455
Debt securities 18,594 62,268 – 80,862 80,862
Equity securities 23,656 – – 23,656 23,656
Derivative financial instruments 21 638 – – 638 638
Reinsurance receivables 18 – – 95 95 95
Other receivables 23 – – 1,231 1,231 1,231
Accrued investment income 23 – – 1,196 1,196 1,196
Cash and cash equivalents 24 – – 2,948 2,948 2,948
Financial assets 42,888 62,268 11,895 117,051 117,081
Notes
fair value through profit or
loss
cost/amortised
cost
Total carrying
valueTotal fair
value
Financial liabilitiesInvestment contract liabilities 26 7,533 1,332 8,865 8,865
Borrowings 28 – 766 766 766
Obligations under securities lending and repurchase agreements 29 – 1,792 1,792 1,792
Derivative financial instruments 21 41 – 41 41
Other liabilities 32 232 2,580 2,812 2,812
Financial liabilities 7,806 6,470 14,276 14,276

AIA Group Limited Annual Report 2012
168
Notes to the Consolidated Financial Statementsand Significant Accounting Policies
FINANCIAL STATEMENTS
22. faIr value of fInancIal InsTrumenTs (continued)
Fair value
US$m Notes
Fair value through profit or
lossAvailable
for sale
Cost/ amortised
cost
Total carrying
valueTotal fair
value
30 November 2011
Financial investments 20Loans and deposits – – 4,565 4,565 4,590Debt securities 16,934 51,018 – 67,952 67,952Equity securities 19,012 – – 19,012 19,012Derivative financial
instruments 21 725 – – 725 725Reinsurance receivables 18 – – 100 100 100Other receivables 23 – – 1,298 1,298 1,298Accrued investment income 23 – – 1,046 1,046 1,046Cash and cash equivalents 24 – – 4,303 4,303 4,303
Financial assets 36,671 51,018 11,312 99,001 99,026
Notes
Fair value through
profit or loss
Cost/ amortised
cost
Total carrying
valueTotal fair
value
Financial liabilitiesInvestment contract liabilities 26 7,048 1,312 8,360 8,360Borrowings 28 – 559 559 559Obligations under securities lending
and repurchase agreements 29 – 670 670 670Derivative financial instruments 21 38 – 38 38Other liabilities 32 259 2,128 2,387 2,387
Financial liabilities 7,345 4,669 12,014 12,014
The carrying amount of assets included in the above tables represents the maximum credit exposure.
Foreign currency exposure, including the net notional amount of foreign currency derivative positions, is shown in note 36 for the
Group’s key foreign exchange exposures.
The fair value of investment contract liabilities measured at amortised cost is not considered to be materially different from the
amortised cost carrying value.
The carrying value of financial instruments expected to be settled within 12 months (after taking into account valuation allowances,
where applicable) is not considered to be materially different from the fair value.

AD
DIT
ION
AL
INF
OR
MA
TIO
NF
INA
NC
IAL
ST
AT
EM
EN
TS
169
CO
RP
OR
AT
E G
OV
ER
NA
NC
EO
VE
RV
IEW
FIN
AN
CIA
L A
ND
OP
ER
ATI
NG
RE
VIE
W
Notes to the Consolidated Financial Statements and Significant Accounting Policies
22. faIr value of fInancIal InsTrumenTs (continued)
fair value measurements on a recurring basis
The Group measures at fair value financial instruments classified at fair value through profit or loss, available for sale securities
portfolios, derivative assets and liabilities, investments held by investment funds which are consolidated, investments in non-
consolidated investment funds and certain investment contract liabilities on a recurring basis. The fair value of a financial instrument
is the amount that would be received on sale of an asset or paid to transfer a liability in an orderly transaction between market
participants at the measurement date.
The degree of judgment used in measuring the fair value of financial instruments generally correlates with the level of pricing
observability. Financial instruments with quoted prices in active markets generally have more pricing observability and less
judgment is used in measuring fair value. Conversely, financial instruments traded in other than active markets or that do not have
quoted prices have less observability and are measured at fair value using valuation models or other pricing techniques that require
more judgment. An active market is one in which transactions for the asset or liability being valued occur with sufficient frequency
and volume to provide pricing information on an ongoing basis.
An other than active market is one in which there are few transactions, the prices are not current, price quotations vary substantially
either over time or among market makers, or in which little information is released publicly for the asset or liability being valued.
Pricing observability is affected by a number of factors, including the type of financial instrument, whether the financial instrument
is new to the market and not yet established, the characteristics specific to the transaction and general market conditions.
The following methods and assumptions were used by the Group to estimate the fair value of financial instruments.
financial assets and liabilities
loans and receivables
For loans and advances that are repriced frequently and have had no significant changes in credit risk, carrying amounts represent
a reasonable estimate of fair values. The fair values of other loans are estimated by discounting expected future cash flows using
interest rates offered for similar loans to borrowers with similar credit ratings.
The fair values of mortgage loans are estimated by discounting future cash flows using interest rates currently being offered
in respect of similar loans to borrowers with similar credit ratings. The fair values of fixed rate policy loans are estimated by
discounting cash flows at the interest rates charged on policy loans of similar policies currently being issued. Loans with similar
characteristics are aggregated for purposes of the calculations. The carrying values of policy loans with variable rates approximate
to their fair value.
debt securities and equity securities
The fair values of equity securities are based on quoted market prices or, if unquoted, on estimated market values generally based
on quoted prices for similar securities. Fair values for fixed interest securities are based on quoted market prices, where available.
For those securities not actively traded, fair values are estimated using values obtained from brokers, private pricing services or
by discounting expected future cash flows using a current market rate applicable to the yield, credit quality and maturity of the
investment. Priority is given to values from independent sources when available, but overall the source of pricing and/or valuation
technique is chosen with the objective of arriving at the price at which an orderly transaction would take place between market
participants on the measurement date. The inputs to determining fair value that are relevant to fixed interest securities include, but
not limited to risk-free interest rates, the obligor’s credit spreads, foreign exchange rates, and credit default rates. For holdings in
hedge funds and limited partnerships, fair values are determined based on the net asset values provided by the general partner or
manager of each investment, the accounts of which are generally audited on an annual basis. The transaction price is used as the
best estimate of fair value at inception.

AIA Group Limited Annual Report 2012
170
Notes to the Consolidated Financial Statementsand Significant Accounting Policies
FINANCIAL STATEMENTS
22. faIr value of fInancIal InsTrumenTs (continued)
financial assets and liabilities (continued)
derivative financial instruments
The Group values its derivative financial assets and liabilities using market transactions and other market evidence whenever
possible, including market-based inputs to models, model calibration to market clearing transactions, broker or dealer quotations
or alternative pricing sources with reasonable levels of price transparency. When models are used, the selection of a particular
model to value a derivative depends on the contract terms of, and specific risks inherent in, the instrument as well as the availability
ofpricinginformationinthemarket.TheGroupgenerallyusessimilarmodelstovaluesimilarinstruments.Valuationmodels
require a variety of inputs, including contractual terms, market prices and rates, yield curves, credit curves, measures of volatility,
prepayment rates and correlations of such inputs. For derivatives that trade in liquid markets, such as generic forwards, swaps
and options, model inputs can generally be verified and model selection does not involve significant management judgment.
Examples of inputs that are generally observable include foreign exchange spot and forward rates, benchmark interest rate curves
and volatilities for commonly traded option products. Examples of inputs that may be unobservable include volatilities for less
commonly traded option products and correlations between market factors.
cash and cash equivalents
The carrying amount of cash approximates its fair value.
reinsurance receivables
The carrying amount of amounts receivable from reinsurers is not considered materially different to their fair value.
fair value of securities sold under repurchase agreement and the associated payables
The contract values of payables under repurchase agreements approximate their fair value as these obligations are short-term in
nature.
other assets
The carrying amount of other assets is not materially different to their fair value. The fair values of deposits with banks are generally
based on quoted market prices or, if unquoted, on estimates based on discounting future cash flows using available market
interest rates offered for receivables with similar characteristics.
Investment contract liabilities
For investment contract liabilities, the fair values have been estimated using a discounted cash flow approach based on interest
rates currently being offered for similar contracts with maturities consistent with those remaining for the contracts being valued. For
investment contracts where the investment risk is borne by the policyholder, the fair value generally approximates to the fair value
of the underlying assets.
Investment contracts with DPF enable the contract holder to receive additional benefits as a supplement to guaranteed benefits.
These are referred to as participating business and are measured and classified according to the Group practice for insurance
contract liabilities and hence are disclosed within note 25. These are not measured at fair value as there is currently no agreed
definition of fair value for investment and insurance contracts with DPF under IFRS. In the absence of any agreed methodology, it
is not possible to provide a range of estimates within which fair value is likely to fall. The IASB is expecting to address this issue in
Phase II of its insurance contracts project.
borrowings
The fair values of borrowings with stated maturities have been estimated based on discounting future cash flows using the interest
rates currently applicable to deposits of similar maturities.

AD
DIT
ION
AL
INF
OR
MA
TIO
NF
INA
NC
IAL
ST
AT
EM
EN
TS
171
CO
RP
OR
AT
E G
OV
ER
NA
NC
EO
VE
RV
IEW
FIN
AN
CIA
L A
ND
OP
ER
ATI
NG
RE
VIE
W
Notes to the Consolidated Financial Statements and Significant Accounting Policies
22. faIr value of fInancIal InsTrumenTs (continued)
financial assets and liabilities (continued)
other liabilities
The fair values of other unquoted liabilities is estimated by discounting expected future cash flows using current market rates
applicable to their yield, credit quality and maturity, except for those with no stated maturity, where the carrying value approximates
to fair value.
fair value hierarchy
Assets and liabilities recorded at fair value in the consolidated statement of financial position are measured and classified in a
hierarchy for disclosure purposes consisting of three “levels” based on the observability of inputs available in the market place used
to measure their fair values as discussed below:
• Level 1: Fair value measurements that are quoted prices (unadjusted) in active markets for identical assets or liabilities that the
Group has the ability to access as of the measurement date. Market price data is generally obtained from exchange or dealer
markets. The Group does not adjust the quoted price for such instruments. Assets measured at fair value on a recurring basis
and classified as Level 1 are actively traded listed equities. The Group considers that government debt securities issued by
G7countries(UnitedStates,Canada,France,Germany,Italy,Japan,theUnitedKingdom)andtradedinadealermarkettobe
Level 1, until they no longer trade with sufficient frequency and volume to be considered actively traded.
• Level 2: Fair value measurements based on inputs other than quoted prices included in Level 1 that are observable for the
asset or liability, either directly (as prices) or indirectly (derived from prices). Level 2 inputs include quoted prices for similar
assets and liabilities in active markets, quoted prices for identical or similar assets or liabilities in markets that are not active
and inputs other than quoted prices that are observable for the asset and liability, such as interest rates and yield curves that
are observable at commonly quoted intervals. Assets and liabilities measured at fair value on a recurring basis and classified as
Level 2 generally include government securities issued by non-G7 countries, most investment grade corporate bonds, hedge
fund investments and derivative contracts.
• Level 3: Fair value measurements based on valuation techniques that use significant inputs that are unobservable.
Unobservable inputs are only used to measure fair value to the extent that relevant observable inputs are not available, allowing
for circumstances in which there is little, if any, market activity for the asset or liability. Assets and liabilities measured at fair
value on a recurring basis and classified as Level 3 include certain classes of structured securities, certain derivative contracts,
private equity and real estate fund investments, and direct private equity investments.
In certain cases, the inputs used to measure fair value may fall into different levels of the fair value hierarchy. In such cases, the
level in the fair value hierarchy within which the fair value measurement in its entirety falls is determined based on the lowest level
input that is significant to the fair value measurement in its entirety. The Group’s assessment of the significance of a particular input
to the fair value measurement in its entirety requires judgment. In making the assessment, the Group considers factors specific to
the asset or liability.

AIA Group Limited Annual Report 2012
172
Notes to the Consolidated Financial Statementsand Significant Accounting Policies
FINANCIAL STATEMENTS
22. faIr value of fInancIal InsTrumenTs (continued)
fair value hierarchy (continued)
A summary of investments carried at fair value according to fair value hierarchy is given below:
fair value hierarchy
US$m level 1 level 2 level 3 Total
30 November 2012
Financial assets
Available for saleDebt securities – 61,750 518 62,268
At fair value through profit or lossDebt securities
Participating funds – 15,544 309 15,853
Unit-linked – 1,757 287 2,044
Other policyholder and shareholder – 474 223 697
Equity securitiesParticipating funds 3,331 72 131 3,534
Unit-linked 12,700 1,534 – 14,234
Other policyholder and shareholder 5,461 152 275 5,888
Derivative financial instruments 3 631 4 638
Total 21,495 81,914 1,747 105,156
Total % 20.4 77.9 1.7 100.0
Financial liabilities
Investment contract liabilities – – 7,533 7,533
Derivative financial instruments – 41 – 41
Other liabilities 232 – – 232
Total 232 41 7,533 7,806
Total % 3.0 0.5 96.5 100.0

AD
DIT
ION
AL
INF
OR
MA
TIO
NF
INA
NC
IAL
ST
AT
EM
EN
TS
173
CO
RP
OR
AT
E G
OV
ER
NA
NC
EO
VE
RV
IEW
FIN
AN
CIA
L A
ND
OP
ER
ATI
NG
RE
VIE
W
Notes to the Consolidated Financial Statements and Significant Accounting Policies
22. faIr value of fInancIal InsTrumenTs (continued)
fair value hierarchy (continued)Fair value hierarchy
US$m Level 1 Level 2 Level 3 Total
30 November 2011
Financial assets
Available for saleDebt securities – 50,651 367 51,018
At fair value through profit or lossDebt securities
Participating funds – 13,574 163 13,737Unit-linked – 2,217 174 2,391Other policyholder and
shareholder – 649 157 806Equity securities
Participating funds 2,562 70 145 2,777Unit-linked 10,404 1,184 – 11,588Other policyholder and
shareholder 4,254 163 230 4,647Derivative financial instruments 1 723 1 725
Total 17,221 69,231 1,237 87,689Total % 19.6 79.0 1.4 100.0
Financial liabilities
Investment contract liabilities – – 7,048 7,048Derivative financial instruments – 38 – 38Other liabilities 259 – – 259
Total 259 38 7,048 7,345Total % 3.5 0.5 96.0 100.0

AIA Group Limited Annual Report 2012
174
Notes to the Consolidated Financial Statementsand Significant Accounting Policies
FINANCIAL STATEMENTS
22. faIr value of fInancIal InsTrumenTs (continued)
fair value hierarchy (continued)
The tables below set out a summary of changes in the Group’s Level 3 financial assets and liabilities for the year ended 30 November 2012 and 2011. The tables reflect gains and losses, including gains and losses on financial assets and liabilities categorised as Level 3 as at 30 November 2012 and 2011.
level 3 financial assets and liabilities
US$mdebt
securitiesequity
securities
derivative financial
assets
derivative financial liabilities
Investment contracts
At 1 December 2011 861 375 1 – (7,048)Realised gains/(losses) 34 (1) – – –Net movement on investment contract
liabilities – – – – (485)Total gains/(losses) relating to instruments
still held at the reporting date Reported in the consolidated
income statement 100 (12) 1 – – Reported in the consolidated
statement of comprehensive income 41 12 – – –Purchases 517 73 3 – –Sales (18) (33) – – –Settlements (78) (1) – – –Transfer into Level 3 88 4 – – –Transfer out of Level 3 (208) (11) (1) – –
At 30 November 2012 1,337 406 4 – (7,533)
US$mDebt
securitiesEquity
securities
Derivative financial
assets
Derivative financial liabilities
Investment contracts
At 1 December 2010 845 288 1 – (7,786)Realised gains 12 2 1 – –Net movement on investment contract
liabilities – – – – 738Total gains/(losses) relating to instruments
still held at the reporting date Reported in the consolidated
income statement 41 14 (1) (1) – Reported in the consolidated
statement of comprehensive income (4) (3) – – –Purchases 299 80 1 1 –Sales (157) (22) (1) – –Settlements (67) – – – –Transfer into Level 3 7 83 – – –Transfer out of Level 3 (115) (67) – – –
At 30 November 2011 861 375 1 – (7,048)
Realised gains and losses arising from the disposal of the Group’s Level 3 financial assets and liabilities are presented in the consolidated income statement.
Movements in investment contract liabilities at fair value are offset by movements in the underlying portfolio of matching assets. Details of the movement in investment contract liabilities are provided in note 26.
There are no differences between the fair values on initial recognition and the amounts determined using valuation techniques since the models adopted are calibrated using initial transaction prices.
During the year, there were no material transfers between Level 1 and Level 2 fair value measurements.

AD
DIT
ION
AL
INF
OR
MA
TIO
NF
INA
NC
IAL
ST
AT
EM
EN
TS
175
CO
RP
OR
AT
E G
OV
ER
NA
NC
EO
VE
RV
IEW
FIN
AN
CIA
L A
ND
OP
ER
ATI
NG
RE
VIE
W
Notes to the Consolidated Financial Statements and Significant Accounting Policies
23. oTher asseTs
as at 30 november
As at 30 November
US$m 2012 2011
PrepaymentsOperating leases of leasehold land 168 64Other 129 171
Accrued investment income 1,196 1,046Pension scheme assets
Defined benefit pension scheme surpluses (note 37) 11 9Insurance receivables
Due from insurance and investment contract holders 725 684Due from agents, brokers and intermediaries 38 71
Receivables from sales of investments 80 101Other receivables 388 442
Total 2,735 2,588
All amounts other than prepayments in respect of operating leases of leasehold land are expected to be recovered within 12
months after the end of the reporting period. Prepayments in respect of operating leases of land are expected to be recovered
over the period of the leases shown below.
Receivables include receivables from reverse repurchase agreements under which the Group does not take physical possession of
securities purchased under the agreements. Sales or transfers of securities are not permitted by the respective clearing house on
which they are registered while the loan is outstanding. In the event of default by the counterparty to repay the loan, the Group has
the right to the underlying securities held by the clearing house. At 30 November 2012, the carrying value of such receivables is
US$64m (2011: US$156m).
Below sets out an analysis of the Group’s interest in land and land use rights:
as at 30 november 2012 As at 30 November 2011
US$m
property, plant and
equipmentInvestment
property
prepayments of operating
leases Total
Property, plant and
equipmentInvestment
property
Prepayments of operating
leases Total
Land held in Hong Kong
Long-term leases (>50 years) 43 590 – 633 43 589 – 632
Medium-term leases (10 to 50 years) – – – – – – – –
Short-term leases (<10 years) – – – – – – – –
Land held outside Hong Kong
Freehold 81 114 – 195 77 112 – 189Long-term leases
(>50 years) 1 – 58 59 – 1 56 57Medium-term leases
(10 to 50 years) – – 110 110 – 1 8 9Short-term leases
(<10 years) – – – – – 4 – 4
Total 125 704 168 997 120 707 64 891

AIA Group Limited Annual Report 2012
176
Notes to the Consolidated Financial Statementsand Significant Accounting Policies
FINANCIAL STATEMENTS
24. cash and cash equIvalenTs
as at 30 november
As at 30 November
US$m 2012 2011
Cash 1,581 1,636
Cash equivalents 1,367 2,667
Total(1) 2,948 4,303
Note:
(1) Of cash and cash equivalents, US$735m (2011: US$788m) are held to back unit-linked contracts.
Cash comprises cash at bank and cash in hand. Cash equivalents comprise bank deposits and highly liquid short-term
investments with maturities at acquisition of three months or less and money market funds. Accordingly, all such amounts are
expected to be realised within 12 months after the reporting period.
25. Insurance conTracT lIabIlITIes
year ended 30 november
Year ended 30 November
US$m 2012 2011
At beginning of financial year 78,752 73,205
Valuationpremiumsanddeposits(1) 15,213 12,846
Liabilities released for policy termination or other policy
benefits paid and related expenses(1) (9,906) (8,746)
Fees from account balances (702) (617)
Accretion of interest 2,875 2,617
Foreign exchange movements 2,620 131
Change in net asset values attributable to policyholders 1,728 (560)
Other movements (6) (124)
At end of financial year 90,574 78,752
Note:
(1) ValuationpremiumsanddepositsandliabilitiesreleasedforpolicyterminationorotherpolicybenefitspaidandrelatedexpenseshavebeengrossedupbyUS$958m in 2011 to conform to the current year presentation of movement in deferred profit liabilities.

AD
DIT
ION
AL
INF
OR
MA
TIO
NF
INA
NC
IAL
ST
AT
EM
EN
TS
177
CO
RP
OR
AT
E G
OV
ER
NA
NC
EO
VE
RV
IEW
FIN
AN
CIA
L A
ND
OP
ER
ATI
NG
RE
VIE
W
Notes to the Consolidated Financial Statements and Significant Accounting Policies
25. Insurance conTracT lIabIlITIes (continued)
business description
The table below summarises the key variables on which insurance and investment contract cash flows depend.
Type of contract Material terms and conditionsNature of benefits and compensation for claims
Factors affecting contract cash flows
Key reportable segments
Traditional participating life assurance with DPF
Participating funds
Participating products combine protection with a savings element. The basic sum assured, payable on death or maturity, may be enhanced by dividends, the aggregate amount of which is determined by the performance of a distinct fund of assets and liabilities. The timing of dividend declarations is at the discretion of the insurer. Local regulations generally prescribe a minimum proportion of policyholder participation in declared dividends
Minimum guaranteed benefits may be enhanced based on investment experience and other considerations
• Investmentperformance
• Expenses• Mortality• Surrenders
Singapore, China, Malaysia
Other participating business
Participating products combine protection with a savings element. The basic sum assured, payable on death or maturity, may be enhanced by dividends, the timing or amount of which is at the discretion of the insurer taking into account factors such as investment experience
Minimum guaranteed benefits may be enhanced based on investment experience and other considerations
• Investmentperformance
• Expenses• Mortality• Surrenders
Hong Kong, Thailand, Other Markets
Traditional non-participating life Benefits paid on death, maturity, sickness or disability that are fixed and guaranteed and not at the discretion of the insurer
Benefits, defined in the insurance contract, are determined by the contract and are not affected by investment performance or the performance of the contract as a whole
• Mortality• Morbidity• Lapses• Expenses
All(1)
Accident and health These products provide morbidity or sickness benefits and include health, disability, critical illness and accident cover
Benefits, defined in the insurance contract, are determined by the contract and are not affected by investment performance or the performance of the contract as a whole
• Mortality• Morbidity• Lapses• Expenses• Claims
experience
All(1)
Unit-linked Unit-linked contracts combine savings with protection, the cash value of the policy depending on the value of unitised funds
Benefits are based on the value of the unitised funds and death benefits
• Investmentperformance
• Lapses• Expenses• Mortality
All(1)
Universal life The customer pays flexible premiums subject to specified limits accumulated in an account balance which are credited with interest at a rate set by the insurer, and a death benefit which may be varied by the customer
Benefits are based on the account balance and death benefit
• Investmentperformance
• Creditingrates
• Lapses• Expenses• Mortality
All(1)
Note:
(1) Other than the Group Corporate Centre segment.

AIA Group Limited Annual Report 2012
178
Notes to the Consolidated Financial Statementsand Significant Accounting Policies
FINANCIAL STATEMENTS
25. Insurance conTracT lIabIlITIes (continued)
methodology and assumptions
The most significant items to which profit for the year and shareholders’ equity are sensitive are market, insurance and lapse risks
which are shown in the table below. Indirect exposure indicates that there is a second order impact. For example, whilst the profit
for the year attributable to shareholders is not directly affected by investment income earned where the investment risk is borne by
policyholders (for example, in respect of unit-linked contracts), there is a second-order effect through the investment management
fees which the Group earns by managing such investments. The distinction between direct and indirect exposure is not intended
to indicate the relative sensitivity to each of these items. Where the direct exposure is shown as being “net neutral”, this is because
the exposure to market and credit risk is offset by a corresponding movement in insurance contract liabilities.
Market and credit risk
Direct exposure
Type of contract
Insurance and investment contract liabilities
Risks associated with related investment portfolio Indirect exposure
Significant insurance and lapse risks
Traditional participating life assurance with DPF
Participating funds
•Netneutralexceptforthe insurer’s share of participating investment performance
•Guarantees
•Netneutralexceptforthe insurer’s share of participating investment performance
•Guarantees
•Investmentperformance subject to smoothing through dividend declarations
•Impactofpersistencyonfuture dividends
•Mortality
Other participating business
•Netneutralexceptforthe insurer’s share of participating investment performance
•Guarantees
•Netneutralexceptforthe insurer’s share of participating investment performance
•Guarantees
•Investmentperformance
•Impactofpersistencyonfuture dividends
•Mortality
Traditional non-participating life assurance
•Investmentperformance
•Creditrisk•Asset-liability
mismatch risk
•Guarantees•Asset-liability
mismatch risk
•Notapplicable •Mortality•Persistency•Morbidity
Accident and health •Lossratio•Asset-liability
mismatch risk
•Investmentperformance
•Creditrisk•Asset-liability
mismatch risk
•Notapplicable •Claimsexperience•Morbidity•Persistency
Pension •Netneutral•Asset-liability
mismatch risk
•Netneutral•Asset-liability
mismatch risk
•Performance-related investment management fees
•Persistency
Unit-linked •Netneutral •Netneutral •Performance-relatedinvestment management fees
•Persistency•Mortality
Universal life •Guarantees•Asset-liability
mismatch risk
•Investmentperformance
•Creditrisk•Asset-liability
mismatch risk
•Spreadbetweenearnedrate and crediting rate to policyholders
•Mortality•Persistency•Withdrawals
The Group is also exposed to currency risk in respect of its operations, and to interest rate risk, credit risk and equity price risk
on assets representing net shareholders’ equity, and to expense risk to the extent that actual expenses exceed those that can be
charged to insurance and investment contract holders on non-participating business. Expense assumptions applied in the Group’s
actuarial valuation models assume a continuing level of business volumes.

AD
DIT
ION
AL
INF
OR
MA
TIO
NF
INA
NC
IAL
ST
AT
EM
EN
TS
179
CO
RP
OR
AT
E G
OV
ER
NA
NC
EO
VE
RV
IEW
FIN
AN
CIA
L A
ND
OP
ER
ATI
NG
RE
VIE
W
Notes to the Consolidated Financial Statements and Significant Accounting Policies
25. Insurance conTracT lIabIlITIes (continued)
methodology and assumptions (continued)
valuation interest rates
As at 30 November 2012 and 2011, the ranges of applicable valuation interest rates for traditional insurance contracts, which vary
by territory, year of issuance and products, within the first 20 years are as follows:
as at 30 november
2012
As at 30 November
2011
Hong Kong 3.50% – 7.50% 3.50% – 7.50%Thailand 3.25% – 9.00% 2.60% – 9.00%Singapore 2.00% – 7.25% 2.00% – 10.00%Malaysia 3.14% – 8.90% 3.70% – 8.90%China 2.75% – 7.00% 2.75% – 7.00%Korea 3.33% – 6.50% 3.33% – 6.50%Philippines 2.20% – 9.20% 3.75% – 9.20%Indonesia 3.05% – 10.80% 3.37% – 10.80%Vietnam 5.07% – 12.25% 5.07% – 12.25%Australia 3.83% – 7.11% 3.83% – 7.11%NewZealand 3.83% – 5.75% 3.83% – 5.75%Taiwan 1.75% – 6.50% 1.75% – 6.50%
26. InvesTmenT conTracT lIabIlITIes
year ended 30 november
Year ended 30 November
US$m 2012 2011
At beginning of financial year 8,360 9,091Effect of foreign exchange movements 107 26Investment contract benefits 540 (861)Fees charged (189) (187)Net deposits and other movements 47 291
At end of financial year 8,865 8,360

AIA Group Limited Annual Report 2012
180
Notes to the Consolidated Financial Statementsand Significant Accounting Policies
FINANCIAL STATEMENTS
27. effecT of chanGes In assumpTIons and esTImaTes
The table below sets out the sensitivities of the assumptions in respect of insurance and investment contracts with DPF to key
variables. This disclosure only allows for the impact on liabilities and related assets, such as reinsurance, and deferred acquisition
costs and does not allow for offsetting movements in the fair value of financial assets backing those liabilities.
US$m
as at 30 november
2012
As at 30 November
2011
(Increase)/decrease in insurance contract liabilities,
increase/(decrease) in equity and profit before tax
0.5 pps increase in investment return 8 90.5 pps decrease in investment return (10) (9)10% increase in expenses (2) (2)10% increase in mortality rates (16) (15)10% increase in lapse/discontinuance rates (19) (15)
Future policy benefits for traditional life insurance policies (including investment contracts with DPF) are calculated using a net
level premium valuation method with reference to best estimate assumptions set at policy inception date unless a deficiency
arises on liability adequacy testing. There is no impact of the above assumption sensitivities on the carrying amount of traditional
life insurance liabilities as the sensitivities presented would not have triggered a liability adequacy adjustment. During the years
presented there was no effect of changes in assumptions and estimates on the Group’s traditional life products.
For interest sensitive insurance contracts, such as universal life products and unit-linked contracts, assumptions are made at each
reporting date including mortality, persistency, expenses, future investment earnings and future crediting rates.
The impact of changes in assumptions on the valuation of insurance and investment contracts with DPF was US$9m decrease in
profit (2011: US$12m decrease).
28. borrowInGs
as at 30 november
As at 30 November
US$m 2012 2011
Bank loans 493 456Bank overdrafts 273 99Other loans – 4
Total 766 559
Properties with a book value of US$893m at 30 November 2012 (2011: US$762m) and a fair value of US$2,008m at 30 November
2012 (2011: US$1,809m) and cash and cash equivalents with a book value of US$2m (2011: US$66m) are pledged as security
with respect to amounts disclosed as bank loans above. Interest on loans reflects market rates of interest. Interest expense on
borrowings is shown in note 9. Further information relating to interest rates and the maturity profile of borrowings is presented in
note 36.

AD
DIT
ION
AL
INF
OR
MA
TIO
NF
INA
NC
IAL
ST
AT
EM
EN
TS
181
CO
RP
OR
AT
E G
OV
ER
NA
NC
EO
VE
RV
IEW
FIN
AN
CIA
L A
ND
OP
ER
ATI
NG
RE
VIE
W
Notes to the Consolidated Financial Statements and Significant Accounting Policies
29. oblIGaTIons under securITIes lendInG and repurchase aGreemenTs
The Group entered into securities lending agreement whereby securities were loaned to a national monetary authority. In addition,
the Group has entered into repurchase agreements whereby securities are sold to third parties with a concurrent agreement to
repurchase the securities at a specified date.
The securities related to these agreements are not derecognised from the Group’s consolidated statement of financial position,
but are retained within the appropriate financial asset classification. During the term of the securities lending and repurchase
agreements, AIA is restricted from selling or pledging the transferred debt securities. The following table specifies the amounts
included within financial investments subject to securities lending or repurchase agreements which do not qualify for derecognition
at each period end:
as at 30 november
As at 30 November
US$m 2012 2011
Debt securities:Securities lending – 321Repurchase agreements 1,846 663
Total 1,846 984
collateral
The Group received collateral based on the initial market value of the securities lent in the form of promissory notes issued by the
national monetary authority; both the securities lent and the collateral are denominated in local currency. In the absence of default,
the Group cannot sell or repledge the collateral and it is not recognised in the consolidated statement of financial position.
The following table shows the obligations under repurchase agreements at each period end:
as at 30 november
As at 30 November
US$m 2012 2011
Repurchase agreements 1,792 670
30. ImpaIrmenT of fInancIal asseTs
In accordance with the Group’s accounting policies, impairment reviews were performed for available for sale securities and loans
and receivables.
available for sale debt securities
During the year ended 30 November 2012, no impairment losses (2011: US$nil) were recognised in respect of available for sale
debt securities.
The carrying amounts of available for sale debt securities that are individually determined to be impaired at 30 November 2012 was
US$64m (2011: US$59m).

AIA Group Limited Annual Report 2012
182
Notes to the Consolidated Financial Statementsand Significant Accounting Policies
FINANCIAL STATEMENTS
30. ImpaIrmenT of fInancIal asseTs (continued)
loans and receivables
The Group’s primary potential credit risk exposure in respect of loans and receivables arises in respect of policy loans and a
portfolio of mortgage loans on residential and commercial real estate (see note 20 Financial investments for further details). The
Group’s credit exposure on policy loans is mitigated because, if and when the total indebtedness on any policy, including interest
due and accrued, exceeds the cash surrender value, the policy terminates and becomes void. The Group has a first lien on all
policies which are subject to policy loans.
The carrying amounts of loans and receivables that are individually determined to be impaired at 30 November 2012 was US$17m
(2011: US$39m).
The Group has a portfolio of residential and commercial mortgage loans which it originates. To the extent that any such loans are
past their due dates specific allowance is made, together with a collective allowance, based on historical delinquency. Insurance
receivables are short-term in nature and cover is not provided if consideration is not received. An ageing of accounts receivable is
not provided as all amounts are due within one year and cover is cancelled if consideration is not received.
31. provIsIons
US$mEmployee
benefits Other Total
At 1 December 2010 81 119 200Charged to the consolidated income
statement 11 64 75Exchange differences – (1) (1)Released during the year – (15) (15)Utilised during the year (8) (71) (79)
At 30 November 2011 84 96 180
Charged to the consolidated income statement 16 78 94
Exchange differences 1 3 4
Released during the year (5) (7) (12)
Utilised during the year (10) (52) (62)
At 30 November 2012 86 118 204
Further details of provisions for employee post-retirement benefits are provided in note 37.
other provisions
Other provisions comprise provisions in respect of regulatory matters, litigation, reorganisation and restructuring. In view of the
diverse nature of the matters provided for and the contingent nature of the matters to which they relate, the Group is unable to
provide an accurate assessment of the term over which provisions are expected to be utilised.

AD
DIT
ION
AL
INF
OR
MA
TIO
NF
INA
NC
IAL
ST
AT
EM
EN
TS
183
CO
RP
OR
AT
E G
OV
ER
NA
NC
EO
VE
RV
IEW
FIN
AN
CIA
L A
ND
OP
ER
ATI
NG
RE
VIE
W
Notes to the Consolidated Financial Statements and Significant Accounting Policies
32. oTher lIabIlITIes
US$m
as at 30 november
2012
As at 30 November
2011
Trade and other payables 1,949 1,660Third-party interests in consolidated investment funds 232 259Payables from purchases of investments 449 304Reinsurance payables 182 164
Total 2,812 2,387
Third-party interests in consolidated investment funds consist of third-party unit holders’ interests in consolidated investment funds
which are reflected as a liability since they can be put back to the Group for cash.
Trade and other payables are all expected to be settled within 12 months after the end of the reporting period. The realisation of
third-party interests in investment funds cannot be predicted with accuracy since these represent the interests of third-party unit
holders in consolidated investment funds held to back insurance and investment contract liabilities and are subject to market risk
and the actions of third-party investors.
33. share capITal and reserves
share capital
as at 30 november 2012 As at 30 November 2011
million shares us$m Million shares US$m
Authorised
Ordinary shares of US$1 each 20,000 20,000 20,000 20,000Issued and fully paid
At beginning and end of the financial year 12,044 12,044 12,044 12,044
Share premium 1,914 1,914
There were no shares issued under share option schemes during the year ended 30 November 2012.
Except for 53,653,843 shares (2011: 30,540,802 shares) of the Company held by the employee share-based trusts, neither the
Company nor any of its subsidiaries purchased, sold or redeemed any of the Company’s listed securities during the year ended 30
November 2012. These purchases were made by the relevant scheme trustees on the Hong Kong Stock Exchange. These shares
are held on trust for participants of the relevant schemes and therefore were not cancelled. Please refer to note 38 for details.
Share premium of US$1,914m represents the difference between the net book value of the Group on acquisition by the Company
of US$13,958m and the nominal value of the share capital issued of US$12,044m.

AIA Group Limited Annual Report 2012
184
Notes to the Consolidated Financial Statementsand Significant Accounting Policies
FINANCIAL STATEMENTS
33. share capITal and reserves (continued)
reserves
fair value reserve
The fair value reserve comprises the cumulative net change in the fair value of available for sale securities held at the end of the
reporting period.
foreign currency translation reserve
The foreign currency translation reserve comprises all foreign currency exchange differences arising from the translation of the
financial statements of foreign operations.
employee share-based trusts
Trusts have been established to acquire shares of the Company for distribution to participants in future periods through the share-
based compensation schemes. Those shares acquired by the trusts, to the extent not transferred to the participants upon vesting,
are reported as “Employee share-based trusts”.
other reserves
Other reserves include the impact of merger accounting for business combinations under common control and share-based
compensation.
34. non-conTrollInG InTeresTs
US$m
as at 30 november
2012
As at 30 November
2011
Equity shares in subsidiaries 60 60Share of earnings 29 18Share of other reserves 42 24
Total 131 102
35. Group capITal sTrucTure
capital management approach
The Group’s capital management objectives focus on maintaining a strong capital base to support the development of its business,
maintaining the ability to move capital freely and satisfying regulatory capital requirements at all times.
The Group’s capital management function oversees all capital-related activities of the Group and assists senior management
in making capital decisions. The capital management function participates in decisions concerning asset-liability management,
strategic asset allocation and ongoing solvency management. This includes ensuring capital considerations are paramount in the
strategy and business planning processes and when determining AIA’s capacity to pay dividends to shareholders.

AD
DIT
ION
AL
INF
OR
MA
TIO
NF
INA
NC
IAL
ST
AT
EM
EN
TS
185
CO
RP
OR
AT
E G
OV
ER
NA
NC
EO
VE
RV
IEW
FIN
AN
CIA
L A
ND
OP
ER
ATI
NG
RE
VIE
W
Notes to the Consolidated Financial Statements and Significant Accounting Policies
35. Group capITal sTrucTure (continued)
regulatory solvency
The Group is in compliance with the solvency and capital adequacy requirements applied by its regulators. The Group’s primary
insurance regulator at the AIA Co. and AIA-B levels is the Hong Kong Office of the Commissioner of Insurance (HKOCI), which
requires that AIA Co. and AIA-B meet the solvency margin requirements of the Hong Kong Insurance Companies Ordinance. The
Hong Kong Insurance Companies Ordinance (among other matters) sets minimum solvency margin requirements that an insurer
must meet in order to be authorised to carry on insurance business in or from Hong Kong. The HKOCI requires AIA Co. and AIA-B
to maintain an excess of assets over liabilities of not less than the required minimum solvency margin. The amount required under
the Hong Kong Insurance Companies Ordinance is 100 per cent of the required minimum solvency margin. The excess of assets
over liabilities to be maintained by AIA Co. and AIA-B required by the HKOCI is not less than 150 per cent of the required minimum
solvency margin.
The capital positions of the Group’s two principal operating companies as of 30 November 2012 and 2011 are as follows:
30 november 2012 30 November 2011
US$mTotal available
capitalrequired
capitalsolvency
ratioTotal available
capitalRequired
capitalSolvency
ratio
AIA Co. 4,811 1,362 353% 6,168 1,984 311%AIA-B 3,108 1,415 220% 3,419 1,150 297%
For these purposes, the Group defines total available capital as the amount of assets in excess of liabilities measured in
accordance with the Hong Kong Insurance Companies Ordinance and “required capital” as the minimum required margin of
solvency calculated in accordance with the Hong Kong Insurance Companies Ordinance. The solvency ratio is the ratio of total
available capital to required capital.
The Group’s individual branches and subsidiaries are also subject to the supervision of government regulators in the jurisdictions
in which those branches and subsidiaries operate and, in relation to subsidiaries, in which they are incorporated. The various
regulators overseeing the Group actively monitor our local solvency positions. AIA Co. and AIA-B submit annual filings to the
HKOCI of their solvency margin position based on their annual audited accounts, and the Group’s other operating units perform
similar annual filings with their respective local regulators.
The ability of the Company to pay dividends to shareholders and to meet other obligations depends ultimately on dividends and
other payments being received from its operating subsidiaries and branches, which are subject to contractual, regulatory and
other limitations. The various regulators overseeing the individual branches and subsidiaries of the Group have the discretion to
impose additional restrictions on the ability of those regulated subsidiaries and branches to make payment of dividends or other
distributions and payments to AIA Co., including increasing the required margin of solvency that an operating unit must maintain.
For example, capital may not be remitted from Thailand without the consent of the Office of the Insurance Commission in Thailand.
The payment of dividends, distributions and other payments to shareholders is subject to the oversight of the HKOCI.

AIA Group Limited Annual Report 2012
186
Notes to the Consolidated Financial Statementsand Significant Accounting Policies
FINANCIAL STATEMENTS
35. Group capITal sTrucTure (continued)
capital and regulatory orders specific to the Group
As of 30 November 2012, the requirements and restrictions summarised below may be considered material to the Group and
remain in effect unless otherwise stated.
hong Kong office of the commissioner of Insurance
AIA Group Limited has given to the Insurance Authority an undertaking that AIA Group Limited will:
(i) ensure that (a) AIA Co. and AIA-B will at all times maintain a solvency ratio of not less than 150 per cent, both on an individual
insurer basis and on an AIA Co./AIA-B consolidated basis; (b) it will not withdraw capital or transfer any funds or assets out of
either AIA Co. or AIA-B that will cause AIA Co.’s or AIA-B’s solvency ratio to fall below 150 per cent, except with, in either case,
the prior written consent of the Insurance Authority; and (c) should the solvency ratio of either AIA Co. or AIA-B fall below 150
per cent, AIA Group Limited will take steps as soon as possible to restore it to at least 150 per cent in a manner acceptable to
the Insurance Authority;
(ii) notify the Insurance Authority in writing as soon as the Company becomes aware of any person (a) becoming a controller
(within the meaning of Section 9(1)(c)(ii) of the HKICO) of AIA Co. and AIA-B through the acquisition of our shares traded on the
HKSE; or (b) ceasing to be a controller (within the meaning of Section 9(1)(c)(ii) of the HKICO) of AIA Co. and AIA-B through the
disposal of our shares traded on the HKSE;
(iii) be subject to the supervision of the Insurance Authority and AIA Group Limited will be required to continually comply with the
Insurance Authority’s guidance on the “fit and proper” standards of a controller pursuant to Section 8(2) of the HKICO. The
Insurance Authority is empowered by the HKICO to raise objection if it appears to it that any person is not fit and proper to
be a controller or director of an authorised insurer. These standards include the sufficiency of a holding company’s financial
resources; the viability of a holding company’s business plan for its insurance subsidiaries which are regulated by the
Insurance Authority; the clarity of the Group’s legal, managerial and operational structures; the identities of any other holding
companies or major regulated subsidiaries; whether the holding company, its directors or controllers is subject to receivership,
administration, liquidation or other similar proceedings or failed to satisfy any judgment debt under a court order or the subject
of any criminal convictions or in breach of any statutory or regulatory requirements; the soundness of the Group’s corporate
governance; the soundness of the Group’s risk management framework; the receipt of information from its insurance
subsidiaries which are regulated by the Insurance Authority to ensure that they are managed in compliance with applicable
laws, rules and regulation; and its role in overseeing and managing the operations of its insurance subsidiaries which are
regulated by the Insurance Authority; and
(iv) fulfil all enhancements or improvements to the guidance referred to in subparagraph (iii) above, as well as administrative
measures issued from time to time by the Insurance Authority or requirements that may be prescribed by the Insurance
Authority in accordance with the HKICO, regulations under the HKICO or guidance notes issued by the Insurance Authority
from time to time.

AD
DIT
ION
AL
INF
OR
MA
TIO
NF
INA
NC
IAL
ST
AT
EM
EN
TS
187
CO
RP
OR
AT
E G
OV
ER
NA
NC
EO
VE
RV
IEW
FIN
AN
CIA
L A
ND
OP
ER
ATI
NG
RE
VIE
W
Notes to the Consolidated Financial Statements and Significant Accounting Policies
36. rIsK manaGemenT
risk management framework
The managed acceptance of risk is fundamental to the Group’s insurance business model. The Group’s Risk Management
Framework seeks to effectively manage, rather than eliminate, the risks the Group faces.
The Group’s Risk Management Framework has been established for the identification, evaluation and management of the key risks
faced by the organisation within our stated Risk Appetite. The framework includes an established risk governance structure with
clear oversight and assignment of responsibility for monitoring and management of financial and non-financial risks.
Insurance risk
The Group considers insurance risk to be a combination of the following component risks:
• Productdesignrisk;
• Underwritingandexpenseoverrunrisk;
• Lapserisk;and
• Claimsrisk
product design risk
Product design risk refers to potential defects in the development of a particular insurance product. The Group manages product
design risk through the New Product Approval Process where products are reviewed against pricing, design and operational risk
benchmarks agreed by the Group Financial Risk Committee (FRC). Local business units work closely with a number of Group
functions including product management, actuarial, legal, compliance, risk and underwriting.
The Group monitors closely the performance of new products and focuses on actively managing each part of the actuarial control
cycle to minimise risk in the in-force book as well as for new products. A significant component of the Group’s long-term insurance
business is participating in nature where the Group has the ability to adjust dividends to reflect market conditions. This reduces
the Group’s exposure to changes in circumstances, in particular investment returns, that may arise during the life of long-term
insurance policies.
underwriting and expense overrun risk
Underwriting and expense overrun risk refers to the possibility of product-related income being inadequate to support future
obligations arising from an insurance product.
The Group manages underwriting risk by adhering to the Group underwriting guidelines. Each operating unit maintains a team of
professional underwriters who review and select risks that are consistent with the underwriting strategy of the Group. A second
layer of underwriting review is conducted at the Group level for complex and large risks. Any exceptions require specific approval
and may be subject to separate risk management actions.
In certain circumstances, such as when entering a new line of business, products or markets for which insufficient experience data
is available the Group makes use of reinsurance to obtain product pricing expertise.
In pricing insurance products the Group manages expense overrun risk by allowing for an appropriate level of expenses that
reflects a realistic medium- to long-term view of the underlying cost structure. A disciplined expense budgeting and management
process is followed that controls expenses within product pricing allowances over the medium to long term.

AIA Group Limited Annual Report 2012
188
Notes to the Consolidated Financial Statementsand Significant Accounting Policies
FINANCIAL STATEMENTS
36. rIsK manaGemenT (continued)
Insurance risk (continued)
lapse risk
Lapse risk refers to the possibility that lapse experience diverges from that assumed when products were priced. It includes
potential financial loss due to early termination of contracts where the acquisition cost incurred may not be recoverable from future
revenue.
The Group carries out regular reviews of persistency experience. The results are assimilated into new and in-force business
management. Target payback periods that form part of the product pricing controls enable monitoring of the Group’s exposure to
lapse risk. In addition, many of the Group’s products include surrender charges that entitle the Group to additional fees on early
termination by the policyholder, thereby reducing exposure to lapse risk.
claims risk
Claims risk refers to the possibility that the frequency or severity of claims arising from insurance contracts exceeds the level
assumed when the products were priced.
The Group seeks to mitigate claims risk by conducting regular experience studies, including reviews of mortality and morbidity
experience, reviewing internal and external data, and considering the impact of these on product design, pricing and reinsurance
needs. As a result of the Group’s history and scale, a substantial volume of experience data has been accumulated which assists
in evaluation and pricing of insurance risk.
Mortality and morbidity risk in excess of the respective retention limits are ceded to reduce volatility in claims experience for the
Group. The Group’s capital position combined with its profitable product portfolio and diversified geographical presence are factors
in management’s decision to retain (rather than reinsure) a high proportion of its written insurance risks.
The Group has a broad geographical footprint across the Asia-Pacific region, which provides a degree of natural geographical
diversification of claims experience. We mitigate and manage this risk by adhering to the underwriting and claims management
policies and procedures that have been developed based on our extensive historical experience. Our broad product offering and
large in-force product portfolio also reduce our exposure to concentration risk. Finally, we use reinsurance solutions to help reduce
concentration and volatility risk, especially with large policies or new risks, and as protection against catastrophes.

AD
DIT
ION
AL
INF
OR
MA
TIO
NF
INA
NC
IAL
ST
AT
EM
EN
TS
189
CO
RP
OR
AT
E G
OV
ER
NA
NC
EO
VE
RV
IEW
FIN
AN
CIA
L A
ND
OP
ER
ATI
NG
RE
VIE
W
Notes to the Consolidated Financial Statements and Significant Accounting Policies
36. rIsK manaGemenT (continued)
financial risk exposures
The Group is exposed to a range of financial risks, including credit risk, market risk, and liquidity risk. The Group applies a
consistent risk management philosophy that is embedded in management processes and controls such that both existing and
emerging risks are considered and addressed.
The following section summarises the Group’s key risk exposures and the primary policies and processes used by the Group to
manage its exposures to these risks.
credit risk
Credit risk occurs wherever we are relying on a third party to satisfy their financial obligation to us. Although the primary source of
credit risk is the Group’s investment portfolio, credit risk also arises in our reinsurance, settlement and treasury activities.
The management of credit risk occurs on two levels in AIA.
The Investment Credit Research team performs a detailed analysis of individual counterparties and recommends a rating within
the internal ratings framework. The Group Risk function manages the Group’s internal ratings framework and agrees these
recommendations. Internal ratings are then used to determine our appetite for exposure to each counterparty.
A matrix of risk tolerances has been approved by the FRC that ensures that credit risk in the investment portfolio is contained
within AIA’s risk appetite. These tolerances cover individual counterparty, segmental concentration and cross-border exposures.
The Investment function has discretion to shape the portfolio within those risk tolerances. If certain investments are technically
within risk tolerances but there is a specific concern, Group Risk may bring these to the attention of the FRC.
market risk
Market risk arises from the possibility of financial loss caused by changes in financial instruments’ fair values or future cash flows
due to fluctuations in key variables, including interest rates, equity market prices, foreign exchange rates and real estate property
market prices.
The FRC approves all policies and metrics associated with the evaluation of market risk exposures.
Interest rate risk
The Group’s exposure to interest rate risk predominantly arises from any difference between the tenor of the Group’s liabilities
and assets, or any difference between the return on investments and the return required to meet the Group’s commitments,
predominantly its insurance liabilities. This exposure can be heightened in products with inherent interest rate options or
guarantees.
We seek to manage interest rate risk by ensuring appropriate insurance product design and underlying assumptions as part of
the product approval process and by matching, to the extent possible and appropriate, the duration of our investment assets with
the duration of our insurance policies. For in-force policies, we regularly adjust the policyholder bonus payout and crediting rates
applicable to policyholder account balances considering, amongst other things, the earned yields and policyholders’ reasonable
expectations.

AIA Group Limited Annual Report 2012
190
Notes to the Consolidated Financial Statementsand Significant Accounting Policies
FINANCIAL STATEMENTS
36. rIsK manaGemenT (continued)
financial risk exposures (continued)
market risk (continued)
Exposure to interest rate risk
The table below summarises the nature of the interest rate risk associated with financial assets and financial liabilities. In preparing
this analysis, fixed rate interest bearing instruments that mature or reprice within 12 months of the reporting date have been
disclosed as variable rate instruments.
US$mvariable
interest ratefixed
interest ratenon-interest
bearing Total
30 November 2012
Financial assetsLoans and deposits 995 5,386 44 6,425
Other receivables 66 1 1,164 1,231
Debt securities 5,932 74,930 – 80,862
Equity securities – – 23,656 23,656
Reinsurance receivables – – 95 95
Accrued investment income – 92 1,104 1,196
Cash and cash equivalents 2,767 – 181 2,948
Derivative financial instruments – – 638 638
Total financial assets 9,760 80,409 26,882 117,051
Financial liabilitiesInvestment contract liabilities – – 8,865 8,865
Borrowings 492 – 274 766
Obligations under securities lending and repurchase agreements 1,792 – – 1,792
Other liabilities – – 2,812 2,812
Derivative financial instruments – – 41 41
Total financial liabilities 2,284 – 11,992 14,276

AD
DIT
ION
AL
INF
OR
MA
TIO
NF
INA
NC
IAL
ST
AT
EM
EN
TS
191
CO
RP
OR
AT
E G
OV
ER
NA
NC
EO
VE
RV
IEW
FIN
AN
CIA
L A
ND
OP
ER
ATI
NG
RE
VIE
W
Notes to the Consolidated Financial Statements and Significant Accounting Policies
36. rIsK manaGemenT (continued)
financial risk exposures (continued)
market risk (continued)
Exposure to interest rate risk (continued)
US$mVariable
interest rateFixed
interest rateNon-interest
bearing Total
30 November 2011
Financial assetsLoans and deposits 1,469 3,058 38 4,565Other receivables 162 1 1,135 1,298Debt securities 5,741 62,211 – 67,952Equity securities – – 19,012 19,012Reinsurance receivables – – 100 100Accrued investment income – 77 969 1,046Cash and cash equivalents 4,093 – 210 4,303Derivative financial instruments – – 725 725
Total financial assets 11,465 65,347 22,189 99,001
Financial liabilitiesInvestment contract liabilities – – 8,360 8,360Borrowings 460 – 99 559Obligations under securities
lending and repurchase agreements 670 – – 670Other liabilities – – 2,387 2,387Derivative financial instruments – – 38 38
Total financial liabilities 1,130 – 10,884 12,014
Foreign exchange rate risk
At the Group level, foreign exchange rate risk arises mainly from our operations in multiple geographical markets in the Asia-Pacific
region and the translation of multiple currencies to US dollars for financial reporting purposes. Foreign currency risk associated with
assets and liabilities denominated in non-functional currencies results in gains and losses being recognised in the consolidated
income statement. Foreign currency risk associated with the translation of the net assets of operations with non-US dollar
functional currencies results in gains or losses being recorded directly in total equity.
On a local operating unit level, we have invested in assets denominated in currencies that match the related liabilities, to the extent
possible and appropriate, to avoid currency mismatches.
The Group’s net foreign currency exposures and the estimated impact of changes in foreign exchange rates are set out in the
tables below after taking into account the effect of economic hedges of currency risk. Whilst providing economic hedges that
reduce the Group’s net exposure to foreign exchange risk, hedge accounting is not applied. Currencies for which net exposure
is not significant are excluded from the analysis below. In compiling the table below the impact of a 5 per cent strengthening of
original currency is stated relative to the functional currency of the relevant operation of the Group. The impact of a 5 per cent
strengthening of the US dollar is also stated relative to functional currency. Currency exposure reflects the net notional amount of
currency derivative positions as well as net equity by currency.

AIA Group Limited Annual Report 2012
192
Notes to the Consolidated Financial Statementsand Significant Accounting Policies
FINANCIAL STATEMENTS
36. rIsK manaGemenT (continued)
financial risk exposures (continued)
market risk (continued)
Foreign exchange rate risk (continued)
Net exposure
US$munited states
dollarhong Kong
dollar Thai bahtsingapore
dollarmalaysian
ringgitchina
renminbiKorean
won
30 November 2012Equity analysed by
original currency 15,990 153 3,713 (1,963) 837 1,377 2,567Net notional amounts of
currency derivative positions (6,177) 301 1,609 3,149 – 2 –
Currency exposure 9,813 454 5,322 1,186 837 1,379 2,567
5% strengthening of original currency
Impact on profit before tax 107 (9) 4 29 5 20 29
5% strengthening of the US dollar
Impact on shareholders’ equity (107) 11 (252) (36) (34) (46) (98)
US$mUnited States
DollarHong Kong
Dollar Thai BahtSingapore
DollarMalaysian
RinggitChina
RenminbiKorean
Won
30 November 2011Equity analysed by
original currency 13,714 (17) 3,496 (2,068) 677 861 1,648Net notional amounts of
currency derivative positions (4,331) 300 1,399 3,195 – 47 –
Currency exposure 9,383 283 4,895 1,127 677 908 1,648
5% strengthening of original currency
Impact on profit before tax 90 (16) 10 28 – 11 2
5% strengthening of the US dollar
Impact on shareholders’ equity (90) 9 (224) (28) (29) (37) (80)
Equity market and interest rate risk
Equity market risk arises from changes in the market value of equity securities and equity funds. Investment in equity assets on a
long-term basis is expected to provide diversification benefits and return enhancements which can improve the risk-adjusted return
of the portfolios.

AD
DIT
ION
AL
INF
OR
MA
TIO
NF
INA
NC
IAL
ST
AT
EM
EN
TS
193
CO
RP
OR
AT
E G
OV
ER
NA
NC
EO
VE
RV
IEW
FIN
AN
CIA
L A
ND
OP
ER
ATI
NG
RE
VIE
W
Notes to the Consolidated Financial Statements and Significant Accounting Policies
36. rIsK manaGemenT (continued)
financial risk exposures (continued)
market risk (continued)
Equity market and interest rate risk (continued)
Sensitivity analysis
Sensitivity analysis to the key variables affecting financial assets and liabilities is set out in the table below. Information relating to sensitivity of insurance and investment contracts with DPF is provided in note 27. The carrying values of other financial assets are not subject to changes in response to movements in interest rates or equity prices. In calculating the sensitivity of debt and equity instruments to changes in interest rates and equity prices the Group has made assumptions about the corresponding impact of asset valuations on liabilities to policyholders. Assets held to support unit-linked contracts have been excluded on the basis that changes in fair value are wholly borne by policyholders. Sensitivity analysis for assets held in participating funds has been calculated after allocation of returns to policyholders using the applicable minimum policyholders’ participation ratios described in note 2. Information is presented to illustrate the estimated impact on profits and net assets arising from a change in a single variable before taking into account the effects of taxation.
For the purpose of illustrating the sensitivity of profit before tax and net assets before the effects of taxation to changes in interest rates and equity prices, the impact of possible impairments of financial investments classified as available for sale which may arise in times of economic stress has been ignored, since default events reflect the characteristics of individual issuers. Because the Group’s accounting policies lock in interest rate assumptions on policy inception and the Group’s assumptions incorporate a provision for adverse deviations, the level of movement illustrated in this sensitivity analysis does not result in loss recognition and so there is no corresponding effect on liabilities.
30 november 2012 30 November 2011
US$m
Impact on profit
before tax
Impact on net assets (before the effects of
taxation)
Impact on profit
before tax
Impact on net assets (before the effects of
taxation)
Equity market risk
10 per cent increase in equity prices 630 630 497 49710 per cent decrease in equity prices (630) (630) (497) (497)Interest rate risk
+ 50 basis points shift in yield curves (92) (2,770) (80) (2,120)- 50 basis points shift in yield curves 92 2,770 80 2,120
liquidity riskLiquidity risk primarily refers to the possibility of having insufficient cash available to meet the payment obligations to counterparties when they become due. The Group is exposed to liquidity risk in respect of insurance and investment policies that permit surrender, withdrawal or other forms of early termination for a cash surrender value specified in the contractual terms and conditions.
To manage liquidity risk, the Group has implemented a variety of measures, including emphasising flexible insurance product design so that it can retain the greatest flexibility to adjust contract pricing or crediting rates. The Group also seeks to match, to the extent possible and appropriate, the duration of its investment assets with the duration of insurance policies issued.
The maturity analysis presented in the tables below presents the estimated maturity of carrying amounts in the consolidated statement of financial position. The estimated maturity for insurance and investment contracts is proportionate to their carrying values based on projections of estimated undiscounted cash flows arising from insurance and investment contracts in force at that date. The Group has made significant assumptions to determine the estimated undiscounted cash flows of insurance benefits and claims and investment contract benefits, which include assumptions in respect of mortality, morbidity, future lapse rates, expenses, investment returns and interest crediting rates, offset by expected future deposits and premiums on in-force policies. The maturity profile of the Group’s borrowings is presented on the presumption that the Group will continue to satisfy loan covenants which, if breached, would cause the borrowings to be repayable on demand. The Group regularly monitors its compliance with these covenants and was in compliance with them at the date of the consolidated statement of financial position and throughout each of the periods presented. Due to the significance of the assumptions used, the maturity profiles presented below could be materially different from actual payments.

AIA Group Limited Annual Report 2012
194
Notes to the Consolidated Financial Statementsand Significant Accounting Policies
FINANCIAL STATEMENTS
36. rIsK manaGemenT (continued)
financial risk exposures (continued)
liquidity risk (continued)
A maturity analysis based on the earliest contractual repayment date would present the insurance and investment contract liabilities
as falling due in the earliest period in the table because of the ability of policyholders to exercise surrender options. Financial assets
and liabilities other than investment contract liabilities are presented based on their respective contractual maturities.
US$m Totalno fixed maturity
due in one year
or less
due after one year through
five years
due after five years
through ten years
due after ten years
30 November 2012
Financial assetsLoans and deposits 6,425 1,949 475 1,203 728 2,070
Other receivables 1,231 65 1,065 89 4 8
Debt securities 80,862 – 2,413 15,974 22,089 40,386
Equity securities 23,656 23,656 – – – –
Reinsurance receivables 95 – 95 – – –
Accrued investment income 1,196 – 1,104 36 56 –
Cash and cash equivalents 2,948 – 2,948 – – –
Derivative financial instruments 638 – 146 415 79 (2)
Total 117,051 25,670 8,246 17,717 22,956 42,462
Financial and insurance contracts liabilitiesInsurance and investment
contract liabilities (net of reinsurance) 98,381 – (871) 784 8,553 89,915
Borrowings 766 273 7 486(1) – –
Obligations under securities lending and repurchase agreements 1,792 – 1,792 – – –
Other liabilities 2,812 232 2,580 – – –
Derivative financial instruments 41 – 4 16 21 –
Total 103,792 505 3,512 1,286 8,574 89,915
Note:
(1) Includes amounts of US$486m (2011: US$nil) due after 2 years through 5 years.

AD
DIT
ION
AL
INF
OR
MA
TIO
NF
INA
NC
IAL
ST
AT
EM
EN
TS
195
CO
RP
OR
AT
E G
OV
ER
NA
NC
EO
VE
RV
IEW
FIN
AN
CIA
L A
ND
OP
ER
ATI
NG
RE
VIE
W
Notes to the Consolidated Financial Statements and Significant Accounting Policies
36. rIsK manaGemenT (continued)
financial risk exposures (continued)
liquidity risk (continued)
US$m TotalNo fixed maturity
Due in one year
or less
Due after one year through
five years
Due after five years
through ten years
Due after ten years
30 November 2011
Financial assetsLoans and deposits 4,565 1,863 547 691 762 702Other receivables 1,298 96 1,155 46 1 –Debt securities 67,952 – 2,638 15,174 18,595 31,545Equity securities 19,012 19,012 – – – –Reinsurance receivables 100 – 100 – – –Accrued investment income 1,046 2 974 24 46 –Cash and cash equivalents 4,303 – 4,303 – – –Derivative financial instruments 725 – 204 392 134 (5)
Total 99,001 20,973 9,921 16,327 19,538 32,242
Financial and insurance contracts liabilitiesInsurance and investment
contract liabilities (net of reinsurance) 86,354 – (521) 1,955 8,161 76,759
Borrowings 559 103 456 – – –Obligations under
securities lending and repurchase agreements 670 – 670 – – –
Other liabilities 2,387 259 2,128 – – –Derivative financial instruments 38 – 8 20 10 –
Total 90,008 362 2,741 1,975 8,171 76,759

AIA Group Limited Annual Report 2012
196
Notes to the Consolidated Financial Statementsand Significant Accounting Policies
FINANCIAL STATEMENTS
37. employee benefITs
defined benefit plans
US$m
as at 30 november
2012
As at 30 November
2011
Present value of unfunded obligations 126 107Present value of funded obligations 53 60
Total present value of obligations 179 167Fair value of plan assets (60) (60)
Present value of net obligations 119 107Unrecognised actuarial losses (41) (31)Unrecognised past service cost (3) (1)
Net recognised defined benefit obligations 75 75
Recognised defined benefit deficits 86 84Recognised defined benefit surpluses (11) (9)
The Group operates funded and unfunded defined benefit plans that provide life and medical benefits for participating employees
after retirement and a lump sum benefit on cessation of employment. The locations covered by these plans include Hong Kong,
Singapore, Malaysia, Thailand, Taiwan, Indonesia, the Philippines and Korea. The latest independent actuarial valuations of the
plans were at 30 November 2012 and were prepared by credentialed actuaries of Mercer (Hong Kong) Limited. All the actuaries
are qualified members of professional actuarial organisations to render the actuarial opinions.
The actuarial valuations indicate that the Group’s obligations under these defined benefit retirement plans are 34 per cent (2011:
36 per cent) covered by the plan assets held by the trustees.
Plan assets comprise:
US$m
as at 30 november
2012
As at 30 November
2011
Equity securities – 3Debt securities 2 1Real estate 51 40Investment contracts issued by third-party financial institutions 7 16
Total 60 60
movement in the present value of defined benefit obligations
US$m
year ended 30 november
2012
Year ended 30 November
2011
At beginning of financial year 167 129Benefits paid by the plan (4) (9)Current service costs and interest (see next page) 19 16Actuarial losses 13 36Plan settlement, curtailment or amendment (21) (4)Foreign exchange movements 5 (1)
At end of financial year 179 167

AD
DIT
ION
AL
INF
OR
MA
TIO
NF
INA
NC
IAL
ST
AT
EM
EN
TS
197
CO
RP
OR
AT
E G
OV
ER
NA
NC
EO
VE
RV
IEW
FIN
AN
CIA
L A
ND
OP
ER
ATI
NG
RE
VIE
W
Notes to the Consolidated Financial Statements and Significant Accounting Policies
37. employee benefITs (continued)
defined benefit plans (continued)
movement in the fair value of plan assets
US$m
year ended 30 november
2012
Year ended 30 November
2011
At beginning of financial year 60 60Contributions paid into the plan 12 8Benefits paid by the plan (4) (9)Expected return on plan assets 5 5Actuarial gains 2 1Foreign exchange movements 4 –Asset distributed on settlement (19) (5)
At end of financial year 60 60
expense recognised in consolidated income statement
US$m
year ended 30 november
2012
Year ended 30 November
2011
Current service costs 12 10Interest on obligation 7 6Expected return on plan assets (5) (5)Settlement/curtailment gains recognised (5) (2)Others 7 2
Total 16 11
The expense is recognised within the following line items in the consolidated income statement:
year ended 30 november
Year ended 30 November
US$m 2012 2011
Operating expenses 16 11
actuarial assumptions
Principal actuarial assumptions at the reporting date are in the following ranges:
as at 30 november
2012
As at 30 November
2011
Expected return on plan assets at beginning of financial year 3.5% – 10.7% 2.5% – 10.7%Future salary increases 3.0% – 10.0% 3.0% – 10.0%Healthcare trend rate:
Immediate trend rate 5.0% – 12.0% 4.0% – 12.0%Ultimate trend rate 4.25% – 12.0% 4.0% – 12.0%
Year in which the ultimate trend rate is reached 2013 – 2016 2012 – 2016Discount rate at end of the financial year 1.0% – 6.25% 1.5% – 7.25%

AIA Group Limited Annual Report 2012
198
Notes to the Consolidated Financial Statementsand Significant Accounting Policies
FINANCIAL STATEMENTS
37. employee benefITs (continued)
defined benefit plans (continued)
actuarial assumptions (continued)
The overall expected long-term rate of return is based on the portfolios as a whole and not on the sum of the returns on individual
asset categories. The return is based on historical returns without adjustment.
Assumptions regarding future mortality rates are based on published statistics and mortality tables. Average retirement ages and
life expectancies are set out below for the principal locations with defined benefit employee benefit:
Hong Kong Singapore Thailand Malaysia Philippines
Retirement age 65 62 60 55 – 60 60
Average life expectancy on retirementMales 19.1 years 23.8 years 20.5 years 19.2 – 23.3 years 21.3 years
Females 23.9 years 26.0 years 23.2 years 25.5 – 29.9 years 25.1 years
Assumed healthcare cost trend rates affect the amounts recognised in profit or loss. A 1 per cent change in assumed healthcare
cost trend rates would have the following effects (expressed as weighted averages):
1% increase 1% decrease
US$m 2012 2011 2012 2011
Effect on the aggregate service and interest cost 1 1 (1) (1)Effect on defined benefit obligation 13 9 (9) (7)
historical informationas at
30 novemberAs at
30 NovemberAs at
30 NovemberAs at
30 NovemberAs at
30 NovemberUS$m 2012 2011 2010 2009 2008
Present value of the defined benefit obligation 179 167 129 110 101Fair value of plan assets (60) (60) (60) (53) (50)Deficits of the plans 119 107 69 57 51Experience loss arising on plan liabilities – (23) (4) (7) (14)Experience gain/(loss) arising on plan assets (2) 1 3 (2) (2)
Contributions to funded and unfunded defined benefit plans during the year ending 30 November 2013 are not expected to be
material.
defined contribution plans
The Group operates a number of defined contribution pension plans. The total expense relating to these plans in the current year
was US$46m (2011: US$41m). Employees and the employer are required to make monthly contributions equal to 5 per cent to 22
per cent of the employees’ monthly basic salaries, depending on years of service and subject to any applicable caps of monthly
relevant income in different jurisdictions. For defined contribution pension plans with vesting conditions, any forfeited contributions
by employers on behalf of employees who leave the scheme prior to vesting fully in such contributions are used by the employer
to reduce any future contributions. The amount of forfeited contributions used to reduce the existing level of contributions is not
material.
The outstanding liability for defined contribution benefit plans is US$10m (2011: US$2m).

AD
DIT
ION
AL
INF
OR
MA
TIO
NF
INA
NC
IAL
ST
AT
EM
EN
TS
199
CO
RP
OR
AT
E G
OV
ER
NA
NC
EO
VE
RV
IEW
FIN
AN
CIA
L A
ND
OP
ER
ATI
NG
RE
VIE
W
Notes to the Consolidated Financial Statements and Significant Accounting Policies
38. share-based compensaTIon
share-based compensation plans
During the year ended 30 November 2012, the Group made further grants of share options and restricted share units (RSUs) to
certain employees, directors and officers of the Group under the Share Option Scheme (SO Scheme) and the Restricted Share Unit
Scheme (RSU Scheme). In addition to the existing Employee Share Purchase Plan (ESPP), the Group has launched an Agency
Share Purchase Plan (ASPP).
rsu scheme
Under the RSU Scheme, the vesting of the granted RSUs is conditional upon the eligible participants remaining in employment with
the Group during the respective vesting periods. RSU grants are vested either entirely after a specific period of time or in tranches
over the vesting period. For RSU grants that are vested in tranches, each vesting tranche is accounted for as a separate grant
for the purposes of recognising the expense over the vesting period. For certain RSUs, performance conditions are also attached
which include both market and non-market conditions. RSUs subject to performance conditions are released to the participants at
the end of the vesting period depending on the actual achievement of the performance conditions. During the vesting period, the
participants are not entitled to dividends of the underlying shares. Except in jurisdictions where restrictions apply, the granted RSUs
are expected to be settled in equity; grants that the Group has the legal or constructive obligation to settle in cash are insignificant
to the Group. The maximum number of shares that can be granted under this scheme is 301,100,000 (2011: 301,100,000),
representing 2.5 per cent (2011: 2.5 per cent) of the number of shares in issue at 30 November 2012.
year ended30 november
2012 number
of shares
Year ended30 November
2011 Number of shares
Restricted Share Units
Outstanding at beginning of financial year 31,202,819 –Granted 22,348,056 31,792,008Forfeited (2,733,564) (589,189)Vested (366,680) –
Outstanding at end of financial year 50,450,631 31,202,819
so scheme
The objectives of the SO Scheme are to align eligible participants’ interests with those of the shareholders of the Company by
allowing eligible participants to share in the value created at the point they exercise their options. Share option (SO) grants are
vested either entirely after a specific period of time or in tranches over the vesting period approximately three to five years, during
which, the eligible participants are required to remain in employment with the Group. For SO grants vested in tranches, each
vesting tranche is accounted for as a separate grant for the purposes of recognising the expense over the vesting period. The
granted share options expire 10 years from the date of grant and each share option entitles the eligible participant to subscribe for
one ordinary share. Except in jurisdictions where restrictions apply, the granted share options are expected to be settled in equity;
grants that the Group has the legal or constructive obligation to settle in cash are insignificant to the Group. The total number of
shares under options that can be granted under the scheme is 301,100,000 (2011: 301,100,000), representing 2.5 per cent (2011:
2.5 per cent) of the number of shares in issue at 30 November 2012. The measurement dates for share option grants made in
June2011andMarch2012weredeterminedtobe15June2011and15March2012respectively,inaccordancewithIFRS2.

AIA Group Limited Annual Report 2012
200
Notes to the Consolidated Financial Statementsand Significant Accounting Policies
FINANCIAL STATEMENTS
38. share-based compensaTIon (continued)
share-based compensation plans (continued)
so scheme (continued)
Information about share options outstanding and share options exercisable by the Group’s employees and directors as at the end
of the reporting period is as follows:
year ended30 november 2012
Year ended30 November 2011
number of share options
weighted average
exercise price
Number of share options
Weighted average
exercise price(hK$) (HK$)
Share options
Outstanding at beginning of financial year 20,426,519 27.35 – –Granted 7,816,367 28.40 20,426,519 27.35Forfeited or expired (71,629) 27.35 – –
Outstanding at end of financial year 28,171,257 27.64 20,426,519 27.35
Share options exercisable at end of financial year – – – –Weighted average remaining contractual life (years) 8.72 9.50
The share options outstanding as of 30 November 2012 have an exercise price of between HK$27.35 and HK$28.40.
espp
Under the plan, eligible employees of the Group can purchase ordinary shares of the Company with qualified employee
contributions and the Company will award one matching restricted stock purchase unit to them at the end of the vesting period for
each two shares purchased through the qualified employee contributions (contribution shares). Contribution shares are purchased
from the open market. During the vesting period, the eligible employees must hold the contribution shares purchased during the
plan cycle and remain employed by the Group. The level of qualified employee contribution is limited to not more than 5 per cent
of the annual basic salary subject to a maximum of US$15,000 per annum. The granted matching restricted stock purchase units
are expected to be settled in equity. For the year ended 30 November 2012, eligible employees paid US$6 million (2011: less than
US$1 million) to purchase 1,630,722 ordinary shares (2011: 232,328 ordinary shares) of the Company.
aspp
The structure of the ASPP generally follows that of the ESPP, the key difference being that the eligible agents are required to pay
a subscription price of US$1 to subscribe for each new share in the Company at the end of the vesting period. Under the plan,
eligible agents of the Group can purchase ordinary shares of the Company with qualified agent contributions and the Company
will award one matching restricted stock subscription unit to them at the end of the vesting period for each two shares purchased
through the qualified agent contributions (agent contribution shares). Each restricted stock subscription unit entitles eligible agents
to subscribe for one new share in the Company. Agent contribution shares are purchased from the open market. During the
vesting period, the eligible agents must hold the contribution shares purchased during the plan cycle and maintain their agent
contracts with the Group. The granted matching restricted stock subscription units are expected to be settled in equity. The level
of qualified agent contribution is subject to a maximum of US$15,000 per annum. For the year ended 30 November 2012, eligible
agents paid US$4 million to purchase 1,130,720 ordinary shares of the Company.

AD
DIT
ION
AL
INF
OR
MA
TIO
NF
INA
NC
IAL
ST
AT
EM
EN
TS
201
CO
RP
OR
AT
E G
OV
ER
NA
NC
EO
VE
RV
IEW
FIN
AN
CIA
L A
ND
OP
ER
ATI
NG
RE
VIE
W
Notes to the Consolidated Financial Statements and Significant Accounting Policies
38. share-based compensaTIon (continued)
valuation methodologyThe Group utilises a binomial lattice model to calculate the fair value of the share option grants, a Monte-Carlo simulation model and/or discounted cash flow technique to calculate the fair value of the RSU, ESPP and ASPP awards, taking into account the terms and conditions upon which the awards were granted. The price volatility is estimated on the basis of implied volatility of the Company’s shares which is based on an analysis of historical data since they are traded in the Hong Kong Stock Exchange andtakesintoconsiderationthehistoricalvolatilityofpeercompanies(theconstituentcompaniesinDowJonesInsuranceTitans30 Index) in view of the short trading history of the Company’s shares on the measurement date. The expected life of the share options is derived from the output of the valuation model and is calculated based on an analysis of expected exercise behaviour of the Company’s employees. The estimate of market condition for performance-based RSUs is based on one-year historical data preceding the grant date. No allowance for forfeiture prior to vesting is included in the valuation of the awards.
The fair value calculated for share options are inherently subjective due to the assumptions made and the limitations of the model utilised.
year ended 30 november 2012
share optionsrestricted
share units
espp restricted
stock purchase
units
aspp restricted
stock subscription
units
AssumptionsRisk-free interest rate 1.44% 0.20% – 0.36%* 0.19% – 0.49% 0.16% – 0.40%Volatility 30% 30% 25% – 30% 30%Dividend yield 1.2% 1.2% – 1.3% 1.2% – 1.3% 1.2% – 1.3%Exercise price (HK$) 28.40 n/a n/a n/aShare option life (in years) 10 n/a n/a n/aExpected life (in years) 7.4 n/a n/a n/aWeighted average fair value per option/unit at
measurement date (HK$) 8.71 23.74 27.43 18.96
* Applicable to RSU with market conditions.
Year ended 30 November 2011
Share optionsRestricted
share units
ESPP Restricted
stock purchase
units
ASPP Restricted
stock subscription
units
AssumptionsRisk-free interest rate 2.28% 0.24% – 0.51%* 0.32% – 0.37% n/aVolatility 25% 25% 25% n/aDividend yield 1.2% 1.2% 1.2% n/aExercise price (HK$) 27.35 n/a n/a n/aShare option life (in years) 9.96 n/a n/a n/aExpected life (in years) 7.42 – 7.87 n/a n/a n/aWeighted average fair value per option/unit at
measurement date (HK$) 7.68 24.73 22.96 n/a
* Applicable to RSU with market conditions.
The weighted average share price for share option valuation for grants made during the year ended 30 November 2012 is HK$28.40 (2011: HK$27.25). The total fair value of share options granted during the year ended 30 November 2012 is US$9m (2011: US$20m).
recognised compensation costThe total recognised compensation cost (net of expected forfeitures) related to various share-based compensation awards granted under the RSU Scheme, SO Scheme, ESPP and ASPP by the Group for the year ended 30 November 2012 is US$45m (2011: US$16m).

AIA Group Limited Annual Report 2012
202
Notes to the Consolidated Financial Statementsand Significant Accounting Policies
FINANCIAL STATEMENTS
39. remuneraTIon of dIrecTors and Key manaGemenT personnel
directors’ remunerationThe Executive Director receives compensation in the form of salaries, bonuses, contributions to pension schemes, long-term incentives, housing and other allowances, and benefits in kind subject to applicable laws, rules and regulations. Bonuses and long-term incentives represent the variable components in the Executive Directors’ compensation and are linked to the performance of the Group and the Executive Director. Details of share-based payment schemes are described in note 38.
US$directors’
fees
salaries, allowances
and benefits in kind bonuses
pension scheme
contributions
post- employment
benefitsshare-based
paymentsInducement
feesTermination
fees Total
Year ended 30 November 2012
Executive DirectorMr. Mark Edward Tucker – 1,905,036 3,924,300 77,732 15,994 5,646,971 – – 11,570,033
Total – 1,905,036 3,924,300 77,732 15,994 5,646,971 – – 11,570,033
US$Directors’
fees
Salaries, allowances
and benefits in kind Bonuses
Pension scheme
contributions
Post- employment
benefitsShare-based
paymentsInducement
feesTermination
fees Total
Year ended 30 November 2011
Executive DirectorMr. Mark Edward Tucker – 1,568,066 3,773,400 64,734 11,383 2,375,885 – – 7,793,468
Total – 1,568,066 3,773,400 64,734 11,383 2,375,885 – – 7,793,468
The remuneration of Non-executive Directors and Independent Non-executive Directors of the Company at 30 November 2012 and 2011 are included in the tables below:
US$directors’
fees
salaries, allowances
and benefits in kind bonuses
pension scheme
contributions
post- employment
benefitsshare-based
paymentsInducement
feesTermination
fees Total
Year ended 30 November 2012
Non-executive DirectorsMr. Edmund Sze-Wing Tse(1) 535,541 75,168 – – – – – – 610,709Mr.JeffreyJoyHurd(3) – – – – – – – – –Mr.JayStevenWintrob(3) – – – – – – – – –Independent
Non-executive DirectorsMr.JackChak-KwongSo(4) 215,301 – – – – – – – 215,301Mr. Chung-Kong Chow 233,197 – – – – – – – 233,197Dr. Qin Xiao 233,142 – – – – – – – 233,142Mr.JohnBarrieHarrison 225,601 – – – – – – – 225,601Mr. Barry Chun-Yuen
Cheung(2) 33,798 – – – – – – – 33,798Mr. George Yong-Boon Yeo(2) 14,385 – – – – – – – 14,385Dr. Narongchai Akrasanee(2) 5,191 – – – – – – – 5,191Mr. Rafael Si-Yan Hui(3) 71,530 – – – – – – – 71,530
Total 1,567,686 75,168 – – – – – – 1,642,854

AD
DIT
ION
AL
INF
OR
MA
TIO
NF
INA
NC
IAL
ST
AT
EM
EN
TS
203
CO
RP
OR
AT
E G
OV
ER
NA
NC
EO
VE
RV
IEW
FIN
AN
CIA
L A
ND
OP
ER
ATI
NG
RE
VIE
W
Notes to the Consolidated Financial Statements and Significant Accounting Policies
39. remuneraTIon of dIrecTors and Key manaGemenT personnel (continued)
directors’ remuneration (continued)
Notes:
(1) Included in directors’ fees is US$18,940 which represents remuneration to Mr. Edmund Sze-Wing Tse in respect of his services as director of a subsidiary of the Company.
(2) Mr. Barry Chun-Yuen Cheung, Mr. George Yong-Boon Yeo and Dr. Narongchai Akrasanee were appointed as directors of the Company on 20 September 2012, 2 November 2012 and 21 November 2012, respectively.
(3) Mr.JeffreyJoyHurdandMr.JayStevenWintrobresignedasdirectorsoftheCompanyon8March2012andMr.RafaelSi-YanHuiresignedasdirectorofthe Company on 29 March 2012.
(4) Mr.JackChak-KwongSowasre-designatedasIndependentNon-executiveDirectoroftheCompanywitheffectfrom26September2012.
US$Directors’
fees
Salaries, allowances
and benefits in kind Bonuses
Pension scheme
contributions
Post- employment
benefitsShare-based
paymentsInducement
feesTermination
fees Total
Year ended
30 November 2011
Non-executive Directors
Mr. Edmund Sze-Wing Tse(1) 501,896 76,098 – – – – – – 577,994Mr.JackChak-KwongSo 215,000 – – – – – – – 215,000Mr.JeffreyJoyHurd – – – – – – – – –Mr.JayStevenWintrob – – – – – – – – –Independent
Non-executive Directors
Mr. Chung-Kong Chow 235,000 – – – – – – – 235,000Mr. Rafael Si-Yan Hui 220,000 – – – – – – – 220,000Dr. Qin Xiao 226,616 – – – – – – – 226,616Mr.JohnBarrieHarrison 94,315 – – – – – – – 94,315
Total 1,492,827 76,098 – – – – – – 1,568,925
Note:
(1) Included in directors’ fees is US$18,159 which represents remuneration to Mr. Edmund Sze-Wing Tse in respect of his services as director of a subsidiary of the Company.
remuneration of five highest paid individuals
The aggregate remuneration of the five highest paid individuals employed by the Group in each of the years ended 30 November
2012 and 2011 is presented in the table below.
US$
Salaries, allowances
and benefits in kind Bonuses
Pension scheme
contributions
Post- employment
benefitsShare-based
paymentsInducement
feesTermination
fees Total
Year ended
30 November 2012 6,307,954 8,359,300 199,762 47,438 12,731,677 – – 27,646,131
30 November 2011 7,374,823 10,193,295 178,683 20,273 4,786,939 – – 22,554,013

AIA Group Limited Annual Report 2012
204
Notes to the Consolidated Financial Statementsand Significant Accounting Policies
FINANCIAL STATEMENTS
39. remuneraTIon of dIrecTors and Key manaGemenT personnel (continued)
remuneration of five highest paid individuals (continued)
The emoluments of the five individuals with the highest emoluments are within the following bands:
HK$
year ended 30 november
2012
Year ended 30 November
2011
24,000,001 to 24,500,000 – 125,000,001 to 25,500,000 1 –27,500,001 to 28,000,000 – 128,500,001 to 29,000,000 1 –31,000,001 to 31,500,000 – 131,500,001 to 32,000,000 – 132,500,001 to 33,000,000 1 –38,000,001 to 38,500,000 1 –60,500,001 to 61,000,000 – 189,500,001 to 90,000,000 1 –
Key management personnel remunerationKey management personnel have been identified as the members of the Group’s Executive Committee and Executive Director of the Company’s Board.
US$
year ended 30 november
2012
Year ended 30 November
2011
Key management compensation and other expensesSalaries and other short-term employee benefits 23,356,919 24,195,898Termination benefits – 422,374Post-employment benefits – defined contribution 395,984 366,772Post-employment benefits – defined benefit – –Post-employment benefits – medical & life 100,397 52,510Other long-term benefits 468,426 1,236,641Share-based payment 17,730,158 7,193,522
Total 42,051,884 33,467,717
The emoluments of the Key Management Personnel are within the following bands:
US$
year ended 30 november
2012
Year ended 30 November
2011
500,001 to 1,000,000 – 11,000,001 to 1,500,000 1 21,500,001 to 2,000,000 1 32,000,001 to 2,500,000 – 32,500,001 to 3,000,000 2 –3,000,001 to 3,500,000 3 13,500,001 to 4,000,000 1 24,000,001 to 4,500,000 1 –4,500,001 to 5,000,000 1 –7,500,001 to 8,000,000 – 111,500,001 to 12,000,000 1 –

AD
DIT
ION
AL
INF
OR
MA
TIO
NF
INA
NC
IAL
ST
AT
EM
EN
TS
205
CO
RP
OR
AT
E G
OV
ER
NA
NC
EO
VE
RV
IEW
FIN
AN
CIA
L A
ND
OP
ER
ATI
NG
RE
VIE
W
Notes to the Consolidated Financial Statements and Significant Accounting Policies
40. relaTed parTy TransacTIonsRemuneration of directors and key management personnel is disclosed in note 39.
41. commITmenTs and conTInGencIescommitments under operating leasesTotal future aggregate minimum lease payments under non-cancellable operating leases are as follows:
year ended 30 november
Year ended 30 November
US$m 2012 2011
Properties and others expiring
Not later than one year 79 80Later than one and not later than five years 103 102Later than five years 32 36
Total 214 218
The Group is the lessee in respect of a number of properties and items of office equipment held under operating leases. The leases typically run for an initial period of one to ten years, with an option to renew the lease when all terms are renegotiated. Lease payments are usually increased at the end of the lease term to reflect market rates. None of the leases include contingent rentals.
Investment and capital commitments
year ended 30 november
Year ended 30 November
US$m 2012 2011
Not later than one year 641 396Later than one and not later than five years 63 31Later than five years 4 2
Total 708 429
Investment and capital commitments consist of commitments to invest in private equity partnerships and other assets.
contingenciesThe Group is subject to regulation in each of the geographical markets in which it operates from insurance, securities, capital markets, pension, data privacy and other regulators and is exposed to the risk of regulatory actions in response to perceived or actual non-compliance with regulations relating to suitability, sales or underwriting practices, claims payments and procedures, product design, disclosure, administration, denial or delay of benefits and breaches of fiduciary or other duties. The Group believes that these matters have been adequately provided for in these financial statements.
The Group is exposed to legal proceedings, complaints and other actions from its activities including those arising from commercial activities, sales practices, suitability of products, policies and claims. The Group believes these matters are adequately provided for in these financial statements.
The Group is the reinsurer in a residential mortgage credit reinsurance agreement covering residential mortgages in Australia. Duetoachangeinlaw,furthercessionsunderthiscontractendedinJuly2008.Thisreinsurancewasfullyretrocededtoasubsidiary of AIG and this retrocession was terminated in February 2012 on a run-off basis. The Group is exposed to the risk of losses in the event of the failure of the counterparty retrocessionaire to honour its outstanding obligations which is mitigated by a trust agreement put in place after the aforesaid termination. The principal balance outstanding of mortgage loans to which the reinsurance agreement relates were approximately US$1,877m at 30 November 2012 (2011: US$2,525m). The liabilities and related reinsurance assets, which totalled US$11m (2011: US$11m), respectively, arising from these agreements are reflected and presented on a gross basis in these financial statements in accordance with the Group’s accounting policies. The Group expects to fully recover amounts outstanding at the reporting date under the terms of this agreement from the retrocessionaire.
At 30 November 2012, the Group has issued capital guarantees and guarantees of indebtedness and minimum guaranteed rates of return ranging from 0 per cent to 5 per cent to holders of units of pension funds that have an accumulation value of approximately US$1,477m (2011: US$1,336m). The Group has the ability to reduce the guaranteed rates of return, subject to obtaining approvals of applicable regulators.

AIA Group Limited Annual Report 2012
206
Notes to the Consolidated Financial Statementsand Significant Accounting Policies
FINANCIAL STATEMENTS
42. subsIdIarIes
The principal subsidiary companies which materially contribute to the net income of the Group or hold a material element of its
assets and liabilities are:
Place ofincorporation and operation
Principal activity Issued share capital
Group’s interest %
as at 30 november
2012
As at 30 November
2011
American International Assurance Company, Limited(1)(3) (AIA Co.)
Hong Kong Insurance 805,902,610 ordinary shares ofUS$5 each
100% 100%
American International Assurance Company (Bermuda) Limited (AIA-B)
Bermuda Insurance 3,000,000 ordinary shares ofUS$1.20 each
100% 100%
AIA Australia Limited Australia Insurance 77,068,300 ordinary shares ofA$1 each
100% 100%
AIA Pension and Trustee Company Limited
BritishVirginIslands
Trusteeship 1,300,000 ordinary shares of US$1 each
100% 100%
American International Assurance Berhad
Malaysia Insurance 241,706,000 ordinary shares of RM1 each
100% 100%
PT AIA Financial Indonesia Insurance 477,711,032 ordinary shares of Rp1,000 each
100% 100%
The Philippine American Life and General Insurance Company
Philippines Insurance 200,000,000 ordinary shares ofPHP10 each
99.78% 99.78%
AIA(Vietnam)LifeInsuranceCompany Limited
Vietnam Insurance Contributed capital of VND1,034,836,791,693
100% 100%
Bayshore Development Group Limited
BritishVirginIslands
Investment holding company
100 ordinary shares of US$1 each
90% 90%
BPI-Philam Life Assurance Corporation
Philippines Insurance 749,993,979 ordinary shares of PHP1 each and 6,000 treasury shares
51% 51%
AIA Singapore Private Limited Singapore Insurance 1,374,000,001 ordinary shares ofS$1 each
100% 100%
Notes:
(1) The Company’s subsidiary.
(2) All of the above subsidiaries are audited by PricewaterhouseCoopers.
(3) On21January2013,AmericanInternationalAssuranceCompany,LimitedhaschangeditsnametoAIACompanyLimited.
All subsidiaries are unlisted.

AD
DIT
ION
AL
INF
OR
MA
TIO
NF
INA
NC
IAL
ST
AT
EM
EN
TS
207
CO
RP
OR
AT
E G
OV
ER
NA
NC
EO
VE
RV
IEW
FIN
AN
CIA
L A
ND
OP
ER
ATI
NG
RE
VIE
W
Notes to the Consolidated Financial Statements and Significant Accounting Policies
43. evenTs afTer The reporTInG perIod
On 5 December 2012, the Group completed the acquisition of 92.3 per cent of the issued share capital in Sri Lankan insurer
Aviva NDB Insurance (ANI). In addition, ANI has entered into an exclusive 20-year bancassurance agreement with the National
Development Bank in Sri Lanka. The acquisition will position the Group to develop a significant operation in the expanding Sri
Lankan market. The remaining 7.7 per cent of ANI not acquired represents shares publicly held and traded on the Colombo Stock
Exchange of Sri Lanka. The consideration with respect to the transaction of US$109 million was paid from existing cash resources;
the consideration amount is subject to purchase price adjustment which is expected to be finalised during 2013.
On 10 December 2012, the Group has entered into an unsecured, committed credit facility agreement (Credit Facility) for 18
months totalling US$1,725 million with a group of international banks. The Credit Facility bears interest based on LIBOR.
On 18 December 2012, the Group acquired 100 per cent of share capital of ING Management Holdings (Malaysia) Sdn. Bhd.
(ING Malaysia). ING Malaysia is the third largest life insurer in Malaysia based upon gross premiums earned for the year ended
31 December 2011. The acquisition presents the Group with a high calibre distribution force of over 9,000 agents and a long-
term bancassurance partnership with a leading Malaysian banking group, Public Bank. The consideration with respect to this
transaction was EUR1,332 million or US$1,754 million at exchange rates on the date of the transaction, and was paid from cash
financed initially through the Credit Facility. The Group utilised a foreign currency forward contract to economically hedge this
transaction. The foreign currency forward contract resulted in a gain of US$20 million which is included in investment experience
as hedge accounting was not applied. The Group intends to repay the bank credit facility with a combination of internal cash
resources and external debt financing.
The Group has the ability to exercise control over ANI and ING Malaysia through control of their voting rights. Due to the limited
time available between these acquisitions and the approval of these financial statements, the Group is still in the process of
establishing the fair value of the assets and liabilities acquired. Accordingly, certain disclosures relating to the above mentioned
business combinations have not been presented in these financial statements.
In October 2012, the Group entered into a Sale and Purchase agreement to acquire a building in Hong Kong for a consideration of
HK$2,398 million (approximately US$309 million). The transaction was completed on 11 December 2012.
On 27 February 2013, the Board of Directors proposed a final dividend of 24.67 Hong Kong cents per share (2011: 22.00 Hong
Kong cents per share).

AIA Group Limited Annual Report 2012
208
Financial Statements of the CompanyFINANCIAL STATEMENTS
sTaTemenT of fInancIal posITIon of The company
US$m Notes
as at30 november
2012
As at30 November
2011
AssetsInvestments in subsidiaries 2 13,994 13,994Amount due from subsidiary 3 1,040 –Derivative financial instruments 4 8 –Other assets 18 2Cash and cash equivalents 5 86 473
Total assets 15,146 14,469
LiabilitiesOther liabilities 13 7
Total liabilities 13 7
EquityIssued share capital 6 12,044 12,044Share premium 6 1,914 1,914Employee share-based trusts 6 (188) (105)Retained earnings 1,303 593Other reserves 7 60 16
Total equity 15,133 14,462
Total liabilities and equity 15,146 14,469
Notes:
(1) The financial information of the Company should be read in conjunction with the consolidated financial statements of the Group.
(2) Net profit of the Company for the years ended 30 November 2012 and 2011 were US$1,240m and US$689m, respectively.
Approved and authorised for issue by the Board of Directors on 27 February 2013.
Mark Edward Tucker Edmund Sze-Wing Tse
Director Director

AD
DIT
ION
AL
INF
OR
MA
TIO
NF
INA
NC
IAL
ST
AT
EM
EN
TS
209
CO
RP
OR
AT
E G
OV
ER
NA
NC
EO
VE
RV
IEW
FIN
AN
CIA
L A
ND
OP
ER
ATI
NG
RE
VIE
W
Financial Statements of the Company
noTes To fInancIal sTaTemenTs of The company
1. accounTInG polIcIes
Where applicable, the accounting policies of the Company are the same as for the Group as set out on pages 112 to 132. The
Company’s financial statements comply with both IFRS and HKFRS.
2. InvesTmenTs In subsIdIarIes
There is no movement in the Company’s investments in its subsidiaries during the year ended 30 November 2012 and 2011. See
note 42 to the Group’s consolidated financial statements for further information of the Company’s subsidiaries.
3. amounT due from subsIdIary
The balance is unsecured, interest-free and repayable on demand.
4. derIvaTIve fInancIal InsTrumenTs
The Company’s non-hedge derivative exposure was as follows:
US$m Notional amount Fair value
30 November 2012
Foreign exchange contracts
Forwards 3,468 8
Total 3,468 8
Details of derivative financial instruments are presented in note 21 to the Group’s consolidated financial statements.
5. cash and cash equIvalenTs
The cash and cash equivalents balance consists of cash of US$86m (2011: US$366m) and cash equivalents of US$nil (2011:
US$107m).
6. share capITal, share premIum and employee share-based TrusTs
Details of share capital, share premium and employee share-based trusts are presented in note 33 to the Group’s consolidated
financial statements.
7. oTher reserves
Other reserves comprise of share-based compensation recognised under the RSU Scheme, ESPP, ASPP and Share Option
Scheme.
8. rIsK manaGemenT
Risk management in the context of the Group is discussed in note 36 to the Group’s consolidated financial statements.
The business of the Company is managing its investments in subsidiaries and associates operations. Its risks are considered to
be the same as those described in the context of the consolidated group. Such investments are held by the Company at cost in
accordance with accounting policy discussed in note 2.3 to the Group’s consolidated financial statements.
Financial assets, other than investments in subsidiaries and associates, largely consist of cash and cash equivalents.

AIA Group Limited Annual Report 2012
210
Financial Statements of the CompanyFINANCIAL STATEMENTS
noTes To fInancIal sTaTemenTs of The company (continued)
9. relaTed parTy TransacTIons
The Company receives dividend from subsidiaries and pays interest and expenses to those subsidiaries in the normal course of
business.
Except as disclosed elsewhere in the financial statements, there are no other material related party transactions.
10. conTInGencIes
During the year, the Company has issued a guarantee to a financial institution in respect of a loan of HK$2,507 million (approximately
US$323 million) borrowed by its subsidiary. The Company is exposed to the risk in the event of default payment by its subsidiary.
11. evenTs afTer The reporTInG perIod
Details of the events after the reporting period of the Company are presented in note 43 to the Group’s consolidated financial
statements.

AD
DIT
ION
AL
INF
OR
MA
TIO
NF
INA
NC
IAL
ST
AT
EM
EN
TS
211
CO
RP
OR
AT
E G
OV
ER
NA
NC
EO
VE
RV
IEW
FIN
AN
CIA
L A
ND
OP
ER
ATI
NG
RE
VIE
W
FINANCIAL STATEMENTS
Supplementary Embedded Value Information
Towers waTson reporT on The revIew of The supplemenTary embedded value InformaTIon
AIA Group Limited (the Company) and its subsidiaries (together, “AIA” or “the Group”) have prepared supplementary embedded
valueresults(EVResults)fortheyearended30November2012(thePeriod).TheseEVResults,togetherwithadescriptionofthe
methodologyandassumptionsthathavebeenused,areshownintheSupplementaryEmbeddedValueInformationsectionofthis
report.
TowersWatsonPennsylvaniaInc.,tradingasTowersWatson(TowersWatson)hasbeenengagedtoreviewtheGroup’sEVResults
and prior year comparisons. This opinion is made solely to the Company and, to the fullest extent permitted by applicable law,
Towers Watson does not accept or assume any responsibility, duty of care or liability to any third party for or in connection with its
review work, the opinions it has formed, or for any statement set forth in this opinion.
scope of worK
Our scope of work covered:
• Areviewofthemethodologyusedtocalculatetheembeddedvalueasat30November2012andthevalueofnewbusiness
for the 12-month period 1 December 2011 to 30 November 2012;
• Areviewoftheeconomicandoperatingassumptionsusedtocalculatetheembeddedvalueasat30November2012andthe
value of new business for the 12-month period 1 December 2011 to 30 November 2012; and
• AreviewoftheresultsofAIA’scalculationoftheEVResults.
In carrying out our review, Towers Watson has relied on data and information provided by the Group.
opInIon
Towers Watson has concluded that:
• ThemethodologyusedisconsistentwithrecentindustrypracticeforpubliclylistedcompaniesinHongKongasregards
traditional embedded value calculations based on discounted values of projected deterministic after-tax cash flows. This
methodology makes an overall allowance for risk for the Group through the use of risk discount rates which incorporate risk
margins and vary by Business Unit, together with an explicit allowance for the cost of holding required capital;
• Theeconomicassumptionsareinternallyconsistentandhavebeensetwithregardtocurrenteconomicconditions;and
• Theoperatingassumptionshavebeensetwithappropriateregardtopast,currentandexpectedfutureexperience,takinginto
account the nature of the business conducted by each Business Unit.
Towers Watson has performed a number of high-level checks on the models, processes and the results of the calculations,
and has confirmed that no issues have been discovered that have a material impact on the disclosed embedded value as at 30
November 2012, the value of new business for the 12-month period 1 December 2011 to 30 November 2012, the analysis of
movement in embedded value for the 12-month period ended 30 November 2012, and the sensitivity analysis.
Towers Watson
27 February 2013

AIA Group Limited Annual Report 2012
212
Supplementary Embedded Value InformationFINANCIAL STATEMENTS
cauTIonary sTaTemenTs concernInG ev
This report includes non-IFRS financial measures and should not be viewed as a substitute for IFRS financial measures.
The results shown in this report are not intended to represent an opinion of market value and should not be interpreted in that
manner. This report does not purport to encompass all of the many factors that may bear upon a market value.
The results shown in this report are based on a series of assumptions as to the future. It should be recognised that actual future
results may differ from those shown, on account of changes in the operating and economic environments and natural variations in
experience. The results shown are presented at the valuation dates stated in this report and no warranty is given by the Group that
future experience after these valuation dates will be in line with the assumptions made.

AD
DIT
ION
AL
INF
OR
MA
TIO
NF
INA
NC
IAL
ST
AT
EM
EN
TS
213
CO
RP
OR
AT
E G
OV
ER
NA
NC
EO
VE
RV
IEW
FIN
AN
CIA
L A
ND
OP
ER
ATI
NG
RE
VIE
W
Supplementary Embedded Value Information
1. hIGhlIGhTsTheembeddedvalue(EV)isameasureofthevalueofshareholders’interestsintheearningsdistributablefromassetsallocatedtothe in-force business after allowance for the aggregate risks in that business. The Group uses a traditional deterministic discounted cashflowmethodologyfordeterminingitsEVandvalueofnewbusiness(VONB).
This methodology makes implicit allowance for all sources of risk including the cost of investment return guarantees and policyholder options, asset-liability mismatch risk, credit risk, the risk that actual experience in future years differs from that assumed,andfortheeconomiccostofcapital,throughtheuseofarisk-adjusteddiscountrate.MoredetailsoftheEVResults,methodology and assumptions are covered in later sections of this report.
Table1.1summarisesthekeyresultsincludingtheadjustednetworth(ANW)andvalueofin-forcebusiness(VIF).
Table 1.1Summary Key Metrics(1) (US$ millions)
at 30 november
2012
At 30 November
2011 Growth
Embeddedvalue(EV) 31,408 27,239 15%
Adjusted net worth (ANW) 13,170 10,906 21%
Valueofin-forcebusiness(VIF) 18,238 16,333 12%
12 months ended
30 november 2012
12 months ended
30 November 2011 YoY
Annualised new premium (ANP) (2) (3) 2,696 2,472 9%
Valueofnewbusiness(VONB) 1,188 932 27%
VONBmargin (3) 43.6% 37.2% 6.4 pps
Notes:(1) The results are after adjustments to reflect additional Hong Kong reserving and capital requirements and the after-tax value of unallocated Group Office
expenses.(2) ANP represents 100 per cent of annualised first year premiums and 10 per cent of single premiums, before reinsurance ceded.(3) ANPandVONBmarginexcludecorporatepensionbusiness.
VONBgrewby27percenttoUS$1,188millionnetoftaxcomparedwith2011.Thisperformancewasdrivenbyincreasesinbothvolumeandmargin.VONBmarginincreasedby6.4percentagepointsto43.6percentandANPgrewby9percenttoUS$2,696million compared with 2011.
EVgrewtoUS$31,408millionat30November2012,anincreaseof15percentfromUS$27,239millionat30November2011.
EVoperatingprofitgrewby12percenttoUS$3,491millioncomparedwith2011.ThiswastheresultofahigherexpectedreturnofUS$2,192milliononthehigheropeningEV,ahigherVONBofUS$1,188millionandoverallpositiveoperatingexperiencevariances and operating assumption changes which totalled US$111 million.
Non-operatingEVmovementsincludedpositiveinvestmentreturnvariancesofUS$933million,negativeeffectofchangesineconomic assumptions of US$105 million and negative other non-operating variances of US$113 million. This was partly offset by the payment of dividends of US$530 million and negative other capital movements of US$42 million. Foreign exchange movements benefitedtheEVbyUS$535million.
TheEVasat30November2012includesANWofUS$13,170millionandVIFofUS$18,238million,up21percentand12percent respectively compared with 30 November 2011.

AIA Group Limited Annual Report 2012
214
Supplementary Embedded Value InformationFINANCIAL STATEMENTS
2. ev resulTs
2.1 embedded value by business unit
TheEVasat30November2012isdetailedinTable2.1below.ResultsarepresentedseparatelyforthesixlargestBusinessUnits,
with those for the remaining Business Units presented together under the category “Other Markets”. This is consistent with the
segment information in the IFRS financial statements. Section 4.1 of this report contains a full list of the entities included in the
report and the mapping of these entities to “Business Units” for the purpose of the report.
Table 2.1
Summary of the EV by Business Unit (US$ millions)
At 30 November 2012
At 30 November
2011
Business Unit ANW(1)VIF before
CoC(2) CoC(2)VIF after
CoC(2) ev EV(4)
AIA Hong Kong 3,415 7,118 474 6,644 10,059 9,536AIA Thailand 5,430 1,766 619 1,147 6,577 5,747AIA Singapore 1,684 2,561 606 1,955 3,639 2,969AIA Malaysia 646 713 153 560 1,206 1,046AIA China 513 1,835 156 1,679 2,192 1,765AIA Korea 1,501 581 351 230 1,731 1,659Other Markets 3,116 1,118 305 813 3,929 3,050Group Corporate Centre 5,443 269 4 265 5,708 4,495
Subtotal 21,748 15,961 2,668 13,293 35,041 30,267
Adjustment to reflect additional Hong Kong reserving and capital requirements(3) (8,578) 5,728 181 5,547 (3,031) (2,432)
After-tax value of unallocated Group Office expenses – (602) – (602) (602) (596)
Total 13,170 21,087 2,849 18,238 31,408 27,239
Notes:
(1) ANW by Business Unit is after net capital flows between Business Units and Group Corporate Centre as reported in the IFRS financial statements.
(2) CoC refers to the cost arising from holding the required capital as defined in Section 4.2 of this report.
(3) AdjustmenttoEVforthebranchesofAIACo.andAIA-B,asdescribedinSection4.4ofthisreport.FollowingthesubsidiarisationofAIASingaporeinJanuary2012,theadjustmentwasnolongermadeforAIASingaporeasof30November2012.TheadjustmentforAIASingaporewasUS$147millionasof 30 November 2011.
(4) Results of certain internal reinsurance have been reclassified from AIA Hong Kong to Group Corporate Centre to conform to current period presentation. Asaresult,theEVofAIAHongKonghasdecreasedbyUS$289million.ThereclassificationhasnoimpactontheEVoftheGroupasof30November2011.

AD
DIT
ION
AL
INF
OR
MA
TIO
NF
INA
NC
IAL
ST
AT
EM
EN
TS
215
CO
RP
OR
AT
E G
OV
ER
NA
NC
EO
VE
RV
IEW
FIN
AN
CIA
L A
ND
OP
ER
ATI
NG
RE
VIE
W
Supplementary Embedded Value Information
2. ev resulTs (continued)
2.2 reconciliation of anw to Ifrs equity
Table 2.2 sets out the derivation of ANW from IFRS equity as at 30 November 2012.
Table 2.2
Derivation of the Group ANW from IFRS equity (US$ millions)
at 30 november
2012
At 30 November
2011
IFRS equity attributable to shareholders of the Company 26,697 21,313Elimination of IFRS deferred acquisition and origination costs asset (14,161) (12,818)Difference between IFRS policy liabilities and local statutory
policyliabilities(forentitiesincludedintheEVResults) 6,659 7,961
Difference between net IFRS policy liabilities and local statutorypolicyliabilities(forentitiesincludedintheEVResults) (7,502) (4,857)
Mark-to-market adjustment for property and mortgage loan investments, net of amounts attributable to participating funds 2,163 2,003
Elimination of intangible assets (292) (276)Recognition of deferred tax impacts of the above adjustments 795 652Recognition of non-controlling interests impacts of the above adjustments (113) (93)
Group ANW (local statutory basis) 21,748 18,742Adjustment to reflect additional Hong Kong reserving requirements, net of tax (8,578) (7,836)
Group ANW (after additional Hong Kong reserving requirements) 13,170 10,906

AIA Group Limited Annual Report 2012
216
Supplementary Embedded Value InformationFINANCIAL STATEMENTS
2. ev resulTs (continued)
2.3 breakdown of anw
Table 2.3 shows the breakdown of the ANW for the Group between the required capital, as defined in Section 4.6 of this report,
and the free surplus, which is the ANW in excess of the required capital.
Table 2.3
Free surplus and required capital for the Group (US$ millions)
at 30 november 2012 At 30 November 2011
localstatutory
basis
hong Kongbasis for
branches ofaIa co. and
aIa-b
Localstatutory
basis
Hong Kongbasis for
branches ofAIA Co. and
AIA-B
Free surplus 16,082 6,643 14,089 5,930Required capital 5,666 6,527 4,653 4,976
ANW 21,748 13,170 18,742 10,906
The Company’s subsidiaries, AIA Co. and AIA-B, are both Hong Kong-regulated entities subject to Hong Kong statutory
requirements. The business written in the branches of AIA Co. and AIA-B is subject to the local reserving and capital requirements
in the relevant territory and the Hong Kong reserving and capital requirements applicable to AIA Co. and AIA-B at the entity level.
At 30 November 2012, the more onerous reserving basis for both AIA Co. and AIA-B was the Hong Kong basis. Therefore, the
Group’s free surplus at 30 November 2012 reduced by US$9,439 million (2011: US$8,159 million) under the Hong Kong basis
compared to the local statutory basis, reflecting US$8,578 million (2011: US$7,836 million) higher reserving requirements and
US$861 million (2011: US$323 million) higher required capital under the Hong Kong basis for branches of AIA Co. and AIA-B.
2.4 earnings profile
Table 2.4 shows how the after-tax distributable earnings from the assets backing the statutory reserves and required capital of the
in-force business of the Group are projected to emerge over future years. The projected values reflect the Hong Kong reserving
and capital requirements for the branches of AIA Co. and AIA-B.
Table 2.4
Profile of projected after-tax distributable earnings for the Group’s in-force business (US$ millions)
At 30 November 2012
Financial year Undiscounted Discounted
2013 – 2017 11,870 9,7762018 – 2022 10,748 5,7432023 – 2027 10,142 3,7102028 – 2032 9,046 2,2602032+ 37,448 3,276
Total 79,254 24,765
The profile of distributable earnings is shown on an undiscounted and discounted basis. The discounted value of after-tax
distributableearningsofUS$24,765millionplusthefreesurplusofUS$6,643millionshowninTable2.3isequaltotheEVof
US$31,408 million shown in Table 2.1.

AD
DIT
ION
AL
INF
OR
MA
TIO
NF
INA
NC
IAL
ST
AT
EM
EN
TS
217
CO
RP
OR
AT
E G
OV
ER
NA
NC
EO
VE
RV
IEW
FIN
AN
CIA
L A
ND
OP
ER
ATI
NG
RE
VIE
W
Supplementary Embedded Value Information
2. ev resulTs (continued)
2.5 value of new business
TheVONBfortheGroupforthe12-monthperiodfrom1December2011to30November2012issummarisedinTable2.5below.
TheVONBisdefinedasthepresentvalue,atthepointofsale,oftheprojectedafter-taxstatutoryprofitslessthecostofrequired
capital. Results are presented separately for the six largest Business Units, with those for the remaining Business Units presented
together under the category “Other Markets”. This is consistent with the segment information in the IFRS financial statements.
Section 4.1 of this report contains a full list of the entities included in the report and the mapping of these entities to “Business
Units” for the purpose of the report.
TheGroupVONBforthe12monthsended30November2012wasUS$1,188million,anincreaseofUS$256million,or27
percent,fromUS$932millioninthesameperiodin2011.VONBgrowthbenefitedfromanexpansionoftheVONBmargin,
which increased from 37.2 per cent for the 12 months ended 30 November 2011 to 43.6 per cent for the 12 months ended 30
November 2012, and 9 per cent growth in ANP.
Table 2.5
Summary of VONB by Business Unit (US$ millions)
12 months ended30 November 2012
12 months ended
30 November 2011
Business UnitVONB before
CoC(1) CoC(1)vonb after
coc(1) (3)VONB after
CoC(1) (3)
AIA Hong Kong 420 54 366 305AIA Thailand(4) 348 61 287 227AIA Singapore 277 51 226 164AIA Malaysia 84 16 68 58AIA China 144 20 124 102AIA Korea 78 10 68 74Other Markets 195 33 162 112
Total before unallocated Group Office expenses (local statutory basis) 1,546 245 1,301 1,042
Adjustment to reflect additional Hong Kong reserving and capital requirements(2) (55) (14) (41) (49)
Total before unallocated Group Office expenses (after additional Hong Kong reserving and capital requirements) 1,491 231 1,260 993
After-tax value of unallocated Group Office expenses (72) – (72) (61)
Total 1,419 231 1,188 932
Notes:
(1) CoC refers to the cost arising from holding the required capital as defined in Section 4.2 of this report.
(2) AdjustmenttoVONBforthebranchesofAIACo.andAIA-B,asdescribedinSection4.4ofthisreport.FollowingthesubsidiarisationofAIASingaporeinJanuary2012,theadjustmentwasnolongermadeforAIASingaporeforconsistencyoverthewhole12-monthperiodfrom1December2011to30November 2012. The adjustment for AIA Singapore was US$(14) million for the 12-month period ended 30 November 2011.
(3) VONBfortheGroupiscalculatedbeforedeductingtheamountattributabletonon-controllinginterests.TheamountsofVONBattributabletonon-controlling interests for the 12 months ended 30 November 2012 and 2011 were US$11 million and US$4 million respectively.
(4) ForAIAThailand,VONBforthe12-monthperiodended30November2012wascalculatedusingtheregulatoryRisk-BasedCapitalbasis.VONBforthe12-month period ended 30 November 2011 was calculated using the statutory reserving and solvency basis applicable prior to the implementation of the Risk-Based Capital requirements. The difference arising from the change in methodologies was not material.

AIA Group Limited Annual Report 2012
218
Supplementary Embedded Value InformationFINANCIAL STATEMENTS
2. ev resulTs (continued)
2.5 value of new business (continued)
Table2.6showstheVONBmarginfortheGroup.TheVONBmarginisdefinedasVONB,excludingcorporatepensionbusiness,
expressedasapercentageofANP.TheVONBforcorporatepensionbusinessisexcludedfromthemargincalculationtobe
consistent with the definition of ANP.
Table 2.6
Summary of VONB Margin by Business Unit (US$ millions)
12 months ended 30 November 2012
12 months ended 30 November
2011
Business Unit
VONB Excluding
Corporate Pension ANP(1)
vonb margin(1)
VONB Margin(1)
AIA Hong Kong 353 604 58.5% 56.1%AIA Thailand(3) 286 532 53.9% 48.8%AIA Singapore 226 339 66.8% 62.3%AIA Malaysia 68 151 45.2% 40.7%AIA China 124 215 57.5% 47.2%AIA Korea 68 237 28.4% 27.3%Other Markets 162 618 26.3% 18.8%
Total before unallocated Group Office expenses
(local statutory basis) 1,287 2,696 47.8% 41.6%
Adjustment to reflect additional Hong Kong reserving and capital requirements(2) (41) –
Total before unallocated Group Office
expenses (after additional Hong Kong
reserving and capital requirements) 1,246 2,696 46.2% 39.7%
After-tax value of unallocated Group Office expenses (72) –
Total 1,174 2,696 43.6% 37.2%
Notes:
(1) ANPandVONBmarginexcludecorporatepensionbusiness.
(2) AdjustmenttoVONBforthebranchesofAIACo.andAIA-B,asdescribedinSection4.4ofthisreport.FollowingthesubsidiarisationofAIASingaporeinJanuary2012,theadjustmentwasnolongermadeforAIASingaporeforconsistencyoverthewhole12-monthperiodfrom1December2011to30November 2012. The adjustment for AIA Singapore was US$(14) million for the 12-month period ended 30 November 2011.
(3) ForAIAThailand,VONBforthe12-monthperiodended30November2012wascalculatedusingtheregulatoryRisk-BasedCapitalbasis.VONBforthe12-month period ended 30 November 2011 was calculated using the statutory reserving and solvency basis applicable prior to the implementation of the Risk-Based Capital requirements. The difference arising from the change in methodologies was not material.

AD
DIT
ION
AL
INF
OR
MA
TIO
NF
INA
NC
IAL
ST
AT
EM
EN
TS
219
CO
RP
OR
AT
E G
OV
ER
NA
NC
EO
VE
RV
IEW
FIN
AN
CIA
L A
ND
OP
ER
ATI
NG
RE
VIE
W
Supplementary Embedded Value Information
2. ev resulTs (continued)
2.5 value of new business (continued)
Table2.7showsthebreakdownoftheVONBandtheVONBmarginfortheGroupbyquarterforbusinesswritteninthe12months
to30November2012.Forcomparisonpurposes,thequarterlyVONBandtheVONBmarginforbusinesswritteninthe12months
to 30 November 2011 are also shown in the same table.
Table 2.7
Summary of the VONB, ANP and VONB Margin by quarter for the Group (US$ millions)
Quartervonb after
coc(1) anp(2)vonb
margin(2)
Values for 2012
3 months ended 29 February 2012 232 543 42.1%
3 months ended 31 May 2012 280 644 43.1%
3 months ended 31 August 2012 300 696 42.6%
3 months ended 30 November 2012 376 813 45.8%
Values for 2011
3 months ended 28 February 2011 182 512 35.2%3 months ended 31 May 2011 217 582 36.7%3 months ended 31 August 2011(3) 245 766 31.6%3 months ended 30 November 2011 288 612 46.5%
Notes:
(1) CoC refers to the cost arising from holding the required capital as defined in Section 4.2 of this report.
(2) ANPandVONBmarginexcludecorporatepensionbusiness.
(3) ExcludingapreviouslyannouncedsinglelargegroupinsuranceschemeinAustralia,theVONBmarginwas36.0percent.

AIA Group Limited Annual Report 2012
220
Supplementary Embedded Value InformationFINANCIAL STATEMENTS
2. ev resulTs (continued)
2.6 analysis of ev movement
Table2.8showstheanalysisofmovementintheEVfrom30November2011to30November2012.
Table 2.8
Analysis of movement in EV (US$ millions)
12 months ended 30 November 2012
12 months ended
30 November 2011 YoY
ANW VIF ev EV EV
Opening EV 10,906 16,333 27,239 24,748 10%Valueofnewbusiness (924) 2,112 1,188 932 27%ExpectedreturnonEV 2,807 (615) 2,192 2,029 8%Operating experience variances (116) 256 140 165 (15)%Operating assumption changes (20) (9) (29) (21) 38%
EV operating profit 1,747 1,744 3,491 3,105 12%Investment return variances 554 379 933 (297) n/mEffect of changes in economic assumptions – (105) (105) (26) 304%Other non-operating variances 410 (523) (113) 18 n/m
Total EV profit 2,711 1,495 4,206 2,800 50%Dividends (530) – (530) (170) 212%Other capital movements (42) – (42) (89) (53)%Effect of changes in exchange rates 125 410 535 (50) n/m
Ending EV 13,170 18,238 31,408 27,239 15%
TheEVoperatingprofitgrewby12percenttoUS$3,491millionin2012(2011:US$3,105million).Theincreasereflectedahigher
VONBofUS$1,188million(2011:US$932million),US$2,192million(2011:US$2,029million)fromtheexpectedreturnonthe
higheropeningEVaswellaspositiveoperatingexperiencevariancesofUS$140million(2011:US$165million)andoperating
assumption changes of US$(29) million (2011: US$(21) million).
TheVONBshowninTable2.8ismeasuredatthepointofsaleforbusinesswrittenduringthePeriodbeforedeductingtheamount
attributabletonon-controllinginterests.TheexpectedreturnonEVistheexpectedchangeintheEVoverthePeriodplusthe
expectedreturnontheVONBfromthepointofsaleto30November2012lesstheVONBattributabletonon-controllinginterests.
OperatingexperiencevariancesreflecttheimpactontheANWandVIFfromdifferencesbetweentheactualexperienceoverthe
Period and that expected based on the operating assumptions.
AD
DIT
ION
AL
INF
OR
MA
TIO
NF
INA
NC
IAL
ST
AT
EM
EN
TS
221
CO
RP
OR
AT
E G
OV
ER
NA
NC
EO
VE
RV
IEW
FIN
AN
CIA
L A
ND
OP
ER
ATI
NG
RE
VIE
W
Supplementary Embedded Value Information
2. ev resulTs (continued)
2.6 analysis of ev movement (continued)
The main operating experience variances (net of tax) are:
• ExpensevariancesofUS$(23)million(2011:US$(33)million)includingnon-recurringprojectexpensesofUS$(27)million;
• MortalityandmorbidityclaimsvariancesofUS$152million(2011:US$149million);and
• PersistencyandothervariancesofUS$11million(2011:US$49million).
The overall effect of changes to operating assumptions during the Period was US$(29) million (2011: US$(21) million).
TheEVprofitofUS$4,206million(2011:US$2,800million)isthetotalofEVoperatingprofitplusinvestmentreturnvariances,the
effect of changes in economic assumptions and other non-operating variances.
The investment return variances arise from the impact of differences between the actual investment returns in the Period and the
expectedinvestmentreturns.ThisincludestheimpactontheEVofthechangesinthemarketvaluesandmarketyieldsonexisting
fixedincomeassets,andtheimpactontheEVofchangesintheeconomicassumptionsusedinthestatutoryreservingbases
for the Group. The investment return variances of US$933 million (2011: US$(297) million) were largely caused by positive market
movementscomparedwiththeassumptionsusedintheEVcalculationatthestartofthePeriodpartiallyoffsetbystatutoryreserve
movements.
The effect of changes in economic assumptions of US$(105) million (2011: US$(26) million) includes the impact of changes in long-
term investment return assumptions of US$(893) million (2011: US$(377) million) offset by the impact of changes in risk discount
rates of US$788 million (2011: US$351 million), reflecting consistent changes in long-term investment return assumptions and risk
discount rates.
Other non-operating variances amounted to US$(113) million (2011: US$18 million) and included:
• TaxadjustmentsresultinginagainofUS$256million(2011:US$(63)million),primarilyfromachangeinthecorporatetaxrate
in Thailand from 30 per cent to 23 per cent for assessment year 2012, 20 per cent for assessment years 2013 and 2014, and
30 per cent from assessment year 2015 onwards;
• AchangetoopeningEVofUS$(147)millionduetothetransferofinsurancebusinessinSingaporeofAIACo.fromabranchto
awholly-ownedsubsidiaryon1January2012;
• Restructuringandothernon-operatingcostsofUS$75million(2011:US$40million),plusthecurrentPeriodeffectofUS$(29)
million (2011: US$(38) million) for the Agency Incentive Plan which was a one-off initiative to improve agent activity and
productivity prior to the IPO of the Company. The remaining balance of the Agency Incentive Plan, estimated to be not more
than US$(113) million (2011: US$(142) million), will be recognised if and when the performance requirements for the incentive
awards are fulfilled in future;
• Modellingenhancements,accountingforthemajorityofthebalance.
The Group paid dividends of US$530 million (2011: US$170 million). Other capital movements of US$(42) million (2011: US$(89)
million) were mainly due to the purchase of shares held by employee share-based trusts.
The US$535 million (2011: US$(50) million) effect of changes in exchange rates reflects the translation gains and losses in respect
of exchange rate movements over the Period.

AIA Group Limited Annual Report 2012
222
Supplementary Embedded Value InformationFINANCIAL STATEMENTS
3. sensITIvITy analysIs
TheEVasat30November2012andtheVONBforthe12-monthperiod1December2011to30November2012havebeen
recalculated to illustrate the sensitivity of the results to changes in certain central assumptions discussed in Section 5.
The sensitivities analysed were:
• Riskdiscountrates200basispointsperannumhigherthanthecentralassumptions;
• Riskdiscountrates200basispointsperannumlowerthanthecentralassumptions;
• Interestrates50basispointsperannumhigherthanthecentralassumptions;
• Interestrates50basispointsperannumlowerthanthecentralassumptions;
• Lapseandpremiumdiscontinuanceratesincreasedproportionallyby10percent(i.e.110percentofthecentralassumptions);
• Lapseandpremiumdiscontinuanceratesdecreasedproportionallyby10percent(i.e.90percentofthecentralassumptions);
• Mortality/morbidityratesincreasedproportionallyby10percent(i.e.110percentofthecentralassumptions);
• Mortality/morbidityratesdecreasedproportionallyby10percent(i.e.90percentofthecentralassumptions);
• Maintenanceexpenses10percentlower(i.e.90percentofthecentralassumptions);and
• Expenseinflationsetto0percent.
TheEVasat30November2012hasbeenfurtheranalysedforthefollowingsensitivities:
• Pricesofequitysecuritiesheldincreasedproportionallyby10percent(i.e.110percentofthepricesat30November2012);
and
• Pricesofequitysecuritieshelddecreasedproportionallyby10percent(i.e.90percentofthepricesat30November2012).
For the interest rate sensitivities, the investment return assumptions and the risk discount rates were changed by 50 basis points
per annum; the projected bonus rates on participating business, the statutory reserving bases at 30 November 2012 and the
values of debt instruments held at 30 November 2012 were changed to be consistent with the interest rate assumptions in the
sensitivity analysis, while all of the other assumptions were unchanged.
For the equity price sensitivities, the projected bonus rates on participating business and the values of equity securities held at 30
November 2012 were changed to be consistent with the equity price assumptions in the sensitivity analysis, while all of the other
assumptions were unchanged.
For each of the remaining sensitivity analysis, the statutory reserving bases at 30 November 2012 and the projected bonus
rates on participating business were changed to be consistent with the sensitivity analysis assumptions, while all of the other
assumptions remain unchanged.
TheresultsoftheabovesensitivityanalysisareshownbelowinTable3.1fortheEVandinTable3.2fortheVONB.

AD
DIT
ION
AL
INF
OR
MA
TIO
NF
INA
NC
IAL
ST
AT
EM
EN
TS
223
CO
RP
OR
AT
E G
OV
ER
NA
NC
EO
VE
RV
IEW
FIN
AN
CIA
L A
ND
OP
ER
ATI
NG
RE
VIE
W
Supplementary Embedded Value Information
3. sensITIvITy analysIs (continued)
The sensitivities chosen do not represent the boundaries of possible outcomes, but instead illustrate how certain alternative
assumptions would affect the results.
Table 3.1
Sensitivity of the EV as at 30 November 2012 (US$ millions)
Scenario EV
Central value 31,408200 bps increase in risk discount rates 27,651200 bps decrease in risk discount rates 36,86610% increase in equity prices 31,96110% decrease in equity prices 30,84650 bps increase in interest rates 31,60550 bps decrease in interest rates 31,00710% increase in lapse/discontinuance rates 31,15710% decrease in lapse/discontinuance rates 31,71110% increase in mortality/morbidity rates 29,06310% decrease in mortality/morbidity rates 33,73210% decrease in maintenance expenses 31,813Expense inflation set to 0% 31,768
Table 3.2
Sensitivity of the VONB for the 12 months ended 30 November 2012 (US$ millions)
Scenario VONB
Central value 1,188200 bps increase in risk discount rates 833200 bps decrease in risk discount rates 1,70050 bps increase in interest rates 1,26150 bps decrease in interest rates 1,09910% increase in lapse rates 1,09410% decrease in lapse rates 1,29510% increase in mortality/morbidity rates 96210% decrease in mortality/morbidity rates 1,41210% decrease in maintenance expenses 1,239Expense inflation set to 0% 1,222

AIA Group Limited Annual Report 2012
224
Supplementary Embedded Value InformationFINANCIAL STATEMENTS
4. meThodoloGy
4.1 entities included in this report
The Group operates through a number of subsidiaries and branches. Its two main operating subsidiaries are American International
Assurance Company, Limited (AIA Co.), a subsidiary of the Company, and American International Assurance Company (Bermuda)
Limited (AIA-B), a subsidiary of AIA Co. Furthermore, AIA Co. has branches located in Brunei, China and Thailand and AIA-B has
brancheslocatedinHongKong,Korea,Macau,NewZealandandTaiwan.On21January2013,AmericanInternationalAssurance
Company, Limited has changed its name to AIA Company Limited.
The following is a full list of the entities and their mapping to “Business Units” for the purpose of this report.
• AIAAustraliareferstoAIAAustraliaLimited,asubsidiaryofAIACo.;
• AIAChinareferstotheChinesebranchesofAIACo.;
• AIAHongKongreferstothetotalofthefollowingthreeentities:
• theHongKongandMacaubranchesofAIA-B;
• theHongKongandMacaubusinesswrittenbyAIACo.;and
• AIAPensionandTrusteeCompanyLimited,asubsidiaryofAIACo.
• AIAIndonesiareferstoPTAIAFinancial,asubsidiaryofAIA-B;
• AIAKoreareferstotheKoreanbranchofAIA-B;
• AIANewZealandreferstotheNewZealandbranchofAIA-B;
• AIAMalaysiareferstoAmericanInternationalAssuranceBhd.,asubsidiaryofAIACo.,andits70percentownedsubsidiary
AIA AFG Takaful Bhd.;
• PhilamLifereferstoThePhilippineAmericanLifeandGeneralInsuranceCompany,asubsidiaryofAIACo.andits51percent
owned subsidiary BPI-Philam Life Assurance Corporation;
• AIASingaporereferstoAIASingaporePrivateLimited,asubsidiaryofAIACo.,andBruneibranchofAIACo.;
• AIAThailandreferstotheThailandbranchesofAIACo.;
• AIATaiwanreferstotheTaiwanesebranchofAIA-B;and
• AIAVietnamreferstoAIA(Vietnam)LifeInsuranceCompanyLimited,asubsidiaryofAIA-B.
In addition, the entity Tata AIA Life Insurance Company Limited (formerly known as Tata AIG Life Insurance Company Limited),
which is 26 per cent owned by AIA-B, has been included in the Group ANW presented in this report on an equity method
accounting basis.
ThesummaryoftheEVoftheGroupbyBusinessUnitinthisreportalsoincludesasegmentfor“GroupCorporateCentre”results.
The results shown for this segment consist of the ANW for the Group’s corporate functions and the present value of remittance
taxes payable on distributable profits to Hong Kong. The ANW has been derived as the IFRS equity for this segment plus mark-to-
market adjustments less the value of excluded intangible assets.
Results are presented separately for the six largest Business Units, with those for the remaining Business Units presented together
under the category “Other Markets”. This is consistent with the segment information in the IFRS financial statements. For the
VONBforthe12monthsto30November2012,“OtherMarkets”includesthepresentvalueofallowanceforremittancetaxes
payable on distributable profits to Hong Kong.

AD
DIT
ION
AL
INF
OR
MA
TIO
NF
INA
NC
IAL
ST
AT
EM
EN
TS
225
CO
RP
OR
AT
E G
OV
ER
NA
NC
EO
VE
RV
IEW
FIN
AN
CIA
L A
ND
OP
ER
ATI
NG
RE
VIE
W
Supplementary Embedded Value Information
4. meThodoloGy (continued)
4.2 embedded value and value of new business
TheGroupusesatraditionaldeterministicdiscountedcashflowmethodologyfordeterminingitsEVandVONB.Thismethodology
makes implicit allowance for all sources of risk including the cost of investment return guarantees and policyholder options,
asset-liability mismatch risk, credit risk, the risk that actual experience in future years differs from that assumed, and for the
economic cost of capital, through the use of a risk-adjusted discount rate. Typically, the higher the risk discount rate, the greater
the allowance for these factors. This is a common methodology used by life insurance companies in Asia currently. Alternative
valuation methodologies and approaches continue to emerge and may be considered by AIA.
ThebusinessincludedintheVIFandVONBcalculationsincludesalllifebusinesswrittenbytheBusinessUnitsoftheGroup,plus
other lines of business which may not be classified as life business but have similar characteristics. These include accident and
health,groupandpensionbusinesses.Theprojectedin-forcebusinessincludedintheVIFalsoincorporatesexpectedrenewalson
short-term business with a term of one year or less.
TheEVisthesumoftheANWandVIF.TheANWisthemarketvalueofassetsinexcessoftheassetsbackingthepolicyreserves
and other liabilities of the life (and similar) business of the Group, plus the IFRS equity value (excluding the value of intangible
assets) of other activities, such as general insurance business. It excludes any amounts not attributable to the shareholders of
the Group. The market value of investment properties and property held for use used to determine the ANW is based on the fair
value disclosed in the Group’s IFRS financial statements as at the valuation date. It is the Group’s policy to obtain external property
valuations annually except in the event of a discrete event occurring in the interim that has a significant impact on the fair value of
the properties.
TheVIFisthepresentvalueofprojectedafter-taxstatutoryprofitsemerginginthefuturefromthecurrentin-forcebusinessless
the cost arising from holding the required capital (CoC) to support the in-force business. CoC is calculated as the face value of
the required capital as at the valuation date less the present value of the net-of-tax investment return on the shareholder assets
backing required capital and the present value of projected releases from the assets backing the required capital. Where the
required capital may be covered by policyholder assets such as surplus assets in a participating fund there is no associated cost
ofcapitalincludedintheVIForVONB.
TheVONBisthepresentvalue,measuredatpointofsale,ofprojectedafter-taxstatutoryprofitsemerginginthefuturefromnew
business sold in the period less the cost of holding required capital in excess of regulatory reserves to support this business. The
VONBfortheGroupiscalculatedbasedonassumptionsapplicableatthepointofmeasurementandbeforedeductingtheamount
attributabletonon-controllinginterests.TheVONBattributabletonon-controllinginterestswasUS$11millionforthe12-month
period ended 30 November 2012 (US$4 million for the 12-month period ended 30 November 2011).
AdeductionhasbeenmadefromtheEVandVONBforthepresentvalueoffutureafter-taxunallocatedGroupOfficeexpenses,
representing the expenses incurred by the Group Office which are not allocated to the Business Units. These unallocated Group
Officeexpenseshavebeenallocatedtoacquisitionandmaintenanceactivities,andadeductionmadefromtheVONBandVIF
respectively.

AIA Group Limited Annual Report 2012
226
Supplementary Embedded Value InformationFINANCIAL STATEMENTS
4. meThodoloGy (continued)
4.3 definition of new business
New business includes the sale of new contracts during the period, additional single premium payments on recurrent single
premiumcontractsandincrementstoexistingcontractswherethesearenotvariationsallowedforinthecalculationoftheVIF.
TheVONBalsoincludesthepresentvalueofcashflowsassociatedwithnewpolicieswrittenduringthereportingperiodbut
subsequently terminated before the valuation date.
For group renewable business including group yearly renewable term business, new business is composed of new schemes set
up during the period plus any premium payable on existing schemes that exceeds the prior year’s premium.
For short-term accident and health business with a term of one year or less, renewals of existing contracts are not considered new
business,andthevalueofexpectedrenewalsonthisbusinessisincludedintheVIF.
For corporate pension business, only new schemes set up during the period are considered as new business for the calculation of
theVONB.
New business volumes shown in this report are measured using annualised new premium (ANP), which is an internal measure of
new business sales. This represents 100 per cent of annualised first year premiums and 10 per cent of single premiums, before
reinsurance ceded. It excludes new business sales for corporate pension business.
4.4 consolidation of hong Kong branches
The Group’s subsidiaries, AIA Co. and AIA-B, are both Hong Kong-regulated entities. AIA operates in a number of territories
as branches of these entities. Therefore, the business written in these branches is subject to the local reserving and capital
requirements in the relevant territory and the Hong Kong reserving and capital requirements applicable to AIA Co. and AIA-B at the
entity level.
Forthesebranches,theconsolidatedGroupEVresultsshowninSection2havebeencalculatedreflectingthemoreonerousof
the Hong Kong and branch level regulatory reserving and capital requirements. This was done because the ultimate distribution
of profits to shareholders of the Company from AIA Co. and AIA-B will depend on both the Hong Kong and the local regulatory
reserving and capital requirements. At the end of November 2012, the more onerous reserving basis for both AIA Co. and AIA-B
wastheHongKongregulatorybasis.ThisimpactisshownasaGroup-leveladjustmenttotheEVandVONB.TheEVandVONB
for each Business Unit reflect only the local reserving and capital requirements, as discussed in
Section 4.6.
4.5 valuation of future statutory losses
For certain lines of business, projected future statutory profits are negative due to the local statutory reserves being insufficient to
meet the value of future policyholder cash flows. Within a traditional embedded value framework, there are a number of acceptable
methods for determining the value of a combination of positive and negative statutory profits for different lines of business.
For the purposes of this valuation, future projected statutory losses have been valued by discounting them at the risk discount rate
for the relevant Business Unit. This has been done because the allowance for risk in the range of selected risk discount rates for
each Business Unit has been set taking into account the presence of any such business lines with projected statutory losses. Also,
the currently more onerous Hong Kong regulatory reserving requirements for the branches of AIA Co. and AIA-B have the effect
of reducing the level of any future projected statutory losses for these Business Units. Based on the assumptions described in
Section 5, and allowing for the Hong Kong statutory reserving and capital requirements for the branches of AIA Co. and AIA-B, the
overall projected annual distributable profits from the current in-force business and the assets backing the required capital of the
Group are positive over the remaining lifetime of the business. Therefore, it is not considered necessary to change the discounting
approach described above.

AD
DIT
ION
AL
INF
OR
MA
TIO
NF
INA
NC
IAL
ST
AT
EM
EN
TS
227
CO
RP
OR
AT
E G
OV
ER
NA
NC
EO
VE
RV
IEW
FIN
AN
CIA
L A
ND
OP
ER
ATI
NG
RE
VIE
W
Supplementary Embedded Value Information
4. meThodoloGy (continued)
4.6 required capital
Each of the Business Units has a regulatory requirement to hold shareholder capital in addition to the assets backing the insurance
liabilities. The Group’s assumed levels of required capital for each Business Unit are set out in Table 4.1 below. Further, the
consolidatedEVResultsfortheGrouphavebeencalculatedreflectingthemoreonerousoftheHongKongandbranchlevellocal
regulatory reserving and capital requirements for AIA Co. and AIA-B.
Table 4.1
Required Capital by Business Unit
Business Unit Required Capital
AIA Australia 100% of the regulatory capital adequacy requirement(1)
AIA China 100% of required minimum solvency marginAIA Hong Kong 150% of required minimum solvency margin(2)
AIA Indonesia 120% of regulatory Risk-Based Capital requirement (standard basis)AIA Korea 150% of regulatory Risk-Based Capital requirementAIA Malaysia 170% of regulatory Risk-Based Capital requirementAIANewZealand 100% of the local regulatory requirementPhilam Life 100% of regulatory Risk-Based Capital requirementAIA Singapore – Brunei business 100% of the local regulatory requirementAIA Singapore – Singapore business 180% of regulatory Risk-Based Capital requirementAIA Taiwan 200% of regulatory Risk-Based Capital requirementAIA Thailand 140% of regulatory Risk-Based Capital requirementAIAVietnam 100% of required minimum solvency margin
Notes:
(1) TheAustralianPrudentialRegulatoryAuthorityhasimplementednewcapitalstandardswhichareeffectivefrom1January2013.ThechangetothenewprescribedcapitalamountbasishasbeenreflectedinCoCintheEVasat30November2012.ThishasnomaterialimpacttotheEVoftheGroupat30November2012.TheVONBforthe12monthsto30November2012,whichisdeterminedusingassumptionsapplicableatthepointofsale,hasbeencalculated using the required capital basis consistent with previous periods.
(2) TheassumedlevelofrequiredcapitalforAIAHongKongisalsousedforthebranchesofAIACo.andAIA-BinthecalculationoftheconsolidatedEVResults.

AIA Group Limited Annual Report 2012
228
Supplementary Embedded Value InformationFINANCIAL STATEMENTS
5. assumpTIons
5.1 Introduction
ThissectionsummarisestheassumptionsusedbytheGrouptodeterminetheEVasat30November2012andtheVONBforthe
12monthsto30November2012andhighlightscertaindifferencesinassumptionsbetweentheEVasat30November2011and
theEVasat30November2012.
5.2 economic assumptions
Investment returns
The Group has set the assumed long-term future returns for fixed income assets to reflect its view of expected returns having
regard to historical returns, estimates of long-term forward rates from yields available on government bonds and current bond
yields. In determining returns on fixed income assets the Group allows for the risk of default, and this allowance varies by the credit
rating of the underlying asset.
Where these long-term views of investment return assumptions differ from current market yields on existing fixed income assets
such that there would be a significant impact on value, an adjustment was made to make some allowance for the current market
yields.Inthesecases,incalculatingtheVIF,adjustmentwasmadetotheinvestmentreturnassumptionssuchthattheinvestment
returns on existing fixed income assets were set consistently with the current market yield on these assets for their full term, to be
consistent with the valuation of the assets backing the policy liabilities.
The Group has set the equity return assumptions by reference to the return on 10-year government bonds, allowing for an internal
assessment of equity risk premia that vary by territory.
For each Business Unit, the non-linked portfolio is divided into a number of distinct product groups, and the returns for each of
these product groups have been derived by considering current and future targeted asset allocations and associated investment
returns for major investment classes.
For unit-linked business, fund growth assumptions have been determined based on actual fund mixes at the valuation date and
expected long-term returns for major asset classes.
risk discount rates
The risk discount rates for each Business Unit can be considered as the sum of the appropriate risk-free rate, to reflect the time
value of money, and a risk margin to make allowance for the risk profile of the business.
The Group has generally set the risk discount rates to be equal to the estimated cost of equity capital for each Business Unit within
the Group. The cost of equity capital is derived using an estimated long-term risk-free interest rate, an equity risk premium and a
market risk factor. In some cases, adjustments have been made to reflect territorial or Business Unit-specific factors.

AD
DIT
ION
AL
INF
OR
MA
TIO
NF
INA
NC
IAL
ST
AT
EM
EN
TS
229
CO
RP
OR
AT
E G
OV
ER
NA
NC
EO
VE
RV
IEW
FIN
AN
CIA
L A
ND
OP
ER
ATI
NG
RE
VIE
W
Supplementary Embedded Value Information
5. assumpTIons (continued)
5.2 economic assumptions (continued)
risk discount rates (continued)
Table 5.1 summarises the risk discount rates and assumed long-term investment returns for the major asset classes for each
Business Unit as at 30 November 2012. The investment return on existing fixed income assets was consistent with the market
yieldontheseassets.NotethatVONBresultswerecalculatedbasedonstart-of-quartereconomicassumptionsconsistentwith
themeasurementatpointofsale.ThesameriskdiscountrateswereusedforalltheEVresultsshowninSection1andSection2
ofthisreport.Inparticular,forthebranchesofAIACo.andAIA-B,theconsolidatedEVresultsreflectingtheHongKongreserving
and capital requirements were calculated using the branch-specific risk discount rates shown in the table. The present value of
unallocated Group Office expenses was calculated using the risk discount rate of AIA Hong Kong. The investment returns shown
are gross of tax and investment expenses.
Table 5.1
Risk discount rates and long-term investment return assumptions by Business Unit (%)
Business Unit Risk discount rates10-year government
bonds Local equities
at 30 nov 2012
At 30 Nov 2011
at 30 nov 2012
At 30 Nov 2011
at 30 nov 2012
At 30 Nov 2011
AIA Australia 7.75 8.25 3.37 4.37 7.15 7.65AIA China 10.00 10.00 3.74 3.74 9.74 9.74AIA Hong Kong(1) 7.25 7.75 2.43 2.93 7.73 8.23AIA Indonesia
(Rupiah-denominated business) 13.50 13.50 6.50 7.00 11.25 11.75AIA Korea 9.75 10.25 3.85 4.57 7.19 7.91AIA Malaysia 8.75 9.00 4.20 4.45 8.09 8.34AIANewZealand 8.25 8.50 3.99 4.49 n/a(2) n/a(2)
Philam Life (Peso-denominated business) 12.25 13.00 5.25 6.00 10.41 11.16
AIA Singapore – Brunei business 7.00 7.50 1.93 2.43 7.25 7.75AIA Singapore – Singapore business 7.00 7.50 1.93 2.43 7.25 7.75AIA Taiwan 7.75 8.00 1.48 1.73 6.62 6.87AIA Thailand 9.50 9.50 3.87 3.87 9.87 10.16AIAVietnam 16.00 16.00 10.20 10.20 16.00 n/a(2)
Notes:
(1) The majority of AIA Hong Kong’s assets and liabilities are denominated in US dollars. The 10-year government bond assumption is for US dollar-denominated bonds.
(2) The assumed asset allocations do not include equities for these Business Units.

AIA Group Limited Annual Report 2012
230
Supplementary Embedded Value InformationFINANCIAL STATEMENTS
5. assumpTIons (continued)
5.3 persistency
Persistency covers the assumptions required, where relevant, for policy lapse (including surrender), premium persistency, premium
holidays, partial withdrawals and retirement rates for pension products.
Assumptions have been developed by each of the Business Units based on their recent historical experience, and their best
estimate expectations of current and expected future experience. Persistency assumptions vary by policy year and product type
with different rates for regular and single premium products.
Where experience for a particular product was not credible enough to allow any meaningful analysis to be performed, experience
for similar products was used as a basis for future persistency experience assumptions.
In the case of surrenders, the valuation assumes that current surrender value bases will continue to apply in the future.
5.4 expenses
The expense assumptions have been set based on the most recent expense analysis. The purpose of the expense analysis
is to allocate firstly total expenses between acquisition and maintenance activities, and then to allocate these acquisition and
maintenance expenses to various product categories to derive unit cost assumptions.
Where the expenses associated with certain activities have been identified as being one-off, these expenses have been excluded
from the expense analysis.
Expense assumptions have been determined for acquisition and maintenance activities, split by product type, and unit costs
expressed as a percentage of premium, sum assured and an amount per policy. Where relevant, expense assumptions have been
calculated per distribution channel.
Expense assumptions do not make allowance for any anticipated future expense savings as a result of any strategic initiatives
aimed at improving policy and claims handling efficiency.
Assumptions for commission rates and other sales-related payments have been set in line with actual experience.
Group office expenses
Group Office expense assumptions have been set, after excluding non-recurring expenses, based on actual acquisition and
maintenance expenses in the 12-month period to 30 November 2012. The Group Office acquisition expenses have been deducted
fromtheVONB.ThepresentvalueoftheprojectedfutureGroupOfficemaintenanceexpenseshasbeendeductedfromtheGroup
EV.ThemaintenanceexpenseassumptionsintheVONBalsoallowfortheallocationofGroupOfficeexpenses.

AD
DIT
ION
AL
INF
OR
MA
TIO
NF
INA
NC
IAL
ST
AT
EM
EN
TS
231
CO
RP
OR
AT
E G
OV
ER
NA
NC
EO
VE
RV
IEW
FIN
AN
CIA
L A
ND
OP
ER
ATI
NG
RE
VIE
W
Supplementary Embedded Value Information
5. assumpTIons (continued)
5.5 expense inflation
The assumed expense inflation rates are based on expectations of long-term consumer price and salary inflation. The expense
inflation assumptions are shown in Table 5.2 below.
Table 5.2
Expense inflation assumptions by Business Unit (%)
Business Unit
at 30 november
2012
At 30 November
2011
AIA Australia 3.25 3.25AIA Brunei 2.0 2.0AIA China 2.0 2.0AIA Hong Kong 2.0 2.0AIA Indonesia 6.0 6.0AIA Korea 3.5 3.5AIA Malaysia 3.0 3.0AIANewZealand 2.5 2.5Philam Life 4.5 4.5AIA Singapore 2.0 2.0AIA Taiwan 1.0 1.0AIA Thailand 2.5 2.5AIAVietnam 5.0 5.0
Unallocated Group Office expenses are assumed to inflate by the weighted average of the Business Unit expense inflation rates.
5.6 mortality
Assumptions have been developed by each Business Unit based on their recent historical experience, and their expectations
of current and expected future experience. Where historical experience is not credible, reference has been made to pricing
assumptions supplemented by market data, where available.
Mortality assumptions have been expressed as a percentage of either standard industry experience tables or, where experience is
sufficiently credible, as a percentage of tables that have been developed internally by the Group.
For products that are exposed to longevity risk, an allowance has been made for expected improvements in mortality; otherwise
no allowance has been made for mortality improvements.
5.7 morbidity
Assumptions have been developed by each Business Unit based on their recent historical experience, and their expectations of
current and expected future experience. Morbidity rate assumptions have been expressed as a percentage of standard industry
experience tables or as expected claims ratios.
5.8 reinsurance
Reinsurance assumptions have been developed by each Business Unit based on the reinsurance arrangements in force as at the
valuation date and the recent historical and expected future experience.

AIA Group Limited Annual Report 2012
232
Supplementary Embedded Value InformationFINANCIAL STATEMENTS
5. assumpTIons (continued)
5.9 policyholder dividends, profit sharing and interest creditingThe projected policyholder dividend, profit sharing and interest crediting assumptions set by each Business Unit that have beenusedincalculatingtheEVResultspresentedinthisreport,reflectcontractualandregulatoryrequirements,policyholders’reasonable expectations (where clearly defined) and each Business Unit’s best estimate of future policies, strategies and operations consistentwiththeinvestmentreturnassumptionsusedintheEVResults.
Participating fund surpluses have been assumed to be distributed between policyholders and shareholders via future final bonuses or at the end of the projection period so that there are no residual assets at the end of the projection period.
5.10 TaxationThe projections of distributable earnings underlying the values presented in this report are net of corporate tax, based on current taxation legislation and corporate tax rates. The projected amount of tax payable in any year allows, where relevant, for the benefits arising from any tax loss carried forward.
The local corporate tax rates used by each Business Unit are set out in Table 5.3 below.
Table 5.3Local corporate tax rates by Business Unit (%)
Business Unit
at 30 november
2012
At 30 November
2011
AIA Australia 30.0 30.0AIA China 25.0 25.0AIA Hong Kong – Hong Kong business 16.5 16.5AIA Hong Kong – Macau business 12.0 12.0AIA Indonesia 25.0 25.0AIA Korea 24.2 24.2 until
31 March 2012; 22.0 thereafter
AIA Malaysia 25.0 25.0AIANewZealand 28.0 28.0Philam Life 30.0 30.0AIA Singapore – Brunei business 20.0 22.0AIA Singapore – Singapore business 17.0 17.0AIA Taiwan 17.0 17.0AIA Thailand 23.0 for assessment year 2012;
20.0 for assessment years 2013 and 2014; 30.0 thereafter
30.0
AIAVietnam 25.0 25.0
The tax assumptions employed in the valuation reflect the local corporate tax rates set out above. Where applicable, tax payable on investment income has been reflected in projected investment returns.
TheEVoftheGroupasat30November2012iscalculatedafterdeductinganyremittancetaxespayableonboththedistributionoftheANWandVIF.
Where territories have an imputation credit system in place, e.g. Australia, no allowance has been made for the value of the imputation credits in the results shown in this report.

AD
DIT
ION
AL
INF
OR
MA
TIO
NF
INA
NC
IAL
ST
AT
EM
EN
TS
233
CO
RP
OR
AT
E G
OV
ER
NA
NC
EO
VE
RV
IEW
FIN
AN
CIA
L A
ND
OP
ER
ATI
NG
RE
VIE
W
Supplementary Embedded Value Information
5. assumpTIons (continued)
5.11 statutory valuation bases
The projection of regulatory liabilities at future points in time assumes the continuation of the reserving methodologies used to
value policyholder liabilities as at the valuation date.
5.12 product charges
ManagementfeesandproductchargesreflectedintheVIFandVONBhavebeenassumedtofollowexistingscales.
5.13 foreign exchange
TheEVasat30November2012and30November2011havebeentranslatedintoUSdollarusingexchangeratesasateach
valuationdate.TheVONBresultsshowninthisreporthavebeentranslatedintoUSdollarusingthecorrespondingaveragerates
foreachquarter.TheothercomponentsoftheEVprofitshownintheanalysisofmovementoftheEVhavebeentranslatedusing
average rates for the period.
6. evenTs afTer The reporTInG perIod
On 5 December 2012, the Group completed the acquisition of 92.3 per cent of the issued share capital in Sri Lankan insurer
Aviva NDB Insurance (ANI). In addition, ANI has entered into an exclusive 20-year bancassurance agreement with the National
Development Bank in Sri Lanka. The acquisition will position the Group to develop a significant operation in the expanding Sri
Lankan market. The remaining 7.7 per cent of ANI not acquired represents shares publicly held and traded on the Colombo Stock
Exchange of Sri Lanka. The consideration with respect to the transaction of US$109 million was paid from existing cash resources;
the consideration amount is subject to purchase price adjustment which is expected to be finalised during 2013.
On 10 December 2012, the Group has entered into an unsecured, committed credit facility agreement (Credit Facility) for 18
months totalling US$1,725 million with a group of international banks. The Credit Facility bears interest based on LIBOR.
On 18 December 2012, the Group acquired 100 per cent of share capital of ING Management Holdings (Malaysia) Sdn. Bhd.
(ING Malaysia). ING Malaysia is the third largest life insurer in Malaysia based upon gross premiums earned for the year ended
31 December 2011. The acquisition presents the Group with a high calibre distribution force of over 9,000 agents and a long-
term bancassurance partnership with a leading Malaysian banking group, Public Bank. The consideration with respect to this
transaction was EUR1,332 million or US$1,754 million at exchange rates on the date of the transaction, and was paid from cash
financed initially through the Credit Facility. The Group utilised a foreign currency forward contract to economically hedge this
transaction. The foreign currency forward contract resulted in a gain of US$20 million which is included in investment experience
as hedge accounting was not applied. The Group intends to repay the bank credit facility with a combination of internal cash
resources and external debt financing.
The Group has the ability to exercise control over ANI and ING Malaysia through control of their voting rights. Due to the limited
time available between these acquisitions and the approval of these financial statements, the Group is still in the process of
establishing the fair value of the assets and liabilities acquired. Accordingly, certain disclosures relating to the above mentioned
business combinations have not been presented in these financial statements.
In October 2012, the Group entered into a Sale and Purchase agreement to acquire a building in Hong Kong for a consideration of
HK$2,398 million (approximately US$309 million). The transaction was completed on 11 December 2012.
On 27 February 2013, the Board of Directors proposed a final dividend of 24.67 Hong Kong cents per share (2011: 22.00 Hong
Kong cents per share).

AIA Group Limited Annual Report 2012
234
Information for ShareholdersADDITIONAL INFORMATION
analysIs of reGIsTered shareholder accounTs30 November 2012
Size of registered shareholding
number of shareholder
accounts
% of total number of
shareholder accounts
number of shares
% of total number of
shares
1,000 shares or below 20,981 80.31 7,868,066 0.06
1,001 – 5,000 shares 4,457 17.06 10,291,633 0.09
5,001 – 10,000 shares 447 1.71 3,396,400 0.03
10,001 – 100,000 shares 232 0.89 5,220,000 0.04
100,001 shares or above 7 0.03 12,017,223,902 99.78
26,124 100.00 12,044,000,001 100.00
fInancIal calendar
Announcement of 2012 Full Year Results 27 February 2013Book Close Period for 2013 Annual General Meeting 7 May 2013 to 10 May 2013 (both days inclusive)2013 Annual General Meeting 10 May 2013Ex-dividend date for proposed 2012 Final Dividend 14 May 2013Record date for proposed 2012 Final Dividend 15 May 2013Payment date for proposed 2012 Final Dividend 30 May 2013Announcement of 2013 Interim Results 26July2013
annual General meeTInG
The 2013 Annual General Meeting will be held at 11:00 a.m. Hong Kong time on Friday, 10 May 2013 at the Grand Ballroom, 2/F,
Hotel Nikko Hongkong, 72 Mody Road, Tsimshatsui East, Kowloon, Hong Kong. Details of the business to be transacted at the
AGM are set out in the circular to the shareholders of the Company to be sent together with this Annual Report.
Details of voting results at the AGM can be found on the website of the Hong Kong Stock Exchange at www.hkex.com.hk and the
Company’s website at www.aia.com on Friday, 10 May 2013.
fInal dIvIdend
The Board has recommended a final dividend of 24.67 Hong Kong cents per share (2011: 22.00 Hong Kong cents per share)
in respect of the year ended 30 November 2012. If approved, the proposed final dividend together with the interim dividend will
represent a total dividend of 37.00 Hong Kong cents per share (2011: 33.00 Hong Kong cents per share) in respect of the year
ended 30 November 2012.
Subject to shareholders’ approval at the AGM, the final dividend will be payable on Thursday, 30 May 2013 to shareholders whose
names appear on the register of members of the Company at the close of business on Wednesday, 15 May 2013.
share reGIsTrar
If you have any enquiries relating to your shareholding, please contact the Company’s share registrar at the contact given below:
Computershare Hong Kong Investor Services Limited
17M Floor, Hopewell Centre, 183 Queen’s Road East, Wanchai, Hong Kong
Telephone: 852 2862 8555
Email: [email protected]
Website: www.computershare.com

235
CO
RP
OR
AT
E G
OV
ER
NA
NC
EO
VE
RV
IEW
FIN
AN
CIA
L A
ND
OP
ER
ATI
NG
RE
VIE
WA
DD
ITIO
NA
L IN
FO
RM
AT
ION
FIN
AN
CIA
L S
TA
TE
ME
NT
S
Information for Shareholders
elecTronIc communIcaTIons
Shareholders are encouraged to elect to receive shareholder documents electronically. You may at any time send written notice to the Company c/o the Company’s share registrar or via email at [email protected] specifying your name, address and request to change your choice of language or means of receipt of all shareholder documents. This will save printing and distribution costs and create environmental benefits.
annual reporT
This Annual Report is printed in English and Chinese and is available at the website of the Company. If you would like to have a printed version of this Annual Report, please contact the Company’s share registrar at the contact given below:
Computershare Hong Kong Investor Services Limited17M Floor, Hopewell Centre, 183 Queen’s Road East, Wanchai, Hong KongEmail: [email protected]
If there is any inconsistency between the Chinese and English version of this Annual Report, the English version shall prevail.
InvesTmenT communITy and news medIa
Enquiries may be directed to:
Investment Community News Media
Paul Lloyd +852 2932 6160 Stephen Thomas +852 2832 6178Angela Chang +852 2832 5480 Sonia Tsang +852 2832 1868Feon Lee +852 2832 4704 Emerald Ng +852 2832 4720
forward-looKInG sTaTemenTs
This document contains certain forward-looking statements relating to the Group that are based on the beliefs of the Group’s management as well as assumptions made by and information currently available to the Group’s management. These forward-looking statements are, by their nature, subject to significant risks and uncertainties. These forward-looking statements include, without limitation, statements relating to the Group’s business prospects, future developments, trends and conditions in the industry and geographical markets in which the Group operates, its strategies, plans, objectives and goals, its ability to control costs, statements relating to prices, volumes, operations, margins, overall market trends, risk management and exchange rates.
When used in this document, the words “anticipate”, “believe”, “could”, “estimate”, “expect”, “going forward”, “intend”, “may”, “ought to”, “plan”, “project”, “seek”, “should”, “will”, “would” and similar expressions, as they relate to the Group or the Group’s management, are intended to identify forward-looking statements. These forward-looking statements reflect the Group’s views as of the date hereof with respect to future events and are not a guarantee of future performance or developments. You are strongly cautioned that reliance on any forward-looking statements involves known and unknown risks and uncertainties. Actual results and events may differ materially from information contained in the forward-looking statements as a result of a number of factors, including any changes in the laws, rules and regulations relating to any aspects of the Group’s business operations, general economic, market and business conditions, including capital market developments, changes or volatility in interest rates, foreign exchange rates, equity prices or other rates or prices, the actions and developments of the Group’s competitors and the effects of competition in the insurance industry on the demand for, and price of, the Group’s products and services, various business opportunities that the Group may or may not pursue, changes in population growth and other demographic trends, including mortality, morbidity and longevity rates, persistency levels, the Group’s ability to identify, measure, monitor and control risks in the Group’s business, including its ability to manage and adapt its overall risk profile and risk management practices, its ability to properly price its products and services and establish reserves for future policy benefits and claims, seasonal fluctuations and factors beyond the Group’s control. Subject to the requirements of the Listing Rules, the Group does not intend to update or otherwise revise the forward-looking statements in this document, whether as a result of new information, future events or otherwise. As a result of these and other risks, uncertainties and assumptions, the forward-looking events and circumstances discussed in this document might not occur in the way the Group expects, or at all. Accordingly, you should not place undue reliance on any forward-looking information or statements. All forward-looking statements in this document are qualified by reference to the cautionary statements set forth in this section.

AIA Group Limited Annual Report 2012
236
Corporate InformationADDITIONAL INFORMATION
board of dIrecTors
non-executive chairman and non-executive director
Mr. Edmund Sze-Wing Tse
executive director
Mr. Mark Edward Tucker
Independent non-executive directors
Mr.JackChak-KwongSo
Mr. Chung-Kong Chow
Dr. Qin Xiao
Mr.JohnBarrieHarrison
Mr. Barry Chun-Yuen Cheung
Mr. George Yong-Boon Yeo
Dr. Narongchai Akrasanee
audit committee
Mr.JohnBarrieHarrison(Chairman)
Mr.JackChak-KwongSo
Mr. Barry Chun-Yuen Cheung
Mr. George Yong-Boon Yeo
Mr. Edmund Sze-Wing Tse
nomination committee
Mr. Edmund Sze-Wing Tse (Chairman)
Mr. Chung-Kong Chow
Mr.JackChak-KwongSo
Dr. Qin Xiao
Mr.JohnBarrieHarrison
Mr. Barry Chun-Yuen Cheung
Mr. George Yong-Boon Yeo
Dr. Narongchai Akrasanee
remuneration committee
Mr.JackChak-KwongSo (Chairman)
Dr. Qin Xiao
Mr. Barry Chun-Yuen Cheung
Mr. Mark Edward Tucker
risk committee
Mr. Chung-Kong Chow (Chairman)
Mr.JohnBarrieHarrison
Dr. Narongchai Akrasanee
Mr. Edmund Sze-Wing Tse
Mr. Mark Edward Tucker
registered office
35/F, AIA Central
No. 1 Connaught Road Central
Hong Kong
website
www.aia.com
company secretary
Ms. Wing-Nga Lai, FCIS, FCS
authorised representatives
Mr. Mark Edward Tucker
Ms. Wing-Nga Lai
share registrar
Computershare Hong Kong Investor Services Limited
17M Floor
Hopewell Centre
183 Queen’s Road East, Wanchai
Hong Kong
principal bankers
Citibank, N.A.
Standard Chartered Bank
auditor
PricewaterhouseCoopers
Certified Public Accountants

237
CO
RP
OR
AT
E G
OV
ER
NA
NC
EO
VE
RV
IEW
FIN
AN
CIA
L A
ND
OP
ER
ATI
NG
RE
VIE
W
ADDITIONAL INFORMATION
Glossary
AD
DIT
ION
AL
INF
OR
MA
TIO
NF
INA
NC
IAL
ST
AT
EM
EN
TS
Accident and health (A&H)insurance products
A&H insurance products provide morbidity or sickness benefits and include health, disability, critical illness and accident cover. A&H insurance products are sold both as standalone policies and as riders that can be attached to our individual life insurance policies.
Acquisition cost(of a financial instrument)
The amount of cash or cash equivalents paid or the fair value of other consideration provided, in order to acquire an asset at the date of its acquisition.
Active agent An agent who sells at least one life insurance policy per month.
Active market A market in which all the following conditions exist:
• theitemstradedwithinthemarketarehomogeneous;
• willingbuyersandsellerscannormallybefoundatanytime;and
• pricesareavailabletothepublic.
A financial instrument is regarded as quoted in an active market if quoted prices are readily and regularly available from an exchange, dealer, broker, industry group, pricing service or regulatory agency, and those prices represent actual and regularly occurring market transactions on an arm’s length basis.
Adjusted net worth (ANW) ANW is the market value of assets in excess of the assets backing the policy reserves and other liabilities of the life (and similar) business of AIA, plus the IFRS equity value (excluding the value of intangible assets) of other activities, such as general insurance business. It excludes any amounts not attributable to shareholders of AIA Group Limited. The market value of investment properties and property held for use used to determine the ANW is based on the fair value disclosed in AIA’s IFRS financial statements as at the valuation date. It is AIA’s policy to obtain external property valuations annually except in the event of a discrete event occurring in the interim that has significant impact on the fair value of the properties.
AGM 2013 Annual General Meeting of the Company to be held at 11:00 a.m. Hong Kong time on Friday, 10 May 2013.
AIA or the Group AIA Group Limited and its subsidiaries.
AIA-B American International Assurance Company (Bermuda) Limited, a subsidiary of AIA Co.
AIA Central The building located at No. 1 Connaught Road Central, Hong Kong.
AIA Co. AIA Company Limited (formerly known as American International Assurance Company, Limited), a subsidiary of the Company.
AIG American International Group, Inc.
ALICO American Life Insurance Company.

AIA Group Limited Annual Report 2012
238 ADDITIONAL INFORMATION
Glossary
Amortised cost The amount at which the financial asset or financial liability is measured at initial recognition minus principal repayments, plus or minus the cumulative amortisation using the effective interest method of any difference between the initial amount and the maturity amount, and minus any reduction for impairment or uncollectibility.
ANI Aviva NDB Insurance.
Annualised new premium (ANP) ANP represents 100 per cent of annualised first year premiums and 10 per cent of single premiums, before reinsurance ceded. It is an internally used measure of new business sales or activity for all entities within AIA. ANP excludes new business of corporate pension business, personal lines and motor insurance.
Annuity A savings product where the accumulated amount can be paid out to the customer in a variety of income streams.
ASPP Agent Share Purchase Plan.
Asset-liability management(ALM)
ALM is the management of the relative risk profiles of assets and liabilities.
Available for sale financialassets
Non-derivative financial assets that are designated as available for sale or are not classified as loans and receivables or as at fair value through profit or loss. Available for sale financial instruments are measured at fair value, with movements in fair value recorded in other comprehensive income.
Bancassurance The distribution of insurance products through banks or other financial institutions.
BPI-Philam BPI-Philam Life Assurance Corporation, a joint venture between Bank of the Philippine Islands and AIA Co.
CDS Credit default swap.
Claims risk The possibility that the frequency or severity of claims arising from insurance products exceeds the levels assumed when the products were priced.
Common control A business combination involving entities under common control is a business combination in which all of the combining entities or businesses are ultimately controlled by the same party or parties both before and after the business combination.
The Company AIA Group Limited.
Corporate Governance Code Code on Corporate Governance Practices (formerly set out in Appendix 14 to the Listing Rules) and Corporate Governance Code (the new edition of the Code on Corporate Governance Practices, which is applicable to financial reports covering a period after 1 April 2012) presently set out in Appendix 14 to the Listing Rules.
Cost of capital (CoC) CoC is calculated as the face value of the required capital as at the valuation date less the present value of the net-of-tax investment return on the shareholder assets backing the required capital and the present value of projected releases from the assets backing the required capital. Where the required capital may be covered by policyholder assets such as surplus assets in a participating fund, there is no associatedcostofcapitalincludedintheVIForVONB.

239
CO
RP
OR
AT
E G
OV
ER
NA
NC
EO
VE
RV
IEW
FIN
AN
CIA
L A
ND
OP
ER
ATI
NG
RE
VIE
WA
DD
ITIO
NA
L IN
FO
RM
AT
ION
FIN
AN
CIA
L S
TA
TE
ME
NT
S
Glossary
Credit risk The risk that third parties fail to meet their obligations to the Group when they fall due.
Currency risk The risk that asset or liability values, cash flows, income or expenses will be affected by changes in exchange rates.
Deferred acquisition costs(DAC)
DAC are expenses of an insurer which are incurred in connection with the acquisition of new insurance contracts or the renewal of existing insurance contracts. They include commissions and other variable sales inducements and the direct costs of issuing the policy, such as underwriting and other policy issue expenses. These costs are deferred and expensed to the consolidated income statement on a systematic basis over the life of the policy. DAC assets are tested for recoverability at least annually.
Deferred origination costs(DOC)
Origination costs are expenses which are incurred in connection with the origination of new investment contracts or the renewal of existing investment contracts. For contracts that involve the provision of investment management services, these include commissions and other incremental expenses directly related to the issue of each new contract. Origination costs on contracts with investment management services are deferred and recognised as an asset in the consolidated statement of financial position and expensed to the consolidated income statement on a systematic basis in line with the revenue generated by the investment management services provided. Such assets are tested for recoverability.
Defined benefit plans Post-employment benefit plans under which amounts to be paid or services to be provided as post-retirement benefits are determined by reference to a formula usually based on employees’ earnings and/or years of service.
Defined contribution plans Post-employment benefit plans under which amounts to be paid as post-retirement benefits are determined by contributions to a fund together with earnings thereon. The Group has no legal or constructive obligation to pay further contributions if the fund does not hold sufficient assets to pay the post-retirement benefits.
Discretionary participationfeatures (DPF)
A contractual right to receive, as a supplement to guaranteed benefits, additional benefits or bonuses:
• thatarelikelytobeasignificantportionofthetotalcontractualbenefits;
• whoseamountortimingiscontractuallyatthediscretionoftheGroup;and
• thatarecontractuallybasedon:
– the performance of a specified pool of contracts or a specified type of contract;
– realised and/or unrealised investment returns on a specified pool of assets held by the issuer; or
– the profit or loss of the company, fund or other entity that issues the contract.

AIA Group Limited Annual Report 2012
240 ADDITIONAL INFORMATION
Glossary
Effective interest method A method of calculating the amortised cost of a financial asset or financial liability and of allocating the interest income or expense over the relevant period. The effective interest rate is the rate that exactly discounts future cash payments or receipts through the expected life of the financial instrument, or when appropriate, a shorter period, to the net carrying value of the financial asset or financial liability.
Embeddedvalue(EV) An actuarially determined estimate of the economic value of a life insurance business based on a particular set of assumptions as to future experience, excluding any economic value attributable to future new business.
EPS Earnings per share.
ESPP Employee Share Purchase Plan.
Exco The Executive Committee of the Group.
Financial Advisory IndustryReview (FAIR)
FAIR is a comprehensive evaluation of the financial advisory industry by a review panel chaired by the Monetary Authority of Singapore (MAS).
Fair value The amount for which an asset could be exchanged, or a liability settled, between knowledgeable, willing parties in an arm’s length transaction.
Fair value through profit orloss(FVTPL)
A financial asset or financial liability that is measured at fair value in the statement of financial position with gains and losses arising from movements in fair value being presented in the consolidated income statement as a component of the profit or loss for the year.
First year premiums First year premiums are the premiums received in the first year of a recurring premium policy. As such, they provide an indication of the volume of new policies sold.
FRC Financial Risk Committee.
Free surplus ANW in excess of the required capital.
Functional currency The currency of the primary economic environment in which the entity operates.
Group insurance An insurance scheme whereby individual participants are covered by a master contract held by a single group or entity on their behalf.
Group Office Group Office includes the activities of the Group Corporate Centre segment consisting of the Group’s corporate functions, shared services, certain internal reinsurance and eliminations of intragroup transactions.
High-net-worth (HNW)customers
Customers who have investable assets of US$1.0 million or more.
HKFRS Hong Kong Financial Reporting Standards.
Hong Kong The Hong Kong Special Administrative Region of the PRC; in the context of our reportable segments, Hong Kong includes Macau.
Hong Kong Companies Ordinance The Companies Ordinance (Laws of Hong Kong, Chapter 32), as amended from time to time.

241
CO
RP
OR
AT
E G
OV
ER
NA
NC
EO
VE
RV
IEW
FIN
AN
CIA
L A
ND
OP
ER
ATI
NG
RE
VIE
WA
DD
ITIO
NA
L IN
FO
RM
AT
ION
FIN
AN
CIA
L S
TA
TE
ME
NT
S
Glossary
Hong Kong Insurance CompaniesOrdinance (HKICO)
The Insurance Companies Ordinance (Laws of Hong Kong, Chapter 41) (HKICO) provides a legislative framework for the prudential supervision of the insurance industry in Hong Kong. The objectives of the HKICO are to protect the interests of the insuring public and to promote the general stability of the insurance industry.
Hong Kong Stock Exchange(HKSE)
The Stock Exchange of Hong Kong Limited.
HKOCI Hong Kong Office of the Commissioner of Insurance.
IAS International Accounting Standards.
IASB International Accounting Standards Board.
IFA Independent financial adviser.
IFRS Standards and interpretations adopted by the International Accounting Standards Board (IASB) comprising:
• InternationalFinancialReportingStandards;
• InternationalAccountingStandards;and
• InterpretationsdevelopedbytheInternationalFinancialReportingInterpretationsCommittee (IFRIC) or the former Standing Interpretations Committee (SIC).
ING Malaysia ING Management Holdings (Malaysia) Sdn. Bhd.
Insurance contract A contract under which the insurer accepts significant insurance risk from the policyholder by agreeing to compensate the policyholder if specified uncertain future events adversely affect the policyholder.
Insurance risk The potential loss resulting from inappropriate underwriting, mispricing, adverse expense, lapse, mortality and morbidity experiences. Under IFRS, insurance risk means risk, other than financial risk, transferred from the holder of a contract to the issuer.
Interactive Point of Sales (iPoS) iPoS is a secure mobile sales tool that features a complete paperless and 24/7 sales process including financial planning, proposal, application, signature, payment and submission.
Investment contract An investment contract is an insurance policy that, whilst structured and regulated as a contract of insurance, does not meet the accounting definition of an insurance contract because it does not transfer significant insurance risk.
Investment experience Realised and unrealised investment gains and losses recognised in the consolidated income statement.
Investment income Investment income comprises interest income, dividend income and rental income.
Investment property Property (land and/or a building or part of a building) held to earn rentals or for capital appreciation or both rather than for use by AIA.

AIA Group Limited Annual Report 2012
242 ADDITIONAL INFORMATION
Glossary
Investment return Investment return consists of investment income plus investment experience.
IPO Initial public offering.
Lapse risk The risk that, having purchased an insurance policy from AIA, customers either surrender the policy or cease paying premiums on it and so the expected stream of future premiums ceases. Lapse risk is taken into account in formulating projections of future premium revenues, for example when testing for liability adequacy and the recoverability of deferred acquisition and origination costs.
LEED Leadership in Energy and Environmental Design.
Liability adequacy testing An assessment of whether the carrying amount of an insurance liability needs to be increased or the carrying amount of related deferred acquisition and origination costs or related intangible assets decreased based on a review of future cash flows.
LIBOR London Interbank Offered Rate.
Life Insurance and MarketResearch Association(LIMRA)
A worldwide research, consulting and professional development organisation, established to help its member companies from life insurance and financial services industries improve their marketing and distribution effectiveness.
Liquidity risk The risk of having insufficient cash available to meet payment obligations to counterparties when they fall due.
Listing Rules Rules Governing the Listing of Securities on The Stock Exchange of Hong Kong Limited.
LTI Long-term incentive.
Mandatory Provident Fund(MPF)
MPF is a compulsory savings scheme (pension fund) for the retirement of residents in Hong Kong. Most employees and their employers are required to contribute monthly to Mandatory Provident Fund Schemes provided by approved private organisations, according to their salaries and the period of employment.
Market risk The risk of loss from adverse movements in the value of assets owing to market factors, including changes in interest and foreign exchange rates, as well as movements in credit, equity and property prices.
Million Dollar Round Table(MDRT)
MDRT is a global professional trade association of life insurance and financial services professionals that recognises significant sales achievements and high service standards.
Model Code Model Code for Securities Transactions by Directors of Listed Issuers set out in Appendix 10 to the Listing Rules in respect of dealings by the Directors in the securities of the Company.
Monetary items Units of currency held and asset and liabilities to be received or paid in a fixed or determinable number of units of currency.
Net book value The net value of an asset. Equal to its original cost (its book value) minus depreciation and amortisation.

243
CO
RP
OR
AT
E G
OV
ER
NA
NC
EO
VE
RV
IEW
FIN
AN
CIA
L A
ND
OP
ER
ATI
NG
RE
VIE
WA
DD
ITIO
NA
L IN
FO
RM
AT
ION
FIN
AN
CIA
L S
TA
TE
ME
NT
S
Glossary
Net funds to GroupCorporate Centre
In presenting net capital in/(out) flows to reportable segments, capital outflows consist of dividends and profit distributions to the Group Corporate Centre segment and capital inflows consist of capital injections into reportable segments by the Group Corporate Centre segment. For the Company, net capital in/(out) flows reflect the net amount received from shareholders by way of capital contributions less amounts distributed by way of dividends.
Net profit Net profit is calculated by subtracting a company’s total expenses from total revenue, including share of loss from associates and after tax.
New business premium A measure of new business activity that is calculated as the sum of the first year premiums on new business (without annualisation) and 10 per cent of single premiums, before reinsurance ceded, written during the period.
NGO Non-governmental organisation.
Non-controlling interests The equity in a subsidiary not attributable, directly or indirectly, to a parent. Also referred to as “minority interests”.
Non-participating life assurance Contracts of insurance with no DPF.
n/a Not available.
n/m Not meaningful.
OPAT Operating profit after tax attributable to shareholders of AIA Group Limited.
Operating profit before tax andafter tax
The Group defines operating profit before and after tax excluding investment experience; investment income and investment management expenses related to unit-linked contracts; corresponding changes in insurance and investment contract benefits in respect of unit-linked contracts and participating fund; changes in third-party interests in consolidated investment funds, policyholders’ share of tax relating to the change in insurance and investment contract liabilities and other significant items of non-operating income and expenditure.
Operating return onallocated equity
Operating return on allocated equity is calculated as operating profit after tax attributable to shareholders of the Company, expressed as a percentage of the simple average of opening and closing total equity attributable to shareholders of the Company, less the fair value and foreign currency translation reserves, and adjusted for subordinated intercompany debt.
Operating segment A component of an entity that:
• engages inbusinessactivities fromwhich itmayearn revenuesand incurexpenses;
• whoseoperatingresultsare regularly reviewedby theentity’schiefoperatingdecision-maker to make decisions about resources to be allocated to the segment and assess its performance; and
• forwhichdiscretefinancialinformationisavailable.

AIA Group Limited Annual Report 2012
244 ADDITIONAL INFORMATION
Glossary
Operational risk The potential direct or indirect loss (including reputational loss) resulting from inadequate or failed internal processes, personnel and systems; or from external events.
ORC Operational Risk Committee.
OTC Over-the-counter.
Other comprehensive income Items of income and expense that form part of total comprehensive income but, as required or permitted by IFRS, do not form part of profit or loss for the year, such as fair value gains and losses on available for sale financial assets.
Participating funds Participating funds are distinct portfolios where the policyholders have a contractual right to receive at the discretion of the insurer additional benefits based on factors such as the performance of a pool of assets held within the fund, as a supplement to any guaranteed benefits. The Group may either have discretion as to the timing of the allocation of those benefits to participating policyholders or may have discretion as to the timing and the amount of the additional benefits.
Participating policies Participating policies are contracts with DPF. Participating policies may either be written within participating funds or may be written within the Company’s general account, whereby the investment performance is determined for a group of assets or contracts, or by reference to the Company’s overall investment performance and other factors. The latter is referred to by the Group as “other participating business”. Whether participating policies are written within a separate participating fund or not largely depends on matters of local practice and regulation.
Persistency The percentage of insurance policies remaining in force from month to month in the past 12 months, as measured by premiums.
Philam Life The Philippine American Life and General Insurance Company, a subsidiary of AIA Co.
Policyholder and shareholderinvestments
Investments other than those held to back unit-linked contracts.
Policyholder dividends Policyholder dividends are the means of participating policyholders receiving the non-guaranteed element of the discretionary benefits, through which they participate in the investment return of the reference portfolio or pool of assets.
pps Percentage points.
PRC The People’s Republic of China.
Property held for use Property held for use in AIA’s business.
Protection gap The difference between the resources needed and resources available to maintain dependants’ living standards after the death of the primary wage-earner.

245
CO
RP
OR
AT
E G
OV
ER
NA
NC
EO
VE
RV
IEW
FIN
AN
CIA
L A
ND
OP
ER
ATI
NG
RE
VIE
WA
DD
ITIO
NA
L IN
FO
RM
AT
ION
FIN
AN
CIA
L S
TA
TE
ME
NT
S
Glossary
Puttable liabilities A puttable financial instrument is one in which the holder of the instrument has the right to put the instrument back to the issuer for cash (or another financial asset). Units in investment funds such as mutual funds and open-ended investment companies are typically puttable instruments. As these can be put back to the issuer for cash, the non-controlling interest in any such funds which have to be consolidated by AIA are treated as financial liabilities.
RCSA Risk and Control Self-Assessment.
Regulatory capital A minimum solvency margin requirement set by the HKICO that an insurer must meet in order to be authorised to carry on insurance business in or from Hong Kong.
Related parties Related parties may be related to AIA for any of the following reasons:
• theyaredirectlyorindirectlycontrolledbyanAIAentity;
• anAIAentityhassignificantinfluenceontheparty;
• theyareinajointventurearrangementwithanAIAentity;
• theyarepartofAIA’skeymanagementoraclosememberofthefamilyofanykey management or any entity that is controlled by these persons; or
• theyareapost-retirementbenefitplanfortheemployeesofAIA.
Renewal premiums Premiums receivable in subsequent years of a recurring premiums policy.
Repurchase agreements(repos)
A repurchase transaction involves the sale of financial investments by AIA to a counterparty, subject to a simultaneous agreement to repurchase those securities at a later date at an agreed price. Accordingly, for accounting purposes, the securities are retained on AIA’s consolidated statement of financial position for the life of the transaction, valued in accordance with AIA’s policy for assets of that nature. The proceeds of the transaction are reported in the caption “Obligations under securities lending and repurchase agreements”. Interest expense from repo transactions is reported within finance costs in the consolidated income statement.
Reverse repurchase agreements(reverse repos)
A reverse repurchase transaction (reverse repo) involves the purchase of financial investments with a simultaneous obligation to sell the assets at a future date, at an agreed price. Such transactions are reported within “Other assets” in the consolidated statement of financial position. The interest income from reverse repo transactions is reported within investment return in the consolidated income statement.
Rider A supplemental plan that can be attached to a basic insurance policy, typically with payment of additional premium.
Risk-adjusted return A measure of how much an investment returned in relation to the amount of risk it took on.

AIA Group Limited Annual Report 2012
246 ADDITIONAL INFORMATION
Glossary
Risk appetite Risk appetite is the amount of risk that companies are willing to take in order to achieve their business targets.
Risk-Based Capital (RBC) RBC represents an amount of capital based on an assessment of risks that a company should hold to protect customers against adverse developments.
RMF Risk Management Framework.
RSUs Restricted share units.
RSU Scheme Restricted Share Unit Scheme.
Securities lending Securities lending consists of the loan of certain securities within the Group’s financial investments to third parties on a short-term basis. The loaned securities continue to be recognised within the appropriate financial investment classifications in the Group’s consolidated statement of financial position.
SFO The Securities and Futures Ordinance (Laws of Hong Kong, Chapter 571), as amended from time to time.
Shadow accounting Investment experience (realised and unrealised investment gains and losses) has a direct effect on the measurement of insurance contract liabilities and related deferredacquisitioncostsand intangibleassets, suchasVOBA (seebelow).Shadow accounting permits adjustments to insurance contract liabilities and the related assets to be reflected in other comprehensive income to match the extent to which unrealised investment gains and losses are recognised in other comprehensive income.
Singapore The Republic of Singapore; in the context of our reportable segments, Singapore includes Brunei.
Single premiums Single premium policies of insurance are those that require only a single lump sum payment from the policyholder.
SME Small-and-medium sized enterprise.
SO Scheme Share Option Scheme.
Solvency The ability of an insurance company to satisfy its policyholder benefits and claims obligations.
Solvency ratio The ratio of actual capital to the minimum capital requirement applicable to the insurer pursuant to relevant regulations.
Statement of financial position Formerly referred to as the balance sheet.
Strategic asset allocation(SAA)
SAA is the setting of strategic asset allocation targets, based on long-term capital market assumptions, to meet long-term requirements of the insurance business and shareholders.

247
CO
RP
OR
AT
E G
OV
ER
NA
NC
EO
VE
RV
IEW
FIN
AN
CIA
L A
ND
OP
ER
ATI
NG
RE
VIE
WA
DD
ITIO
NA
L IN
FO
RM
AT
ION
FIN
AN
CIA
L S
TA
TE
ME
NT
S
Glossary
Strategic risk The risk of unexpected changes in the regulatory, market and competitive environment in which the Group operates.
Stress tests Stress test is a form of testing that is used to determine the stability of a given system or entity. It involves testing beyond normal operational capacity, often to a breaking point, in order to observe the results.
Takaful Islamic insurance which is based on the principles of mutual assistance and risk sharing.
Total weighted premium income(TWPI)
TWPI consists of 100 per cent of renewal premiums, 100 per cent of first year premiums and 10 per cent of single premiums. As such it provides an indication of AIA’s longer-term business volumes as it smoothes the peaks and troughs in single premiums.
Underwriting The process of examining, accepting or rejecting insurance risks, and classifying those accepted, in order to charge an appropriate premium for each accepted risk.
Unit-linked investments Financial investments held to back unit-linked contracts.
Unit-linked products Unit-linked products are insurance products where the policy value is linked to the value of underlying investments (such as collective investment schemes, internal investment pools or other property) or fluctuations in the value of underlying investment or indices. Investment risk associated with the product is usually borne by the policyholder. Insurance coverage, investment and administration services are provided for which the charges are deducted from the investment fund assets. Benefits payable will depend on the price of the units prevailing at the time of death of the insured or surrender or maturity of the policy, subject to surrender charges.
Universal life A type of insurance product where the customer pays flexible premiums, subject to specified limits, which are accumulated in an account balance which are credited with interest at a rate either set by the insurer or reflecting returns on a pool of matching assets. The customer may vary the death benefit and the contract may permit the policyholder to withdraw the account balance, typically subject to a surrender charge.
Valueofbusinessacquired(VOBA)
VOBA in respectofaportfolioof long-term insuranceand investmentcontractsacquired is recognised as an asset, calculated using discounted cash flow techniques, reflecting all future cash flows expected to be realised from the portfolio. VOBAisamortisedovertheestimatedlifeofthecontractsintheacquiredportfolioon a systematic basis. The rate of amortisation reflects the profile of the additional valueofthebusinessacquired.ThecarryingvalueofVOBAisreviewedannuallyforimpairment and any impairment is charged to the consolidated income statement.
Valueofin-forcebusiness(VIF) VIFisthepresentvalueofprojectedafter-taxstatutoryprofitsemerginginthefuturefrom the current in-force business less the cost arising from holding the required capital (CoC) to support the in-force business.

AIA Group Limited Annual Report 2012
248 ADDITIONAL INFORMATION
Glossary
Valueofnewbusiness(VONB) VONB is thepresent value,measuredatpointof sale,ofprojectedafter-taxstatutory profits emerging in the future from new business sold in the period less the cost of holding required capital in excess of regulatory reserves to support this business.VONBforAIAisstatedafteradjustmentstoreflectapplicableHongKongreserving and capital requirements and the after-tax value of unallocated Group Officeexpenses.VONBbymarketisstatedbeforeadjustmentstoreflectapplicableHong Kong reserving and capital requirements and unallocated Group Office expenses, and presented on a local statutory basis.
VONBmargin VONBexcludingcorporatepensionbusiness,expressedasapercentageofANP.VONBmargin forAIA isstatedafteradjustmentstoreflectapplicableHongKongreserving and capital requirements and the after-tax value of unallocated Group Officeexpenses.VONBmarginbymarket isstatedbeforeadjustments toreflectapplicable Hong Kong reserving and capital requirements and unallocated Group Office expenses, and presented on a local statutory basis.
Withholding tax When a payment is made to a party in another country, the laws of the payer’s country may require withholding tax to be applied to the payment. International withholding tax may be required for payments of dividends or interest. A double tax treaty may reduce the amount of withholding tax required, depending upon the jurisdiction in which the recipient is tax resident.
Working capital Working capital comprises debt and equity securities, deposits and cash and cash equivalents held at Group Corporate Centre. These liquid assets are available to invest in building the Group’s business operations.

AIA
Gro
up Lim
ited 友邦保險控股有限公司
Annual R
epo
rt 2012
AIA Group Limited友邦保險控股有限公司
AIA.COM


