30
Creating User Interfaces Review midterm Sampling Homework: User observation reports due next week
| Date post: | 30-Dec-2015 |
| Category: |
Documents |
| Upload: | sherilyn-oconnor |
| View: | 217 times |
| Download: | 2 times |
Creating User Interfaces
Review midtermSampling
Homework: User observation reports due next week
Sampling
• Basic technique when it is impossible or too expensive to measure everything/everybody
• Premise: possible to get random sample, meaning every member of whole population equally likely to be in sample
• NOTE: not a substitute for monitoring directly activity on / with interface
Source
• The Cartoon guide to Statistics by Larry Gonick and Woollcott SmithHarperResource
• Procedures (formulas) presented without proof, though, hopefully, motivated
Task
• Want to know the percentage (proportion) of some large group– adults in USA– television viewers– web users
• For a particular thing– think the president is doing a good job– watched specific program
• viewed specific commercial• visited specific website
Strategy: Sampling
• Ask a small group– phone– solicitation at a mall– Follow-up or prelude to access to webpage– other?
• Monitor actions of a small group, group defined for this purpose
• Monitor actions of a panel chosen ahead of timeALL THESE: make assumption that those in group
are similar to the whole population.
Two approaches
• Estimating with confidence intervalc in general population based on proportionphat
in sample
• Hypothesis testing:H0 (null hypothesis) p = p0 versusHa p > p0
Estimation process
• Construct a sample of size n and determine phat
– Ask who they are voting for (for now, let this be binomial choice)
• Use this as estimate for actual proportion p.
• … but the estimate has a margin of error. This means :The actual value is within a range centered at phat …UNLESS the sample was really strange.
• The confidence value specifies what the chances are of the sample being that strange.
Statement
• I'm 95% sure that the actual proportion is in the following range….
• phat – m <= p <= phat + m
• Notice: if you want to claim more confidence, you need to make the margin bigger.
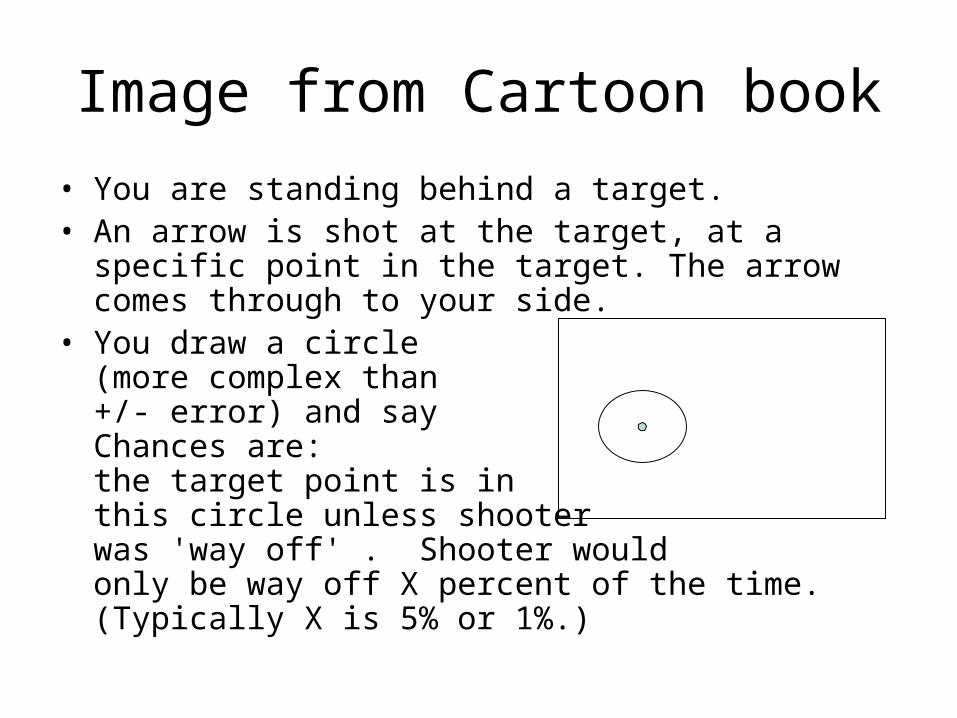
Image from Cartoon book
• You are standing behind a target.• An arrow is shot at the target, at a specific point in the
target. The arrow comes through to your side.• You draw a circle
(more complex than+/- error) and sayChances are:the target point is inthis circle unless shooterwas 'way off' . Shooter would only be way off X percent of the time.(Typically X is 5% or 1%.)
Mathematical basis
• Samples are themselves normally distributed…– if sample and p satisfy certain conditions.
• Most samples produce phat values that are close to the p value of the whole population.
• Only a small number of samples produce values that are way off.– Think of outliers of normal distribution
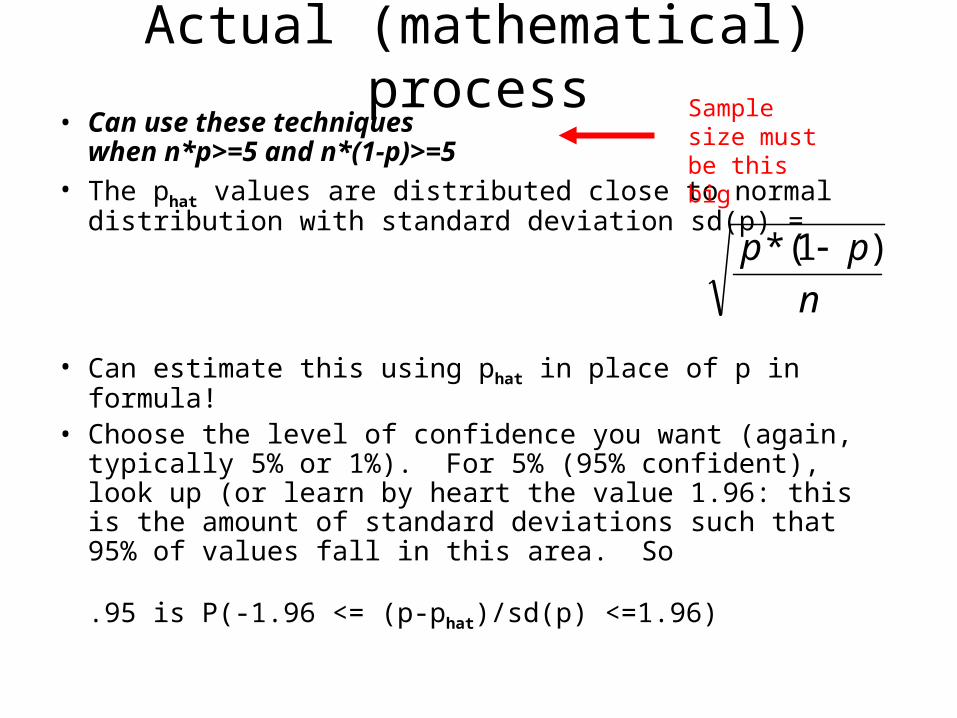
Actual (mathematical) process• Can use these techniques
when n*p>=5 and n*(1-p)>=5• The phat values are distributed close to normal
distribution with standard deviation sd(p) =
• Can estimate this using phat in place of p in formula!• Choose the level of confidence you want (again, typically
5% or 1%). For 5% (95% confident), look up (or learn by heart the value 1.96: this is the amount of standard deviations such that 95% of values fall in this area. So .95 is P(-1.96 <= (p-phat)/sd(p) <=1.96)
n
pp )1(*
Sample size must be this big
Notes
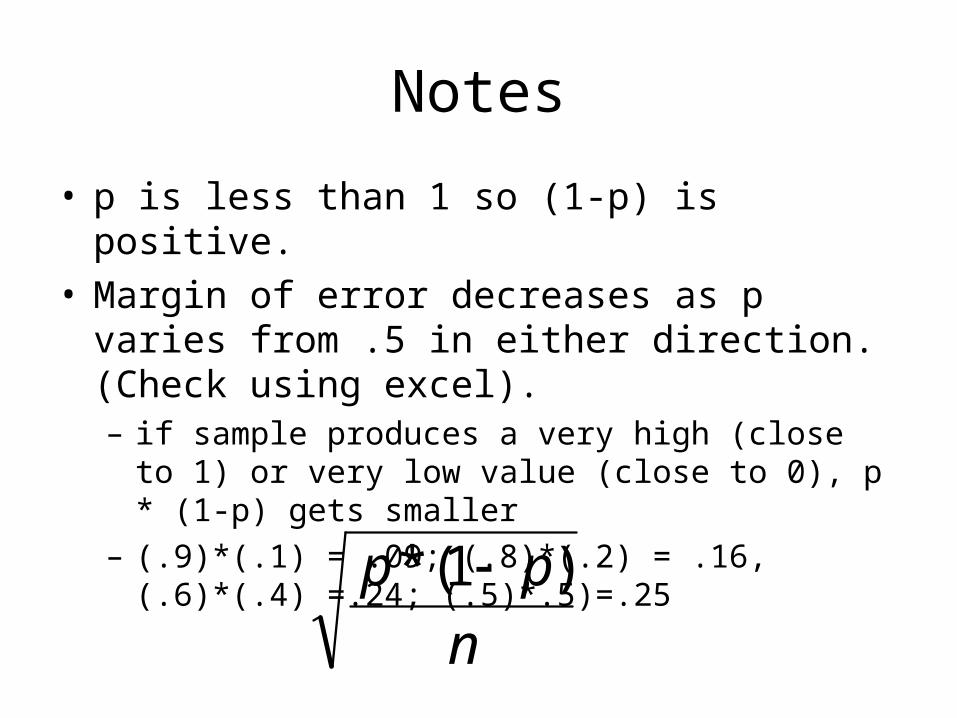
• p is less than 1 so (1-p) is positive.• Margin of error decreases as p varies from .5 in
either direction. (Check using excel).– if sample produces a very high (close to 1) or very
low value (close to 0), p * (1-p) gets smaller– (.9)*(.1) = .09; (.8)*(.2) = .16, (.6)*(.4) =.24;
(.5)*.5)=.25
n
pp )1(*
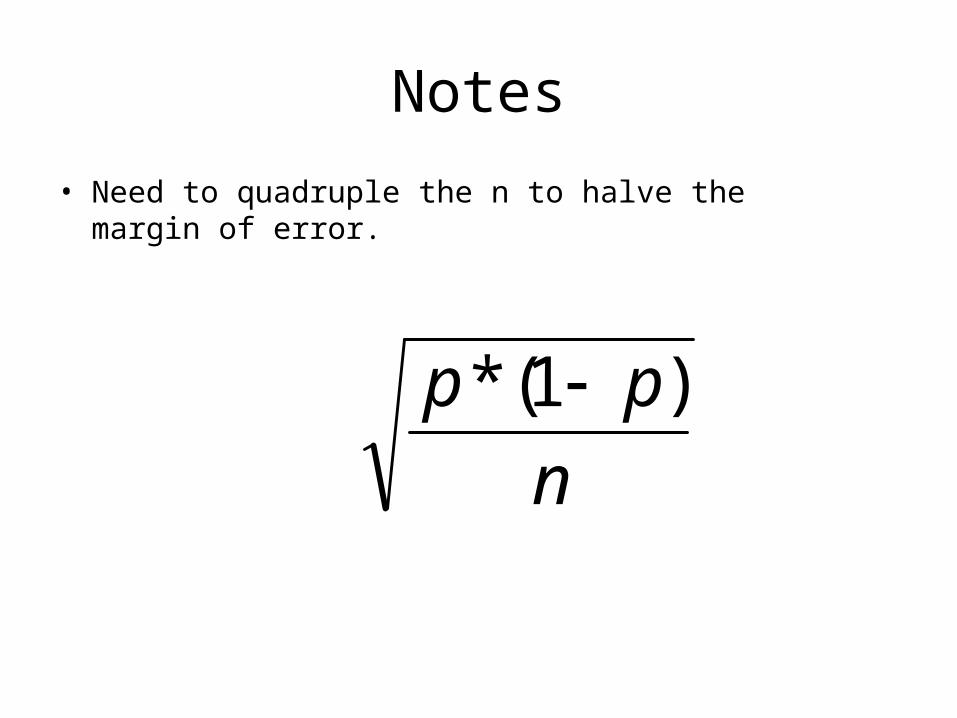
Notes
• Need to quadruple the n to halve the margin of error.
n
pp )1(*
Formula
• Use a value called the z transform– 95% confidence, the value is 1.96
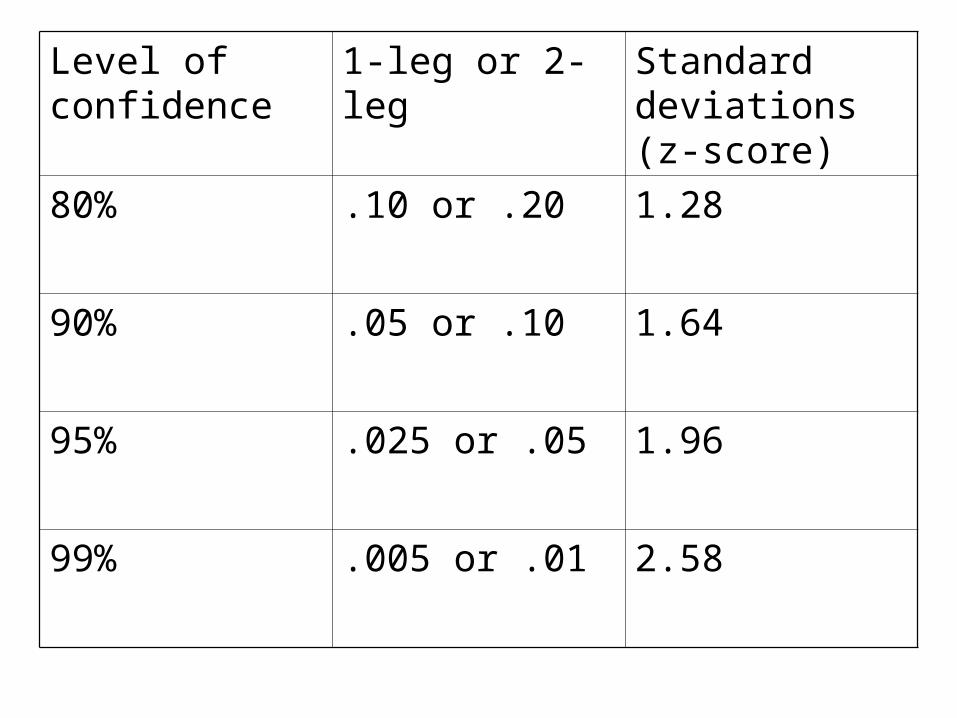
Level of confidence
1-leg or 2-leg Standard deviations (z-score)
80% .10 or .20 1.28
90% .05 or .10 1.64
95% .025 or .05 1.96
99% .005 or .01 2.58
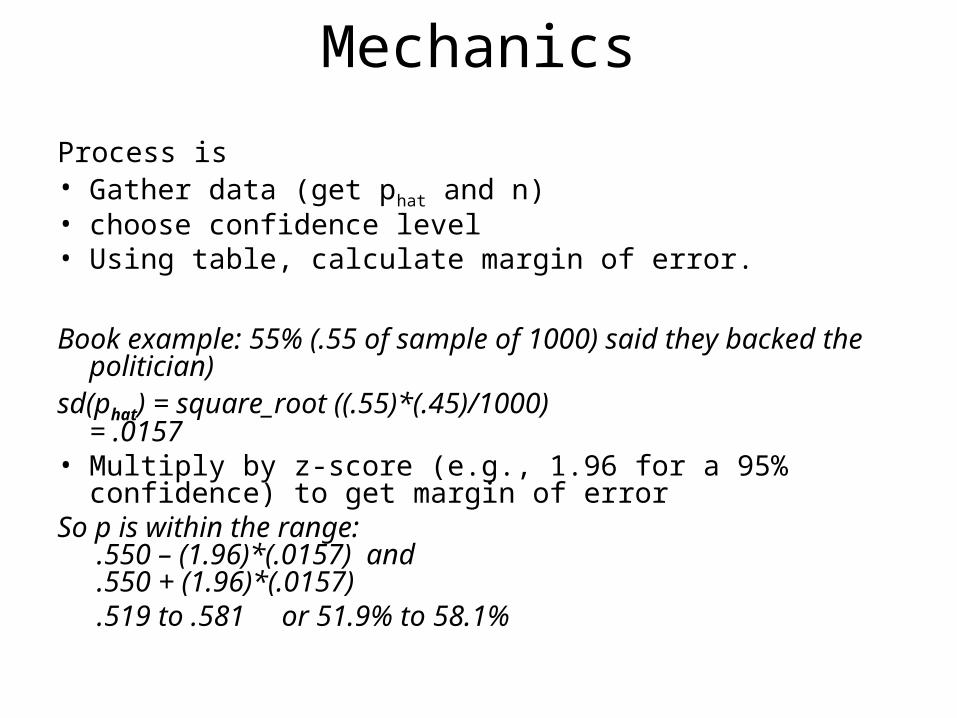
Mechanics
Process is • Gather data (get phat and n)• choose confidence level • Using table, calculate margin of error.
Book example: 55% (.55 of sample of 1000) said they backed the politician)
sd(phat) = square_root ((.55)*(.45)/1000)= .0157
• Multiply by z-score (e.g., 1.96 for a 95% confidence) to get margin of error
So p is within the range: .550 – (1.96)*(.0157) and .550 + (1.96)*(.0157) .519 to .581 or 51.9% to 58.1%
Example, continued
51.9% to 58.1%
may round to 52% to 58%
or
may say 55% plus or minus 3 percent.
What is typically left out is that there is a 1/20 chance that the actual value is NOT in this range.
95% confident means
• 95/100 probability that this is true• 5/100 chance that this is not true• 5/100 is the same as 1/20 so,• There is only a 1/20 chance that this is not true.• Only 1/20 truly random samples would give an
answer that deviated more from the real
– ASSUMING NO INTRINSIC QUALITY PROBLEMS– ASSUMING IT IS RANDOMLY CHOSEN
99% confidence means
• [Give fraction positive]
• [Give fraction negative]
Why
• Confidence intervals given mainly for 95% and 99%??
• History, tradition, doing others required more computing….
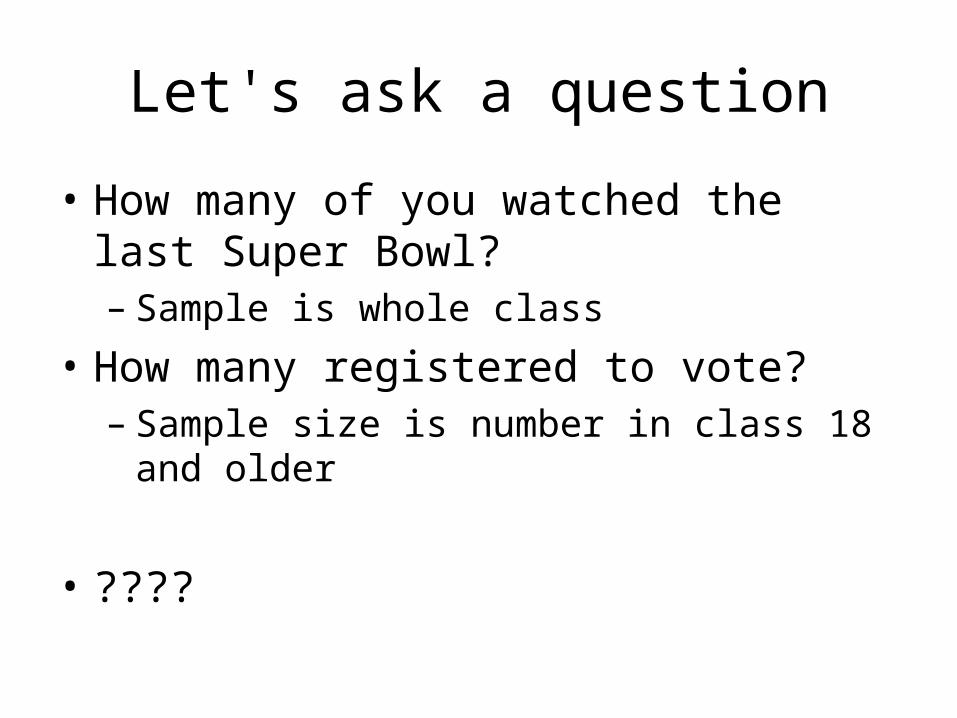
Let's ask a question
• How many of you watched the last Super Bowl?– Sample is whole class
• How many registered to vote?– Sample size is number in class 18 and older
• ????
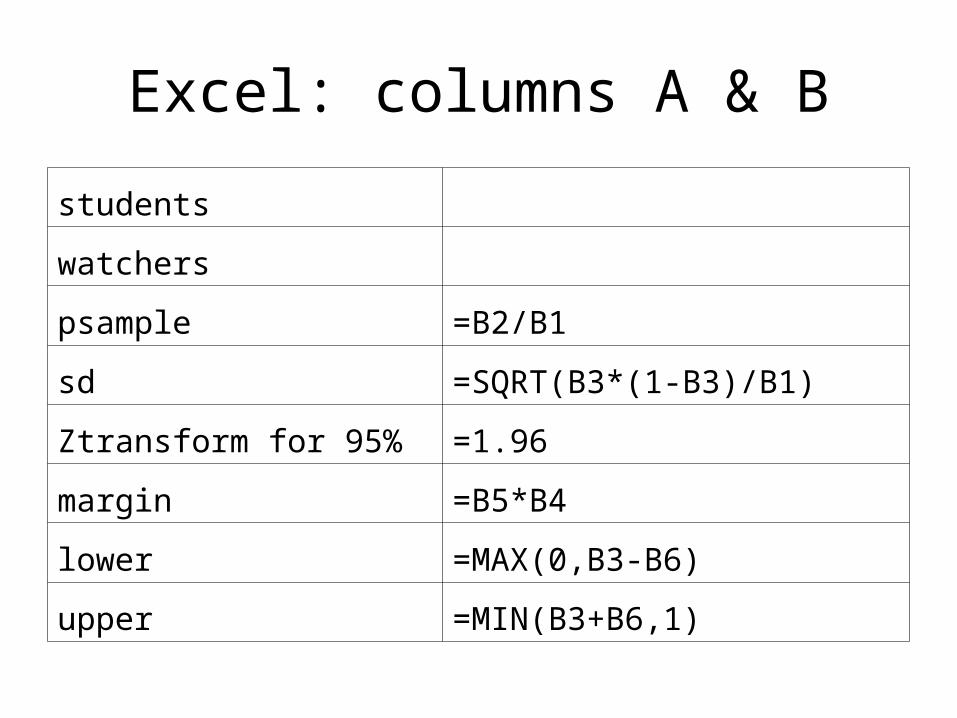
Excel: columns A & B
students
watchers
psample =B2/B1
sd =SQRT(B3*(1-B3)/B1)
Ztransform for 95% =1.96
margin =B5*B4
lower =MAX(0,B3-B6)
upper =MIN(B3+B6,1)
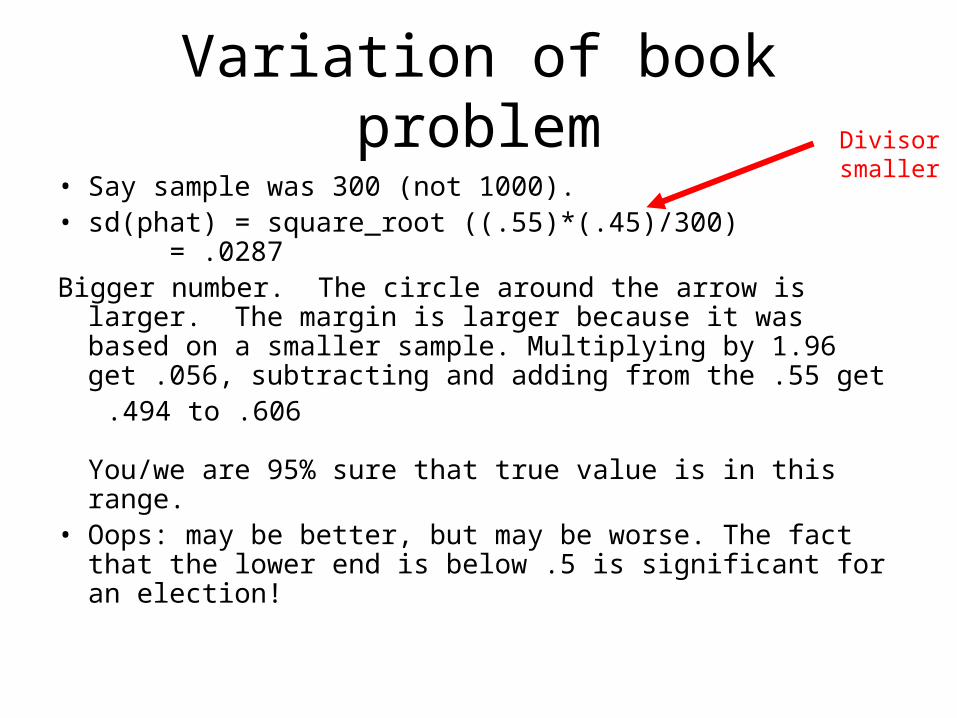
Variation of book problem
• Say sample was 300 (not 1000).• sd(phat) = square_root ((.55)*(.45)/300)
= .0287Bigger number. The circle around the arrow is larger. The
margin is larger because it was based on a smaller sample. Multiplying by 1.96 get .056, subtracting and adding from the .55 get
.494 to .606
You/we are 95% sure that true value is in this range.• Oops: may be better, but may be worse. The fact that
the lower end is below .5 is significant for an election!
Divisor smaller
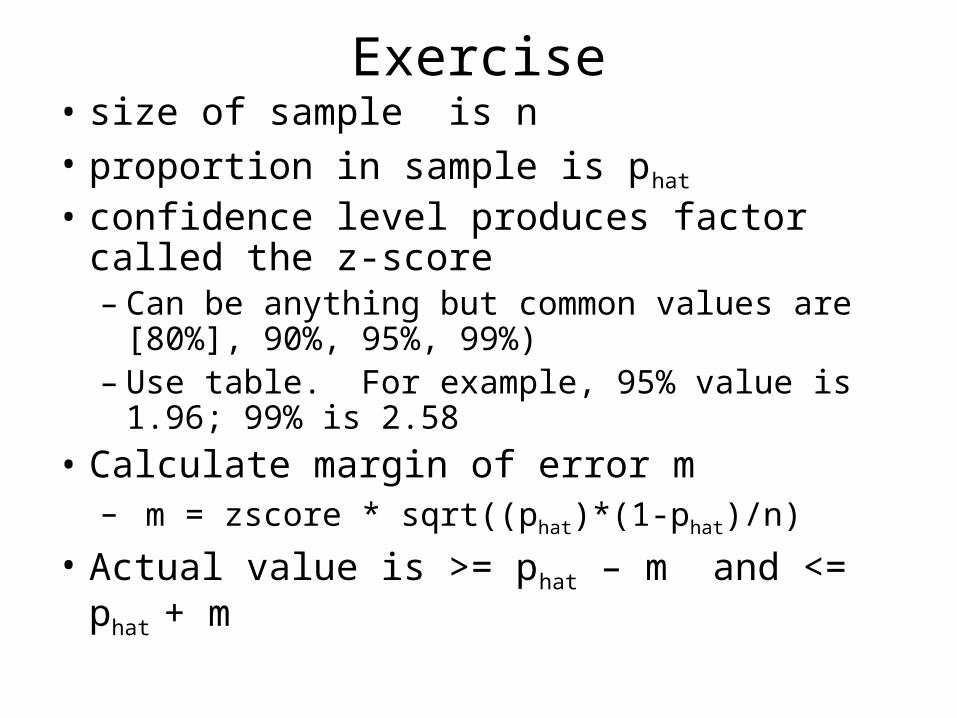
Exercise• size of sample is n• proportion in sample is phat
• confidence level produces factor called the z-score– Can be anything but common values are
[80%], 90%, 95%, 99%) – Use table. For example, 95% value is 1.96;
99% is 2.58
• Calculate margin of error m– m = zscore * sqrt((phat)*(1-phat)/n)
• Actual value is >= phat – m and <= phat + m
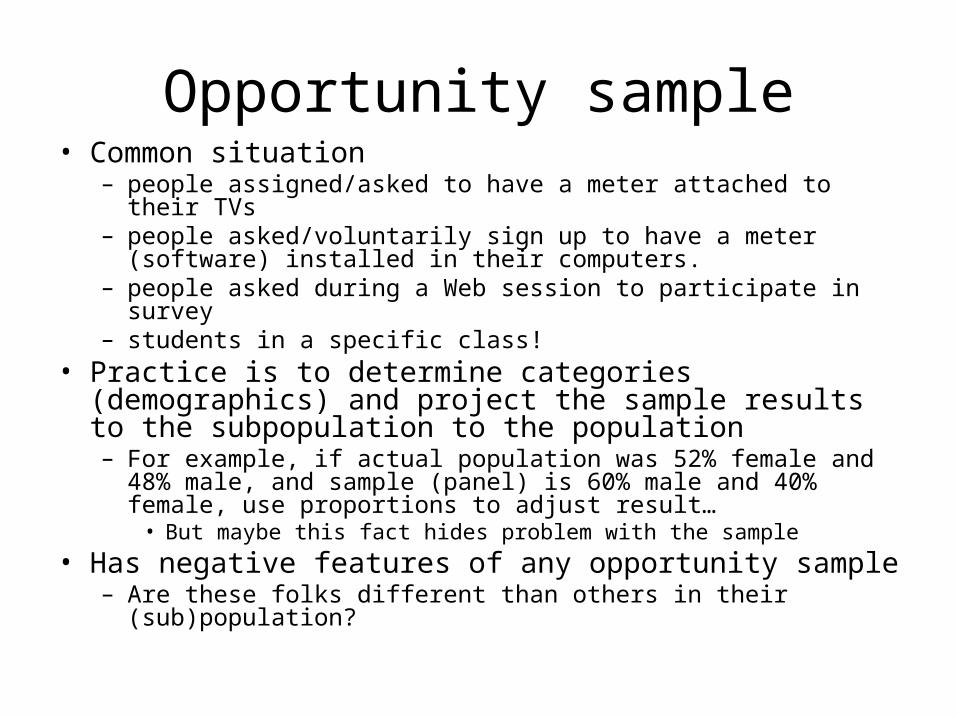
Opportunity sample• Common situation
– people assigned/asked to have a meter attached to their TVs– people asked/voluntarily sign up to have a meter (software)
installed in their computers.– people asked during a Web session to participate in survey– students in a specific class!
• Practice is to determine categories (demographics) and project the sample results to the subpopulation to the population– For example, if actual population was 52% female and 48%
male, and sample (panel) is 60% male and 40% female, use proportions to adjust result…
• But maybe this fact hides problem with the sample
• Has negative features of any opportunity sample– Are these folks different than others in their (sub)population?
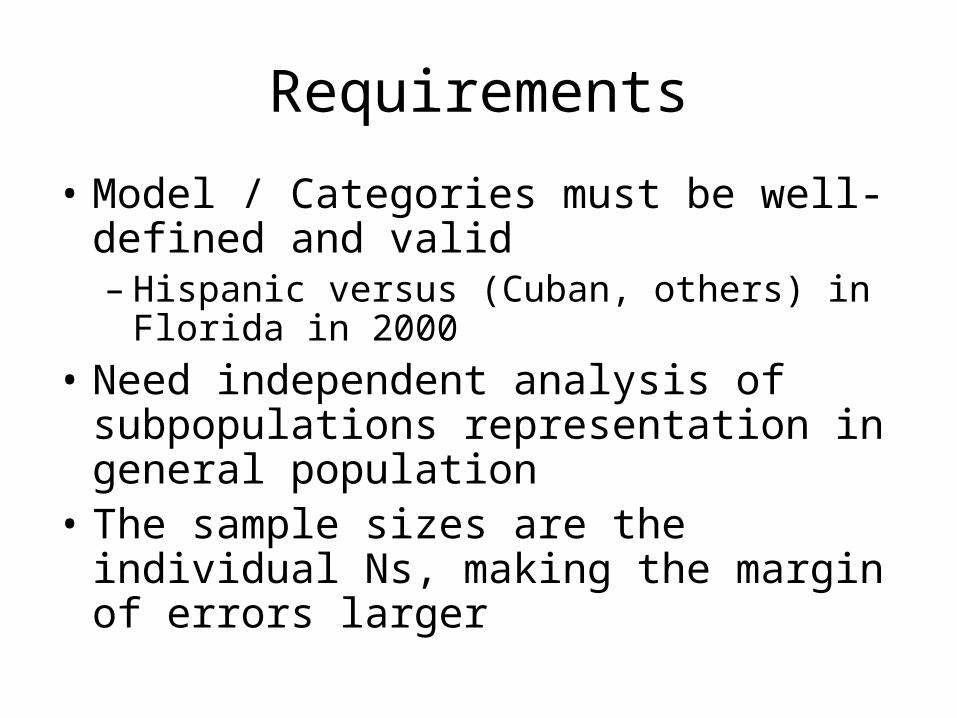
Requirements
• Model / Categories must be well-defined and valid– Hispanic versus (Cuban, others) in Florida in
2000
• Need independent analysis of subpopulations representation in general population
• The sample sizes are the individual Ns, making the margin of errors larger
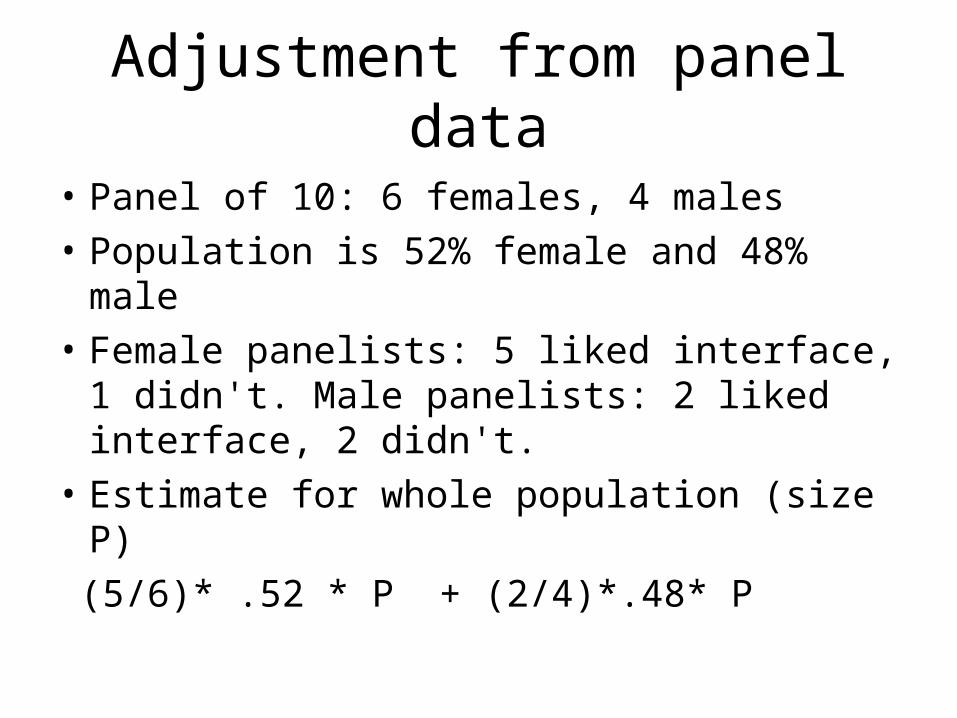
Adjustment from panel data
• Panel of 10: 6 females, 4 males
• Population is 52% female and 48% male
• Female panelists: 5 liked interface, 1 didn't. Male panelists: 2 liked interface, 2 didn't.
• Estimate for whole population (size P)
(5/6)* .52 * P + (2/4)*.48* P
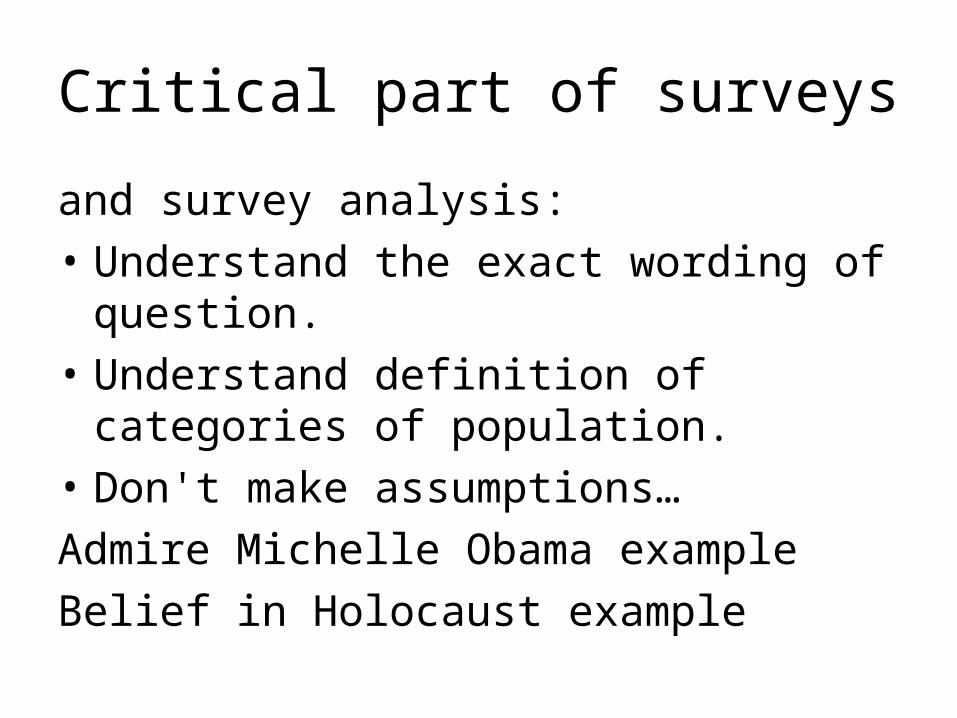
Critical part of surveys
and survey analysis:
• Understand the exact wording of question.
• Understand definition of categories of population.
• Don't make assumptions…
Admire Michelle Obama example
Belief in Holocaust example
Usability research
• Often aims for qualitative, not quantitative results– Ideas, critical factors
• Note: there are fields of study– Non-numeric statistics– Qualitative research
• Still necessary to be systematic.• AD: consider taking Statistics!
Homework
• Continue work on user observation studies– This is qualitative work


