40
1 Technology Change, Economic Feasibility and Creative Destruction: The Case of New Electronic Products and Services By Jeffrey L Funk Forthcoming INDUSTRIAL AND CORPORATE CHANGE
| Date post: | 13-Apr-2017 |
| Category: |
Business |
| Upload: | jeffrey-funk |
| View: | 70 times |
| Download: | 0 times |

1
Technology Change, Economic Feasibility and Creative Destruction:
The Case of New Electronic Products and Services
By
Jeffrey L Funk
Forthcoming
INDUSTRIAL AND CORPORATE CHANGE

2
Technology Change, Economic Feasibility and Creative Destruction:
The Case of New Electronic Products and Services
Abstract
This paper shows how new forms of electronic products and services become economically
feasible and thus candidates for commercialization and creative destruction as improvements in
standard electronic components such as microprocessors, memory, and displays occur. Unlike the
predominant viewpoint in which commercialization is reached as advances in science facilitate
design changes that enable improvements in performance and cost, most new forms of electronic
products and services are not invented in a scientific sense and the cost and performance of them
are primarily driven by improvements in standard components. They become candidates for
commercialization as the cost and performance of standard components reach the levels necessary
for the final products and services to have the required levels of performance and cost. This
suggests that when managers, policy makers, engineers, and entrepreneurs consider the choice and
timing of commercializing new electronic products and services, they should understand the
composition of new technologies, the impact of components on a technology’s cost, performance
and design, and the rates of improvement in the components.

3
1. Introduction
Although different terms are used, most economic (Schumpeter, 1934; Rosenberg, 1974,
1982, 1994; Acemoglu and Robinson, 2012), marketing (Chandy and Tellis, 1998), and
management (Christensen, 1997; Adner, 2002) scholars agree that creative destruction is an
essential part of economic and firm growth. Technologies such as steam engines, electricity,
automobiles, aircraft, integrated circuits, computers, and the Internet destroyed an existing order
of firms and created a new one in the form of new products, services, and systems. These new
forms of products, services, and systems, have enabled dramatic improvements in economic
productivity (Solow, 1957) and thus living standards and have created winners and losers at the
individual, firm, and country level (Acemoglu and Robinson, 2012).
But how should firms, entrepreneurs, governments, and universities search for these new
technologies? Where should they look, what should they monitor, and how can managers and
policy makers use this information to “look forward and reason back,” in order to identify
commercially viable technologies and develop good strategies for them (Yoffie and Cusumano,
2015)? These questions suggest a more fundamental question: what is the long-term evolutionary
process (Nelson and Winter, 1982; Ziman, 2000; Murmann, 2004) by which new technologies
become economically feasible and thus candidates for commercialization and creative
destruction? There may be multiple processes depending on a technology’s paradigm (Dosi, 1982)
and thus different types of technologies may have different directions and rates of change, types
of problems to solve, and ways of achieving improvements (Dosi, 1982; Dosi and Nelson, 2010).
The predominant viewpoint is that new technologies proceed through distinct stages of
invention (Arthur, 2007), commercialization, and diffusion (Rogers, 1963) in which advances in
science facilitate design changes that enable improvements in performance and cost (Rosenberg,
1974, 1982, 1994; Balconi et al, 2012). Advances in science – new explanations of natural or
artificial phenomena - play an important role in this process because they facilitate the new product
and process designs that lead to improvements along cost and performance trajectories (Dosi,

4
1982) over the many decades before commercialization occurs (Rosenberg, 1974; Arthur, 2009;
Balconi et al, 2012; Funk and Magee, 2015). Following commercialization and implementation
(Geels, 2002, 2004; Ansari and Garud, 2008), costs continue to fall as diffusion occurs, production
is expanded, and R&D is increased, thus leading to improvements in performance and cost along
an experience curve (Dutton and Thomas, 1984; Lieberman, 1984; Balasubramania and
Lieberman, 2010).
This paper considers important types of products and services for which an alternative process
is more appropriate than is the predominant viewpoint of invention, commercialization, and
diffusion. Most new forms of computers, smart phones and apps, game consoles and content,
Internet services and content, wearable computing, and other electronic products and services,
even when they are considered radical innovations that lead to creative destruction, do not directly
involve advances in science in their overall designs and thus they are not invented in a scientific
sense. Second, anecdotal evidence (Dedrick et al, 2009; Funk, 2013a) suggests that the cost of
most electronic products and services are impacted more by standard components such as
microprocessors, memory, and displays than by assembly costs and thus cumulative production
and experience curves are not useful for analyzing their cost and performance. Third, many of
these standard components have experienced very rapid rates of improvements of greater than
30% per year over the last 50 years (Funk and Magee, 2015).
This paper proceeds as follows. It first surveys the literature on how new technologies
become economically feasible and thus become candidates for commercialization and creative
destruction. Second, the methods of finding and analyzing cost data and characterizing the
improvements in performance and cost of products are summarized. Third, it shows that the costs
of most electronic products primarily depend on the cost of standard components such as
microprocessors, memory, and displays. Fourth, it analyzes two recently introduced electronic
products, the iPhone and the iPad, that have led to creative destructions in hardware and app-based
services. Fifth, using longitudinal data on the iPhone, iPad and their components, it works

5
backwards to understand the process by which they and their associated services became
economically feasible. Sixth, it uses this analysis to propose an evolutionary process by which
electronic products and services become economically feasible.
2. Literature Review
New technologies must provide certain levels of performance and price before they will
become economically feasible and thus candidates for commercialization. This can be graphically
represented with demand and supply curves in Figure 1. For simplification, this figure focuses on
the typical movements of a supply curve over time as a new technology becomes cheaper. In
particular, the price (and thus the cost) of a new technology must fall below a maximum threshold
of price before users will consider purchasing products based on the new technology (see the
arrow in Figure 1). If performance instead of price is plotted on the y-axis, one can also represent
minimum thresholds of performance in Figure 1; the performance of a new technology must
exceed this performance before users will consider purchasing products based on the new
technology (Green and Wind, 1973; Lancaster, 1979; Adner, 2002, 2004; Adner and Zemsky,
2005). Since multiple dimensions of performance are typically relevant for a new technology,
multiple figures can also be used or the multiple dimensions can be combined into a single value
proposition (Chandy and Tellis, 1998), which should be superior to the one for the previous
technology. One can also define minimum levels of performance and maximum levels of price for
each user represented by the demand curve in Figure 1 where each user may have different needs
and willingness to pay partly because they are using the technology for different applications.
But how does a technology reach the point at which performance exceeds the minimum
threshold of performance and at which price falls below the maximum threshold of price for the
early users represented by the demand curve in Figure 1? Answering these questions requires an
understanding of technology paradigms (Dosi, 1982) including the directions and rates of change,
the problems being solved, and the way improvements are being achieved (Dosi, 1982: Dosi and

6
Nelson, 2010). More generally speaking, what is the long-term evolutionary process (Nelson and
Winter, 1982; Ziman, 2000; Murmann, 2004) by which this occurs, and how can managers (and
policy makers) use this information to “look forward and reason back” (Yoffie and Cusumano,
2015) in order to develop good strategies for new technologies, including the timing of the
commercialization.
As noted in the introduction, the predominant viewpoint is that improvements occur as new
technologies proceed through distinct stages of invention (Arthur, 2007), commercialization, and
diffusion (Rogers, 1963) in which advances in science facilitate improvements in the overall
design (Rosenberg, 1974; Arthur, 2009; Balconi et al, 2012), particularly before
commercialization. For example, the creation of new materials that better exploited physical
phenomena (Funk, 2013b) enabled rapid improvements over many decades in the performance
and cost of quantum dot solar cells and displays; organic transistors, solar cells, and displays; and
of quantum computers. Also before commercialization, reductions in the scale of transistors and
memory cells enabled rapid improvements in superconducting Josephson junctions and resistive
RAM (Funk and Magee, 2015). Consistent with other research (Rosenberg, 1974; Dosi, 1982;
Arthur, 2009; Balconi et al, 2012), advances in science facilitated the use of new materials and the
reductions in scale (Funk and Magee, 2015).
The creation and demonstration (i.e., invention) of new concepts is also sometimes facilitated
by advances in science. This is because a new explanation of physical or artificial phenomenon
often forms the basis for a new concept (Arthur, 2007, 2009), sometimes through combinatorial
search and recursion (Fleming, 2001; Fleming and Sorenson, 2001; Arthur, 2007). Thus, although
some old technologies (e.g., the steam engine) were commercialized before most advances in
science occurred, the concepts for more recent technologies were mostly based on advances in
science. In addition to the examples mentioned in the previous paragraph, other examples include
radio (Lewis, 1991), television (Bilby, 1986), semiconductors (Tilton, 1971), lasers, light-emitting
diodes (Orton, 2005); and liquid crystal displays (Castellano, 2005).
7
After a technology is commercialized and implementation problems are solved (Geels, 2002,
2004; Ansari and Garud, 2008), the predominant viewpoint is that another set of dynamics begins
to operate; costs fall as learning is done in factories (Wright 1936; Argote and Epple 1990) and as
R&D spending is increased (Schmookler, 1966; Sinclair et al, 2000). The former is called the
learning curve (Arrow 1962; Thornton and Thompson, 2001) and the latter is called the experience
curve. In the latter, some argue that all of the cost and performance improvements can be explained
in a model linking cumulative production with the improvements (Dutton and Thomas, 1984;
Lieberman, 1984; Balasubramania and Lieberman, 2010) in which changes in the product design
are defined as novel combinations of components (Basalla, 1995; Iansiti, 1995).
Consider automobiles. Improvements in the acceleration of automobiles, the comfort and
safety of the ride, the aesthetics of the interior and exterior, and the durability of the automobile
came from novel combinations of mechanical components at the system level over many decades
(Abernathy and Clark, 1985). These novel designs largely involve unique rather than standard
components. For example, one comprehensive study of 29 new automobile products found that
standard components only represented about 6% of the material costs (Clark and Fujimoto, 1991).
The argument linking cumulative production with improvements in performance and/or cost
is also implicit in Christensen’s (1997) analyses of hard disk drives, computers and other
“disruptive” technologies. Although he plots performance vs. time (and not cumulative
production), his models imply that the introduction and production of a low-end product leads to
increases in R&D spending, the increased R&D spending purportedly leads to rapid improvements
in the low-end product, and these rapid improvements cause the new product to replace the
dominant product.
The literature on general-purpose technologies (David, 1990; Bresnahan and Trajtenberg,
1995; Helpman, 2003; Lipsey et al, 2005; Jovanovic and Rousseau, 2005) suggests an alternative
long-term evolutionary process (Nelson and Winter, 1982; Ziman, 2000; Murmann, 2004) by
which new technologies become economically feasible and thus candidates for commercialization

8
and creative destruction. Many of the recently defined GPTs are electronic components or
electronic products/systems. Examples of the former include integrated circuits (ICs) and lasers
and examples of the latter include computers and the Internet (David, 1990; Bresnahan and
Trajtenberg, 1995; Helpman, 2003; Lipsey et al, 2005). Building from the concept of a GPT, some
papers and books have analyzed the relationship between computers (Nordhaus, 2007), telecom,
the productivity of higher-level systems (Cortada, 2003, 2005), and economic growth (Oliner and
Sichel, 2002; Olner, Sichel and Stiroh, 2007; Jorgensen et al, 2008) where it is recognized that
improvements in standard ICs are the sources of the improvement in computers by computer
scientists (Smith, 1989), economists (Bresnahan and Trajtenberg, 1995), and management
scholars (Baldwin and Clark, 2000; Funk, 2013a, Funk, 2013b). The large impact of ICs on the
performance and cost of electronic products and services suggests these electronic products have
a different type of technology paradigm (Dosi, 1982) than do other products and services.
One reason these ICs and other electronic components are defined as GPTs is because they
have experienced rapid improvements over many decades. For example, the number of transistors
per chip for microprocessors and other ICs, the number of memory bits per dynamic random
access memory (DRAMs) and flash memory, and the number of pixels per camera chip have
doubled every 18 to 24 months for many years, resulting in relatively constant annual rates of
improvement of 30% to 40% per year (Funk and Magee, 2015). Often called Moore’s Law, these
improvements are linked by a common set of product and process design changes that are
facilitated by advances in science. As described in the semiconductor industry’s annual report
(International Technology Roadmap for Semiconductors), there is a common trajectory for many
of these ICs in which reductions in the feature size of transistors, memory cells, and pixels enable
increases in the number of transistors, memory bits, or pixels per chip respectively (ITRS, many
years); this forms the basis for the technology paradigm of ICs (Funk, 2013a).
In summary, these rapid rates of improvements in ICs and other standard electronic
components and the literature on GPTs suggest that some technologies become economically

9
feasible and candidates for commercialization through a long-term evolutionary process (Nelson
and Winter, 1982; Ziman, 2000; Murmann, 2004) that is very different from the predominant
viewpoint of invention, commercialization, and diffusion. The purpose of this paper is to analyze
this long-term process. Can we better understand the levels of performance and cost that are
needed in these components before new types of electronic products and services become
economically feasible? What other factors might impact on these required levels? How can
decision makers use knowledge of these factors and the overall process of technology change to
better search for new types of electronic products and services and commercialize them?
3. Methodology
The first step was to find detailed cost data on electronic products. Such data were found from
iSuppli and TechInsights on 89 products that can be classified as smart phones, tablet computers,
eBook readers, game consoles, MP3 players, large-screen televisions, Internet TVs, and Google
Glasses, for the years 2007 to 2014. Although cost data for other electronic products such as digital
cameras, drones, scanners, 3D printers, and smart watches were also investigated, data in
sufficient detail were not found. For the data that was found, iSuppli and TechInsights publish cost
data, some for clients and some for the public, and the public data includes cost data in various
levels of tabular detail. Some tables provide final assembly costs in addition to the cost of materials,
some tables provide more details on materials than do other tables, and one table provided data on
licensing costs (5% of the first iPhone). Most of the tables often provide information on the name
of the component and the identity of the suppliers in addition to the cost data and component
details. All of the tables also include one or multiple “others” categories in which inexpensive
components are lumped together. It is assumed that each line item (component and final assembly)
also include the cost of logistics, production tooling, and inventory. It is also assumed that the
costs are similar across customers of these standard components, although large customers will
obtain standard components both sooner and for less cost than will other customers.

10
Second, once the data was collected and placed in an excel spreadsheet, components were
defined as standard or non-standard components. Although some scholars might define standard
components as ones with standard interfaces, this paper is more concerned with cost dynamics
than with modular design/vertical disintegration and thus standard components are defined as
components that are used by multiple suppliers of an end-product and/or by multiple end products
from a single supplier. It should be noted that vertical disintegration (Baldwin and Clark, 2000) is
considered a separate (and important) research topic from the one being addressed in this paper.
To better explain the definition of standard components used in this paper, Table 1 shows the
typical data that is available for electronic products, in this case Apple’s iPhone5s. It shows the
costs for 11 categories of materials and for assembly and total cost. It also shows the specifications
for 9 different components, all of which are designed (except for the A7 processor) and
manufactured by firms other than Apple. All of these components are used in other phones or in
the cases of the A7 processor and touch screen, are used in other Apple products such as iPods
and tablet computers. Since the touch screen was unique to the iPhone until the iPad was released
in April 2010, the touch screen and its associated circuity (e.g., touch screen controller) are defined
as non-standard components in the first-generation iPhone and the iPhone 3 but are defined as
standard components in the iPhone5s (See Table 1) and subsequent iPhones. It is important to
recognize that the use of touch screen technologies in the iPhone and other smart phones (very
similar technologies are used) have made touch screen technology a standard component that is
available in a wide variety of electronic products.
Thus, except for the mechanical, electro-mechanical, and box contents, all of the components
in Table 1 can be defined as standard components and thus provide a lower estimate for the cost
of standard components in the Apple iPhone 5s. It is a lower estimate because some of the
mechanical and electro-mechanical components might also be standard components. For example,
in the more detailed cost breakdowns that are available for some of the other products, cost data
is available for passive electronic components such as filters that are used by many phone suppliers.

11
However, these passive components are placed in the “electro-mechanical” or “other” category
for many of the products by iSuppli and TechInsights and thus it is difficult to distinguish between
standard passive components and other components that are unique to the product. This causes
this paper’s analysis to underestimate the contribution of standard components to costs.
The third step in this paper’s analysis was to place the standard components into multiple
categories. The information from iSuppli and TechInsight provided various levels of detail on the
components, their category, and their specifications. These categories were used to identify a set
of component categories that are common to most or all of the nine product types for which data
was collected. For example, returning to Table 1 and beginning with NAND flash and DRAM,
they are defined as one category of memory. This process was repeated for each of the items in
Table 1 and the other 88 products. This process also relied on the author’s knowledge of electronic
components and products both as an engineer early in his career and as a researcher and consultant
on these products over the last 20 years.
Fourth, detailed information were collected on the evolution over time in the iPhone and iPad,
both of which have led to creative destruction in both hardware and app-based services. Both are
radical innovations since they involve large changes in both the concepts and architectures. The
concept of smart phones involves browsing and apps while previous phones involved voice and
texting (Yoffie and Kim, 2010; West and Mace, 2010). The concept of tablet computers involves
touch screen browsing while previous computers involve mouse-based browsing.
Data were collected on the performance measures and how improvements in these measures
are characterized. Which measures of performance are measured and improved? What types of
design changes enabled these improvements and how are they different from the design changes
that enabled improvements in other products such as automobiles (Abernathy and Clark, 1985)?
Apple’s home pages and other sites were investigated and it was found that Wikipedia’s pages on
the iPhone and iPad (probably managed by Apple or by an Apple supporter) are consistent with
Apple’s home pages and provide a good summary of how these products were improved.

12
Fifth, the information on the evolution of the iPhone and iPad were used to better understand
how they first emerged by working backwards in time. As we go back in time, the performance of
the end products and components becomes lower while the prices typically become higher.
Building from others (Green and Wind, 1973; Lancaster, 1979; Funk, 2009, 2013a), what was the
cost/price and performance in both the end product and the components that were needed before
these end products become economically feasible? Since an eco-system of apps are considered an
important part of the iPhone’s success, business model, and strategy (Yoffie and Kim, 2010), what
was the cost/price and performance that was needed in the components before Apple’s app-based
strategy became economically feasible? This also enables us to better understand how and when
specific apps, i.e., new electronic services, became economically feasible, many of which have
valuations greater than $1 billion and as high as $50 billion (e.g., Uber) and thus may lead to
creative destruction (WSJ, 2015). The next section presents the results beginning with the “first
step” discussed above, which is to understand the cost breakdown of electronic products.
4. Results
Table 2 summarizes the average percentage cost representation of final assembly and of
standard components for nine products. This data demonstrates that final assembly represents a
small percentage of costs and that standard components represents a much larger percentage of
costs than does final assembly. Final assembly represents less than 6% of total costs for all of the
nine product types and it is less than 3% for laptop computers, game consoles, televisions, and
Google Glasses. Standard components represent more than 55% of total cost and more than 60%
of material costs for all nine product types. They represent more than 80% of total costs and total
material costs for smart phones, tablet computers, eBook Readers, and televisions.
Some readers might argue that assembly operations once constituted a large percentage of
total costs but that learning in these assembly operations has reduced assembly’s contribution for
total costs to their current low values. Although this might be true for products first introduced

13
decades ago such as laptop computers, game consoles, and small-screen televisions, it is not true
for the newer products in Table 2. Apple’s first iPhone is usually defined as the first successful
Internet-compatible smart phone outside of Japan and Korea and it was introduced in 2007. Tablet
computers and eBook Readers were first introduced in about 2008, large-screen televisions were
introduced a few years earlier, and Internet TVs and Google Glass were introduced much more
recently. The recent introduction of these product types and the fact that the data in Table 2 covers
2007 to 2014 suggest that assembly costs have always represented a small percentage of total costs
and that standard components have always represented a large percentage of total costs.
Table 3 probes deeper. It summarizes the average cost contribution of specific standard
component categories for the nine types of products. All of these categories are mentioned by
iSuppli and TechInsights in their cost breakdowns and this table merely combines some categories
into larger categories. An entry of “None” means that the component is not used in the product
and an entry of “Not Available” means that the component is used in the product but that the data
is not available.
Looking at Table 3 in more detail, we begin with memory and move to the right. SRAM (Static
Random Access Memory), DRAM (Dynamic RAM), and flash memory are used in most or all of
the nine types of products to store audio, graphics, video, and other data while hard disks are used
in just a few products. Microprocessors are used in all of the products to process audio and video
signals. Processors and memory represent the largest percentages of costs in game consoles (77%)
followed by Internet TVs (47%) and smart phones (37%). For smart phones, two different
processors, one for internal processing of music, video, and other applications and one for
interacting with the cellular network, have been used for many years but they have been integrated
into a single chip in some cases (ISCC, 2013). The bills of materials from iSuppli and TechInsight
suggest that more than 90% of smart phones use one of six standard processors from five suppliers
(Travlos, 2012; Peddie, 2014; Kondojjala, 2012), most of which are based on ARM cores.
Displays are used in all of the products except game consoles and Internet TV and displays

14
represent the largest percentage of costs in large screen televisions (76%) followed by tablet
computers (38%) and eBook Readers (42%). Power management modules are in all of the
products and batteries are in all of the products except game consoles and televisions but they
represent a small percentage of final costs in all the products. Cameras are in about half the
products as are connectivity and sensors. The category of “connectivity and sensors” includes a
large variety of standard components that do WiFi, FM radio, GPS, and Bluetooth; these functions
have been integrated into a single chip by many suppliers. Sensors include accelerometers,
gyroscopes and compasses, among others.
The data in Table 3 suggest that a small number of standard components constitute most of the
final cost and thus probably determine the performance of the final products. Economists would
probably call many of the components in Table 3, particularly memory, microprocessors, and
displays, general-purpose technologies. To investigate the effect of standard components on how
and when new forms of electronic products and services become economically feasible, the
evolution of the iPhone and iPad, including smart phone apps are investigated in more detail.
4.1 Smart Phones
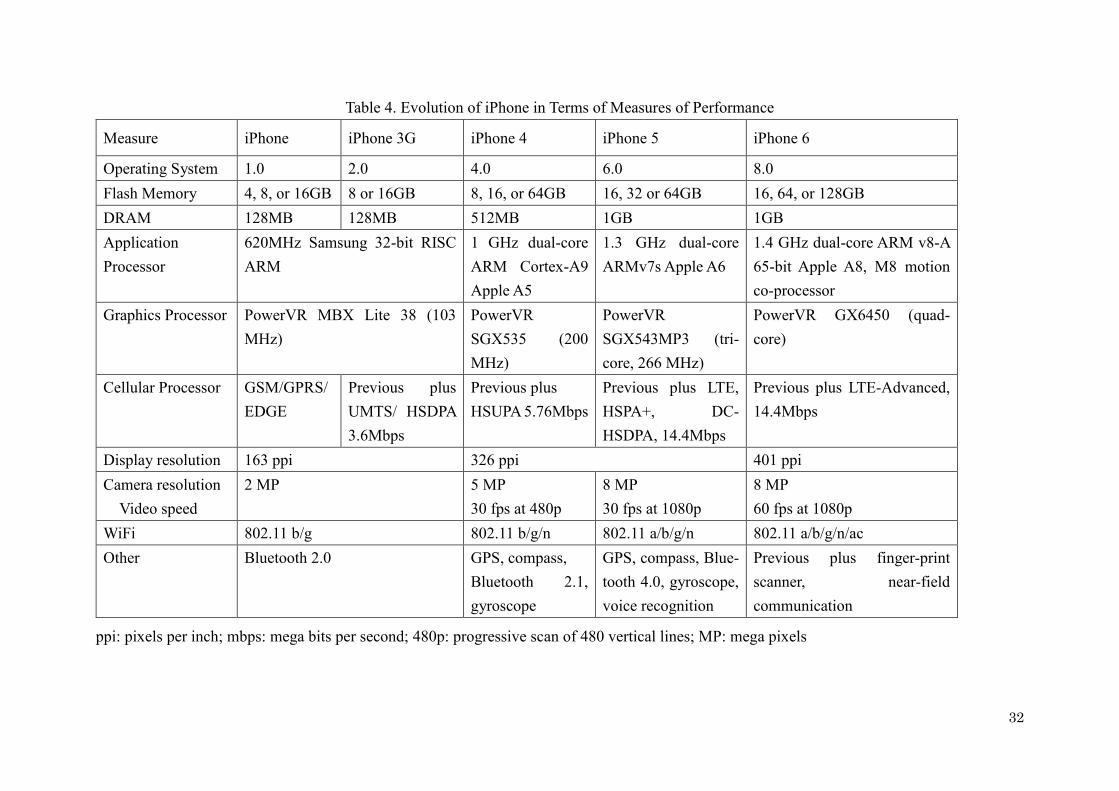
Table 4 summarizes the evolution of the iPhone. The first iPhone was introduced in 2007 and
it is a radical innovation since it involved large changes in both the concept and architecture, as
noted above. The concept of smart phones involves browsing and apps while previous phones
involved voice and texting (Yoffie and Kim, 2010). The architecture for the iPhone was also new
and can be defined as a loosely coupled architecture (Yoo et al, 2010). Many of the subsequent
iPhones can also be defined as architectural innovations (Henderson and Clark, 1990), albeit
smaller ones than the first iPhone, because functions were combined into fewer chips, electronic
and mechanical parts were moved around to meet form factor goals, and software was reorganized
to enhance usability and performance.
Table 4 organizes the evolution of the iPhone by component type since this is the way Apple

15
and others characterize the improvements. New versions of the iPhone have more memory, faster
and better processors, higher resolution displays and cameras, faster and higher resolution video
cameras, faster WiFi, and Bluetooth, and new features such as compasses, gyroscopes, voice
recognition, finger-print scanners, and near field communication. More memory increases the
number of songs, pictures, videos, games, and apps that can be stored in a phone. Faster
application and graphics processors enable increased sophistication of applications and of video
and game processing and these faster processors are needed to handle higher resolution displays
and cameras, more sophisticated games and apps, and higher audio and video resolutions (ISSCC,
2013). Newer and faster cellular processors enable compatibility with newer cellular standards
such as 3G and 4G that have faster data speeds (Gonzalez, 2010). The faster and newer WiFi and
Bluetooth chips also enable faster data speeds through compatibility with newer standards (WiFi,
2015) for these technologies. New forms of standard components such as compasses, gyroscopes,
voice recognition, finger-print scanners, and near field communication also provide new features.
The one component in Table 4 that does not show significant improvements is the touch display,
which is an additional layer on a liquid crystal display (LCD).
The importance of these components can also be seen in their impact on the performance of
the iPhone. Although such an analysis can be done for many of the components shown in Table 4
and the tradeoffs that are made among them, flash memory is analyzed since storing music, videos,
games, and particularly apps are important to many users. The first iPhone contained either 4 or
8GB of flash memory so we can hypothesize that 4GB was the minimum amount of flash memory
needed before the iPhone was economically feasible for users. According to various sources
(MacWorld, 2015; Wiki, 2015), 4 GB of memory can store about 760 songs, 4000 pictures (4
megapixel JPEG), four hours of video, or 100 apps/games, or some combination of these songs,
photos, video, and apps/games. Equal usage of them would mean a user could store 190 songs,
1000 pictures, one hour of video, and 25 apps/games in an iPhone with 4GB of flash memory.
An eco-systems of app suppliers is often emphasized in discussions of the iPhone’s success
16
(Yoffie and Kim, 2010) so flash memory’s impact on them is analyzed in further detail. 1.4 billion
apps had been downloaded by the 26 million people who had purchased an iPhone by July 2009
(Moonshadow, 2015). This means that the average user had downloaded 58 apps, thus
representing a significant fraction (58%) of the 4GB iPhone’s memory capacity. Clearly flash
memory capacity had a large impact on when Apple’s app strategy became economically feasible
and could be introduced.
A sensitivity analysis for the impact of flash memory on iPhone costs also illuminates the
importance of flash memory. The cost of the iPhone 5 varied from $207 to $238 depending on
whether the flash memory capacity was 16GB, 32GB, or 64GB. For the earlier phones, the
differences were even larger. For the iPhone 4s, the costs were between $196 and $254 for the
same range in flash memory. For the iPhone 3GS, 16GB of flash memory are $24 thus suggesting
that the costs for the same change in flash memory capacity were between $179 and $251. In
percentage terms, the same changes in flash memory capacity led to an increase of 40% in the
iPhone 3GS and an increase of only 15% in the iPhone 5. Clearly, improvements in flash memory
have had a large impact on iPhone costs and have enabled users to obtain phones with larger
amounts of memory. Similar analyses can be done for many of the other components shown in
Table 4.
Improvements in flash memory, application processors, and in other components also
impacted on the quality and variety of apps, a type of electronic service, some of which have
destroyed an existing economic system and created a new one. As improvements occurred in flash
memory and microprocessors thus enabling increases in the flash memory capacity and processing
speeds of phones, app developers were able to create more sophisticated apps for new and
interesting applications. Ride sharing (e.g., Uber), hotel (e.g., Airbnb), mobile shopping (e.g.,
Flipkart), and picture sharing (e.g., Snapchat) apps began to proliferate as the improvements in
iPhones occurred. All of the startups in parentheses are now valued at more than $15 billion and
more than other 30 startups that offer these apps were valued at more than $1 billion each as of

17
October, 2015 (WSJ, 2015). Although the costs of these apps may not be primarily driven by
standard components as with electronic products, the performance of them were driven by
improvements in phones and the mobile telecommunication systems, and improvements in both
of them were driven by improvements in microprocessors, flash memory, and other electronic
components (Gonzalez, 2010).
One component in the iPhone that is not a standard component is the operating system. Apple
uses its own operating system - iOS - in smart phones, tablet computers, and other products while
Android, which is free from Google, is used by suppliers of other smart phones, tablet computers,
and products. The first versions of these operating systems included the functionality necessary
for the first smart phones to have touch based browsing, which changed the concept of a phone
from voice and texting to touch-based browsing and required a new architecture, one that can be
called a loosely coupled architecture (Yoo et al, 2010). Touch-based browsing required different
linkages between the operating system, touch display, apps, and other components than had
existed in previous phones (McNish and Silcoff, 2015) and thus involved a completely new
architecture. The iOS and the new architecture phone architectural were essential to the success
of the iPhone because they effectively organized the service stack and the user experience around
applications, content and networking (Eaton et al, 2011). Subsequent iPhones can also be
considered architectural innovations, albeit smaller ones than the first iPhone, because there has
been continued changes in the linkages between components: functions have been combined into
fewer chips, electronic and mechanical parts have been moved around to meet form factor goals,
and software, including the operating system and its interface with apps, has been reorganized to
enhance usability.
However, the basic argument of this paper still holds for Apple’s operating system.
Improvements in standard components such as microprocessors and memory enabled this new
form of operating system to become economically feasible. As with all computers, larger and more
sophisticated operating systems require microprocessors that are faster (Maccaba, 2014) and for

18
mobile devices, the microprocessors must also have low power consumption (McNish and Silcoff,
2015). These improvements in performance (and price) came about gradually over time and even
the second and third generation iPhones have much faster browsing and lower power consumption
than did the first one. Interestingly, one reason Blackberry was slow to introduce smart phones
was because Blackberry executives did not think consumers would use phones with browsers as
slow and power consuming as the ones in the first iPhones (McNish and Silcoff, 2015); a problem
that was gradually solved as improvements in microprocessors occurred and portable battery
packs became widely available.
4.2 Tablet Computers
Table 5 summarizes the evolution of the iPad. As with the first iPhone, the first iPad is a radical
innovation since it involved changes in both the concept and architecture, as noted above. The
concept of tablet computers involves touch screen browsing while previous computers involve
mouse-based browsing. The first iPad also involved a new architecture, one that can be defined as
a loosely coupled architecture (Yoo et al, 2010). Subsequent versions can also be considered
architectural innovations (Henderson and Clark, 1990) since like smart phones, functions were
combined into fewer chips, electronic and mechanical parts were moved around to meet form
factor goals, and software was reorganized to enhance usability and performance.
As with the iPhone in Table 4, Table 5 organizes the evolution of the iPad by component type
because this is the way Apple and others characterize the improvements. Also similar to the iPhone,
new versions of the iPad have faster and better components. In fact, the components shown in
Tables 4 and 5 are almost the same; the main differences are in the cellular processors and in the
new components that provide new features. Although improved versions of cellular processors are
available in both the iPhones and iPads, cellular processors are a standard feature in the iPhone
and an option in the iPad. For the new features, the iPad includes an accelerometer, light sensor,
magnetometer, gyroscope and barometer, all made possible through new components.

19
The importance of these components can also be seen in their impact on product capability
and cost. Although such an analysis can be done for many of the components shown in Table 5,
displays, flash memory, and cellular processors are analyzed because these components probably
had the largest impact on when the iPad initially became economically feasible. The display
includes the LCD and touch screen. Although time series data on touch screens are not available,
data for LCDs suggests that their costs fell 12% per year on a per area basis between 2001 and
2011 (prices fell by 30%) and thus the cost of displays for the iPad were probably also dropping,
eventually reaching a point at which the iPad was considered economically feasible to users.
The impact of improvements in flash memory and cellular processors for the iPad are also
easy to understand. The cost of the iPad Air, released in late 2013, varies from $274 to $331
depending on whether the flash memory capacity is 16GB, 32GB, or 64GB and whether a cellular
processor for access to the cellular network is available or not. For the earlier iPads, the differences
are even larger. For the iPad3, the costs range from $316 to $409 for the same range in flash
memory and the addition of a cellular processor. For the first iPad, the costs range from $229 to
$346 for the same changes in flash memory and cellular processor. Thus, the first iPad has a cost
increase of more than 50%, the iPad3 has a cost increase of 30%, and the iPad Air has a cost
increase of 21% for the same increases in flash memory capacity and the addition of a cellular
processor. Therefore, two standard components in the iPad, the flash memory and cellular
processor increased the cost of the first iPad by 50% and this extra cost fell to 21% in the iPad Air
as the cost of these standard components fell.
As with the iPhone, one components in the iPad that is not a standard component is the iPad’s
operating system. The operating system for the iPad was borrowed from the iPhone and it included
the functionality necessary for the first iPad to have touch based browsing; this functionality
changed the concept of a computer from mouse-based to touch-based browsing. It also changed
the architecture of a computer and these architectural changes have continued with subsequent
iPads. However, as with the iPhone, the basic argument of this paper still holds for the iPad.

20
Improvements in standard components such as microprocessors and memory enabled this new
form of operating system to become economically feasible since a sufficiently large and
sophisticated operating system required microprocessors that had sufficiently fast speeds and low
power consumption.
5. Interpretation of Results
The previous section showed that the costs of standard components are much higher than that
of assembly costs for a large variety of electronic products. These standard components are mostly
provided by independent component suppliers and are used in many different types of electronic
products. Although some high cost components were designed and/or manufactured by a supplier
of an electronic product such as Samsung or Apple, in these cases the same components were used
in other end products from the same supplier and/or the same types of products from a different
supplier.
The previous section also showed that the evolution of the iPhone’s and iPad’s performance
are characterized by improvements in standard components. This suggests that not only do
standard components represent a large percentage of total costs, they also greatly contribute to
product performance. Engineers used improvements in components to improve component-based
performance measures for the iPhone and iPad and make changes to their overall design. For the
products investigated in this paper, they used improvements in memory to increase the number of
videos, pictures, songs, games, and apps that can be stored in the products. They used
improvements in microprocessors to create and improve a sophisticated operating system and to
make the device compatible with more sophisticated games, apps, and with new cellular, WiFi,
Bluetooth and other communication standards. They used improvements in displays to provide
better resolution and clarity and they used new forms of components such as GPS, accelerometers,
and compasses to provide new features. This is quite different from the system-based design
changes that were described in the literature review for automobiles (Abernathy and Clark, 1985).

21
What does this tell us about how radical innovations such as the first iPhones and iPads
became economically feasible? While most of us will read Tables 4 and 5 from left to right, reading
from right to left can help us understand how the first smart phones and tablet computers became
economically feasible. A product’s performance must exceed a minimum threshold of
performance and its price must fall below a maximum threshold of price before the product will
diffuse (Green and Wind, 1973; Lancaster, 1979; Adner, 2002, 2004; Adner and Zemsky, 2005).
These thresholds can be inferred from Tables 4 and 5 by reading from right to left and by
considering the probably lower performance and higher cost of these products before they were
released. Furthermore, since components have the largest impact on performance and cost for
smart phones and tablet computers, these thresholds can also be defined for specific components
within smart phones and tablet computers.
Consider smart phones for which many argue that touch screens, apps, and a 3G cellular
connection were necessary before they became popular with users. Specific components are
important for each of these functions. A sufficiently sensitive and inexpensive display was needed
so that browsing could be done through touch. Second, inexpensive memory was needed before
an adequate number of songs, pictures, videos, apps, and games could be saved on a smart phone
and Apple’s eco-system of app suppliers became a feasible strategy; Section 4.1 highlighted the
importance of growing memory capacity and falling costs per memory bit. Third, inexpensive and
fast processors were needed before 3G cellular capability could be placed in the phone; the 3G
connection was needed to have adequate data speeds. For each of these components, one can
calculate minimum and maximum thresholds of performance and price respectively for them that
were needed before the iPhone became economically feasible. Except for the touch screen, rates
of improvement trajectories for these components can also help estimate these thresholds.
Furthermore, since the touch screen grew out of improvements in liquid crystal displays and thin-
film processing, its development could also be analyzed if more data is collected.
A similar type of logic can be applied to tablet computers. The larger size of the display for

22
them suggests that the cost of the liquid crystal and touch screen display was probably more
important for tablet computers than for smart phones and this should be reflected in maximum
and minimum thresholds of price and performance for displays in tablet computers Second,
inexpensive WiFi chips (and perhaps a certain density of WiFi locations) were needed before tablet
computers were purchased. Maximum and minimum thresholds of price and performance
respectively can be defined for the WiFi chips, which are basically a type of microprocessor. For
each of these components, one can calculate minimum and maximum thresholds of performance
and price respectively for them that were needed before the iPhone became economically feasible
and except for the touch screen, rates of improvement trajectories for these components could help
estimate these thresholds.
For both tablet computers and smart phones, the existence of standards also helped them
become economically feasible1. Although the literature on them usually emphasizes compatibility
and network size (Shapiro and Varian, 1999), their existence also reduced the minimum level of
performance and raised the maximum level of price that were needed in components for the iPhone
and iPad because standards reduced the technical difficulties of the problems that needed to be
solved. For example, the existence of 3G network standards and WiFi standards reduced the
number of network interfaces for which the relevant ICs and software needed to handle. The
existence of standards for maps, video, music, and external memory also reduced the technical
challenges for designers. Without these standards, more complex software and higher performance
components would have been needed before the iPhone and iPad became economically feasible.
6. Discussion
What is the long-term evolutionary process (Nelson and Winter, 1982; Ziman, 2000; Murmann,
2004) by which new technologies, including ones that can be defined as radical innovations,
1 I am indebted to an anonymous reviewer for this insight.

23
become economically feasible and thus candidates for commercialization? This paper found a
process for electronic products and services that is very different from the traditional emphasis on
distinct stages of invention, commercialization, and diffusion. In spite of their large impact on the
world, i.e., creative destruction, the iPhone (and app-based services), iPad, and other new
electronic products were not invented in a scientific sense so the first stage of this process does
not exist. Although some might argue that the commercialization of the iPhone or iPad represents
a form of invention, arguing for simultaneous invention and commercialization does not illuminate
the long-term evolutionary process by which they became economically feasible.
Second, the costs of the iPhone and iPad were not driven by assembly or other “system” costs.
Instead, the costs of the iPhone, iPad, and other electronic products are primarily driven by the
cost of standard components, which are used in a wide variety of electronic products and by
multiple firms. This suggests that learning and experience curves do not explain the cost
reductions for electronic products such as the iPhone and iPad; the observation about learning
curves is consistent with (Thompson, 2012).
The apparent importance of standard components enables one to work backwards to
understand the performance and price that were needed in these components before the radical
innovations of the first iPhones and iPads, including their app-based eco-systems (Yoffie and Kim,
2010), would begin to sell. This analysis and in particular the analysis of flash memory and apps
suggests that the economics of the first iPhones and iPads were highly dependent on the price and
performance of flash memory, microprocessors, displays, and other electronic components. As the
components were improved, the concept of an iPhone and iPad became economically feasible,
they were introduced by Apple, and both diffusion and further improvements occurred. Along with
the introduction and diffusion of the iPhone and iPad, a similar set of dynamics enabled better
apps to emerge and diffuse.
This has important implications for firms must “look forward and reason back,” in order to
develop good strategies (Yoffie and Cusumano, 2015). Managers and policy makers must think
24
about the types of products and services that are likely to emerge as improvements in standard
components continue. Then they must think about which ones are the best opportunities for them
and what types of strategies are made possible by the improvements in standard components (e.g.,
app-based strategy). Only after doing these two things does the traditional literature on technology
implementation become useful (Geels, 2002, 2004; Ansari and Garud, 2008).
6.1 Theoretical Contributions
How does this paper’s results advance our understanding for evolutionary theories of
technology change? Three key issues in theories of evolutionary change are combinatorial
learning, recursion (Fleming, 2001; Fleming and Sorenson, 2001; Arthur, 2007, 2009), and variety
creation (Nelson and Winter, 1982; Ziman, 2000; Murmann, 2004), all of which can be subsumed
under the general term, “technology paradigm” (Dosi, 1982; Dosi and Nelson, 2010). For the first
three, while recombinant search among components may be a critical aspect of recursion and
variety creation for many products (Basalla, 1988; Fleming, 2001; Fleming and Sorenson, 2001;
Arthur, 2007), it is probably of less importance when standard components contribute most of the
performance and cost and these components are experiencing rapid improvements.
When standard components are important, the combinatorial learning, recursion and variety
creation revolve around them as engineers conceive of new products that might be made possible
by rapid improvements in standard components. Even when the new products are radical or
architectural innovations, engineers consider the levels of performance and cost in the components
that are needed before the performance and price of possible end products will exceed minimum
thresholds of performance and fall below maximum thresholds of price. As rapid improvements
in electronic components continue, the variety of products and services to consider continues to
grow.
This paper also has implications for recursion and variety creation once an engineer or a firm
has decided to focus on a specific type of product. Once a type of product has been chosen,
25
engineers must think about the value proposition and the customers (Chandy and Tellis, 1998).
They must think about the value proposition that a product can provide with existing components,
whether this value proposition is sufficient for customers, for which customers might this value
proposition be sufficient, and the impact of improved components on the value proposition and
architectural design for the product (Ulrich, 1995; Yoo et al, 2010). These questions are considered
recursively as a product proceeds from conceptual to detailed design and they will continue to be
relevant even after a product is commercialized.
This discussion suggests that electronic products and services have a different type of
technology paradigm (Dosi, 1982; Dosi and Nelson, 2010) from science-based products. While
science strongly impacts on how problems are solved and improvements are achieved for some
products and services, improvements in electronic components have a strong impact on many
aspects of electronic products and services. This include their direction and rates of change, the
types of problems that are solved, the way in which improvements are achieved, and thus the
direction of the entire electronics sector.
Second, electronic products involve multiple standard interfaces often at different layers in an
overall architecture (Baldwin and Clark, 2001) and many of these standards come from a wide
eco-system of firms. Each layer in the architecture (Yoo et al, 2010) involves both competition
between firms and between standards, where each competing standard is often supported by an
eco-system of firms (Adomavicius, 2008). This existence of standards and thus the competition
among them impacts on the levels of performance and price that are needed in standard
components before a new product or service becomes economically feasible. Furthermore, the
competition in the eco-system and the entry of new firms impacts on how these standard
components are assembled into higher-level standard modules and on the development of
complementary technologies such as algorithms and design tools.
6.2 Generalizability

26
How broadly is this paper’s analysis applicable? It is likely that this analysis is applicable to
radical innovations for a wide variety of electronic products including the nine products analyzed
in this paper. It can also probably help engineers analyze new forms of drones, scanners, 3D
printers, smart watches, driverless vehicles, and wearable computing, and applications for the
Internet of things. While mechanical products mostly have mechanical components, adding an
internet connection primarily involves electronic components. This will become economically
feasible when the cost of the components is lower than the value added (performance) of the
components where the value added will probably depend on the product types.
This paper’s analysis can also help find low-end disruptive innovations (Christensen, 1997).
Christensen’s theory implies that all the improvements in new forms of electronic products are
driven by the demand for these new products and that the introduction of the first successful
product is a key event that stimulates R&D in the new product. He has made this argument for
many types of computers, of electronic products including the Walkman (Christensen et al, 2001),
and of hard disk drives (Christensen, 1997). However, the high contribution of microprocessors,
semiconductor memory, hard disk memory, and monitors to the cost of computers and other
electronic products suggests that the improvements in new forms of electronic products have been
primarily driven by improvements in components and thus the impact of demand on the
improvements in the new product have been much less important than is emphasized by
Christensen. Thus, in order to find potential disruptive innovations, this paper’s results suggest
one should look for component technologies that are experiencing rapid improvements and that
enable the emergence of low-end products.
This paper’s results are also applicable to Internet content, services and software (Lyytinen
and Rose, 2003) including the Internet’s telecommunication system, servers, routers and
computers (Funk, 2013a). For example, for e-commerce sites, the cost for users primarily depends
on the cost of the Internet services and the performance of the content (e.g., pictures, videos)
depends on the bandwidth, cost, and latency of the Internet. Improvements in the Internet have

27
enabled music and video services, the greater usage of pictures, videos, and flash content on
websites, and new forms of advertising to emerge (Downes and Nunes, 2014; WebSite, 2015).
Similar arguments can be made for new forms of cloud computing, big data, and software and the
importance of architectures and standards for them. Thus, engineers can use this paper’s
description to look for new types of Internet content, services, and software and future research
should explore this issue further.
7. Conclusions
This paper describes an evolutionary process by which new forms of electronic products and
services become economically feasible that is very different than the predominant viewpoint of
invention, commercialization, and diffusion. The new forms of electronic products and services
are not invented in a scientific sense and the cost and performance of them are primarily driven
by improvements in standard components. Thus, these new products and services initially become
economically feasible as the cost and performance of standard electronic components reach the
levels necessary for the new products and services to become economically feasible. This suggests
that the composition of new technologies, the impact of components on a technology’s cost,
performance and design, and the rates of improvement in the components are important things to
consider when managers, policy makers, and engineers consider the choice and timing of
commercializing new electronic products and services.

28
Quantity
Price
q
Figure 1. Supply and Demand Curves and Maximum Threshold of Price
Demand Curve
Supply Curve
Typical movement ofsupply curve over time
Maximumthresholdof price

29
Table 1. Example of Cost Data Published for Apple iPhone 5s
Cost Element Details Cost of Phone for different
amounts of flash memory
16GB 32GB 64GB
NAND Flash $9.40 $18.80 $29.00
DRAM 1GB LPDDR3 $11.00
Display and Touch
Screen 4” Retina Display w/Touch $41.00
Processor 64-Bit A7 Processor + M7 Co-Processor $19.00
Camera 3MP (1.5 micron)+1.2MP $13.00
Wireless Section-
BB/RF/PA
Quallcom
MDM9615+WTR1605L+Front End $32.00
User Interface and
Sensors Includes fingerprint sensor assembly $15.00
WLAN/BT/FM/GPS Murata Dual-Band Wireless-N Module $4.20
Power Management Dialog+Qualcomm $7.50
Battery 3.8V~1560mAh $3.60
Mechanical/Electro-
mechanical $28.00
Box Contents $7.00
Total Materials $190.70 $200.10 $210.30
Final Assembly $8.00
Total Costs $198.70 $208.10 $218.30
Source: (IHS, 2013)

30
Table 2. Cost Breakdown for Electronic Products for Assembly and Standard Components
Type of
Product
Final Assembly Standard Components1
Number
of Data
Points
Average
cost (%)
Standard
Deviation3
Number
of Data
Points
Average cost2
(%)
Standard
Deviation3
Smart
Phones
28 4.2% 0.011 26, 28 76%, 79% 0.10,
0.10
Tablet
Computers
33 3.1% 0.010 33, 33 81%, 84% 0.033,
0.032
eBook
Readers
6 4.0% 0.0064 6, 9 88%, 88% 0.037,
0.031
Laptop
Computers
3 2.7% 0.0070 Not available
Game
Consoles
2 2.6% 0.0039 2, 2 78%, 80% 0.19,
0.19
MP3
Players
2 3.4% 0.0052 2, 9 74%, 76% 0.0087,
0.081
Large
Screen
Televisions
2 2.4% 0.0057
2, 2 82%, 84% 0.041,
0.038
Internet
TVs
2 5.7% 0.0052 2, 2 57%, 61% 0.067,
0.075
Glass
1 2.7% Not
Applicable
1, 1 62%, 64% Not
Applicable
1 Standard components exclude mechanical components, printed circuit boards, and passive
components
2 Average costs as a percent of total and material costs, figures are separated by commas
3 Standard deviations are in decimal form while averages are in percentages

31
Table 3. Percentage of Standard Components for Products Shown in Table 1
Type of
Product
Number
of Data
Points
Memory Micro-
Processor
Display Camera Connectivity
& Sensors
Battery Power
Management
Smart
Phones
23 15% 22% 22% 8.2% 7.9% 2.3% 3.8%
Tablet
Computers
33 17% 6.6% 38% 2.9% 6.3% 7.3% 2.5%
eBook
Readers
9 10% 8.1% 42% .30% 8.3% 8.3% Not available
Game
Consoles
2 38% 39% none none Not available none 5.8%
MP3
Players
9 53% 9% 6% none Not available 4% 3.5%
Televisions 2 7% 4.0% 76% none Not available none 3.0%
Internet
TVs
2 16% 31% none none 10.5% none 3.5%
Glass
1 17% 18% 3.8% 7.2% 14% 1.5% 4.5%
32
Table 4. Evolution of iPhone in Terms of Measures of Performance
Measure iPhone iPhone 3G iPhone 4 iPhone 5 iPhone 6
Operating System 1.0 2.0 4.0 6.0 8.0
Flash Memory 4, 8, or 16GB 8 or 16GB 8, 16, or 64GB 16, 32 or 64GB 16, 64, or 128GB
DRAM 128MB 128MB 512MB 1GB 1GB
Application
Processor
620MHz Samsung 32-bit RISC
ARM
1 GHz dual-core
ARM Cortex-A9
Apple A5
1.3 GHz dual-core
ARMv7s Apple A6
1.4 GHz dual-core ARM v8-A
65-bit Apple A8, M8 motion
co-processor
Graphics Processor PowerVR MBX Lite 38 (103
MHz)
PowerVR
SGX535 (200
MHz)
PowerVR
SGX543MP3 (tri-
core, 266 MHz)
PowerVR GX6450 (quad-
core)
Cellular Processor GSM/GPRS/
EDGE
Previous plus
UMTS/ HSDPA
3.6Mbps
Previous plus
HSUPA 5.76Mbps
Previous plus LTE,
HSPA+, DC-
HSDPA, 14.4Mbps
Previous plus LTE-Advanced,
14.4Mbps
Display resolution 163 ppi 326 ppi 401 ppi
Camera resolution
Video speed
2 MP 5 MP
30 fps at 480p
8 MP
30 fps at 1080p
8 MP
60 fps at 1080p
WiFi 802.11 b/g 802.11 b/g/n 802.11 a/b/g/n 802.11 a/b/g/n/ac
Other Bluetooth 2.0 GPS, compass,
Bluetooth 2.1,
gyroscope
GPS, compass, Blue-
tooth 4.0, gyroscope,
voice recognition
Previous plus finger-print
scanner, near-field
communication
ppi: pixels per inch; mbps: mega bits per second; 480p: progressive scan of 480 vertical lines; MP: mega pixels

33
Table 5. Evolution of iPad in Terms of Measures of Performance
Measure iPad iPad2 iPad3 iPad4 iPad Air iPad Air 2
Operating System 5.1.1 iOS 8
System on Chip Apple A4 Apple A5 Apple A5X Apple A6X Apple A7 Apple A8X
Application Processor 1 GHz ARM Cortex-
A8
1 GHz dual-core ARM
Cortex-A9
1.4 GHz dual-
core Apple Swift
1.4 GHz dual-core
Apple Cyclone
1.5 GHz tri-core
Graphics Processor PowerVR SGX535 Dual-core
PowerVR
SGX543MP2
Quad-core
PowerVR
SGX543MP4
Quad-core
PowerVR
SGX554MP4
Quad-core
PowerVR G6430
Octa-core
PowerVR
GXA6850
Flash Memory 16, 32, or 64 GB 16, 32, 64, or 128 GB 16, 64, 128 GB
DRAM 256 MB 512 MB 1 GB 2GB
Display 132 ppi 264 ppi
Camera resolution, video
speed, digital zoom
None .7 MP, 30fps
5 times
5 MP, 30fps,
5 times
8 MP, 30 fps
3 times
Wireless without cellular Wi-Fi 802.11a/b/g/n; Bluetooth 2.1 Wi-Fi 802.11a/b/g/n; Bluetooth 4.0
802.11a/b/g/n/ac
Bluetooth 4.0
Wireless w/cellular Above plus 2G EDGE, 3G HSDPA Above and left plus LTE
Geolocation without
cellular
WiFi, Apple location database Previous plus
iBeacon
Geolocation with cellular Assisted GPS, Apple databases,
cellular network
Previous plus GLONASS (Russian-based GPS) Previous plus
iBeacon
Other Accelerometer, light
sensor, magnetometer
Previous plus gyroscope Previous plus
barometer
ppi: pixels per inch; MP: mega pixels; fps: frames per second;

34
8. References
Acemoglu D and Robinson J 2012. Why Nations Fail, NY: Crown
Abernathy W and Clark K 1985. Innovation: Mapping the winds of creative destruction,
Research Policy 14: 3-22.
Adner, R. 2002. When are technologies disruptive? A demand-based view of the emergence of
competition, Strategic Management Journal 23 (8), 667 – 688.
Adner, R. 2004. A demand-based perspective on technology lifecycles, Advances in Strategic
Management 21: 25-43.
Adner, R. and Zemsky, P. 2005. Disruptive technologies and the emergence of competition,
The Rand Journal of Economics 36(2): 229-254.
Adomavicius G, Bockstedt J, Gupta A, and Kauffman R, 2008. Making Sense of Technology
Trends in the Information Technology Landscape: A Design Science Approach, MIS Quarterly
32(4): 779-809
Argote L and Epple D 1990. Learning Curves in Manufacturing, Science 247(4945): 920- 924.
Ansari S and Garud G 2008. Inter-generational transitions in socio-technical systems: The case
of mobile communications, Research Policy 38: 382-392.
Arrow K 1962. The economic implications of learning by doing, The review of economic
Studies 29(3): 155-173.
Arthur B 2007. The structure of invention, Research Policy 36(2): 274-287.
Arthur B 2009. The Nature of Technology: What it is and How it Evolves, NY: Free Press.
Balasubramanian N and Lieberman M 2010. Industry Learning Environments and the
Heterogeneity of Firm Performance, Strategic Management Journal 31: 390-412.
Balconi M, Brusoni S, Orsenigo L 2012. In Defence of the Linear Model, Research Policy
39(1): 1-13.
Baldwin, C. and Clark, K., 2000, Design Rules, Volume 1: The Power of Modularity, MIT Press.
Basalla G 1988. The Evolution of Technology, Cambridge University Press.
35
Bilby K 1986. The General: David Sarnoff and the Rise of the Communications Industry, NY:
Harper and Row.
Bresnahan T and Trajtenberg M, 1995. General purpose technologies 'Engines of growth?’,
Journal of Econometrics, Elsevier 65(1): 83-108.
Castellano J 2005. Liquid Gold: The Story of Liquid Crystal Displays and the Creation of an
Industry, World Scientific Publishing.
Chandy, R and Tellis G 1998. Organizing for Radical Product Innovation: The Overlooked
Role of Willingness to Cannibalize, J of Marketing Research, 34 (November), 474–87.
Christensen, C 1997, The innovator’s dilemma, Boston: Harvard Business School Press.
Christensen C, Craig T, and Hart S 2001. The Great Disruption, Foreign Affairs 80(2),
March/April.
Clark K and Fujimoto T, 1991. Product Development Performance: Strategy, Organization,
and Management in the World Auto Industry, Boston: Harvard Business School Press.
Cortada J 2004. The Digital Hand, Volume I: How Computers Changed the Work of American
Manufacturing, Transportation, and Retail Industries, NY: Oxford University Press.
Cortada J 2005. The Digital Hand, Volume II: How Computers Changed the Work of Amer.
Financial, Telecommunications, Media, Entertainment Industries, NY: Oxford Uni. Press.
David P 1990 The Dynamo and the Computer: An Historical Perspective on the Modern
Productivity Paradox, American Economic Review 80(2): 355-61
Dedrick J, Kraemer K, Linden G 2009. Who profits from innovation in global value chains?:
a study of the iPod and notebook PCs, Industrial and Corporate Change 19(1): 81-116.
Dosi, G. 1982. Technological paradigms and technological trajectories, Research Policy 11 (3):
147-162.
Dosi, G. and R. Nelson, 2010. Technical Change and Industrial Dynamics as Evolutionary
Processes, in B. Hall and N. Rosenberg (eds), Handbook of The Economics of Innovation,
Burlington: Academic Press.

36
Downes L, Nunes P 2014, Big Bang Disruption, NY: Portfolio.
Dutton J and Thomas A 1984; Treating Progress Functions as a Managerial Opportunity,
Academy of Management Review 9(2): 235-247.
Eaton B, Elaluf-Calderwood S, Sorensen C and Yoo Y 2011. Dynamic structures of control and
generativity in digital ecosystem service innovation: the cases of the Apple and Google mobile
app stores. Working paper series, 183. London School of Economics and Political Science.
Fleming L 2001. Recombinant Uncertainty in Technological Search, Management Science
47(1): 117-132.
Fleming L and Sorenson O 2001. Technology as a complex adaptive system: evidence from
patent data, Research Policy 30: 1019-1039.
Francis G 2011. Data Storage – Trends and Directions http://lib.stanford.edu/files/pasig-
jan2012/11B7%20Francis%20PASIG_2011_Francis_final.pdf;
Funk J 2009. Systems, Components, and Technological Discontinuities: The case of magnetic
recording and playback equipment, Research Policy 38(7): 1079-1216.
Funk J 2013a. Technology Change and the Rise of New Industries, Stanford University Press.
Funk J 2013b. What Drives Exponential Improvements? California Mgmt Review, Spring
Funk and Magee, 2015. Rapid Improvements with No Commercial Production: How do the
improvements occur, Research Policy 44(3): 777-788.
Geels F. 2002. Technological transitions as evolutionary reconfiguration processes: A multi-
level perspective and a case-study, Research Policy 31(8-9): 1257-1274.
Geels F, 2004. From sectoral systems of innovation to socio-technical systems: Insights about
dynamics and change from sociology and institutional theory. Res Policy 33 (6-7): 897-920.
Gonzalez M, 2010. Embedded Multicore Processing for Mobile Communication Systems, ruhr-
uni-bochum.de/integriertesysteme/emuco/files/hipeac_trends_future.pdf.accessed May 16, 2012.
Green, P. and Wind, Y. 1973, Multi-attribute Decisions in Marketing: A Measurement Approach,
Dryden Press, Hinsdale, IL.

37
Helpman E 2003. General Purpose Technologies and Economic Growth, MIT Press.
Henderson R and Clark K 1990. Architectural Innovation: The Reconfiguration of Existing
Product Technologies and the Failure of Established Firms, Admin Sci Quar 35(1): 9-30.
Iansiti 1995. Technology integration: Managing technological evolution in a complex
environment, Research Policy 24(4): 521-542
IHS, 2013. Groundbreaking iPhone 5s Carries $199 BOM and Manufacturing Cost, HIS
Teardown Revels, Sep 25. https://technology.ihs.com/451425/. Accessed March 16, 2015.
ISSCC, 2013. International Solid State Circuits Conference, ISSCC Trends
ITRS, various years. International Technology Roadmaps for Semiconductors.
http://www.itrs.net/, last accessed March 18, 2015
Jorgenson D, Ho M, and Stiroh K 2008. A Retrospective Look at the U.S. Productivity Growth
Resurgence, Journal of Economic Perspectives 22(1): 3-24.
Kondajjala, 2012. Cellular Baseband Market: 3G Smartphones Boost MediaTek to Number
Two Spot in 1H 2012.http://blogs.strategyanalytics.com/HCT/post/2012/11/16/Cellular-Baseband-Market-
3G-Smartphones-Boost-MediaTek-to-Number-Two-Spot-in-1H-2012.aspx. Accessed 29/1/2015.
Kurzwell, R., 2005, The Singularity is Near, NY: Penguin Books.
Lieberman M 1984. The learning curve and pricing the chemical processing industries. Rand
Journal of Economics 15: 213-228. R&D expenditures and capital intensity
Lipsey, R. Carlaw, K. and Bekar, C. 2005. Economic Transformations, NY: Oxford Univ Press.
Lyytinen K and Rose G 2003. The Disruptive Nature of Information Technology Innovations,
MIS Quarterly 27(4): 557-596.
Macccaba B 2014. Why Software doesn’t follow Moore’s Law, Forbes, May 19.
http://www.forbes.com/sites/ciocentral/2014/05/19/why-software-doesnt-follow-moores-law/
MacWorld, 2015. http://www.macworld.co.uk/feature/ipad/whats-iphone-or-ipads-true-storage-capacity-
3511773/ Last accessed January 26, 2015
McNish J and Silcoff, S, 2015. Losing the Signal: The Untold Story Behind the Extraordinary

38
Rise and Spectacular Fall of Blackberry, Flatiron Books.
Moonshadow, 2015. iPhone Apps, http://www.moonshadowecommerce.com/
mobile_website_faq.html
Murmann J 2004. Knowledge and Competitive Advantage: The Coevolution of Firms,
Technology, and National Institutions, NY: Cambridge University Press.
Nelson R and Winter R 1982. An Evolutionary Theory of Economic Change, Cambridge, MA:
Harvard University Press
Nordhaus W 2007. Two Centuries of Productivity Growth in Computing, Journal of
Economic History 67(1): 128-159.
Oliner S and Sichel D 2002. Information technology and productivity: where are we now and
where are we going? Economic Review 91: 1-32
Oliner S, Sichel D, Stiroh K 2007. Explaining a Productive Decade, Finance and Economics
Discussion Series 2007-63,
Orton J 2009. Semiconductors and the Information Revolution, NY: Academic Press.
Peddie J, 2014. Mobile Devices and the GPUs Inside. Last accessed Nov 17, 2016
http://jonpeddie.com/publications/mobile-devices-and-the-gpus-inside/.
Rogers, E 1983. Diffusion of Innovations (third edition). New York: Free Press
Rosenberg N 1974. Science, Invention and Economic Growth, The Econ Jour 84(333): 90-108.
Rosenberg N 1982. Inside the Black Box: Technology and Economics, Cambridge Uni. Press.
Rosenberg N 1994: Exploring the Black Box, Cambridge University Press.
Schmookler, J. 1966. Invention and Economic Growth, Cambridge, Harvard University Press.
Shapiro C and Varian H 1999. Information Rules, Boston: Harvard Business School Press.
Schumpeter J 1934. The Theory of Economic Development, NY: Transaction Publishers.
Sinclair G, Klepper S, and Cohen W 2000. What’s experience got to do with it? Sources of
cost reduction in a large specialty chemicals producer. Management Science, 46: 28–45.
Smith R 1988. A Historical Overview of Computer Architecture, IEEE Annals of the History
39
of Computing 10(4): 277-303.
Solow R. 1957. Technical Change and the Aggregate Production Function, Review of
Economics and Statistics, 39: 312-320.
Thompson P 2012. The Relationship between Unit Cost and Cumulative Quantity and the
Evidence for Organizational Learning-by-Doing, Journal of Econ Perspect. 26(3): 203-224.
Thornton R and Thompson P 2001. Learning from Experience and Learning from Others,
American Economic Review 91(5): 1350-1368.
Tilton J, 1971. International Diffusion of Technology: The Case of Semiconductors, Washington
DC: Brookings Institution.
Travlos D 2012. ARM Holdings and Qualcomm: The Winners in Mobile,
http://www.forbes.com/sites/darcytravlos/2013/02/28/arm-holdings-and-qualcomm-the-
winners-in-mobile/
Ulrich, K. 1995. The role of product architecture in the manufacturing firm, Research Policy,
24(3), 419-440.
WebSite, 2015. Average Web Page Breaks 1600K.
http://www.websiteoptimization.com/speed/tweak/average-web-page/
West J and Mace M 2010. Browsing as the killer app: Explaining the rapid success of Apple’s
iPhone, Telecommunications Policy 34, 5-6: 270-286.
WiFi, 2015. http://en.wikipedia.org/wiki/Wi-Fi, last accessed on May 6, 2015
Wright T P, 1936. Factors Affecting the Cost of Airplane, Journal of Aeronautical Sciences,
3(4): 122 – 128.
WSJ, 2015. Wall Street Journal, The Billion Dollar Startup Club,
http://graphics.wsj.com/billion-dollar-club/.
Yoffie D and Kim R 2010. Apple Inc. in 2010. HBS Case Study 9-710-467
Yoffie D and Cusumano M 2015. Strategy Rules: Five Timeless Lessons from Bill Gates, Andy
Grove, and Steve Jobs, NY: HarperCollins.

40
Yoo Y, Henfridsson O, Lyytinen K 2010. The New Organizing Logic of Digital Innovation:
An Agenda for Information Systems Research, Information Systems Research 21(4): 724-735.
Yoon Y 2010. Nano-Tribology of Discrete Track Recording Media, Unpublished PhD
Dissertation, University of California, San Diego
Ziman J 2000. Technological Innovation as an Evolutionary Process. NY: Cambridge
University Press.


