Stats REB® Calgary Real Estate BoardCalgary, August 3, 2010 –The summer cool down in Calgary’s housing market continued in the month of July, according to gures released today by the Calgary Real Estate Board (CREB ® ). The number of single family homes sold in July 2 010 in the city of Calgary was down 42 per cent from the same time a year ago, and condominium sales saw a decrease of 44 per cent from the same time a yearago. July 2010 saw 915 single family homes sold in the city of Calgary. This is a decrease of 14 per cent from 1,061 sales in June 2010. In July 2009, single family home sales totalled 1,585. The number ofcondominium sales for the month of July 2010 was 396. This was a decrease of 11 per cent from the 445 condominium transactions recorded in June 2010. In July 2009, condominium sales were 702. “Calgary’s housing market is cooling off after its record-setting pace in the post-recession period. This slow-down is not all that surprising in the face of tighter mortgage regulations and rising interest rates. The post-recession rally we saw in the summer of 2009 was unique and that pace couldn’t be sustained,” says Sano Stante, CREB ® president- elect. “The sense of urgency seen last summer, fall and winter in the lead-up to tighter mortgage-lending measures has diminished,” says Stante. “Rising mortgage rates and increased inventories will be the primary head-wind facing Calgary’s housing market, but improving job prospects will offer some tail winds in the latter half of 2010 and into 2011.” The average price of a single family home in the city of Calgary in July 2010 was $464,655, showing a 4 per cent decrease from June 2010, when the average price was $481,964, and showing an increase of 6 per cent from July 2009, when the average price was $436,782. The average price of a condominium in the city of Calgary was $291,168, showing no signica nt change from June 2010, when the average price was $292,238 and a 2 per cent increase over last year, when the average price was $285,032. Average price information can be useful in establishing trends overtime, but does not indicate actual prices in centres comprised of widely divergent neighbourhoods, oraccount for price differentials between geographical areas. “We are seeing relative stability in our average and median prices for the Calgary market,” says Stante. “A gradual return to moderate interest rates will not trigger any kind of steep decline in prices in ourhousing market. Prices may soften in select markets where inventory has bulked up, but for the most part they will remain relatively sticky as the economy improves.” “Nonetheless with the combination of historically low interest rates and a large inventory of homes, REALTORS ® are educated, licensed professionals trained to guide you through the real estate transaction. SUMMER COOL DOWN CONTINUES IN CALGARY HOUSING MARKET No MLS® information can be reprinted without sourcing the Calgary Real Estate Board. Total MLS ® Inventory to Sales Total MLS ® Information REALTOR®SOLDPROPERTIESJULY 2010 Absorption Rate there are some great buys out there—particularly in areas where comparable stock is ample such as the condominium and multi-family market. This presents a great opportunity to get into the market orto trade up,” adds Stante. The median price of a single family home in the city of Calgary for July 2010 was $400,000, showing a 5 per cent decrease from June 2010, when the median price was $418,900, and a 3 per cent increase from July 2009, when the median price was $390,000. The median price of a condominium in July 2010 was $268,000, showing a 1 per cent decrease from June 2010, when the median was $269,900. That’s up 2 per cent from July 2009, when the median price was $263,000. All city of Calgary MLS ® statistics include properties listed and sold only within Calgary’s city limits. The median price is the price that is midway between the least expensive and most expensive home sold in an area during a given period of time. During that time, half the buyers bought homes that cost more than the median price and half bought homes for less than the median price. There was a slowdown in the number of Calgarians putting homes up for sale in the month of July. Single family listings in the city of Calgary added for the month of July totalled 1,942, a decrease of 29 percent from June 2010 when 2,733 new listings were added, and showing a decrease of 7 per cent from July 2009, when 2,089 new listings came to the market. Condominium new listings in the city of Calgary added for July 2010 were 890, down 18 per cent from June 2010, when the MLS ® saw 1,084 condo listings coming to the market. This is a decrease of3 per cent from July 2009, when new condominium listings added were 918. “Indeed Alberta and Calgary’s economic recovery is lagging behind the rest of the country right now. But on the bright side we see this trend reversing itselfas we move into 201 1. We expect Alberta to lead in economic growth and recovery—outperforming much of the country in 2011,” says Stante. CREB ® is a professional body of 5,543 licensed brokers and registered associates, representing 247 member ofces and is dedicated to enhancing the value, integrity and expertise of its REALTOR® members. REALTORS ® are committed to a high standard of professional conduct, ongoing education, and a strict Code of Ethics and Standards of Business Practice. Using the services of a professional REALTOR® can help consumers take full advantage of real estate opportunities while reducing their risks when buying or selling real estate. The board does not generate statistics or analysis of any individual member or company’ s market sha re. All MLS ® active listings for Calgary and area may be found on the board’s website at www.creb.com. Page 1 of 16
Calgary, August 3, 2010 – The summer cool downn Calgary’s housing market continued in the monthf July, according to gures released today by the
Calgary Real Estate Board (CREB®
).
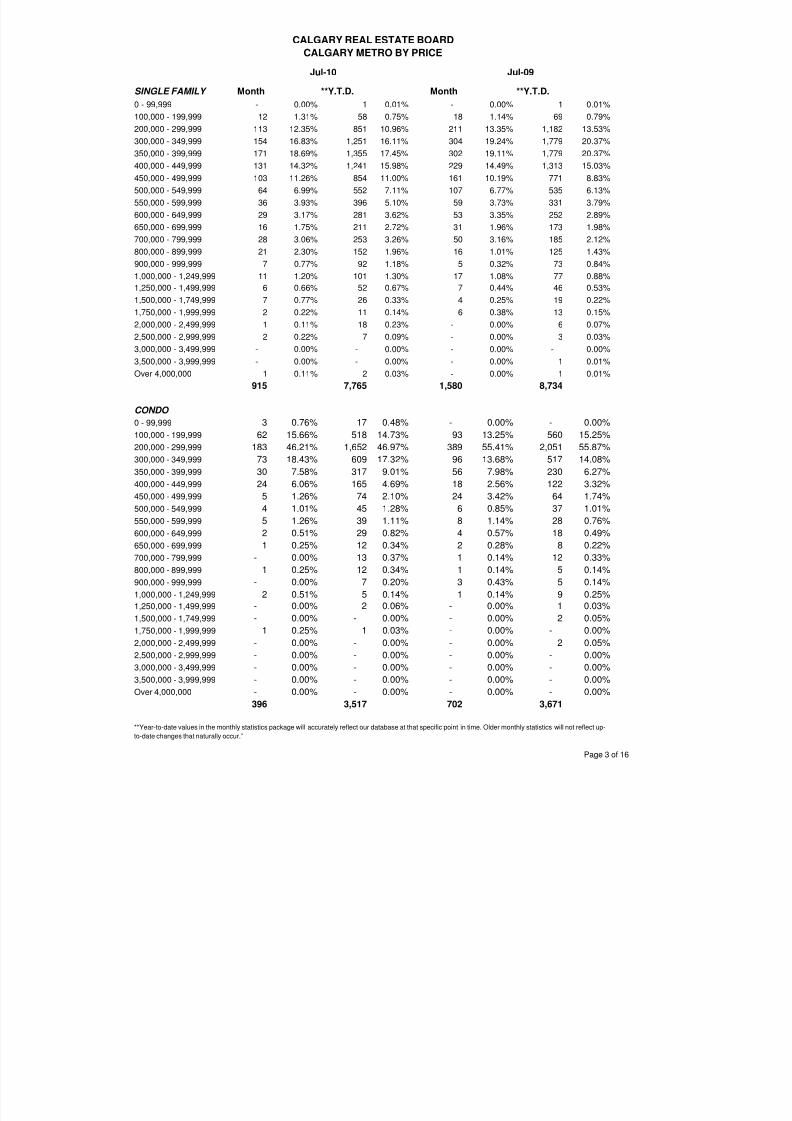
The number of single family homes sold in July 2010n the city of Calgary was down 42 per cent from theame time a year ago, and condominium sales sawdecrease of 44 per cent from the same time a year
go.
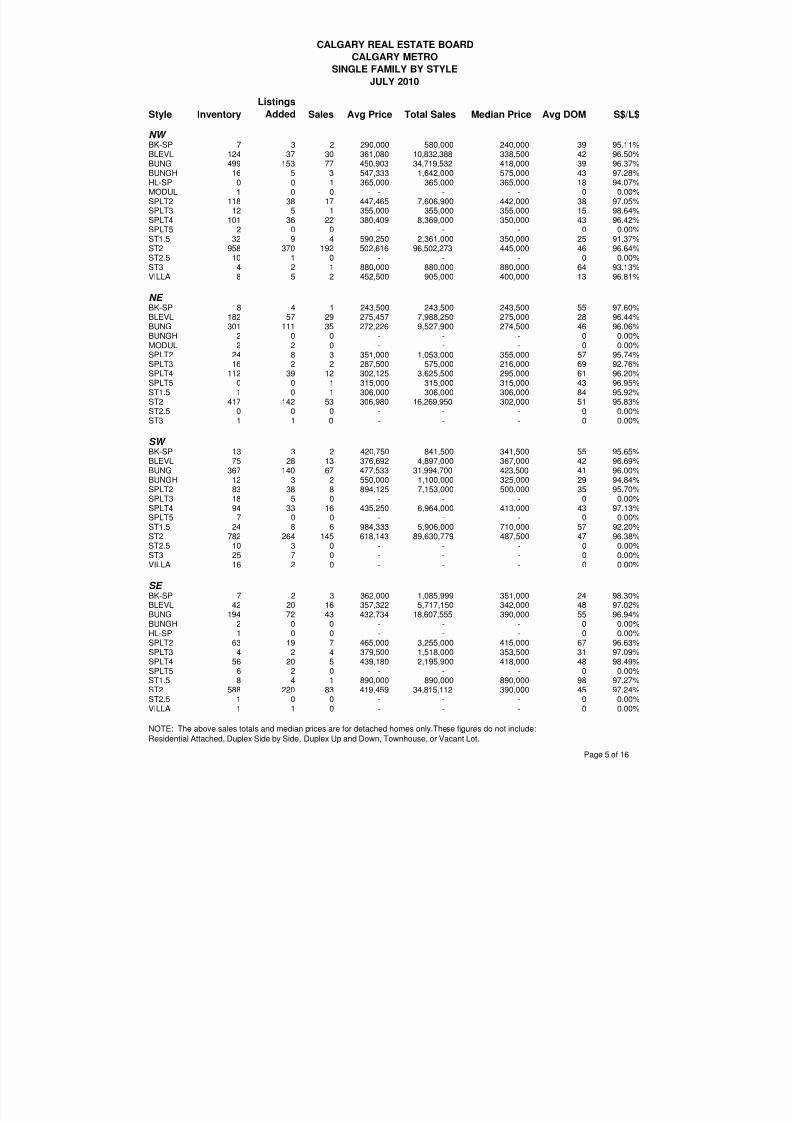
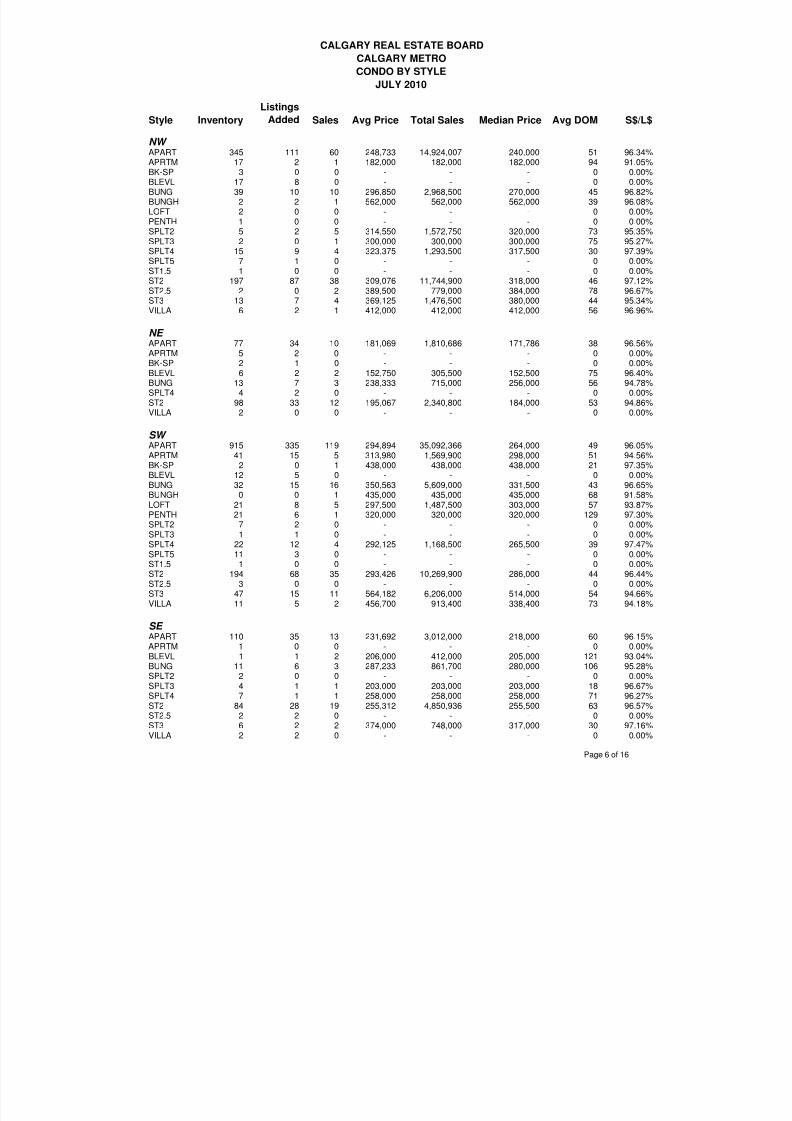
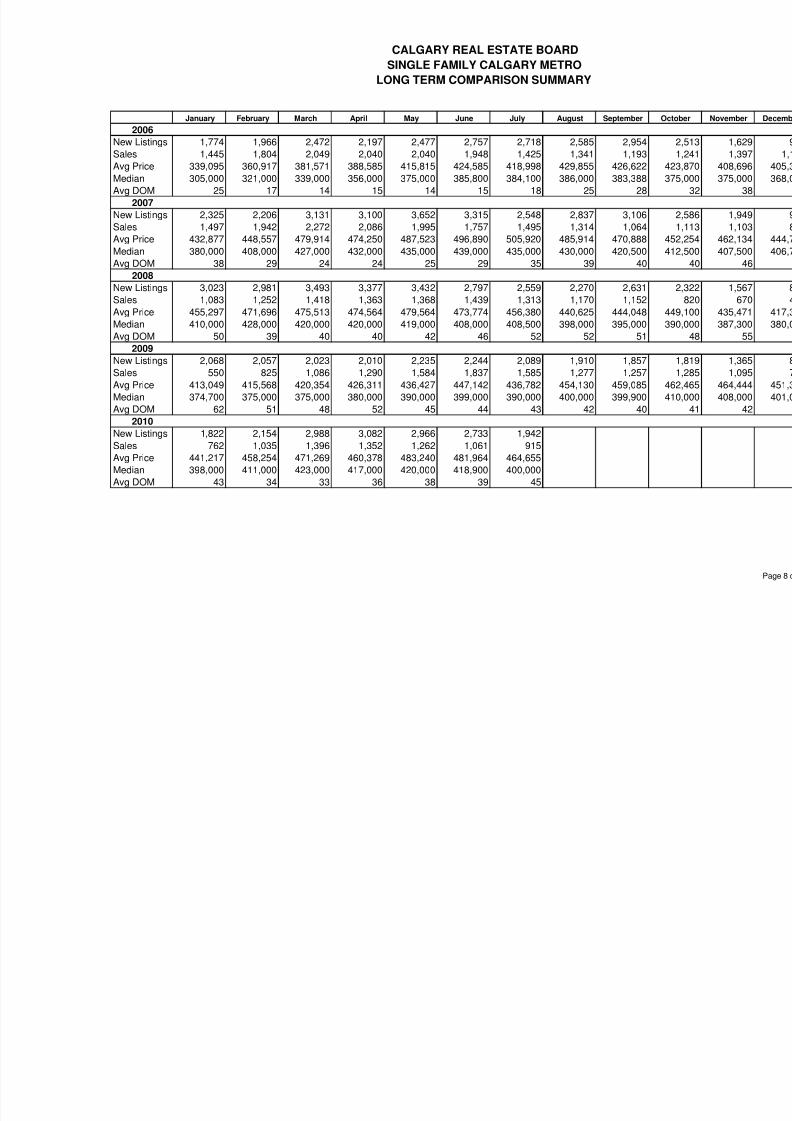
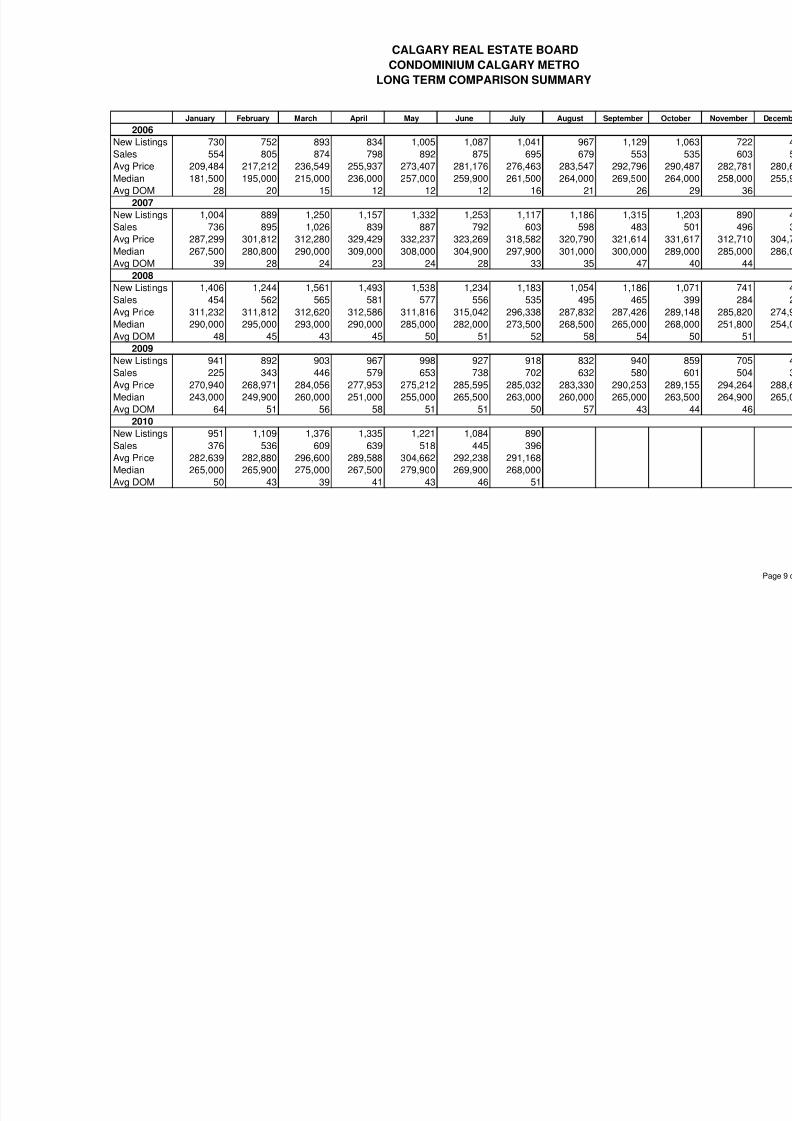
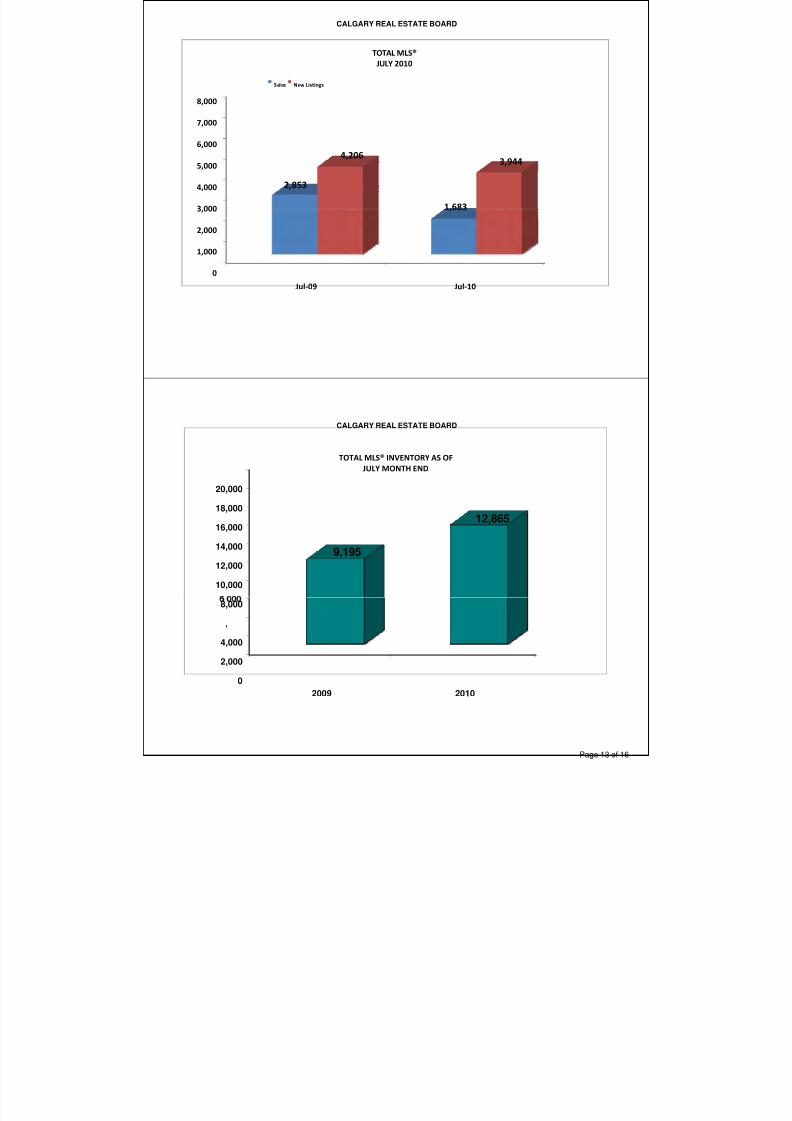
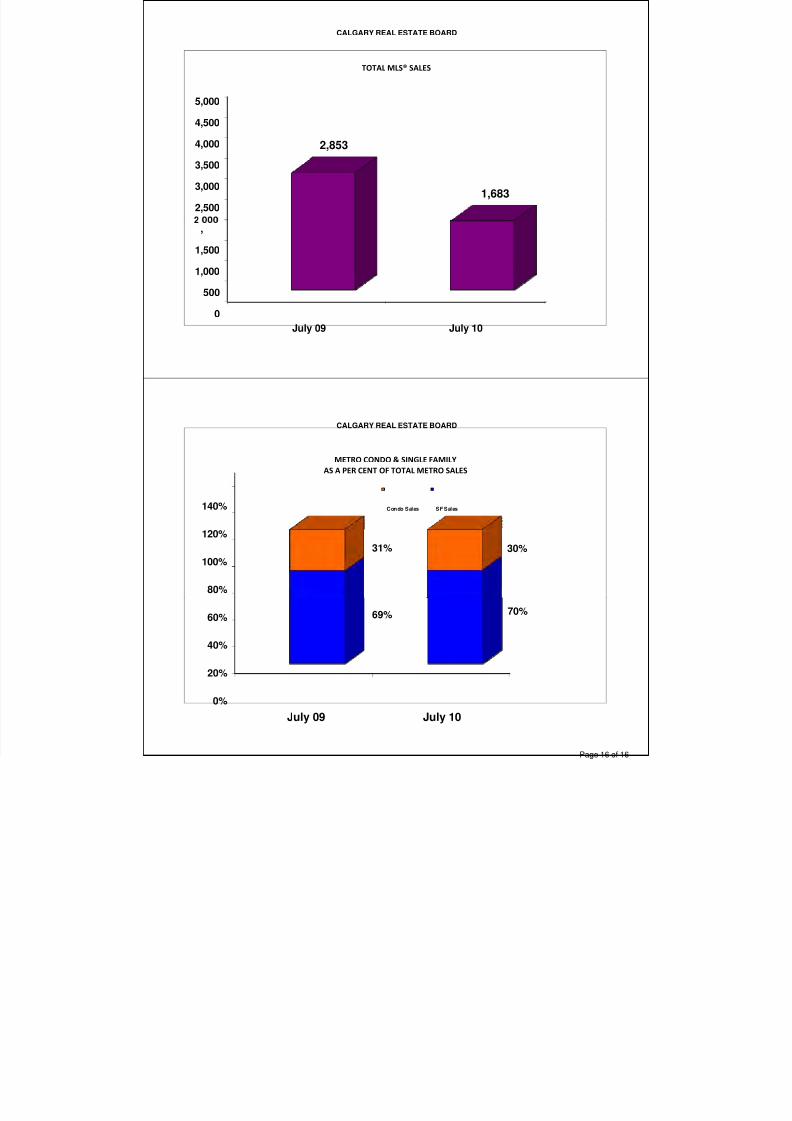
uly 2010 saw 915 single family homes sold in theity of Calgary. This is a decrease of 14 per centrom 1,061 sales in June 2010. In July 2009, singleamily home sales totalled 1,585. The number of ondominium sales for the month of July 2010 was96. This was a decrease of 11 per cent from the 445ondominium transactions recorded in June 2010. Inuly 2009, condominium sales were 702.
Calgary’s housing market is cooling off after itsecord-setting pace in the post-recession period.
This slow-down is not all that surprising in the facef tighter mortgage regulations and rising interestates. The post-recession rally we saw in theummer of 2009 was unique and that pace couldn’t
be sustained,” says Sano Stante, CREB® president-lect.
The sense of urgency seen last summer, fall andwinter in the lead-up to tighter mortgage-lendingmeasures has diminished,” says Stante. “Risingmortgage rates and increased inventories will be therimary head-wind facing Calgary’s housing market,
but improving job prospects will offer some tailwinds in the latter half of 2010 and into 2011.”
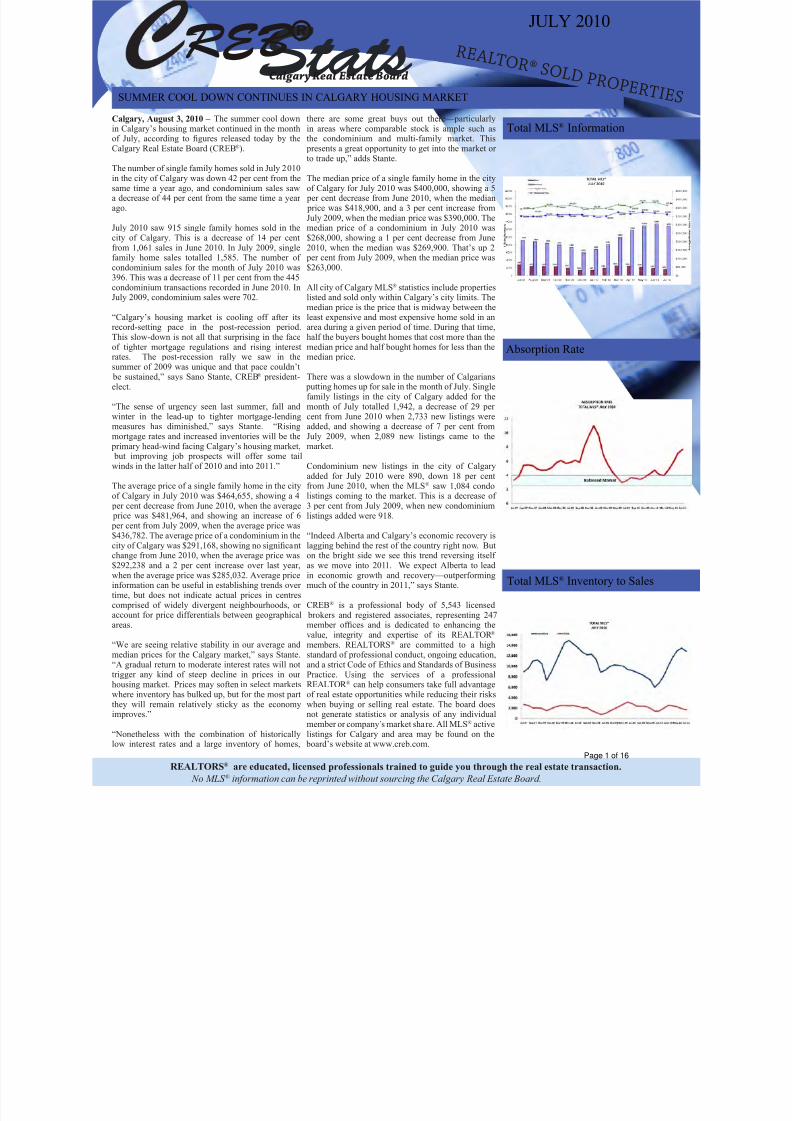
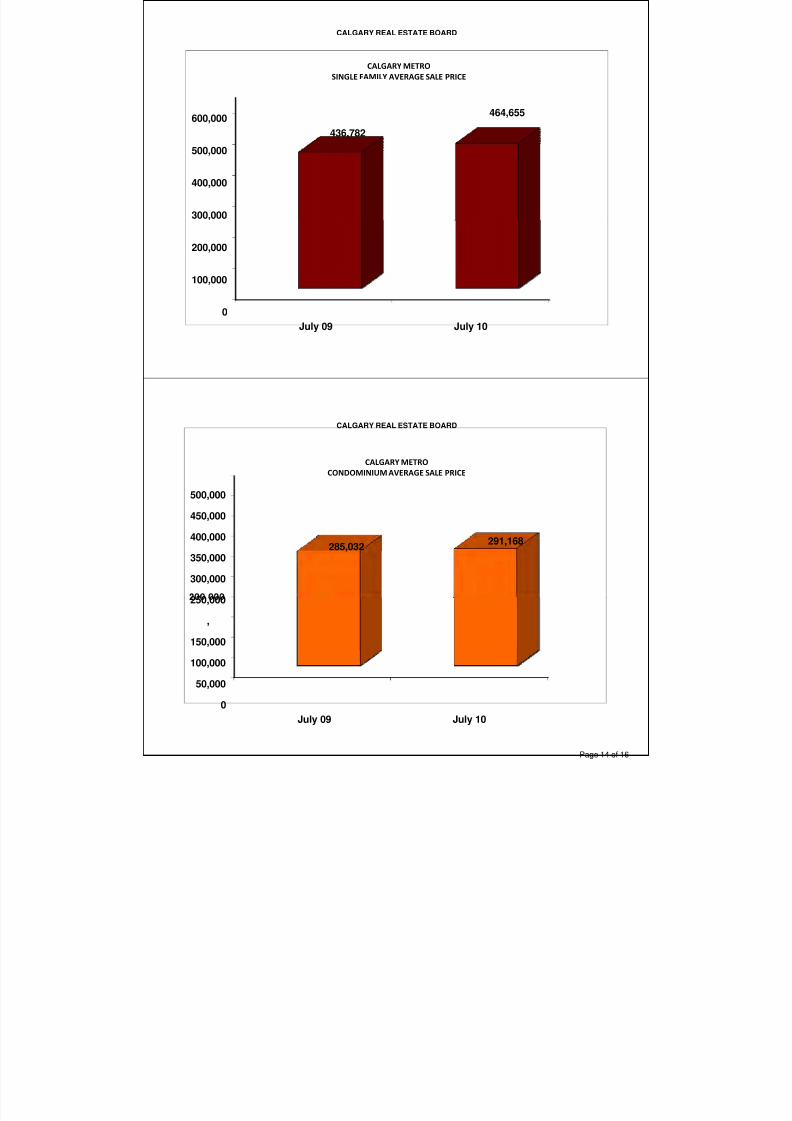
The average price of a single family home in the cityf Calgary in July 2010 was $464,655, showing a 4
per cent decrease from June 2010, when the averageprice was $481,964, and showing an increase of 6er cent from July 2009, when the average price was436,782. The average price of a condominium in theity of Calgary was $291,168, showing no signicanthange from June 2010, when the average price was292,238 and a 2 per cent increase over last year,
when the average price was $285,032. Average pricenformation can be useful in establishing trends over ime, but does not indicate actual prices in centres
omprised of widely divergent neighbourhoods, or ccount for price differentials between geographicalreas.
We are seeing relative stability in our average andmedian prices for the Calgary market,” says Stante.A gradual return to moderate interest rates will notrigger any kind of steep decline in prices in our
housing market. Prices may soften in select marketswhere inventory has bulked up, but for the most parthey will remain relatively sticky as the economymproves.”
Nonetheless with the combination of historicallyow interest rates and a large inventory of homes,
REALTORS® are educated, licensed professionals trained to guide you through the real estate transaction.
SUMMER COOL DOWN CONTINUES IN CALGARY HOUSING MARKET
No MLS ® information can be reprinted without sourcing the Calgary Real Estate Board.
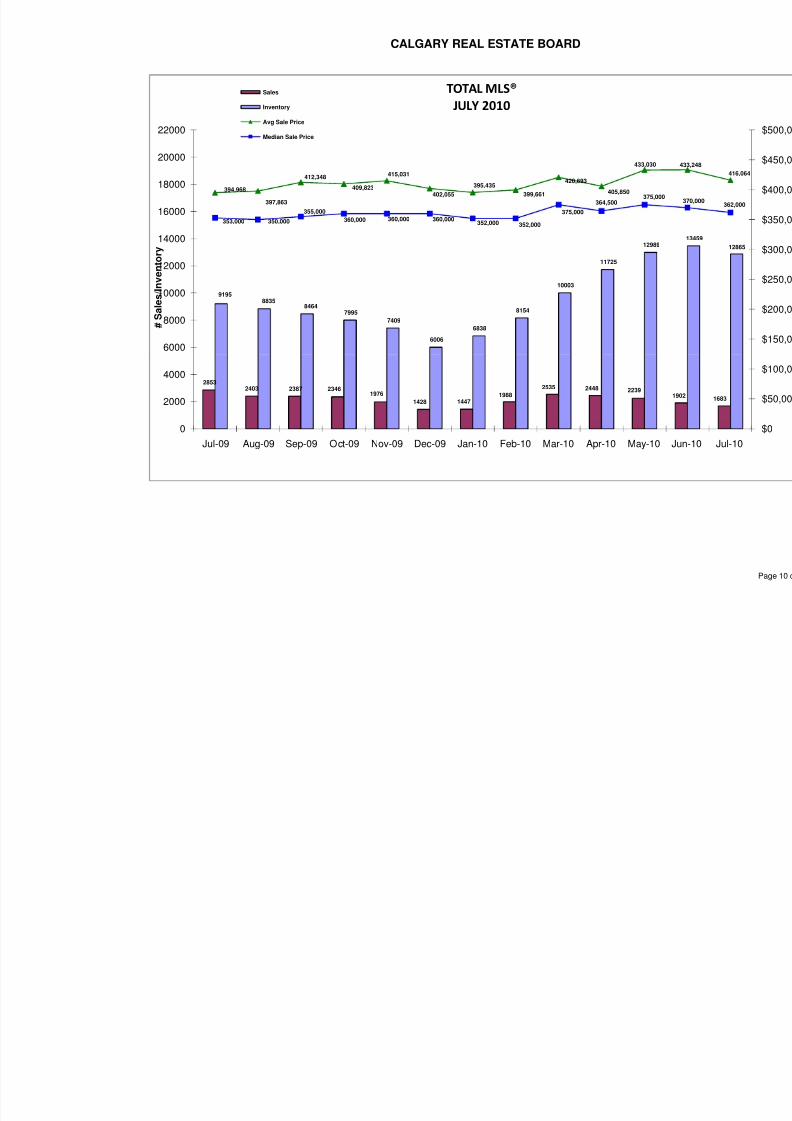
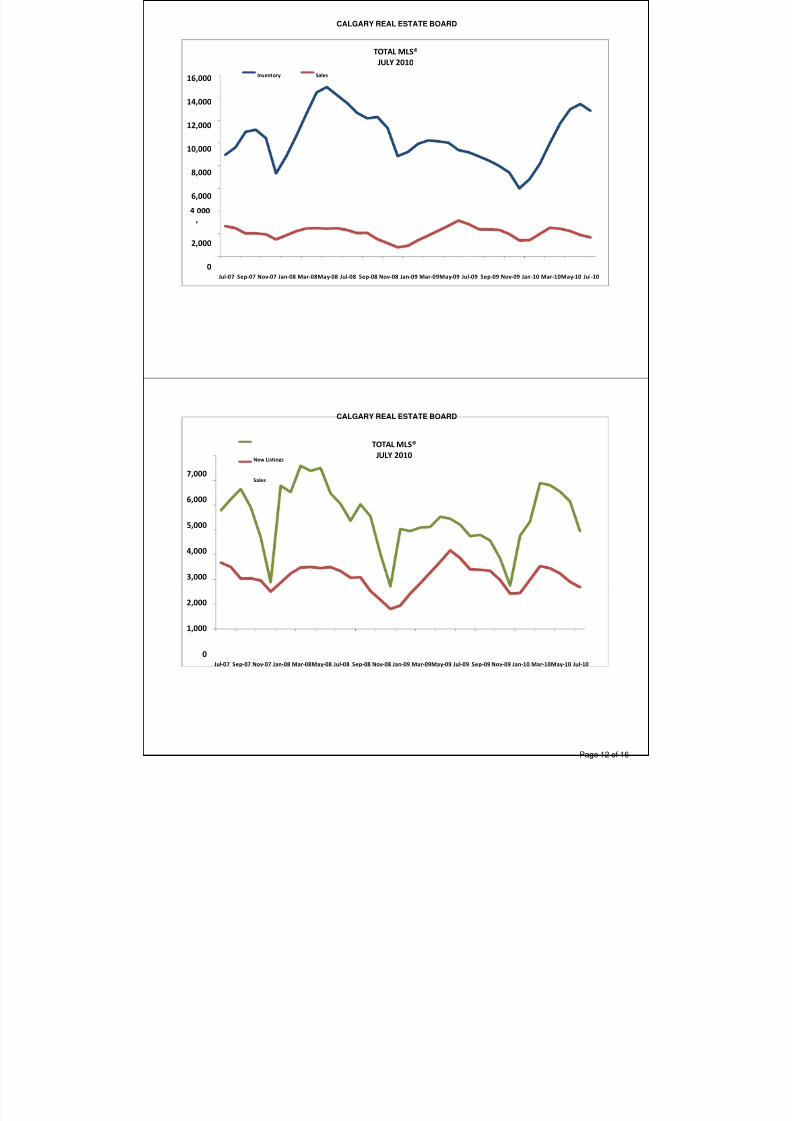
Total MLS® Inventory to Sales
Total MLS® Information
R E A L T O R ® S O L D P R O P E R T I
JULY 2010
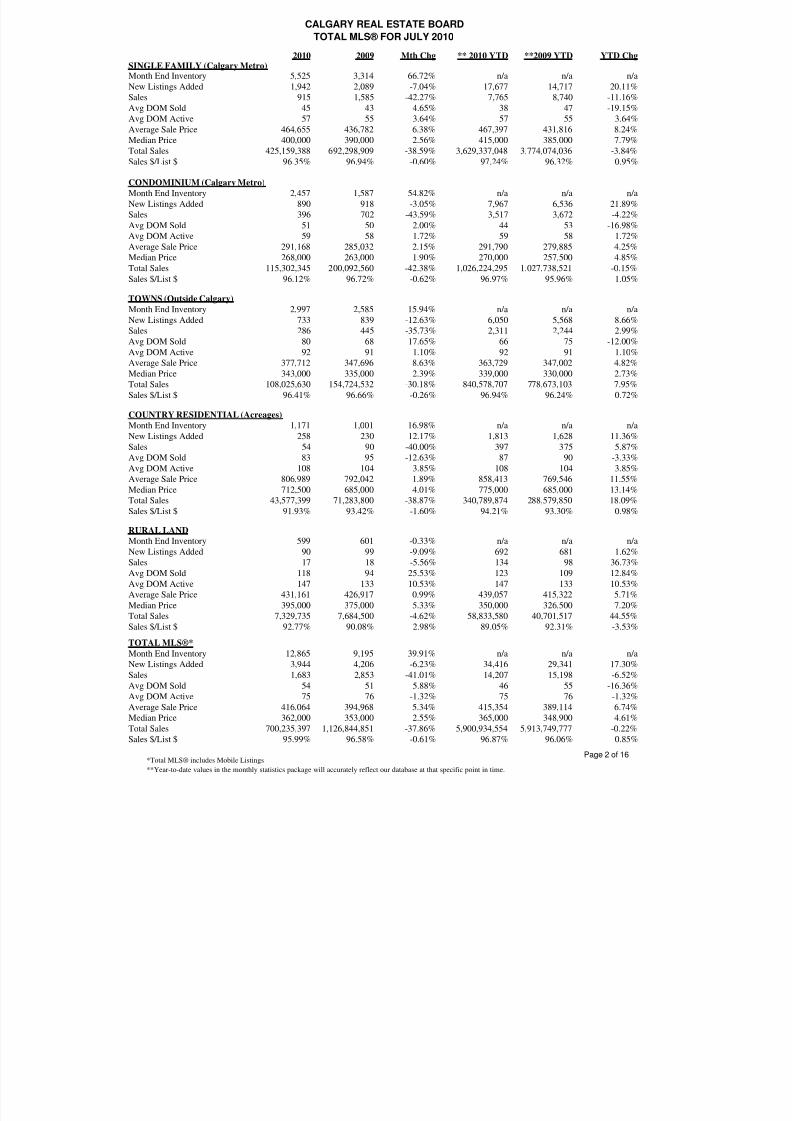
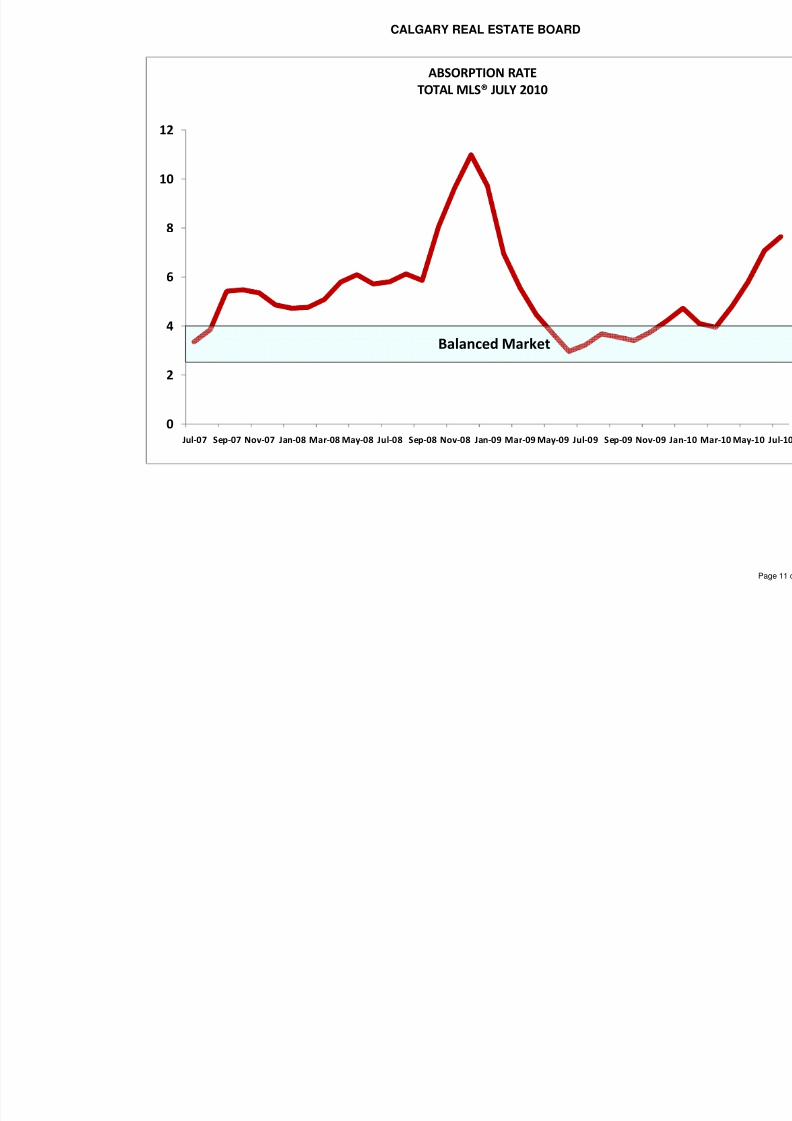
Absorption Rate
there are some great buys out there—particularlyin areas where comparable stock is ample such asthe condominium and multi-family market. This
presents a great opportunity to get into the market or to trade up,” adds Stante.
The median price of a single family home in the cityof Calgary for July 2010 was $400,000, showing a 5
per cent decrease from June 2010, when the median price was $418,900, and a 3 per cent increase fromJuly 2009, when the median price was $390,000. Themedian price of a condominium in July 2010 was$268,000, showing a 1 per cent decrease from June2010, when the median was $269,900. That’s up 2
per cent from July 2009, when the median price was$263,000.
All city of Calgary MLS® statistics include propertieslisted and sold only within Calgary’s city limits. Themedian price is the price that is midway between theleast expensive and most expensive home sold in anarea during a given period of time. During that time,half the buyers bought homes that cost more than themedian price and half bought homes for less than themedian price.
There was a slowdown in the number of Calgarians putting homes up for sale in the month of July. Singlefamily listings in the city of Calgary added for themonth of July totalled 1,942, a decrease of 29 per cent from June 2010 when 2,733 new listings wereadded, and showing a decrease of 7 per cent fromJuly 2009, when 2,089 new listings came to themarket.
Condominium new listings in the city of Calgaryadded for July 2010 were 890, down 18 per centfrom June 2010, when the MLS® saw 1,084 condolistings coming to the market. This is a decrease of 3 per cent from July 2009, when new condominiumlistings added were 918.
“Indeed Alberta and Calgary’s economic recovery islagging behind the rest of the country right now. Buton the bright side we see this trend reversing itself as we move into 2011. We expect Alberta to leadin economic growth and recovery—outperformingmuch of the country in 2011,” says Stante.
CREB®
is a professional body of 5,543 licensed brokers and registered associates, representing 247member ofces and is dedicated to enhancing thevalue, integrity and expertise of its REALTOR ®
members. REALTORS® are committed to a highstandard of professional conduct, ongoing education,and a strict Code of Ethics and Standards of BusinessPractice. Using the services of a professionalREALTOR ® can help consumers take full advantageof real estate opportunities while reducing their riskswhen buying or selling real estate. The board doesnot generate statistics or analysis of any individualmember or company’s market share. All MLS® activelistings for Calgary and area may be found on the
*Total MLS® includes Mobile Listings**Year-to-date values in the monthly statistics package will accurately reflect our database at that specific point in time.
**Year-to-date values in the monthly statistics package will accurately reflect our database at that specific point in time. Older monthly statistics will not reflect up-
**Year-to-date values in the monthly statistics package will accurately reflect our database at that specific point in time. Older monthly statistics will not reflect up-