bostonfed.org Credit Availability 20 Years after Peek and Rosengren – Panel Discussion Eric S. Rosengren President & CEO Federal Reserve Bank of Boston Joe Peek Vice President Federal Reserve Bank of Boston January 3, 2015 International Banking, Economics, and Finance Association American Economic Association Boston, Massachusetts EMBARGOED UNTIL SATURDAY, JANUARY 3, 2015 AT 10:15 A.M. EASTERN TIME OR UPON DELIVERY
Transcript
bostonfed.org
Credit Availability 20 Years after Peek and Rosengren – Panel Discussion Eric S. Rosengren President & CEO Federal Reserve Bank of Boston Joe Peek Vice President Federal Reserve Bank of Boston January 3, 2015
International Banking, Economics, and Finance Association American Economic Association Boston, Massachusetts
EMBARGOED UNTIL SATURDAY, JANUARY 3, 2015 AT 10:15 A.M. EASTERN TIME OR UPON DELIVERY
2
Credit Crunches Revisited
▶ Research about the bank credit crunch in the 1990s ▶ All members of this panel participated
▶ Mechanism was capital-constrained banks responding by shrinking loans (assets), which impacted borrowers with limited alternatives
▶ Controversial in 1990s – including with policymakers
▶ Less controversial now ▶ Widely recognized as a potential problem
▶ TARP, initial stress test, lending facilities all designed to mitigate possible bank credit crunch
3
1990s Bank Credit Crunch Versus 2008 Financial Crisis
▶ 2008 had important differences from early 1990s credit crunch with respect to lending ▶ Bank lending fell dramatically but recovered
relatively quickly, in part because of the rapid recapitalization of banks
▶ Non-depository financial intermediaries played a much bigger role in the financial crisis
▶ The move more toward market-centric financing increased the amplitude of problems ▶ Shadow banking and runs
▶ Interconnectedness of bank and nonbank intermediaries
4
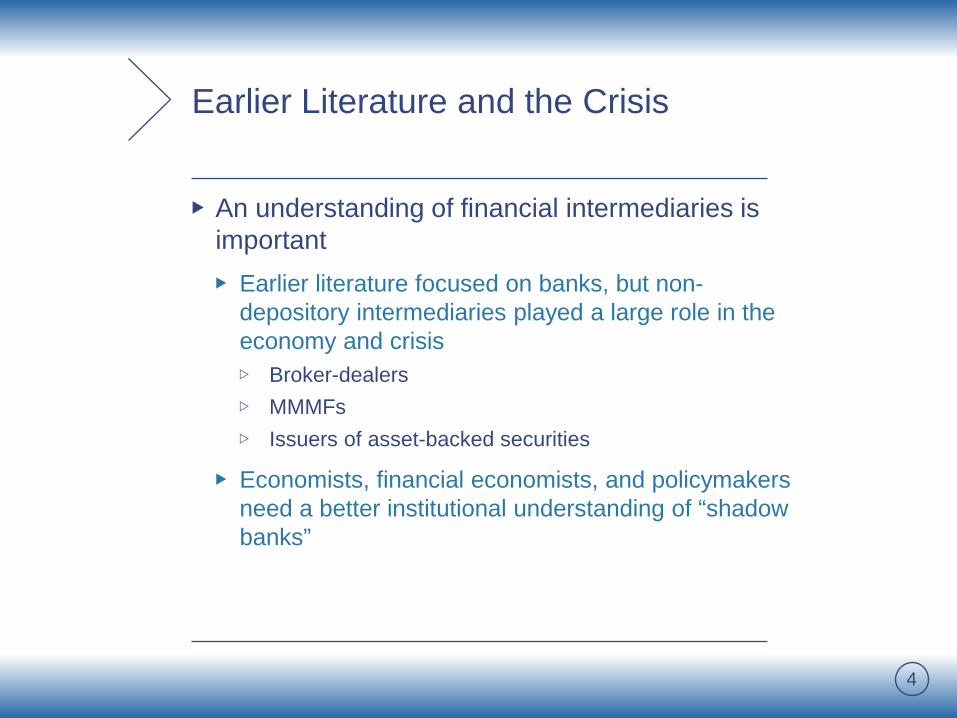
Earlier Literature and the Crisis
▶ An understanding of financial intermediaries is important ▶ Earlier literature focused on banks, but non-
depository intermediaries played a large role in the economy and crisis ▷ Broker-dealers ▷ MMMFs ▷ Issuers of asset-backed securities
▶ Economists, financial economists, and policymakers need a better institutional understanding of “shadow banks”
2.0
4.0
6.0
8.0
1984:Q1 1990:Q1 1996:Q1 2002:Q1 2008:Q1 2014:Q1
Recession
Trillions of 2014 Dollars
5
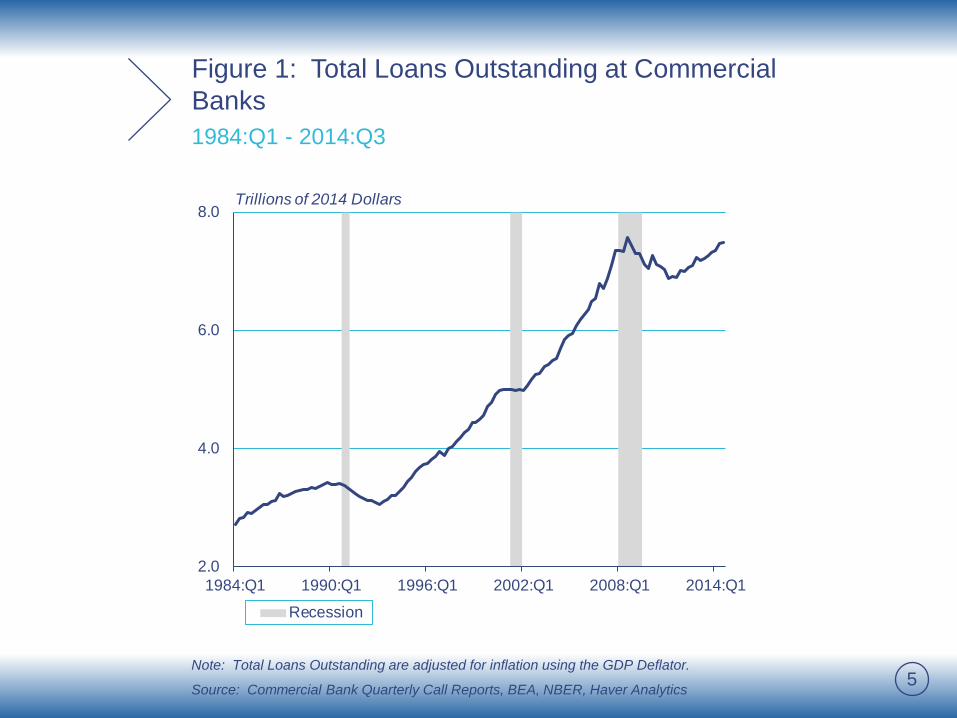
Figure 1: Total Loans Outstanding at Commercial Banks 1984:Q1 - 2014:Q3
Note: Total Loans Outstanding are adjusted for inflation using the GDP Deflator.
Source: Commercial Bank Quarterly Call Reports, BEA, NBER, Haver Analytics
Note: The 9 census regions are: New England (NE), Middle Atlantic (MA), East North Central (ENC), West North Central (WNC), South Atlantic (SA), East South Central (ESC), West South Central (WSC), Mountain (M) and Pacific (P).
6
Figure 2: Growth in Real House Prices by Census Region 1984:Q1 - 2014:Q3
Source: Federal Housing Finance Agency, BLS, Haver Analytics
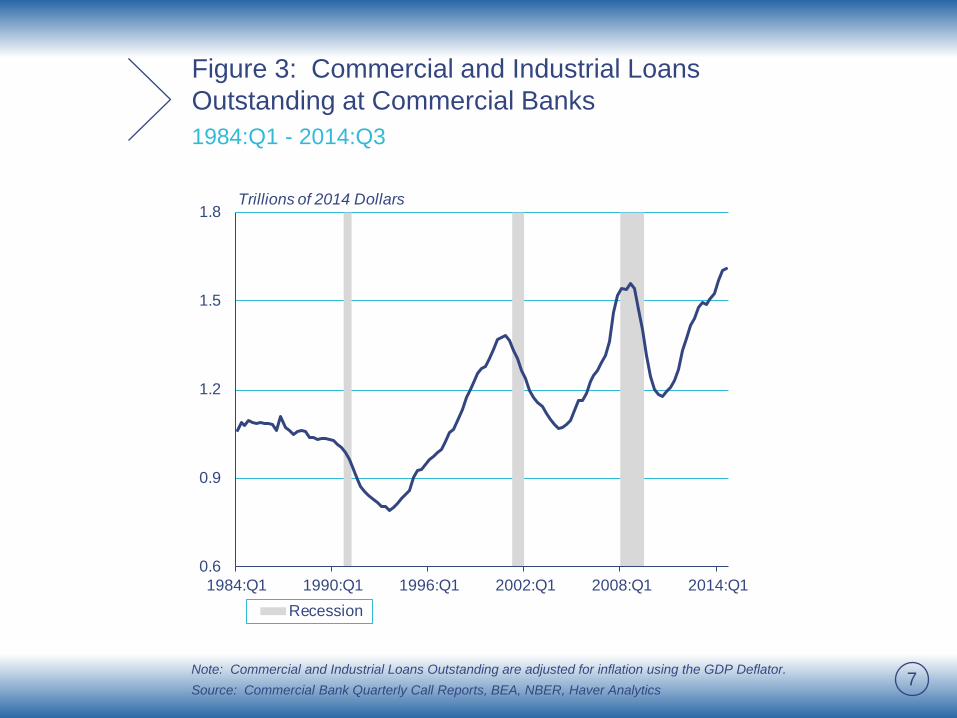
Figure 3: Commercial and Industrial Loans Outstanding at Commercial Banks 1984:Q1 - 2014:Q3
Note: Commercial and Industrial Loans Outstanding are adjusted for inflation using the GDP Deflator. Source: Commercial Bank Quarterly Call Reports, BEA, NBER, Haver Analytics
0
20
40
60
80
100
120
1984:Q1 1990:Q1 1996:Q1 2002:Q1 2008:Q1 2014:Q1
Percent
8
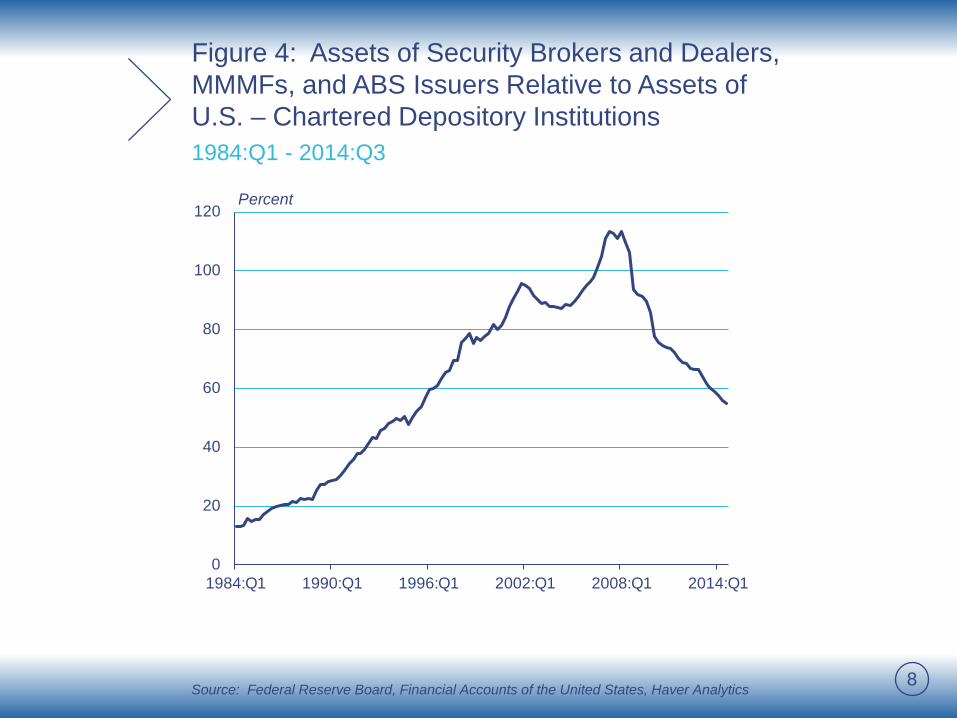
Figure 4: Assets of Security Brokers and Dealers, MMMFs, and ABS Issuers Relative to Assets of U.S. – Chartered Depository Institutions 1984:Q1 - 2014:Q3
Source: Federal Reserve Board, Financial Accounts of the United States, Haver Analytics
9
Lessons from the Earlier Research Applied to the Financial Crisis
▶ TARP – Need to recapitalize banks quickly
▶ Initial Stress Tests (Supervisory Capital Assessment Program) – Participants could not meet stress test capital requirements by shrinking assets
▶ Liquidity programs – Continuing nonbank lending also critical to the economy
▶ Nonbank assets small relative to banks in 1990, but that had changed dramatically by 2008
10
Nonbanks Less Resilient in Crisis
▶ Bank literature – Capital constraint is important because deposit insurance significantly reduced runs, and banks have access to the discount window
▶ Nonbanks – Liquidity crisis is critical – liabilities ran, forcing fire sales of assets ▶ Re-examine regulation of nonbanks
▶ Consider stability of nonbank financial intermediaries
▶ Nonbanks proved much slower to recover
11
Broker-Dealers
▶ Bear Stearns and Lehman Brothers were significant drivers of the financial crisis
▶ Heavily reliant on wholesale funding – had been assumed that because it was collateralized, it would not run
▶ No insured deposits and no access to discount window created little opportunity to recover once investors lost confidence
▶ All large broker-dealers are now in bank holding companies – but that does not resolve run problems
0
1
2
3
4
5
6
1984:Q1 1990:Q1 1996:Q1 2002:Q1 2008:Q1 2014:Q1
Trillions of 2014 Dollars
12
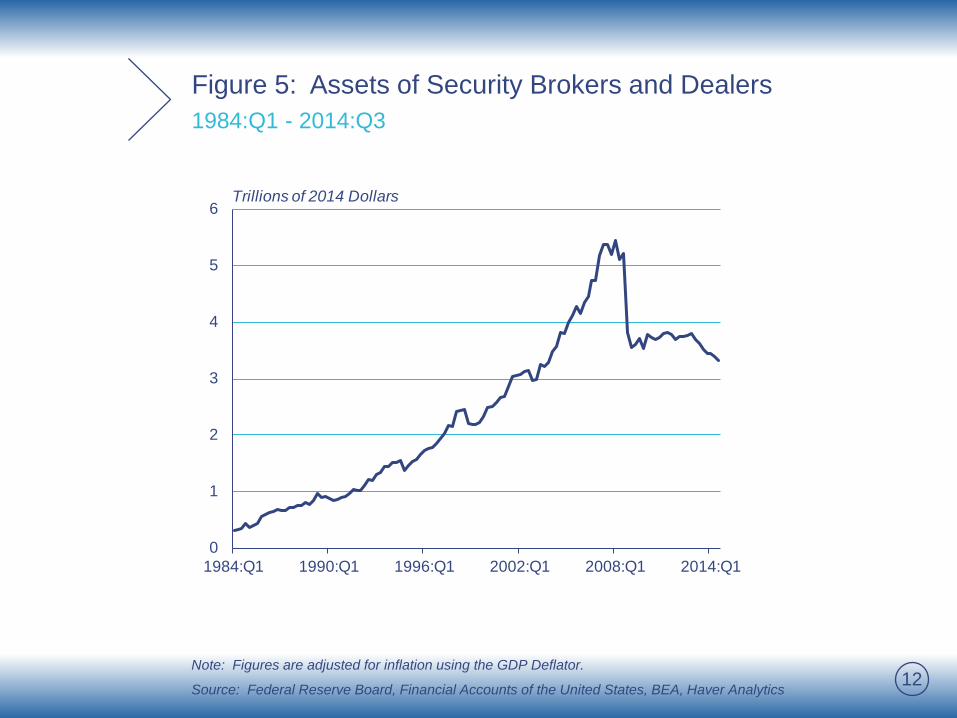
Figure 5: Assets of Security Brokers and Dealers 1984:Q1 - 2014:Q3
Note: Figures are adjusted for inflation using the GDP Deflator.
Source: Federal Reserve Board, Financial Accounts of the United States, BEA, Haver Analytics
Figure 6: Selected Balance-Sheet Items of Security Brokers and Dealers 1984:Q1 - 2014:Q3
Note: Figures are adjusted for inflation using the GDP Deflator.
Source: Federal Reserve Board, Financial Accounts of the United States, BEA, Haver Analytics
14
Regulatory Response is Incomplete for Broker-Dealers
▶ No change in broker-dealer regulation since the crisis, despite widespread problems
▶ Being in a bank holding company and having a wholesale funding capital charge will help, but: ▶ Discount window is available only for depository
institutions
▶ Dodd-Frank limits support of non-depository subs, as does the Federal Reserve Act
▶ Limited transparency of broker-dealers
15
Money Market Mutual Funds
▶ Little academic or policy focus prior to the crisis
▶ Many assumed they would be stable during financial problems because of SEC limitations ▶ Limited to short-maturity assets
▶ Limits on credit risk of assets
▶ Investors often used MMMFs as a transaction account with little perceived difference from insured deposits
▶ MMMFs hold no capital
0.0
1.0
2.0
3.0
4.0
5.0
1986:Q1 1991:Q1 1996:Q1 2001:Q1 2006:Q1 2011:Q1
Total Prime Funds
Trillions of 2014 Dollars
Lehman fails (Sep 15, 2008)The Reserve Primary Fund breaks the buck (Sep 16, 2008)
16
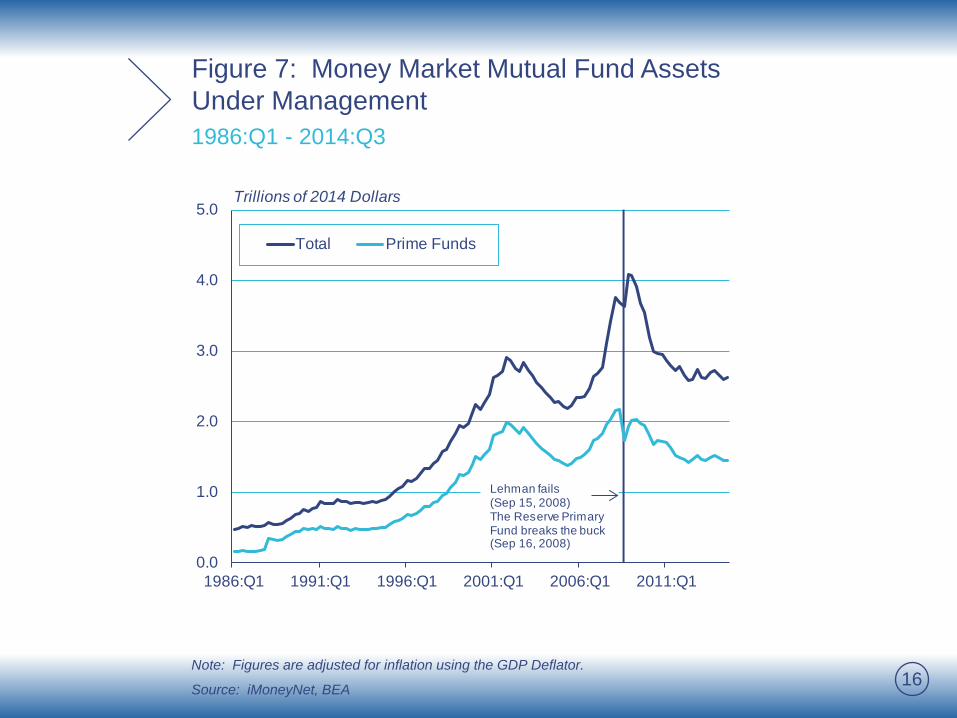
Figure 7: Money Market Mutual Fund Assets Under Management 1986:Q1 - 2014:Q3
Note: Figures are adjusted for inflation using the GDP Deflator.
Source: iMoneyNet, BEA
17
Regulatory Response is Incomplete for Money Market Mutual Funds
▶ SEC has adopted rules to improve liquidity and to require institutional prime money market funds to have a floating Net Asset Value
▶ Still have financial stability concerns ▶ Floating NAV does not apply to retail prime
MMMFs
▶ Allows funds with liquidity problems to impose gates and fees – likely to have unintended consequences, destabilize other funds
18
Asset-Backed Securities (ABS) Issuers
▶ Have received little academic attention
▶ Banks and finance companies removed assets from their balance sheets
▶ Collect fees, but with less capital at risk
▶ Major growth since the early 1990s credit crunch
▶ Structure of short-term financing for risky assets was subject to runs
▶ Risk retention, legal risk, greater reporting requirements have all restricted use
0
1
2
3
4
5
6
1984:Q1 1990:Q1 1996:Q1 2002:Q1 2008:Q1 2014:Q1
Trillions of 2014 Dollars
19
Figure 8: Assets of ABS Issuers 1984:Q1 - 2014:Q3
Note: Figures adjusted for inflation using the GDP Deflator.
Source: Federal Reserve Board, Financial Accounts of the United States, BEA, Haver Analytics
20
Fed Lending Facilities Provided Liquidity Lending to Non-Depositories
▶ Use of 13-3 exemption for discount window necessary for significant lending
▶ To help with liquidity problems at broker-dealers, Primary Dealer Credit Facility and Term Securities Lending Facility were established
▶ Without intervention, market making in critical markets may have been impaired as broker-dealers could not finance themselves and were reliant on new facilities
0
20
40
60
80
100
120
140
160
17-Mar-08 16-Jun-08 15-Sep-08 16-Dec-08 19-Mar-09
Other (9)
London Subsidiaries (4)
Countrywide Securities Corp.
Lehman Brothers Inc.
Barclays Capital Inc.
Goldman, Sachs & Co.
Banc of America Securities
Bear, Stearns & Co., Inc.
Morgan Stanley & Co. Inc.
Merrill Lynch Gov't. Sec.
Citigroup Global Markets
Billions of Dollars
21
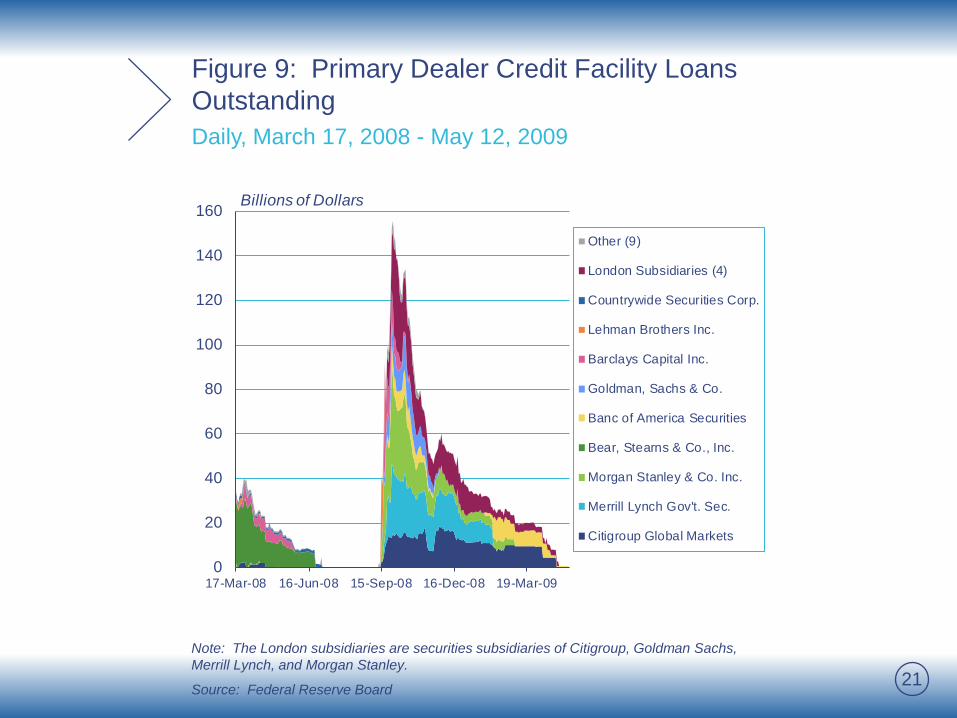
Figure 9: Primary Dealer Credit Facility Loans Outstanding Daily, March 17, 2008 - May 12, 2009
Note: The London subsidiaries are securities subsidiaries of Citigroup, Goldman Sachs, Merrill Lynch, and Morgan Stanley.
Source: Federal Reserve Board
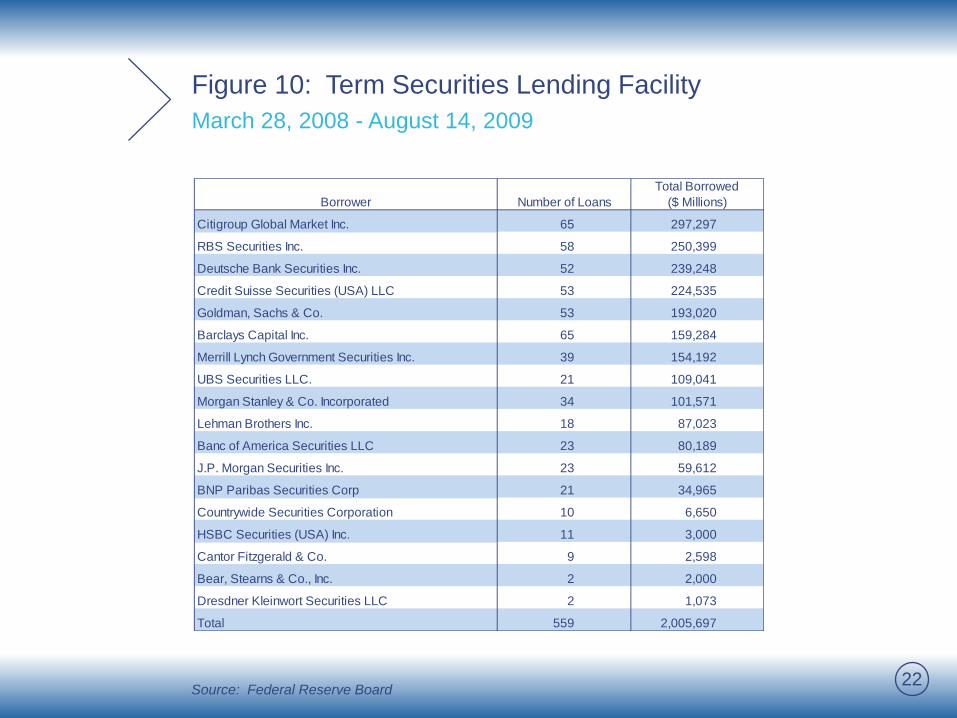
Citigroup Global Market Inc. 65 297,297
RBS Securities Inc. 58 250,399
Deutsche Bank Securities Inc. 52 239,248
Credit Suisse Securities (USA) LLC 53 224,535
Goldman, Sachs & Co. 53 193,020
Barclays Capital Inc. 65 159,284
Merrill Lynch Government Securities Inc. 39 154,192
UBS Securities LLC. 21 109,041
Morgan Stanley & Co. Incorporated 34 101,571
Lehman Brothers Inc. 18 87,023
Banc of America Securities LLC 23 80,189
J.P. Morgan Securities Inc. 23 59,612
BNP Paribas Securities Corp 21 34,965
Countrywide Securities Corporation 10 6,650
HSBC Securities (USA) Inc. 11 3,000
Cantor Fitzgerald & Co. 9 2,598
Bear, Stearns & Co., Inc. 2 2,000
Dresdner Kleinwort Securities LLC 2 1,073
Total 559 2,005,697
Number of LoansBorrowerTotal Borrowed
($ Millions)
22
Figure 10: Term Securities Lending Facility March 28, 2008 - August 14, 2009
Source: Federal Reserve Board
23
Emergency Support Restricted in the Future
▶ Financing securities of broker-dealers became a critical problem during crisis
▶ Dodd-Frank restricts lending and discourages use of exemptions such as 23A and 23B that allowed bank holding companies to finance nonbank subsidiaries
▶ Without access to liquidity and given run risk in a crisis, we need to rethink broker-dealer regulation
24
Concluding Observations
▶ Earlier research on the credit crunch ▶ Highlighted need to focus on credit availability
▶ Emphasized need for bank recapitalization
▶ Growth of shadow banks has not received sufficient attention ▶ Non-depository problems were quite different, but