28
CORPORATE LIQUIDITY WHITE PAPER CREDIT & COLLECTIONS GLOBAL BENCHMARKING STUDY
CORPORATE LIQUIDITY
WHITE PAPERCREDIT & COLLECTIONSGLOBAL BENCHMARKING STUDY

2 Credit and Collections Global Benchmarking Study
3 Introduction
4 Organizing for Growth: What is the optimal model?
9 Prioritizing Collections: Using Risk vs. Aging
12 A new dawn for automated dispute resolution
13 Taking the pain out of collection claim processing
15 Paradise by the dashboard lights
18 Appendix
CONTENTS

www.sungard.com/avantgard 3
Key Study Findings:
88% of companies are still using age and value to drive collections prioritization
Without an effective alternative, companies are still using age or invoice value as the driver of collections prioritization, which will lead to unworked current high risk receivables rolling into past due buckets in the short term future.
55% of companies hold up the entire invoice once there is a dispute recorded versus segregating the disputed portion from the collectable
Segregating the disputed portion of an invoice from the collectable is a critical step in helping to reduce DSO and bad debt expense associated with invoice exceptions.
87% of companies that cite collections volume as a top challenge are not fully automated across the order-to-cash operation
Key areas that can be addressed through automation include chasing disputed invoices, prioritizing collection activity, identifying and mitigating risk, setting & sending reminders include: reporting and organizing call queues.
24% of companies that claim to only periodically score their portfolios also reported that 21%+ of their portfolio is past due.
Monthly scoring of the portfolio can help companies find valuable clarity around portfolio risk; thereby targeting companies with the least propensity to pay as the priority.
61% of companies do not have a method of monitoring collection agency output in real-time
An agency portal can provide the ability to send and receive claims electronically and monitor performance across multiple agencies.
44% of companies are leveraging the collections effectiveness index to measure performance
While most companies look at DSO and Past Due A/R data, fewer are using more insightful KPI tracking methods such as the collections effectiveness index or root-cause analysis for reduction in dispute volume.
59% of organizations operate in a regional or decentralized model; for companies with 50K+ in open invoices, this figure rises to 83%
While regional or decentralized models offer increased agility and the ability to more effectively service specific regions or business lines, it can open up a level of risk if the company is unable to view credit exposure across the entire enterprise, while presenting challenges related to compliance to one corporate credit and collections policy.
INTRODUCTION The largest current asset on most balance sheets is the accounts receivable (A/R). In order to understand how corporations are optimizing this asset, SunGard embarked on a global credit & collections benchmarking study.
The study is comprised of 400 participants. The study represents over 20 primary industries with 52% reporting from these top six industries: Manufacturing, Technology, Business Services, Food & Beverage, Construction & Materials and Chemical.
Data is viewed in various breakdowns, most commonly across revenue tiers: $500M – 1B, 1B – 2B, 2B – 5B, 5B – 10B, and 10B+.
88% of companies are still using age and value to drive collections prioritization
55% of companies hold up the entire invoice once there is a dispute recorded versus segregating the disputed portion from the collectable

4 Credit and Collections Global Benchmarking Study
Organizing for Growth: What is the optimal model?
Operating Models: Central vs. RegionalWhen looking at organizational structure, there are typically a few key indicators that companies will evaluate. One is the geographic distribution as well as the enterprise distribution – meaning are you organized regionally, centrally or in a fully distributed environment. The next layer would be to look at if you are organized by business unit or in an enterprise wide structure – such as a centralized or regionalized shared service center.
The implications of organizational structure typically surface when looking at productivity, the ability to view credit risk exposure across the entire enterprise and then also in customer service levels.
One of the most significant trends over the past decade has been the migration to a shared service center. Initial migrations typically focused on pure cost savings due to labor arbitrage in lower cost areas or reduction in force. However, these initial savings were often coupled with increases in DSO, reduced customer satisfaction and a slew of other issues. For this reason, many companies shifted to look at how to use regional shared service centers as centers of excellence.
In terms of the current state, 59% of the respondents operate in a regional or decentralized model – often allowing for regional nuances, time zones and redundancy for reduction of risk. However, there is a marked difference once the top tier of $10B in revenue or 50K + in open invoices is reached; dropping to almost a regional model exclusively.
59% of the respondents operate in a regional or decentralized model.
Regional / Decentralized
Fully /Centralized
59%41%
Regional / Decentralized
Fully Centralized
0
20
40
60
80
100
$500M–1B $1B-2B $2-5B $5-10B $10B+
57%
43%
24%
76%
43%
57%
33%
67%
4%
96%
Regional / Decentralized
Fully Centralized
0
10
20
30
40
50
60
70
80
90
100
>1,000 1-5k 5-25k 25-50k 50k+
33%
67%
53%
47%
36%
64%
35%
65%
17%
83%
83% of companies with 50K + in open invoices operate in a regional versus centralized model.
Organizational Structure
Organizational Structure by Revenue
Organizational Structure with Invoice Volume

www.sungard.com/avantgard 5
Staffing Requirements
Invoice volume and average invoice value tend to drive the organizational structure as it relates to the number of collectors in practice. However, with this data, there tends to be a wide spread between the 6 and 50 mark without any direct correlation to invoice volume or amounts.
Number of collectors according to invoice volume (revenue $0 – 10B+)
Fewer than 5 collectors
6 – 10
11 – 20
21 – 50
51 – 100
More than 100
Up to 1000 Invoices 84% 8% 0% 4% 0% 4%
1001 – 5000 66% 13% 16% 3% 0% 3%
5001 – 25,000 43% 27% 14% 2% 12% 2%
25,000 – 50,000 23% 0% 36% 9% 14% 18%
More than 50,000 8% 11% 25% 19% 14% 22%
n = 164
Number of collectors according to invoice volume (revenue $1B-10B+)
Fewer than 5 collectors
6 – 10
11 – 20
21 – 50
51 – 100
More than 100
Up to 1000 Invoices 8% 0% 0% 0% 0% 0%
1001 – 5000 16% 3% 3% 0% 0% 3%
5001 – 25,000 14% 8% 8% 2% 10% 2%
25,000 – 50,000 9% 0% 32% 9% 14% 18%
More than 50,000 6% 3% 14% 8% 14% 22%
n = 74
Number of collectors according to monthly invoice volume (revenue $10B+)
Fewer than 5 collectors
6 – 10
11 – 20
21 – 50
51 – 100
More than 100
Up to 1000 Invoices 0% 0% 100% 0% 0% 0%
1001 – 5000 0% 0% 100% 0% 0% 0%
5001 – 25,000 0% 0% 0% 0% 100% 0%
25,000 – 50,000 0% 0% 0% 0% 67% 33%
More than 50,000 0% 0% 8% 25% 17% 50%
n = 18

6 Credit and Collections Global Benchmarking Study
Productivity & Automation
As manufacturing and orders increase, there is a natural influx in collection activity, however there is often little appetite for increased staffing. In addition, there is not necessarily a correlation between adding staff and improved results.
Of those companies that cited managing collections volume as the top challenge, only 13% are fully automated across the order-to-cash cycle; 43% state that they are fully/mostly automated while 57% are either somewhat or not automated.
Top challenge cited: managing increased volume of collections with current staff.
Collaborating with Sales
Collections Volume Increased
Risk Data for Emerging Markets
DSO and Past Due A/R are increasing
Dispute Volume has Increased
Prioritizing Collection Activity
Scoring of Existing A/R Portfolio
17%
7%
28%
9%
15%
11%
13%
Top challenge in Credit and Collections

www.sungard.com/avantgard 7
Degree of Automation
In looking across the full spectrum of responses, 61% of the participants report that they are either not at all or only somewhat automated. Automation can help improve productivity and manage collections more effectively by helping to prioritize activity while also helping to allocate resources most prudently to the highest risk accounts.
One of the most prevalent methods of measuring collections effectiveness is to look at the percent past due. Automation, in any capacity, can help to minimize manual processing helping to improve productivity and minimize the drain on the organization. The following chart depicts companies with $1B or greater in revenue. Areas in which automation are typically used most effectively are around prioritizing collections activities, dunning efforts and routing / managing disputes.
Partially / FullyAutomated
Not Automated (Spreadsheets)
0
10
20
30
40
50
<3% 4-10% 11-15% 16-20% >21%
Lack of automation is driving increased past-due receivables.
Percentage of portfolio past-due according to level of automation

8 Credit and Collections Global Benchmarking Study
DSO Reduction of 11 Days in 7 MonthsWithin approximately 7 months after introducing automation, EmployBridge has achieved a full ROI; much of which is evidenced as lowered DSO by an average of 11 days in a year’s time. Features such as automated payment reminders are also helping to improve customer service levels. The unified system approach to order-to-case management introduced by AvantGard has been a great asset to the company, as now management has full visibility into receivables activities in all of its operating locations and they are also able to gain better insight into what A/R processes are working well and which may need altering.
Managing increased invoice volume with automation
Using Automation to Reduce Past Due A/REmployBridge, a staffing solutions provider, was facing a number of challenges that drove them to investigate technology for improving order-to-cash management. DSO was much higher than the company desired and there was a large percentage of past due A/R—with a few accounts being as high as 120 days past due.
Many of these negative results were stemming from the fact that EmployBridge did not have a unified system in place for helping the credit analysts to prioritize which accounts to contact first during their work day. This lack of organization also contributed to employee dissatisfaction with their daily workflow. Furthermore, it was difficult for upper management to gain an accurate picture on the performance of individual collectors throughout a daily, weekly or monthly basis.
EmployBridge utilizes the credit and collections functionality to drive strategic collections activities, and the sales & service portal for the management of dispute resolution including problem detection, assignment and notification. The company is currently in the process of implementing the dashboard, which will provide them with a comprehensive view of performance and compliance to policy in real-time.
Our invoice volume was increasing and we required a solution to help us manage this growth; with automation we improved operational efficiencies in collections … we can also route disputed issues through a workflow process to reduce our dispute cycle time.
Jerry Roth
vice president of credit and collections EmployBridge

www.sungard.com/avantgard 9
In building a statistical model, the most important model variables are the internal A/R data that is used to develop the model and score the portfolio. Specifically, the most valuable internal data is a company’s own payment experience with their customer. It has proven to be, by far, the most predictive data that is available. The best predictor of future customer payment performance is customer payment history. Statistical scoring models using specific customer payment history (payment behavior) can outperform judgmental or generic statistical credit scoring models whether or not those models use credit bureau data or not. When the two methods are compared to each other by analyzing the same set of customers over the same time period, statistical-based scoring always outperforms judgmental scoring in predicting those customers that will become seriously delinquent.
Only 7% were using a risk grade as their top driver, which has been proven to be a more effective tool. Of the participants that used risk grade as their primary driver, half had fewer than five collectors. Those using risk grade also reported having lower past due rates than the other respondents.
Prioritizing Collections: Using Risk vs. Aging
When asked what is the number one, top driver for setting priority around collection activity, 88% of the participants identified either invoice age or value. This is a practice that was originally established in the days of aging reports where there was little technology available to help sort through the invoices in any other way. However, with the emergence of risk-based collections there is a more effective method that is not yet widely-adopted – statistical scoring models.
Statistical-based credit scoring models are designed to predict the inherent risk of a customer, including the probability that the customer will become seriously delinquent, go to write-off or file for bankruptcy at some point in the future, usually within six months from the scoring date. Statistical models “quantify risk” by stating the odds or probability of the delinquency, giving A/R departments the ability, from a dollar perspective, to quantify the value of their risk.
Judgmental-based scoring models are ranking systems wherein the company with the highest score is considered the lowest risk and the company with the lowest score is considered the highest risk. Judgmental scoring does not tell you what the probability or odds are that a given company will pay its bill within any particular time period.
88% of companies are still using age and value to drive collections prioritization.
Aging
Value
Customer Type
Customer Risk Grade
7%
66%
5%
22%
Collection Prioritization Drivers
10 Credit and Collections Global Benchmarking Study
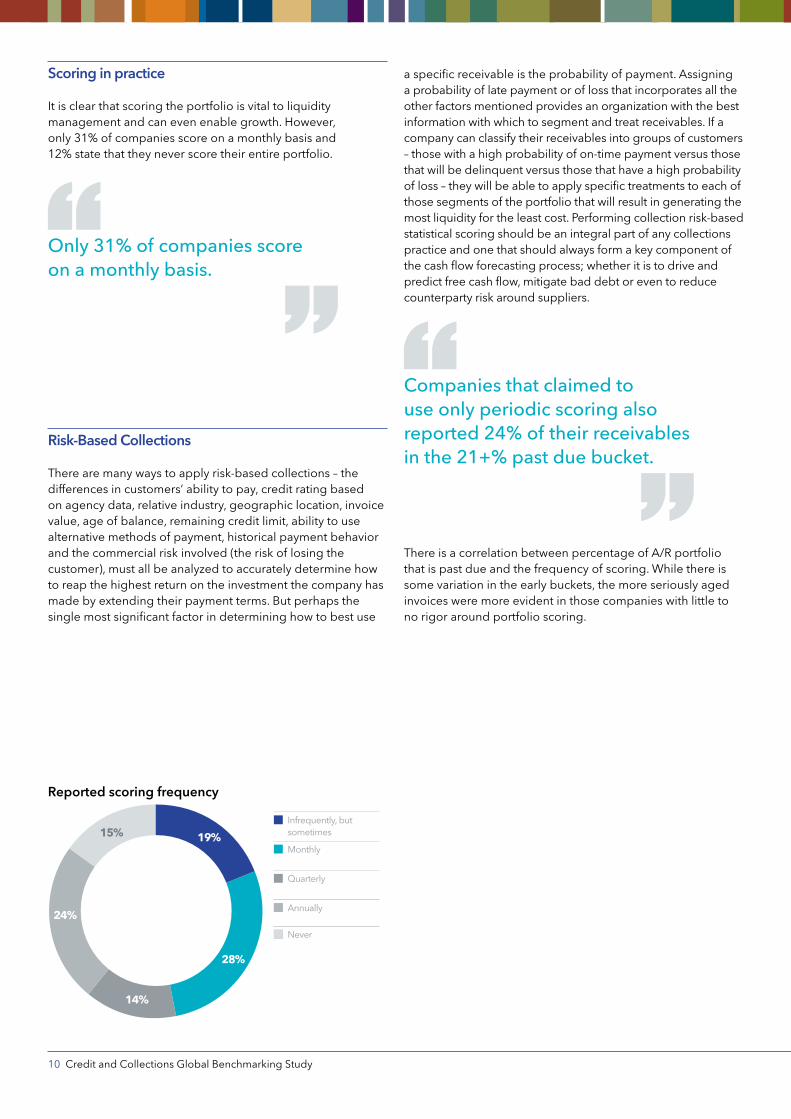
Scoring in practice
It is clear that scoring the portfolio is vital to liquidity management and can even enable growth. However, only 31% of companies score on a monthly basis and 12% state that they never score their entire portfolio.
Risk-Based Collections
There are many ways to apply risk-based collections – the differences in customers’ ability to pay, credit rating based on agency data, relative industry, geographic location, invoice value, age of balance, remaining credit limit, ability to use alternative methods of payment, historical payment behavior and the commercial risk involved (the risk of losing the customer), must all be analyzed to accurately determine how to reap the highest return on the investment the company has made by extending their payment terms. But perhaps the single most significant factor in determining how to best use
Only 31% of companies score on a monthly basis.
a specific receivable is the probability of payment. Assigning a probability of late payment or of loss that incorporates all the other factors mentioned provides an organization with the best information with which to segment and treat receivables. If a company can classify their receivables into groups of customers – those with a high probability of on-time payment versus those that will be delinquent versus those that have a high probability of loss – they will be able to apply specific treatments to each of those segments of the portfolio that will result in generating the most liquidity for the least cost. Performing collection risk-based statistical scoring should be an integral part of any collections practice and one that should always form a key component of the cash flow forecasting process; whether it is to drive and predict free cash flow, mitigate bad debt or even to reduce counterparty risk around suppliers.
There is a correlation between percentage of A/R portfolio that is past due and the frequency of scoring. While there is some variation in the early buckets, the more seriously aged invoices were more evident in those companies with little to no rigor around portfolio scoring.
Companies that claimed to use only periodic scoring also reported 24% of their receivables in the 21+% past due bucket.
Infrequently, butsometimes
Monthly
Quarterly
Annually
Never
19%
28%
15%
24%
14%
Reported scoring frequency

www.sungard.com/avantgard 11
Periodically
Annually/Quarterly
Monthly
0
10
20
30
40
50
<3% 4-10% 11-15% 16-20% >21%
CASE IN POINT
Risk Models Drive Six Day Drop in DSO
It is hard to find a place that CertainTeed’s parent company, Saint-Gobain S.A., a French multinational corporation, has not touched. Originally a mirror manufacturer, it now produces a variety of construction and high performance materials. CertainTeed specializes in manufacturing building materials, including roofing, vinyl siding, gypsum, ceilings and insulation.
CertainTeed’s corporate office, located in Valley Forge, Pennsylvania, hosts the company’s credit shared services department, led by Director of Credit Susan Delloiacono. The credit shared services department encompasses CertainTeed’s 65 facilities and serves its North American customers.
Aggregate Data for a Single View of Enterprise RiskWhen Delloiacono took the director of credit position, CertainTeed’s credit shared services department ran on five independent ERP systems, each dedicated to a specific product line. In addition to the unique ERPs, each product line had its own credit manager. While the credit managers were well versed in their specific product line, “… we could sell to the same customer in all five ERP systems with no way to manage the overall risk,” Delloiacono says.
Run Scoring Models to Drive Collections PrioritizationUsing statistical risk scoring, the team evaluates the customer base and provides the user with critical data that allows the department to prioritize their collections using a risk-based strategy.
It does so by analyzing the customer master file, invoices, credit bureau scores and any other information requested by the user to create a score that accurately assesses an account’s real risk. Unlike an aging report that gives you a snapshot of your current collections, the scoring assesses risk based on both current and paid invoices to provide users with an accurate picture of the likelihood a customer will pay late or become delinquent. Essentially, it allows collections to be proactive instead of reactive.
“We are learning more about our customers,” says Delloiacono. “With the scores, I can be mindful of high-risk accounts. They’re going to be in the rotation frequently versus maybe the customer who is very-low risk.” Since implementing statistical scoring to drive collections prioritization, Delloiacono has seen a six point drop in Days Sales Outstanding (DSO). Additionally, bad debt has decreased dramatically.
[Excerpt from the Accounts Receivables Network]
More frequent scoring shows reduction in past-due levels
12 Credit and Collections Global Benchmarking Study
A new dawn for automated dispute resolution
Why Dispute Management Remains a Challenge
Managing disputes remains a time consuming challenge for most credit departments. Commercial trading relationships typically involve multiple points of interaction between trading partners pointing toward an increased need for networking or collaboration solutions. Any deviation from a clean transaction can impact the cash settlement process.
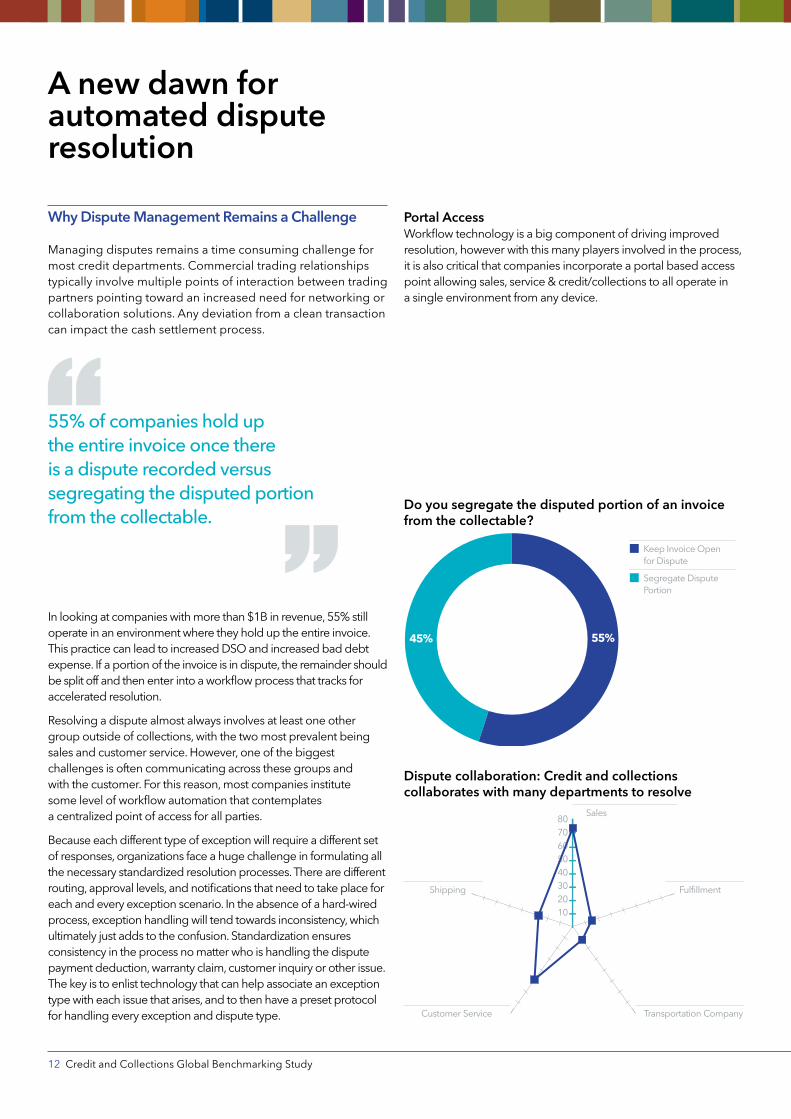
In looking at companies with more than $1B in revenue, 55% still operate in an environment where they hold up the entire invoice. This practice can lead to increased DSO and increased bad debt expense. If a portion of the invoice is in dispute, the remainder should be split off and then enter into a workflow process that tracks for accelerated resolution.
Resolving a dispute almost always involves at least one other group outside of collections, with the two most prevalent being sales and customer service. However, one of the biggest challenges is often communicating across these groups and with the customer. For this reason, most companies institute some level of workflow automation that contemplates a centralized point of access for all parties.
Because each different type of exception will require a different set of responses, organizations face a huge challenge in formulating all the necessary standardized resolution processes. There are different routing, approval levels, and notifications that need to take place for each and every exception scenario. In the absence of a hard-wired process, exception handling will tend towards inconsistency, which ultimately just adds to the confusion. Standardization ensures consistency in the process no matter who is handling the dispute payment deduction, warranty claim, customer inquiry or other issue. The key is to enlist technology that can help associate an exception type with each issue that arises, and to then have a preset protocol for handling every exception and dispute type.
55% of companies hold up the entire invoice once there is a dispute recorded versus segregating the disputed portion from the collectable.
Keep Invoice Openfor Dispute
Segregate Dispute Portion
55%45%
Sales
FulfillmentShipping
Customer Service Transportation Company
1020304050607080
Do you segregate the disputed portion of an invoice from the collectable?
Dispute collaboration: Credit and collections collaborates with many departments to resolve
Portal AccessWorkflow technology is a big component of driving improved resolution, however with this many players involved in the process, it is also critical that companies incorporate a portal based access point allowing sales, service & credit/collections to all operate in a single environment from any device.
www.sungard.com/avantgard 13
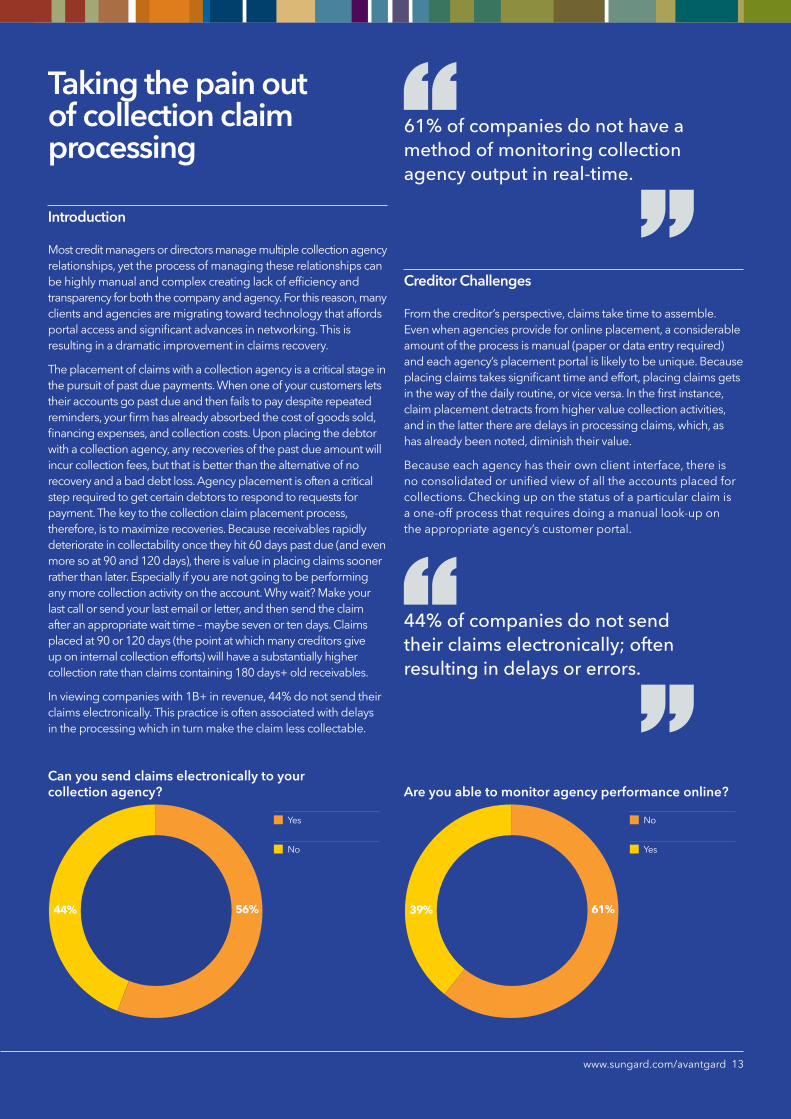
No
Yes
61%39%
Yes
No
56%44%
Taking the pain out of collection claim processing
Introduction
Most credit managers or directors manage multiple collection agency relationships, yet the process of managing these relationships can be highly manual and complex creating lack of efficiency and transparency for both the company and agency. For this reason, many clients and agencies are migrating toward technology that affords portal access and significant advances in networking. This is resulting in a dramatic improvement in claims recovery.
The placement of claims with a collection agency is a critical stage in the pursuit of past due payments. When one of your customers lets their accounts go past due and then fails to pay despite repeated reminders, your firm has already absorbed the cost of goods sold, financing expenses, and collection costs. Upon placing the debtor with a collection agency, any recoveries of the past due amount will incur collection fees, but that is better than the alternative of no recovery and a bad debt loss. Agency placement is often a critical step required to get certain debtors to respond to requests for payment. The key to the collection claim placement process, therefore, is to maximize recoveries. Because receivables rapidly deteriorate in collectability once they hit 60 days past due (and even more so at 90 and 120 days), there is value in placing claims sooner rather than later. Especially if you are not going to be performing any more collection activity on the account. Why wait? Make your last call or send your last email or letter, and then send the claim after an appropriate wait time – maybe seven or ten days. Claims placed at 90 or 120 days (the point at which many creditors give up on internal collection efforts) will have a substantially higher collection rate than claims containing 180 days+ old receivables.
In viewing companies with 1B+ in revenue, 44% do not send their claims electronically. This practice is often associated with delays in the processing which in turn make the claim less collectable.
Creditor Challenges
From the creditor’s perspective, claims take time to assemble. Even when agencies provide for online placement, a considerable amount of the process is manual (paper or data entry required) and each agency’s placement portal is likely to be unique. Because placing claims takes significant time and effort, placing claims gets in the way of the daily routine, or vice versa. In the first instance, claim placement detracts from higher value collection activities, and in the latter there are delays in processing claims, which, as has already been noted, diminish their value.
Because each agency has their own client interface, there is no consolidated or unified view of all the accounts placed for collections. Checking up on the status of a particular claim is a one-off process that requires doing a manual look-up on the appropriate agency’s customer portal.
44% of companies do not send their claims electronically; often resulting in delays or errors.
61% of companies do not have a method of monitoring collection agency output in real-time.
Can you send claims electronically to your collection agency? Are you able to monitor agency performance online?

14 Credit and Collections Global Benchmarking Study
Organizations today are looking for a more streamlined method to operate. While there has been much advancement within the credit industry, until now the client – agency relationship has benefited little. Besides the physical challenge of placing collection claims and the associated data management, agency communications are handled as exceptions rather than process components. As mentioned, monitoring claim progress and results is fragmented because every agency has their own way of handling how claim status is communicated. To help address this challenge some companies are now using a single agency portal that sends claims to multiple agencies and is also capable of tracking agency performance.
Agency Challenges
The challenges agencies face are almost a mirror image of their clients. For example, claim quality is affected when claims are placed later than they should have been and increases the time lapse since the last collection activity. Incomplete files also affect claim quality. In particular, when the agency is not provided with access to the debtor’s collection history, the agency must ‘start over’ with the debtor rather than ‘pick up’ where the creditor left off. Agencies are also challenged when they receive claim data in both electronic and paper formats. Paper clogs up the process because data conversion is an unnecessary cost and burden. For these reasons, progressive agencies are now participating in more innovative communication methods, taking advantage of portals and connectivity.
The automated claims process
Recent developments have allowed for an automated collection claim process that facilitates the translation of claim data derived from the creditors A/R system into the agency’s collection software and then standardizes feedback from the agency to the creditor. These systems also allow the creditor to track the terms and conditions of the relationship with the creditor; allowing for easy tracking and reconciliation of all relationships. On the front end, automated claim placement is abetted with an electronic acknowledgement of receipt. As the claim is worked by the agency, A/R account updates are automatically transmitted by the creditor to the agency while claim status information is transmitted back to the creditor in a standardized format that allows the creditor to not only monitor individual claim progress, but also apprehend a single consolidated view of their entire 3rd party collection efforts. Thus constituted, an automated collection claim placement process contains these three primary features:
1. Automated claim placement
2. Automated Agency/Creditor Data Flows
3. Ability to Closely Monitor the terms and conditions of the relationship, Status of claims and Performance of the agency.
The greater visibility associated with an automated collection claim process also yields significant dividends. Because the agency receives full details on new claims, there are fewer subsequent requests for information from the creditor, and there is no need to rehash details – the agency starts work where the creditor left off. By the same token, enhanced status updates are provided to the creditor, and maybe most importantly, everybody is on the same page when a decision about how to proceed is required. The efficiency gains combined with improved transparency help to form a stronger relationship.
www.sungard.com/avantgard 15
DSO
Past Due A/RRoot-Cause Analysis
Dispute Cycle Time Average Days to Pay
Dispute Volume
CollectionsEffectiveness
1020304050607080
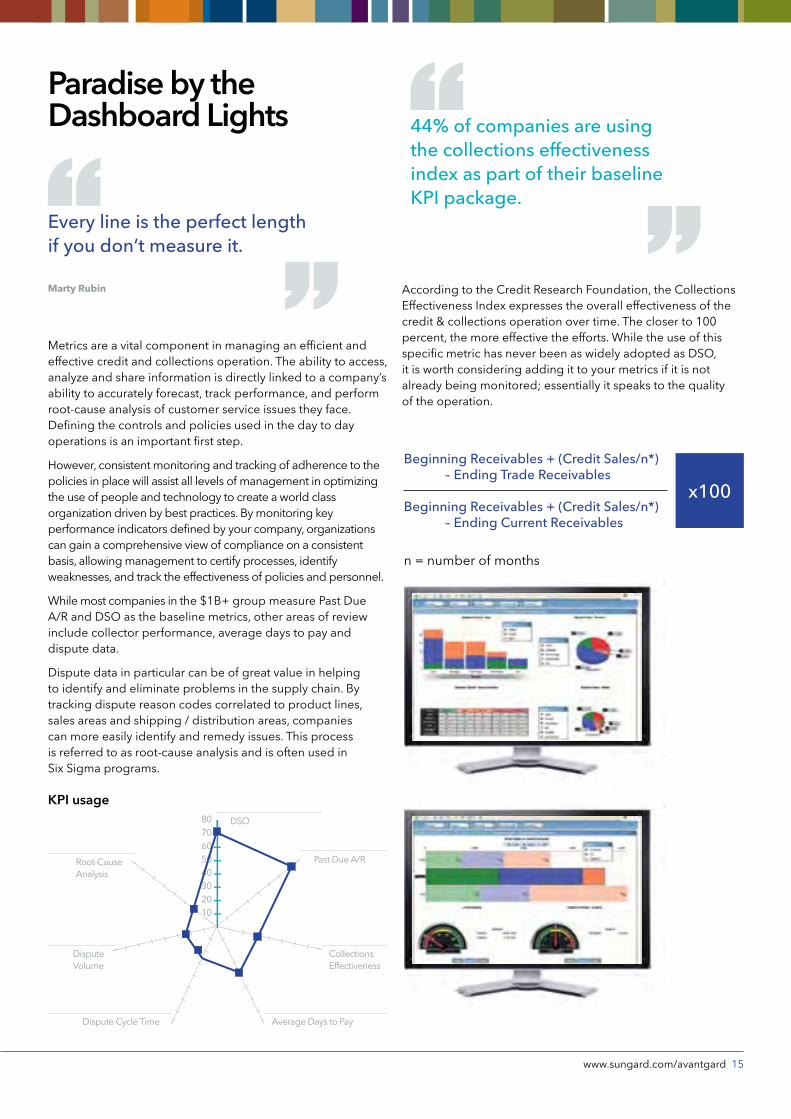
Paradise by the Dashboard Lights
Metrics are a vital component in managing an efficient and effective credit and collections operation. The ability to access, analyze and share information is directly linked to a company’s ability to accurately forecast, track performance, and perform root-cause analysis of customer service issues they face. Defining the controls and policies used in the day to day operations is an important first step.
However, consistent monitoring and tracking of adherence to the policies in place will assist all levels of management in optimizing the use of people and technology to create a world class organization driven by best practices. By monitoring key performance indicators defined by your company, organizations can gain a comprehensive view of compliance on a consistent basis, allowing management to certify processes, identify weaknesses, and track the effectiveness of policies and personnel.
While most companies in the $1B+ group measure Past Due A/R and DSO as the baseline metrics, other areas of review include collector performance, average days to pay and dispute data.
Dispute data in particular can be of great value in helping to identify and eliminate problems in the supply chain. By tracking dispute reason codes correlated to product lines, sales areas and shipping / distribution areas, companies can more easily identify and remedy issues. This process is referred to as root-cause analysis and is often used in Six Sigma programs.
Every line is the perfect length if you don’t measure it.
Marty Rubin According to the Credit Research Foundation, the Collections Effectiveness Index expresses the overall effectiveness of the credit & collections operation over time. The closer to 100 percent, the more effective the efforts. While the use of this specific metric has never been as widely adopted as DSO, it is worth considering adding it to your metrics if it is not already being monitored; essentially it speaks to the quality of the operation.
44% of companies are using the collections effectiveness index as part of their baseline KPI package.
Beginning Receivables + (Credit Sales/n*) – Ending Trade Receivables
Beginning Receivables + (Credit Sales/n*) – Ending Current Receivables
n = number of months
x100
KPI usage

16 Credit and Collections Global Benchmarking Study
SummaryAs companies continue to face increased pressure to manage more with less, including an influx of invoice volume, there is increased demand for automation and workflow solutions. Key areas to highlight include the ability to:
1. Aggregate data across disparate ERP systems for a single view of credit risk;
2. Introduce statistical scoring models to drive collections prioritization;
3. Engage in monthly scoring of the ENTIRE A/R portfolio
4. Segregate disputes from collectable portions of an invoice;
5. Use routing and tracking software to expedite the resolution of disputed invoices;
6. Monitor collection agencies in real-time for performance and effectiveness
7. Metrics, metrics, metrics – you get what you measure – driving behavior requires goal alignment across the entire enterprise
After two and a half years of using automation & workflow technology, late payments have declined by half, and DSO improved by 21%. This is a consequence of all these joint actions with other departments; sales, accounting, supply chain, legal, IT...
Barbara Farge
credit manager Heineken

www.sungard.com/avantgard 17
88% of companies are still using age and value to drive collections prioritization
Without an effective alternative, companies are still using age or invoice value as the driver of collections prioritization, which will lead to unworked current high risk receivables rolling into past due buckets in the short term future.
55% of companies hold up the entire invoice once there is a dispute recorded versus segregating the disputed portion from the collectable
Segregating the disputed portion of an invoice from the collectable is a critical step in helping to reduce DSO and bad debt expense associated with invoice exceptions.
87% of companies that cite collections volume as a top challenge are not fully automated across the order-to-cash operation
Key areas that can be addressed through automation include chasing disputed invoices, prioritizing collection activity, identifying and mitigating risk, setting & sending reminders include: reporting and organizing call queues.
24% of companies that claim to only periodically score their portfolios also reported that 21%+ of their portfolio is past due.
Monthly scoring of the portfolio can help companies find valuable clarity around portfolio risk; thereby targeting companies with the least propensity to pay as the priority.
61% of companies do not have a method of monitoring collection agency output in real-time
An agency portal can provide the ability to send and receive claims electronically and monitor performance across multiple agencies.
44% of companies are leveraging the collections effectiveness index to measure performance
While most companies look at DSO and Past Due A/R data, fewer are using more insightful KPI tracking methods such as the collections effectiveness index or root-cause analysis for reduction in dispute volume.
59% of organizations operate in a regional or decentralized model; for companies with 50K+ in open invoices, this figure rises to 83%
While regional or decentralized models offer increased agility and the ability to more effectively service specific regions or business lines, it can open up a level of risk if the company is unable to view credit exposure across the entire enterprise, while presenting challenges related to compliance to one corporate credit and collections policy.

18 Credit and Collections Global Benchmarking Study
AppendixUnder $1 billion in revenue
How is your credit & collections function managed?
In-House
Outsourced
92%
8%
How many collectors do you have in total?
5 or Fewer
6 to 10
11 to 20
21 to 50
51 to 100
More than 10059%
1%
18%
13%
7%2%
How is your group organized?
Fully Centralized Globally (Single Center)
Regional Shared Service Centers
Decentralized at theSubsidiary Level
Combination
11%
51%
21%
17%
Over $1 billion in revenue
How is your credit & collections function managed?
In-House
Outsourced
89%
11%
How many collectors do you have in total?
5 or Fewer
6 to 10
11 to 20
21 to 50
51 to 100
More than 100
24%
17%8%
24%9%
18%
How is your group organized?
Fully Centralized Globally (Single Center)
Regional Shared Service Centers
Decentralized at theSubsidiary Level
Combination
34%
25%27%
14%

www.sungard.com/avantgard 19
Looking back over the past 24 months, what is your top challenge?
Collections volume has gone up with same or reduced staff
DSO and Past Due A/R are increasing
Collaborating with Sales
Unable to score customers/poor view of ongoing credit risk
Difficulty getting risk datafor emerging markets
Problems prioritizing collection activity
My dispute invoice hasgone up
23%
12%
19%
17%
13%
9%
7%
How many invoices are generated monthly?
Up to 1000
1001 – 5000
5001 – 25,000
25,00 – 50,000
More than 50,000
28%
14%
26%
28%
4%
What is the average value of each invoice?
Less than $500
$500 – 100
$1000 – 5,000
$5,000 – 10,000
$10,000 – 30,000
$30,000 – 100,000
$100,000 – 500,000
More than $500,000
22%8%
14%
22%
24%
5% 3%2%
Looking back over the past 24 months, what is your top challenge?
Collections volume has gone up with same or reduced staff
Collaborating with Sales
DSO and Past Due A/R are increasing
Problems prioritizing collection activity
My dispute invoice hasgone up
Unable to score customers/poor view of ongoing credit risk
Difficulty getting risk datafor emerging markets
32%
11%
15%14%
12%
11%
5%
How many invoices are generated monthly?
Up to 1000
1001 – 5000
5001 – 25,000
25,00 – 50,000
More than 50,000
2%
32%
12%
28%
26%
What is the average value of each invoice?
Less than $500
$500 – 100
$1000 – 5,000
$5,000 – 10,000
$10,000 – 30,000
$30,000 – 100,000
$100,000 – 500,000
More than $500,000
5%
28%
14%
14%
19%
12%1% 7%
Under $1 billion in revenue Over $1 billion in revenue

20 Credit and Collections Global Benchmarking Study
To what extent to you feel you have automated the entire order-to-cash process?
Not Automated – AllSpreadsheets
Some Functions areAutomated
Most Functions areAutomated
Fully Automated
50%
15%10%
25%
How many instances of ERPs or A/R systems exist across the organization?
1 Single System Globally
2 to 5
6 to 10
more than 10
59%
2%3%
36%
What percentage of your receivables portfolio is typically past due?
Less than 1%
2 – 3%
4 – 5%
6 – 10%
11 – 15%
16 – 20%
More than 21%
15%
12%
10%
10%
22%
14%
17%
To what extent to you feel you have automated the entire order-to-cash process?
Not Automated – AllSpreadsheets
Some Functions areAutomated
Most Functions areAutomated
Fully Automated
45%
6%13%
36%
How many instances of ERPs or A/R systems exist across the organization?
1 Single System Globally
2 to 5
6 to 10
more than 10
47%
29%
12%
12%
What percentage of your receivables portfolio is typically past due?
Less than 1%
2 – 3%
4 – 5%
6 – 10%
11 – 15%
16 – 20%
More than 21%
2%
17%
20%
9%
30%
12%
10%
Under $1 billion in revenue Over $1 billion in revenue
www.sungard.com/avantgard 21
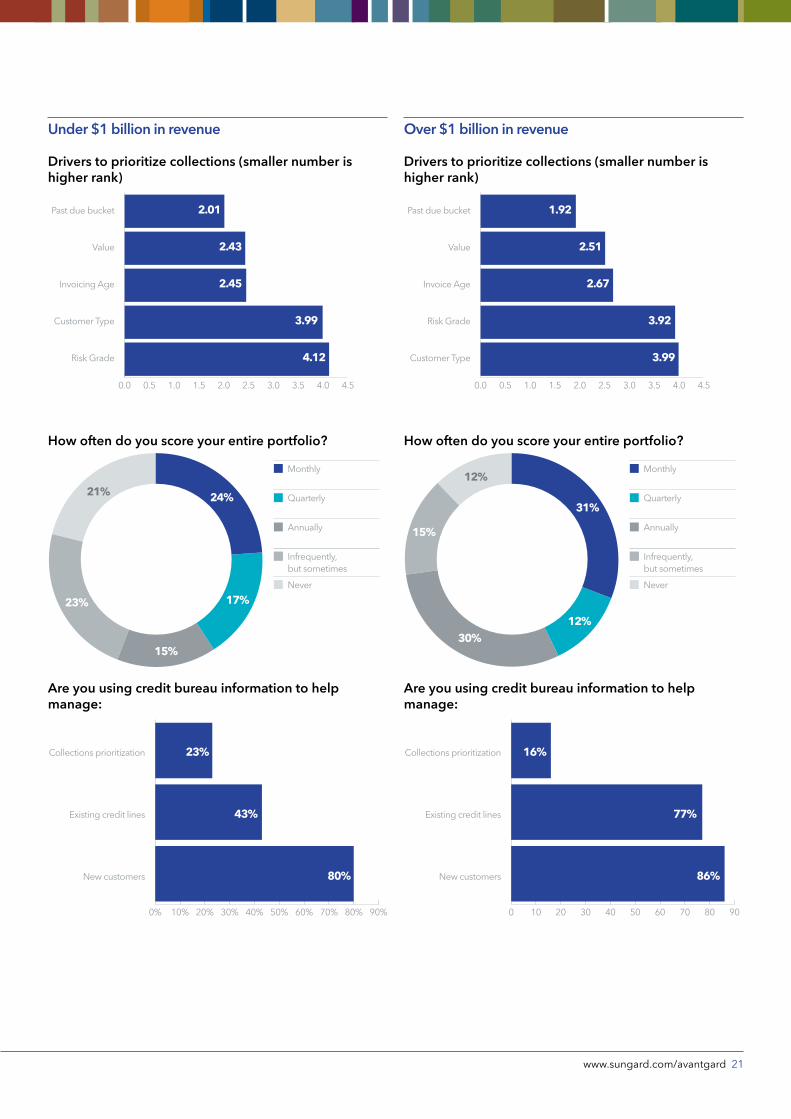
Drivers to prioritize collections (smaller number is higher rank)
Past due bucket
Value
Invoice Age
Risk Grade
Customer Type
0.0 0.5 1.0 1.5 2.0 2.5 3.0 3.5 4.0 4.5
1.92
2.51
2.67
3.92
3.99
How often do you score your entire portfolio?
Monthly
Quarterly
Annually
Infrequently, but sometimes
Never
31%
12%
12%30%
15%
Are you using credit bureau information to help manage:
Collections prioritization
Existing credit lines
New customers
0 10 20 30 40 50 60 70 80 90
77%
16%
86%
Drivers to prioritize collections (smaller number is higher rank)
Past due bucket
Value
Invoicing Age
Customer Type
Risk Grade
0.0 0.5 1.0 1.5 2.0 2.5 3.0 3.5 4.0 4.5
2.01
2.43
2.45
3.99
4.12
How often do you score your entire portfolio?
Monthly
Quarterly
Annually
Infrequently, but sometimes
Never
24%21%
17%
15%
23%
Are you using credit bureau information to help manage:
Collections prioritization
Existing credit lines
New customers
0% 10% 20% 30% 40% 50% 60% 70% 80% 90%
43%
23%
80%
Under $1 billion in revenue Over $1 billion in revenue
22 Credit and Collections Global Benchmarking Study
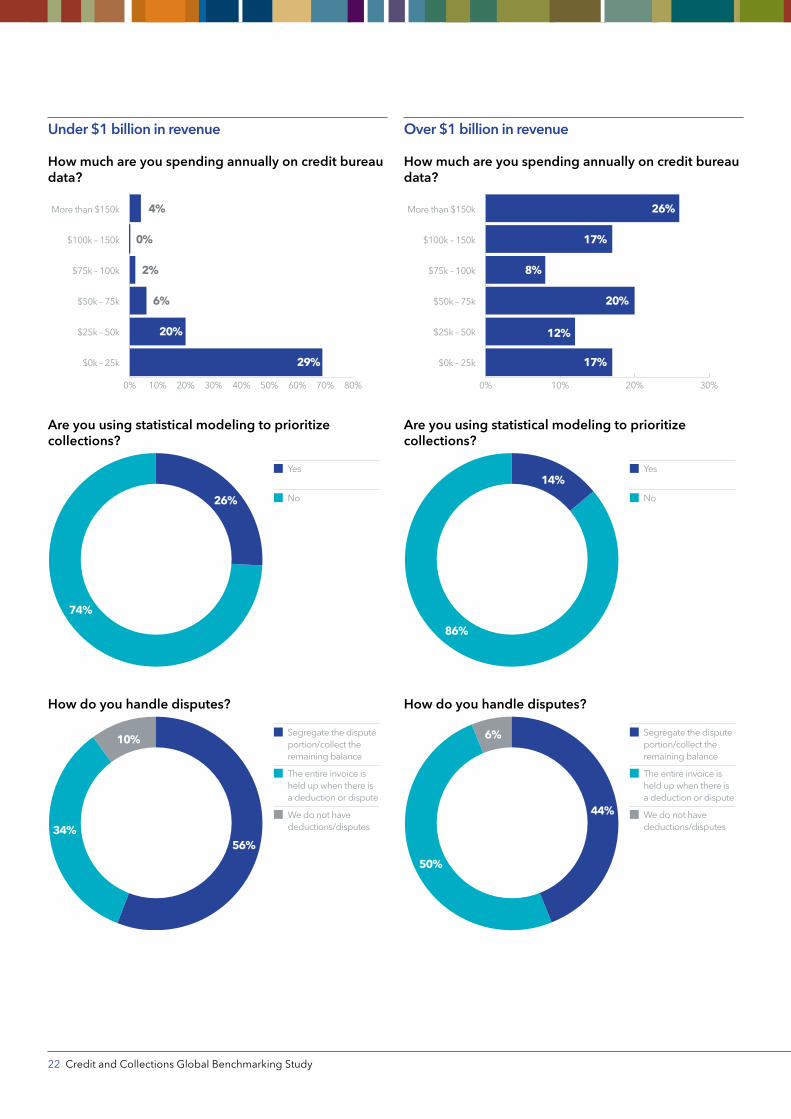
How much are you spending annually on credit bureau data?
More than $150k
$75k – 100k
$0k – 25k
$100k – 150k
$50k – 75k
$25k – 50k
0% 10% 20% 30% 40% 50% 60% 70% 80%
20%
6%
29%
2%
0%
4%
Are you using statistical modeling to prioritize collections?
Yes
No
74%
26%
How do you handle disputes?
Segregate the disputeportion/collect theremaining balance
The entire invoice is held up when there is a deduction or dispute
We do not have deductions/disputes
56%
10%
34%
How much are you spending annually on credit bureau data?
More than $150k
$75k – 100k
$0k – 25k
$100k – 150k
$50k – 75k
$25k – 50k
0% 10% 20% 30%
12%
20%
17%
8%
17%
26%
Are you using statistical modeling to prioritize collections?
Yes
No
86%
14%
How do you handle disputes?
Segregate the disputeportion/collect theremaining balance
The entire invoice is held up when there is a deduction or dispute
We do not have deductions/disputes
44%
6%
50%
Under $1 billion in revenue Over $1 billion in revenue

www.sungard.com/avantgard 23
Do you engage in complex deduction/dispute routing with multiple levels of approval?
Yes
No
62%
38%
Who is typically involved in dispute resolution outside of credit and collections?
Sales
Shipping
N/A
Customer Service
Transportation Company
Fulfillment
0% 10% 20% 30% 40% 50% 60% 70% 80%
8%
8%
5%
9%
63%
75%
How many different collection agencies do you use?
None
1 to 3
4 to 6
More than 7
1%
39%
2%
58%
Do you engage in complex deduction/dispute routing with multiple levels of approval?
Yes
No
46%54%
Who is typically involved in dispute resolution outside of credit and collections?
Sales
Shipping
N/A
Customer Service
Fulfillment
Transportation Company
0% 10% 20% 30% 40% 50% 60% 70% 80% 90%100%
15%
18%
4%
29%
60%
92%
How many different collection agencies do you use?
None
1 to 3
4 to 6
More than 7
7%
35%
7%
51%
Under $1 billion in revenue Over $1 billion in revenue
24 Credit and Collections Global Benchmarking Study
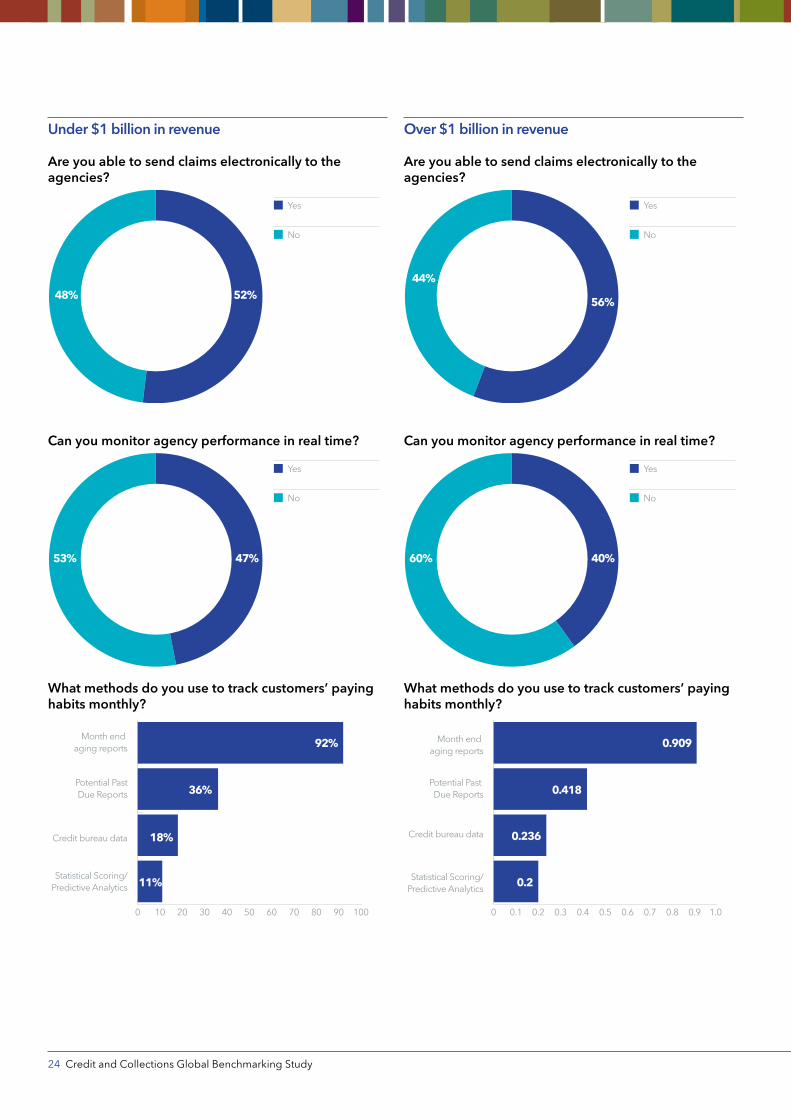
Are you able to send claims electronically to the agencies?
Yes
No
48% 52%
Can you monitor agency performance in real time?
Yes
No
53% 47%
What methods do you use to track customers’ paying habits monthly?
Month end aging reports
Statistical Scoring/Predictive Analytics
Potential PastDue Reports
Credit bureau data
0 10 20 30 40 50 60 70 80 90 100
18%
11%
36%
92%
Are you able to send claims electronically to the agencies?
Yes
No
44%
56%
Can you monitor agency performance in real time?
Yes
No
60% 40%
What methods do you use to track customers’ paying habits monthly?
Month end aging reports
Statistical Scoring/Predictive Analytics
Potential Past Due Reports
Credit bureau data
0 0.1 0.2 0.3 0.4 0.5 0.6 0.7 0.8 0.9 1.0
0.236
0.2
0.418
0.909
Under $1 billion in revenue Over $1 billion in revenue
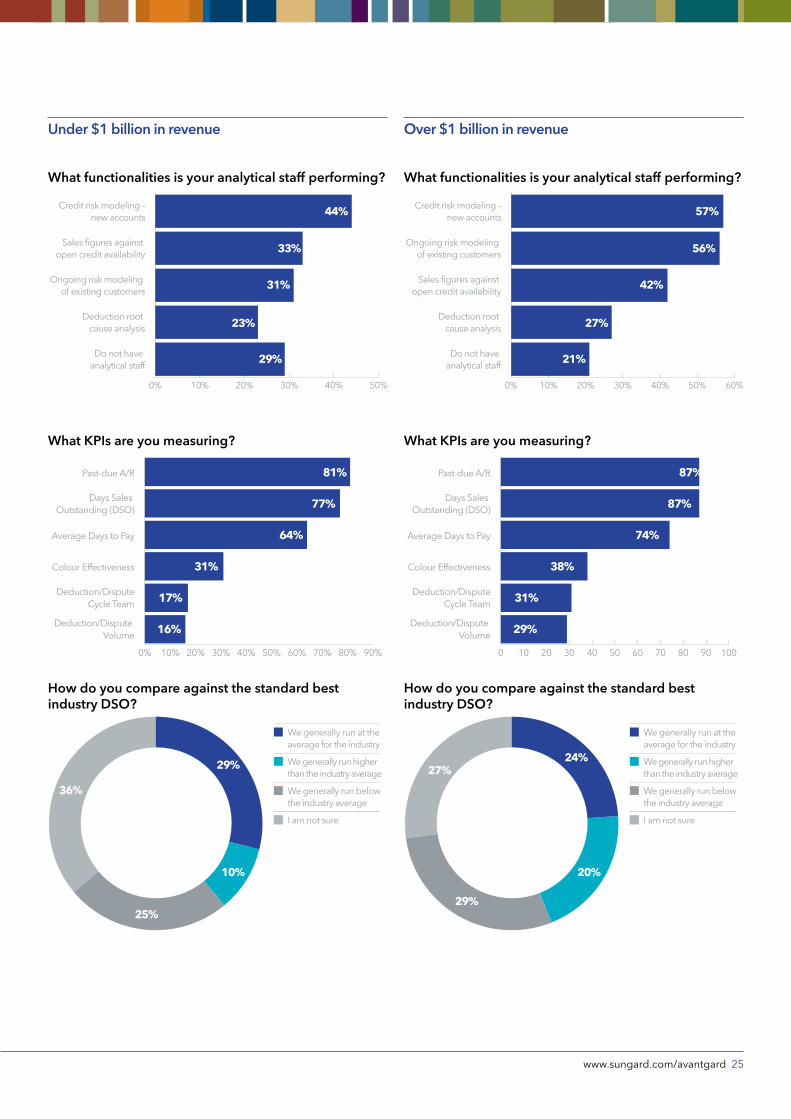
www.sungard.com/avantgard 25
What functionalities is your analytical staff performing?
Credit risk modeling –new accounts
Sales figures against open credit availability
Ongoing risk modeling of existing customers
Deduction root cause analysis
Do not have analytical staff
0% 10% 20% 30% 40% 50% 60%
27%
42%
21%
56%
57%
What KPIs are you measuring?
Past-due A/R
Average Days to Pay
Deduction/Dispute Volume
Days Sales Outstanding (DSO)
Colour Effectiveness
Deduction/Dispute Cycle Team
0 10 20 30 40 50 60 70 80 90 100
31%
38%
29%
74%
87%
87%
How do you compare against the standard best industry DSO?
We generally run at theaverage for the industry
We generally run higherthan the industry average
We generally run belowthe industry average
I am not sure
27%24%
29%
20%
What functionalities is your analytical staff performing?
Credit risk modeling –new accounts
Ongoing risk modeling of existing customers
Sales figures against open credit availability
Deduction root cause analysis
Do not have analytical staff
0% 10% 20% 30% 40% 50%
23%
31%
29%
33%
44%
What KPIs are you measuring?
Past-due A/R
Average Days to Pay
Deduction/Dispute Volume
Days Sales Outstanding (DSO)
Colour Effectiveness
Deduction/Dispute Cycle Team
0% 10% 20% 30% 40% 50% 60% 70% 80% 90%
17%
31%
16%
64%
77%
81%
How do you compare against the standard best industry DSO?
We generally run at theaverage for the industry
We generally run higherthan the industry average
We generally run belowthe industry average
I am not sure
36%
29%
25%
10%
Under $1 billion in revenue Over $1 billion in revenue

26 Credit and Collections Global Benchmarking Study
Industry Classification
Agriculture & Fisheries
Automobiles & Parts
Chemicals
Construction & Materials
Financial Services
Food & Beverage
Forestry & Paper
Health Care
Industrial Goods & Services
Insurance
Manufacturing
Media
Metals & Mining
Oil & Gas
Pharmaceuticals & Biotech
Retail
Services (Non-Financial)
Technology
Telecommunications
Textiles & Apparel
Transportation
Utilities
8%
2%2%
4%1%13%1%
2%
2%
2%
6%
14%
5%1%5%
1%4%
1%
2%
2%
11%
8%
Industry Classification
Agriculture & Fisheries
Automobiles & Parts
Chemicals
Construction & Materials
Financial Services
Food & Beverage
Health Care
Industrial Goods & Services
Insurance
Manufacturing
Media
Metals & Mining
Oil & Gas
Personal & Household Goods
Real Estate
Retail
Services (Non-Financial)
Technology
Telecommunications
Transportation
Travel & Leisure
Utilities
5%1%
8%
2%13%2%
1%1%2%
1%3%
12%
8%
7%
6% 1% 2%
13%
3%4%
2%5%
Under $1 billion in revenue Over $1 billion in revenue
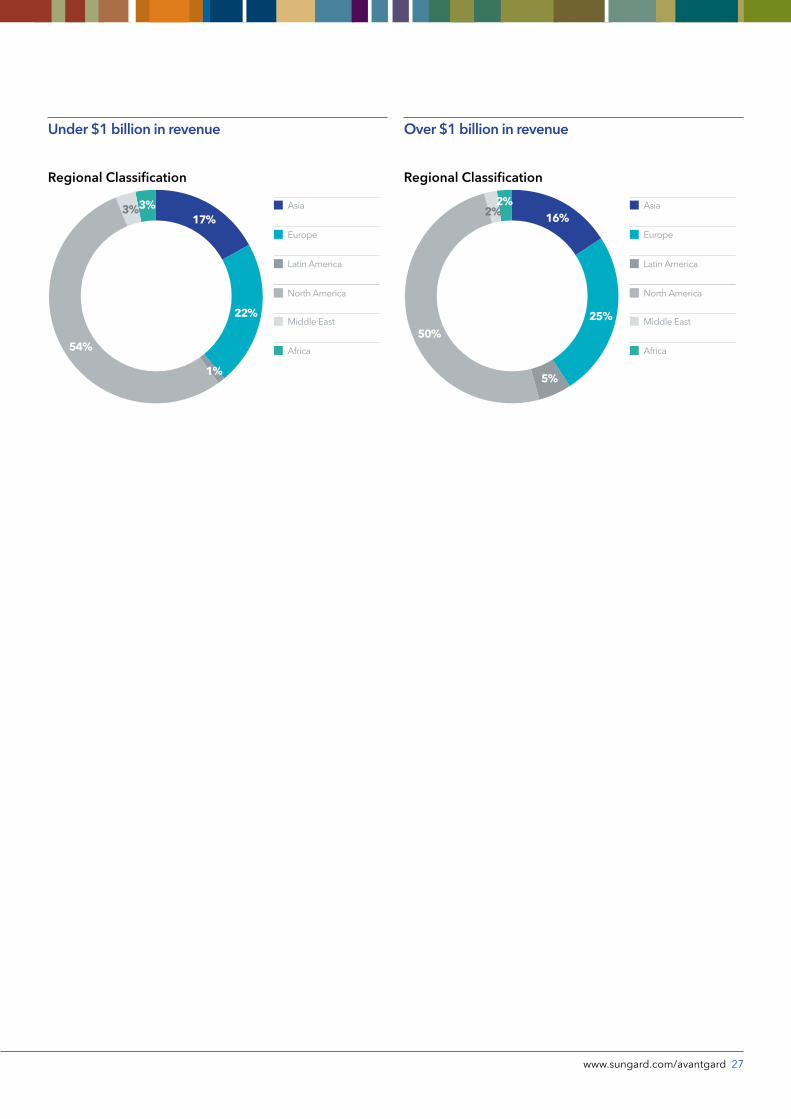
www.sungard.com/avantgard 27
Regional Classification
Asia
Europe
Latin America
North America
Middle East
Africa
16%2%
25%
5%
50%
2%
Regional Classification
Asia
Europe
Latin America
North America
Middle East
Africa
17%3%
22%
1%
54%
3%
Under $1 billion in revenue Over $1 billion in revenue

©2014 SunGard. Trademark Information: SunGard, and the SunGard logo are trademarks or registered trademarks of SunGard Data Systems Inc. or its subsidiaries in the U.S. and other countries. All other trade names are trademarks or registered trademarks of their respective holders.CPL1938
About SunGard’s AvantGardSunGard’s AvantGard is a leading Corporate Liquidity and risk management solution for corporations, insurance companies and the public sector. The AvantGard solution suite includes credit risk modeling, collections management, treasury risk analysis, cash management, payments system integration, and payments execution delivered directly to corporations or via banking partners. AvantGard solutions help consolidate data from multiple in-house systems, drive workflow and provide connectivity to a broad range of trading partners including banks, SWIFT, credit data providers, FX platforms, money markets, and market data. The technology is supported by a full range of services delivered by domain experts, including managed cloud services, treasury operations management, SWIFT administration, managed bank connectivity, bank on-boarding, and vendor enrollment. For more information, visit www.sungard.com/avantgard.
About SunGard SunGard is one of the world’s leading software and technology services companies, with annual revenue of about $2.8 billion. SunGard provides software and processing solutions for financial services, education and the public sector. SunGard serves approximately 16,000 customers in more than 70 countries and has more than 13,000 employees. For more information, please visit www.sungard.com.
Contact us [email protected]
For more information, please visit: www.sungard.com/avantgard
Visit us on Twitter at: www.twitter.com/SGavantgard


