20
WP/09/53 Credit Market in Morocco: A Disequilibrium Approach Laurence Allain and Nada Oulidi

WP/09/53
Credit Market in Morocco: A Disequilibrium Approach
Laurence Allain and Nada Oulidi


© 2009 International Monetary Fund WP/09/53 IMF Working Paper Middle East and Central Asia and Monetary and Capital Markets Departments
Credit Market in Morocco: A Disequilibrium Approach
Prepared by Laurence Allain and Nada Oulidi
Authorized for distribution by Joël Toujas-Bernaté and Daniel Hardy
March 2009
Abstract
This Working Paper should not be reported as representing the views of the IMF. The views expressed in this Working Paper are those of the author(s) and do not necessarily represent those of the IMF or IMF policy. Working Papers describe research in progress by the author(s) and are published to elicit comments and to further debate.
In this paper we use a disequilibrium framework common in the “credit crunch” literature, first to examine whether the slow credit growth in Morocco during the rapid expansion of liquidity in the first half of the decade can be attributed to credit rationing, and second to investigate the role of asset price increases in the recent acceleration of credit growth. Our results do not support the credit rationing hypothesis in the first half of the decade. They do however, show that the recent increase in real estate prices stimulated credit supply and demand, with a stronger effect on the latter. JEL Classification Numbers: G21; G20 Keywords: Credit growth, credit demand, credit supply, real estate prices Authors’ E-Mail Addresses: [email protected]; [email protected]

2
Contents Page
I. Introduction ............................................................................................................................3
II. Overview of Credit Market Developments ...........................................................................4
III. Literature Review.................................................................................................................7
IV. Estimation Strategy..............................................................................................................9
V. Estimation Results...............................................................................................................11
VI. Concluding Remarks .........................................................................................................14 References................................................................................................................................18 Figures 1. Required Bank Reserves and Official Reserves, 2000–07 ............................................4 2. Treasury Bill Rate, 2000–07..........................................................................................4 3. Private Sector Credit in Percent of GDP, 2000–07........................................................5 4. Structure of Banking System Assets..............................................................................5 5. Credit to the Economy (2002=100) ...............................................................................6 6. Evolution of Real Estate Stock Market Index................................................................6 Appendixes I. Unit Root Tests ............................................................................................................16 II. Cointegration Tests ......................................................................................................17

3
I. INTRODUCTION1
The success of Morocco’s economic reform program since the turn of the century has substantially strengthened macroeconomic conditions, accelerated the pace of non-agricultural growth, and improved the soundness of the financial sector. Increase in tourism and remittance receipts, coupled with higher capital inflows, have sustained current account surpluses for most of the period, and boosted domestic liquidity. In contrast with what happened in other regions of the world, these developments did not fuel a credit boom, and the ratio of credit to the economy to non-agricultural GDP remained basically flat between 2000 and 2004. Insufficient access to credit, particularly for small- and medium-sized enterprises, was often pointed to as an important obstacle to growth in the national economic debate, a diagnostic echoed in the 2005 Investment Climate Assessment conducted by the World Bank. Starting in 2006 however, credit to the private sector has been increasing rapidly, growing by almost 30 percent year-on-year in 2007, while its ratio to non-agricultural GDP jumped by more than 10 percentage points between 2006 and 2007, to reach almost 80 percent.
These sharply contrasting developments raise several questions, which this paper seeks to answer. Using an explicit disequilibrium framework common in the “credit crunch” literature, we first test the hypothesis that the presence of excess liquidity in the banking system at a time when there was anecdotal evidence of strong credit demand implies that some form of credit rationing was at play, with banks reticent to extend credit to firms in the presence of high information asymmetries. Second, we investigate whether the recent acceleration in the pace of credit growth is supply- or demand-driven, and discuss the role that the sharp increase of asset prices, notably in the real estate sector, may have played in this increase.
The paper is organized as follows: Section II briefly discusses the main characteristics of Morocco’s credit market. Section III reviews the literature on disequilibrium credit markets. Section IV discusses our estimation strategy and our results, and Section V concludes.
1 We would like to thank Mark Lewis, Daniel Hardy, Abdelhak Senhadji, May Khamis, Plamen Iossifov, Boileau Loko, Tahsin Saadi-Sedik, Gabriel Sensenbrenner, Joël Toujas-Bernaté and Mouad Farhi (Bank Al Maghrib) for invaluable comments and suggestions. The usual disclaimer applies.

4
II. OVERVIEW OF CREDIT MARKET DEVELOPMENTS
Macroeconomic conditions have significantly strengthened since the turn of the century, as evidenced by higher per-capita growth, declining public deficit and debt stock, and low and stable inflation. Sizeable capital flows—stemming from increased foreign direct investment flows as well as strong remittance and tourism receipts—have kept the balance of payment in surplus, with reserves increasing more than fivefold to reach US$ 24 billion at end-2007.
In the context of Morocco’s fixed exchange rate regime and partially closed capital account, these capital flows have considerably boosted domestic liquidity, with the banking system’s structural liquidity position increasing from about 10 percent of banks’ total assets in 2000 to 24 percent in 2006. To buffer the impact of this increase on macroeconomic stability, the Central Bank of Morocco (Bank Al-Maghrib, BAM) raised the ratio of required reserves from 10 percent in 2000 to 16.5 percent in 2006, before lowering it again to 15 percent at end-2007 (Figure 1). In spite of these increases, banks held excess reserves during most of 2000-07, and BAM regularly used its 24-hour deposit facility to mop up the system’s excess liquidity. Combined with declining interest rates in Europe, Morocco’s main trading partner, these developments led to a steady decline of interest rates through much of the period (Figure 2).
Figure 1. Required Bank Reserves and Official Reserves, 2000-07
0
10 20 30
40 50 60
2000 2001 2002 2003 2004 2005 2006 2007
0
5
10
15
20
25
30
Required bank resevers (MAD bn) Official reserves (in US$ bn, right axis)
Figure 2. Treasury Bill Rate, 2000-07
0.0
1.0
2.0
3.0
4.0
5.0
6.0
7.0
2000Q1
2000Q3
2001Q1
2001Q3
2002Q1
2002Q3
2003Q1
2003Q3
2004Q1
2004Q3
2005Q
1
2005Q3
2006Q
1
2006Q3
2007Q
1
2007Q3
Source: BAM During the first half of the decade, the expansion of the banking sector’s balance sheet did not translate into a significant increase in credit to the economy. Its ratio to GDP remained basically flat between 2000 and 2006; in fact, the share of the banking sector’s total assets to credit to the private sector fell by 3 points during this period (Figures 3 and 4). The most plausible explanation for this finding lies in the structure of the Moroccan credit market. On the supply side, bank credit is highly concentrated with limited competition, with the three largest banks accounting for roughly 60 percent of outstanding credit to the private sector in 2007. The demand side is characterized by a marked dichotomy between, on the one hand, a few large and well-established firms including large Moroccan conglomerates and subsidiaries of multinationals, whose financial reporting abide by international standards, and on the other, a

5
multitude of smaller firms, many of which operate in the informal sector, for which reliable financial information is harder to obtain and credit-risk much harder to assess. Other factors which may have hamstrung the distribution of credit is the persistence of a relatively large portfolio of nonperforming loans in the banks’ books until 2005, which may have further weakened their appetite for risk, and the existence of an interest rate ceiling, which may have limited their ability to lend to higher-risk customers. Taken together, these two factors suggest that the segmented nature of the demand-side of the credit market may have led to some credit rationing on the supply-side, reflecting the difficulty for banks to price risk in the presence of high information asymmetries.
Figure 3. Private Sector Credit in Percent of GDP, 2000-07
0 10
20
30
40
50
60
70
80
2000 2001 2002 2003 2004 2005 2006 2007
Figure 4. Structure of Banking System Assets
0
20
40
60
80
100
120
2000 2006
Credit to the economy
Credit to the economy
Claims on the government Claims on the
government
ReservesReserves
Foreign assets
Source: BAM
Credit growth has picked up sharply after 2006, and while credit to consumers and the real estate sector have been the fastest-growing categories, the increase in credit is fairly broad-based (Figure 5). A confluence of demand and supply factors has contributed to this turnaround in the evolution in credit.
First, since 2005, the central bank has spearheaded a comprehensive effort to encourage lending, which involved the sector’s main stakeholders (including bankers and business associations), to improve the reliability of the financial information on borrowers available to banks, increase the transparency of credit decisions, strengthen banks’ risk management capacity, and improve bad loans recovery. These measures include standardizing the minimum data requirements to process credit applications, helping banks develop their internal risk-rating systems, monitoring banks’ risk management practices, and setting up a credit bureau.
Second, to facilitate access to credit, the Treasury has strengthened the performance of several public-guarantee funds, notably those providing guarantees to small- and medium-term enterprises and those encouraging home-ownership. These guarantees have also provided an incentive for banks to increase lending.
Third, asset prices, and particularly real estate prices, have increased considerably, creating a positive wealth effect, and boosted collateral values. The main stock market index for the Casablanca Stock Exchange (MASI) increased threefold since 2000, and overall market

6
capitalization soared from 29 percent of GDP to 103 percent between 2000 and 2007. Furthermore, there is high evidence suggesting a strong increase in real estate prices, reaching almost 20 percent in 2007 in some cities. As robust time-series data on real estate prices are not available, we use the real-estate sector index of shares traded on the Casablanca Stock Exchange (CSE) as a proxy. As shown in Figure 6, this index has dramatically shot up over the last couple of years, reflecting the high performance of real estate companies, and investors’ strong demand for their shares.2
Figure 5. Credit to the Economy (2002=100)
50
100
150
200
250
300
2002 2003 2004 2005 2006 2007
Working capital credit Investment credit Real estate credit Consumption credit
Figure 6. Evolution of Real-Estate Stock Market Index
0
10,000
20,000
30,000
40,000
50,000
60,000
70,000
1997Q1
1997Q3
1998Q1
1998Q3
1999Q1
1999Q3
2000Q1
2000Q3
2001Q1
2001Q3
2002Q1
2002Q3
2003Q1
2003Q3
2004Q1
2004Q3
2005Q1
2005Q3
2006Q1
2006Q3
2007Q1
2007Q3
Sources: BAM; and Casablanca Stock Exchange
The relationship between credit and real estate prices is multifaceted, with effects on both demand and supply. The real estate “boom” was partly fueled by an increase in demand from non-residents linked to a pick-up in foreign direct investment from Gulf countries and the implementation of the government’s ambitious tourism strategy, which calls for a sizeable increase in the country’s hotel capacity. Rising real estate has increased the wealth of homeowners leading to heightened demand for loans to finance consumption and investments. Furthermore, rising collateral values increased the ability of homeowners to borrow. On the supply side, rising real estate prices have led to a loosening in lending practices reflecting wider availability of public guarantees, increased collateral values, and the expectation of continuously rising real estate prices. Mortgage products have evolved: variable-rate mortgages now represent close to half of outstanding mortgages, against a little over a quarter four years ago, average mortgage maturities have lengthened, and loan-to-value ratios have increased, with the share of loan-to-value ratios above 90 percent, almost doubling in the last two years and reaching 76 percent in 2007.
2 An important caveat to the use of this index is its shallowness, since it is comprised of only 3 companies (out of a total of 73 listed on the CES), representing 16 percent of total stock market capitalization at end-2007.

7
III. LITERATURE REVIEW
In their seminal paper, Madala and Nelson (1974) discuss the appropriate use of maximum likelihood method to estimate disequilibrium models. This approach has become popular in the “credit crunch” literature, which has focused mostly on advanced economies.
Previous studies of credit demand and supply have varied from simple time-series regression analyses, to panel regression models, and disequilibrium models. Variables used on the demand side have included forward-looking variables reflecting expected performance of the corporate sector and the real economy and contemporaneous macroeconomic and financial variables such as interest rates, inflation, industrial production, investments, real GDP, and output gap. On the supply side, explanatory variables have included financial variables on the banking and corporate sectors such as corporate net worth, stock market prices, risk premia, and banks’ lending capacity, as well as macroeconomic variables such as interest rates, industrial production, real GDP, and output gap.
For example, Bernanke, Lown, and Friedman (1991) conclude, using both state-level data and data on individual banks, that bank equity capital limited banks’ credit supply, supporting the credit crunch episode in the US. They also find that the slowdown in credit demand also contributed to the credit crunch, as evidenced by the weakening of borrowers’ balance sheets.
The results of Blundel-Wignall and Gizycki (1992) do not support the existence of credit rationing for business loans in Australia over the period of credit liberalization, as the authors contend that credit risk for corporate clients was reflected in normal variations in the risk premia attached to lending rates, rather than by direct rationing. The corporate credit supply and demand were mostly influenced by forward looking variables reflecting expected performance. For example, credit supply was mostly affected by corporate net worth, risk premia, and bank equity prices. Credit demand on the other hand was affected by expected investment volumes, inflation, and earnings- to- price ratios of the corporate sector.
Pazarbasioglu (1996) also estimated demand and supply of credit in a disequilibrium framework, to determine whether there was a credit crunch in Finland. The paper found that the decline in credit was driven by a decline in demand due to the high indebtedness of borrowers during the crisis. It also found that credit supply decreased in times of asset quality decline, as well as banks’ need to increase capital adequacy. The paper used as explanatory variables for the supply function, total deposits and capital (as a proxy for lending capacity), relative stock market performance of banks, lending rates, and market capitalization (as a proxy for the corporate sector’s performance), interest rate spreads (as a proxy for alternative investments for banks), inflation, and the volatility of banks’ equity prices. As regards the demand model, the explanatory variables included lending rates, inflation, industrial production, and investments. The lending rate and expected investment appeared to be the most influential factors for the demand model. As for the supply model, lending capacity, lending rate, banks’ financial performance, and interest rate spreads all appeared to be significant.

8
Woo (1999) tests for the existence of a credit crunch in Japan through a panel regression model using banks’ capital, nominal GDP growth, nominal interest rates on new loans, and corporate cash flows as explanatory variables. The findings reject the existence of a credit crunch, and “surprisingly” support evidence of a strong negative correlation between banks’ capital and credit growth.
Nehls and Schmidt (2003) use a similar disequilibrium model to Ikhide, Ghosh and Ghosh, and Pazarbazioglu to test for the existence of a credit crunch in Germany in 2001. The credit demand function used interest rates and real GDP as explanatory variables, and the credit supply function included interest rates, lending capacity proxied by deposits plus banks’ equity capital, stock market prices, and interest rate spreads (between loans and deposits). Their findings substantiated the existence of a credit crunch since the beginning of 2001, with the slump in corporate profits as evidenced by stock market prices declines, being the driving factor behind the decline in credit supply.
The first notable application of the disequilibrium method to emerging market economies is found in Ghosh and Ghosh (1999). In their analysis to determine whether there was a credit crunch (i.e. interest rates do not clear demand and supply and the observed credit is constrained by supply) in East Asia, Ghosh and Ghosh used a disequilibrium model in three East Asian crisis countries: Indonesia, Korea, and Thailand during 1997-98 using a maximum log likelihood framework. Ghosh and Ghosh did not find evidence of a credit crunch or supply rationing in the three countries. Ghosh and Ghosh used lending capacity, interest rates, and industrial production as variables for the supply model, and interest rates, industrial production, stock market prices, output gap, and inflation, as explanatory variables in the supply function. They found that banks’ lending capacity was positively correlated with credit and was the most influential variable in the credit supply model. As for the demand function, they found that industrial production was the most significant explanatory variable with a positive significant coefficient implying that demand for credit is highly correlated with macroeconomic performance. Their general finding rejected the existence of a credit crunch in East Asian crisis countries in 1997-98.
More recently, Ikhide (2003) provides evidence of a credit crunch in Namibia using a maximum log likelihood disequilibrium framework. The supply of credit was assumed to depend on banks’ lending capacity, interest rates, economic activity and expectations (stock market prices, expected inflation, and real income) and current prices. The demand for credit was assumed to depend on expected income, output gap, and expected inflation. This study showed that interest rates and unexpected inflation were weakly correlated with demand for credit, but that expected income was the single most significant macroeconomic variable. Banks’ lending capacity, as proxied by deposits, was the most prominent factor behind credit supply. The paper concluded that credit supply was the binding constraint behind credit growth, and found evidence of a credit crunch.

9
IV. ESTIMATION STRATEGY
To test our assumption that the supply of credit has been the “rare” factor constraining credit growth in the first half of the decade, and investigate the reasons behind the recent surge in credit, we use a disequilibrium framework common in the “credit crunch” literature described above. Our model consists of three equations: a demand and supply equations and a “short-side rule” equation. This equation allows for the possibility that, in the presence of rigidities, the interest rate does not fulfill its market-clearing function, so that the actual amount of credit observed is not the (unobservable) equilibrium amount, but rather the minimum of credit demanded and credit supplied.
In its simplest form, our model can be written as:
'1 1 1
dt t tC X uβ= + (1)
'2 2 2
st t tC X uβ= + (2)
min( , )d st t tC C C= (3)
Where dtC and s
tC are the unobservable quantities demanded and supplied at period t,
respectively, 1X and 2X are explanatory variables that influence dtC and s
tC , respectively,
1β and 2β are parameters, and tC is the quantity of credit observed at time t. Assuming u1 and u2 are independently and normally distributed , with variances σ1 and σ2 respectively, and defining :
( )2'1 1 12
11
1 1( ) exp22t t tf C C Xβσπσ
⎡ ⎤= − −⎢ ⎥
⎣ ⎦
' 22 2 22
22
1 1( ) exp ( )22t t tf C C Xβσπσ
⎡ ⎤= − −⎢ ⎥
⎣ ⎦
' 21 1 12
11
1 1( ) exp ( )22 t
d dt t t tC
F C C X dCβσπσ
∞ ⎡ ⎤= − −⎢ ⎥
⎣ ⎦∫
' 22 2 22
22
1 1( ) exp ( )22 t
s st t t tC
F C C X dCβσπσ
∞ ⎡ ⎤= − −⎢ ⎥
⎣ ⎦∫
If tC is determined by the demand equation, the conditional density of tC is given by::
1 2( ). ( )( )
t td st t
f C F Cpr C C<
If tC is determined by the supply equation, the conditional density of tC is given by:

10
2 1( ). ( )1 ( )
t td st t
f C F Cpr C C− <
Since tC lies on the demand equation with probability pr( dtC < s
tC ) and on the supply equation
with probability1-pr( dtC < s
tC ), the unconditional density of tC is:
' ' 1 2 2 11 2
( ( ). ( )) ( ). ( )( | , ) ( ) (1 ( ))( ) 1 ( )
d s d st t t tt t t t t t td s d s
t t t t
f C F C f C F Cf C X X pr C C pr C Cpr C C pr C C
⎡ ⎤ ⎡ ⎤= < + − <⎢ ⎥ ⎢ ⎥< − <⎣ ⎦ ⎣ ⎦
(4)
Hence,
[ ]' '1 2 1 2 2 2( | , ) ( ). ( ) ( ). ( )t t t t t t tf C X X f C F C f C F C= +
If L is the log-likelihood, then:
[ ]1 2 2 21
log ( ). ( ) ( ). ( )n
t t t tt
L f C F C f C F C=
= +∑ (5)
We estimate our model on quarterly data for the period 1997Q3 to 2007Q4. Because of the small sample size, and in view of the relative scarcity of robust quarterly data on the Moroccan economy, we chose a fairly parsimonious specification. Real demand of credit is assumed to depend on the real interest rate, economic activity and real estate prices (deflated by inflation). In the absence of a robust time series on banks’ actual lending rates, we use the one-year Treasury bill rate as a proxy. As a robustness check, we also use the money market rate as an alternative proxy for interest rates. 3 Lending rates are expected to be negatively correlated with credit demand. We use the energy production index as our proxy for current economic activity; because energy production is not expected to be strongly correlated with the supply of credit, the choice of this variable is also meant to ensure that our demand equation is properly identified. As discussed above, we use the stock market real-estate index as our proxy for real estate prices; As a robustness check, we also estimated a model using the overall stock market index to assess whether the price of financial assets, rather than real estate assets, have a stronger influence on credit demand.
As regards real supply of credit, we expect it to be also positively correlated with both our real interest rate and real estate prices proxies. Therefore, the real interest rate and real estate prices also appear in our supply equation. Banks’ deposits in Morocco are mostly inelastic to interest rates since they are for the most part unremunerated sight deposits, so that, ceteris paribus, higher interest rates are expected to increase banks’ profitability, and therefore be positively correlated with the quantity of credit supplied. However, as discussed in Stiglitz and Weiss
3Using risk-free assets to proxy the interest is obviously problematic, as they do not reflect possible changes in the risk-profile of borrowers over time. Ideally, we would have liked to use the marginal lending rate (i.e. the interest rate on now loans for each quarter) as our price variable; however, such data are not available on a quarterly basis for the period we are looking at.

11
(1981), interest rates could also be negatively correlated with credit supply due to the adverse selection effect deriving from asymmetric information between borrowers and lenders inherent in credit markets. Therefore the sign of interest rates in the supply equation is ambiguous. The coefficient on real estate is expected to display a positive sign, primarily because of the importance of real estate as collateral for bank loans. Collateralized loans are less subject to adverse selection and moral hazard problems that often hinder the expansion of non-collateralized bank lending (Catão, 1997). The liquidity of the real estate market in Morocco, and improvements in the operational environment including in the legal system, also increase the attractiveness of real estate as collateral.4
Our supply equation is identified by the inclusion of a proxy of banks’ capacity to lend, which should also be positively correlated with credit supply. We approximate banks’ lending capacity by subtracting required reserves from total deposits. Conceptually, the maximum banks can lend is the excess capital over minimum required regulatory capital plus deposits after complying with reserve requirements. However, historical data on capital adequacy ratios (CAR) were not available, so the assumption is that banks pursue maximum profitability and do not hold excess capital. This assumption is not unrealistic since Moroccan banks’ CARs were not significantly above the minimum regulatory CAR in 2007.
One issue for our estimation strategy is the stationarity of our data, as all our variables have at least one unit root (Appendix I). Because of our sample size, we did not attempt to use an error-correction framework. Rather, we decided to estimate the model in levels, following the argument discussed in Ghosh and Ghosh (1999), who argue that is legitimate to estimate the model in levels as long as the determinants of credit supplied and credit demanded form a cointegrating vector. This is done by checking that our estimated supply of, and demand for, credit are cointegrated with observed credit (see Appendix II).
V. ESTIMATION RESULTS
Using the Marquardt iterative approach, we estimated the log-likelihood function in equation 4 on quarterly data over the period 1997Q3-2007Q4. All variables, except for the interest rates, are expressed in logarithms. Table 1 summarizes our results.
The first result is that the interest rate variable is never significant. While striking, this result is similar to the finding of other papers in the literature where interest rate turns out insignificant or weakly insignificant (Ghosh and Gosh, Ikide). The most plausible explanation is that neither
4 We would have liked to include the ratio of non-performing loan to total loans in our equation as a proxy for creditworthiness; however this variable is not available on a quarterly basis. We could also have included credit to the government to account for the possibility of crowding-in; however, this effect is unlikely to have played an important role in credit market developments in Morocco, as shown by the small (and positive) correlation between credit to the government and credit to the private sector (in percent of GDP).

12
of the variables we use—the one-year Treasury bill rate or the money market rate—is a good proxy for the underlying variable of interest, the lending rate. Available data suggests that this could be due to the fact that the decline in interest rates was passed through to lending rates only partially, and with a lag, confirming the existence of price rigidities in the credit market. It could also be due to structural breaks in the relationship between lending rates and Treasury bill rates. The results for other variables are in line with expectations: the elasticity of credit supplied to banks’ lending capacity is very strong and varies between 0.7 and 0.9 depending on the specifications, and the elasticity of credit demanded to economic activity, as proxied by the energy index, is about 0.5 in the most plausible specifications.
Supply Equation Coef. Std error Coef. Std error Coef. Std error Coef. Std error
C 2.42** (0.80) 2.14* (1.24) 0.60 (0.43) 1.97** (0.43)Real interest rate (Treasury bill) 0.25 (0.88) ... ... 0.60 (0.66) -0.59 (1.04)Real interest rate (Money market) ... ... 0.38 (0.46) ... ... ... ...Log(real lending capacity) 0.74** (0.08) 0.77** (0.13) 0.88** (0.05) 0.84** (0.03)Log(real estate index) 0.08** (0.02) 0.07** (0.04) ... ... ... ...Log(stock market index) ... ... ... ... 0.09** (0.04) ... ...
Demand Equation
C 8.08** (0.71) 7.97** (0.85) 7.54** (2.78) 7.98** (3.10)Real interest rate (Treasury bill) 0.00 (2.96) ... ... -3.21 (3.80) -0.53 (6.38)Real interest rate (Money market) ... ... -0.32 (1.93) ... ... ... ...Log(energy production index) 0.48** (0.03) 0.39** (0.21) 0.69 (0.62) 0.90 (0.60)Log(real estate index) 0.22** (0.06) 0.28** (0.03) ... ... ... ...Log(stock market index) ... ... ... ... 0.19 (0.26) ... ...
Log-likelihood -49.06 -53.10 -53.25 -55.07Akaike information criterion 2.72 2.91 2.92 2.91** denotes significance at the 95% level; * denotes significance at the 90% level.
(4)
Summary of Results
(1) (2) (3)
Our results also confirm the important role played by the recent increase in asset prices in credit market developments; as evidenced in specification (4), the model behaves much more poorly when these variables are excluded. Our estimates of the supply schedule do not significantly differ when the overall stock market index, rather than the real-estate sector share index, is used to proxy asset prices. In both cases, the (positive) elasticity of credit supplied to a change in asset prices is around 0.08. The results are very different for the demand function, perhaps unsurprisingly in view of the importance of real estate collateral in the lending process and of the recent sharp growth in real estate credit. In this case, our results fail to show a significant impact of the overall stock market index on the demand for credit, whereas our proxy for real estate prices is strongly significant in both equations (1) and (2), with an estimated elasticity of 0.20 and 0.24, respectively. In other words, while the impact of the increase of real estate prices on the amount of credit the banks are willing to supply has been high, its impact has been two to three times higher on the demand for credit, which is consistent with the existence of a wealth

13
effect of real estate prices5. These results are also consistent with the idea that the development of mortgage products, spurred in part by increasing prices, strongly stimulated the demand for credit.
Our preferred specification was equation (1) based on the log-likelihood results, but we show other specifications (equations 2-4) for robustness purposes.6 Our results also enable us to identify periods of excess demand and excess supply, as illustrated in figure 7 (equation (1)). Our results do not support the assumption that there was large excess credit demand in the first half of the decade; indeed, in the 32 quarters between 2000Q1 and 2007Q4, about 60 percent were identified as characterized by excess supply. The trend reversed more conspicuously in late 2006, when demand strongly outpaced supply. The estimated disequilibria were rather small before end-2006, averaging about 2 percent of actual credit (Figure 8), but markedly increased thereafter.
Figure 7. Real Credit Supplied, Demanded and Actual(in MAD billions)
0
50
100
150
200
250
300
350
400
450
1997
Q3
1998
Q1
1998
Q3
1999
Q1
1999
Q3
2000
Q1
2000
Q3
2001
Q1
2001
Q3
2002
Q1
2002
Q3
2003
Q1
2003
Q3
2004
Q1
2004
Q3
2005
Q1
2005
Q3
2006
Q1
2006
Q3
2007
Q1
2007
Q3
Demand Supply Actual
5 While the endogeneity of real estate prices could pose an econometric issue, anecdotal evidence shows that the surge of real estate prices in Morocco has been partly driven by capital inflows, and demand for high-end secondary homes by Europeans.
6 We also tried to use the ratio of the real-estate-related stock market index to the overall stock market index as a proxy for real estate prices, but the results were not significantly different from those presented in column (1).

14
Figure 8. Excess Demand and Supply, 2000-07 (in percent of actual credit)
-8.0
-6.0
-4.0
-2.0
0.0
2.0
4.0
6.0
8.0
10.0
12.0
2000
Q1
2000
Q3
2001
Q1
2001
Q3
2002
Q1
2002
Q3
2003
Q1
2003
Q3
2004
Q1
2004
Q3
2005
Q1
2005
Q3
2006
Q1
2006
Q3
2007
Q1
2007
Q3
Excess Demand
Excess Supply
While somewhat at odds with the widespread perception of credit “rationing” in the first half of the decade, our results may not be as surprising as they may seem at first. First, macroeconomic improvements typically take time to translate into an increase in consumption, investment, and hence an increase in demand for credit. The impact of improved policy credibility also takes hold with a lag, especially in traditionally cash-based economies such as Morocco, where the credit culture has evolved only progressively. Moreover, prior to the increase in asset prices, several borrowers did not hold the necessary collateral to apply for credit, so they were either deterred from applying (demand effect) or turned down (supply effect).
VI. CONCLUDING REMARKS
In this paper, we use an explicit disequilibrium framework common in the “credit crunch” literature to examine first whether the slow growth in credit during the first half of the decade–at a time when liquidity in the banking sector was rapidly expanding—can be attributed to a form of credit rationing, and, second, to investigate the role played by the sharp increase in asset prices in the recent acceleration in the pace of credit growth. Our results do not support the hypothesis of credit rationing in the first half of the decade. They do however provide evidence that the recent sharp increase in real estate prices have strongly stimulated both supply and demand for credit, with a substantially stronger effect on the latter, possibly reflecting pent-up demand.

15
Short-time series and limited quarterly data are important caveats to our results. The lack of variation of interest rates in Morocco makes it difficult to select a good price variable, and may explain why the model fails to pick up a significant role for the interest rate variable in credit decisions. However, similar results were found in other papers on some emerging credit markets. Further, recent structural changes may not be captured by the historical relationship of the model. Finally, the possible endogeneity of real estate prices may impart a bias on our estimates, mitigated however by the use of stock market indices as proxies for these prices. Further research could use forward-looking variables reflecting expectations, real estate price index when available, and corporate earnings variables.
Looking forward, the strong increase in credit growth—and the potential build-up of imbalances between credit supplied and demanded—calls for renewed vigilance on the part of supervisory authorities. While credit growth in Morocco has not been accompanied by the signs of overheating observed during similar episodes in several transition countries, a large share of the growth has been in consumer and housing loans and was accompanied by soaring real estate prices, potentially exposing the system to important losses should this trend be reversed. In this context, the central bank’s decision to ensure banks’ compliance with the newly adopted code of good practices on mortgages, which includes fuller disclosure of risks to prospective borrowers, and the soon-to-be established credit bureau are good steps forward. Although not explicitly directed at real estate lending, the recent increase in the minimum bank CAR from 8 percent to 10 percent will also strengthen the system, and bring it closer to best practices in emerging markets.
The unfolding of the global financial crisis calls for renewed vigilance: while credit growth had not slowed down significantly as of end-December 2008, there is some anecdotal evidence of a softening in real estate prices—corroborated by the significant drop in the real-estate sector stock index, which fell by 20 percent between end-September and end-December 2008. Looking forward, to limit potential fall-out from asset price volatility, Morocco’s central bank should take more account of asset prices in monetary policy decisions—a key lesson from the ongoing crisis.

16
Appendix I. Unit Root Tests
Level First Difference
Log(real credit to the private sector) 2.01 -2.74*Real interest rate (Treasury bill) -1.53 -7.44**Real interest rate (Money market) -1.47 -7.38**Log(real lending capacity) 1.66 -6.00**Log(real estate index) 0.76 -4.45**Log(stock market index) -0.36 -3.83**Log(energy production index) -0.29 -2.88*The lag length is determined based on the Scwarz information criterion.** denotes significance at the 1% level; * denotes significance at the 10% level.
Unit Root TestsAugmented Dickey-Fuller Statistics
Significant coefficients of the first differences of the time series reflect the existence of a unit root.
17
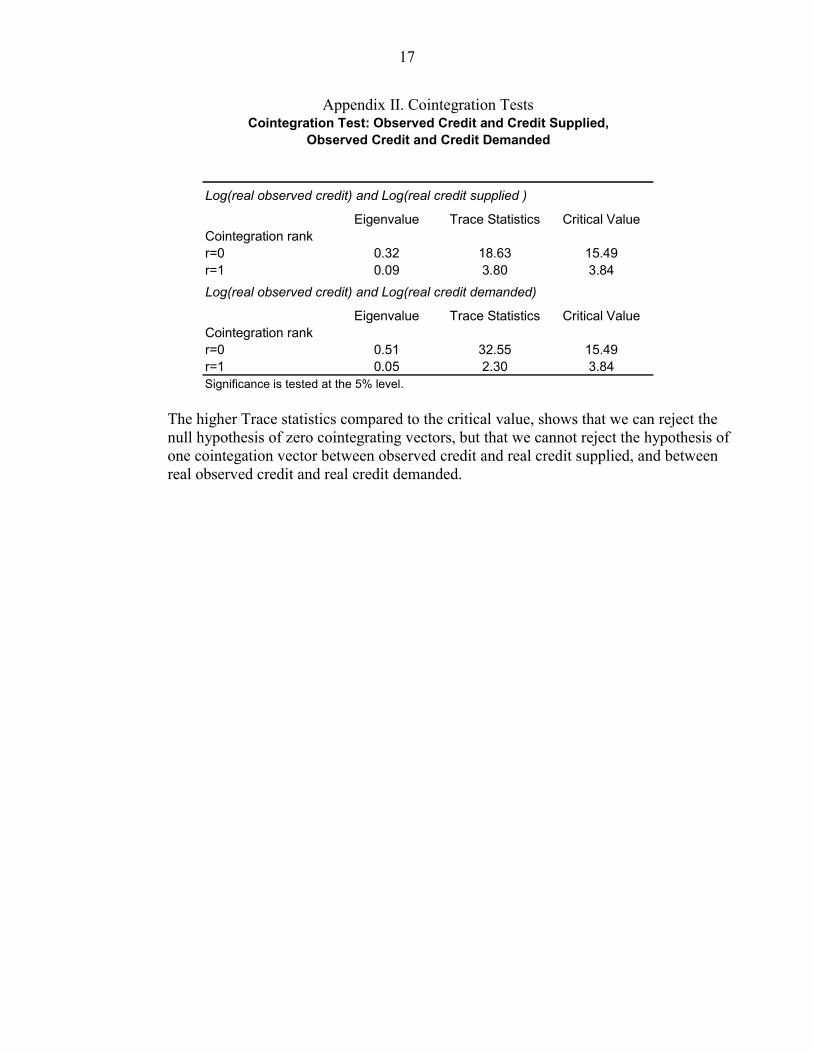
Appendix II. Cointegration Tests
Log(real observed credit) and Log(real credit supplied )
Eigenvalue Trace Statistics Critical ValueCointegration rankr=0 0.32 18.63 15.49r=1 0.09 3.80 3.84Log(real observed credit) and Log(real credit demanded)
Eigenvalue Trace Statistics Critical ValueCointegration rankr=0 0.51 32.55 15.49r=1 0.05 2.30 3.84Significance is tested at the 5% level.
Cointegration Test: Observed Credit and Credit Supplied,Observed Credit and Credit Demanded
The higher Trace statistics compared to the critical value, shows that we can reject the null hypothesis of zero cointegrating vectors, but that we cannot reject the hypothesis of one cointegation vector between observed credit and real credit supplied, and between real observed credit and real credit demanded.

18
References Agénor, P.R., J. Aizeman, and A. Hoffmaister, 2000, “The Credit Crunch in East Asia: What Can Bank Excess Liquid Assets Tell Us?” NBER Working Paper 7951. Bernanke, B., C. Lown, and B. Friedman, 1991, “The Credit Crunch,” Brookings Papers on Economic Activity, Vol. 1991, No. 2., pp. 205-47. Blundell-Wignal, A., and M. Gizycki, 1992, “Credit Supply and Demand and the Australian Economy,” Research Discussion Paper 9208 (Australia: Reserve Bank of Australia). Catão, L., 1997, “Bank Credit in Argentina in the Aftermath of the Mexican Crisis: Supply or
Demand Constrained?” IMF Working Paper 97/32 (Washington: International Monetary Fund).
Cottarelli, C., G. Dell’Ariccia, and I. Vladkova-Hollar, 2003, “Early Birds, Late Risers, and
Sleeping Beauties: Bank Credit Growth to the Private Sector in Central and Eastern Europe and the Balkans,” IMF Working Paper 03/213 (Washington: International Monetary Fund).
Davidson, R., and J. MacKinnon, 1981, “Several Tests for Model Specification in the Presence of Alternative Hypotheses,” (Econometrica, Vol.49, No.3, pp. 781-93).
Ghosh, S., and A. Ghosh, 1999, “East Asia in the Aftermath: Was There a Crunch?” IMF Working Paper 99/38 (Washington: International Monetary Fund). Hilbers, P., and Others, 2005, “Assessing and Managing Rapid Credit Growth and the Role of
Supervisory and Prudential Policies” IMF Working Paper 05/151(Washington: International Monetary Fund).
Ikide, S., 2003, “Was There a Credit Crunch in Namibia Between 1996-2000?” Journal of Applied Economics, Vol. VI, No. 2, pp. 269-90. Maddalla, G.S., and F. Nelson, 1974, “Maximum Likelihood Methods for Models of Markets in Disequilibrium,” (Econometrica, Vol. 42, No.6, pp. 1013-30). Nehls, H., and T. Schmidt, 2003, “Credit Crunch in Germany?” RWI: Discussion Papers, No.6. Pazarbasioglu, C., 1996, “A Credit Crunch? A Case Study of Finland in the Aftermath of the
Banking Crisis,” IMF Working Paper 96/135 (Washington: International Monetary Fund).
Stiglitz, J.E., and A. Weiss, 1981, “Credit Rationing in Markets with Imperfect Information,” American Economic Review, Vol. 71, No.3, pp. 393-410. Woo, D., 1999, “In Search of “Capital Crunch” Supply Factors Behind the Credit Slowdown in Japan,” IMF Working Paper 99/3 (Washington: International Monetary Fund).


