Credit Quality, Information Asymmetry, and the Source of Corporate Debt: Evidence from New Debt Issues * Vassil Mihov Krannert Graduate School of Management 1310 Krannert Building Purdue University West Lafayette, IN 47907-1310 Tel.: (765) 494-4393 E-mail: [email protected]http://expert.cc.purdue.edu/~mihov/ Current version: April 15, 2000 JEL classification codes: D82, G21, G32 Keywords: Bank monitoring, public debt, private placements, pecking order, debt maturity * This paper is derived from my Ph.D. dissertation at Purdue University. I am indebted to Dave Denis, Diane Denis and John McConnell for many valuable comments and suggestions. I would also like to thank the seminar participants at Concordia University, Purdue University, Santa Clara University, Texas Christian University, Texas Tech University, York University, and the University of North Carolina at Chapel Hill for their helpful comments. This research was supported by a grant from Purdue Research Foundation.
Transcript
Credit Quality, Information Asymmetry, and the Source of Corporate Debt: Evidence from New Debt Issues*
Vassil Mihov
Krannert Graduate School of Management 1310 Krannert Building
Current version: April 15, 2000 JEL classification codes: D82, G21, G32 Keywords: Bank monitoring, public debt, private placements, pecking order, debt maturity
*This paper is derived from my Ph.D. dissertation at Purdue University. I am indebted to Dave Denis, Diane Denis and John McConnell for many valuable comments and suggestions. I would also like to thank the seminar participants at Concordia University, Purdue University, Santa Clara University, Texas Christian University, Texas Tech University, York University, and the University of North Carolina at Chapel Hill for their helpful comments. This research was supported by a grant from Purdue Research Foundation.
Credit Quality, Information Asymmetry, and the Source of Corporate Debt: Evidence from New Debt Issues
Abstract
In this study I investigate empirically the choice of new public debt, bank debt, and non-bank private debt financing for a sample of 1,560 debt financings. Unlike previous studies, I analyze the determinants of new debt, rather than studying the firm’s existing debt mix, because debt issues are large, very infrequent events. This approach allows me to link contemporaneously the decision about the source of new debt to firm characteristics that tend to vary significantly over time. I find that the probability of issuing public debt is positively related to firm size, credit rating, the ratio of fixed assets to total assets, and the firm’s profitability. Conversely, the probability of borrowing from private, non-bank sources is negatively related to profitability and credit rating, and positively related to the firm’s ex-ante probability of default. Firms with lower managerial ownership tend to issue public debt, even after controlling for firm size. I document that the source and maturity of corporate debt have common determinants and control for their simultaneous choice using a two-stage regression model. Overall, my findings support theories of debt choice that are based on information asymmetry and bank monitoring, borrower’s reputation, and efficient renegotiation. I argue that the findings also indicate that the choice between private and public debt is an integral part of the more general question about the source of firm financing in the context of the pecking order theory.
1
1. Introduction
Previous theoretical research has studied the differences between public and private corporate debt.
Various authors have hypothesized that private debt financing has a significant advantage over public debt
in terms of efficiency of monitoring of the borrower (Diamond (1984), Boyd and Prescott (1986), Berlin
and Loyes (1988)), access to private information (Fama (1985)), and efficiency of liquidation and
renegotiation decisions in financial distress (Chemmanur and Fulghieri (1994), Gertner and Scharfstein
(1991)). However, private lenders can also negatively affect the borrower by extracting rents and
distorting management incentives (Rajan, 1992).
Several empirical studies (Houston and James, (1996), Johnson (1997), Krishnaswami, Spindt and
Subramaniam, (1998)) document a positive relation between the use of public debt financing and firm
characteristics such as size, leverage, age, and amount issued. However, these studies differ in their
findings about the effects of the proportion of fixed assets to total assets and the market-to-book ratio on
the source of debt.
This study extends the literature on debt choice in several ways. First, I extend Myers’ (1984)
pecking order theory of firm financing to the choice between public and private debt. According to this
theory, a firm facing high costs of asymmetric information uses external financing only when internally
generated funds are unavailable, rather than to adjust a target debt structure. Then, it issues the “safest”
security first – the one whose value changes least when inside information is revealed to the market. I
argue that because private debt is usually senior, collateralized, and more informed, it is a safer instrument
relative to public debt. Thus, I hypothesize that if the pecking order theory is correct, firms with high costs
of asymmetric information will choose bank or other private debt before public debt.
Second, unlike prior empirical studies that focus on the proportions of existing debt in the firm’s
debt structure, I use an incremental approach that focuses on new debt issues. Because debt issues are
large, infrequent events, the firm’s mix of debt claims tends to be “sticky”, with large changes occurring at
2
discrete points in time.1 However, some of the firm characteristics that are hypothesized to affect the
choice of debt tend to vary significantly over time. Consequently, an incremental approach provides a
stronger test than a cross-sectional approach, by relating the hypothesized determinants of the debt source
contemporaneously to the new debt decision. Such an approach is similar to the one taken by Opler and
Titman (1994), who study the debt-equity choice, by Jung, Kim and Stulz (1995), who examine external
financing decisions, and by Guedes and Opler (1996), who study the determinants of debt maturity.
Using the incremental approach, I examine a sample of 1,560 new debt financings made by 1,480
public companies in 1995 and 1996. I further extend the prior literature on the choice between private and
public debt by making an empirical distinction between bank and non-bank private debt. I find that firms
that borrow from non-bank private lenders tend to be the poorest performers, have the lowest credit rating,
and the highest ex-ante probability of default. Conversely, public borrowers are larger in firm size, have
higher credit rating, a higher proportion of fixed assets relative to total assets, and are more profitable,
relative to both bank and non-bank private lenders. The probability of issuing public debt is positively
related to firm size, credit rating, the ratio of fixed assets to total assets, and the firm’s profitability. The
probability of borrowing from private non-bank sources is negatively related to profitability and credit
rating, and positively related to the firm’s ex-ante probability of default. I interpret my findings as
supporting theories of debt choice that are based on information asymmetry and bank monitoring, credit
quality, and efficient renegotiation, and as consistent with the prediction of the pecking order theory. The
evidence about the latter suggests that the choice between private and public debt financing is an integral
part of the more general question about the capital structure of the firm.
The evidence also indicates that the market for private non-bank debt, that has been typically
ignored by the theoretical literature and most empirical studies, complements the bank and public sources
1 For example, Mikkelson and Partch (1986) document that the implied probability of a firm issuing debt in a given year is less than 15% for a sample of industrial firms listed on the NYSE and AMEX. James (1987) finds an even lower probability (less than 7%) using a broader sample. New debt issues are also very substantial in size. In
3
of borrowing and plays an important role in accommodating the firms with the lowest credit and project
quality. Unlike some prior studies, however, I do not find a significant relation between measures of future
growth opportunities and the choice of debt source.
An additional contribution of this paper is its examination of the role of managerial discretion in
the firm’s new borrowing decisions. I argue that private lenders constrain overinvestment and are a
potential turnover threat to management through imposing restrictive loan covenants, direct control of a
firm’s day-to-day financing, and board representation. In this context, I test the hypothesis that firms with
lower management ownership tend to avoid bank or private sources of debt, in favor of public debt.
Consistent with this hypothesis, I find higher levels of management stock ownership in companies that
borrow from banks or privately, even after controlling for firm size effects.
Finally, I study the relation between the choice of debt source and debt maturity. I use a two-stage
estimation approach to control for the simultaneous choice of debt source and maturity and find that the
choice of debt significantly affects the choice of maturity, in addition to factors such as firm size, leverage,
and credit quality.
The remainder of the paper is organized as follows. In Section 2, I review the hypotheses
associated with existing theories about the determinants of debt choice and summarize the prior empirical
evidence. In Section 3, I describe the data and the methodology. Section 4 reports the empirical results
regarding the determinants of the source of new debt. Section 5 discusses the relation between the choice of
debt and the capital structure of the firm. Section 6 discusses the relation between the source and maturity
of the debt issues. Section 7 concludes the paper.
the sample studied here, the median amount borrowed is $120 million, which is nearly 15% of the market value of the firm, 24% of the book value of its total assets, and 80% of its existing total debt.
4
2. Theories of Debt Choice and Testable Hypotheses
In this section I outline the hypotheses associated with various theories about the determinants of
debt choice and summarize prior empirical evidence.
2.1. Public vs. Private Debt
The main focus of previous theoretical research have been the differences between private and
public debt financing with respect to three general factors: asymmetric information between the firm and
the market, the efficiency in resolution of default, and the importance of growth opportunities.
2.1.1. Asymmetric Information and Bank Monitoring
The early theoretical work on intermediation focuses on the differences between private and public
debt financing with respect to the cost and efficiency of monitoring the borrower. Diamond (1984), and
Boyd and Prescott (1986), propose that bank lending mitigates the moral hazard problem that a borrower
faces in an economy characterized by asymmetric information. Monitoring is most effective and least
costly if performed by a financial intermediary for two reasons. First, it avoids the duplication of effort
that characterizes monitoring by atomistic public debtholders. Second, free-rider problems reduce the
incentive for public debtholders to monitor. The access to proprietary information that results from the
bank’s on-going business relationship with the borrower has been further emphasized by Fama (1985), who
argues that banks have a competitive advantage in monitoring relative to arm’s length investors or even
other private monitors. Collectively, the above theories predict that firms with a higher degree of
information asymmetry will borrow privately, while firms with lower information problems will prefer
public debt.
In the spirit of the asymmetric information literature, Diamond (1991) and Rajan (1992) develop
models that emphasize the importance of the borrower’s reputation and project quality. Both models
predict a non-monotonic relation between firm quality and debt source: highest quality firms issue public
5
debt, medium quality firms borrow from banks, while for low quality firms the costs of bank monitoring
outweigh the benefits, and they issue public debt.
Diamond argues that monitoring induces borrowers to establish and maintain a reputation for
creditworthiness in exchange for more favorable credit terms. In the absence of monitoring, risky
borrowers are subject to moral hazard, choosing risky negative net present value projects. Monitoring,
however, creates an incentive for risky firms to make the optimal investment decisions. Thus, firms with
sufficiently high rating are expected to issue public debt, at a lower interest rate; borrowers with medium
credit ratings choose to borrow privately; if the credit rating is very low, monitoring is not worth the cost,
and the low-rated firms will issue (low-grade) public debt.
Rajan (1992) focuses on both the benefits and costs of bank debt. The primary cost of bank debt
comes from bank’s control over the investment decisions through refusing to roll over loans and the ability
to expropriate residual surplus. Arm’s length lenders, on the other hand, are unable to monitor and,
therefore, price up front the possibility of the continuation of bad projects. In Rajan’s model, project
quality determines the source of debt. The benefit of bank monitoring decreases with the quality of a firm’s
project, therefore, high quality firms are predicted to issue public debt. For intermediate quality firms, the
benefits of bank monitoring outweigh the distortion of effort, therefore such firms are predicted to issue
bank debt over arm’s length debt. For low quality firms, public debt is optimal relative to bank debt
because the bank’s distortion of borrower’s incentives is significant.
2.1.2. Efficiency of Liquidation and Renegotiations
Private and public debt differ significantly with respect to the efficiency of liquidation and
renegotiation. Berlin and Loyes (1988) examine the tradeoffs between the benefits of efficient liquidation
policy and the agency cost of bank monitoring. Their model predicts that firms with high credit rating will
use public debt with lenient covenants; firms with intermediate rating will use bank loans, while firms with
low ratings will issue public debt with harsh bond covenants. A similar prediction about the choice of
6
borrowing is obtained by Chemmanur and Fulghieri (1994). In their model the value of private debt is
derived from the bank’s ability to make an efficient liquidation/renegotiation decision in case of the
borrower’s financial distress. Banks are concerned about building a reputation for the right
liquidation/renegotiation policy and are willing to invest in monitoring. In the separating equilibrium, the
borrowers with a higher ex-ante probability of distress choose bank debt, while the borrowers with a lower
probability of distress borrow directly from the pubic at the lower equilibrium rate. For the latter, the
benefit of efficient renegotiation is small.
The existing regulatory setting also makes the flexibility of renegotiation different for bank and
other private debt relative to public debt. To comply with the Trust Indenture Act of 1939, firms must
receive the unanimous consensus of bondholders to alter any of the material terms in the bond indenture.
This can cause severe holdout problems for publicly traded bonds, which tend to be held by many
investors. The main source of inefficiency in public exchange offers is the coordination problem among the
numerous public debtholders (Gertner and Scharfstein, (1991)). Conversely, private debt is held in
concentrated positions by a few institutional holders that are not subject to similar regulatory requirements.
Gilson, John and Lang (1990) document a higher likelihood of private (and presumably less costly)
restructuring for firms that hold a higher proportion of bank debt to total debt. Therefore, the regulatory
setting, which determines the difference in the likelihood of efficient renegotiation, suggests that it is
optimal for borrowers with higher ex-ante probability of distress to borrow privately.
2.1.3. Costly Contracting and the Borrower’s Growth Options
Myers (1977) hypothesizes that firms financed with risky debt sometimes forego investment in
valuable projects, thereby reducing firm value (“the underinvestment problem”). He proposes that costly
renegotiation and monitoring, the use of restrictive covenants, and shortening of the debt maturity can
mitigate this problem. If firms maintain a "continuous, intimate and flexible relationship" (Myers, 1977, p.
159) with the lender, the optimal investment policy can be achieved by rolling over short maturity debt
7
claims. It is more likely that a firm can achieve such a relationship with banks and other private lenders
than with public debtholders, because private debtholders are much more concentrated and face fewer free-
rider problems than public debtholders. In addition, private debt typically has shorter maturity than public
debt. Thus, a testable hypothesis of the theory is that, in equilibrium, firms with higher future growth
opportunities will prefer bank and other private debt to public debt, and short-term debt to long-term debt.
2.2. The Choice between Private and Public Debt and the Pecking Order Theory of Corporate
Financing
One of the main theories about the source of firm financing is the Myers’ (1984) pecking order
theory. The pecking order theory is based entirely on the asymmetric information argument of Myers and
Majluf (1984). According to this theory, a firm facing high costs of information asymmetry will use
external funds only when internally generated funds are not available. Then, it will issue the “safest”
security first – the one whose value changes least when inside information is revealed to the market – first
debt, and only as a last resort, equity.2 The magnitude of the costs of information asymmetries is measured
on the scale spanned by internal equity (lowest costs) and external equity (highest costs). Debt as a whole
lies in-between, and even risky debt is “safer” than external equity.
One of the questions that this study attempts to answer empirically is whether the pecking order
preference extends to the choice between public and private debt as well. When comparing private and
public debt, their relative safety will determined entirely by their expected payoffs given the probability of
default, because both types of debt are fixed claims. Because private debt is more informed through
monitoring and screening, and is usually senior (Welch, (1998)) and collateralized, it will be safer than
arm’s length debt, holding constant the degree of information asymmetries between the firm and the outside
market.
2 Myers (1984) defines the “safety” of a security as the degree to which its value changes when inside information is revealed to the market.
8
If the pecking order hypothesis applies to firm financing in general, including the choice between
private and public debt, then a testable hypothesis of the theory is that firms with higher costs of
asymmetric information, and higher probability of default, will issue private debt before public debt. As
the degree of asymmetric information decreases, the scale of safety begins to collapse, and for the firms
with lower asymmetries the choice between private and public debt will be determined by additional factors
– such as transactions costs, the flexibility of covenants (Gilson and Warner, (1998)), and the possibility of
rent extraction by banks (Rajan, (1992)).
2.3. Bank Debt vs. Non-Bank Privately Placed Debt
The theoretical literature has typically not distinguished between bank debt and other private debt.
However, the two types of debt differ in terms of the concentration and identity of debtholders, regulatory
requirements, maturity, and placement structure. Kwan and Carleton (1995) study the financial
contracting of privately placed, non-bank debt. They describe the private contract as a tightly held,
relatively illiquid position. Being exempt from SEC registration, it has lower flotation costs. Covenants are
custom-designed for each borrowing situation. The private placement has both restrictive and affirmative
covenants, which require maintaining and reporting a certain standard of financial health. Carey, Post and
Sharpe (1998) use a large database of individual corporate loans to study the differences between lending
by banks and other finance companies. They fail to find significant differences in the role of the two types
of lenders play in resolving information asymmetry. They conclude that intermediaries in general, not
banks in particular, play a special role with respect to information production, although they find that
financial companies do appear to serve riskier borrowers.
A substantial portion of private debt is placed under SEC Rule 144a. The rule allows companies
to market their debt to private investors, often institutions, much more quicker than if the issue was going
to the public. Although 144a offerings cannot be offered directly to the public, individual investors
9
participate in them through mutual funds. Anecdotal evidence suggests that the junk-debt market
significantly overlaps with the market for privately placed debt under SEC Rule 144a.3 Debt issues under
Rule144a appear to combine some features of both bank loans and low-grade public debt. They offer the
flexibility of renegotiations in default, but avoid a potential direct day-to-day influence of a bank.4 Firms
with particularly valuable research and development projects may want to avoid sharing that information
with a bank for competitive reasons. As an extension of Rajan’s (1992) and Diamond’s (1991) predictions
about a non-monotonic relation between firm quality and the choice of debt, I hypothesize that the riskiest
firms, having lowest project quality and highest probability of bankruptcy may be screened out by both
banks and public debt market. Such firms will be the most likely candidates for private debt.
2.4. Managerial Discretion and the Source of Debt Financing
In this study I develop a hypothesis about the role of management discretion in the choice of debt
by focusing on the effect of debt on management incentives and investment decisions. I begin by presuming
that banks have a much greater disciplining effect on management than public debtholders. Welch (1998)
argues that banks can exert much greater influence and pressure on management than public debt because
banks are intrinsically better organized, maintain constant legal staff, hold more concentrated debt holdings
and have some control over the day-to-day liquidity of the firm. Berkovitch and Israel (1996) demonstrate
that it is sometimes optimal to allocate to debtholders control rights, such as the right to veto management
replacements if managerial turnover would increase the volatility of cash flows and increase the value of
equity (similar to a call option) at the expense of the debtholders. Their argument, however, could be
expanded to include management replacement initiated by debtholders, if in given instances, particularly
during poor performance and in financial distress, volatility of cash flows actually decreases with
3 See “Credit Markets: Privately Placed Junk Bonds Pass Public Offerings”, the Wall Street Journal, Monday, November 18, 1996. 4 See Gilson and Warner (1998).
10
management replacement, or the improvement in performance creates a sufficient increase in cash flows to
offset the negative effect of any increase in volatility. Although their theory does not distinguish between
private and public debtholders, it is more likely that private lenders will be able to use such control rights
effectively because of their higher concentration of debt holdings, lower probability of free-rider problems,
and better intrinsic organization.
Gilson (1989, 1990) provides evidence of direct bank involvement in management turnover. Ofek
(1993) finds that management turnover in poorly performing firms is positively related to the pre-distress
proportion of private debt. Examples of banks’ ability to influence corporate policy include selection of
directors and veto powers over investment and financing policies, particularly when there is a greater
probability of default.5
I hypothesize that, if banks and private lenders constrain overinvestment and are a potential
turnover threat, managers with lower ownership stakes in the company will be more likely to avoid private
debt and issue public debt. Berger, Ofek and Yermack (1997) test a similar hypothesis with respect to the
choice between debt and equity financing. Conversely, following the intuition of Zwiebel (1994),
entrenched managers might choose the closer monitoring and more restrictive bank debt as a credible signal
of their commitment to optimal investment policy.
2.5. Prior Empirical Studies on the Choice Between Public and Private Debt
Initially, the empirical literature on debt choice focused on the benefits of bank debt financing
(James (1987), Lummer and McConnell (1989), Hoshi, Kashyap and Scharfstein (1990, 1991)). More
recently, a number of studies focus on the empirical determinants of the choice between public and private
5 On several occasions in my sample, simultaneously with obtaining a loan the borrower appoints representatives of the lender to its board. One of the lenders required as a condition of the loan that the current CEO remains in place during the term of the loan, or otherwise in the event of CEO turnover the loan could be recalled. Gilson and Warner (1998) comment on the restrictiveness of bank loan covenants.
11
debt. These studies commonly employ a cross-sectional approach to studying the existing mix of public
and private debt.
Houston and James (1996) focus on the relation between proportions of bank debt relative to total
debt and firm growth opportunities within the context of bank rent extraction. Consistent with Rajan’s
(1992) prediction, they find a negative relation between growth opportunities and the proportion of bank
debt to total debt for firms with a single bank relationship, but a positive relation between growth
opportunities and the proportion of bank debt to total debt for firms with multiple bank relations. Larger
firms, more highly levered firms, and firms with higher coverage ratios also have lower ratios of bank debt
to total debt. Krishnaswami, Spindt and Subramaniam (1999) document that larger firms and firms with
larger issue sizes rely more heavily on public debt, while firms with higher growth opportunities (measured
by market-to-book ratio) use more private debt. Firms with higher information asymmetries, measured by
the residual standard deviation of stock returns, use more private debt.
Johnson (1997) is the only prior study that distinguishes between public debt, private non-bank
debt and bank debt. However, his study is still in the context of examining proportions of existing debt.
He finds that firm size and age are significantly positively related to the proportion of public debt and
negatively related to bank debt. The fixed assets ratio and leverage are positively related to the proportion
of public debt and bank debt and negatively related to private non-bank debt. The market-to-book ratio is
not related to the proportion of public debt, is positively related to the proportion of private non-bank debt,
and is negatively related to the proportion of bank debt. In addition, proportions of public debt are
negatively related to earnings growth volatility.
In a paper related to this study, Hadlock and James (1998) revisit the positive price reaction
associated with bank loan announcements that was previously documented by Mikkelson and Parch (1986),
James (1987), and Lummer and McConnell (1989). They argue that a positive reaction should be expected
only if public debt is a feasible alternative. To evaluate firm access to public debt markets they use a
logistic model to predict the likelihood of issuing public debt, conditional on new financing. The likelihood
12
of issuing public debt is positively related to firm age, size and leverage, and to the ratio of fixed assets to
total assets, and negatively related to the volatility of the firm’s daily stock returns. The likelihood of
issuing public debt is unrelated to the market-to-book ratio and the ratio of R&D expenditures to total sales
(although the proportion of existing public debt to total debt is decreasing in the importance of growth
opportunities).
Overall, the existing empirical literature has focused on the determinants of the existing debt mix of
the firm, thus implicitly assuming that the firm maintains a target private-to-public debt structure. The
studies have emphasized the importance of growth opportunities on debt choice, and to a lesser extent, the
cost of asymmetric information, flotation costs, and number of bank relations.6 Except for Johnson (1997),
the literature has not distinguished between bank and non-bank private debt, and there is little evidence on
the role of resolution of default, and firm credit quality in determining the debt choice.
3. Methodology and Data
In this section, I first present the methodology and the sampling technique used in the study, and
then describe the data.
3.1. Empirical Methodology
A common feature of most existing studies is their focus on the proportions of public, bank, and
other private debt to total debt in the firm’s existing debt structure. In this study I use an incremental
approach to investigate empirically the determinants of new debt issues, rather than the existing debt mix.
If firms maintained a target private-to-public debt ratio and adjusted it continuously in response to changes
in their economic environment, relating their existing ratio to variables that describe contemporaneously
that environment would allow making inferences about the hypothesized determinants of the debt mix.
6 However, the studies differ in their findings on the effect of growth opportunities on debt source.
13
However, consistent with the pecking order theory, new external financing decisions are large,
discrete, very rare events. For example, Mikkelson and Partch (1984), who study the publicly announced
external financings of a random sample of 360 industrial firms listed on the NYSE or AMEX during the
period 1972-1982, document a total of 486 external debt financing events for 3,213 firm-years. The
implied probability of a firm issuing external debt in a given year is less than 15% (one debt financing
event per firm every seven years). James (1987) documents an even lower frequency of publicly reported
debt financing events -- only 207 Wall Street Journal announcements of external debt financing for a
random sample of 300 non-financial firms over the period 1974-1983. His study implies that the
probability of a firm issuing debt is less than 7% per year. While in both studies public issues and private
placements are less common than bank debt, all three types of instruments are very infrequent.
New debt decisions are also very substantial in size. For example, in the sample studied here, the
median amount borrowed is $120 million, which is nearly 15% of the market value of the firm, 24% of the
book value of its total assets, and 80% of its existing total debt (see Table II). Both the infrequency and the
magnitude of the new debt financing decisions are consistent with Myers’ (1984) pecking order argument,
according to which firms use external funds only when internally generated funds are unavailable. If firms
follow the preference order for external financing described by Myers, the question about the determinants
of the choice of corporate debt is best answered by an incremental approach focusing on new debt.
The infrequency and the magnitude of new debt issues also suggest that that firm’s mix of debt
claims tends to be “sticky”, with large changes occurring at discrete points in time, while some of the firm
characteristics that are hypothesized to affect the choice of debt tend to vary significantly over time. As
Table III illustrates, the time-variability (as measured by the median coefficient of variation across time) of
several economic factors that are hypothesized to affect the choice of debt financing is quite significant.
Variables such as the ratios of advertising and research and development expenditures to sales, the
price-earnings ratio, the interest coverage ratio, the ratio of capital expenditures to total assets, and
profitability, tend to fluctuate substantially from year to year. Other variables, which reflect the
14
cumulative history of the firm, tend to vary less. Relating current values of variables that have high time-
series variation to the existing debt mix, which, on average, was determined several years prior, may cloud
the true relation between the variable and the choice of debt, or lead to spurious relations. Therefore, an
incremental approach is potentially better suited to studying the determinants of debt financing by relating
the source of debt to these factors immediately before the time of the financing decision. This approach
allows me to extend the pecking order hypothesis of external financing to the choice between private and
public debt. The approach is similar to the one taken by Opler and Titman (1994), who study the debt-
equity choice, by Jung, Kim and Stulz (1995), who examine external financing decisions, and by Guedes
and Opler (1996), who study the determinants of maturity of corporate debt.
In addition, this approach allows the analysis to include a small, but non-negligible number of
firms that have no outstanding debt at the time of the decision. These firms account for approximately six
percent of all issuers. As shown in panel B of Table II, they are much smaller than their “seasoned debt”
counterparts, but the amount of debt that they issue is anything but trivial – the median issue size is $48.5
million, which is 52% of existing total assets and 22.5% of the firm’s market value, both measured at the
end of the fiscal year prior to borrowing.
3.2. Sample Selection
Public companies are required to disclose to the SEC any material change in their financing.
Companies include information about the new financing in their 8K reports, or sometimes 10Q or 10K
reports.7 According to attorneys with the SEC’s Division of Corporation Finance, if these financing events
are significant enough to warrant a filing, they are typically accompanied by a press release.
7 The 8K is the “current report”, which is used to report the occurrence of any material events not reported previously. It provides more current information than forms 10K and 10Q and must be filed within 15 days of the event.
15
I search the newswires included in the Dow Jones News Retrieval libraries entitled “Financing
Agreements” and “Private Placements” for announcements of debt financing agreements or private debt
placements in 1995 and 1996. I also use a number of keywords to search for announcements outside of
these two libraries. The information submitted to the newswires is immune to a bias that a particular
newspaper may apply in selecting which news releases to publish. In fact, the news releases often contain
news releases about numerous very small firms, including many firms that are not included on CRSP and
COMPUSTAT datasets, and even private firms. Similar to James (1987) and Lummer and McConnell
(1989), I document announcements of new credit facilities, as well as for renewed and re-negotiated
facilities.
I exclude warrants, convertible debt and announcements by non-U.S. firms and those, made by
financial firms (SIC codes 6000 to 6799). I collect the available information on the borrower’s identity,
amount and type of the loan, maturity of the loan, interest rate, collateralization, whether the loan is new,
renewed, extended, or increased, the intended purpose of the financing, and the identity of the lender.
I obtain information about public and 144a debt issues from the Investment Dealers’ Digest. It
provides data on the issuance date, amount issued, maturity, coupon, price, yield, rating, agent, call
provisions. The appendix presents examples of such announcements and reports.
This approach yields a sample of 2,338 new debt financing announcements. I obtain data for the
borrowing firms from COMPUSTAT’s Industrial, Full Coverage and Research files for the year preceding
the loan, and I aggregate debt issues of the same type by the same firm within a year (this is a more
relevant issue for the public debt issues, where firms sometimes have up to seven different issues within a
month, or even several issues on the same day), which leaves 1,560 public issues, private placements or
loans, by 1,480 companies.8 I collect insider stock ownership data from the Disclosure database and from
proxy statements filed by the issuing firms.
8 An alternative to using annual COMPUSTAT data would be to use quarterly data. Such an approach would eliminate the effect that time disparity between the end of the fiscal year and the actual debt issue across the issuers
16
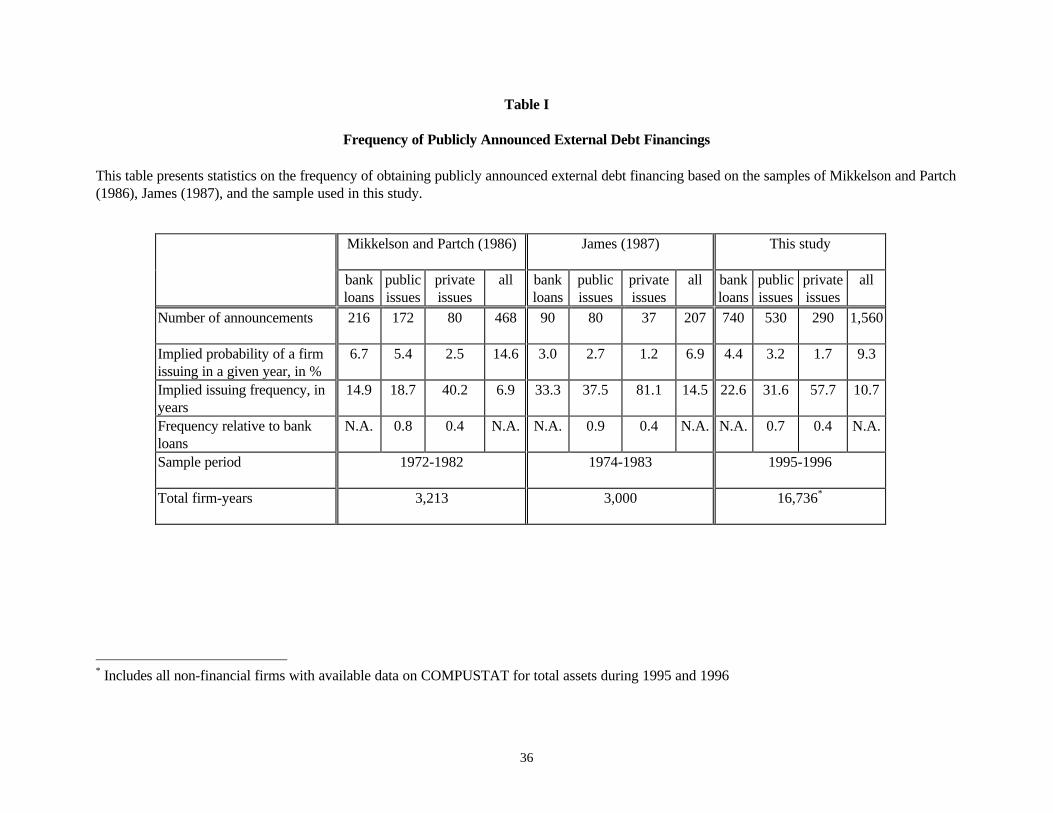
Table I presents a comparison of the frequency of external debt financings documented by
Mikkelson and Partch (1984), James (1987), and this study. In the sample used in this study I document
1,560 publicly announced external financing, based on the universe of firms with Compustat data for the
period 1995-1996 (a total of 16,763 firm-years). This implies that the probability of a firm issuing in a
given year is 9%. This estimate is higher than James’ and lower than Mikkelson and Partch’s, however,
Mikkelson and Partch’s sample includes only NYSE and AMEX firms, while both James and I use broader
samples.
3.3. Definition of Variables
In this section I define empirical proxies for the factors hypothesized to affect the source of debt,
which are used in the analysis of debt source.
Future growth opportunities are predicted to be positively related to the probability of borrowing
privately and negatively related to debt maturity. I use several empirical proxies to measure the importance
of valuable future projects. First, I use as a forward-looking measure of growth options the firm’s market-
to-book ratio, calculated as the book value of the firm assets minus book value of equity plus market value
of equity, divided by book value of assets. However, the market-to-book ratio potentially reflects firm
quality, instead of growth options (as used by McConnell and Servaes (1990), and others). This could be
problematic because firm quality is expected to be negatively related to the probability of borrowing
privately. To circumvent this ambiguity, I also use the following historical measures as proxies for future
growth: the industry market-to-book ratio, defined as the market-to-book ratio for the median firm in the
narrowest SIC classification with at least five firms; growth of the capital expenditures, scaled by total
assets, during the one- and three-year periods preceding the debt issue; employee growth over the past one-
and three-year periods; and sales growth over the past one- and three-year periods.
might have on the estimated relations. A downside of this approach is the fact that the accounting data itself is less precise and often missing.
17
The theories that focus on the information production role of private lenders predict that firms with
higher information asymmetries will issue private debt, while firms with lower levels of asymmetric
information will prefer public debt. To examine this prediction, I use the following measures to proxy for
the magnitude of the information asymmetries between the firm and the lenders. My first proxy for the
degree of information asymmetry is the ratio of fixed assets, defined as the COMPUSTAT item Property,
Plant and Equipment, to total assets. I expect firms with a higher proportion of fixed assets to issue public
debt. Second, I use firm size as a measure of information asymmetry, and hypothesize that it will be
positively related to the probability of issuing publicly. Third, I hypothesize that firms with higher research
and development (R&D) expenditures, scaled by sales, will be more likely to borrow privately. For the
majority of the firms data about R&D expenditures are missing. I create two other variables based on
R&D. In the first variable I replace the missing R&D data with a zero, and in the second I replace it with
the R&D for the median firm in the narrowest SIC classification with at least five firms.9 Finally,
conditional upon data availability, I propose to use as measures of information asymmetry the number of
analysts following a firm, and the dispersion (variance) of analyst earnings forecasts, both provided by
I/B/E/S.
A number of theories hypothesize that probability of issuing public debt is positively related to the
firm’s creditworthiness and project quality, and negatively related to the firm’s ex-ante probability of
default. I measure directly a firm’s creditworthiness using the firm’s senior debt rating, as provided by
COMPUSTAT. I use the credit rating to construct the following two indicator variables: a) an indicator
variable equal to 1 if the firm has an investment grade rating, 0 otherwise; b) an indicator variable equal to
1 if the firm does not have any rating at all, 0 otherwise. In the cases where a firms has no debt
outstanding at the time of the issue, it is assigned the lowest credit rating, or the lower-rated category. I use
9 The R&D ratio, however, could be correlated with (and has been used in empirical studies as a measure of future growth opportunities as well, thus making it complicated to distinguish between the effects of growth and information asymmetry based on the ratio alone.
18
Altman’s Z-score as an ex-ante measure of the likelihood of default, and measure project quality by a
firm’s profitability, defined as earnings before interest, taxes and depreciation (EBITD), scaled by total
assets, and past profitability, defined as the average profitability over a three-year period.
I use the fraction of stock ownership held by the firm’s insiders, as reported by the firm’s proxy
statements and Disclosure, to measure the magnitude of the potential agency conflict between managers and
the shareholders of the firm, and the degree to which management has relative control over voting decisions.
This allows me to test the hypothesis about the effect of managerial discretion on the source of new debt
financing.
A number of theories suggest firm size as a determinant of the source of debt. Because large firms
are more likely to be followed by analysts and the press, firm size can be regarded as a measure of
information asymmetry. Given that small firms are more likely to go bankrupt, firm size could also be
considered a proxy of the ex-ante probability of bankruptcy. Because large firms have survived for many
years, size reflects their successful history, and could be treated as a proxy for the firm’s creditworthiness.
In addition, Fama (1985) argues that outside debt, like outside equity has high fixed information and
contracting costs, which make it uneconomical for small organizations. Therefore, firm size could also
proxy for the economies of scale, characterizing issuing public debt. While it appears that size cannot be
associated with only one single theory, all of the economic factors for which it proxies are expected to be
positively related to the likelihood of issuing public debt. I use as measures of firm size the firm’s total
assets, sales, and market value, calculated as the book value of firm assets minus the book value of equity
plus the market value of equity. All three measures are very highly (above 92%) correlated with each
other.
Finally, I control for the effects of existing leverage, measured as the sum of long- and short-term
debt, scaled by total assets.
19
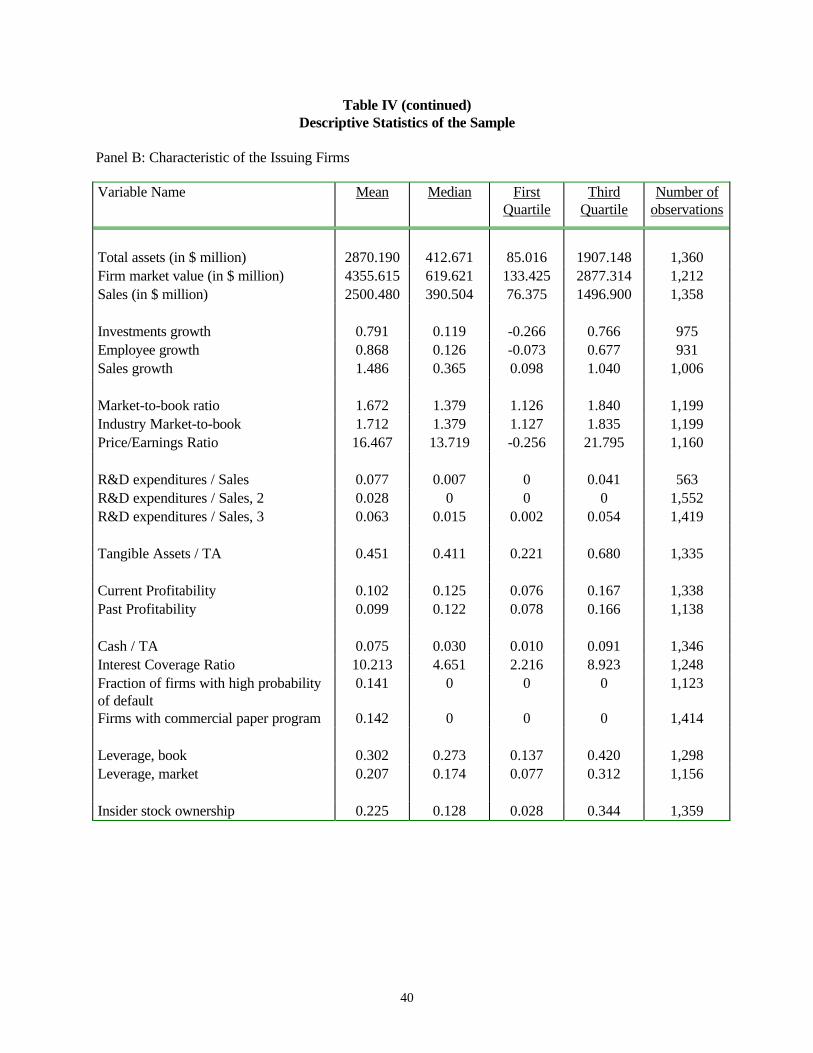
3.4. Descriptive Statistics
Table IV presents descriptive statistics on the main variables used in this study. All firm
characteristics are measured as of the end of the year preceding the debt issue. The total number of debt
issues is 1,560, of which 530 are public debt issues, 740 are bank loans, and 290 are private debt
placements. The total amount of debt raised by the firms in the study is $349.9 billion. Public debt
accounts for $162.3 billion, bank debt $151.3 billion, and private debt $36.4 billion. It is interesting to
note that the public and the bank debt markets provide approximately the same amount of financing, and
that the private and the bank debt combined account for more than half of the dollar amount of all new
debt. The maturity of the new issues ranges from 1 year to 100 years. The median maturity of the new debt
is 8.7 years, and more than five percent of the debt matures in more than 30 years. There is a wide
variation in the size of the issuing firms. The median firm in the sample has total assets of $412.7 million,
and the median market value is $619.6 million. As reported earlier in Table II, the median amount issued is
15% of the market value of the firm, 25% of the total assets, and 80% of the existing total debt. While I do
not report separately a comparison of the sample firms with the median firm of their respective industries,
the issuing firms are not significantly different from their respective industry median firms in any aspect,
except for firm size (the median sample firm has total assets of $412.67 million vs. $118.64 million for the
median industry firm), and leverage (book leverage for the median sample firm is 0.27 vs. 0.22 for the
industry median).
As hypothesizes previously, a large fraction of the private debt is placed under SEC Rule 144a.
Placements under Rule 144a account for $16.7 billion, or nearly half of the dollar amount of all private
placements and loans. The overwhelming majority of them (68 out of 74 issues, for $15.5 billion) have
ratings below investment grade. By comparison, there are 530 public issues, amounting to $162.3 billion.
Of them, there are 168 issues ($38.3 billion) with rating below investment grade. Thus, the private high-
yield market appear to emerges as a sizable complement to the traditional public high-yield market, which
20
has shrunk substantially since the fall of Drexel Burnham Lambert, the conviction of Michael Milken, and
the negative publicity surrounding those events.
4. Results
This section presents univariate comparisons across the type of new debt, and then examines the
choice of debt in a multivariate framework.
4.1. Univariate Analysis
The firms obtaining new debt financing from the three different sources – banks, private
institutions, and public markets, are quite different from each other. The univariate analysis provides
evidence, largely consistent with the prediction of the theories of source of debt based on credit/project
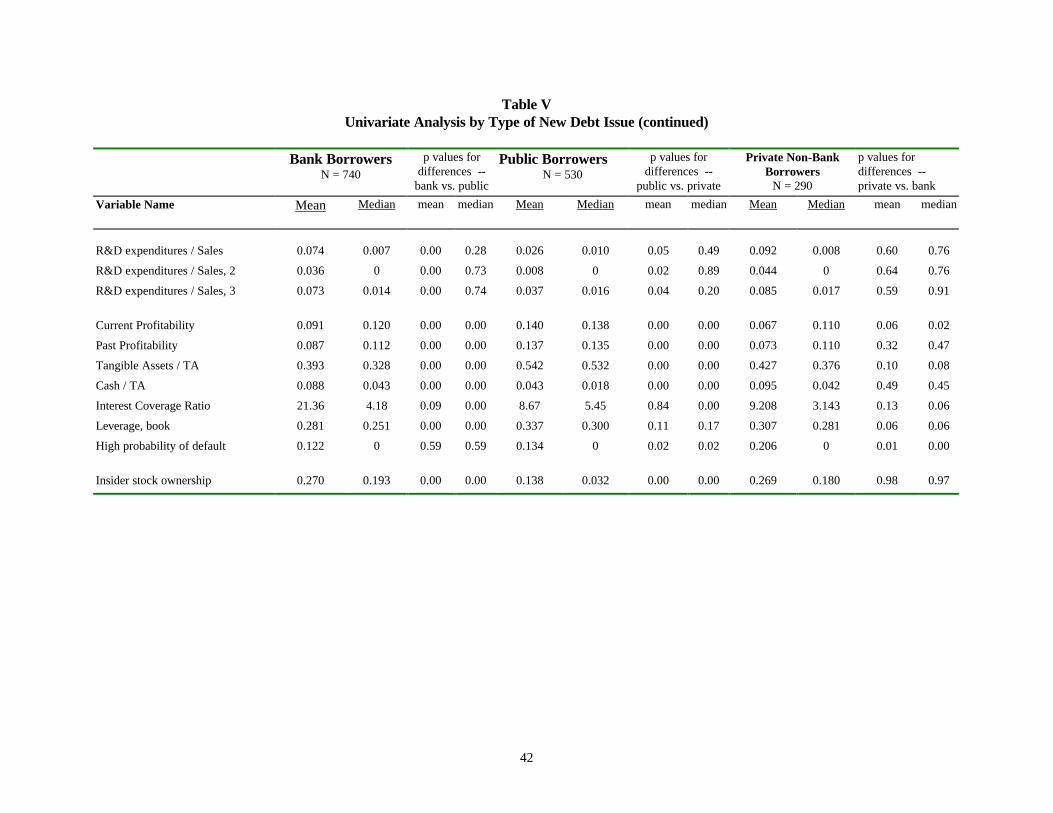
quality and asymmetric information. Table V presents the results.
The first obvious difference between public issuers, and both bank and private borrowers, is firm
size. As expected, public borrowers are significantly larger than both bank and private borrowers, and also
tend to issue greater amounts of debt. One possible explanation for the difference in the amount issued is
that firms issuing greater amounts appear to take advantage of the economies of scale, characterizing the
issuance costs of public debt. However, as it will be confirmed in the multivariate setting, the difference
between amount borrowed is being driven by firm size. The amount borrowed relative to total assets,
however, is highest for bank borrowers (median ratio 36%), compared to both public (8%) and private
borrowers (26%), all significantly different at 1% confidence level.
Private borrowers have experienced higher growth of employees, capital expenditures, and sales
than public borrowers over the three years preceding the debt issue. (The comparisons also hold for the
one-year period). However, the forward-looking measures of growth, such as the market-to-book ratio, and
the industry market-to-book ratio, although slightly higher for firms that obtain bank loans than for public
borrowers and other private borrowers, are not significantly different from each other.
21
Consistent with the theories about the information production role of private debt, bank and other
private borrowers have a significantly lower proportion of fixed assets to total assets, compared with public
issuers. However, although the average research and development expenditures are significantly higher for
private borrowers, their medians are not significantly different compared to public issuers.
All measures of project quality are consistent with the theoretical predictions. Public issuers are
more profitable than firms that borrow from banks, while firms that borrow from private non-bank sources
are least profitable. The fraction of firms with high probability of default (Altman’s Z-score<1.81) is
much higher for private borrowers relative to both bank and public borrowers. While the distribution of
the interest coverage ratios appears to be strongly influenced by outliers, the median interest coverage ratio
for private non-bank, private borrowers, is significantly lower than that of both the bank and the public
issuers. Public borrowers carry much less cash as a percentage of their total assets, relative to bank and
non-bank borrowers. Given that the firm borrowing privately also face higher degrees of information
asymmetry, as the comparisons of the fixed assets ratio demonstrate, this finding is consistent with the
Myers and Majluf (1984) financial slack argument.
Table VI examines the effect of credit quality on the source of new debt by comparing existing debt
rating across issuer type. Seventy-six percent of the public issuers have a debt rating assigned by Standard
and Poors, while only twenty five percent of the bank and twenty seven percent of the private borrowers do.
The median firm that issues public debt has a BBB debt rating, while the median private or banks borrower
does not have a rating.
Because the availability of credit rating may simply reflect whether the firm has public debt
outstanding, I also separately compare the firms with existing ratings. If we consider only the firms that do
have credit ratings, the median public issuer has a rating of BBB+, while the median bank and private
borrower has a rating of BB and BB-, respectively.
Fifty-eight percent of the public issuers have investment grade rating, while only five percent of the
bank borrowers and less than two percent of the private borrowers do. If we consider only the rated firms,
22
the respective numbers are seventy eight percent of the public issuers, almost twenty two percent of the
bank borrowers, and only six percent of the private borrowers.
Finally, more than forty percent of the public issuers have commercial paper rating, while only 2.7
percent of the bank borrowers, and 1.7 percent of the private borrowers do.
All comparisons in Table VI are statistically significant at 1% confidence level, except for the
fraction of firms with senior debt rating for bank borrowers and private borrowers, which are not
statistically distinguishable at conventional levels. The evidence from the univariate comparison of the
firms’ credit ratings strongly suggests that credit quality is one of the most important determinants of the
debt source, consistent with Diamond’s (1991) theory.
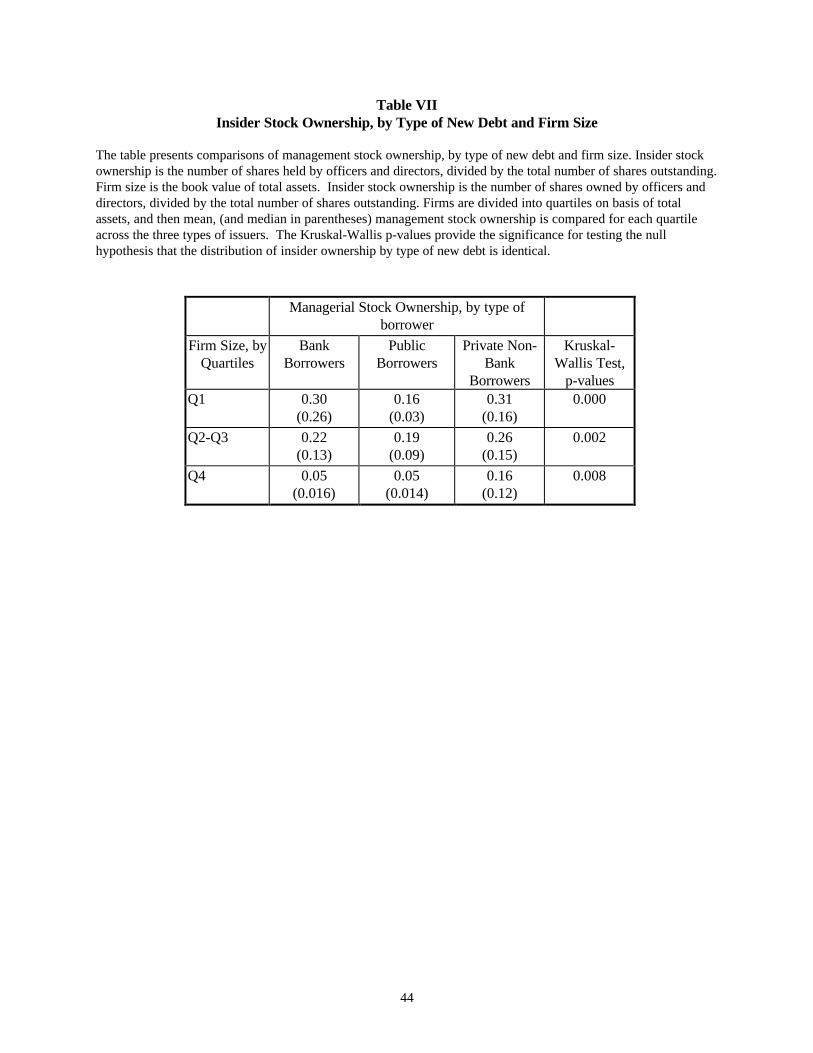
Finally, public, bank, and private borrowers also differ in terms of management stock ownership.
Consistent with the hypothesis that I develop, the univariate comparison demonstrates higher ownership
levels for bank and private borrowers. The median ownership for bank borrowers is 19.3 percent, for
public borrowers is 3.2 percent, and for private borrowers is 18.6 percent. The differences in management
stock ownership remain significant even after controlling for firm size. When firms are divided into
quartiles on basis of total assets, and the average and median management stock ownership are compared
for each quartile across the three types of issuers, the differences between bank borrowers and public
borrowers remain for small and medium-size firms, and disappear for large firms, but even for large firms
management stock ownership of private non-bank borrowers remains high. This analysis is presented in
Table VII.
4.2. Multinomial Logit Analysis
In this section I examine the determinants of the source of new debt financing using a multinomial
logit framework. I regress the source of new debt against a set of empirical proxies related to the examined
hypotheses. By using a multinomial logit analysis, I am able to distinguish and derive simultaneous
comparisons among the determinants of public, bank, and non-bank private debt. The results are presented
23
in Table VIII. The following evidence supporting the theories of debt choice that are based on information
asymmetry, credit quality, and efficiency of renegotiation emerge from the results.
First, all measures of credit and project quality, such as existing investment grade rating, even after
controlling for the availability of rating, and recent and past profitability are positively related to the
probability of choosing public debt, and negatively related to the probability of choosing private non-bank
debt. The relation between credit and project quality proxies and the debt source is robust to various
specifications and are among the most important predictors of debt source. Firms facing high likelihood of
bankruptcy, indicated by Altman’s Z-score less than 1.81 are likely to borrow privately, consistent with the
argument about the role of private lenders in renegotiations. Consistent with the hypothesis based on
Diamond’s (1991) theory, that banks screen out the lowest quality candidates for credit, these firms with
high probability of default are more likely to issue private debt even relative to bank debt. While prior
studies have used some proxies for the borrowers credit risk, such as leverage, and volatility of earnings
growth, my findings provide direct support for the borrower’s reputation (measured directly by the firm’s
existing credit rating) and for the ex-ante probability of default (measured by profitability, and Altman’s Z-
score) as significant predictors of the choice of debt.
The fixed assets ratio is significantly positively related to the probability of selecting public debt,
and is robust to regression specification. Thus, firms with lower information asymmetries tend to issue
public debt, while firms with higher degree of information problems tend to borrow from banks and private
creditors. However, research and development expenditures are not significantly related to the debt choice
at conventional levels. The evidence about firms with higher information asymmetries choosing private
source of debt is consistent with the theoretical predictions, as well as with the findings of Krishnaswami,
Spindt and Subramaniam (1999), who obtain a similar result using a different proxy for information
asymmetries.
I do not find a significant relation between future growth opportunities and debt choice. None of
the growth measures, such as such as the market-to-book ratio, the industry market-to-book ratio, past
24
growth of investments, sales or employees, is significantly related to the source of debt. This result is very
different from the existing cross-sectional evidence. Houston and James (1996) find a negative relation
between use of bank debt and growth opportunities for firms with a single bank relation, and a positive
relation between growth opportunities and use of bank debt for firms with multiple banking relations.
Krishnaswami, Spindt and Subramaniam (1999) find a positive relation between growth opportunities, and
the use of private debt. Johnson (1997), however, finds no relation between the use of public debt and
growth opportunities, a positive relation between use of private debt and growth opportunities, and a
negative relation between the use of bank debt and growth opportunities. Interestingly, Hadlock and James
(1998), who predict the choice of new debt also finds no relation between the measures of growth
opportunities and the probability of issuing public debt (although they do not distinguish between bank debt
and non-bank private debt).
One possible explanation for this result is that firms use means, other than contracting with the
lender, to resolve the “underinvestment problem”, through lower debt levels altogether, or through focusing
on debt maturity, rather than debt source.
There is also some evidence that managerial ownership is related to the debt choice. The
probability of issuing public debt is negatively related to managerial ownership, even after controlling for
the effect of firm size. While this proxy of potential agency conflicts always has the expected sign, and
magnitude, its statistical significance is sensitive to specification. This is perhaps due to the non-linear
relation between ownership and firm size. More work is required to obtain more detailed results the
instances in which managerial ownership plays a role in the choice of debt financing.
As noted earlier, many theories suggest firm size as a determinant of debt source. Given that firm
size is emblematic for many of the factors, potentially affecting the choice of debt, a major question in
studying the determinants of debt source is how to interpret the significance of firm size, and what factors,
other than firm size affect the choice of debt. As expected, there is a strong positive relation between firm
size, measured by total assets (while not reported, similar qualitative and quantitative results are obtained
25
using sales and the market value of the firm), and the probability of issuing public debt, which is consistent
with multiple competing explanations.
Contrary to the univariate results and theoretical predictions based on economies of scale, the
amount borrowed is negatively related to the probability of issuing public debt, implying that holding
constant firm size, public borrowers obtain smaller amount of debt than bank borrowers. Statistically this
is equivalent to the measure of relative size. This is consistent with the results from the univariate
comparison of amount borrowed relative to firm size across type of debt, presented earlier in Table V. One
economic interpretation of this observation is that, just as there are high fixed costs associated with public
issues, there are high fixed cost associated with the screening process that the bank performs before the
decision to enter into a relationship with the firm, particularly for large, complex transactions, involving
large, or even international bank syndicates. An alternative explanation is based on financial constraints
argument. If firms that borrow from bank sources face higher information asymmetries, as both the logit
and the univariate analyses demonstrate, their access to the market can be more limited than the access
available to public borrowers. In such a case, controlling for firm size, a private borrower may obtain a
greater amount than a public borrower to avoid being financially constrained in the future. This
explanation is consistent with the observation that bank borrowers carry more cash than public borrowers,
and the Myers and Majluf (1984) financial slack motive.
4.3. Robustness Tests: Comparison of Public and Private High Yield Debt
In this section I compare the characteristics of public and private high yield debt. One possible
concern about the robustness of the results in the previous section could arise from the hypothesis that, for
firms that issue high yield debt, the placement and monitoring mechanism of high yield debt might be more
important for the issue decision, than the source of debt itself. Consequently, the “high yield” feature could
be the more important characteristic of the debt than source, and it might be more appropriate to separate
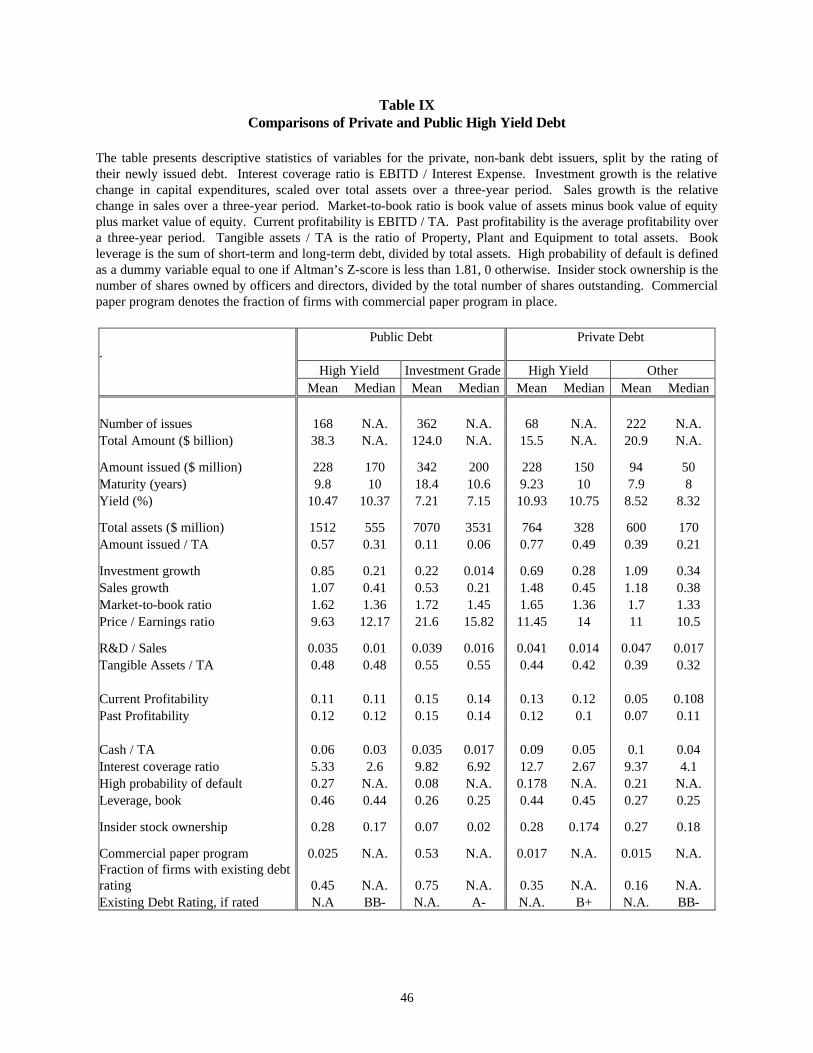
the high yield issues from the analysis of debt source. Table IX presents descriptive statistics of the public
26
and private debt and issuers, split by the rating of new debt. It is remarkable that the public and private
high yield debt and issuers are almost identical in several aspects. Their issue sizes are almost the same, as
well as the maturity of new debt. The firms have experienced growth of investments and sales at similar
rates. They are equally profitable, and equally highly leveraged. The yield on private high yield issues is
slightly higher (by less than 0.5%) than that on public high yield issues. However, the factors outlined by
the multivariate analysis as the main determinants of debt source remain significantly different. First, the
high yield private issuers are much smaller than the public high yield issuers, and tend to be more similar to
the other private issuers with respect to firm size. (The median amount of total assets for private high yield
issuers is $555 million, while it is only $328 million for private ones). Second, the private high yield
issuers tend to have lower fixed asset ratios, and higher R&D / Sales ratios than the public high yield
issuers. Third, fewer of the private high yield issuers have existing credit rating and commercial paper
programs in place, and those that are rated have lower median rating relative to their public counterparts.
These results indicate that although public and private high yield issuers are very similar in a
number of ways (in fact, more similar to one another than they are relative to non-high-yield issuers that
borrow from same respective source), they remain very different with respect to measures of information
asymmetry and credit reputation. With respect to these factors they are much more similar to the other
non-high-yield borrowers that choose the same source. This analysis confirms the importance of the
proxies for information asymmetries as the primary determinants of the source of borrowing.
5. The Source of Firm Debt and the Pecking Order Theory of External Financing
Earlier in the paper I hypothesized that, if the pecking order hypothesis holds for the choice
between private and public debt too, firms facing high costs of information asymmetries will choose private
debt before public debt, because private debt, being senior, collateralized, more informed through screening
and monitoring, is safer than arm’s length debt.
27
The findings about the costs of asymmetric information, credit quality, and probability of default,
as strong predictors of the choice of debt are consistent with the pecking order hypothesis. Using a sample
from a different time period and derived using different news sources, this study also confirms the pattern
of external debt issuance documented previously: new external debt issues are very rare, and very large.
Such a pattern is more consistent with the pecking order hypothesis, than with readjusting a target private-
to-public debt ratio. Additionally, Houston and James (1996) document that 60% of the firms of their
sample do not have any public debt outstanding. It is difficult to justify that for such a large proportion of
firms, the “optimal” ratio of private-to-public debt is to rely exclusively on bank debt, if firms set such a
target ratio. However, such a finding is consistent with the main argument of the pecking order hypothesis
– the cost of asymmetric information, and with the results of this study. Close monitoring and information
production by banks makes it possible for firms facing high cost of asymmetric information to access
external funds that would not be feasible to obtain from the public debt market or the seasoned equity
market. Thus, it appears that the choice between private and public debt financing is an integral part of the
more general question about the capital structure of the firm as viewed by the pecking order theory.
6. Analysis of the Maturity of New Debt
A question closely related to the choice of debt financing is the choice of debt maturity. Firms face
a number of simultaneous decisions when obtaining external financing. If a firm decides to issue debt, it
makes a decision on its source, maturity, and covenants. A number of theories have similar predictions
about the firm’s maturity, and firm’s debt source. To address the question about the simultaneous decision
about choice and maturity, I use a simultaneous equations (two-stage) approach, involving a continuos
choice (maturity) and a discrete choice (debt). I use a technique described by Mannering (1986) and Train
(1986), which derives from the more general simultaneous equations models associated with Heckman
(1979). The technique consists of using the predicted probabilities with respect to each choice alternative,
28
from a multinomial logit regression, to construct a correction for the selectivity bias, associated with the
simultaneous choice. Figure 1 below illustrates the possibility of such bias.
Figure 1
0
1
2
3
4
5
6
7
0 1 2 3 4 5Xi
Yi Line B
Line A
Suppose that on the Y-axis we plot as the left-hand side variable maturity of new debt, while on the
X-axis we plot an explanatory factor, such as size. The potential problem of selectivity bias comes from
the fact that the observed choice of maturity represents a biased sample. If the squares represent the
observed maturity of debt for firms that have selected a public source of financing, the estimated relation
will be represented by Line A. However, if we are interested in the relation between debt maturity and a
certain factor for all firms, regardless of debt source, we have to consider what the maturity would have
been if the firm had chosen another alternative (represented by the dots). Line B represents the true,
unbiased relation between maturity, and the factor of interest.
Formally, the adjustment that I use, λij, is equal to:
λij
K P P P Pkj kj kj ijk i
K
= − +≠
∑( / ) {[ ln / ( )] ln ]}1 1 (1)
where Pij is the predicted probability that the chosen alternative is selected, and Pjk are the probabilities for
the other two alternatives. The correction factor is used in the OLS estimation as an explanatory variable.
29
Table X presents the results. I first estimate the multinomial logistic model on debt source to
obtain the predicted probabilities for each alternative, using the first specification reported in Table VII.
Then, I calculate the selectivity bias correction, λ. As expected, the correction is largest for the alternative
least likely to be selected, private debt. I then use the correction term in the OLS regression predicting
maturity. I regress the logarithm of the term to maturity of the new issues, against variables that proxy for
credit quality, information asymmetries and growth options. The results are qualitatively similar to Guedes
and Opler (1996). Firms with higher credit rating choose longer maturity, controlling for the availability of
rating. Firms with higher information asymmetries, as denoted by lower fixed asset ratios tend to borrow
on the shorter end of the spectrum, while larger firms, and firms with more fixed assets borrow longer term.
Then, I compare the uncorrected and the corrected model, which uses the selectivity bias correction term.
The bias correction term is very significant, and its presence decreases the significance of some of the other
factors, that are significant in the uncorrected model, such as the fixed asset ratio, the dummy for
availability of rating, and R&D expenditures. This analysis demonstrates that maturity and source share
common determinants, and that it is appropriate to account for the simultaneous choice of the two.
7. Conclusion
In this study I analyze the determinants of the choice of new debt, using a large sample of publicly
traded firms that issued public debt, obtained bank loans, or placed debt privately. Because debt issues are
large, discrete events, I use an incremental approach to study their determinants. I find that the probability
of issuing debt publicly is positively related to firm size, the ratio of fixed assets, existing credit rating, and
profitability. Conversely, the probability of borrowing from private non-bank debt sources is negatively
related to the firm’s profitability and credit rating, and positively related to its ex-ante probability of
default.
The findings support hypotheses of the theories that are based on asymmetric information and bank
monitoring. Consistent with Diamond’s (1991) theory, the evidence suggests that firms with high
30
information asymmetries and low credit rating borrow from banks, while firms with lowest credit quality
are screened out. These firms tend to borrow from other private sources. Consistent with the theories of
debt choice based on efficiency of renegotiation, firms with higher ex-ante probability of bankruptcy
borrow from banks and private sources. However, unlike prior cross-sectional studies, I find no support
for the hypothesis that firms with higher future growth opportunities will prefer bank debt to public debt.
I argue that my findings about the determinants of debt source are consistent with the pecking order
theory of external financing, and that the choice of private, bank, and public debt can be viewed as an
integral part of the more general question about the capital structure of the firm in the context of the
pecking order theory.
I also find supporting evidence for a hypothesis that firms with lower levels of managerial
ownership tend to avoid private debt, if private debt constraints management, or is perceived at turnover
threat. Additionally, I demonstrate that debt maturity and source share some common determinants, such
as firm size, ratio of fixed assets to total assets, and credit rating. I use a two-stage regression approach to
control for their simultaneous determination.
Several interesting questions remain to be addressed. First, the intended purpose and the use of the
proceeds from borrowing appear to play a role in the choice of debt. As argued in section 3, firms issue
debt in large amounts and very infrequently. Also, it appears that firms raising very large amounts of debt
tend to use both the public and the private debt market. Investigating the use of new funds from borrowing
can shed more light on the decision on debt choice. Second, while this study distinguishes between bank
and other private debt, the latter category encompasses a variety of lending instruments, such as term loans,
revolvers, senior notes, which appear to be very different in terms of placement structure, maturity, and
identity of lenders. Further investigation of these types of private debt can enhance our understanding of
the similarities and the differences between private debt and both bank and public debt. Finally, the
existing research has not empirically examined the relation between debt choice and firm value. It is
31
potentially interesting to investigate whether the source of debt is cross-sectionally related to firm value, or
conversely, is endogenously determined.
32
References
Berger Philip, Eli Ofek and David Yermak, 1997, Managerial Entrenchment and Capital Structure Decisions, Journal of Finance 52, 1411-1438.
Berkovich, Elazar and Ronen, Israel, 1996, The Design of Internal Control and Capital Structure, Review
of Financial Studies 9, 209-240. Berlin, Mitchell and Jan Loyes, 1988, Bond Covenants and Delegated Monitoring, Journal of Finance 43,
397-412. Boyd, John and Edward C. Prescott, 1986, Financial Intermediary-Coalitions, Journal of Financial
Theory 38, 211-232. Campbell, Tim S. and William A. Kracaw, 1980, Information Production, Market Signaling, and the Theory of Financial Intermediation, Journal of Finance 35, 863-882. Carey, Mark, Mitch Post and Steven A. Sharpe, 1998, Does Corporate Lending by Banks and Financial
Institutions Differ? Evidence on Specialization in Private Debt Contracting, Journal of Finance 53, 845-878.
Chemmanur, Thomas and Paolo Fulghieri, 1994, Reputation, Renegotiation, and the Choice Between
Bank Loans and Publicly Traded Debt, Review of Financial Studies 7, 475-506. Diamond, Douglas W., 1984, Financial Intermediation and Delegated Monitoring, Review of Economic
Studies 51, 393-414. Diamond, Douglas W., 1991, Monitoring and reputation: The Choice Between Bank Loans and Directly
Placed Debt, Journal of Political Economy 99, 689-721. Fama, Eugene, 1985, What’s Different About Banks?, Journal of Monetary Economics 15, 29-39. Gertner, Robert and David Scharfstein, 1991, A Theory of Workouts and the Effects of Reorganization
Law, Journal of Finance 46, 1189-1222. Gilson, Stuart, 1989, Management Turnover and Financial Distress, Journal of Financial Economics 23,
241-262. Gilson, Stuart, 1990, Bankruptcy, Boards, Banks, and Blockholders: Evidence on Changes in Corporate
Ownership and Control when Firms Default, Journal of Financial Economics 27, 355-387. Gilson, Stuart, Stuart, Kose John, and Larry H. P. Lang, 1990, Troubled Debt Restructuring: An
Empirical Study of Private Reorganizations of Firms in Default, Journal of Financial Economics 27, 315-353.
Gilson, Stuart C. and Jerold B. Warner Junk Bonds, Bank Debt and Financing Coprorate Growth,
Harvard Business School, working paper.
33
Guedes, Jose and Tim Opler, 1996, The Determinants of the Maturity of Corporate Debt Issues, Journal of Finance 51, 1809–1833.
Hadlock, Charles and Christopher James, 1998, Bank Lending and the Menu of Financing Options,
working paper. Heckman, James, 1979, Sample Selection Bias as a Specification Error, Econometrica 47, 153-162. Hoshi, Takeo, Anil Kashyap and David Scharfstein, 1990, The Role of Banks in Reducing the Costs of
Financial Distress in Japan, Journal of Financial Economics 27, 67-88. Hoshi, Takeo, Anil Kashyap and David Scharfstein, 1991, Corporate Structure, Liquidity, and
Investment: Evidence from Japanese Industrial Groups, Quarterly Journal of Economics 106, 33-60.
Houston, Joel and Christopher James, 1996, Bank Information Monopolies and the Mix of Private and
Public Debt Claims, Journal of Finance 51, 1863-1889. James, Christopher, 1987, Some Evidence on the Uniqueness of Bank Loans, Journal of Financial
Economics 19, 217-235. Johnson, Shane, 1997, An Empirical Analysis of the Determinants of the Corporate Debt Ownership
Structure, Journal of Financial and Quantitative Analysis 32, 47-69. Jung, Kooyul, Kim, Yong-Cheol, and Rene Stulz, Timing, Investment Opportunities, Managerial
Discretion, and the Security Issue Decision, Journal of Financial Economics, 42, 159-185.
Krishnaswami, Sudha, Paul A. Spindt andVenkat Subramaniam, 1999, Information Asymmetry, Monitoring and the Placement Structure of Corporate Debt, Journal of Financial Economics, 51, 407-434.
Kwan, Simon H. and Willard T. Carleton, 1995, The Role of Private Placement Debt Issues in Corporate Finance, Federal Reserve Bank of San Francisco, working paper. Lummer, Scott L. and John J. McConnell, 1989, Further Evidence on the Bank Lending Process and the
Capital Market Response to Bank Loan Agreements, Journal of Financial Economics 25, 99-122.
Mannering, Fred, 1987, Selectivity Bias in Models of Discrete and Continuous Choice : An Empirical
Analysis, Transportation Research Record 18, 58-62.
McConnell, John J. and Henri Servaes, 1990, Additional Evidence on Equity Ownership and Corporate Value, Journal of Financial Economics 27, 595-612. Mikkelson, Wayne and Megan Partch, 1986, Valuation Effects of Securities Offerings and the Issuance
Process, Journal of Financial Economics 15, 31-60. Myers, Stewart C., 1977, Determinants of Corporate Borrowing, Journal of Financial Economics 20,
293-315.
34
Myers, Stewart C.,1984, The Capital Structure Puzzle, Journal of Finance 39, 575-592. Myers, Stewart C., and Nicholas S. Majluf, 1984, Corporate Financing and Investment Decisions
When Firms Have Information That Investors Do Not Have, Journal of Financial Economics 13, 187-221.
Ofek, Eli, 1993, Capital Structure and Firm Response to Poor Performance: An Empirical Analysis,
Journal of Financial Economics 34, 3-30. Opler, Tim and Sheridan Titman, 1997, The Debt-Equity Choice: An Analysis of Issuing Firms, working
paper. Rajan, Raghuram, 1992, Insiders and Outsiders: The Choice Between Informed and Arm’s-Length Debt,
Journal of Finance 47, 1367-1406. Train, Kenneth, 1986, Qualitative Choice Analysis (The MIT Press, Cambridge, Massachusetts). Welch, Ivo, 1997, Why is Bank Debt Senior? A Theory of Asymmetry and Claim Priority Based on
Influence Costs, Review of Financial Studies 10, 1203-1236. Zwiebel, Jeffrey, 1996, Dynamic Capital Structure under Managerial Entrenchment, American Economic
Review 86, 1197-1215.
35
Appendix Examples of New Debt Financing Announcements and Reports
Part A: Examples of typical bank loan or private placement announcements from the Dow Jones News Retrieval include the following two:
12/04/1996 19:39 Dow Jones News Service (Copyright (c) 1996, Dow Jones & Company, Inc.) TAFT, Calif. (Dow Jones)--Berry Petroleum Co. (BRY) entered a three-year, $150 million unsecured revolving line of credit with NationsBank Corp.'s (NB) NationsBank of Texas unit. In a press release, Berry said the initial borrowing base will be $50 million, which can be redetermined periodically based on its needs, agreement with the bank and approval of its board. Initial borrowings under the agreement will bear interest at LIBOR plus 60 basis points, which at current market conditions is about 6 1/4% annually. Berry Petroleum, Taft, Calif., is an independent oil and gas production and exploration company.
Business Wire (Copyright (c) 1995, Business Wire) DAYTON, Ohio--(BUSINESS WIRE)--Nov. 8, 1995--Amcast Industrial Corporation(NYSE - AIZ) today announced that the company has entered into a new $50 million, ten-year credit agreement with two institutional investors, Principal Mutual Life Insurance Company, Des Moines, Iowa, and Northwestern Mutual Life Insurance Company, Milwaukee, Wisconsin. The notes will carry an interest rate of 7.09% and will have an average term of eight and one half years. The proceeds of the notes will be used to retire existing bank debt, fund Amcast's capital expenditures for expansion, as well as other general corporate and business purposes. 16:04 ET NOV 08, 1995
Part B:
The Investment Dealers’ Digest reports on the new debt issues in the following format:
Investment Dealers' Digest, December 16, 1996 HEADLINE: New Issues; (December 2, 1996 - December 12, 1996); Debt;
PLASTIC CONTAINERS INC. (144A) QUEST DIAGNOSTICS INC. Location: Syosset, NY Location: Teleboro, NJ Date Offered: 12/11/96 Date Offered: 12/11/96 Amount: $ 125,000,000 Amount: $ 150,000,000 Type of Security: Senior Secured Notes Type of Security: Senior Subordinated Notes Maturity: 12/14/06 Maturity: 12/15/06 Coupon: 10.00% Coupon: 10.75% Price: 100 Yield: 10.75% Rated: B1/B+ Rated: B2/B+ Call Protection: Non-call, for five years Call Protection: Non-call, for five years Managers: Donaldson, Lufkin Managers: J.P. Morgan; Goldman, Sachs and Lazard Freres
36
Table I
Frequency of Publicly Announced External Debt Financings
This table presents statistics on the frequency of obtaining publicly announced external debt financing based on the samples of Mikkelson and Partch (1986), James (1987), and the sample used in this study.
Mikkelson and Partch (1986) James (1987)
This study
bank loans
public issues
private issues
all bank loans
public issues
private issues
all bank loans
public issues
private issues
all
Number of announcements
216 172 80 468 90 80 37 207 740 530 290 1,560
Implied probability of a firm issuing in a given year, in %
* Includes all non-financial firms with available data on COMPUSTAT for total assets during 1995 and 1996
37
Table II Size of New Debt Issues
This table presents a summary statistics of the absolute and relative size of new debt issues by a sample of 1,480 firms, which issued public debt, placed debt privately, or obtained bank loans during 1995-1996. Firm market value is calculated as book value of assets minus book value of equity plus market value of equity.
Panel A: All firms N Mean Median
Number of issues 1,560 N.A. N.A. Number of firms 1,480 N.A. N.A. Firm total assets 1,360 2870.19 412.67 Market value of the firm 1,212 4355.61 619.62 Amount of new debt 1,560 224.32 120.00 Amount of new debt / Total assets 1,354 0.79 0.24 Amount of new debt / Market value of the firm 1,209 0.32 0.15 Amount of new debt / Existing debt 1,239 7.15 0.80
Panel B: Firms with no outstanding debt N Mean Median
Number of firms 77 N.A. N.A. Number of firms as a fraction of all issuers* N.A. 0.06 N.A. Firm total assets 77 130.05 21.10 Market value of the firm 72 175.19 48.57 Amount of new debt 77 76.14 15.00 Amount of new debt / Total assets 76 2.89 0.52 Amount of new debt / Market value of the firm 72 0.72 0.23
.
* with available COMPUSTAT data
38
Table III
Time variability of certain factors, hypothesized to be related to the source of firm debt. This table compares the relative time variability of factors, hypothesized to be related to the source of debt financing, as measured by the average and median coefficient of time variation across a sample of 1,480 firms, which issued public debt, placed debt privately, or obtained bank loans during 1995-1996. The coefficient of time
variation is calculated as follows. For each sample firm, i , I first calculate the mean, X i , and standard deviation
across a five year period, preceding the debt financing (t=-1,-5), , σ iit i
t
X X=
−
=−
−
∑ ( )2
1
5
4, for each variable.
The coefficient of variation for each firm, CVi, is defined as the ratio of the standard deviation, σ i, to the absolute
value of the mean, X i , and expressed in percentage terms. Formally, CVX
ii
i
=σ
*100% . Then the average
and median coefficient of variation are the obtained from the distribution of CVi, across firms. Firm market value is calculated as book value of assets minus book value of equity plus market value of equity. Interest coverage ratio is EBITD / Interest Expense. Investment is the amount of capital expenditures, scaled over total assets. Market-to-book ratio is book value of assets minus book value of equity plus market value of equity. Current profitability is EBITD / TA. Fixed assets ratio is the ratio of net Property, Plant and Equipment to total assets. Book leverage is the sum of short-term and long-term debt, divided by total assets. Market leverage is the sum of short-term and long term debt, divided by firm market value.
Variable Mean CV, % Median CV, % Advertising expenditures/Sales 97.7 91.6 Price-Earning ratio 647.3 79.5 Investment / Total assets 44.0 58.5 Interest Coverage ratio 117.8 43.1 Leverage, market 49.7 34.9 R&D expenditures /Sales 67.0 33.0 Leverage, book 47.1 29.1 Profitability 81.8 25.4 Sales 31.1 20.5 Altman’s Z-score 30.1 17.9 Market-to-Book ratio 34.2 13.8 Fixed assets ratio 18.2 11.0 Bond Rating 5.6 3.4
39
Table IV Descriptive Statistics of the Sample
The table presents descriptive statistics of selected key variables for a sample of 1,560 public debt issues, bank loans and private placements during 1995-1996, by 1,480 publicly traded firms. Firm market value is calculated as book value of assets minus book value of equity plus market value of equity. Interest coverage ratio is EBITD / Interest Expense. Investment growth is the relative change in capital expenditures, scaled over total assets over a three-year period. Employee growth is the relative change in employees over a three-year period. Sales growth is the relative change in sales over a three-year period. Market-to-book ratio is book value of assets minus book value of equity plus market value of equity. Industry market-to-book ratio is the market-to-book ratio of the median firm within the closest SIC codes with at least five firms. Current profitability is EBITD / TA. Past profitability is the average profitability over a three-year period. Tangible assets / TA is the ratio of Property, Plant and Equipment to total assets. Book leverage is the sum of short-term and long-term debt, divided by total assets. Market leverage is the sum of short-term and long term debt, divided by firm market value. High probability of default is defined as a dummy variable equal to one if Altman’s Z-score is less than 1.81, 0 otherwise. Insider stock ownership is the number of shares owned by officers and directors, divided by the total number of shares outstanding. Panel A: Characteristics of the Debt Issues Variable Name Total
Table IV (continued) Descriptive Statistics of the Sample
Panel B: Characteristic of the Issuing Firms Variable Name Mean Median First
Quartile Third
Quartile Number of
observations
Total assets (in $ million) 2870.190 412.671 85.016 1907.148 1,360 Firm market value (in $ million) 4355.615 619.621 133.425 2877.314 1,212 Sales (in $ million) 2500.480 390.504 76.375 1496.900 1,358 Investments growth 0.791 0.119 -0.266 0.766 975 Employee growth 0.868 0.126 -0.073 0.677 931 Sales growth 1.486 0.365 0.098 1.040 1,006 Market-to-book ratio 1.672 1.379 1.126 1.840 1,199 Industry Market-to-book 1.712 1.379 1.127 1.835 1,199 Price/Earnings Ratio 16.467 13.719 -0.256 21.795 1,160 R&D expenditures / Sales 0.077 0.007 0 0.041 563 R&D expenditures / Sales, 2 0.028 0 0 0 1,552 R&D expenditures / Sales, 3 0.063 0.015 0.002 0.054 1,419 Tangible Assets / TA 0.451 0.411 0.221 0.680 1,335 Current Profitability 0.102 0.125 0.076 0.167 1,338 Past Profitability 0.099 0.122 0.078 0.166 1,138 Cash / TA 0.075 0.030 0.010 0.091 1,346 Interest Coverage Ratio 10.213 4.651 2.216 8.923 1,248 Fraction of firms with high probability of default
0.141 0 0 0 1,123
Firms with commercial paper program 0.142 0 0 0 1,414 Leverage, book 0.302 0.273 0.137 0.420 1,298 Leverage, market 0.207 0.174 0.077 0.312 1,156 Insider stock ownership 0.225 0.128 0.028 0.344 1,359
41
Table V Univariate Analysis by Type of New Debt Issue
The table presents descriptive statistics of selected key variables for a sample of 1,560 public debt issues, bank loans and private placements during 1995-1996. Firm market value is calculated as book value of assets minus book value of equity plus market value of equity. Interest coverage ratio is EBITD / Interest Expense. Investment growth is the relative change in capital expenditures, scaled over total assets over a three-year period. Employee growth is the relative change in employees over a three-year period. Sales growth is the relative change in sales over a three-year period. Market-to-book ratio is book value of assets minus book value of equity plus market value of equity. Industry market-to-book ratio is the market-to-book ratio of the median firm within the closest SIC codes with at least five firms. Current profitability is EBITD / TA. Past profitability is the average profitability over a three-year period. Tangible assets / TA is the ratio of Property, Plant and Equipment to total assets. Book leverage is the sum of short-term and long-term debt, divided by total assets. High probability of default is defined as a dummy variable equal to one if Altman’s Z-score is less than 1.81, 0 otherwise. Insider stock ownership is the number of shares owned by officers and directors, divided by the total number of shares outstanding. The significance of the difference in means is determined using the t-test, and the significance of the difference in medians is determined using the Kruskal-Wallis test.
Bank Borrowers N = 740
p values for differences --
bank vs. public
Public Borrowers N = 530
p values for differences --
public vs. private
Private Non-Bank Borrowers
N = 290
p values for differences --
private vs. bank
Variable Name Mean Median mean median Mean Median mean median Mean Median mean median
Table VI Existing Standard and Poors Senior Debt Rating by Types of New Debt Financing
The table presents univariate comparisons of existing senior debt rating by Standard and Poors, as reported by COMPUSTAT, by type of new debt financing. The significance of the difference in proportions is determined using the Wilcoxon rank-sum test, and the significance of the difference in medians is determined using the Kruskal-Wallis test. All medians and proportions compared are significantly different at the 1% level, with the exception of fraction with senior debt rating for bank borrowers and private non-bank borrowers.
Bank Borrowers Public Debt Issuers Private Non-bank Borrowers
A
Lowest Median Highest Lowest Median Highest Lowest Median Highest Senior debt rating N.R. N.R. AA N.R. BBB AAA N.R. N.R. A
Senior debt dating, if rated CCC+ BB AA CCC+ BBB+ AAA CCC- BB- A
B
Fraction with senior debt rating 0.25 0.76 0.27
Fraction with investment grade rating 0.05 0.58 0.02
Fraction with investment grade rating, if rated
0.22 0.79 0.06
C
Fraction with commercial paper rating 0.03 0.42 0.02
44
Table VII Insider Stock Ownership, by Type of New Debt and Firm Size
The table presents comparisons of management stock ownership, by type of new debt and firm size. Insider stock ownership is the number of shares held by officers and directors, divided by the total number of shares outstanding. Firm size is the book value of total assets. Insider stock ownership is the number of shares owned by officers and directors, divided by the total number of shares outstanding. Firms are divided into quartiles on basis of total assets, and then mean, (and median in parentheses) management stock ownership is compared for each quartile across the three types of issuers. The Kruskal-Wallis p-values provide the significance for testing the null hypothesis that the distribution of insider ownership by type of new debt is identical.
Managerial Stock Ownership, by type of borrower
Firm Size, by Quartiles
Bank Borrowers
Public Borrowers
Private Non-Bank
Borrowers
Kruskal-Wallis Test,
p-values Q1 0.30
(0.26) 0.16
(0.03) 0.31
(0.16) 0.000
Q2-Q3 0.22 (0.13)
0.19 (0.09)
0.26 (0.15)
0.002
Q4 0.05 (0.016)
0.05 (0.014)
0.16 (0.12)
0.008
45
Table VIII Multinomial Logistic Regressions Predicting Source of New Debt
The table presents results form multinomial logistic regressions predicting the source of 1,560 new corporate debt issues during 1995-1996. The normalized alternative is bank debt. Market-to-book ratio is book value of assets minus book value of equity plus market value of equity. PPE/TA is the ratio of Property, Plant and Equipment to total assets. R&D/Sales is the ratio of Research and Development expenditures to sales. Book leverage is the sum of short-term and long-term debt, divided by total assets. Insider stock ownership is the number of shares owned by officers and directors, divided by the total number of shares outstanding. Investment grade rating is an indicator variable, equal to one if the firms have existing debt rating of BBB or higher, zero otherwise. Not rated is an indicator variable, equal to one if the firm has no existing debt rating, zero otherwise. Ownership is the insider stock ownership. Total assets and amount issued are measure in thousands of dollar. High probability of default an indicator variable equal to 1 if the firm’s Altman Z-score is less than 1.81, 0 otherwise. Profitability, 3 yr., is defined as the average ratio of EBTID/TA over three years.
Number of Observations 1021 955 1053 1023 Log-likelihood 2247 2101 2318 2247 Log-likelihood, at convergence 1565 1438 1646 1428
46
Table IX Comparisons of Private and Public High Yield Debt
The table presents descriptive statistics of variables for the private, non-bank debt issuers, split by the rating of their newly issued debt. Interest coverage ratio is EBITD / Interest Expense. Investment growth is the relative change in capital expenditures, scaled over total assets over a three-year period. Sales growth is the relative change in sales over a three-year period. Market-to-book ratio is book value of assets minus book value of equity plus market value of equity. Current profitability is EBITD / TA. Past profitability is the average profitability over a three-year period. Tangible assets / TA is the ratio of Property, Plant and Equipment to total assets. Book leverage is the sum of short-term and long-term debt, divided by total assets. High probability of default is defined as a dummy variable equal to one if Altman’s Z-score is less than 1.81, 0 otherwise. Insider stock ownership is the number of shares owned by officers and directors, divided by the total number of shares outstanding. Commercial paper program denotes the fraction of firms with commercial paper program in place.
. Public Debt
Private Debt
High Yield Investment Grade High Yield Other Mean Median Mean Median Mean Median Mean Median
Table X OLS Regressions Predicting the Maturity of New Debt
Panel A presents summary statistics for the selectivity correction bias, calculated using the predicted probabilities of debt choice from a multinomial logit regression. Panel B presents the results of ordinary least squares regressions predicting the logarithm of the term to maturity of 1,560 new debt issues during 1995-1996. Market-to-book ratio is book value of assets minus book value of equity plus market value of equity. When the data for the ratio of R&D expenditures to sales was missing, the missing observations were replaced with the median R&D/Sales ratio of the narrowest SIC codes with data for at least five firms. Fixed assets ratio is the ratio of Property, Plant and Equipment to total assets. Book leverage is the sum of short-term and long-term debt, divided by total assets. Investment grade rating is an indicator variable, equal to one if the firms have existing debt rating of BBB or higher, zero otherwise. Not rated is an indicator variable, equal to one if the firm has no existing debt rating, zero otherwise. Panel A
Selectivity bias correction, λ Estimate Standard deviation