1 CREDIT RATIONING FOR SME’S IN THE CORPORATE BANK LOAN MARKET OF A BANK-BASED ECONOMY Prof. dr. Wim Voordeckers Limburgs Universitair Centrum Department of Business Administration Universitaire Campus, B-3590 Diepenbeek, BELGIUM Tel. +32 11 268694, Fax +32 11 268700 Drs. Tensie Steijvers Limburgs Universitair Centrum Department of Business Administration Universitaire Campus, B-3590 Diepenbeek, BELGIUM Tel. +32 11 268627, Fax +32 11 268700 E-mail: [email protected]ABSTRACT Credit rationing is by many Keynesian economists nowadays seen as one of the most important examples of market failure in a modern capitalistic economy. Credit rationing occurs if in equilibrium the demand for loans exceeds the supply at the ruling price (interest rate). Since SMEs in a bank-based financial system like Belgium, heavily rely on bank finance, this restricted access to bank finance could have a negative effect on the investment in new profitable projects and growth of the economy. We study the empirical significance of credit rationing for SMEs in a Belgian context by means of an extensive panel data set consisting of 2.698 SMEs reporting data over the period 1993-2001. The novelty of our research is twofold. First, we make the distinction between credit rationing for long and short term bank debt, of which the relevance was suggested in a theoretical model by Das (2004). Second, in contrast to the numerous previous studies, pioneered by Fazzari et al. (1988), we opt for an endogenous classification into ‘credit rationed’ and ‘non credit rationed’ firms, allowing for switching between both groups throughout time. Our results, based on an instrumental variable technique being 3SLS, suggest that, over the entire period, more than 50% of the Belgian SMEs are credit rationed. In most years, long term bank debt is being slightly more rationed than short term bank debt, except in 2001. The results reveal that credit rationed firms for short term bank debt are smaller, faster growing firms with less financial strength and much less current assets to offer as collateral. For long term bank debt, credit rationed firms are in general smaller and younger, low growth firms with low cash flow to assets ratios and much less tangible assets to offer as collateral even though they have a higher added value and return on assets ratio than unconstrained firms. We can conclude from both analyses that constrained Belgian SMEs can be mainly characterized as young, small SMEs with little internal financial resources and a lack of assets to guarantee the repayment of debt. EFM classification codes: 140; 800
Transcript
1
CREDIT RATIONING FOR SME’S IN THE CORPORATE BANK LOAN
Credit rationing is by many Keynesian economists nowadays seen as one of the most important examples of market failure in a modern capitalistic economy. Credit rationing occurs if in equilibrium the demand for loans exceeds the supply at the ruling price (interest rate). Since SMEs in a bank-based financial system like Belgium, heavily rely on bank finance, this restricted access to bank finance could have a negative effect on the investment in new profitable projects and growth of the economy. We study the empirical significance of credit rationing for SMEs in a Belgian context by means of an extensive panel data set consisting of 2.698 SMEs reporting data over the period 1993-2001. The novelty of our research is twofold. First, we make the distinction between credit rationing for long and short term bank debt, of which the relevance was suggested in a theoretical model by Das (2004). Second, in contrast to the numerous previous studies, pioneered by Fazzari et al. (1988), we opt for an endogenous classification into ‘credit rationed’ and ‘non credit rationed’ firms, allowing for switching between both groups throughout time. Our results, based on an instrumental variable technique being 3SLS, suggest that, over the entire period, more than 50% of the Belgian SMEs are credit rationed. In most years, long term bank debt is being slightly more rationed than short term bank debt, except in 2001. The results reveal that credit rationed firms for short term bank debt are smaller, faster growing firms with less financial strength and much less current assets to offer as collateral. For long term bank debt, credit rationed firms are in general smaller and younger, low growth firms with low cash flow to assets ratios and much less tangible assets to offer as collateral even though they have a higher added value and return on assets ratio than unconstrained firms. We can conclude from both analyses that constrained Belgian SMEs can be mainly characterized as young, small SMEs with little internal financial resources and a lack of assets to guarantee the repayment of debt. EFM classification codes: 140; 800
If all firms would have equal access to capital markets, the financial structure of any firm would
not have any effect on the investment decisions. Firms can costlessly substitute external funds for
internal capital. Under this assumption of perfect capital markets, investment decisions are made
independently of the financial condition of the firm (Modigliani en Miller 1958). The assumption
of perfect capital markets is however not applicable to reality, since it is no longer assumed that
external and internal capital can be costlessly substituted. According to Fazzari et al. (1988), the
assumption of perfect capital markets is certainly not relevant for small firms. For those firms,
external capital is not a perfect substitute for internal funds due to information asymmetry.
The majority of firms in Belgium consists of SMEs. Their importance for the economy is
substantial. In order to ensure their continuity and realise growth, SMEs need to acquire the
necessary financial resources. For SMEs, there is a tendency to adopt labour intensive techniques
which involve mainly a large proportion of variable instead of fixed operating costs. This causes
a lower operation leverage which reduces the effect of a change in sales on earnings before
interest and taxes and thus reduces the variability in earnings and reduces the risk to pay back
their debt. From an optimal financing point of view, these firms should rely more heavily on
bank debt (Hutchinson 1995). Moreover, when external sources are needed, these small firms
have to rely mainly on bank finance since collecting money on the public capital market is no
option for SMEs, set up in the Belgian bank-based financial system (Bhattacharya and Thakor
1993, Berger and Udell 2002).
This heavy reliance on banks could have negative consequences for some firms, that can not (no
longer) get the necessary finance to keep their firm going or to invest in new projects in order to
grow. Credit rationing is by many Keynesian economists nowadays seen as one of the most
important examples of market failure in a modern capitalistic economy. Credit rationing occurs if
the demand for loans exceeds the supply at the ruling price (interest rate). We would expect that
an excess demand for debt would cause the opportunistic suppliers to increase the price, until
quantity demanded equals quantity supplied. In reality, this mechanism isn’t always working and
consequently there are firms coping with credit rationing. Credit rationing can be of great
practical importance when reduced bank debt supply for certain firms would reduce their
financial resources and prevent the execution of profitable investment projects. Moreover, the
impact of financing constraints on investment behaviour tends to increase systematically as firm
3
size decreases. Audretsch and Elston (2002) find in their study based on German SMEs that
smaller firms tend to be more vulnerable to financing constraints than their larger counterparts.
Often there is made an implicit assumption that firms act in a neo-classical manner, with a desire
to invest in all available projects with a positive discounted net cash flow. Consequently,
imperfections in the supply of finance, for example by financial institutions, tend to be
highlighted as a contributory cause of any small firm sector tendency to invest sub-optimally,
exhibit slower than average growth or experience higher than average bankruptcy rates
(Hutchinson 1995). It would be more correct to involve supply for as well as demand for finance
in casu bank finance in this discussion, as will be done in the current paper.
Despite the large body of theoretical literature concerning credit rationing, there is little
consensus about the economical significance of this phenomenon since the empirical research in
this domain is scant. This study is an attempt to fill this gap and empirically investigate the
existence of credit rationing for SMEs in the Belgian corporate bank loan market, by estimating
the demand-supply disequilibrium model for bank debt and deriving by means of this model, the
proportion of credit rationed firms. The model is estimated based on a panel data set of small and
medium sized Belgian firms for the period 1993-2001. The novelty of our study is twofold. In
this study, we separate firms endogenously which is an improvement over previous research using
mainly proxies to identify the firms which ‘would be expected a priori’ to be credit rationed (e.g.
Fazzari et al. 1988, Hoshi et al. 1991, Berger and Udell 1992, Petersen and Rajan 1994, Gertler
and Gilchrist 1994, Harhoff and Körting 1998, Bopaiah 1998). This classification method was
used in recent research by Atanasova and Wilson (2004), Vijverberg (2003) and Ogawa and
Suzuki (2000) and allows firms to switch throughout time between the categories of rationed and
non rationed firms. Our method of research has the additional advantage of the possibility of
linking the phenomenon of credit rationing to changes in the economic situation throughout time
or other events arising in an economy e.g. Basel II Capital Accord and consolidation in banking.
Moreover, we make a distinction between long term and short term bank debt rationing, as was
suggested by the theoretical framework of Das (2004). This distinction was never made in
previous empirical studies.
The remaining part of the paper is organised as follows. In section 2, we provide a brief overview
of the theoretical credit rationing literature which is the foundation of the empirical research.
Section 3 describes the empirical methodology, formulating the disequilibrium model of
corporate bank lending and the hypotheses to be tested. In section 4, the estimation method of the
4
model is presented, as well as a description and justification of the dataset used. Section 5 reports
and interprets the results of the estimation of the disequilibrium models for short term and long
term bank lending. In section 5.2., the sample firms are classified as borrowing constrained and
unconstrained for long term and short term bank debt, based on the estimated models. Finally
section 6 concludes the paper.
2. CREDIT RATIONING: A LITERATURE REVIEW
Even though not everyone agrees on the relevance of the phenomenon, for many Keynesian
economists it’s one of the most important examples of market failure in our modern capitalistic
economy. Or as Keynes (1930) wrote in ‘A treatise on money’: “…So far however, as bank
loans are concerned, lending does not (…) take place according to the principles of a perfect
market. There is apt to be an unsatisfied fringe of borrowers, … This phenomenon is capable,
when it exists, of having great practical importance.’…”
If demand for bank debt exceeds the supply, we would expect that the applicants for bank debt or
the opportunistic suppliers would increase the price. Consequently, in an economy that meets the
standard neoclassical assumptions, it is not clear why credit rationing exists. Numerous
researchers have tried to find a theoretical explanation.
The first explanatory models have tried to explain this phenomenon by means of a full
information framework and various market imperfections (e.g. Hodgman 1960, Miller 1962,
Freimer and Gordon 1965, Jaffee and Modigliani 1969, Jaffee 1971, Smith 1972, Azzi and Cox
1976, Koskela 1979). The problem with these theories is that they do not take into account the
inherent complexity of the borrower-lender relation: in particular the problem of less than perfect
information or information asymmetry. Information asymmetry is prevalent if a firm knows the
expected risk and return of their project, while the bank only knows the average expected return
and risk of an average project in the economy.
Jaffee and Russell (1976) and Stiglitz and Weiss (1981) were the first to introduce asymmetrical
information in the analysis of the credit decision. A traditional model within the credit rationing
literature is the ‘Stiglitz-Weiss-model’. Stiglitz and Weiss (1981) came to the conclusion that
banks will rather ration credit than increase the interest rate due to adverse selection (Akerlof
1970) and moral hazard problems (Arrow 1963). The economic theory states that there is an
equilibrium in the market when demand equals supply or when the above mentionned Walrasian
market clearing level is reached. In the market for bank debt, there seems to be an equilibrium,
5
different from the point where demand equals supply but instead equilibrium is established when
the bank-optimal interest rate is reached. The bank-optimal interest rate is the equilibrium
interest rate since at any interest rate above the bank-optimal interest, the expected return for the
bank increases at a slower rate than the interest rate and will even decrease after a certain interest
rate is exceeded. At the bank-optimal interest rate, the demand for bank debt will exceed the
supply. Some applicants for bank debt who will not receive bank debt, will be prepared to pay a
higher interest rate. If the bank agrees to this higher interest rate, the interest rate will increase
until the point is reached where demand equals supply. The negative consequence is however
that higher risk borrowers are attracted and lower risk borrowers drop out (adverse selection
effect). In order to avoid this, banks will not charge an interest rate above the bank-optimal rate
since higher risk lending is not expected to be rewarded with higher return. The expected return
of a loan at an interest rate above the bank-optimal rate will be lower than the expected return of
loans at the bank-optimal rate. Moreover, the interest rate will also affect the borrower in his
selection of projects to execute. If the bank increases the interest rate, higher risk projects will
rather be preferred above low risk projects by the borrower who receives the loan, decreasing
again the expected return for the bank (moral hazard effect). Stiglitz and Weiss thus conclude
that there are no competitive forces in action, bringing demand and supply together. Since the
behaviour of borrowers can not be monitored costlessly, the bank will take into account this
behaviour when setting the interest rate. This is an additional reason for the bank to prefer
rationing credit rather than increasing the interest rate.
By consequence, the ‘Law of Supply and Demand’ may not be considered as a law (Stiglitz and
Weiss 1981). The existence of credit rationing suggests that, in equilibrium, demand is not
always equal to supply. The law is only the result of the underlying assumption that prices do not
have adverse selection or moral hazard effects. Prices do not always equilibrate the market, as is
often stated in economical models. The model of Stiglitz and Weiss gave rise to many theoretical
models trying to explain credit rationing, taking into account the existence of asymmetrical
information (e.g. Blinder and Stiglitz 1983, Wette 1983, Gale and Hellwig 1984, Besanko and
Thakor 1987a, 1987b, Williamson 1986, 1987, De Meza and Webb 1987, Milde and Riley 1988).
Most models came to the conclusion that information asymmetry leads to credit rationing when
the information problem remains unresolved. Due to asymmetrical information, the expected
return increases non monotonously when the interest rate is increased, which is the foundation for
credit rationing.
6
3. EMPIRICAL METHODOLOGY
3.1. Description of the credit market as a disequilibrium model: demand and supply for
bank debt
Models of markets in disequilibrium appear more and more often in recent economic theories and
the econometrical area of research. Early economic theory was based on models of market
equilibrium: the equilibrium was brought about by the price. Recently however, as well macro as
micro models set aside the traditional hypotheses that prices always restore equilibrium on every
market (Yang 1987). Numerous studies have studied the significance of the dynamics of a
market disequilibrium as well as the methodology of estimating a supply and demand function for
those markets in disequilibrium (Fair and Jaffee 1972, Fair and Kelejian 1974, Maddala and
Nelson 1974, Maddala 1980, Goldfeld and Quandt 1981).
The amount of bank debt received depends on the interaction of the desired demand and the
supply of bank debt if the equilibrium interest rate is lower than the bank-optimal interest rate r*
from the model of Stiglitz and Weiss (1981). If the equilibrium interest rate exceeds the bank-
optimal interest rate, the transaction is determined by the supply of bank debt. The bank would
not lend at an interest rate above the bank-optimal interest rate because such a loan is likely to be
a worse risk than the average loan at the bank-optimal interest rate. Thus, the expected return to
such a loan is lower than the expected return to the loans the bank is presently making. Hence,
there are no competitive forces leading supply to equal demand, and credit is rationed.
In our study, credit rationing cán occur in a market in equilibrium as defined by Stiglitz and
Weiss (1981). In other words, in equilibrium, being the situation in which the bank demands the
bank-optimal interest rate, the credit market can, from the traditional Walrasian point of view, be
in disequilibrium. We assume that the interest rates are ‘sticky’ and do not equilibrate the market
in every period considered. We are thus considering equilibrium rationing in our study, being a
situation where price persistently stays at a level implying an excess demand which can be
consistent with rational lender behaviour (Baltensperger 1978).
In order to take into account the existence of a (permanent) disequilibrium in the market (credit
rationing), the simultaneous equation model mentioned below, being a disequilibrium model, will
be estimated: (Maddala and Nelson 1974)
7
Ldt = β1 x’1t + u1t
Lst = β2 x’2t + u2t
Lt = min (Ldt , Ls
t)
The model consists of a demand equation Ldt, a supply equation Ls
t and a transaction equation Lt.
The vectors x’1t and x’2t reflect the exogenous, independent variables, β1 and β2 their coefficients,
and u1t and u2t are the disturbances. Ldt and Ls
t are in this model the amount of bank debt
demanded and supplied, but they are not observed by any external party. Only the amount of
bank debt which was actually received, the transaction amount Lt, can be perceived. We do not
know if this transaction amount of debt agrees to the amount demanded by the firm or whether
there was a limitation set by the bank which was not prepared to offer the demanded amount of
bank debt. Put differently, we do not know ex ante which firms in our sample deal with credit
rationing. There is ‘unknown sample separation’ (Maddala 1987, Perez 1998).
Moreover, we want to estimate this model twice: once for measuring credit rationing concerning
long term bank debt and once for measuring credit rationing concerning short term bank debt.
Das (2004) also makes this distinction in his theoretical framework on credit rationing. What
makes this distinction relevant, is the fact that the term of the bank loan can be seen as a
characteristic of a contract that serves to solve the information problems a SME copes with. It
can also reinforce the control on the SME. Moreover, long term loans require a long term
judgement of the creditor on the creditworthiness of the debtor. A firm that is financially strong
and creditworthy at the moment of a credit acquisition cannot assure that it will remain
creditworthy in the future. The chance of occurrence of an adverse event becomes larger, as the
time period of the loan is enlarged (Mann 1997). Also, the problem of asset substitution is
particularly present when providing long term credit (Jackson and Kronman 1979). The term of
the loan gives the debtor enough opportunity to alter the projects in subtle ways or even switch
from low-risk to high-risk projects. As loan duration falls, the reputation effect becomes much
more important. For firms, which have acquired short term credit and would actually engage in
asset substitution, the wealth transfer would be relatively small compared to the reputation cost
(higher future interest rates). Moreover, the speed required to substitute assets would raise costs
for the debtor. By means of a succession of bank debt contracts of short term, the bank can force
the SME to negotiate on a regular basis in order to receive a new short term loan (Hutchinson
1995). That’s why we expect that SMEs are more rationed for (more risky) long term bank debt
than for short term bank debt.
8
Short term bank debt is defined as debt with a duration of less than 1 year; long term bank debt is
defined as debt with a duration of more than 1 year. We hypothesize that the proportion of SMEs
which are credit rationed for long term debt, would be higher than for short term debt (supra). For
both kinds of bank debt, we estimate a separate model for the demand and supply of bank debt.
3.2. The disequibrium model for the corporate bank loan market: formulation of
hypotheses Our empirical study can be split up into two phases. First, the disequilibrium model of demand
and supply of bank debt is estimated. We make a distinction between the model for long term
bank debt and the model for short term bank debt. Then, the estimated models are used to
estimate the proportion of credit rationed firms, for long and short term bank debt, for each year
between 1993 and 2001.
Before estimating the model, we formulate the hypotheses concerning the demand and supply of
long term and short term bank debt. After a profound review of previous scant empirical
research, various explanatory variables were selected and combined (Sealey 1979, Perez 1998,
Ogawa and Suzuki 2000, Shen 2002, Atanasova and Wilson 2004). These were elaborated by
other variables which did not prevail in previous studies but were considered relevant based on
the theoretical literature in the finance domain.
3.2.1. Hypotheses concerning the demand for bank debt
a. Level of activity
The desired demand for bank debt is determined by the level of activity or production level of a
firm (Atanasova and Wilson 2004). Operating at a higher activity level implies the need for more
working capital (Perez 1998) and thus more short term bank debt. Moreover, we expect that
firms with a higher production level, also have to invest more in order to replace certain assets
(e.g. machines, equipment), and thus need more long term bank debt. We can formulate the
hypotheses:
H1: The demand for long term bank debt increases if the activity level of the firm is higher
H2: The demand for short term bank debt increases if the activity level of the firm is higher
9
b. Internal available resources
The ‘pecking order theory’ states that firms follow a certain order when choosing their financing
resources (Myers 1984). Firms prefer internal financial sources but if these sources appear to be
insufficient, they will appeal to external finance, e.g. bank finance. As a firm grows for example,
the financial needs and options change. SMEs are characterized as firms with a ‘financial growth
cycle’ (Berger and Udell 1998). Growing firms need more financial resources to fund the growth
(Cressy and Olofsson 1997b) and will, according to the ‘pecking order’ theory have to descend in
the financing hierarchy and appeal to bank finance.
The pecking order was confirmed by numerous empirical studies (e.g. Shyam-Sunder and Myers
1999, Fama and French 2002). Even studies particularly aimed at SMEs confirm the pecking
order theory (Norton 1991, Holmes and Kent 1991, Van der Wijst and Thurik 1993, Chittenden et
al. 1996, Hamilton and Fox 1998). Durinck et al. (1997) report indirect evidence in support of
the pecking order hypothesis, related to growth. Their study, based on industrial Belgian SMEs,
revealed that the level of growth had a statistical significant influence on the choice of financing.
The faster the growth, the less firms use retained earnings as their most important source of
finance and more firms appeal to external financing.
On the other hand, the possession of sufficient internal finance (due to a high profitability), could
also increase the demand for external bank debt. The firm knows that the probability of acquiring
additional debt is increased at that moment and will demand for more bank debt to insure itself
against the need for more bank debt when the firm experiences a period of lower profitability.
This reasoning is in accordance with the ‘static trade off theory’, based on the idea that every firm
has an optimal debt ratio determined by a trade off of the costs and benefits of debt finance
(Modigliani and Miller 1963, Jensen and Meckling 1976, Harris and Raviv 1990, Stulz 1990).
Based on the several empirical confirmations of the ‘pecking order theory’, we formulate the
hypotheses:
H3: The demand for long term bank debt increases if a firm has less internal resources available
H4: The demand for short term bank debt increases if a firm has less internal resources available
c. Trade credit as a substitute for bank finance
Trade credit is for many SMEs the only substitute for bank finance, even if it may be an
expensive financing source if cash discounts for early payment are given (Duca 1986). Other
alternative equity sources of finance mostly are not available for small (Belgian) firms.
Financing theory links the use of trade credit to the existence of market imperfections and
10
asymmetrical information causing credit rationing by financial institutions towards certain
(considered risky) firms. This excess demand for bank debt can be compensated by the use of
trade credit. Suppliers ask for higher implicit interest rates in order to grant trade credit. Thus
trade credit can be a substitute for the unsufficient bank finance they received, as was empirically
confirmed by Atanasova and Wilson (2004). The results of the empical studies of Petersen and
Rajan (1994, 1995) and Biais et al. (1995) also suggest that certain categories of SMEs that have
a lower probability of being credit rationed, appear to appeal less to trade credit.
Other theories/models consider trade credit and bank debt to be complements. Market
imperfections (e.g. information costs and transaction costs) can bring about the use of trade credit
without necessarily being credit rationed (Lewellen et al. 1980). Suppliers can generate benefits
in information costs if they extend credit to customers with whom they have regular contact.
Moreover, the cost of evaluation in determining the probability of default is lower since the
supplier is often working in the same or related industry as the customer and is more familiar with
the customer (Emery 1984). Moreover, in case of default, collection costs for trade credit are
lower because the inventories can be resold and thus have a higher value for the seller. In
addition, suppliers may have greater incentive in offering credit because it can help to increase
their sales. Petersen and Rajan (1997) and Wilner (2000) also argue that a supplier may want to
protect the value of its implicit equity stake in the customer being the present value of profits he
makes on the current and future sales to the firm by providing it with sufficient short term
financing. Biais and Gollier (1997) add that receiving trade credit acts as a signal and reveals
private information to the bank.
We formulate our hypotheses based on the complementary view of trade credit and bank debt. In
this model, two simultaneous effects take place: firms use trade credit because they are credit
constrained (substitution effect) but this use of trade credit also facilitates access to bank debt
(complementary effect). Constrained access to bank debt or the desire to exploit the signaling
effect of trade credit, causes the use of trade credit. We formulate the following hypotheses:
H5: The demand for long term bank debt increases if the use of trade credit increases
H6: The demand for short term bank debt increases if the use of trade credit increases
d. Intragroup finance as a substitute for bank finance
Belgium is a small country consisting of many small firms. A lot of these small firms form part
of a group of firms, tied together by equity shares (Deloof 1995). Internal capital markets are a
major channel of capital allocation in modern industrial economies. These internal capital
11
markets would be more efficient than external capital markets. They have an information
advantage over banks and incur lower transaction costs when supplying finance. Within a group
structure, it can be expected that the scarce financial resources they possess, are allocated
optimally at group level (Stein 1997). A firm belonging to a group could obtain the necessary
external finance within the group, without having to appeal to financial institutions and bank debt.
Consequently, intragroup finance can be a substitute for bank debt. We formulate the hypotheses:
H7: The demand for long term bank debt decreases if a firm is tied together to other firms by
means of equity shares
H8: The demand for short term bank debt decreases if a firm is tied together to other firms by
means of equity shares
3.2.2. Hypotheses concerning the supply of bank debt
a. Firm risk
The risk degree of a firm has an influence on the willingness of banks to offer bank debt: firms
for which the repayment of the loan is more uncertain, are more risky for the bank. The risk for
the bank implies the default risk, being the risk that the firm can not fulfill its obligations versus
the bank. The main reason for default of a firm is mismanagement (Ooghe et al. 1995). This
mismanagement can be related to the lack of technical ability and personality of the management,
the quality of the management policy, organization of the firm, experience and motivation of
management and personnel, reputation… Mismanagement leads to a worsening of the financial
condition of a firm, being reflected in financial ratios. Due to the lack of data on quantitative
elements related to mismanagement, traditional default prediction models are based on the
financial structure of firms, although this is only an intermediate variable. Firms characterized by
a worsening of their financial structure and a decline of their financial ratios, represent a bad risk
for financial institutions. We formulate following hypotheses:
H9: The supply of long term bank debt decreases if a firm is characterized by a higher risk
degree
H10: The supply of short term bank debt decreases if a firm is characterized by a higher risk
degree b. Collateral offered by the firm
The amount of debt offered by the bank can also be influenced by the value of the collateral that
can be offered by a firm (Calcagnini and Iacobucci 1997). In case of default, the bank can sell
the collateral obtained and recover (part of) the loan. Collateral is a powerful instrument that
12
allows financial institutions to offer bank debt at more favorable terms to SMEs who might
otherwise, due to their information asymmetry, be credit rationed (Berger and Udell 1998). A lot
of theories concerning the role of collateral have been developed throughout the years.
Collateral reduces the information asymmetry between the SME and the financial institution
(Chan and Kanatas 1985). The applicant receives, in exchange for the collateral, the advantage of
a lower interest rate but can loose the collateral when the return of the project is too low. If the
probability of a low return is too high, the costs of providing collateral will exceed the benefits of
a lower interest rate. Consequently, the applicant will refuse the loan. The reverse is true if a
project with a high probability of a high return is being considered. Thus, the applicant can signal
the real value of a project by offering collateral. This signaling role is certainly important when
the financial institution has limited information on the firm and the value of the project is
estimated lower (Rothschild and Stiglitz 1971). Thus collateral could have a signaling value for
the bank when considering the creditworthiness of the firm (Bester 1985, 1987). Also ex post,
after obtaining the loan and offering the collateral, credit applicants wish to fulfill their
obligations and repay on a timely basis in order to avoid loosing the collateral. Thus, giving
collateral can also solve the ‘moral hazard’ problem by reducing the motives to switch to a higher
risk project or do less effort to realize the proposed project (Boot et al. 1991). This implies that
firms with a lot of intangible assets, which are difficult to monitor, and thus are informationally
very opaque, might incur difficulties in obtaining bank finance. They have more risk shifting
opportunities and these firms do not have much collateral to offer in order to ensure repayment of
debt (Longhofer and Santos 2000).
Stiglitz and Weiss (1981) also studied if a higher demand for collateral could reduce the risk and
increase the return for the bank. In their model, they came to the conclusion that there is a
positive ‘moral hazard’ effect, causing collateral to increase the return for the bank. On the other
hand, there is also a negative ‘adverse selection’ effect working when an increasing demand for
collateral makes the average and marginal borrower become more risky. Stiglitz and Weiss show
that the negative adverse selection effect more than compensates the positive moral hazard effect.
So contrary to the signaling theory, Stiglitz and Weiss (1981) conclude that increasing the
demand for collateral will decrease the expected return for the bank, so that offering more
collateral will not increase the supply of bank debt to firms.
13
Theoretically, there is no consensus on the influence of collateral on the supply of bank debt.
Empirical studies (Atanasova and Wilson 2004, Ogawa and Suzuki 2000, Alphonse et al. 2004)
mainly confirm the signaling theory. We thus formulate the following hypotheses:
H11: The supply of long term bank debt increases if a firm can offer more assets as collateral
H12: The supply of short term bank debt increases if a firm can offer more assets as collateral
c. Use of trade credit
This variable was never included in previous studies on this subject although Biais and Gollier
(1997) show in their model that the reliance on trade credit increases the availability of bank debt.
They show that trade credit reveals private information of the supplier to the bank which can
update its beliefs about the customer’s default risk. It might alleviate the information asymmetry
which might otherwise have prevented the financing of a NPV project. Bank debt and trade
credit can be considered as two complementary sources of financing. This was empirically
confirmed by Cook (1999) and Alphonse et al. (2004). This might explain why SMEs who cope
more often with credit rationing, due to asymmetric information, appeal to trade credit. This
would affect the availability of bank debt in a positive way: trade credit may appear to be a means
to obtain bank debt. Trade credit can work as a signal about the firm’s quality, reducing the
adverse selection problem, and thus facilitating access to bank debt.
On the other hand, relying heavily on trade credit, could give a negative signal to the bank,
indicating that the firm can not obtain enough (cheaper) bank debt at any bank (Kohler et al.
2000, Petersen and Rajan 1997). This could lead to a reduced bank debt supply. This is
consistent with the financing theory concerning trade credit which states that suppliers will lend
more to their customers since they have a comparative advantage in the collection of information
on the financial strength and future of their buyers and the possibility to liquidate the goods in
case of default. Moreover, suppliers have an interest in the survival of their customers on the
long term. Consequently, they offer firms extension of payment if they can no longer rely on
banks for additional bank debt (Asselbergh 2002, Wilson and Summers 2002).
We formulate our hypotheses, based on the positive signal of trade credit:
H13: The supply of long term bank debt increases if a firm uses more trade credit
H14: The supply of short term bank debt increases if a firm uses more trade credit
14
d. Intragroup finance
If a firm forms part of a group of firms that are interrelated by means of cross equity holdings,
this might have a positive influence on the supply of bank debt. Deloof and Jegers (1996) point
at the fact that excesses of financial resources can be transferred to other group members by
means of investment in financial fixed assets in order to avoid limitations on obtaining additional
external bank debt. Being part of a group of firms may also avoid default of repayment of debt
by means of intragroup transfers of money. The group firms also have an interest in the survival
of each firm that belongs to the group. This is important to retain its reputation as being
creditworthy as a group and thus avoid problems in obtaining bank debt in the future. Moreover,
firms of a group can guarantee the repayment of bank debt for another firm belonging to the
group. This interconnectedness makes that firms of a group can, if needed, rely on the other firms
belonging to the group (Mayer 1988). Gertner et al. (1994) also state that a firm which acquires
intragroup financial resources, will be more subject to monitoring. The mother company
possesses eventually the assets or the majority of the assets of each firm of the group and thus has
the residual control over the assets causing a surplus for the mother company when monitoring
the firms of the group. Since the financial institution knows that each group firm is heavily
internally monitored, the financial institutions will have more trust in those firms. This might
also reduce the liquidity constraints for firms within a conglomerate (Lamont 1997, Scharfstein
and Stein 2000), which was empirically confirmed by Shin and Stulz (1998) and Deloof (1998).
Thus we formulate the following hypotheses:
H15: The supply of long term bank debt increases if a firm forms part of a group of firms
characterized by cross equity ownership
H16: The supply of short term bank debt increases if a firm forms part of a group of firms
characterized by cross equity ownership
3.3. Measuring the variables
The demand and supply equations are expressed in terms of financial ratios, log or ratios of firms’
(end of previous year) total assets rather than levels. This specification alleviates the problem of
heteroskedasticity that might be present in the sample data.
DEPENDENT VARIABLE
15
The dependent variable Lt in our study, is the obtained amount of bank debt by a certain firm i in
period t. Short term bank debt is defined as debt with a duration of less than 1 year; long term
bank debt is defined as debt with a duration of more than 1 year.
EXPLANATORY VARIABLES IN THE DEMAND FUNCTION
a. Level of activity
Sales can measure the production level of a firm (Perez 1998). Due to lack of data on sales
figures, we opt for an alternative measure being the ln(added value).
b. Internal available resources
This variable can be measured by means of different indicators. We opt for three measures.
First, we use profitability, measured by Return on Assets, as a proxy for the internal resources a
firm possesses (Shen 2002, Ogawa and Suzuki 2000, Ito and Ueda 1981). Secondly, we use the
internal cash flow, measured as the net income plus depreciation (Atanasova and Wilson 2004,
Sealey 1979, Laffont and Garcia 1977). Thirdly, we incorporate the growth rate in our model in
order to check whether a higher growth rate increases indeed the demand for bank debt. The
growth rate will be measured by asset growth, calculated as the difference between the end of this
year assets and the end of previous year assets, divided by end of previous year assets (Titman
and Wessels 1988). We also add a fourth measure which is only relevant when considering the
demand for short term bank debt being the quick ratio (Perez 1998). The quick ratio is calculated
as the short term assets in proportion to the short term debt. This ratio measures to which degree
a firm can finance its own production level. If the short term debt is not sufficient to finance the
short term assets, there is a need for additional short term (bank) debt. A high quick ratio
indicates that the firm does not need much external short term (bank) credit, indicating an
expected negative sign for this parameter.
c. Trade credit as a substitute for bank finance
We use two indicators for measuring this variable, being accounts payable and net accounts
payable. ‘Net accounts payable’ is defined as the difference between the accounts payable and
accounts receivable at the end of the year (Atanasova and Wilson 2004). Minimization of
accounts receivable and delaying the payment of accounts payable are used as alternative modes
of financing (Winborg and Landström 2000).
16
The results of a study by Deloof and Jegers (1999) suggest that trade credit with a term of less
than one year can be a substitute for short term bank debt but also for long term bank debt,
although this seems to contradict with the 'matching principle'. This can however be explained by
the existence of a permanent component in the short term assets. According to Van Horne
(1995), this component has to be financed by means of long term debt.
d. Intragroup finance as a substitute for bank finance
The data allow us to make a distinction between shareholdings and participations. We create two
dummy variables: a shareholder dummy indicating if a firm has a shareholder or not and a
participation dummy indicating if a firm has a participation or not.
e. Control variables
*Cost of capital
Based on the availability of data and the use of non-price contract terms (e.g. covenants), we are
unable to estimate individual firms’interest rate premiums (capital cost) for bank loans. However,
within a given year, similar interest rates are observed for all the firms. Therefore, we choose for
an alternative variable. We take the interest rate of a safe investment with a long term (obligation
of the state (called ‘OLO’) with a term of 10 year) which is the foundation for the interest rate on
a long term loan for each individual firm. We opt for the LIBOR interest rate with a term of one
year, which is the foundation for the interest rate on a short term loan for each individual firm.
We expect a negative relationship between the cost of capital and the demand for bank debt: a
higher interest rate would reduce the demand for bank debt.
Compared to other studies (Sealey 1979, King 1986, Kim 1999), we don’t consider the cost of
capital of alternative financing sources relevant because SMEs cannot rely on other equity
financing sources (e.g. commercial paper, obligation, IPO…). A Belgian SME can not consider
these financing sources as possible alternatives.
*Business outlook
The state of the economy can have an influence on the individual demand for bank debt by firms
(Shen 2002, Kim 1999, King 1986, Sealey 1979, Laffont and Garcia 1977). In a period of
decline, there are less opportunities to invest or firms choose to postpone their investment. This
would decrease the demand for long term bank debt. Investing less also decreases the activity
increase and thus the need for working capital and short term bank debt. We expect that in boom
periods, firms would like more bank debt. The inclusion of dummy variables for the years 1993-
17
2001 is expected to give us the opportunity to take into account these time effects (Atanasova and
Wilson 2004).
*Industry
Rajan and Zingales (1998) establish the fact that there are industries which need more (external)
finance e.g. bank finance. They suppose this could be due to technological reasons. The scope of
the investment projects, the time needed to develop a project or become known to the public, the
period to be financed before cash can be collected from a project and the need for continuous
investment can also differ between industries (Beck and Levine 2002). Cressy and Olofsson
(1997b) indicate in their study that manufacturing firms face larger investment needs in fixed
assets while the needs of firms in the service industry are limited to product and market
development. This has an influence on the demand for short and long term bank debt. We
distinguish between four industries (dummy variables): production, building, retail and services.
EXPLANATORY VARIABLES IN THE SUPPLY FUNCTION
a. Firm risk
As far as the qualitative elements in evaluating the risk degree are concerned, we have no data
available for including them in our study. The technical ability, the quality and experience of the
management can be proxied by the age of the firm, expressed in years. For most small firms, the
use of equity in the early stages of development is limited to an individual and/or his family’s
contributions. Moreover, young firms are often run by novice entrepreneurs which increases the
financial risk for any potential financier (Egeln et al. 1997). Moreover, a firm which is already in
operation for many years has a proven track record (Jankowicz and Hisrich 1987).
Those firms with a track record are also in most cases larger than young start-up firms. That’s
why we also include the size of the firm as an indicator of the risk degree and/or opacity, being
ln(assets). Hooks (2003) argues that size of the firm is a rough proxy for the reputation of the
firm. Moreover, the assets are an indication of the financial vulnerability of a firm (Fazzari et al.
1988). Consequently, the risk of default is reduced for those firms. It is a fact that many firms
fail in their first years of operation.
Also the industry in which a firm is active, can be an indicator for the risk degree. Certain
industries are more sensitive to the tendency of the market or to changes in market conditions
than others or are characterized by a local market. A bank considers some industries as being
more risky than others, based on a proportional higher past percentage of default in those
industries (Cowling and Mitchell 2003). We create four dummyvariables for the four industries.
18
As far as the quantitative elements in evaluating risk are concerned, we consider the interestcover
as most important indicator (Atanasova and Wilson 2004, Shen 2002, Perez 1998). It reveals
how well a firm can pay back its interest costs to the bank by means of its operating income. For
banks, this ratio would be important as it indicates how much margin a firm has in order to keep
satisfying its obligations versus the banks. In other words, this ratio indicates the probability that
the firm can repay the interest on a new loan demanded.
For the supply of long term bank debt, we also consider the solvency as being an important ratio.
This ratio indicates how much of its assets are financed with equity and measures the financial
power of the firm. It interacts with the financial situation of the firm and is connected with the
profitability by means of the financial leverage and with the liquidity by means of the coverage of
debt. Solvency is particular important in determining the supply of long term debt because it
indicates how long a firm can cope with a situation of a negative evolution in profitability which
is related to its ability of paying off its debt on the long term. For the supply of short term bank
debt, we consider the cash flow as being a more important measure for the risk of paying off the
debt. The cash flow of a firm is used to pay off short term debt.
b. Collateral offered by the firm
When considering the measures for collateral offered, we use different measures for short and
long term debt (Calcagnini and Iacobucci 1997). For long term debt, used to finance mainly
tangible assets, we use the amount of tangible assets a firm has, as a measure. The more labour
intensive a production process is, the more liquid the assets are and thus less tangible assets and
less collateral is available. For short term debt, used to finance mainly working capital, we add
up 50% of accounts receivable and 50% of inventories, shortly noted as ‘acc receiv + inv’ as a
measure. We do not use accounts receivable and inventories for 100% as collateralizable, since
banks consider these categories of collateral as not fully recoverable in case of default.
Inventories can already have become obsolete or partly ‘disappeared’. Accounts receivable are
often already collected before default or have become doubtful.
c. Use of trade credit
Beside a measure of trade credit we used for the demand for bank debt (net accounts payable), we
add an additional measure that compares the use of trade credit by a firm with the use of trade
credit by other firms active in the same industry. We consider this additional measure as being
important for a bank when considering whether they should offer additional bank debt. We create
a dummy variable (accounts payable industry dummy) that is assigned the value ‘1’ if the firm
19
uses more trade credit (accounts payable) than the average of the industry. Otherwise, if it uses
less trade credit than the average of the industry, it is assigned the value ‘0’. If a firm uses less
trade credit than the average of all the firms in the industry, it indicates that suppliers who possess
private information, have less confidence in this firm compared to the other firms in the industry.
d. Intragroup finance
Similar as in the demand function, we create two dummy variables: a shareholder dummy and a
participation dummy.
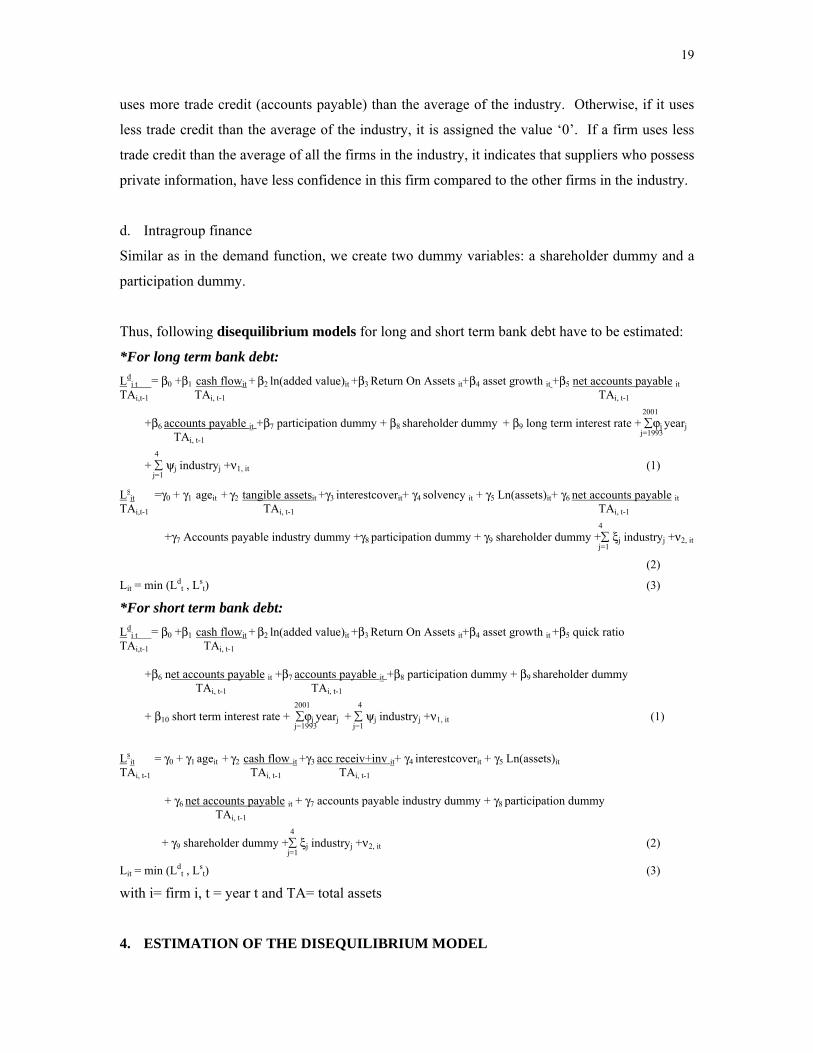
Thus, following disequilibrium models for long and short term bank debt have to be estimated:
*For long term bank debt: Ld
i t = β0 +β1 cash flowit + β2 ln(added value)it +β3 Return On Assets it+β4 asset growth it +β5 net accounts payable it TAi,t-1 TAi, t-1 TAi, t-1
2001 +β6 accounts payable it +β7 participation dummy + β8 shareholder dummy + β9 long term interest rate + ∑ϕj yearj TA i, t-1
j=1993
4
+ ∑ ψj industryj +ν1, it (1) j=1
Ls
it =γ0 + γ1 ageit + γ2 tangible assetsit +γ3 interestcoverit+ γ4 solvency it + γ5 Ln(assets)it+ γ6 net accounts payable itTAi,t-1 TAi, t-1 TAi, t-1 4 +γ7 Accounts payable industry dummy +γ8 participation dummy + γ9 shareholder dummy +∑ ξj industryj +ν2, it j=1
(2)
Lit = min (Ldt , Ls
t) (3)
*For short term bank debt: Ld
i t = β0 +β1 cash flowit + β2 ln(added value)it +β3 Return On Assets it+β4 asset growth it +β5 quick ratio TAi,t-1 TAi, t-1
+β6 net accounts payable it +β7 accounts payable it +β8 participation dummy + β9 shareholder dummy TAi, t-1 TAi, t-1 2001 4 + β short term interest rate + ∑ϕ year + ∑ ψj industryj +ν1, it (1) 10 j j j=1993 j=1
Ls
it = γ0 + γ1 ageit + γ2 cash flow it +γ3 acc receiv+inv it+ γ4 interestcoverit + γ5 Ln(assets)it TAi, t-1 TAi, t-1 TAi, t-1 + γ6 net accounts payable it + γ7 accounts payable industry dummy + γ8 participation dummy TAi, t-1 4 + γ9 shareholder dummy +∑ ξj industryj +ν2, it (2) j=1
Lit = min (Ldt , Ls
t) (3)
with i= firm i, t = year t and TA= total assets
4. ESTIMATION OF THE DISEQUILIBRIUM MODEL
20
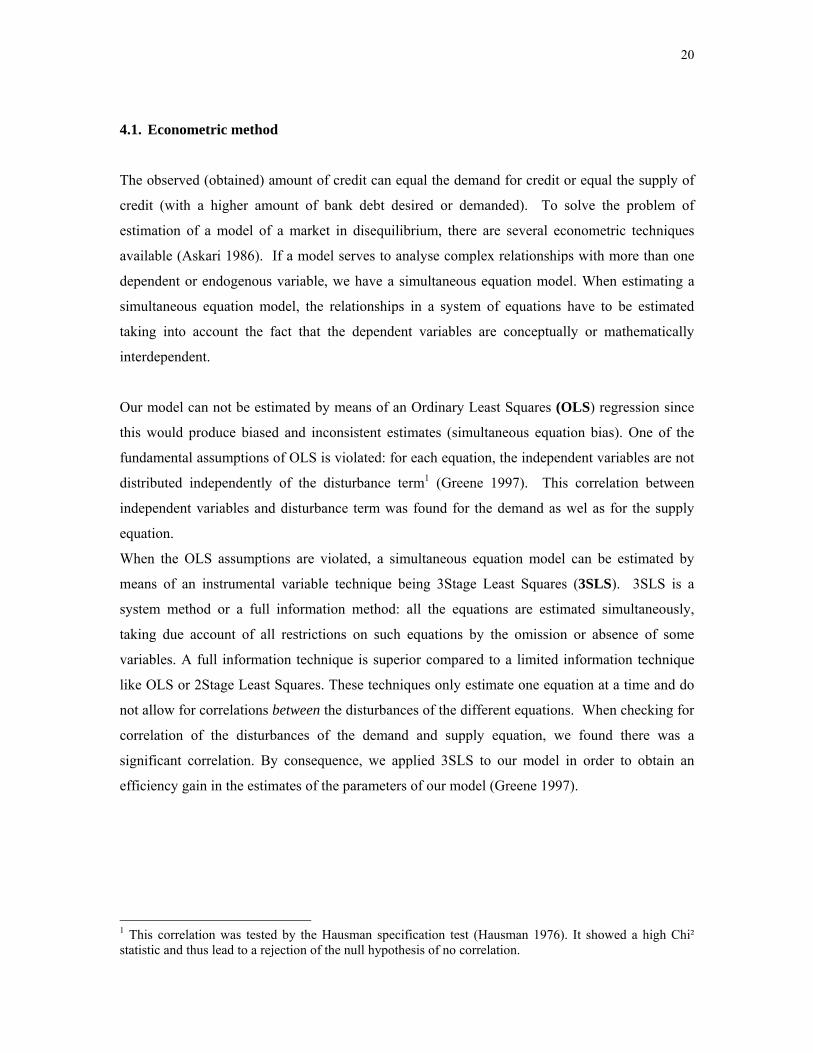
4.1. Econometric method
The observed (obtained) amount of credit can equal the demand for credit or equal the supply of
credit (with a higher amount of bank debt desired or demanded). To solve the problem of
estimation of a model of a market in disequilibrium, there are several econometric techniques
available (Askari 1986). If a model serves to analyse complex relationships with more than one
dependent or endogenous variable, we have a simultaneous equation model. When estimating a
simultaneous equation model, the relationships in a system of equations have to be estimated
taking into account the fact that the dependent variables are conceptually or mathematically
interdependent.
Our model can not be estimated by means of an Ordinary Least Squares (OLS) regression since
this would produce biased and inconsistent estimates (simultaneous equation bias). One of the
fundamental assumptions of OLS is violated: for each equation, the independent variables are not
distributed independently of the disturbance term1 (Greene 1997). This correlation between
independent variables and disturbance term was found for the demand as wel as for the supply
equation.
When the OLS assumptions are violated, a simultaneous equation model can be estimated by
means of an instrumental variable technique being 3Stage Least Squares (3SLS). 3SLS is a
system method or a full information method: all the equations are estimated simultaneously,
taking due account of all restrictions on such equations by the omission or absence of some
variables. A full information technique is superior compared to a limited information technique
like OLS or 2Stage Least Squares. These techniques only estimate one equation at a time and do
not allow for correlations between the disturbances of the different equations. When checking for
correlation of the disturbances of the demand and supply equation, we found there was a
significant correlation. By consequence, we applied 3SLS to our model in order to obtain an
efficiency gain in the estimates of the parameters of our model (Greene 1997).
1 This correlation was tested by the Hausman specification test (Hausman 1976). It showed a high Chi² statistic and thus lead to a rejection of the null hypothesis of no correlation.
21
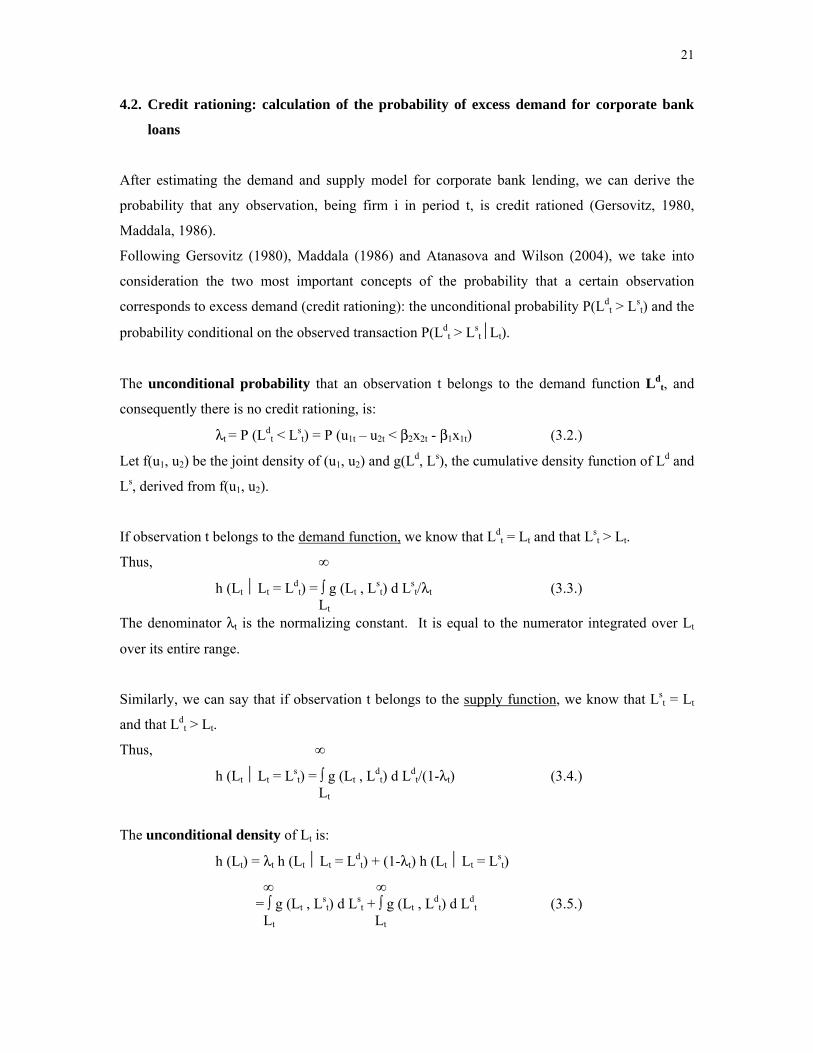
4.2. Credit rationing: calculation of the probability of excess demand for corporate bank
loans
After estimating the demand and supply model for corporate bank lending, we can derive the
probability that any observation, being firm i in period t, is credit rationed (Gersovitz, 1980,
Maddala, 1986).
Following Gersovitz (1980), Maddala (1986) and Atanasova and Wilson (2004), we take into
consideration the two most important concepts of the probability that a certain observation
corresponds to excess demand (credit rationing): the unconditional probability P(Ldt > Ls
t) and the
probability conditional on the observed transaction P(Ldt > Ls
t⏐Lt).
The unconditional probability that an observation t belongs to the demand function Ldt, and
consequently there is no credit rationing, is:
λt = P (Ldt < Ls
t) = P (u1t – u2t < β2x2t - β1x1t) (3.2.)
Let f(u1, u2) be the joint density of (u1, u2) and g(Ld, Ls), the cumulative density function of Ld and
Ls, derived from f(u1, u2).
If observation t belongs to the demand function, we know that Ldt = Lt and that Ls
t > Lt.
Thus, ∞
h (Lt ⏐ Lt = Ldt) = ∫ g (Lt , Ls
t) d Lst/λt (3.3.)
Lt The denominator λt is the normalizing constant. It is equal to the numerator integrated over Lt
over its entire range.
Similarly, we can say that if observation t belongs to the supply function, we know that Lst = Lt
and that Ldt > Lt.
Thus, ∞
h (Lt ⏐ Lt = Lst) = ∫ g (Lt , Ld
t) d Ldt/(1-λt) (3.4.)
Lt
The unconditional density of Lt is:
h (Lt) = λt h (Lt ⏐ Lt = Ldt) + (1-λt) h (Lt ⏐ Lt = Ls
t)
∞ ∞ = ∫ g (Lt , Ls
t) d Lst + ∫ g (Lt , Ld
t) d Ldt (3.5.)
Lt Lt
22
The likelihood function is:
L = Π h (Lt) (3.6.) t Thus, after estimating the parameters of the demand and supply model, the probability that an
observation belongs to the demand or supply function can be estimated. Maddala and Nelson
(1974) suggest doing this by estimating λt in (3.2.). These are the (unconditional) probabilities as
calculated in Sealey (1979). Gersovitz (1980) suggests calculating the conditional probability
being:
P (Ldt < Ls
t⏐ Lt), (3.7.)
and to classify an observation, firm i in period t, as belonging to the demand function if this
probability is >0.5. Then, that firm is not credit rationed in the particular period t. The
observation belongs to the supply function if the probability is <0.5. This firm is classified as
credit rationed in the period t.
Thus: ∞
P (Ldt < Ls
t⏐ Lt) = ∫ g (Lt, Lst) d Ls
t / h (Lt) (3.8.) Lt
where h (Lt) is defined in (3.5.)
Lee (1983) shows that the classification rule, also suggested by Gersovitz (1980), is optimal in
the sense that the total probability of misclassifications is minimized.
This decision rule will also be used in this empirical study. To put it into more concrete terms,
we calculate for each observation i in period t:
P (β1x1t - β2x2t > u2t – u1t) σ σ The error terms are assumed to be distributed normally; σ² = var(u2t – u1t), β1x1t is the
unconditional expectation of Ldt and β2x2t is the unconditional expectation of Ls
t. The
unconditional expectation of Ldt is higher than the unconditional expectation of Ls
t if P(Ldt > Ls
t)
> 0.5. We remark that firms that are not classified as credit rationed in one period t, can be
classified as credit rationed in another period. Switching between both categories throughout
time is possible (Ogawa en Suzuki, 2000).
23
4.3. Data
4.3.1. Population and sample
The population of Belgian firms consists of those firms satisfying the following conditions:
- small or medium sized firm according to Belgian law2;
- not being active in the agriculture or forestry industry or being a financial institution;
- having more than 10 employees;
- still active in 1998;
- not publicly noted;
- the published accounts for each year meet all the requirements set by the National Bank
of Belgium;
- being a limited company (‘NV’) or a limited liability company (‘(E)BVBA’);
A panel data set, consisting of 2.698 randomly selected small and medium size Belgian firms for
the period 1993-2001, is being used to estimate the disequilibrium model of Belgian SME
corporate bank lending. Each observation x in our sample (xit) or database consists of the data
(being published accounts) for one firm i in one particular year t. Thus, each firm can appear
repeatedly in our sample: for each year of its existence in the period 1993-2001 one observation x
can be found. For the total of 2.698 firms, we become a sample consisting of 18664 published
accounts reporting data on short term bank debt and 18627 published accounts reporting data on
long term bank debt. In this sample, also ‘null’ values are included of firms who do not have
short term or long term bank debt in a particular year. Our dataset includes firms which existed
already before 1993, as well as firms which were set up in the period 1993-2001. By
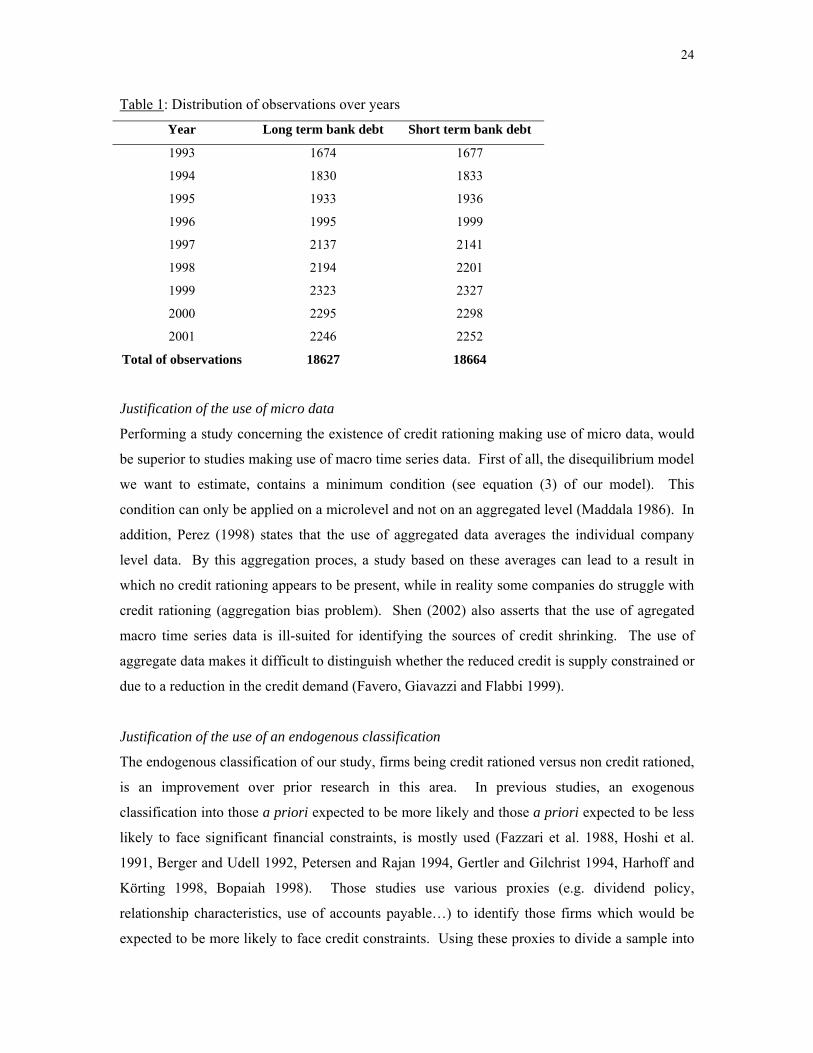
consequence, the panel is not balanced. Table 1 reports the distribution of observations over
years for our sample.
2 The definition used for ‘Small and medium sized firms’ is the definition set forward by Belgian law as companies which don’t exceed more than one of the following criteria: - maximum of 50 employees - maximum sales of 6.250.000 euro - maximum total of assets of 3.125.000 euro and do not have more than 100 employees.
24
Table 1: Distribution of observations over years
Year Long term bank debt Short term bank debt
1993 1674 1677
1994 1830 1833
1995 1933 1936
1996 1995 1999
1997 2137 2141
1998 2194 2201
1999 2323 2327
2000 2295 2298
2001 2246 2252
Total of observations 18627 18664
Justification of the use of micro data
Performing a study concerning the existence of credit rationing making use of micro data, would
be superior to studies making use of macro time series data. First of all, the disequilibrium model
we want to estimate, contains a minimum condition (see equation (3) of our model). This
condition can only be applied on a microlevel and not on an aggregated level (Maddala 1986). In
addition, Perez (1998) states that the use of aggregated data averages the individual company
level data. By this aggregation proces, a study based on these averages can lead to a result in
which no credit rationing appears to be present, while in reality some companies do struggle with
credit rationing (aggregation bias problem). Shen (2002) also asserts that the use of agregated
macro time series data is ill-suited for identifying the sources of credit shrinking. The use of
aggregate data makes it difficult to distinguish whether the reduced credit is supply constrained or
due to a reduction in the credit demand (Favero, Giavazzi and Flabbi 1999).
Justification of the use of an endogenous classification
The endogenous classification of our study, firms being credit rationed versus non credit rationed,
is an improvement over prior research in this area. In previous studies, an exogenous
classification into those a priori expected to be more likely and those a priori expected to be less
likely to face significant financial constraints, is mostly used (Fazzari et al. 1988, Hoshi et al.
1991, Berger and Udell 1992, Petersen and Rajan 1994, Gertler and Gilchrist 1994, Harhoff and
Körting 1998, Bopaiah 1998). Those studies use various proxies (e.g. dividend policy,
relationship characteristics, use of accounts payable…) to identify those firms which would be
expected to be more likely to face credit constraints. Using these proxies to divide a sample into
25
two groups, the credit rationed firms versus the non credit rationed, creates at least two problems.
First, companies are in this set up not allowed to switch between both groups (credit rationed to
non credit rationed or vice versa) over time. Second, some of those proxies are the endogenous
outcome of management decisions of a company e.g. decisions concerning dividend policy,
company structure… By consequence, these proxies are not appropriate measures for credit
rationing. We pursue the new methodology based on an endogenous classification applied by
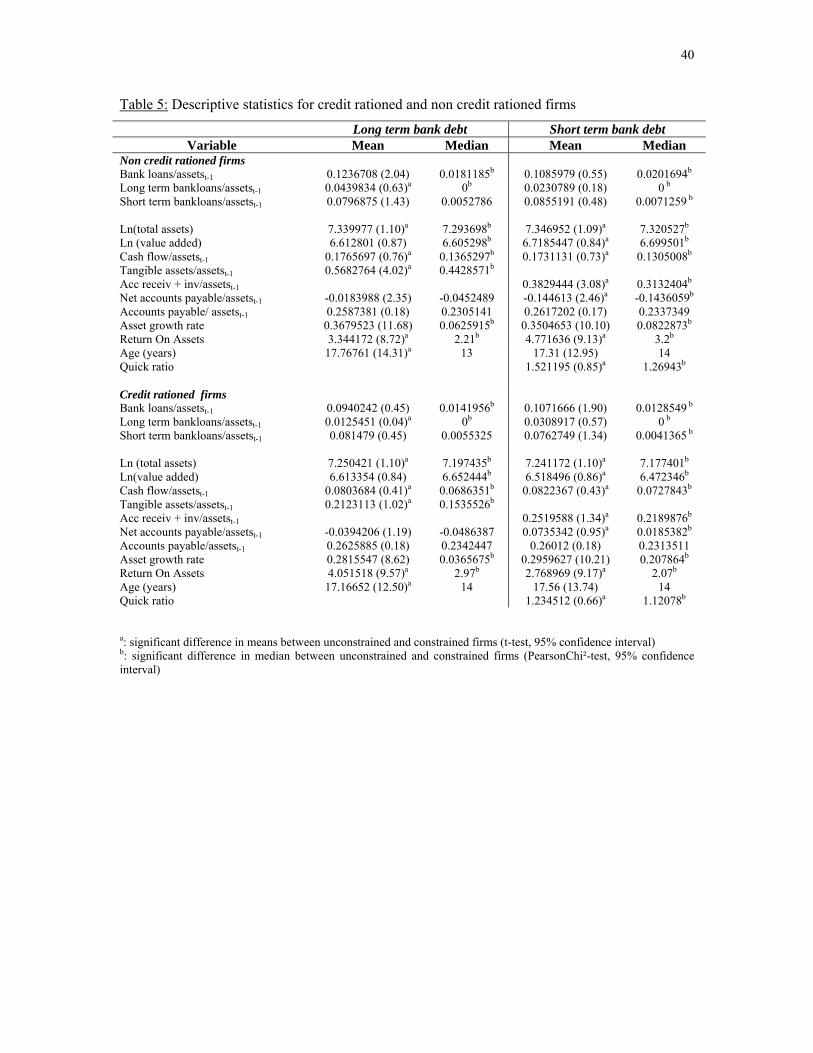
Atanasova and Wilson (2004) and Ogawa and Suzuki (2000). 4.3.2. Descriptive statistics
Outliers were removed by means of the method developed by Hadi (1992, 1994). A measure of
distance from an observation to a cluster of points is defined. A base cluster of r points is
selected and then that cluster is continually redefined by taking r+1 points ‘closest’ to the cluster
as the new base cluster.
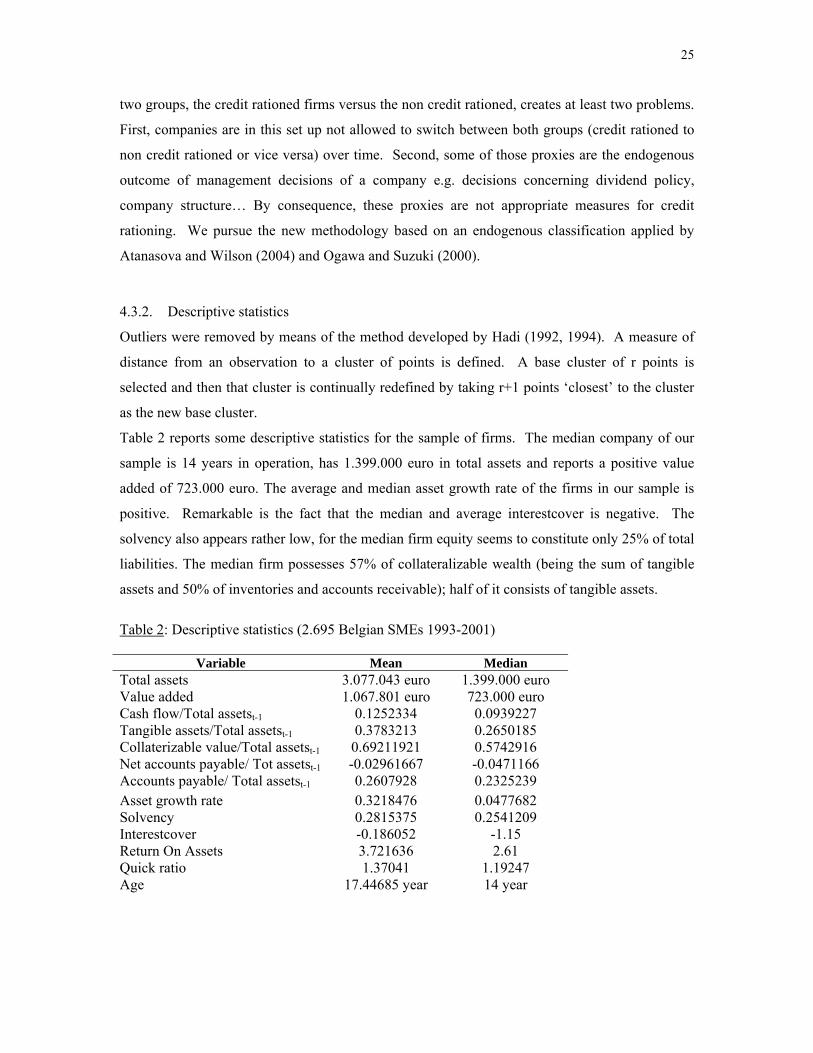
Table 2 reports some descriptive statistics for the sample of firms. The median company of our
sample is 14 years in operation, has 1.399.000 euro in total assets and reports a positive value
added of 723.000 euro. The average and median asset growth rate of the firms in our sample is
positive. Remarkable is the fact that the median and average interestcover is negative. The
solvency also appears rather low, for the median firm equity seems to constitute only 25% of total
liabilities. The median firm possesses 57% of collateralizable wealth (being the sum of tangible
assets and 50% of inventories and accounts receivable); half of it consists of tangible assets. Table 2: Descriptive statistics (2.695 Belgian SMEs 1993-2001)
Variable Mean Median Total assets 3.077.043 euro 1.399.000 euro Value added 1.067.801 euro 723.000 euro Cash flow/Total assetst-1 0.1252334 0.0939227 Tangible assets/Total assetst-1 0.3783213 0.2650185 Collaterizable value/Total assetst-1 0.69211921 0.5742916 Net accounts payable/ Tot assetst-1 -0.02961667 -0.0471166 Accounts payable/ Total assetst-1 0.2607928 0.2325239 Asset growth rate 0.3218476 0.0477682 Solvency 0.2815375 0.2541209 Interestcover -0.186052 -1.15 Return On Assets 3.721636 2.61 Quick ratio 1.37041 1.19247 Age 17.44685 year 14 year
26
5. ESTIMATION RESULTS
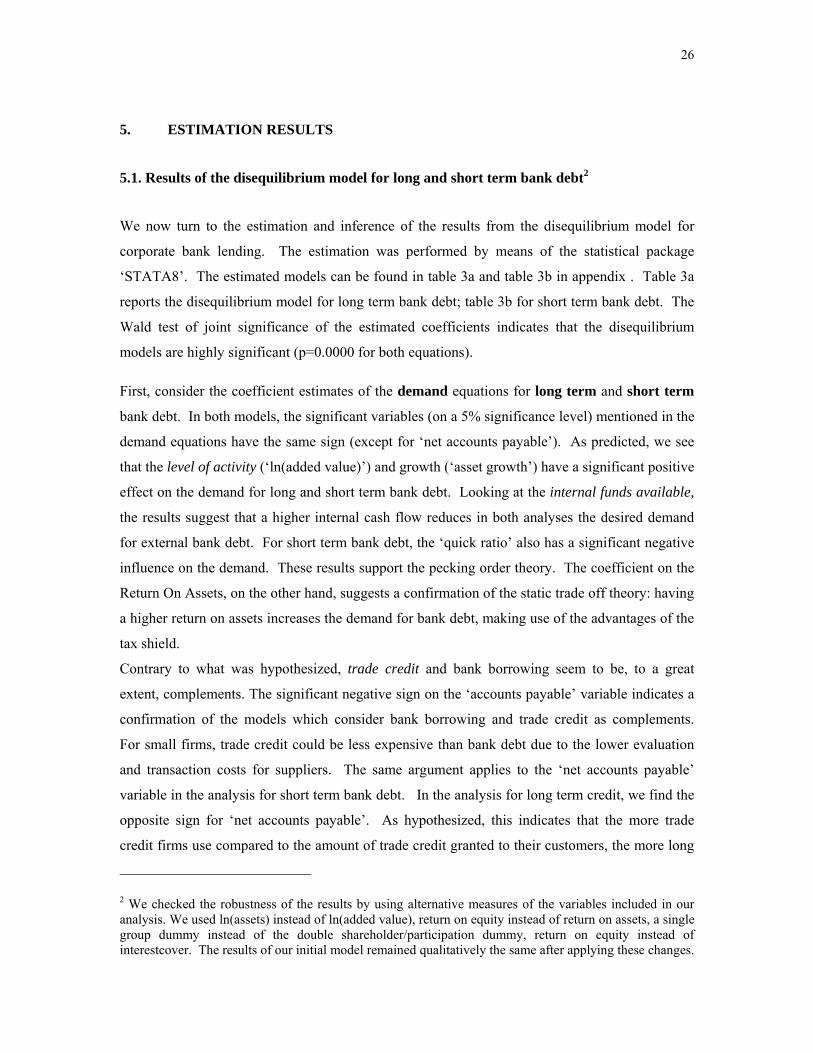
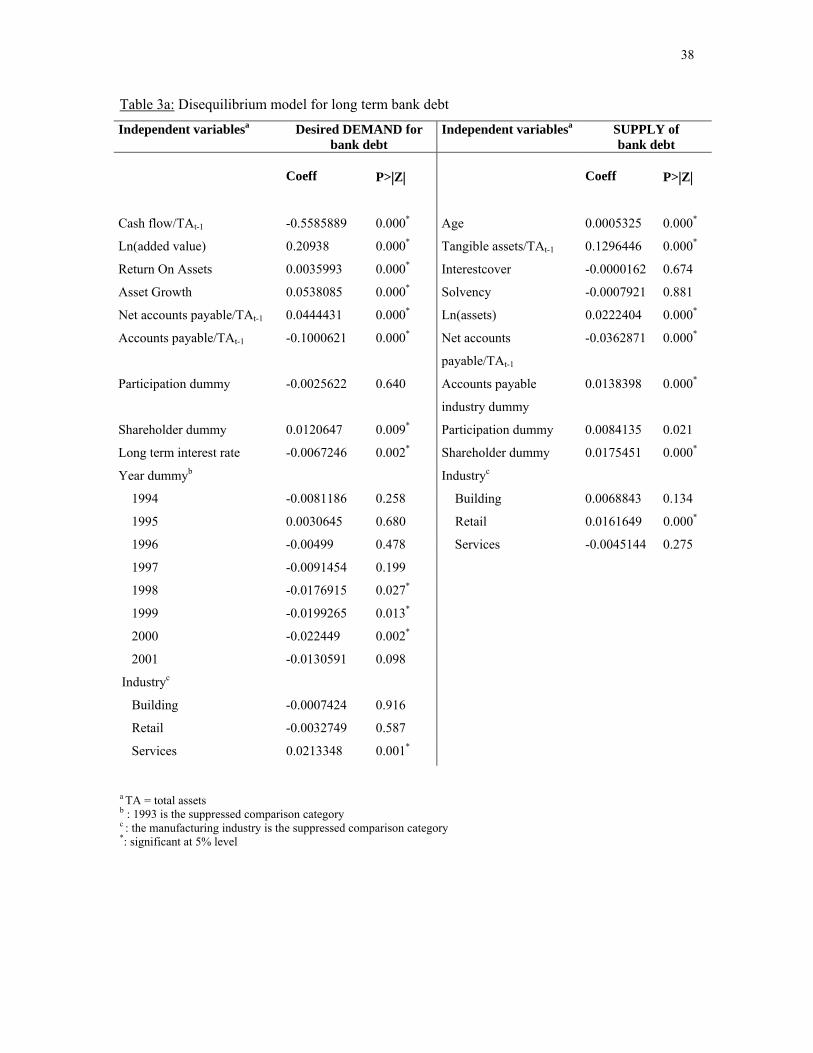
5.1. Results of the disequilibrium model for long and short term bank debt2
We now turn to the estimation and inference of the results from the disequilibrium model for
corporate bank lending. The estimation was performed by means of the statistical package
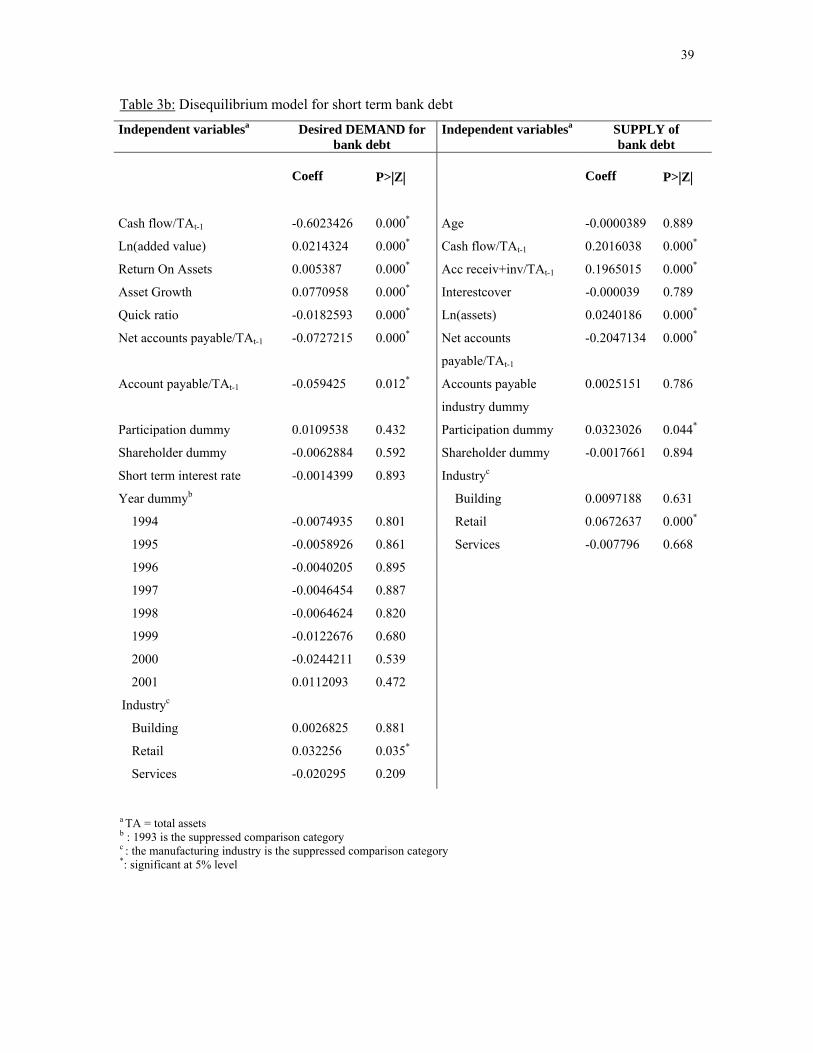
‘STATA8’. The estimated models can be found in table 3a and table 3b in appendix . Table 3a
reports the disequilibrium model for long term bank debt; table 3b for short term bank debt. The
Wald test of joint significance of the estimated coefficients indicates that the disequilibrium
models are highly significant (p=0.0000 for both equations). First, consider the coefficient estimates of the demand equations for long term and short term
bank debt. In both models, the significant variables (on a 5% significance level) mentioned in the
demand equations have the same sign (except for ‘net accounts payable’). As predicted, we see
that the level of activity (‘ln(added value)’) and growth (‘asset growth’) have a significant positive
effect on the demand for long and short term bank debt. Looking at the internal funds available,
the results suggest that a higher internal cash flow reduces in both analyses the desired demand
for external bank debt. For short term bank debt, the ‘quick ratio’ also has a significant negative
influence on the demand. These results support the pecking order theory. The coefficient on the
Return On Assets, on the other hand, suggests a confirmation of the static trade off theory: having
a higher return on assets increases the demand for bank debt, making use of the advantages of the
tax shield.
Contrary to what was hypothesized, trade credit and bank borrowing seem to be, to a great
extent, complements. The significant negative sign on the ‘accounts payable’ variable indicates a
confirmation of the models which consider bank borrowing and trade credit as complements.
For small firms, trade credit could be less expensive than bank debt due to the lower evaluation
and transaction costs for suppliers. The same argument applies to the ‘net accounts payable’
variable in the analysis for short term bank debt. In the analysis for long term credit, we find the
opposite sign for ‘net accounts payable’. As hypothesized, this indicates that the more trade
credit firms use compared to the amount of trade credit granted to their customers, the more long
2 We checked the robustness of the results by using alternative measures of the variables included in our analysis. We used ln(assets) instead of ln(added value), return on equity instead of return on assets, a single group dummy instead of the double shareholder/participation dummy, return on equity instead of interestcover. The results of our initial model remained qualitatively the same after applying these changes.
27
term bank debt they would actually desire. This could indicate that the firms which are rationed
by banks, rely on suppliers to fulfill their need for additional long term finance. Trade credit may
play a role in mitigating the credit rationing problem as firms can appeal to trade credit when
faced with borrowing constraints.
As far as the ownership structure is considered, we see that only the shareholder dummy is
positively significant but only in the model for long term bank debt. Contrary to what was
hypothesized, being (partly) owned by another firm by means of equity shares and thus having a
shareholder, increases the demand for long term bank debt. A possible explanation for this
surprising result, might be the fact that being part of a group increases the demand for long term
bank debt in order to transfer this money to other (possible smaller) firms of the group who suffer
from credit rationing but want to invest and expand (Ghatak and Kali 2001).
The coefficient of the cost of capital for bank debt is significantly negative as was expected. A
higher interest rate, reduces the desire for long term bank debt. As far as the industry is
concerned, the results suggest that retail firms would like more short term bank debt compared to
production firms. This could be explained by the need to finance the period between the purchase
of goods for resale and their actual sale and payment by the customer. Moreover, the results
indicate that firms which provide services would like more long term bank debt compared to
production firms. This could be due to the fact that for firms in the services industry who supply
intangibles to its customers, it may take longer to develop an idea or a project which satisfies the
needs of the customer. To bridge over this longer period, more long term bank debt is desired.
Examining the time dummies, we only find significant effects for the model for short term bank
debt. For the dummies of 1998, 1999 and 2000, the results suggest that the desired demand for
short term bank debt decreases more and more throughout time, compared to 1993. In 2001, we
see a slight reversal compared to 2000 (significant at 10%), increasing the demand for short term
bank debt again by 1%.
The estimation results of the equations of the supply of long and short term bank debt are
mainly in line with our hypotheses set forward previously. In both models, the significant
variables (on a 5% significance level) mentioned in both supply equations have the same sign.
A firm which is characterized by a higher risk degree, will be offered less long and short term
credit by banks. The results indicate that the size of the firm measured by the amount of assets
(‘ln(assets)’), has a significant positive effect on the amount of bank debt supplied to a firm. In
both analyses, one dummy variable concerning the industry, being ‘retail’ is positively
significant, meaning that being active in the retail industry reduces the risk for the banks
28
compared to those being active in the production industry and thus improves the availability of
bank debt. Surprisingly, the risk measures ‘interestcover’ and ‘solvency’ appear not to be
significant in either analysis. Concerning the supply of long term credit, the positive significant
coeffient for ‘age’ of the firm indicates that older firms are offered more long term bank debt.
For the supply of short term credit, the cash flow seems to be an important measure of risk. As
hypothesized, a higher cash flow increases the availability of short term bank debt.
Another very important element in the analysis is the amount of collateral available within a firm,
which can be a risk mitigation towards the bank. As hypothesized, the amount of tangible assets
available to offer as collateral, is positively related to the amount of long term credit offered by
banks. For short term bank debt, the amount of accounts receivable and inventories which can be
offered as collateral, appear to be an important determinant of short term bank debt availability.
The coefficient of this variable has a significant positive sign.
The results suggest that the use of more trade credit compared to the amounts of accounts
receivable (‘net accounts payable’), reduces the amount of short and long term bank debt offered.
This contradicts our hypothesis but agrees to the financing theory. Using more trade credit,
compared to the trade credit granted to their customers, is a negative sign for the banks and
reduces the availability of bank debt. In the analysis of long term bank debt, even the accounts
payable industry dummy is positively significant, as was expected. It confirms the signaling
value of trade credit for the supply of long term bank debt: if a firm uses more trade credit than
the average use by the firms active in the same industry, it increases the amount of long term
bank debt offered.
The ownership structure appears to be significant in both analysis: in analysing the supply of long
term bank debt, having a shareholder as well as having a participation increases the availability of
long term bank debt. In analysing the supply of short term bank debt, only the participation
dummy is significant. This confirms our hypothesis.
5.2. Calculation of the proportion of credit rationed firms for long term and short term
bank debt
After estimating our simultaneous equation models consisting of the demand and supply
functions for short and long term bank debt, we can obtain the fitted values for our model
concerning the quantity of bank debt demanded and supplied. When the demand for long (or
short) term bank debt exceeds the supply of long (or short) term credit in a certain year t for a
29
firm i, firm i copes with credit rationing for long (or short) term bank debt in that particular year t.
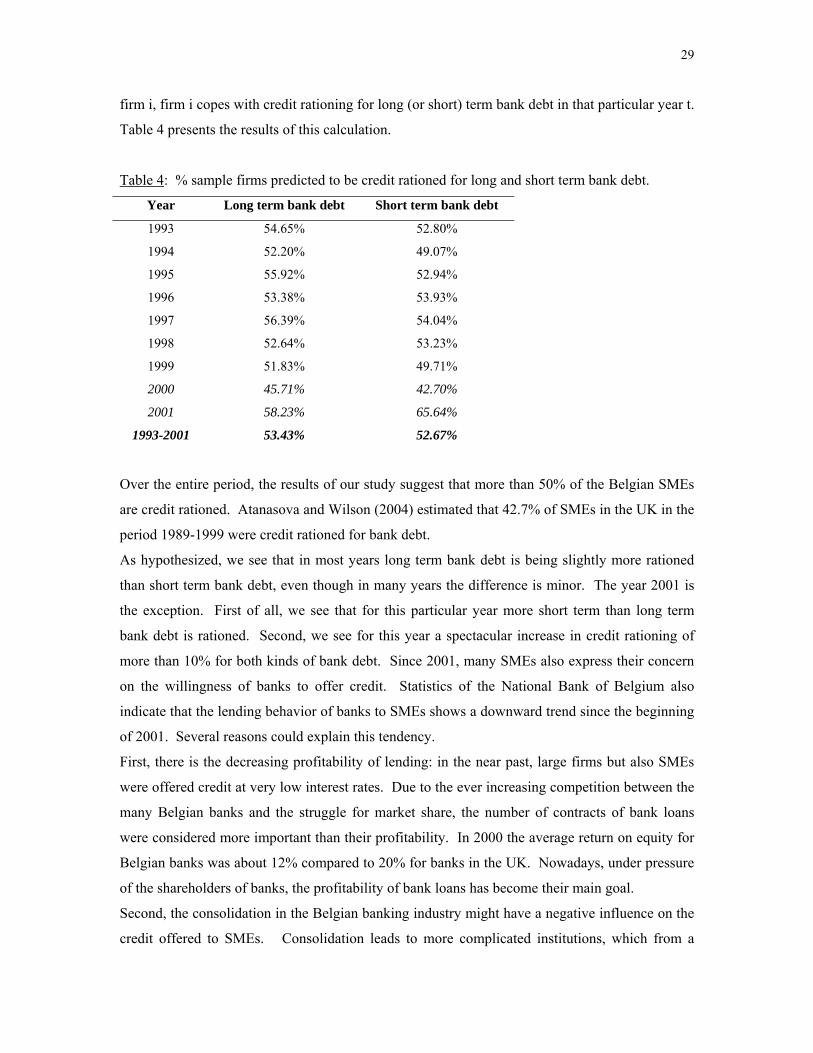
Table 4 presents the results of this calculation.
Table 4: % sample firms predicted to be credit rationed for long and short term bank debt.
Year Long term bank debt Short term bank debt
1993 54.65% 52.80%
1994 52.20% 49.07%
1995 55.92% 52.94%
1996 53.38% 53.93%
1997 56.39% 54.04%
1998 52.64% 53.23%
1999 51.83% 49.71%
2000 45.71% 42.70%
2001 58.23% 65.64%
1993-2001 53.43% 52.67%
Over the entire period, the results of our study suggest that more than 50% of the Belgian SMEs
are credit rationed. Atanasova and Wilson (2004) estimated that 42.7% of SMEs in the UK in the
period 1989-1999 were credit rationed for bank debt.
As hypothesized, we see that in most years long term bank debt is being slightly more rationed
than short term bank debt, even though in many years the difference is minor. The year 2001 is
the exception. First of all, we see that for this particular year more short term than long term
bank debt is rationed. Second, we see for this year a spectacular increase in credit rationing of
more than 10% for both kinds of bank debt. Since 2001, many SMEs also express their concern
on the willingness of banks to offer credit. Statistics of the National Bank of Belgium also
indicate that the lending behavior of banks to SMEs shows a downward trend since the beginning
of 2001. Several reasons could explain this tendency.
First, there is the decreasing profitability of lending: in the near past, large firms but also SMEs
were offered credit at very low interest rates. Due to the ever increasing competition between the
many Belgian banks and the struggle for market share, the number of contracts of bank loans
were considered more important than their profitability. In 2000 the average return on equity for
Belgian banks was about 12% compared to 20% for banks in the UK. Nowadays, under pressure
of the shareholders of banks, the profitability of bank loans has become their main goal.
Second, the consolidation in the Belgian banking industry might have a negative influence on the
credit offered to SMEs. Consolidation leads to more complicated institutions, which from a
30
theoretical point of view would lead to a decrease in the amount of credit offered to SMEs.
According to the organization model of Williamson (1967), organizational diseconomies are
present in extending credit by large banks to small firms.
Third, the new Basel II Capital Accord, that obliges banks to hold a minimum of capital
depending on the risk degree of the credit they extend to firms, might affect the amount of credit
extended to SMEs in a negative way. One of the goals of Basel II is to fit the amount of equity of
a bank to the real risk exposure of the banks in order to offer a better protection to the depositors.
Unfortunately for SMEs, the loans offered to them generally have an inherent larger risk degree
compared to loans offered to large firms. Consequently, banks might have to hold more capital
for the credit they offer to small firms. Since capital is scarce and has to be used as efficient as
possible, this could have a negative effect on the amount of credit offered to SMEs.
Table 5 in appendix shows some descriptive statistics for the credit rationed versus non credit
rationed firms in our sample. We see that on average, long term rationed firms finance only 1.2%
of their assets with long term bank loans whereas the unconstrained firms finance 4.4% of their
assets with long term bank loans. These rationed firms have only 9.4% of their assets financed
with bank debt versus 12.4% for the non credit rationed firms. Firms which are rationed for short
term bank debt, finance only 7.6% of their assets with short term debt versus 8.6% for the
unconstrained firms. The constrained and unconstrained firms finance almost the same
proportion of their assets with bank debt.
The results reveal that credit rationed firms for short term bank debt are smaller, faster growing
firms with a low return on assets, added value, quick ratio and cash flow to assets ratio.
Moreover, they also have much less accounts receivable and inventories to offer as collateral.
For long term bank debt, we see that the credit rationed firms are in general smaller and younger
firms with low cash flow to assets ratios and a low growth rate and much less to offer as collateral
compared to unconstrained firms. Surprisingly, the constrained firms have a higher added value
and return on assets ratio than unconstrained firms. This can be due to the desire of the bank to
encourage firms to use their own profits to finance long term investments in order for the bank to
ascertain itself of the belief of the firm in its own project and avoid risk shifting.
Remarkable is the fact that especially the collateral ratios are significantly different: the balance
sheet of rationed firms for long term credit consists of 21% of tangible assets versus 57% for non
rationed firms. The balance sheet of rationed firms for short term credit consists of 25% of
accounts receivable and inventories to be offered as collateral versus 38% for non rationed firms.
31
In general, our results contradict many of the findings of Atanasova and Wilson (2004) who did
not make the distinction between long and short term debt and found that in the U.K. constrained
firms had a higher cash flow to assets ratio and were fast growing.
5. CONCLUSION A large panel data set consisting of 2.698 Belgian SMEs was used to estimate the disequilibrium
models of demand and supply of long and short term corporate bank loans. No previous study
was found estimating the existence of credit rationing in a bank based economic system. The
novelty of this study is that the model estimated is a disequilibrium model, allowing for the
existence of credit rationing. Moreover, firms are endogenously classified as credit rationed or
non rationed. No ex ante separation in two groups has to be made and thus firms can switch
between both groups from one year to another.
The results of our study indicate that, over the entire period, 53.43% of the Belgian SMEs are
credit rationed for long term bank debt and 52.67% for short term bank debt. In most years, long
term bank debt is being slightly more rationed than short term bank debt except for the year 2001.
For this particular year, more short term than long term bank debt is rationed and a spectacular
increase in credit rationing of more than 10% for both kinds of bank debt arises.
The results reveal that credit rationed firms for short term bank debt are smaller, faster growing
firms with a low return on assets, added value, quick ratio and cash flow to assets ratio.
Moreover they also have much less accounts receivable and inventories to offer as collateral.
For long term bank debt, we see that the credit rationed firms are in general smaller and younger
firms with low cash flow to assets ratios and a low growth rate and much less to offer as collateral
compared to unconstrained firms. Surprisingly, the constrained firms have a higher added value
and return on assets ratio than unconstrained firms.
We can conclude from both analyses that in Belgium, mainly young, small SMEs with little
internal resources and a lack of assets to guarantee the repayment of debt, are most likely to be
suffering from credit rationing.
32
References Akerlof, G., 1970, The market for lemons: quality uncertainty and the market mechanisms,
Quarterly Journal of Economics 84, 488-500. Alphonse, P., Ducret, J. and E. Séverin, 2004, When trade credit facilitates access to bank
finance: evidence from US small business data, Working paper presented at EFMA 2004. Anderson, R.C., Mansi, S.A. and D.M. Reeb, 2003, Founding family ownership and the agency
cost of debt, Journal of Financial Economics 68, 263-285. Ans, J.S., Cole, R.A. and J.W. Lin, 2000, Agency costs and ownership structure, Journal of
Finance 55(1), 81-106. Ang, J.S., 1992, On the theory of finance for privately held firms, Journal of Small Business
Finance 1(3), 185-203. Ang, J.S., 1991, Small business uniqueness and the theory of financial management, Journal of
Small Business Finance 1(1), 1-13. Arrow, K.J., 1963, Uncertainty and the welfare economics of medical care, American Economic
Review 53, 941-973. Asselbergh, G., 2002, Financing firms with restricted access to financial markets: the use of trade
credit and factoring in Belgium, The European Journal of Finance 8, 2-20. Atanasova, C.V. and N. Wilson, 2004, Disequilibrium in the UK corporate loan market, Journal
of Banking and Finance 28, 595-614. Audretsch, D. and J. Elston, 2002, Does firm size matter? Evidence on the impacts of liquidity
constraints on firm investment behavior in Germany, International Journal of Industrial Organization 20, 1-17.
Audretsch, D. and J. Elston, 1997, Financing the German mittelstand, Small Business Economics 9, 97-110.
Azzi, C.F. and J.C. Cox, 1976, A theory and test of credit rationing: comment, American Economic Review 66, 911-917.
Baltensperger, E., 1978, Credit rationing: issues and questions, Journal of Money, Credit and Banking 10, 170-183.
Barton, S.L. and C.H. Matthews, 1989, Small firm financing : implications from a strategic management perspective, Journal of Small Business Management, 1-7.
Barton, S.L. and P.J. Gordon, 1987, Corporate strategy: useful perspective for the study of capital structure?, Academy of Management Review 12(1), 67-75.
Beck, T. and R. Levine, 2002, Industry growth and capital allocation: does having a market- or bank-based system matter?, Journal of Financial Economics 64, 147-180.
Berger, A.N. and G.F. Udell, 1992, Some evidence on the empirical significance of credit rationing, Journal of Political Economy 100, 1047-1077.
Berger, A.N. and G.F. Udell, 1998, The economics of small business finance: the roles of private equity and debt markets in the financial growth cycle, Journal of Banking and Finance 22, 613-673.
Berger, A.N. and G.F. Udell, 2002, Small business credit availability and relationship lending : the importance of bank organisational structure, Economic Journal 112, F32 - F54.
Besanko, D. and A. Thakor, 1987a, Collateral and rationing : sorting equilibria in monopolistic and competitive credit markets, International Economic Review 28 (3), 671-689.
Besanko, D. and A. Thakor, 1987b, Competitive equilibrium in the credit market under asymmetric information, Journal of Economic Theory 42, 167-182.
Bester, H., 1985, Screening vs. rationing in credit markets with imperfect information, American Economic Review 75, 850-855.
Bester, H., 1987, The role of collateral in credit markets with imperfect information, European Economic Review 31(4), 887-899.
33
Bhattacharya, S. and A. Thakor, 1993, Contemporary banking theory, Journal of Financial Intermediation 3, 2-50.
Bias, B., Hillion, P. and Malécot, J.F., 1995, La structure financière des entreprises: une investigation empirique sur données françaises’, Economie et Prévision 120, 15-28.
Biais, B. and C. Gollier, 1997, Trade credit and credit rationing, Review of Financial Studies10(4), 903-937.
Blinder, A. and J. Stiglitz, 1983, Money, credit constraints, and economic activity, American Economic Review papers and proc. 73, 297-302.
Boot, A., Thakor, A. and Udell, G.F., 1991, Secured lending and default risk : equilibrium analysis, policy implications and empirical results, Economic Journal 101, 458-472.
Bopaiah, C., 1998,Availability of credit to family businesses,Small Business Economics 11,75-86. Bruce, N. and Waldman, M., 1990, The rotten kid theorem meets the Samaritan’s dilemma,
Quarterly Journal of Economics 105, 155-165. Calcagnini, G. and D. Iacobucci, 1997, Small firm investment and financing decisions: an option
value approach, Small Business Economics 9, 491-502. Chaganti, R., DeCarolis D. and D., Deeds, 1995, Predictors of capital structure in small ventures,
Entrepreneurship theory and Practice 20, 7-18. Chan, Y.S. and G. Kanatas, 1985, Asymmetric valuation and the role of collateral in loan
agreements, Journal of Money, Credit and Banking 17, 85-95. Chance, D.M., 1982, Evidence on a simplified model of systematic risk, Financial Management
11(3), 53-63. Chittenden, F., Hall, G. and P. Hutchinson, 1996, Small firm growth, access to capital markets
and financial structure : review of issues and an empirical investigation, Small Business Economics 8, 59-67.
Chua, J., Chrisman, J. and P. Sharma, 1999, Defining the family business by behavior, Entrepreneurship Theory and Practice 23(4), 19-39.
Commission of the European Community, 2001, Access of firms to finance, Working paper. Cook, L.D., 1999, Trade credit and bank finance: financing small firms in Russia, Journal of
Business Venturing 14, 493-518. Cowling, M. and Mitchell, P., 2003, Is the small firms loan guarantee scheme hazardous for
banks or helpful to small business?, Small Business Economics 21, 63-71. Cressy, R. and C. Olofsson, 1997a, European SME financing: an overview, Small Business
Economics 9, 87-96. Cressy, R. and C. Olofsson, 1997b, The financial conditions for Swedish SMEs: survey and
research agenda, Small Business Economics 9, 179-194. Cressy, R., 1995, Business borrowing and control: a theory of entrepreneurial types, Small
Business Economics 7, 291-300. Das, P.K., 2004, Credit rationing and firms investment and production decisions, International
Review of Economics and Finance 13, 87-114. De Meza, D. and D. Webb, 1987, Too much investment : a problem of asymmetric information,
Quarterly Journal of Economics 102, 281-292. Deloof, M., 1995, Verbondenheid en financiering van Belgische ondernemingen, Maandschrift
Economie 59, 298-323. Deloof, M. and M. Jegers, 1996, Trade credit, product quality, and intragroup trade: some
European evidence, Financial Management 25(3), 33-43. Deloof, M. and Jegers, M., 1999, Trade credit, corporate groups and the financing of Belgian
firms, Journal of Business Finance and Accounting 26(7)-(8), 945-966. Diamond, D., 1989, Reputation acquisition in debt markets, Journal of Political Economy 97(4),
828-862. Donckels, R. and E. Fröhlich, 1991, Are family businesses really different ? European
experiences from STRATOS, Family Business Review 4(2), 149-160.
34
Duca, J., 1986, Trade credit and credit rationing: a theoretical model, Research papers in Banking and Financial Economics, Board of Governors of the Federal Reserve System.
Durinck, E., Laveren, E. and N. Lybaert 1997, The impact of sales growth above a sustainable level on the financing choice of belgian industrial SMEs, Working paper 97-257 University of Antwerp.
Egeln, J., Licht, G. and F. Steil, 1997, Firm foundations and the role of financial constraints, Small Business Economics 9, 137-150.
Eisenhard, K.M., 1989, Agency theory: an assessment and review, Academy of Management Review 14, 57-74.
Emery, G.W., 1984, A pure financial explanation for trade credit, Journal of Financial and Quantitative Analysis 19, 271-285.
Fair, R.C. and D.M. Jaffee, 1972, Methods of estimation for markets in disequilibrium, Econometrica 40, 497-514.
Fair, R.C. and H.H. Kelejian, 1974, Methods of estimation for markets in disequilibrium: a further study, Econometrica 42, 177-190.
Fama, E.F. and M.C. Jensen, 1983, Separation of ownership and control, Journal of Law and Economics 26, 301-325.
Fama, E.F. and K.R. French, 2002, Testing trade-off and pecking order predictions about dividends and debt, Review of Financial Studies 15(1), 1-33.
Fazzari, S.M., Hubbard, R.G. and B.R. Petersen, 1988, Financing constraints and corporate investment, Brookings Papers on Economic Activity, 141-195.
Freimer, M. and M.J. Gordon M.J., 1965, Why bankers ration credit, Quarterly Journal of Economics 79, 397-416.
Gale, D. and M. Hellwig, 1984, Incentive-compatible contracts: the one-period problem, Review of Economic Studies 52(4), 647-663.
Gallo, M.A. and A. Vilaseca, 1996, Finance in family business, Family Business Review 9(4), 387-401.
Gertler, M. and S. Gilchrist, 1994, Monetary policy, business cycles and the behaviour of small manufacturing firms, Quarterly Journal of Economics 109 (2), 309-340.
Ghatak, M. and R. Kali, 2001, Financially interlinked business groups, Journal of Economics and Management Strategy 10(4), 591-619.
Goldfeld, S.M. and R.E. Quandt, 1981, Single market disequilibrium models: estimation and testing, Journal of Econometrics 13, 157-172.
Goyal, V.K., Lehn, K. and S. Racic, 2002, Growth opportunities and corporate debt policy: the case of the U.S. defense industry, Journal of Financial Economics 64, 35-59.
Hadi, A.S., 1992, Identifying multiple outliers in multivariate data, Journal of Royal Statistical Society Series B 54(3), 761-771.
Hadi, A.S., 1994, A modification of a method for the detection of outliers in multivariate samples, Journal of Royal Statistical Society Series B 56(2), 393-396.
Hamilton, R. and M.A. Fox, 1998, The financing preferences of small firm owners, International Journal of Entrepreneurial Behaviour & Research 4(3), 239-248.
Harhoff, D. and T. Körting, 1998, Lending relationships in Germany – Empirical evidence from survey data, Journal of Banking and Finance 22(10-11), 1317-1353.
Harris, M. and A., Raviv, 1990, Capital structure and the informational role of debt, Journal of Finance 45(1), 321-349.
Hausman, J.A., 1976, Specification tests in econometrics, Econometrica 43, 1251-1271. Hendry, J., 2002, The principal’s other problems: honest incompentence and the specification of
objectives, Academy of Management Review 27, 98-113. Hodgman,D.R.,1960,Credit risk and credit rationing,Quarterly Journal of Economics 74,258-278. Holmes, S. and P. Kent, 1991, An empirical analysis of the financial structure of small and large
Australian manufacturing enterprises, Journal of Small Business Finance 1(2), 141-154.
35
Hooks, L.M., 2003, The impact of firm size on bank debt use, Review of Financial Economics 12, 173-189.
Hoshi, T., Kashyap, A. and D. Scharfstein, 1991, Corporate structure, liquidity, and investment: evidence from Japanese industrial groups, Quarterly Journal of Economics 106(1), 33-60.
Hughes, A., 1997, Finance for SMEs: a U.K. perspective, Small Business Economics 9, 151-166. Hutchinson, R.W., 1995, The capital structure and investment decisions of the small owner-
managed firm: some exploratory issues, Small Business Economics 7, 231-239. Jackson, T.H. and A.T. Kronman, 1979, Secured financing and priorities among creditors, The
Yale Law Journal 88, 1143-1182. Jaffee, D. and F. Modigliani, 1969, A theory and test of credit rationing, American Economic
Review 59(5), 850-872. Jaffee, D., 1971, Credit rationing and the commercial loan market,(John Wiley&Sons, New York) Jaffee, D. and T. Russell, 1976, Imperfect information, uncertainty, and credit rationing,
Quarterly Journal of Economics 90(4), 651-666. Jalilvand, A. and R. Harris, 1984, Corporate behaviour in adjusting to capital structure and
dividend targets: an econometric study, Journal of Finance 39(1), 127-145. James, H.S., Jr., 1999, Owner as manager: extended horizons and the family firm, International
Journal of the Economics of Business 6, 41-56. Jensen, M.C. and W.H. Meckling, 1976, Theory of the firm: managerial behavior, agency costs
and ownership structure, Journal of Financial Economics, 305-360. Kaulio, M.A., 2003, Initial conditions or process of development? Critical incidents in the early
stages of new ventures, R&D Management 33 (2), 165-175. Keasey, K. and R. Watson, 1995, The bank financing of small unlisted firms in the UK: an
analysis of recent conflicts, Journal of Small Business Finance 4(2/3), 143-164. Keynes, J.M., 1930, A treatise on money, England : MacMillan St. Martin’s Press. Kim, H.E., 1999, Was credit channel a key monetary transmission mechanism following the
recent financial crisis in the Republic of Korea?, The World Bank, Policy Research Working Paper 3003
King , R., 1986, Monetary transmission: through bank loans or bank liabilities?, Journal of Money, Credit and Banking 18(3), 290-303.
Kohler, M., Britton, E. and Yates, T., 2000, Trade credit and the monetary transmission mechanism, Working Paper (Bank of England ISSN 1368-5562).
Koskela, E., 1979, On the theory of rationing equilibria with special reference to credit markets : a survey, Zeitschrift für Nationalökonomie 1-2, 63-82.
Laffont, J.J. and R. Garcia, 1977, Disequilibrium econometrics for business loans, Econometrica 45(5), 1187-1204.
Leland, H. and D. Pyle, 1977, Information asymmetries, financial structure, and financial intermediaries, Journal of Finance 32(2), 371-387.
Lewellen, W.G., Mc Connell, J.J. and Scott, J.A., 1980, Capital market influences on trade credit policies, Journal of Financial Research 3, 105-113.
Longhofer S.D. and J.A. Santos, 2000, The importance of bank seniority for relationship lending, Journal of Financial Intermediation 9, 57-89.
Maddala, G.S. and F.D. Nelson, 1974, Maximum likelihood methods for models of markets in disequilibrium, Econometrica 42(6), 1013-1030.
Maddala, G.S., 1980, Disequilibrium, self-selection and switching models, Social Science Working Paper 303, California Institute of Technology, February.
Maddala, G.S., 1986, Disequilibrium , self-selection, and switching models, in ‘Handbook of econometrics, Vol. III, ed.Griliches, Z. and Intriligator, M.D.,Elsevier Science Publishers BV.
Maddala, G.S., 1987, Limited-dependent and qualitative variables in econometrics, Cambridge University Press.
Mann, R.J., 1997, Explaining the pattern of secured debt, Harvard Law Review 110, 625-683.
36
Mayer, C., 1988, New issues in corporate finance, European Economic Review 32, 1167-1189. Mc Mahon, R. and A. Stanger, 1995, Understanding the small enterprise financial objective
function, Entrepreneurhip Theory and Practice 19(4), 21-39. Mian, S. and C. Smith, 1992, Accounts receivable management policy: theory and evidence,
Journal of Finance 47, 169-200. Milde, H. and J.G. Riley, 1988, Signaling in credit markets, Quarterly Journal of Economics
103(1), 101-129. Miller, M.H., 1962, Credit risk and credit rationing: further comment, Quarterly Journal of
Economics 76, 480-488. Miller, M.H., 1977, Debt and taxes, Journal of Finance 32, 261-275. Mishra, C.S. and D.L. McConaughy, 1999, Founding family control and capital structure: the risk
of loss of control and the aversion to debt, Entrepreneurship: theory and practice, 53-64. Modigliani, F. and M.H. Miller, 1963, Corporate income taxes and the cost of capital: a
correction, American Economic Review June, 433-443. Morck, R., Shleifer, A. and R. Vishny, 1988, Management ownership and market valuation: an
empirical analysis, Journal of Financial Economics 20, 293-316. Morck, R. and Yeung, B., 2003, Agency problems in large family business groups,
Entrepreneurship Theory and Practice 27(4), 367-382. Myers, S.C., 1984, The capital structure puzzle, Journal of Finance 39(3), 575-592. Norton,E.,1991,Capital structure and small public firms,Journal of Business Venturing 6,287-303. Ogawa, K. and K. Suzuki, 2000, Demand for bank loans and investment under borrowing
constraints: a panel study of Japanese firm data, Journal of the Japanese and International Economies 14, 1-21.
Ooghe, H., Joos, P. and C. De Bourdeaudhuij, 1995, Financial distress models in Belgium: the results of a decade of empirical research, The International Journal of Accounting 30, 245-274.
Perez, S.J., 1998, Testing for credit rationing: an application of disequilibrium econometrics, Journal of macroeconomics 20(4), 721-739.
Petersen, M.A. and R.G. Rajan, 1994, Benefits of lending relationships: evidence from small business data, Journal of Finance 49(1), 3-37.
Petersen, M.A. and Rajan, R.G., 1995, The effect of credit market competition on lending relationships, Quarterly Journal of Economics 110(2), 407-443.
Petersen, M.A. and Rajan, R.G., 1997, Trade credit: theories and evidence, The Review of Financial Studies 10(3), 661-691.
Pettit, R. and R. Singer, 1985, Small business finance: a research agenda, Financial Management, 47-60.
Pierce, J.L., Kostova, T. and K.T. Dirks, 2001, Towards a theory of psychological ownership in organizations, The Academy of Management Review 26(2), 298-310.
Poutziouris, P., Chittenden, F. and N. Michaelas, 1998, The financial affairs of private companies. Manchester Business School, The University of Manchester.
Rajan, R.G. and L. Zingales, 1998, Financial dependence and growth, The American Economic Review 88(3), 559-586.
Riding, A., Haines, G. and Thomas, R., 1994, The Canadian small business-bank interface: a recursive model, Entrepreneurship: Theory and Practice 18(4), 5-24.
Rothschild, M. and J. Stiglitz, 1971, Increasing risk : a definition, Journal of Economic Theory 2(3), 225-243.
Schultze, W.S, Lubatkin, M.H. and R.N. Dino, 2003, Toward a theory of agency and altruism in family firms, Journal of Business Venturing 18, 473-490.
Schultze, W.S, Lubatkin, M.H., Dino R.N. and A.K. Buchholtz, 2001, Agency relationships in family firms: theory and evidence, Organization Science 12, 99-116.
Sealey, C.W., 1979, Credit rationing in the commercial loan market: estimates of a structural model under conditions of disequilibrium, Journal of Finance 34(3), 689-702.
37
Sharma, P., Chrisman, J.J. and J.H. Chua, 1997, Strategic management of the family business: past research and future challenges, Family Business Review 9, 107-123.
Shen, C.-H., 2002, Credit rationing for bad companies in bad years: evidence from bank loan transaction data, Journal of Finance and Economics 7, 261-278.
Shyam-Sunder, L. and S.C. Myers, 1999, Testing static tradeoff against pecking order models of capital structure, Journal of Financial Economics 51, 219-244.
Smith, V., 1972, A theory and test of credit rationing : some generalizations, American Economic Review 62(3), 477-483.
Sonnenfeld, J.A. and P.L., Spence, 1989, The parting patriarch of a family firm, Family Business Review 2(4), 355-375.
Stiglitz, J. and A. Weiss, 1981, Credit rationing in markets with imperfect information, American Economic Review 71(3), 393-410.
Storey, D.J., 1994, Understanding the small business sector. London: Routledge. Stulz, R., 1990, Managerial discretion and optimal financing policies, Journal of Financial
Economics 26, 3-27. Titman, S. and Wessels, R., 1988, The determinants of capital structure choice, Journal of
Finance 43, 1-19. Van Auken, H.E. and L. Neeley, 1996, Evidence of bootstrap financing among small start-up
firms, Journal of Entrepreneurial and Small Business Finance 5(3), 233-247. Van der Wijst, N. and R. Thurik, 1993, Determinants of small firm debt ratio’s : an analysis of
retail panel data, Small Business Economics 5, 55-65. Van de Wijst, D., 1989, Financial structure in small business: theory, tests and applications,
Berlin: Springer-Verlag. Van Horne, J., 1995, Financial management and policy, Prentice Hall. Vijverberg, C.C., 2004, An empirical financial accelerator model: small firms’ investment and
credit rationing, Journal of Macroeconomics 26(1), 101-129. Voordeckers, W., 1998, Financieringsstrategieën in kleine industriële ondernemingen,
Economisch en Sociaal Tijdschrift 1998/3, 345-369. Welsh, J.H. and J.F., White, 1981, A small business is not a little big business, Harvard Business
Review July-August, 18-32. Wette, H., 1983, Collateral in credit rationing in markets with imperfect information : note,
American Economic Review 73(3), 442-445. Williamson, O., 1967, The economics of defense contracting : incentives and performance, in Mc
Kean, R. ed., Issues in defense economics, (Columbia University Press, New York). Williamson, S., 1986, Costly monitoring, financial intermediation and equilibrium credit
rationing, Journal of Monetary Economics 18(2), 159-179. Williamson, S., 1987, Costly monitoring, loan contracts, and equilibrium credit rationing,
Quarterly Journal of Economics 102(1), 135-145. Wilner, B.S., 2000, The exploitation of relationships in financial distress: the case of trade credit,
Journal of Finance 55(1), 153-177. Wilson, N. and B. Summers, 2002, Trade credit terms offered by small firms: survey evidence
and empirical analysis, Journal of Business Finance and Accounting 29(3), 317-351. Winborg, J. and H. Landström, 2000, Financial bootstrapping in small businesses: examining
small business managers’ resource acquisition behaviors, Journal of Business Venturing 16, 235-254.
Yang, B.M., 1987, The supply and demand for exports for industrialized countries: a disequilibrium analysis, Applied Economics 19, 1137-1148.
38
Table 3a: Disequilibrium model for long term bank debt
Independent variablesa Desired DEMAND for bank debt
Independent variablesa SUPPLY of bank debt
Coeff P>|Z| Coeff P>|Z|
Cash flow/TAt-1 -0.5585889 0.000* Age 0.0005325 0.000*
Long term interest rate -0.0067246 0.002* Shareholder dummy 0.0175451 0.000*
Year dummyb Industryc
1994 -0.0081186 0.258 Building 0.0068843 0.134
1995 0.0030645 0.680 Retail 0.0161649 0.000*
1996 -0.00499 0.478 Services -0.0045144 0.275
1997 -0.0091454 0.199
1998 -0.0176915 0.027*
1999 -0.0199265 0.013*
2000 -0.022449 0.002*
2001 -0.0130591 0.098
Industryc
Building -0.0007424 0.916
Retail -0.0032749 0.587
Services 0.0213348 0.001*
a TA = total assets b : 1993 is the suppressed comparison category c : the manufacturing industry is the suppressed comparison category *: significant at 5% level
39
Table 3b: Disequilibrium model for short term bank debt
Independent variablesa Desired DEMAND for bank debt
Independent variablesa SUPPLY of bank debt
Coeff P>|Z| Coeff P>|Z|
Cash flow/TAt-1 -0.6023426 0.000* Age -0.0000389 0.889
Short term interest rate -0.0014399 0.893 Industryc
Year dummyb Building 0.0097188 0.631
1994 -0.0074935 0.801 Retail 0.0672637 0.000*
1995 -0.0058926 0.861 Services -0.007796 0.668
1996 -0.0040205 0.895
1997 -0.0046454 0.887
1998 -0.0064624 0.820
1999 -0.0122676 0.680
2000 -0.0244211 0.539
2001 0.0112093 0.472
Industryc
Building 0.0026825 0.881
Retail 0.032256 0.035*
Services -0.020295 0.209
a TA = total assets b : 1993 is the suppressed comparison category c : the manufacturing industry is the suppressed comparison category *: significant at 5% level
40
Table 5: Descriptive statistics for credit rationed and non credit rationed firms
Long term bank debt Short term bank debt Variable Mean Median Mean Median
Non credit rationed firms Bank loans/assetst-1 0.1236708 (2.04) 0.0181185b 0.1085979 (0.55) 0.0201694b
Long term bankloans/assetst-1 0.0439834 (0.63)a 0b 0.0230789 (0.18) 0 b
Short term bankloans/assetst-1 0.0796875 (1.43) 0.0052786 0.0855191 (0.48) 0.0071259 b
Return On Assets 4.051518 (9.57)a 2.97b 2.768969 (9.17)a 2.07b
Age (years) 17.16652 (12.50)a 14 17.56 (13.74) 14 Quick ratio 1.234512 (0.66)a 1.12078b
a: significant difference in means between unconstrained and constrained firms (t-test, 95% confidence interval) b: significant difference in median between unconstrained and constrained firms (PearsonChi²-test, 95% confidence interval)