24
Credit Risk Analysis Prof Ian Giddy Stern School of Business New York University LIB
| Date post: | 21-Dec-2015 |
| Category: |
Documents |
| View: | 216 times |
| Download: | 0 times |

Credit Risk Analysis
Prof Ian Giddy
Stern School of Business
New York University
LIB

Copyright ©1998 Ian H. Giddy Credit Risk Analysis 2
Returns, Standard Deviations, and Frequency Distributions: 1926-1996
Source: © Stocks, Bonds, Bills, and Inflation 1997 Yearbook™, Ibbotson Associates, Inc., Chicago (annually updates work by Roger G. Ibbotson and Rex A. Sinquefield). All rights reserved.
– 90% + 90%0%
Average Standard Series Annual Return Deviation Distribution
Large Company Stocks 12.7% 20.3%
Small Company Stocks 17.7 34.1
Long-Term Corporate Bonds 6.0 8.7
Long-Term Government Bonds 5.4 9.2
U.S. Treasury Bills 3.8 3.3
Inflation 3.2 4.5

Copyright ©1998 Ian H. Giddy Credit Risk Analysis 3
Debt vs Equity Risk
Value
of future
cash flows
Value
of future
cash flows
Contractual int. & principal
No upside
Senior claims
Control via restrictions
Contractual int. & principal
No upside
Senior claims
Control via restrictions
Assets Liabilities
Debt
Residual payments
Upside and downside
Residual claims
Voting control rights
Residual payments
Upside and downside
Residual claims
Voting control rights
Equity

Copyright ©1998 Ian H. Giddy Credit Risk Analysis 4
Total Firm Risk
Probability
Return on Assets
68%
95%
> 99%
– 3 – 48.2%
– 2 – 27.9%
– 1 – 7.6%
012.7%
+ 1 33.0%
+ 2 53.3%
+ 3 73.6%

Copyright ©1998 Ian H. Giddy Credit Risk Analysis 5
Debt vs Equity Risk
Probability
Return on Assets
68%
95%
> 99%
– 3 – 48.2%
– 2 – 27.9%
– 1 – 7.6%
012.7%
+ 1 33.0%
+ 2 53.3%
+ 3 73.6%
Debt Risk Equity Risk

Copyright ©1998 Ian H. Giddy Credit Risk Analysis 6
Credit Risk versus Market Risk

Copyright ©1998 Ian H. Giddy Credit Risk Analysis 7
CreditMetrics Methodology
Establishes the exposure profile of each obligor in a portfolio.
Computes the volatility in value of each instrument caused by possible upgrades, downgrades, and defaults.
Taking into account correlations between each of these events, it combines the volatility of the individual instruments to give an aggregate portfolio volatility.

Copyright ©1998 Ian H. Giddy Credit Risk Analysis 8
CreditMetrics Roadmap
Compute exposure profile of
each asset
Compute exposure profile of
each asset
Compute the volatility of value caused by
upgrades/downgrades and defaults
Compute the volatility of value caused by
upgrades/downgrades and defaults
Compute correlations
Compute correlations
Portfolio value-at-risk due to creditPortfolio value-at-risk due to credit
Exposures Value-at-risk due to credit Correlations

Copyright ©1998 Ian H. Giddy Credit Risk Analysis 9
Provisions of Bonds
Secured or unsecured Call provision Convertible provision Put provision (putable bonds) Floating rate bonds Sinking funds

Copyright ©1998 Ian H. Giddy Credit Risk Analysis 10
Default Risk and Ratings
Rating companiesMoody’s Investor ServiceStandard & Poor’sDuff and PhelpsFitch
Rating CategoriesInvestment gradeSpeculative grade

Copyright ©1998 Ian H. Giddy Credit Risk Analysis 11
Bond Credit Ratings
Moody’sStandard &Poor’s Interpretation
AaaAa
AAAAA
High-quality debt instruments
ABaa
ABBB
Strong to adequate ability topay principal and interest
BaBCaaCaC
BBBCCCCCC
Ability to pay interest andprincipal speculative
D In default

Copyright ©1998 Ian H. Giddy Credit Risk Analysis 12
Factors Used by Rating Companies
Coverage ratios Leverage ratios Liquidity ratios Profitability ratios Cash flow to debt

Copyright ©1998 Ian H. Giddy Credit Risk Analysis 13
Medians of Key Ratios : 1993-1995
AAA AA A BBB BB B CCCPretax Interest Coverage 13.50 9.67 5.76 3.94 2.14 1.51 0.96
EBITDA Interest Coverage 17.08 12.80 8.18 6.00 3.49 2.45 1.51Funds from Operations / Total Debt
(%) 98.2% 69.1% 45.5% 33.3% 17.7% 11.2% 6.7%
Free Operating Cashflow/ TotalDebt (%) 60.0% 26.8% 20.9% 7.2% 1.4% 1.2% 0.96%
Pretax Return on Permanent Capital(%) 29.3% 21.4% 19.1% 13.9% 12.0% 7.6% 5.2%
Operating Income/Sales (%) 22.6% 17.8% 15.7% 13.5% 13.5% 12.5% 12.2%Long Term Debt/ Capital 13.3% 21.1% 31.6% 42.7% 55.6% 62.2% 69.5%Total Debt/Capitalization 25.9% 33.6% 39.7% 47.8% 59.4% 67.4% 69.1%

Copyright ©1998 Ian H. Giddy Credit Risk Analysis 14
Process of Ratings and Rate Estimation
We use the median interest coverage ratios for large manufacturing firms to develop “interest coverage ratio” ranges for each rating class.
We then estimate a spread over the long term bond rate for each ratings class, based upon yields at which these bonds trade in the market place.

Copyright ©1998 Ian H. Giddy Credit Risk Analysis 15
Interest Coverage Ratios and Bond Ratings
If Interest Coverage Ratio is Estimated Bond Rating> 8.50 AAA
6.50 - 8.50 AA
5.50 - 6.50 A+
4.25 - 5.50 A
3.00 - 4.25 A–
2.50 - 3.00 BBB
2.00 - 2.50 BB
1.75 - 2.00 B+
1.50 - 1.75 B
1.25 - 1.50 B –
0.80 - 1.25 CCC
0.65 - 0.80 CC
0.20 - 0.65 C
< 0.20 D

Copyright ©1998 Ian H. Giddy Credit Risk Analysis 16
Spreads Over Long Bond Rate for Ratings Classes
Rating Coverage gtSpreadAAA 0.20%AA 0.50%A+ 0.80%A 1.00%A- 1.25%BBB 1.50%BB 2.00%B+ 2.50%B 3.25%B- 4.25%CCC 5.00%CC 6.00%C 7.50%D 10.00%
Rating Coverage gtSpreadAAA 0.20%AA 0.50%A+ 0.80%A 1.00%A- 1.25%BBB 1.50%BB 2.00%B+ 2.50%B 3.25%B- 4.25%CCC 5.00%CC 6.00%C 7.50%D 10.00%

Copyright ©1998 Ian H. Giddy Credit Risk Analysis 17
Volatilities from “Transition Matrix”

Copyright ©1998 Ian H. Giddy Credit Risk Analysis 18
Construction of Volatility Across Credit Horizons

Copyright ©1998 Ian H. Giddy Credit Risk Analysis 19
Defaults and Recovery Rates

Copyright ©1998 Ian H. Giddy Credit Risk Analysis 20
The Distribution of Returns
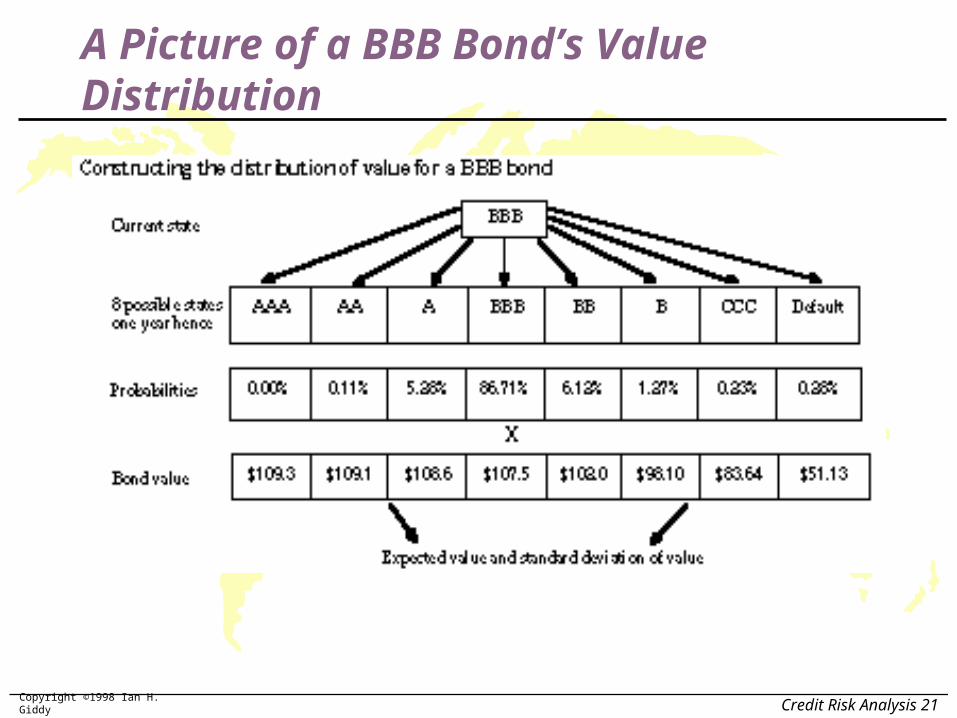
Copyright ©1998 Ian H. Giddy Credit Risk Analysis 21
A Picture of a BBB Bond’s Value Distribution

Copyright ©1998 Ian H. Giddy Credit Risk Analysis 22
Calculating Mean and Standard Deviation

Copyright ©1998 Ian H. Giddy Credit Risk Analysis 23
CreditMetrics
creditmetrics.com

Copyright ©1998 Ian H. Giddy Credit Risk Analysis 29
Ian H. Giddy
Professor of Finance
Stern School of Business
New York University
44 West 4th Street, New York, NY 10012, USA
Tel 212-998-0332; Fax 212-995-4233
Email: [email protected]
World Wide Web: http://giddy.org


