24
39 39 0 24 45 22 52 45 CREDIT RISK TRANSFER PROGRESS REPORT March 2017
39
39
0
24 45
22 52
45
CREDIT RISK TRANSFER PROGRESS REPORT March 2017

page 1
Table of Contents
2 Overview of the Program and Q1 2017 Highlights3 Q1 2017 CRT Activity4 The Role of Primary Mortgage Insurance in CRT Transactions5 Fannie Mae CRT Transactions7 Freddie Mac CRT Transactions9 Coverage of Single-Family Loan Acquisitions
10 Estimating the Market-Implied Guarantee Fee13 Freddie Mac Implied Credit Cost and Guarantee Fees on STACR Transactions14 Fannie Mae Implied Credit Cost and Guarantee Fees on CAS Transactions15 Comparison of CRT Market Pricing - Mezzanine Bonds to Corporate BBB Index16 Comparison of CRT Market Pricing - Mezzanine Bonds to High Yield Credit Default Swaps 17 Appendix A: CRT Background21 Appendix B: CRT Principles, Concepts and Definitions23 Appendix C: CRT Transaction Types, Arrangement, and Risk
CREDIT RISK TRANSFER PROGRESS REPORT March 2017
page 2
-
CREDIT RISK TRANSFER PROGRESS REPORT March 2017
$58$147 $181 $215
$65$32
$231$239
$333
$108$90
$378$420
$548
$174
$0
$200
$400
2013 2014 2015 2016 1Q17
total
Fannie Mae
Freddie Mac
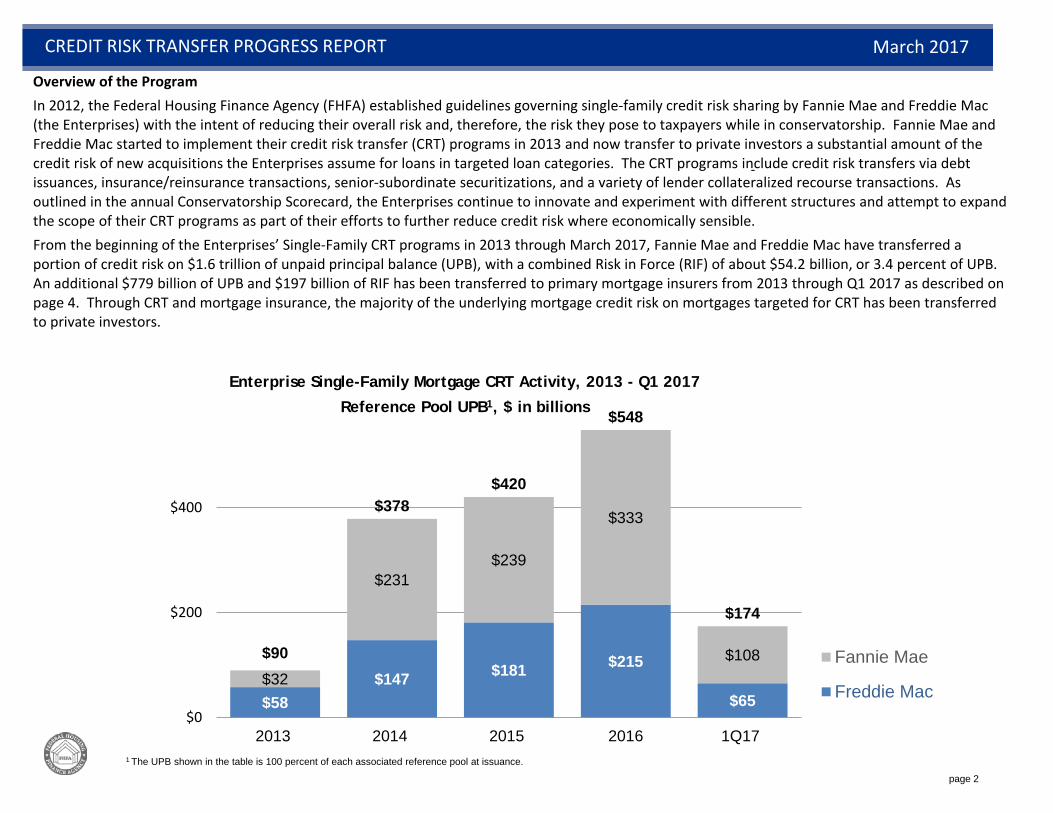
Enterprise Single-Family Mortgage CRT Activity, 2013 - Q1 2017
Reference Pool UPB1, $ in billions
1 The UPB shown in the table is 100 percent of each associated reference pool at issuance.
Overview of the ProgramIn 2012, the Federal Housing Finance Agency (FHFA) established guidelines governing single-family credit risk sharing by Fannie Mae and Freddie Mac (the Enterprises) with the intent of reducing their overall risk and, therefore, the risk they pose to taxpayers while in conservatorship. Fannie Mae and Freddie Mac started to implement their credit risk transfer (CRT) programs in 2013 and now transfer to private investors a substantial amount of the credit risk of new acquisitions the Enterprises assume for loans in targeted loan categories. The CRT programs include credit risk transfers via debt issuances, insurance/reinsurance transactions, senior-subordinate securitizations, and a variety of lender collateralized recourse transactions. As outlined in the annual Conservatorship Scorecard, the Enterprises continue to innovate and experiment with different structures and attempt to expand the scope of their CRT programs as part of their efforts to further reduce credit risk where economically sensible.From the beginning of the Enterprises’ Single-Family CRT programs in 2013 through March 2017, Fannie Mae and Freddie Mac have transferred a portion of credit risk on $1.6 trillion of unpaid principal balance (UPB), with a combined Risk in Force (RIF) of about $54.2 billion, or 3.4 percent of UPB. An additional $779 billion of UPB and $197 billion of RIF has been transferred to primary mortgage insurers from 2013 through Q1 2017 as described on page 4. Through CRT and mortgage insurance, the majority of the underlying mortgage credit risk on mortgages targeted for CRT has been transferred to private investors.

page 3
$ in millions
Reference Pool UPB3 RIF4
Percent of RIF
Reference Pool UPB3 RIF4
Percent of RIF
Reference Pool UPB3 RIF4
Percent of RIF
Debt Issuances 83,746 2,681 80% 63,624 1,555 73% 147,370 4,236 77%
Reinsurance 20,391 510 15% 516 24% 20,391 1,026 19%Whole Loan Securities 0% 640 38 2% 640 38 1%Lender Recourse 488 65 2% 488 65 1%Front-End Reinsurance 3,734 95 3% 1,171 31 1% 4,905 126 2%Total 108,359 3,351 65,435 2,140 173,793 5,491
Credit Risk Transfer Volume2
for Q1 2017
Fannie Mae Freddie Mac Total
CREDIT RISK TRANSFER PROGRESS REPORT March 2017
1 See pages 18-20 for a description of Credit Risk Transfer Structures.2 The same reference pool backs STACR and ACIS transactions; CAS and CIRT are backed by separate reference pools.3 Reference pool UPB at issuance.4 RIF represents the maximum loss exposure that could be absorbed by CRT investors.
Q1 2017 CRT1 Activity
In Q1 2017, the Enterprises transferred risk on $174 billon of UPB with a total RIF of $5.5 billion. Debt issuances accounted for 77 percent of RIF, and reinsurance transactions accounted for 19 percent of RIF.

page 4
The Role of Primary Mortgage Insurance in CRT TransactionsFrom the beginning of Fannie Mae and Freddie Mac’s CRT programs in 2013 through Q12017, the Enterprises have transferred a portion of credit risk on about $1.6 trillion in single-family loans through CRT.
Between 25 to 30 percent of the Enterprises’ CRT debt issuances (STACR/CAS) have been backed by loans with loan to values (LTVs) above 80 percent, which are required to have loan-level credit enhancement in one of the following charter-eligible forms:
• Private mortgage insurance (PMI), • Recourse agreement, or • Seller retained participation in the loan.
PMI is the form of credit enhancement used most often. The charts below show the total UPB and RIF (measured at the time of Enterprise acquisition for each loan) with PMI acquired by the Enterprises for each year between 2013 and Q1 2017. When losses occur on loans with LTVs above 80 percent, private mortgage insurers provide credit loss coverage before credit risk transfer investors or the Enterprises. However, it should be noted that the Enterprise, not the CRT investor, is responsible for counterparty risk when PMI coverage is provided. Therefore, if the private mortgage insurer is not able to make the payment necessary to fulfill its credit loss coverage obligations, the Enterprise must step in and cover those losses, not the CRT investor.
CREDIT RISK TRANSFER PROGRESS REPORT March 2017
1 In billions of dollars. While the total RIF associated with primary mortgage insurance is large, the actual level of credit risk sharing provided through paid insurance claims depends on the number of insured loans that default and the severity of losses on those loans. These figures assume that all PMI payments would be made by the mortgage insurer, not by Fannie Mae or Freddie Mac.
$48 $54 $72 $91 $283 $109 $92 $120 $146
$496
$157 $146 $192 $236
$48
$779
0
200
400
600
800
2013 2014 2015 2016 1Q17 Total
Primary Mortgage Insurance UPB1
Coverage for New Acquisitions
$13 $15 $19 $23$74$27 $23 $30 $36
$124
$40 $38 $49 $59
$12
$197
0
50
100
150
200
2013 2014 2015 2016 1Q17 Total
Primary Mortgage Insurance RIF1 for New Acquisitions
Fannie Mae
Freddie Mac
Fannie Mae
Freddie Mac
page 5
Deal Type
Deal Name Date
Reference Pool UPB5
(in millions of $)
Risk transferattach/detach points
(in basis points)
Sold portion of tranches:
Note size6 or RIF (in millions of $)
Retained portion of tranches
(in millions of $)
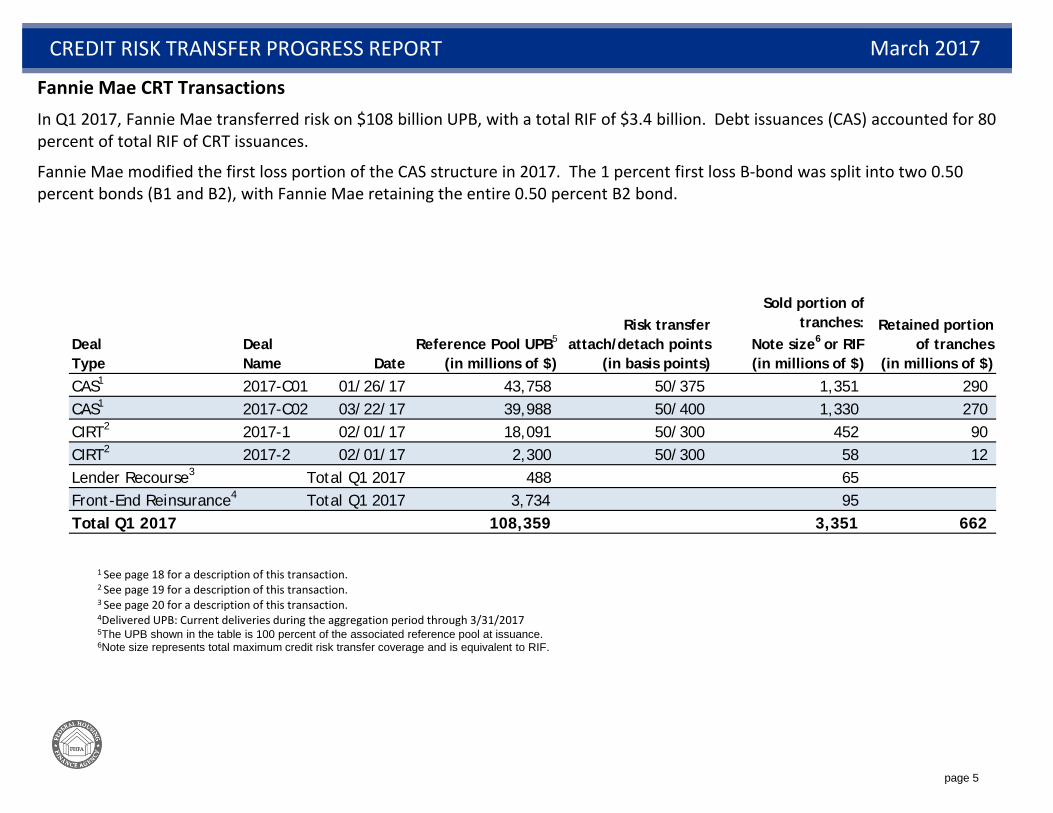
CAS1 2017-C01 01/26/17 43,758 50/375 1,351 290CAS1 2017-C02 03/22/17 39,988 50/400 1,330 270CIRT2 2017-1 02/01/17 18,091 50/300 452 90CIRT2 2017-2 02/01/17 2,300 50/300 58 12Lender Recourse3 Total Q1 2017 488 65Front-End Reinsurance4 Total Q1 2017 3,734 95Total Q1 2017 108,359 3,351 662
SINGLE-FAMILY CREDIT RISK TRANSFER PROGRESS REPORTCREDIT RISK TRANSFER PROGRESS REPORT March 2017
1 See page 18 for a description of this transaction.2 See page 19 for a description of this transaction.3 See page 20 for a description of this transaction.4Delivered UPB: Current deliveries during the aggregation period through 3/31/20175The UPB shown in the table is 100 percent of the associated reference pool at issuance.6Note size represents total maximum credit risk transfer coverage and is equivalent to RIF.
Fannie Mae CRT Transactions In Q1 2017, Fannie Mae transferred risk on $108 billion UPB, with a total RIF of $3.4 billion. Debt issuances (CAS) accounted for 80 percent of total RIF of CRT issuances.
Fannie Mae modified the first loss portion of the CAS structure in 2017. The 1 percent first loss B-bond was split into two 0.50 percent bonds (B1 and B2), with Fannie Mae retaining the entire 0.50 percent B2 bond.
page 6
SINGLE-FAMILY CREDIT RISK TRANSFER PROGRESS REPORTCREDIT RISK TRANSFER PROGRESS REPORT March 2017
$1,469 $1,448 $1,557 $1,446 $1,977
$2,488
$1,202 $1,726
$2,681 $117
$379 $512
$629
$563
$360
$205
$510
$93 $93
$157
$156
$157
$156
$160
$1,562 $1,658
$2,029$2,051
$2,763
$3,207
$1,719
$2,087
$3,351
0
500
1,000
1,500
2,000
2,500
3,000
1Q15 2Q15 3Q15 4Q15 1Q16 2Q16 3Q16 4Q16 1Q17
Series4
Other
CIRT
CAS
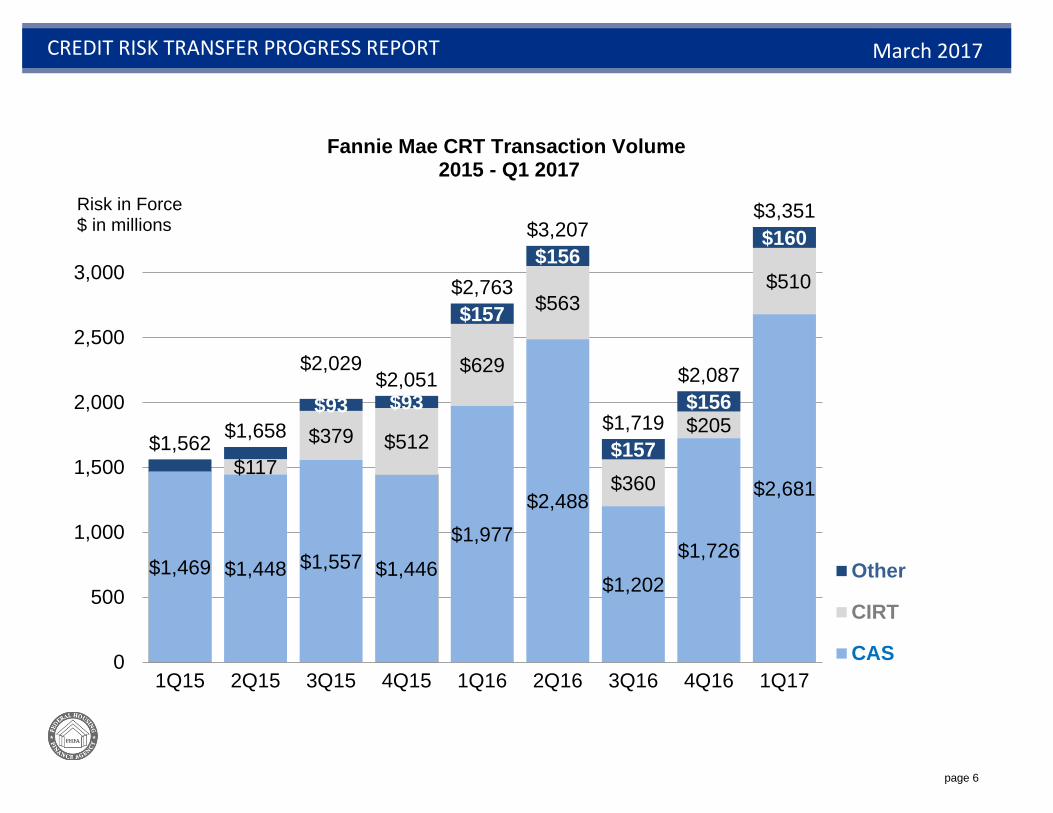
Fannie Mae CRT Transaction Volume2015 - Q1 2017
Risk in Force$ in millions
page 7
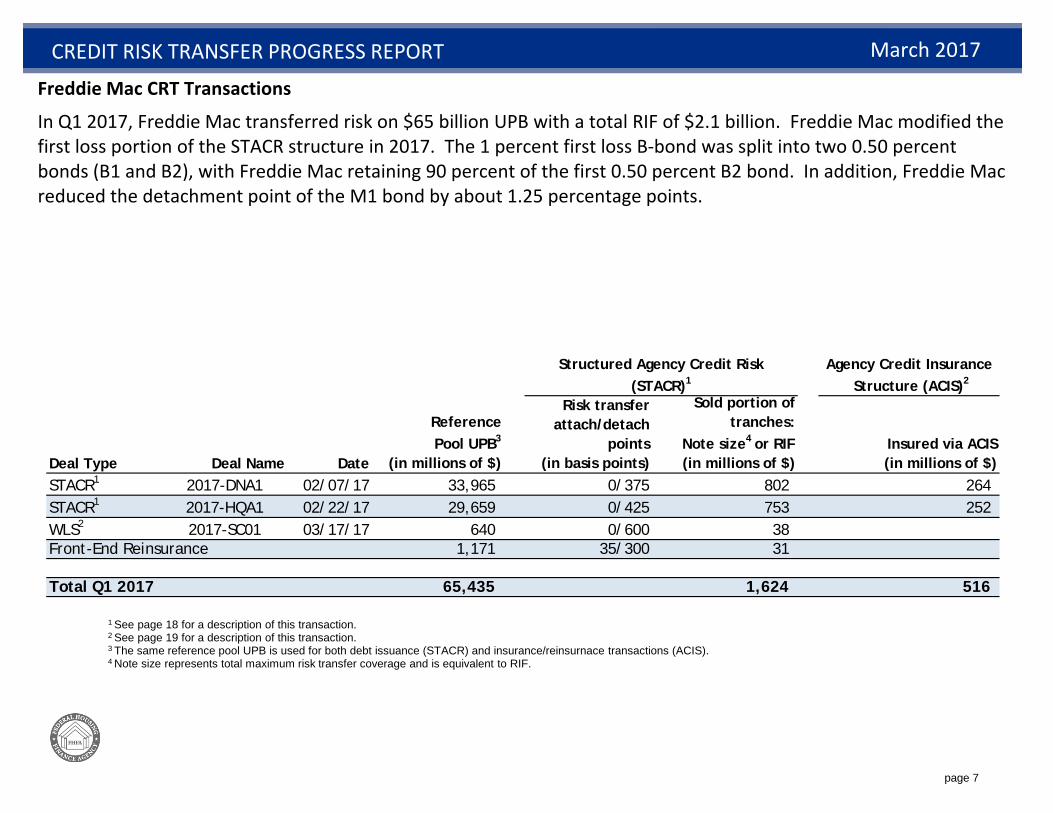
Deal Type Deal Name Date
Reference Pool UPB3
(in millions of $)
Risk transferattach/detach
points(in basis points)
Sold portion of tranches:
Note size4 or RIF (in millions of $)
Insured via ACIS(in millions of $)
STACR1 2017-DNA1 02/07/17 33,965 0/375 802 264STACR1 2017-HQA1 02/22/17 29,659 0/425 753 252WLS2 2017-SC01 03/17/17 640 0/600 38Front-End Reinsurance 1,171 35/300 31
Total Q1 2017 65,435 1,624 516
Structured Agency Credit Risk (STACR)1
Agency Credit Insurance Structure (ACIS)2
SINGLE-FAMILY CREDIT RISK TRANSFER PROGRESS REPORTCREDIT RISK TRANSFER PROGRESS REPORT March 2017
1 See page 18 for a description of this transaction. 2 See page 19 for a description of this transaction.3 The same reference pool UPB is used for both debt issuance (STACR) and insurance/reinsurnace transactions (ACIS).4 Note size represents total maximum risk transfer coverage and is equivalent to RIF.
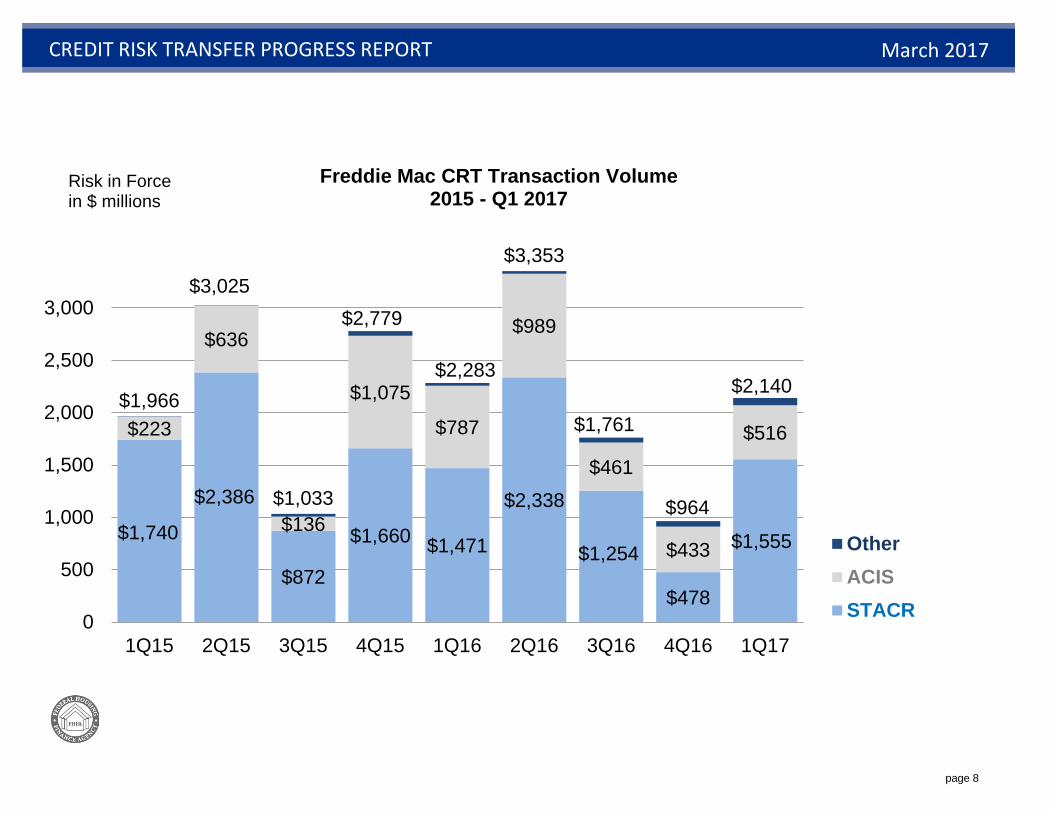
Freddie Mac CRT Transactions
In Q1 2017, Freddie Mac transferred risk on $65 billion UPB with a total RIF of $2.1 billion. Freddie Mac modified the first loss portion of the STACR structure in 2017. The 1 percent first loss B-bond was split into two 0.50 percent bonds (B1 and B2), with Freddie Mac retaining 90 percent of the first 0.50 percent B2 bond. In addition, Freddie Mac reduced the detachment point of the M1 bond by about 1.25 percentage points.
page 8
24 4522 52
45
SINGLE-FAMILY CREDIT RISK TRANSFER PROGRESS REPORTCREDIT RISK TRANSFER PROGRESS REPORT March 2017
$1,740
$2,386
$872
$1,660 $1,471
$2,338
$1,254
$478
$1,555
$223
$636
$136
$1,075
$787
$989
$461
$433
$516 $1,966
$3,025
$1,033
$2,779
$2,283
$3,353
$1,761
$964
$2,140
0
500
1,000
1,500
2,000
2,500
3,000
1Q15 2Q15 3Q15 4Q15 1Q16 2Q16 3Q16 4Q16 1Q17
Series4OtherACISSTACR
Freddie Mac CRT Transaction Volume2015 - Q1 2017
Risk in Forcein $ millions
page 9
24 4522 52
45
CREDIT RISK TRANSFER PROGRESS REPORT March 2017
40%50% 57% 60%
60%50% 43% 40%
0%
20%
40%
60%
80%
100%
2013Acquisitions
2014Acquisitions
2015Acquisitions
2016Acquisitions
Loans not Targeted for CRT
Loans Targeted for CRT
Targeted Coverage of Loan Acquisitions
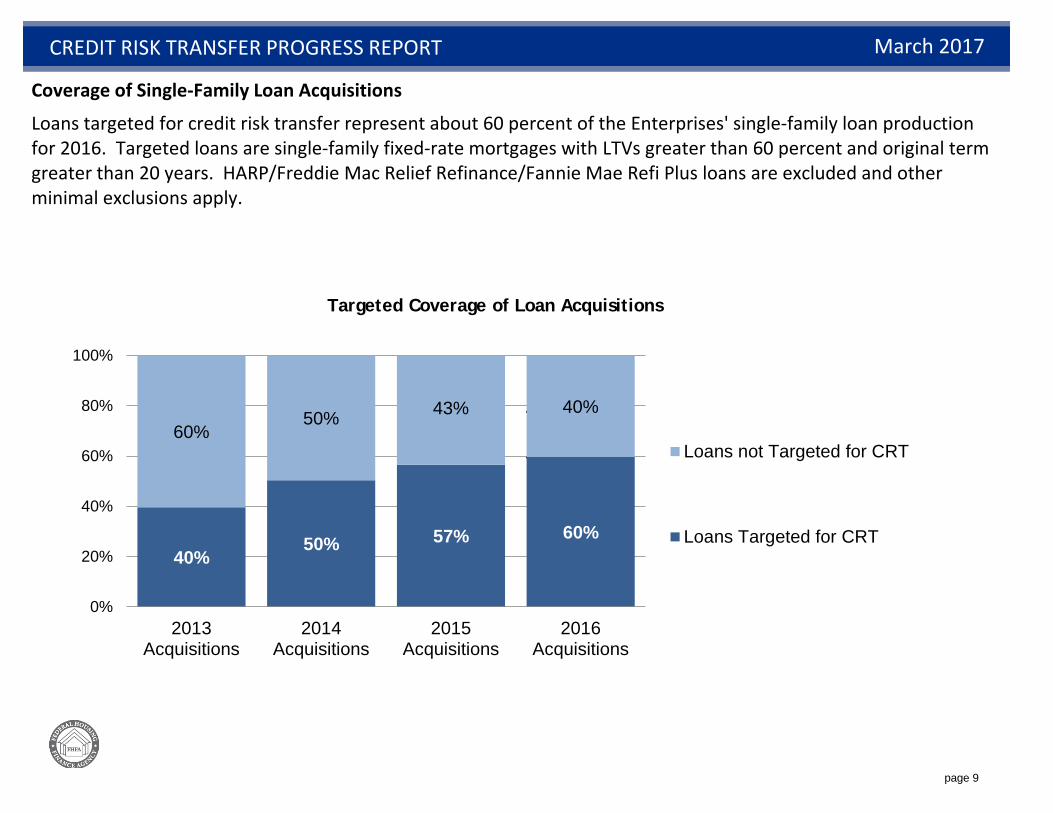
Coverage of Single-Family Loan Acquisitions
Loans targeted for credit risk transfer represent about 60 percent of the Enterprises' single-family loan production for 2016. Targeted loans are single-family fixed-rate mortgages with LTVs greater than 60 percent and original term greater than 20 years. HARP/Freddie Mac Relief Refinance/Fannie Mae Refi Plus loans are excluded and other minimal exclusions apply.
page 10
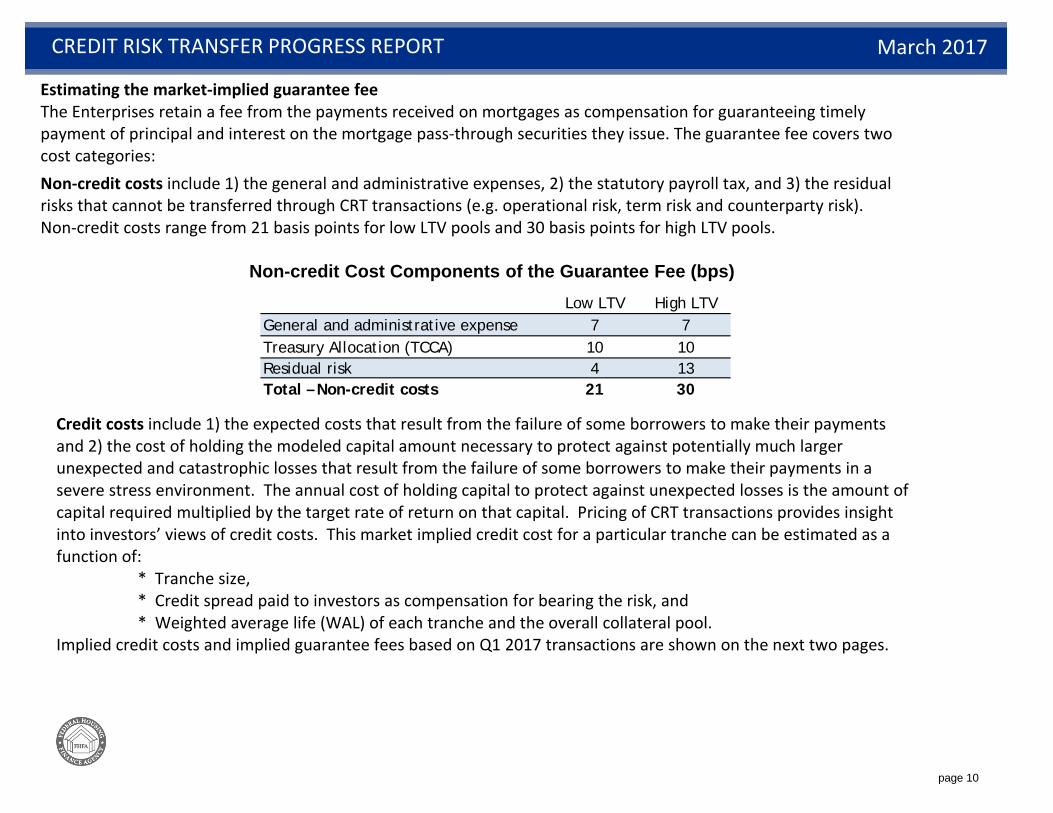
Low LTV High LTVGeneral and administrative expense 7 7Treasury Allocation (TCCA) 10 10Residual risk 4 13Total – Non-credit costs 21 30
CREDIT RISK TRANSFER PROGRESS REPORT March 2017
Estimating the market-implied guarantee fee The Enterprises retain a fee from the payments received on mortgages as compensation for guaranteeing timely payment of principal and interest on the mortgage pass-through securities they issue. The guarantee fee covers two cost categories:Non-credit costs include 1) the general and administrative expenses, 2) the statutory payroll tax, and 3) the residual risks that cannot be transferred through CRT transactions (e.g. operational risk, term risk and counterparty risk). Non-credit costs range from 21 basis points for low LTV pools and 30 basis points for high LTV pools.
Credit costs include 1) the expected costs that result from the failure of some borrowers to make their payments and 2) the cost of holding the modeled capital amount necessary to protect against potentially much larger unexpected and catastrophic losses that result from the failure of some borrowers to make their payments in a severe stress environment. The annual cost of holding capital to protect against unexpected losses is the amount of capital required multiplied by the target rate of return on that capital. Pricing of CRT transactions provides insight into investors’ views of credit costs. This market implied credit cost for a particular tranche can be estimated as a function of:
* Tranche size,* Credit spread paid to investors as compensation for bearing the risk, and* Weighted average life (WAL) of each tranche and the overall collateral pool.
Implied credit costs and implied guarantee fees based on Q1 2017 transactions are shown on the next two pages.
Non-credit Cost Components of the Guarantee Fee (bps)

page 11
STACR Tranche
Credit Spread to LIBOR (bps)
Implied Credit Cost (bps)
Credit Spread to LIBOR (bp)
Implied Credit Cost (bps)
M1 120 0.6 120 0.4 Non-credit Costs 21 30M2 325 6.7 355 9.7 Market implied credit cost 18 22.7B1 495 4.3 500 4.3 Market Implied Guarantee Fee 39 53B2 1000 6.5 1275 8.2
Implied Credit Costs 18.1 22.7
2017 DNA-1
2017 HQA-1
2017 DNA-1 2017 HQA-1
CREDIT RISK TRANSFER PROGRESS REPORT
Estimating Implied Credit Costs and Guarantee Fees - Freddie MacMarket pricing for Q1 2017 STACR transactions implies credit costs of 18 to 23 bps as shown below. Adding non-credit costs of 21 to 30 bps results in a range of market-implied guarantee fees of 39 to 53 bps.
Guarantee Fees Implied by STACR Bond PricingCredit costs implied by STACR Bond pricing
Methodology for calculating market-implied credit costsThe size of each tranche is publicly available, as are credit spreads associated with each tranche. Charts on the pages that follow show trends in the credit spreads for the mezzanine tranches. A simplified scenario is applied to calculate the WAL (i.e. 10 percent constant prepayment rate, 0.2 percent constant default rate, and 25 percent loss given default or loss severity). Individual analysts can leverage their own market assumptions or test a range of scenarios. The calculations assume that 100 percent of the notes are sold (no retention by the Enterprises). Research analysts have estimated that credit spreads on the B2 bond would increase by 100 to 300 bp if the entire position were sold.
March 2017
page 12
STACR Tranche
Credit Spread to LIBOR (bps)
Implied Credit Cost (bps)
Credit Spread to LIBOR (bp)
Implied Credit Cost (bps)
M1 130 0.5 115 0.3 Non-credit Costs 21 30.0M2 355 7.1 365 8.7 Market implied credit cost 21 22.0B1 575 5.0 550 4.8 Market Implied Guarantee Fee 42 52B2 13001 8.0 12001 7.8
Implied Credit Costs 20.5 21.6
2017 DNA-1 2017 HQA-1
2017 C01
2017 C02
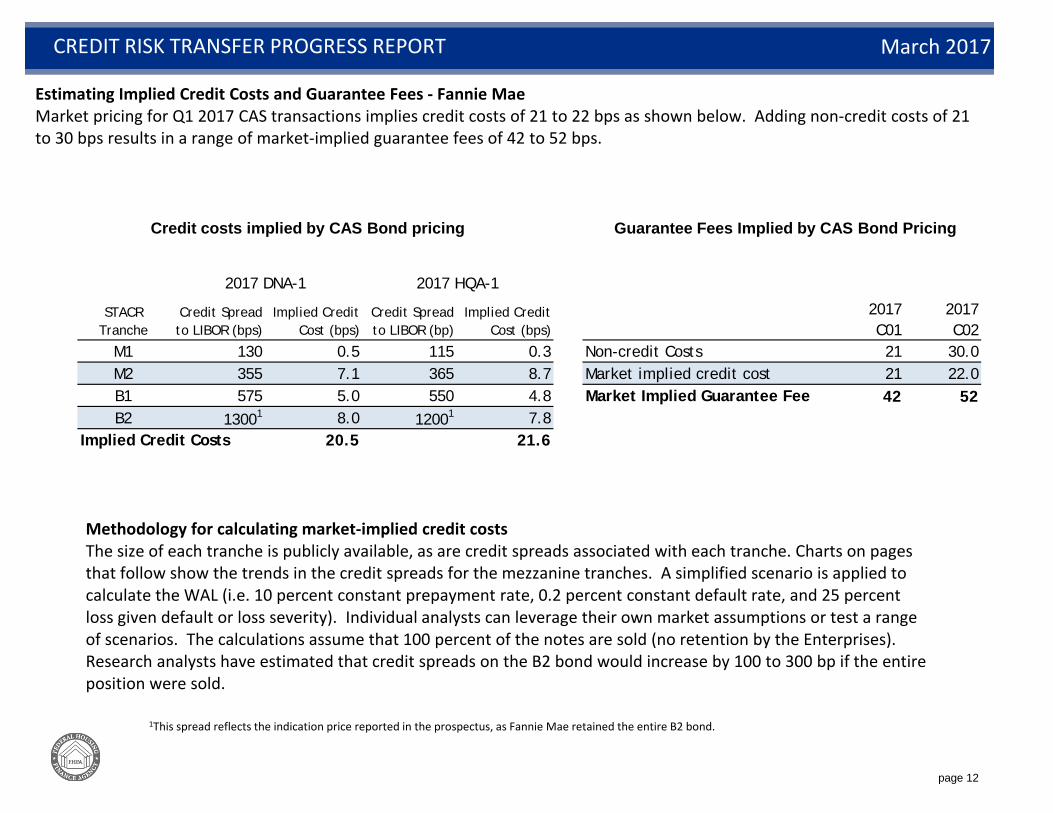
CREDIT RISK TRANSFER PROGRESS REPORT
Estimating Implied Credit Costs and Guarantee Fees - Fannie MaeMarket pricing for Q1 2017 CAS transactions implies credit costs of 21 to 22 bps as shown below. Adding non-credit costs of 21 to 30 bps results in a range of market-implied guarantee fees of 42 to 52 bps.
Guarantee Fees Implied by CAS Bond PricingCredit costs implied by CAS Bond pricing
Methodology for calculating market-implied credit costsThe size of each tranche is publicly available, as are credit spreads associated with each tranche. Charts on pages that follow show the trends in the credit spreads for the mezzanine tranches. A simplified scenario is applied to calculate the WAL (i.e. 10 percent constant prepayment rate, 0.2 percent constant default rate, and 25 percent loss given default or loss severity). Individual analysts can leverage their own market assumptions or test a range of scenarios. The calculations assume that 100 percent of the notes are sold (no retention by the Enterprises). Research analysts have estimated that credit spreads on the B2 bond would increase by 100 to 300 bp if the entire position were sold.
March 2017
1This spread reflects the indication price reported in the prospectus, as Fannie Mae retained the entire B2 bond.
page 13
Deal Name1 Date
Attach/Detach Points
Estimated Credit Cost2
Estimated Guarantee Fee3
Average Guarantee Fee4
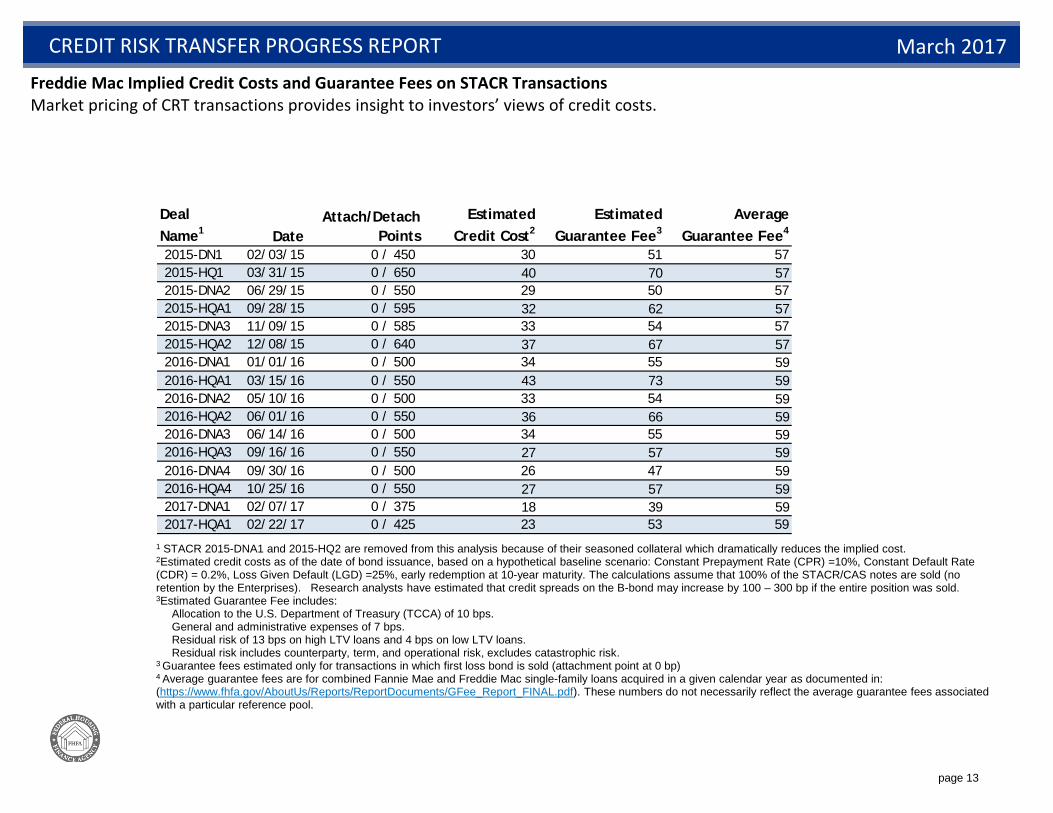
2015-DN1 02/03/15 0 / 450 30 51 572015-HQ1 03/31/15 0 / 650 40 70 572015-DNA2 06/29/15 0 / 550 29 50 572015-HQA1 09/28/15 0 / 595 32 62 572015-DNA3 11/09/15 0 / 585 33 54 572015-HQA2 12/08/15 0 / 640 37 67 572016-DNA1 01/01/16 0 / 500 34 55 592016-HQA1 03/15/16 0 / 550 43 73 592016-DNA2 05/10/16 0 / 500 33 54 592016-HQA2 06/01/16 0 / 550 36 66 592016-DNA3 06/14/16 0 / 500 34 55 592016-HQA3 09/16/16 0 / 550 27 57 592016-DNA4 09/30/16 0 / 500 26 47 592016-HQA4 10/25/16 0 / 550 27 57 592017-DNA1 02/07/17 0 / 375 18 39 592017-HQA1 02/22/17 0 / 425 23 53 59
Freddie Mac Implied Credit Costs and Guarantee Fees on STACR TransactionsMarket pricing of CRT transactions provides insight to investors’ views of credit costs.
CREDIT RISK TRANSFER PROGRESS REPORT March 2017
1 STACR 2015-DNA1 and 2015-HQ2 are removed from this analysis because of their seasoned collateral which dramatically reduces the implied cost. 2Estimated credit costs as of the date of bond issuance, based on a hypothetical baseline scenario: Constant Prepayment Rate (CPR) =10%, Constant Default Rate (CDR) = 0.2%, Loss Given Default (LGD) =25%, early redemption at 10-year maturity. The calculations assume that 100% of the STACR/CAS notes are sold (no retention by the Enterprises). Research analysts have estimated that credit spreads on the B-bond may increase by 100 – 300 bp if the entire position was sold.3Estimated Guarantee Fee includes:
Allocation to the U.S. Department of Treasury (TCCA) of 10 bps.General and administrative expenses of 7 bps.Residual risk of 13 bps on high LTV loans and 4 bps on low LTV loans.Residual risk includes counterparty, term, and operational risk, excludes catastrophic risk.
3 Guarantee fees estimated only for transactions in which first loss bond is sold (attachment point at 0 bp)4 Average guarantee fees are for combined Fannie Mae and Freddie Mac single-family loans acquired in a given calendar year as documented in: (https://www.fhfa.gov/AboutUs/Reports/ReportDocuments/GFee_Report_FINAL.pdf). These numbers do not necessarily reflect the average guarantee fees associated with a particular reference pool.
page 14
Deal Name DateAttach/Detach
PointsEstimated Credit
Cost1 Estimated
Guarantee Fee2Average
Guarantee Fee3
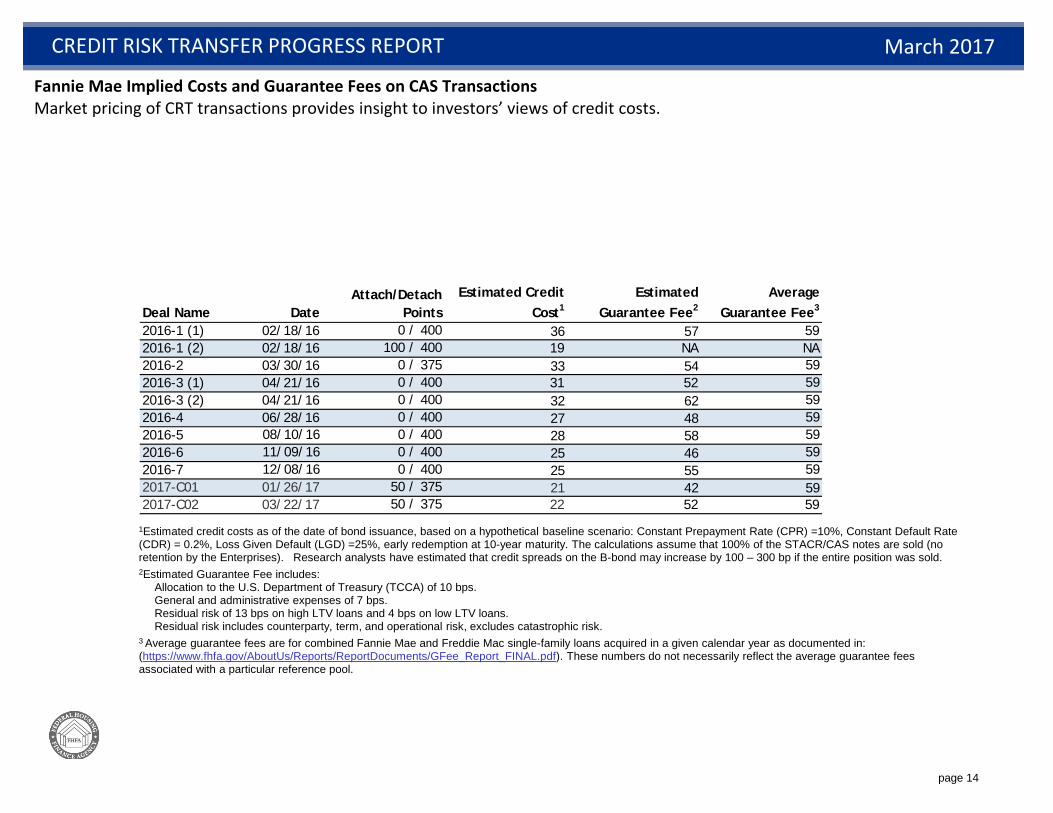
2016-1 (1) 02/18/16 0 / 400 36 57 592016-1 (2) 02/18/16 100 / 400 19 NA NA2016-2 03/30/16 0 / 375 33 54 592016-3 (1) 04/21/16 0 / 400 31 52 592016-3 (2) 04/21/16 0 / 400 32 62 592016-4 06/28/16 0 / 400 27 48 592016-5 08/10/16 0 / 400 28 58 592016-6 11/09/16 0 / 400 25 46 592016-7 12/08/16 0 / 400 25 55 592017-C01 01/26/17 50 / 375 21 42 592017-C02 03/22/17 50 / 375 22 52 59
CREDIT RISK TRANSFER PROGRESS REPORT March 2017
Fannie Mae Implied Costs and Guarantee Fees on CAS TransactionsMarket pricing of CRT transactions provides insight to investors’ views of credit costs.
1Estimated credit costs as of the date of bond issuance, based on a hypothetical baseline scenario: Constant Prepayment Rate (CPR) =10%, Constant Default Rate (CDR) = 0.2%, Loss Given Default (LGD) =25%, early redemption at 10-year maturity. The calculations assume that 100% of the STACR/CAS notes are sold (no retention by the Enterprises). Research analysts have estimated that credit spreads on the B-bond may increase by 100 – 300 bp if the entire position was sold.2Estimated Guarantee Fee includes:
Allocation to the U.S. Department of Treasury (TCCA) of 10 bps.General and administrative expenses of 7 bps.Residual risk of 13 bps on high LTV loans and 4 bps on low LTV loans.Residual risk includes counterparty, term, and operational risk, excludes catastrophic risk.
3 Average guarantee fees are for combined Fannie Mae and Freddie Mac single-family loans acquired in a given calendar year as documented in: (https://www.fhfa.gov/AboutUs/Reports/ReportDocuments/GFee_Report_FINAL.pdf). These numbers do not necessarily reflect the average guarantee fees associated with a particular reference pool.
page 15
1Bank of America Merrill Lynch US Corporate BBB Index 1Bank of America Merrill Lynch US Corporate BBB Index
Fannie Fannie Mae CAS M1
Credit Spread at Issuance vs BBB Corporate Bond Index (bps)
REDIT ESS REPORT
March 2017
Freddie Mac STACR M2Credit Spread at Issuance vs BBB
Corporate Bond Index (bps)
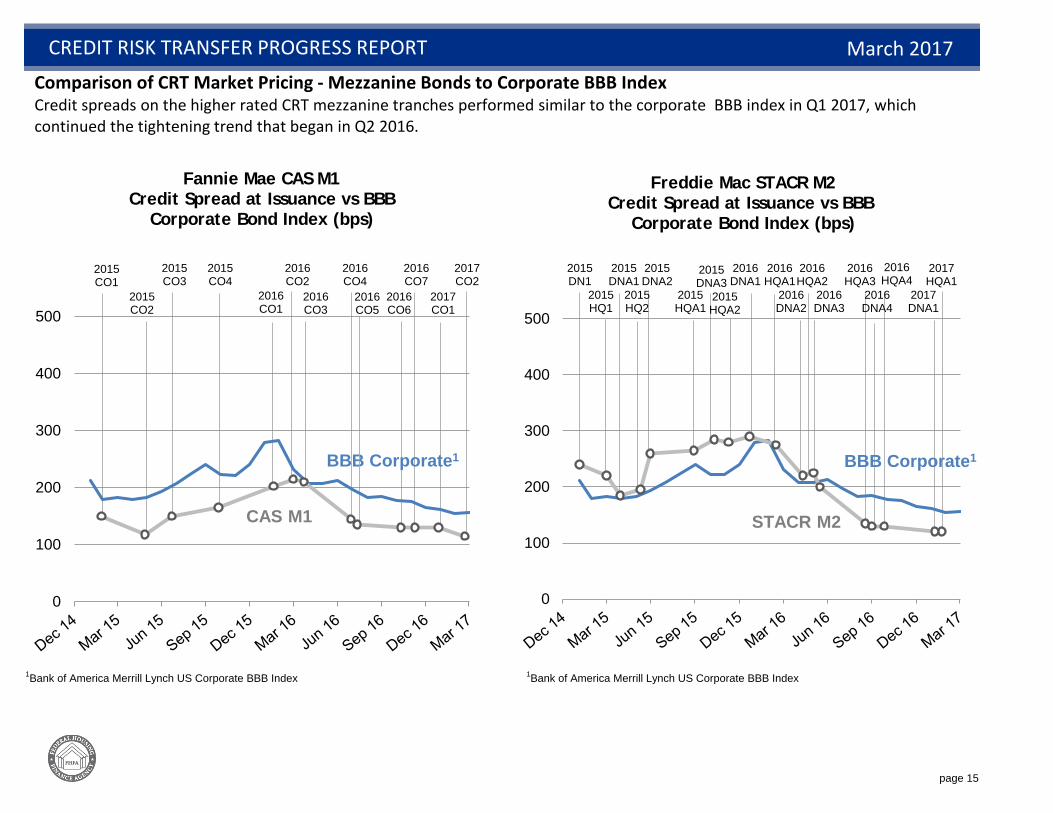
Comparison of CRT Market Pricing - Mezzanine Bonds to Corporate BBB IndexCredit spreads on the higher rated CRT mezzanine tranches performed similar to the corporate BBB index in Q1 2017, which continued the tightening trend that began in Q2 2016.
CREDIT RISK TRANSFER PROGRESS REPORT
2015CO1
2015CO2
2015CO3
2015CO4
2016CO1
2016CO2
2016CO3
2016CO4
2016CO6
2016CO7
2017CO1
2017CO2
BBB Corporate1
2015DN1
2015HQ1
2015DNA1
2015HQ2
2015DNA2
2015HQA1
2015DNA3
2015HQA2
2016DNA1
2016HQA1
2016DNA2
2016HQA2
2016DNA3
2016HQA3
2016DNA4
2016HQA4
2017DNA1
2017HQA1
2016CO5
0
100
200
300
400
500
CAS M1
0
100
200
300
400
500
BBB Corporate1
STACR M2
page 16
1Markit CDX North American High Yield Index 1Markit CDX North American High Yield Index
300
400
500
600
7002016CO2
March 2017
Freddie Mac STACR M3Credit Spread at Issuance vs High Yield
Credit Default Swap Index (bps)
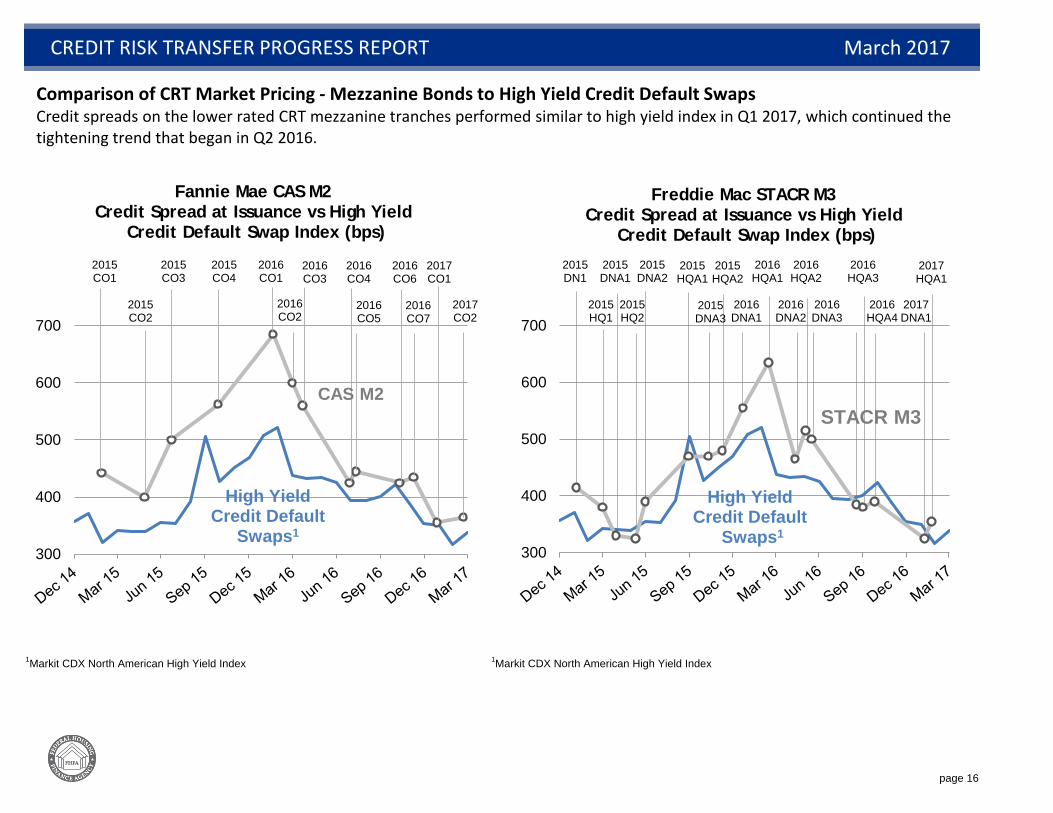
Comparison of CRT Market Pricing - Mezzanine Bonds to High Yield Credit Default SwapsCredit spreads on the lower rated CRT mezzanine tranches performed similar to high yield index in Q1 2017, which continued thetightening trend that began in Q2 2016.
CREDIT RISK TRANSFER PROGRESS REPORT
Fannie Mae CAS M2Credit Spread at Issuance vs High Yield
Credit Default Swap Index (bps)
2015CO1
2015CO2
2015CO3
2015CO4
2016CO1
2016CO3
2016CO4
2016CO6
2016CO7
2017CO1
2017CO2
2015DN1
2015HQ1
2015DNA1
2015HQ2
2015DNA2
2015HQA1
2015DNA3
2015HQA2
2016DNA1
2016HQA1
2016DNA2
2016HQA2
2016DNA3
2016HQA3
2016HQA4
2017DNA1
2017HQA1
High Yield Credit Default
Swaps1
STACR M3CAS M2
2016CO5
300
400
500
600
700
High Yield Credit Default
Swaps1

page 17
24 45
22 52
45
Appendix A: CRT Background
Enterprise Efforts to Transfer Credit Risk to the Private Sector
The Enterprises’ public purposes include providing broad national secondary market liquidity for residential mortgage financing, both for single-family and multifamily mortgages. The Enterprises provide market liquidity by acquiring mortgage loans from lenders and creating securities backed by those mortgages for sale to investors. Through the securitization process, the Enterprises transfer the interest rate and liquidity risk associated with holding mortgage loans. The securitization process generally does not, however, transfer credit risk on these loans.1
Each Enterprise manages the credit risk of its mortgage acquisitions and guarantees the timely payment of principal and interest to mortgage-backed securities investors. The Enterprises charge a guarantee fee in exchange for providing this guarantee, which covers administrative costs, projected credit losses from borrower defaults over the life of the loans, and the cost of holding capital to protect against projected credit losses that could occur during stressful macroeconomic conditions.2 The following sections describe the Enterprises’ activities to share credit risk through credit risk transfer programs.
The Role of Primary Mortgage Insurance in Sharing Credit Risk
Under their charters, loans acquired by Fannie Mae and Freddie Mac that have LTV ratios above 80 percent are required to have loan-level credit enhancement either in the form of mortgage insurance, a recourse agreement, or seller retained participation in the loan. This is
1 Freddie Mac’s securitization of its multifamily loans through K-deals does transfer credit risk in addition to interest rate and liquidity risk.2 Currently, the guarantee fee also includes a 10 basis point charge as required by Section 401 of the Temporary Payroll Tax Cut Continuation Act of 2011, codified at 12 USC 4547.
CREDIT RISK TRANSFER PROGRESS REPORT March 2017
a long-standing statutory requirement that pre-dates the Enterprises’ development of additional credit risk transfer programs. Primarymortgage insurance (PMI) is the form of charter-eligible credit enhancement used most often. Primary mortgage insurance, which can be paid by the borrower, the lender, or the Enterprise, is obtained at the front-end of the mortgage transaction prior to acquisition by the Enterprises.
The Enterprises establish PMI coverage requirements that specify the insurance coverage needed on individual loans, and these coverage requirements vary depending on the type of loan and the LTV of the loan. Currently, for 30-year loans the Enterprises require coverage that is roughly twice what is required to meet the Enterprises' minimum guidelines. The dollar amount of insurance coverage is referred to as risk-in-force (RIF). The RIF for each insured loan is calculated by multiplying the percentage of insurance coverage times the UPB of the mortgage. The total RIF for all PMIs represents the maximum level of coverage for all loans with mortgage insurance and is roughly equivalent to the Enterprises’ total risk exposure to PMI counterparties.
While the total RIF associated with PMI is large, the actual level of credit risk sharing provided through insurance claims paid depends on the number of insured loans that default and the severity of losses on those loans. The loan-level coverage structure of PMI differs from the pool-level coverage that is used in other kinds of credit risk sharing transactions. The difference between the loan-level coverage of PMI and the pool-level coverage of recent credit risk transfer transactions means that the RIF figures for these two categories are not strictly comparable.
Enterprise Credit Risk Transfer Programs
The Enterprises have made significant progress over the last four years toward fully integrating a credit risk transfer program into their
page 18
24 45
22 52
45
CREDIT RISK TRANSFER PROGRESS REPORT March 2017
business models. They have increased the amount of credit risk transferred year-over-year, and they are now transferring credit risk on most higher risk new acquisitions for which credit risk transfer is economically reasonable.
The Enterprises have also worked to develop a portfolio of different transaction structures3, which include:
• Credit risk debt issuances• Insurance/reinsurance transactions • Senior/subordinate securities • Lender front-end risk transfer transactions
As with primary mortgage insurance, the amount of credit risk transferred is referred to as RIF for the insurance products. For the Enterprises’ debt issuances, Connecticut Avenue Securities (CAS) for Fannie Mae and Structured Agency Credit Risk (STACR) for Freddie Mac, and other products where securities are created, the amount of credit risk transferred is referred to as note size. For purposes of simplifying the discussion, this CRT Progress Report refers to the amount of credit risk transferred on all credit risk transfer transactions as RIF. The following subsections provide information about different credit risk transfer structures.
Credit Risk Transfer Transaction Structures
STACR/CAS Transactions: To date, the STACR and CAS debt issuances have been the dominant transaction structure used under the Enterprises’ credit risk transfer programs. STACR and CAS securities are issued as Enterprise debt and do not constitute the sale of mortgage loans. Instead, STACR and CAS are designed to track to the performance
of a reference pool of mortgage loans that have been previously securitized into MBS guaranteed by the Enterprises and for which the Enterprises have assumed the credit risk.
The STACR/CAS structure has several key benefits. The liquidity of the to-be-announced (TBA) market is not affected by this structure because the loans referenced were previously pooled into guaranteed mortgage-backed securities and sold in the TBA market. The STACR and CAS transactions are also effectively fully collateralized by cash that investors pay to purchase the debt securities. This means that the Enterprises essentially have no counterparty or reimbursement risk with this structure. Investors pay for STACR and CAS notes in full at the time of purchase and absorb applicable credit losses through a reduction in principal on the underlying notes. As part of its STACR issuances in 2015, Freddie Mac began to transfer to investors a portion of the first losses on mortgage reference pools. Both Enterprises had previously retained the first losses on loans referenced in earlier debt issuances. Freddie Mac implemented this change for all of its 2015 STACR transactions, and Fannie Mae did so for CAS transactions starting in 2016. Beginning in 2017 the Enterprises have moved to generally retaining the first 0.50 percent B2 bond. This change is based on the economics of selling first loss. Both Enterprises also changed the structure of their securities starting in 2015 to transfer credit risk based on actual credit loss amounts, rather than based on defined credit losses calculated by a formula as in prior transactions. That change was made possible by the release by both Enterprises of approximately 15 years of historical loan-level data on single-family mortgage credit actual losses.
3 Additional information about each of the various credit risk transfer products is available in FHFA’s report entitled Overview of Fannie Mae and Freddie Mac Credit Risk Transfer Transactions, available athttp://www.fhfa.gov/AboutUs/Reports/Pages/Overview-of-Fannie-Mae-and-Freddie-Mac-Credit-Risk-Transfer-Transactions-8212015.aspx.
page 19
24 45
22 52
45
v
CREDIT RISK TRANSFER PROGRESS REPORT March 2017
Additional Credit Risk Transfer StructuresThe Enterprises use other credit risk transfer structures in addition to the STACR/CAS structure. In 2016, these additional transaction types started to constitute a greater percentage of overall credit risk transfers.
Pursuing a broad portfolio of credit risk transfer transaction structures furthers FHFA’s objective of having the Enterprises diversify their investor base for credit risk transfers and be able to compareexecution across different structures and market environments. The Enterprises are currently pursuing the following additional transaction types:
Insurance/Reinsurance Transactions: Insurance or reinsurance transactions are considered part of the credit risk transfer program and separate from the Enterprises’ charter requirements applicable to loans with LTVs greater than 80 percent. To date, the Enterprises have focused on two pool-level products — Agency Credit Insurance Structure (ACIS) for Freddie Mac and Credit Insurance Risk Transfer (CIRT) for Fannie Mae. Instead of providing coverage on individual loans as occurs with loan-level primary mortgage insurance, these pool-level policies cover a specified percentage of aggregate credit risk for a pool of hundreds or thousands of loans.
Through the CIRT and ACIS structures, the Enterprises are purchasing insurance primarily from diversified reinsurers. These transactions are partially collateralized and distributed among a variety of highly-ratedinsurers and reinsurers, which reduces counterparty, reimbursement, and correlation risk.4 Freddie Mac and Fannie Mae have different approaches to the reference pools behind their respective reinsurance deals. In the ACIS structure, which generally shares the same 4 Reinsurers are often characterized by diversified lines of business, which helps mitigate the risk that the Enterprises’ counterparties are correlated to the housing market stress and would have increased claims at exactly the same time the Enterprise themselves are under stress.
reference pool as STACR, Freddie Mac allocates sales between capital markets and reinsurance investors. In contrast, Fannie Mae establishes separate reference pools for CAS and CIRT transactions.
Senior/Subordinate Transactions: In a senior/subordinate securitization, an Enterprise sells a pool of mortgages to a trust which securitizes the cash flows into several tranches of bonds. The subordinated bonds (mezzanine and first-loss) are structured toabsorb expected and unexpected credit losses, protecting the senior bond.
The collateral backing senior/subordinate transactions are typically mortgages for which a TBA market does not exist. Examples include:
• Super-conforming mortgage loans, which have balances between the national conforming loan limit and higher limits applicable in high-cost areas;
• Adjustable Rate Mortgages (ARMs); and• Multifamily mortgages.
Freddie Mac’s version of the senior/subordinate program for its single-family program, called Whole Loan Securities (WLS), is modeled after the multifamily K-deal transactions. Fannie Mae haspreviously done a version of the senior/subordinate program for its single-family program called Wisconsin Avenue Securities (WAS) and may do so in the future. Currently, only Freddie Mac issues senior/subordinate structures.
Front-End Credit Risk Transfer Transactions: Front-end risk transfer transactions are structured so that risk is transferred prior to, or simultaneous with, Enterprise loan acquisition. These transactions may be issued as securities, which allows the originating lender to either hold the credit risk by retaining the securities or sell the credit risk by selling the securities to credit risk investors. To date, lender

page 20
24 45
22 52
45
front-end risk sharing has been the primary form of front-end risk transfer. Fannie Mae's structured security version of front-end risk transfer with lenders is called L Street Securities (LSS). To date, both agencies have issued structured securities for lender specific risk transfers. Both Enterprises are making progress in their efforts to expand the front-end risk transfer approach to the private mortgage insurance and reinsurance industries. Each issued a front-end structure with reinsurer affiliates of the mortgage insurance industry in 2016, and Fannie Mae issued a larger 12-month forward structure with traditional reinsurers in Q1 2017.
Compensation paid to the lenders for the protection they provide on front-end transactions is based solely on economic considerations and not on the overall amount of loans the lenders sell to the Enterprises. For all front-end transactions, lenders are required to retain a material portion of the risk on the underlying loans and to collateralize theirretained loss position.
Multifamily Credit Risk Transfer Transactions: Risk sharing with the private sector is an integral part of the multifamily business model for both Enterprises. Freddie Mac issues senior/subordinate notes to finance most of its multifamily originations, primarily through its K-deal structure. In these transactions, virtually all credit risk is transferred to investors through subordinated bonds that are structured to absorb expected and unexpected risk. Freddie Mac also launched a new structured product (SCR notes) to transfer credit risk on certain multifamily mortgage loans backing targeted affordable rental housing tax-exempt bonds guaranteed by Freddie Mac.
In Fannie Mae’s multifamily program (known as DUS), lenders typically share in loan level credit losses in two ways: (1) lenders share up to one-third of the losses on a pro rata basis or (2) lenders bear losses up to the first 5 percent of the unpaid principal balance of the loan and share in remaining losses up to a prescribed limit. Aside from their
CREDIT RISK TRANSFER PROGRESS REPORT March 2017
DUS transactions, Fannie Mae completed an additional multifamily CRT transaction during 2016. For this transaction, Fannie Mae transferred a portion of the risk to the reinsurance industry. This was the first non-DUS CRT transaction for Fannie Mae involving multifamily mortgage loans.
page 21
24 45
22 52
45
CREDIT RISK TRANSFER PROGRESS REPORT March 2017
Appendix B: CRT Principles, Concepts and DefinitionsCRT PrinciplesFHFA assesses all Enterprise credit risk transfer activities using the same key principles. These principles include:Reduce taxpayer risk: Transactions should transfer a meaningful amount of credit risk to private investors.Economically sensible: The program should consist of transactions in which the cost to the Enterprise for transferring the credit risk does not meaningfully exceed the cost to the Enterprise of self-insuring the credit risk being transferred.Continuity of core business: Transactions should not interfere with the continued operation of the Enterprises’ core business, including the efficient operation of the to-be-announced (TBA) market or the ability of borrowers to access credit.Repeatable: Whenever possible, transactions should be part of a regular program of similar transactions.Scalable: Transaction structures should be capable of being scaled without significantly affecting the economics or management of the transaction.Counterparty strength: In transactions in which the credit risk being transferred is not fully collateralized, credit risk transfer counterparties to the Enterprises should be financially strong companies that are able to fulfill their financial commitments even in adverse markets.Broad investor base: The program should include different transaction structures to attract a diversified and broad investor base with the objective of improving pricing, increasing secondary market liquidity, and promoting market stability.Stability through economic and housing cycles: Transaction structures should be designed to ensure that at least some
investors will remain in the market through all phases of the housing price cycle, including economic downturns.
Transparency: Whenever practical, parties to a transaction should provide public disclosure of transaction information.
Level playing field: Credit risk transfer transactions should only reflect the cost of transferring credit risk and not favor large mortgage originators over small ones.
CRT Concepts and DefinitionsFirst Loss Position: Credit risk for a pool of mortgages can be decomposed into expected loss (under baseline economic conditions), unexpected loss (under stressful, yet plausible, economic conditions), and catastrophic loss (beyond unexpected losses). While there is no single definition of first loss for purposes of credit risk transfers, FHFA interprets “first-loss position” as starting with the first dollar of loss through all expected losses.
Expected Credit Loss: Credit loss projected, on average, to occur if housing market conditions proceed according to a stable long-term trend, particularly with regard to house price levels. Even in a healthy housing market, a pool of mortgages is likely to experience some credit losses (i.e., defaults on the underlying mortgages) as some borrowers face trigger events such as illness, job loss, or other unanticipated events.
Unexpected Credit Loss: Credit loss over and above expected losses should there be a stressful, yet plausible, macroeconomic event, such as a severe downturn in house price levels as might accompany a recession (similar to what was experienced during the recent housing crisis), but short of catastrophic credit losses.
Catastrophic Credit Loss: Credit loss beyond unexpected loss that would be deemed highly unlikely to occur. There is no bright line between unexpected credit losses and catastrophic credit losses.
page 22
24 45 22 52
45
CREDIT RISK TRANSFER PROGRESS REPORT March 2017
Credit Risk: In the case of residential mortgage loans, credit risk is risk of loss to a mortgage creditor stemming from a borrower's failure to repay the loan.
Credit Risk Transfer: Credit risk transfer occurs when a party exposed to credit risk transfers some or all of that risk to another party, usually accompanied by the payment of a fee for the other party’s assumption of that risk. The Enterprises’ credit risk transfer transactions are effective for a limited duration, typically a 10- to 12-year time period. The exact reimbursement terms and recognition of credit loss are a function of the specific credit risk transfer contract for that transaction. Risk transfer may result in the transferor’s assumption of a different risk. For example, when an Enterprise transfers the credit risk on a mortgage loan for which the Enterprise has guaranteed payment of principal and interest, the Enterprise may assume risks associated with the counterparty, including reimbursement risk.
Counterparty Risk: Counterparty risk is the risk that a contractual counterparty will not perform in accordance with contract terms. This would include the counterparty’s capacity to pay claims timely, such as its financial and operational strength, the depth and quality of its capital and the diversification of its business. It also includes assessment of concentration exposures with that counterparty. When an Enterprise transfers the credit risk on a mortgage loan for which the Enterprise has guaranteed payment of principal and interest, the Enterprise assumes reimbursement risk from its risk transfer counterparties for losses incurred.
Reimbursement Risk: In the case of the Enterprise, the risk that the party(ies) to the credit risk transfer (front- or back-end) will not repay the Enterprise on time and in full for its portion of credit losses. When an Enterprise transfers credit risk while continuing to provide a guarantee to MBS investors for timely payments on principal and interest, the Enterprise assumes reimbursement risk from its risk transfer counterparty. This is an element of counterparty risk.
Front-End or Up-Front Credit Risk Transfer: This term applies to transactions in which the arrangement of the risk transfer occurs prior to, or simultaneous with, the acquisition of residential mortgage loans by an Enterprise. “Front-end” refers to the timing of the arrangement of the credit risk transfer and does not affect (either mitigate or exacerbate) the reimbursement risk assumed by an Enterprise.
Back-End Credit Risk Transfer: This term applies to transactions in which the arrangement of the risk transfer occurs after the acquisition of residential mortgage loans by the Enterprises. “Back-end” refers to the timing of the arrangement of the credit risk transfer, and does not affect (either mitigate or exacerbate) the reimbursement risk assumed by an Enterprise.
page 23
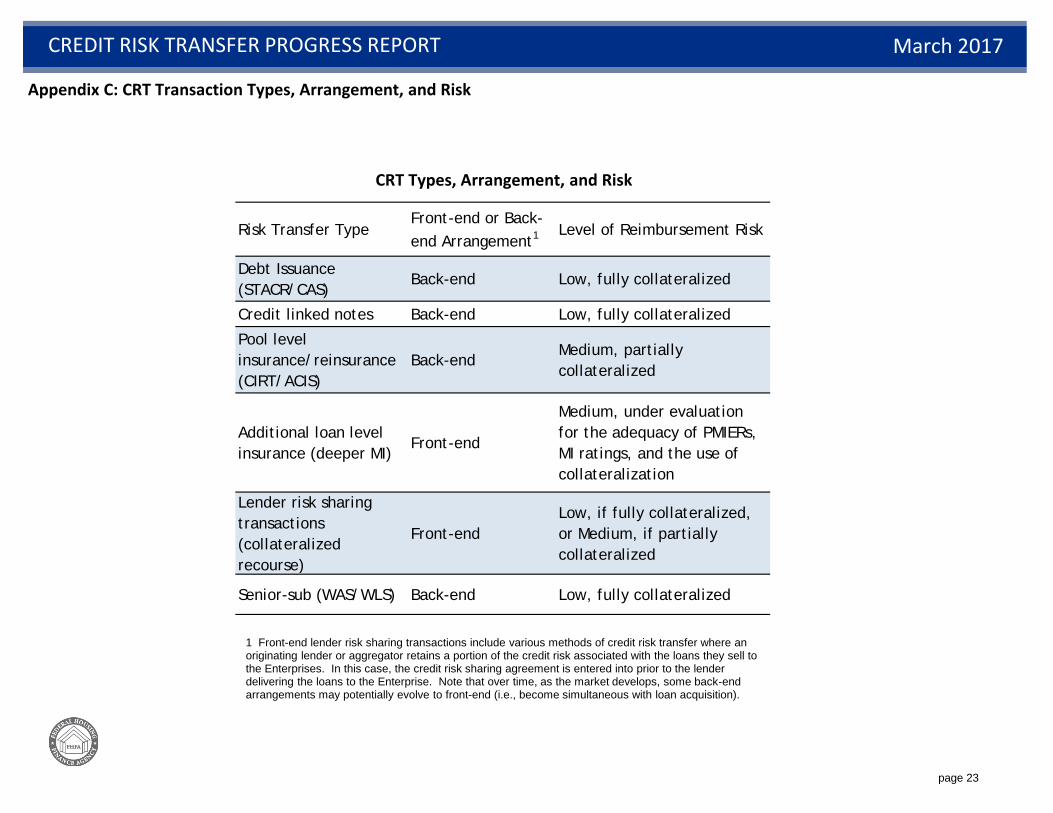
Risk Transfer TypeFront-end or Back-end Arrangement1 Level of Reimbursement Risk
Debt Issuance (STACR/CAS)
Back-end Low, fully collateralized
Credit linked notes Back-end Low, fully collateralized
Pool level insurance/reinsurance (CIRT/ACIS)
Back-endMedium, partially collateralized
Additional loan level insurance (deeper MI)
Front-end
Medium, under evaluation for the adequacy of PMIERs, MI ratings, and the use of collateralization
Lender risk sharing transactions (collateralized recourse)
Front-endLow, if fully collateralized, or Medium, if partially collateralized
Senior-sub (WAS/WLS) Back-end Low, fully collateralized
CREDIT RISK TRANSFER PROGRESS REPORT March 2017
1 Front-end lender risk sharing transactions include various methods of credit risk transfer where an originating lender or aggregator retains a portion of the credit risk associated with the loans they sell to the Enterprises. In this case, the credit risk sharing agreement is entered into prior to the lender delivering the loans to the Enterprise. Note that over time, as the market develops, some back-end arrangements may potentially evolve to front-end (i.e., become simultaneous with loan acquisition).
Appendix C: CRT Transaction Types, Arrangement, and Risk
CRT Types, Arrangement, and Risk


