282
ANNUAL REPORT 2004 TOGETHER
| Date post: | 13-Apr-2017 |
| Category: |
Documents |
| Upload: | quarterlyearningsreports2 |
| View: | 155 times |
| Download: | 0 times |

ANNUAL REPORT 2004
TOGETHER

TOGETHER
We set ourselves ambitious targets in 2004, and accomplished a great deal. Our success wasattributable to the considerable efforts of each and every one of us, and it was all the more meaningful because we achieved it together: as a team, in our dialog with clients, across ourindividual businesses, and through a combination of our individual strengths.
The renowned Swiss photographic artist Beat Streuli (born 1957) captured
images of Credit Suisse Group employees at various international locations
during January and February 2005. The Group’s financial publications for
2005 are illustrated with the work that resulted from this project.
Titel: Ketan Mehta, Reby Gulcan, Torun Mathias, Robert Arsov – Mergers & Acquisitions, Credit Suisse First Boston, New York
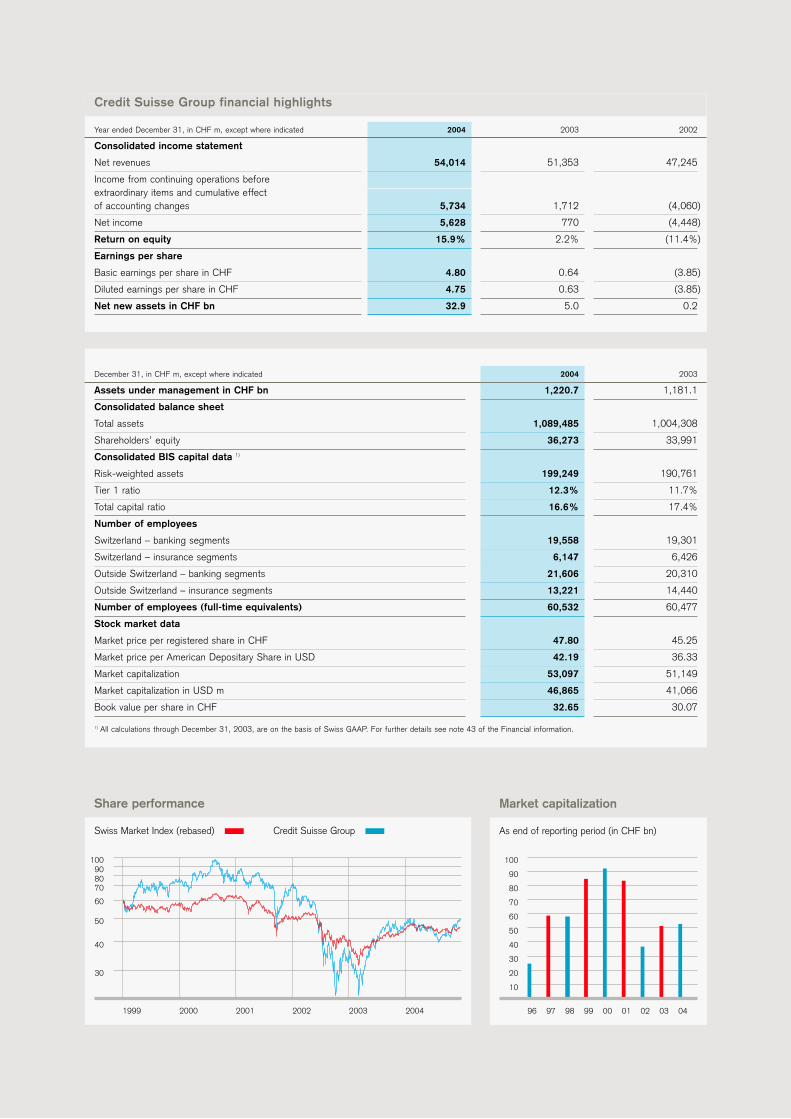
Credit Suisse Group financial highlights
Year ended December 31, in CHF m, except where indicated 2004 2003 2002
Consolidated income statement
Net revenues 54,014 51,353 47,245
Income from continuing operations before extraordinary items and cumulative effect of accounting changes 5,734 1,712 (4,060)
Net income 5,628 770 (4,448)
Return on equity 15.9% 2.2% (11.4%)
Earnings per share
Basic earnings per share in CHF 4.80 0.64 (3.85)
Diluted earnings per share in CHF 4.75 0.63 (3.85)
Net new assets in CHF bn 32.9 5.0 0.2
December 31, in CHF m, except where indicated 2004 2003
Assets under management in CHF bn 1,220.7 1,181.1
Consolidated balance sheet
Total assets 1,089,485 1,004,308
Shareholders’ equity 36,273 33,991
Consolidated BIS capital data 1)
Risk-weighted assets 199,249 190,761
Tier 1 ratio 12.3% 11.7%
Total capital ratio 16.6% 17.4%
Number of employees
Switzerland – banking segments 19,558 19,301
Switzerland – insurance segments 6,147 6,426
Outside Switzerland – banking segments 21,606 20,310
Outside Switzerland – insurance segments 13,221 14,440
Number of employees (full-time equivalents) 60,532 60,477
Stock market data
Market price per registered share in CHF 47.80 45.25
Market price per American Depositary Share in USD 42.19 36.33
Market capitalization 53,097 51,149
Market capitalization in USD m 46,865 41,066
Book value per share in CHF 32.65 30.07
1) All calculations through December 31, 2003, are on the basis of Swiss GAAP. For further details see note 43 of the Financial information.
96 97 98 99 00 01 02 03 04
10
20
30
40
50
60
70
80
90
100
Market capitalization
As end of reporting period (in CHF bn)
1999 2000 2001 2002 2003 2004
Share performance
Swiss Market Index (rebased) Credit Suisse Group
30
50
40
70
60
9080
100

Ticker symbols / Stock exchange listings
Bloomberg Reuters Telekurs
SWX Swiss Exchange/virt-x CSGN VX CSGN.VX CSGN,380
New York (ADS) 1) CSR US CSR.N CSR,065
1) 1 ADS represents 1 registered share.
CSG share ADS
Swiss security number 1213853 570660
ISIN number CH0012138530 US2254011081
CUSIP number 225 401 108
Financial calendar
Annual General Meeting Friday, April 29, 2005
First quarter results 2005 Wednesday, May 4, 2005
Dividend payment Friday, May 6, 2005
Second quarter results 2005 Wednesday, August 3, 2005
Third quarter results 2005 Wednesday, November 2, 2005
Ratings
Moody’s Standard & Poor’s Fitch Ratings
Credit Suisse Group
Short term – A-1 F1+
Long term Aa3 A AA-
Outlook Stable Stable Stable
Credit Suisse
Short term P-1 A-1 F1+
Long term Aa3 A+ AA-
Outlook Stable Stable Stable
Credit Suisse First Boston
Short term P-1 A-1 F1+
Long term Aa3 A+ AA-
Outlook Stable Stable Stable
Winterthur
Insurer Financial Strength A1 A- A+
Rating WatchOutlook Negative Stable Negative
Share data
December 31 2004 2003
Shares issued 1,213,906,217 1,195,005,914
Treasury shares (103,086,736) (64,642,966)
Shares outstanding 1,110,819,481 1,130,362,948
Share price
in CHF 2004 2003 2002
High (closing price) 49.50 48.70 73.60
Low (closing price) 37.35 20.70 20.60

ANNUAL REPORT 2004

The Business Review 2004 provides further insight into
the Credit Suisse Group business, strategy and market
environment from a management, client and employee
perspective. It is being published for the first time in
2005 and is targeted at a wide readership including
shareholders, clients and other parties with an interest
in the Group. Included in the Business Review is a
condensed presentation of the Group's results, which
should be read in conjunction with the financial
statements as disclosed in the Annual Report 2004.
BUSINESS REVIEW 2004
TOGETHER

Content
4 Message from the Chairman
6 Message from the Chief Executive Officer
9 INFORMATION ON THE COMPANY10 Credit Suisse Group
14 Credit Suisse
21 Credit Suisse First Boston
29 Winterthur
37 OPERATING AND FINANCIAL REVIEW38 Overview
40 Summary of Group results
41 Summary of segment results
43 Credit Suisse Group
50 Credit Suisse
51 Private Banking
53 Corporate & Retail Banking
56 Credit Suisse First Boston
57 Institutional Securities
62 Wealth & Asset Management
66 Winterthur
67 Life & Pensions
73 Non-Life
79 Corporate Center
81 RISK MANAGEMENT
109 FINANCIAL INFORMATION110 Consolidated financial statements
221 Parent company financial statements
231 CORPORATE GOVERNANCE
273 MAIN OFFICES

Message from the Chairman4
Dear shareholders
2004 marked another year of progress for Credit Suisse Group. We have delivered agood business and financial performance in the face of a mixed market environment,we also made some significant changes to our top management team andannounced our strategic plan drafted by the CEO, Oswald J. Grübel, and his teamand approved by the Board. There is much more to do, but we are now well on theway to achieving a sustainable position as a leading competitor in the global financialmarketplace.
We reported net income of CHF 5.6 billion for the full year. The Board of Directorswill propose a dividend of CHF 1.50 per share to the Annual General Meeting onApril 29, 2005 and will also ask for approval for a share buyback program for up toCHF 6 billion.
The context for our strategic deliberations was our belief that the financial servicesindustry will continue to experience change driven by technology and theglobalization of markets. This means that the business environment will becomemore complex and less predictable and this change will continue to transform theneeds of our clients. Our continued success will depend on a swift and flexiblestrategic response. We believe that we have put in place an appropriate strategicplan and the management capability to deliver it.
This plan will enable us to unlock the considerable experience and knowledge offinancial markets from across Credit Suisse Group to fulfill the expectations of ourclients. We will do this by managing our banking businesses as a fully integratedbank rather than separate business units. This will enable us to use our resourcesmore effectively and allow our people to work together on a global basis. We willhave three banking business areas: private client services, corporate and investmentbanking and asset management, supported by integrated corporate center functions.The transition to the new structure will be completed at the latest by the end of2006.
In addition to our plans for integration we have identified priorities for our growingeach of our businesses. In private banking, we intend to expand our position as aleading global institution. We also plan to strengthen the position in our core Swissmarket, both in private and in corporate and retail banking. In investment banking,we are focusing on profitable growth and want to be among the leading institutionsoffering a wide spectrum of investment banking services worldwide. We use our
Walter B. Kielholz
Chairman of the
Board of Directors
Credit Suisse Group

Message from the Chairman 5
existing strengths more effectively and aim to expand our presence throughprofitable growth – particularly in Europe and Asia.
We also defined the strategy for our insurance business. Winterthur’s ability todeliver solid earnings has increased considerably. This was reflected in its results for2004. However, we believe that earnings at Winterthur could still further improve. Asthe integrated management of banking and insurance is no longer our strategy, wehave decided to manage Winterthur as a financial investment and prepare ourinsurance group – market conditions allowing – for a possible public offering.
During 2004 we made a number of changes to the executive team to ensure thatwe can realize the benefits of becoming a more integrated bank and implement ourgrowth plans. By mid-year, Oswald Grübel, who has been with Credit Suisse for over30 years and has an outstanding track record in both investment banking and privatebanking, became sole CEO of Credit Suisse group. John Mack left the Group at theend of his three-year contract in early July 2004. John Mack had joined CreditSuisse Group as CEO of Credit Suisse First Boston in 2001 and was appointed Co-CEO of Credit Suisse Group as per January 1, 2003. I would like to thank Mr. Mackfor his most valuable contributions to both the restructuring of Credit Suisse FirstBoston and the turnaround of the Group.
Walter Berchtold was appointed CEO of Credit Suisse and Brady Dougan CEO ofCredit Suisse First Boston. Both have occupied leading positions within our companyfor many years. In addition, our executive team gained two experienced managersfrom outside the company with the appointment of Urs Rohner as General Counseland Head of the Corporate Center and Renato Fassbind as Chief Financial Officer.Together with Leonhard Fischer, CEO of Winterthur, these individuals form thecommittee of the Group Executive Board, which provides the leadership of CreditSuisse Group.
The Board is confident that following our return to profitability in 2003, a goodfinancial result in 2004 has provided further reassurance that we are on track tocontinue to deliver attractive returns to our shareholders.
Our financial results show that we have a solid operating business and strong capitalbase upon which to build our strategy. It is equally important for us to have acorporate culture that is able to adapt successfully to the rapid changes within ourindustry and turn it to our clients’ advantage. Consequently, foresight, a willingnessto innovate, and an ability to accurately assess and take a disciplined approach torisk are all factors governing success in our business. These are qualities, which ouremployees have demonstrated in 2004, and I would like to thank them all for theirconsiderable commitment and contribution to the Group. We want to be at the veryforefront of our industry and, together, we are working to create a ’one bank’organization and culture that will generate real benefits for our clients andshareholders.
Yours sincerely
Walter B. Kielholz
March 2005

Message from the Chief Executive Officer6
Dear shareholders
The year 2004 put the flexibility of the financial services industry to the test: marketsentiment improved in the first half, only to be replaced by a lack of clear trends,reduced volumes and historically low volatility in the second half – compounded bythe weakening of the US dollar. Our Group successfully navigated these challengesand generated net income of CHF 5.6 billion for 2004 – despite an increase inprovisions related to the sale of Winterthur International, a loss on the disposal of aminority holding and severance costs at Credit Suisse First Boston. This good 2004result underscores our ability to capture opportunities and to capitalize on change ina mixed market environment.
Credit Suisse Group’s overall 2004 performance reflects progress on many fronts.All of our banking units reported increased profitability compared to 2003, driven inpart by efficiency gains and cost containment efforts. Improved business momentumwas also evident at Winterthur, which delivered solid 2004 results and madecontinued progress towards sustained profitability.
Our Private Banking business posted strong annual results in 2004, due primarily toasset-driven revenue generation and efficiency improvements. The segment’s strongfull-year net income was accompanied by excellent gross margins and healthy netnew asset inflows across all regions. While cost containment and processenhancement remained a priority throughout the year, Private Banking continued toinvest in key growth opportunities in selected international markets.
Corporate & Retail Banking recorded very good net income in 2004, coupled with animproved cost/income ratio and an increased return on average allocated capital.The enhanced profitability of our business with private and corporate clients inSwitzerland was mainly attributable to efficiency improvements and a low level ofcredit provisions. Moreover, by reallocating resources to the client segments offeringthe greatest potential, Corporate & Retail Banking succeeded in strengthening itsclient focus and in improving the quality of its products and services.
Credit Suisse First Boston reported improvements in its financial performance in2004, with moderate revenue growth and continued cost discipline in both of itssegments. At Institutional Securities, the year-on-year rise in net income wasattributable to higher fixed income and equity trading results, higher debtunderwriting revenues, gains on legacy investments, lower credit provisions and
Oswald J. Grübel
Chief Executive Officer
Credit Suisse Group

Message from the Chief Executive Officer 7
lower income tax expense. Meanwhile, improved 2004 net income at Wealth & AssetManagement was driven primarily by private equity investment-related gains.
Credit Suisse First Boston also continued to lay the foundations for the futuredevelopment of the business. As well as implementing key organizational changes,the firm launched a new strategy aimed at achieving a leadership position in selectedmarkets by delivering a more focused franchise.
Our insurance business, Winterthur, recorded a solid result in 2004. Both the Life &Pensions and the Non-Life segment delivered improved underwriting results –reflecting cost containment and efficiency improvements – and stable investmentincome with lower levels of realized losses. Despite being impacted by theaforementioned increase in provisions relating to the sale of Winterthur International,these results underscore that Winterthur is advancing towards its goal of sustainedprofitability.
The Group’s positive 2004 performance enabled it to further strengthen its capitalbase – resulting in a consolidated BIS tier 1 ratio of 12.3% as of December 31,2004. This will not only enable us to fund our ambitious growth strategy but will alsoallow us to return capital to our shareholders.
In view of the progress we have achieved during the 2004 financial year and ourproven ability to respond rapidly, flexibly and – in particular – creatively to marketdevelopments, I believe that we have a strong basis upon which to implement ourkey strategic objectives. Moreover, with the unfaltering commitment and expertise ofour employees, I am confident that we will continue to satisfy the diverse needs ofour clients and the expectations of our shareholders going forward.
Yours sincerely
Oswald J. Grübel
March 2005

This page has been intentionally left blank.

INFORMATION ON THE COMPANY
Credit Suisse Group
Institutional Securities
Wealth & Asset Management
Life & Pensions
Non-Life
Credit Suisse First Boston Winterthur
Credit Suisse First Boston legal entity Winterthur legal entity
Credit Suisse
Private Banking
Corporate & Retail Banking
Credit Suisse legal entity

Information on the company Credit Suisse Group10
INFORMATION ON THE COMPANY
Credit Suisse Group
OVERVIEW
Credit Suisse Group is a global financial services company domiciled in Switzerland.The activities of Credit Suisse Group are structured into three main business units,described below.
CREDIT SUISSE GROUP STRUCTURE
Credit Suisse Group comprises three business units with six reporting segments:Credit Suisse, including the Private Banking and Corporate & Retail Bankingsegments; Credit Suisse First Boston, including the Institutional Securities andWealth & Asset Management segments; and Winterthur, including the Life &Pensions and Non-Life segments.
The structuring of the organization into three business units resulted from acorporate reorganization in July 2004 designed to accelerate the integration of thecore businesses and to sharpen the Group’s strategic focus. The new structurecame into effect on July 13, 2004. The reorganization also included the designationof a single CEO and the elimination of the Credit Suisse Financial Services businessunit. The individual financial reporting segments remained unchanged.
The organization presented below reflects the segment structure in place as of July2004.
Credit Suisse Group
Credit Suisse
PRIVATE BANKING
CORPORATE & RETAIL BANKING
INSTITUTIONAL SECURITIES
WEALTH & ASSET MANAGEMENT
LIFE & PENSIONS
NON-LIFE
Credit Suisse First Boston Winterthur
Credit Suisse legal entity Credit Suisse First Boston legal entity Winterthur legal entity

Information on the company Credit Suisse Group 11
Credit SuisseThe Credit Suisse business unit is a leading provider of comprehensive financialservices in Europe and several other markets globally. Under its main brands CreditSuisse and Credit Suisse Private Banking, it offers comprehensive financial servicesto private and corporate clients.
Credit Suisse operates through two segments, Private Banking and Corporate &Retail Banking:
– Private Banking, providing high-net-worth individuals in Switzerland and innumerous other markets around the world with wealth management products andservices.
– Corporate & Retail Banking, offering banking products and services tocorporate and retail clients in Switzerland.
Credit Suisse First BostonThe Credit Suisse First Boston business unit serves global institutional, corporate,government clients and high-net-worth individuals as a financial intermediary,providing a broad range of products and services including securities underwriting,sales and trading, financial advisory, private equity investments, full servicebrokerage, derivatives and risk management products, asset management andresearch.
Credit Suisse First Boston operates through two segments, Institutional Securitiesand Wealth & Asset Management:
– Institutional Securities, providing financial advisory and capital raising servicesand sales and trading for global users and suppliers.
– Wealth & Asset Management, offering international asset managementservices to institutional, mutual fund and private investors, making private equityinvestments and managing private equity funds, and providing financial advisoryservices to high-net-worth individuals and corporate investors.
WinterthurThe Winterthur business unit provides insurance and pension solutions for privateand corporate clients in Europe, North America and selected Asian markets.
Winterthur operates through two segments, Life & Pensions and Non-Life:
– Life & Pensions, offering life insurance products through multiple distributionchannels to private and corporate clients in Switzerland and selected markets inEurope and Asia.
– Non-Life, providing non-life insurance products to private and small and medium-sized corporate clients in Switzerland, North America and certain markets inEurope.

Information on the company Credit Suisse Group12
Corporate Center The Credit Suisse Group Corporate Center performs typical holding companyfunctions for the benefit of the Group as a whole and includes parent companyoperations, certain centrally managed functions and consolidation adjustments.
The Corporate Center consists of the following functions reporting directly to theGroup’s Chief Executive Officer, with the exception of Group Internal Audit, whichreports to the Audit Committee:
– Group-level functions assigned to the Group General Counsel and Head of theCorporate Center, including Legal and Compliance, Human Resources,Communications and Corporate Development;
– Group-level functions assigned to the Chief Financial Officer, includingAccounting and Financial Reporting, Tax, Capital and Liquidity Management andInvestor Relations;
– Group Risk Management; and– Group Internal Audit.
ACQUISITIONS AND DIVESTITURES
In December 2004, Credit Suisse Group agreed to sell its 19.9% stake in theprivate equity activities of Warburg Pincus, which it acquired in July 1999. Theinvestment was repurchased by Warburg Pincus with effect from January 1, 2005.
OUTSOURCING OF SERVICES
Where the outsourcing of services through agreements with external serviceproviders is considered significant under the terms of Swiss Federal BankingCommission Circular 99/2 “Outsourcing,” those agreements comply with allregulatory requirements with respect to business and banking secrecy, dataprotection and customer information. Credit Suisse Group has no significantoutsourcing relationships with external service providers.
STRATEGY
Credit Suisse Group’s strategy is to strengthen its global position in asset gatheringand investment banking by being a leader in private wealth management, globalinstitutional asset management, retail banking in Switzerland and global investmentbanking. The Group intends to meet its financial targets by accelerating organicgrowth and strengthening its competitive position in its core banking businesses. TheGroup will continue to manage Winterthur in order to generate profitable growth. Inaddition, Credit Suisse Group expects to continue its role as a leader in the evolutionof the global financial services industry.

Information on the company Credit Suisse Group 13
Business unit strategies Within the framework of the overall Group strategy, the three business units alsopursue their own more specific strategies designed to meet the needs of theircustomers, as well as their particular operating and competitive environment. Thesestrategies are discussed in more detail in the respective descriptions of the businessunits.
RealignmentA key strategic initiative announced in December 2004 is the formation of a fullyintegrated bank, with three distinct lines of business: Private Client Services,Corporate and Investment Banking, and Asset Management. Components of thisinitiative, which is expected to be completed by the end of 2006, include a mergerof the two main banking legal entities, greater emphasis on Corporate Centerfunctions and the focus of management on the Group as a whole, to enhancecooperation across the whole company. In addition, Asset Management activitiesthroughout the Group will be brought together and thereby positioned as a corestrength and will represent a key component of our value proposition in all ourbusinesses.
COMPANY HISTORY AND LEGAL STRUCTURE
The history of Credit Suisse Group dates back to the formation of SchweizerischeKreditanstalt, founded in 1856. The first branch was opened in Basle in 1905 andthe first branch outside of Switzerland was opened in New York in 1940. In 1978, acooperation with First Boston, Inc. began and in 1990, a controlling stake wasacquired. A controlling stake in Bank Leu was purchased in 1990, SchweizerischeVolksbank was purchased in 1993, Neue Aargauer Bank was purchased in 1994,and the acquisition of Winterthur took place in 1997. Another key acquisition wasDonaldson, Lufkin & Jenrette Inc., or DLJ, in 2000.
Credit Suisse Group’s three business units, Credit Suisse, Credit Suisse First Bostonand Winterthur, are aligned within the following three principal legal entities:
– Credit Suisse (Private Banking and Corporate & Retail Banking segments);– Credit Suisse First Boston (Institutional Securities and Wealth & Asset
Management segments); and – Winterthur (Life & Pensions and Non-Life segments).
The Board of Directors of Credit Suisse Group, Credit Suisse and Credit Suisse FirstBoston have resolved to merge legal entity Credit Suisse with legal entity CreditSuisse First Boston in Switzerland during the second quarter of 2005.
Credit Suisse Group is registered as a corporation in the commercial register of, andhas registered offices in, Zurich, Switzerland. The address of the principal executiveoffices is: Paradeplatz 8, P.O. Box 1, CH-8070, Zurich, Switzerland; the telephonenumber is: +41 44 212 1616.

Information on the company Credit Suisse14
Credit Suisse
OVERVIEW
The Credit Suisse business unit is comprised of the Private Banking and Corporate& Retail Banking segments. These two segments offer comprehensive financialservices to private and corporate clients.
As discussed in the Credit Suisse Group section above, as part of the corporatereorganization in July 2004, the banking and insurance businesses of the formerCredit Suisse Financial Services business unit were reorganized under the CreditSuisse and Winterthur business units, respectively.
– Private Banking provides high-net-worth individuals in Switzerland and innumerous other markets around the world with wealth management products andservices. Private Banking is one of the largest private banking operationsworldwide, with a leading client-centric service model and recognized innovationcapabilities.
– Corporate & Retail Banking offers banking products and services to corporateand retail clients in Switzerland. Corporate & Retail Banking is the second-largestbank in Switzerland, with a nationwide branch network and leading multi-channeldistribution capabilities.
As of December 31, 2004, the Credit Suisse distribution network consisted of 214branches serving Corporate & Retail Banking and Private Banking clients inSwitzerland and approximately 50 Private Banking locations abroad.
As a result of the reorganization in 2004, Credit Suisse is structured as follows:
– Four dedicated front-office divisions: one division serving Corporate & RetailBanking clients and three divisions serving Private Banking clients (PrivateBanking Switzerland, Private Banking International and Private Banking Europe);
– Four middle and back-office divisions, each serving all front-office divisions:Investment Management, Trading & Sales, Information Technology andOperations;
– A Chief Operating and Chief Financial Officer division (COO & CFO), whichincludes the Treasury function and nearly all Corporate Center functions of theCredit Suisse business unit;
– Three departments for Marketing, Human Resources and the Business School,which report directly to the CEO of Credit Suisse; and
– Four separately branded private banks reporting directly to the CEO of CreditSuisse: Bank Leu, Clariden Bank and Bank Hofmann, all headquartered inZurich; and BGP Banca di Gestione Patrimoniale, headquartered in Lugano.
Client relationships were not affected by this reorganization.

Information on the company Credit Suisse 15
STRATEGY
Credit Suisse’s mission is to be the leading global private bank and the leading bankin Switzerland in terms of client satisfaction, employee excellence and shareholderreturns.
Credit Suisse’s strategy is to:
– Invest in markets and businesses with above-average growth or growth potential;– Secure its earnings strength by further expanding its position in the Swiss home
market;– Secure long-term growth by diversifying its geographic mix;– Lead the industry in terms of innovative products and solutions;– Further develop an integrated business model across segments and divisions by
leveraging client relations, products and infrastructure;– Finance growth investments through continuous productivity improvements; and– Continue to be an important cash flow contributor to Credit Suisse Group.
With respect to its two segments, Credit Suisse pursues the following strategies:
Private Banking intends to expand in the international onshore and offshore business(Asia, Middle East, Central & Eastern Europe and Latin America) and to growprofitably in the European onshore business where it aims to reach break-even by2007. In addition, Private Banking aims to maintain a strong position and to increaseits profitability in the European offshore business. Furthermore, Private Bankingintends to expand its market share in the Swiss onshore business by a greater focuson increasing its share of managed assets (discretionary mandates, funds, structuredproducts) and by further building on premium positioning in value-added clientservices.
Corporate & Retail Banking intends to gain market share in the high-end retailbusiness through attractive anchor products such as private mortgages andinvestment products. Furthermore, Corporate & Retail Banking aims to increase itsprofitability in the low-end retail business and to grow in the consumer financebusiness including the credit card business. In addition, the segment is looking toexpand its strong position with large corporate clients and to further gain marketshare with small and medium-sized corporate clients that have attractive risk-returnprofiles. Corporate & Retail Banking intends to have a superior positioning in value-added client services, aligned to specific client needs for each of the above-mentioned client segments.
PRIVATE BANKING
Overview Private Banking is one of the world’s largest private banking organizations, withbranches in Switzerland and numerous international locations, and providescomprehensive wealth management products and services to high-net-worthindividuals through a network of relationship managers and specialists. It also offersvarious services directly over the Internet through its portal located at www.credit-suisse.com/privatebanking.

Information on the company Credit Suisse16
Each one of the approximately 600,000 Private Banking clients has a designatedrelationship manager as a primary point of contact. As of December 31, 2004, thePrivate Banking segment had approximately 12,000 employees worldwide, of whichapproximately 2,600 were relationship managers and financial advisors. As of thatdate, Private Banking had CHF 539.1 billion of assets under management.
Private Banking has three front-office divisions, focusing on clear strategic marketpriorities:
– Private Banking Switzerland comprises the Swiss domestic market, internationalprivate clients from neighboring countries, and booking centers in Luxembourg,Guernsey, Monaco and Gibraltar;
– Private Banking International comprises international private clients in AsiaPacific, the Middle East, the Americas, Northern Europe, Eastern Europe, SouthAfrica and Iberia. It includes the Global Private Banking Center in Singapore, aswell as operations in Hong Kong, the Bahamas and Frye-Louis CapitalManagement, Inc. in Chicago. In addition to these activities, Private BankingInternational operates Credit Suisse Trust, which provides independent advice anddelivers integrated wealth management solutions to ultra high-net-worthindividuals, as well as Credit Suisse Advisory Partners, which offers highlydeveloped special financing, corporate advisory and family office services to ultrahigh-net-worth individuals; and
– Private Banking Europe comprises onshore banking operations in the five largestEuropean markets: Germany, Italy, the United Kingdom, France and Spain, andalso includes JO Hambro Investment Management Limited in London.
The four separately branded private banks – Bank Leu, Clariden Bank, BankHofmann and BGP Banca di Gestione Patrimoniale – also form part of the PrivateBanking segment.
Private Banking intends to pursue the following in order to implement its strategy:
– Expand geographic coverage by opening or upgrading further locations; – Strengthen international management capabilities and resources;– Continue to hire and develop senior relationship managers for key growth
markets;– Further expand capabilities and offerings for the ultra high-net-worth individuals
segment;– Leverage the client base of other Credit Suisse Group businesses;– Further expand investment product skills and offerings;– Further develop and deploy Credit Suisse’s structured advisory process;– Benefit from continued investments in client relationship management and
workplace tools; and– Further improve customer experience along all points of contact and interfaces.
Products and services Private Banking offers customized solutions that address the full range of clients’wealth management needs. This includes providing comprehensive financial advicefor each phase of life, as well as addressing issues relating to clients’ non-liquidassets such as business and property interests.

Information on the company Credit Suisse 17
In 2004, Private Banking fully integrated and further improved its “Private BankingAdvisory Process” in Switzerland. Using a structured approach, the client’s personalfinances are analyzed and an investment strategy is prepared based on the client’srisk profile, service profile and level of “free assets” after dedicated assets are setaside to cover the client’s fixed and variable liabilities. In accordance with theInvestment Committee’s guidelines, Private Banking’s investment professionalsdevelop their specific investment recommendations. The subsequent implementationand monitoring of the client’s portfolio are carried out by the relationship managerusing a continuously improving financial tool, which is closely linked to PrivateBanking’s award-winning customer relationship management platform.
Private Banking’s core service is managing liquid assets through investment adviceand discretionary asset management. Investment advice covers a wide range oftopics from portfolio consulting to advice on single securities. For clients who areinterested in a more active management of their portfolios, Private Banking offersdedicated investment consultants who continuously analyze the latest marketinformation to develop investment recommendations, enabling clients to takeadvantage of market opportunities across all asset categories. For clients with morecomplex requirements, Private Banking offers investment portfolio structuring andthe implementation of individual strategies, including a wide range of investments instructured products, alternative investments, private equity and real estate.
Discretionary asset management is designed for clients who wish to delegate theresponsibility for investment decisions to the bank. Private Banking offers a numberof standardized portfolio management mandates linked to the client’s riskpreferences and reference currency. Four types of mandates are offered: Classic,Funds & Alternative Investments, Total Return Strategy and Premium. Depending onthe type of mandate, direct investments, investments in funds or investments inalternative products are executed. Predefined investment strategies such as capitalpreservation and growth or current return, and customized solutions that meetclients’ identified investment goals, are offered within the Premium Mandate.
Private Banking remains at the forefront of product innovation and open productplatforms. The latter allows us to offer tailor-made, client-specific solutions, whichare bundled from a wide range of own and third-party best-in-class products andservices. Structured investment products are intended to provide market-neutralinvestments and access to Private Banking’s own and third-party international assetmanagers through a fund-of-funds approach. Market-neutral means that assetmanagers pursue investment strategies that offer positive returns in economicclimates in which traditional assets perform poorly. Private Banking currently offersmutual fund products covering around 2,500 funds from around 55 fund providers.
For financing needs, Private Banking offers two basic financing services, securities-backed financing (repo-business) and margin lending, which allows clients to borrowagainst their investment portfolios, and real estate financing of clients’ residentialproperties.
Private Banking’s advisory services comprise tax planning, pension planning andwealth and inheritance advice, including the establishment of Private Banking trustsand foundations, as well as advice on life insurance. Private Banking’s corporateadvisory services are aimed at entrepreneurs seeking to sell their businesses or toraise additional capital. In either case, Private Banking provides valuation services

Information on the company Credit Suisse18
and seeks to find potential investors in the public and private markets. PrivateBanking also offers “Family Office” services, a variety of tailor-made products andadvice for individuals and families generally with minimum assets of USD 50 million.
Marketing and distributionPrivate Banking has a global franchise and a strong presence in Europe, Asia, LatinAmerica and the Middle East. As of December 31, 2004, Private Banking served itsclients through approximately 120 locations around the world, of which approximately70 locations are in Switzerland (not including the locations of Bank Leu, BankHofmann, Clariden Bank and BGP Banca di Gestione Patrimoniale).
In 2004, Credit Suisse opened offices in various locations (including Moscow, Jerseyand Brazil). Offices in Bangkok and Dubai are in the process of being opened.Credit Suisse is the first foreign bank to have been granted a license to offer fullPrivate Banking services in the Dubai International Financial Centre starting in April2005. This branch will offer onshore and offshore services as well as Sharia-compliant banking services.
Operating environment and competitionOperating environmentCredit Suisse expects reduced, but still significant, growth rates in the privatebanking market in the near future. Growth is expected to be higher in onshore thanin offshore markets. This is the result of greater political stability in manyindustrialized and newly industrialized countries, as well as the deregulation of localmarkets coupled with tighter restrictions and ongoing pressure on traditional offshorelocations. The positive trends affecting the private banking industry over the nextseveral years are expected to include a growing demand for pension provisions,which can no longer be guaranteed through general social security. As a result,governments will increasingly encourage the accumulation of private wealth. Inaddition, entrepreneurs are using the services of private banks to diversify theirassets, while, at the same time, the next generation is inheriting an increasingvolume of wealth from the baby-boom generation.
Competitive pressure in the financial services industry remains high. The need toinvest in quality advice, product innovation and tools for front-office employeesunderlines this situation. In addition, the costs of doing business (e.g. compliance,accounting, competition for talented employees) are increasing. The Group expectsmain growth to be achieved through acquisitions of relationship managers and otherbanks as well as through net new asset generation.
CompetitionThe private banking market is highly fragmented and consolidation, especially inSwitzerland, is expected to proceed at a higher pace. Competitors in the privatebanking business include major financial institutions with dedicated private bankingactivities such as UBS, HSBC and Citigroup, as well as domestic banks within theirrespective markets. In the ultra high-net-worth individuals business, there are majorcompetitors including US investment banks, which are building upon their investmentbanking expertise and their client relationships. In the Swiss market, the largestcompetitor is UBS, followed by a number of independent private banks, as well asretail banks providing private banking services.

Information on the company Credit Suisse 19
CORPORATE & RETAIL BANKING
OverviewCorporate & Retail Banking serves both corporate and retail clients through a multi-channel distribution approach.
As of December 31, 2004, Corporate & Retail Banking had approximately 1.8million retail clients and approximately 100,000 corporate clients. As of that date,the segment had total loans of CHF 86.7 billion.
Corporate & Retail Banking intends to pursue the following in order to implement itsstrategy:
– Acquire new clients through attractive anchor products as well as targetedmarketing campaigns and events;
– Increase product penetration, tailored to the financial abilities of target clients, bydatabase marketing and by product bundling;
– Strengthen sales force effectiveness through focused training and targetedincentives;
– Continuously optimize branch network, upgrade e-banking offerings and extendthird-party distribution channels;
– Improve client service delivery through optimized end-to-end processes (higherquality, improvements in speed, and a lower cost base);
– Shift resources from mid and back-office functions to client teams and hiresales-oriented relationship managers;
– Launch further retail investment products and continuously improve lendingproduct offerings; and
– Invest in workplace tools, leveraging best-in-class technology from PrivateBanking.
The results of operations of Corporate & Retail Banking include the activities ofNeue Aargauer Bank, a separately branded regional retail bank in the canton ofAargau, Switzerland.
Products and servicesCorporate & Retail Banking offers corporate and retail clients a wide range offinancing products and services, such as mortgages, secured and unsecuredcorporate loans, trade finance, consumer loans, leasing and credit cards, as well asinvestment products and services, payment transactions, foreign exchange, lifeinsurance and pension products. Corporate & Retail Banking also offers clients e-banking solutions. In some cases, such as investment and insurance product sales,Corporate & Retail Banking sells these products jointly with other Credit SuisseGroup businesses.
In the credit card business, Corporate & Retail Banking has entered into a jointventure, Swisscard AECS, with American Express Travel Related Services Companyfor the purpose of issuing cards, processing transactions and acquiring merchants.As a market leader in credit cards in Switzerland in terms of turnover, SwisscardAECS offers Mastercard, Visa and American Express cards. These credit cards aredistributed through Corporate & Retail Banking and Private Banking sales channels,as well as through those of Swisscard AECS.
Information on the company Credit Suisse20
Corporate & Retail Banking offers sophisticated payment products tailored to theneeds of all customer segments. The variety of payment products ranges from IT-based, fully automated transaction solutions for large corporate clients to cost-efficient and convenient schemes for private clients.
For its lending products, Corporate & Retail Banking often requires a pledge ofcollateral. The amount of collateral required is determined by the type and amount ofthe loan, as well as the risk profile of the specific customer. As of December 31,2004, 84% of its loan portfolio was secured by collateral, including marketablesecurities, commercial and residential properties as well as bank and clientguarantees.
Marketing and distributionAs of December 31, 2004, Corporate & Retail Banking served its clients through214 banking branches, including 33 branches of Neue Aargauer Bank inSwitzerland. Corporate & Retail Banking markets its products to clients under theCredit Suisse brand, primarily through its branch network and direct channels,including the Internet and telephone banking.
Advisors for small and medium-sized corporate clients are based in 43 of theCorporate & Retail Banking branches. Large domestic corporate clients are servedthrough two regional offices in Zurich and Lausanne, Switzerland.
Operating environment and competitionOperating environmentThe Swiss corporate and retail banking industry is, to a significant extent, dependenton the overall economic development in Switzerland. For the retail and corporatebanking market, growth in line with the development of the economy is expected.Generally, Swiss retail banking clients have comparatively high incomes and savingsrates, resulting in a high demand for personal investment management. In recentyears, the Swiss private mortgage business has developed positively, and this trendis expected to continue. The home ownership rate in Switzerland is still low atapproximately 36%, thus offering further potential for mortgage business growth butdeclining margins may limit further revenue potential.
CompetitionIn the Swiss corporate and retail banking business, competition has increasedconsiderably over the past few years, especially in the field of private mortgages,which is characterized by an aggressive pricing policy by existing competitors andmarket entry of new competitors. The need to invest heavily in quality advisorycapabilities, product innovation and open architecture underlines this development.The largest competitor in the Swiss Corporate and Retail Banking segment remainsUBS. Other competitors include the Cantonal banks, many of which have stateguarantees, as well as regional savings and loan institutions, the Raiffeisen andother cooperative banks.

Information on the company Credit Suisse First Boston 21
Credit Suisse First Boston
OVERVIEW
Credit Suisse First Boston operates through two segments, Institutional Securitiesand Wealth & Asset Management. Effective January 1, 2004, Credit Suisse FirstBoston reorganized its operations by transferring the private equity and private fundsgroup activities previously in the Institutional Securities segment to the CSFBFinancial Services segment, which was renamed Wealth & Asset Management.Credit Suisse First Boston also reorganized the businesses within the InstitutionalSecurities segment along the lines of its investment banking and trading businessesand realigned the businesses within the Wealth & Asset Management segment tobring together its alternative investment activities, including the private equity andprivate funds groups.
The Credit Suisse First Boston business unit serves global institutional, corporate,government and high-net-worth clients as a financial intermediary, providing a broadrange of products and services including:
– Securities underwriting, sales and trading;– Financial advisory services;– Private equity investments;– Full service brokerage;– Derivatives and risk management products; – Asset management; and– Research.
The Institutional Securities segment provides financial advisory and capital raisingservices and sales and trading for global users and suppliers of capital. TheInstitutional Securities segment includes:
– Trading, which includes sales and trading in equity and debt securities andderivatives, and other related activities; and
– Investment Banking, which raises and invests capital, provides financial and otheradvisory services, manages and underwrites securities offerings and arrangesprivate placements.
The Wealth & Asset Management segment provides international assetmanagement services to institutional, mutual fund and private investors, makesprivate equity investments and manages private equity funds, and provides financialadvisory services to high-net-worth individuals and corporate investors. Wealth &Asset Management includes:
– The institutional asset management business, which operates under the brandCredit Suisse Asset Management and offers a wide array of products, includingfixed income, equity, balanced, money-market and indexed products;
– Alternative Capital, which invests in, manages and provides capital raising andother services to hedge funds, private equity funds and other alternativeinvestment vehicles; and
– Private Client Services, a financial advisory business which serves high-net-worthindividuals and corporate investors with a wide range of proprietary and third-party investment management products and services.

Information on the company Credit Suisse First Boston22
STRATEGY
Credit Suisse First Boston seeks to build on its improved financial results whilemaintaining a high priority on controls, risk management and the firm’s reputation.Credit Suisse First Boston’s strategy is geared towards winning where it chooses tocompete by delivering a more focused franchise. Credit Suisse First Boston expectsto achieve this by identifying and allocating resources to its most valuable clients andpursuing excellence in selected high-margin and strategically important services suchas leveraged finance, mergers and acquisitions, initial public offerings, derivativesand mortgage securitization, which are areas in which it has competitive strengthsand attractive growth opportunities. Credit Suisse First Boston believes increasedearnings and a stronger capital base will allow it to capture trading opportunitiesthrough extended, disciplined and diversified risk-taking. Institutional Securities andWealth & Asset Management will also make a number of structural changes withintheir various businesses to promote greater bottom-line accountability, improve costdiscipline and capitalize on the integration with the Group’s other bankingbusinesses. Credit Suisse First Boston intends to build a strong, performance-basedownership culture with a structured approach to attracting, developing and retainingtalent.
Consistent with this strategy, Institutional Securities will provide differentiated, full-service coverage to a smaller number of clients who value more service, establishmore unified offerings across certain fixed income and equity products and build onexisting leadership positions in selected areas. Key initiatives include the formationof a unified global proprietary trading group under a single management structureacross equity and fixed income and the creation of a consolidated derivativesstructuring group. Institutional Securities intends to grow its leading leveragedfinance business and commercial mortgage franchises by expanding into Europe.Institutional Securities also plans to build a commodities unit, continue to grow itsmortgage securitization business and add senior cross-product resources to topclients. In Investment Banking, Institutional Securities will adjust its coverage modelto better meet client needs, pursue a disciplined, client-centric approach to itsproduct offering and improve execution and client management. Specific coverageinitiatives include flexible client coverage with product coverage where appropriate,vertical integration of financial institutions coverage and increased share in atargeted subset of large-capitalization clients. In the Investment Banking area,Institutional Securities will focus on its high-margin, strategic products and create anintegrated capital markets group to deliver solutions to clients more effectively.
In Wealth & Asset Management, Credit Suisse First Boston will build on its leadingalternative capital franchise and leverage existing strengths to promote growth inCredit Suisse Asset Management and Private Client Services. In Alternative Capital,Credit Suisse First Boston expects to build on a broad diversity of funds, focusincreasingly on international markets, such as Asia, that display strong seculargrowth, spin out funds that could benefit from an independent platform and establisha new services platform for limited partners. Credit Suisse Asset Management willseek to grow European distribution, expand global product offerings, restoreprofitability to its U.S. franchise and streamline its Asian presence. Key initiatives inPrivate Client Services include leveraging a strong global brand and investmentbanking franchise, and building upon a leading position in volatility management.

Information on the company Credit Suisse First Boston 23
In Europe, Credit Suisse First Boston intends to strengthen its position by expandingsuccessful products such as leveraged finance and commercial mortgage-backedsecurities. In Asia, Institutional Securities and Wealth & Asset Management will buildon an already strong platform to capture business in a growth market. Initiatives inAsia will include the exploration of acquisition and joint venture opportunities,expanded derivatives capabilities throughout the region and strengthened positions inselected markets.
Credit Suisse First Boston is committed to complying fully with laws and regulationsand vigorously reviews ways to ensure continued professionalism and integrity in theconduct of its businesses. Furthermore, Credit Suisse First Boston remainscommitted to adhering to the highest professional standards and providing top-quality execution and investment performance, while developing and retainingoutstanding employees.
INSTITUTIONAL SECURITIES
OverviewInstitutional Securities provides financial advisory and capital raising services, andsales and trading for users and suppliers of capital around the world. The operationsof Institutional Securities include debt and equity underwriting and financial advisoryservices, and the equity and fixed income trading businesses.
For the year ended December 31, 2004, according to Thomson Financial,Institutional Securities ranked:
– Eleventh in global mergers and acquisitions advisory services in US dollar volumeof announced transactions;
– Sixth in global mergers and acquisitions advisory services in number ofannounced transactions;
– Fifth in US dollar value of global debt underwriting;– Second in US dollar value of global high-yield debt underwriting;– Eighth in US dollar value of global equity and equity-linked underwriting;– Third in US dollar value of global asset-backed financing; and– First in Swiss franc-denominated international debt issuances.
Products and servicesInstitutional Securities’ clients demand high-quality products and services for theirfunding, investing, risk management and financial advisory needs. In response tothese needs, Institutional Securities has developed a global product-based structuredelivered through regional teams.
The principal products and activities of Institutional Securities are:

Information on the company Credit Suisse First Boston24
Trading– Credit products, including investment-grade debt securities and credit derivatives;– Equity securities and equity derivatives, including convertible bonds;– Foreign exchange services including currency derivatives;– Interest rate products, including global government securities and interest rate
derivatives;– Leveraged finance, including high-yield and distressed debt;– Margin lending;– Market making in securities and options;– Matched book activities, in which the firm acts as an intermediary between
borrowers and lenders of short-term funds, mainly through repurchase and resaleagreements, to earn a positive spread between interest rates and to fundinventory positions;
– Money market instruments;– Prime services, including dealer-to-dealer financing, covering proprietary and
client short positions through securities borrowing and lending arrangements,margin lending, prime brokerage to attract client borrowings of cash andsecurities, the facilitation of financing, clearance, settlement and custody ofsecurities transactions and the provision of flexible solutions for clients to enablethem to use more than one broker for the execution of trading strategies but oneprime broker for efficient margining and consolidated position reporting;
– Proprietary trading;– Real estate activities, such as financing real estate and real estate-related
products and originating loans secured by commercial and residential properties;– Risk arbitrage in the equity securities of companies involved in publicly
announced corporate transactions;– Securities lending;– Securities, futures and options clearing services; – Structured products, including structuring and trading of asset-backed securities,
such as collateralized debt obligations, and origination, structuring and trading ofcommercial and residential mortgage-backed securities and mortgages; and
– Trading of syndicated, defaulted, distressed and other loans.
Investment Banking– Mergers and acquisitions and other advisory services, including corporate sales
and restructuring, divestitures and take-over defense strategy; and– Capital raising services, including equity and debt underwriting.
OtherOther products and activities of Institutional Securities that are not part of Trading orInvestment Banking are lending and legacy investments, including legacy privateequity and real estate investments and the distressed asset portfolios. Lendingincludes senior bank debt in the form of syndicated loans and commitments toextend credit to investment grade and non-investment grade borrowers.
Global investment researchCredit Suisse First Boston provides in-depth research on companies and industries,macroeconomics and debt strategy globally. The core strengths of Credit Suisse FirstBoston research include focused company and business model analysis andcustomized client service. Equity analysts perform differentiated informationgathering and value-added information processing and provide high-quality

Information on the company Credit Suisse First Boston 25
investment recommendations. Credit Suisse First Boston’s equity research alsoincludes extensive data resources, analytical frameworks and methodologies thatleverage the firm’s global platform and enable its analysts to customize theirproducts for institutional customers. Credit Suisse First Boston’s fixed incomeresearch provides clients with credit portfolio strategies and analysis, forecasts ofswaps and generic spread movements and outstanding credit strategy research forboth high-grade and high-yield products. Credit Suisse First Boston analysts’ in-depth understanding of markets, companies, investment instruments and local,regional and global economies forms a strong foundation for the firm’s innovativeweb-based analytical tools and technology.
Operating environment and competitionOperating environmentThe operating environment for Institutional Securities is expected to remainchallenging in the near term, reflecting expected continued slow securities marketgrowth in developed countries, fee compression and commoditization acrossproducts, and the ongoing importance of balance sheet commitments for clients. Inaddition, the regulatory environment remains difficult, with significant new reportingrequirements and increasing complexity in managing potential conflicts of interestacross its evolving businesses. Credit Suisse First Boston is well-positioned tobenefit from a number of trends in the industry. The move towards electronicexecution plays to the firm’s strengths in technology and its advanced executionservices platform. Credit Suisse First Boston is also likely to continue to benefit fromleveraging its leadership position with financial sponsors and alternative investments,both of which are expected to gain greater importance in the market.
CompetitionCredit Suisse First Boston faces intense global competition across each of itsbusinesses. Institutional Securities competes with investment and commercial banks,broker-dealers and other firms offering financial services. New entrants into thefinancial services and execution markets, such as commercial banks and technologycompanies, have contributed to further market fragmentation, fee and spreadcompression and product commoditization. In addition, Credit Suisse First Bostonfaces continued competitive pressure to make loans or commit capital to clients.

Information on the company Credit Suisse First Boston26
WEALTH & ASSET MANAGEMENT
OverviewWealth & Asset Management provides international asset management services toinstitutional, mutual fund and private investors, makes private equity investments andmanages private equity funds, and provides financial advisory services to high-net-worth individuals and corporate investors.
Credit Suisse Asset Management is a leading global asset manager focusing oninstitutional, investment fund and private client investors, providing investmentproducts and portfolio advice in three regions: the Americas, Asia Pacific andEurope. With CHF 386.7 billion in assets under management at December 31,2004, Credit Suisse Asset Management has investment capabilities in all majorasset classes, including equities, fixed income and balanced products.
Alternative Capital invests in, manages and provides capital raising and otherservices to hedge funds, private equity funds and other alternative investments.
Private Client Services serves high-net-worth and corporate investors with significantfinancial resources and specialized investment needs. Private Client Services had246 investment advisors and managed or advised clients on approximately CHF 59.1billion in assets as of December 31, 2004.
Products and servicesThe following is a discussion of the key global products and services of Wealth &Asset Management and the businesses through which they are delivered.
Asset management and advisory servicesThe asset management business offers its clients discretionary asset managementservices through segregated or pooled accounts. The investment policies of portfoliomanagers are generally focused on providing maximum return within the investor’scriteria, while maintaining a controlled risk profile and adherence to high-qualitycompliance and investment practices. The advisory services of the assetmanagement business include advice on customized investment opportunities, newproduct and risk management strategies and global investment reporting. Globalinvestment reporting involves the use of a global custodian, acting as a centraldepositary for all of a client’s securities. Once custody has been centralized, clientsare offered a series of value-added services, including cash management, securitieslending, performance measurement and compliance monitoring. Clients may choosefrom a wide array of products, including:
– Fixed income and equity products in local and global markets;– Balanced products, comprising a mixed portfolio of fixed income and equity
investments according to pre-defined risk parameters set by the customer or theinvestment guidelines of the fund;
– Money market products in multiple currencies;– Quantitative indexed products;– Derivatives and commodities; and– Real estate portfolio management.

Information on the company Credit Suisse First Boston 27
FundsThe asset management business offers a wide range of open-end funds. Thesefunds are marketed under the main brand name Credit Suisse. The largest complexof funds, which is domiciled in Luxembourg and marketed mainly in Europe, includesa full range of equity, balanced, fixed income and money market funds. In addition tothese pan-European mutual funds, the asset management business offers domesticregistered funds in the United States, Switzerland, the United Kingdom, Germany,Italy, France, Poland, Japan and Australia.
The asset management business acts primarily as a wholesale distributor of mutualfunds, and the majority of the Credit Suisse brand funds are marketed through ourother businesses and third-party distributors, including third-party banks andinsurance companies and other financial intermediaries.
Alternative CapitalAlternative Capital invests in, manages and provides capital raising and otherservices to, hedge funds, private equity funds and other alternative investmentvehicles. Alternative Capital includes the private equity group, the private fundsgroup and the capital markets group.
The private equity group manages a wide array of private equity funds includingleveraged buyout funds, mezzanine funds, real estate funds, secondary funds andfunds of funds. The private equity group invests primarily in unlisted or illiquid equityor equity-related securities in privately negotiated transactions, making investmentsacross the entire capital structure, from venture capital equity to investments in thelargest leveraged buyouts. In addition to debt and equity investments in companies,the private equity group invests in real estate and third-party-managed private equityfunds. Investments are made directly or through a variety of investment vehicles.
The private funds group raises capital for hedge funds, private equity funds andreal estate funds.
The capital markets group has direct hedge funds and invests in hedge funds offunds and collateralized debt obligations.
The strategic objectives of Alternative Capital include creating and growing aportfolio of investment management businesses for alternative assets (includingprivate equity, real estate and hedge funds) that generate attractive returns oncapital and provide a full array of product offerings to alternative asset investors.Alternative Capital intends to launch new businesses and expand its capabilitiesglobally. Alternative Capital also intends to spin out certain funds (including theCredit Opportunities Fund, the Diversified Credit Strategies Fund and the Sproutfunds) that could benefit from an independent platform. Alternative Capital has alsodetermined that certain investment professionals from the private equity business willestablish independent private equity firms to provide certain consulting services tothe Merchant Banking Partners funds, which Alternative Capital will continue tomanage as general partner of the funds. Following these transactions, AlternativeCapital intends to maintain significant investment commitments and financialinterests in, and strategic relationships with, each of these funds.

Information on the company Credit Suisse First Boston28
Private Client ServicesThe Private Client Services business offers a range of services, including brokerage,hedging and sales of restricted securities. Private Client Services also offers itsclients a wide range of investment management products, including third-party-managed accounts and alternative investments.
Operating environment and competitionOperating environmentThe operating environment for asset management improved somewhat during thelast year as equity indices generally posted gains and interest rates remained low,particularly in the United States. The demographic profile of most developedcountries suggests medium-term growth opportunities as aging populations seek toinvest for retirement. Nevertheless, the continuing development of markets makes itincreasingly difficult for active asset managers to outperform, and the regulatoryenvironment for mutual funds remains uncertain. Structured and alternativeinvestments are expected to continue to gain in importance.
CompetitionIn asset management, Credit Suisse First Boston faces competition primarily fromretail and institutional fund managers. Passive investment strategies are gainingshare at the expense of active managers as markets develop, and a larger share ofnew investment flows are being directed to a small number of fund managers.Competition for attractive alternative investments, including private equityinvestments, will likely remain intense and contribute to increasingly large privateequity investments.

Information on the company Winterthur 29
Winterthur
OVERVIEW
The Winterthur business unit consists of the Life & Pensions and Non-Lifesegments. The two segments offer insurance and pension solutions for private andcorporate clients.
As discussed in the Credit Suisse Group section above, as part of the corporatereorganization in July 2004, the banking and insurance businesses of the formerCredit Suisse Financial Services business unit were reorganized under the CreditSuisse and Winterthur business units, respectively.
– Life & Pensions offers life insurance products through multiple distributionchannels to private and corporate clients in Switzerland and other markets inEurope and Asia; and
– Non-Life offers non-life insurance products to private and small and medium-sized corporate clients in Switzerland, North America and certain markets inEurope.
Both segments are market leaders in Switzerland and hold solid market positions inBelgium, Spain and Germany.
In 2004, Winterthur completed the following reorganizations and disposals:
– First, Winterthur restructured its Life & Pensions and Non-Life organization inSwitzerland, bringing management responsibility for the unified organizationtogether. This reorganization is more in line with current customer requirementsand is intended to improve operating efficiency;
– Second, Winterthur put its Life & Pensions cross-border businesses in Bermudaand Luxembourg into run-off; and
– Finally, Winterthur divested various operations in the course of the year, includingPersonal Pension Management Limited (PPML), its Life & Pensions subsidiary ofWinterthur Life UK, which manages pension services; Rhodia Assurances S.A,the French Non-Life subsidiary; L’Unique Compagnie d’Assurances Générales,one of its two Canadian operations, based in Quebec; and the Dutch branch ofLes Assurés Réunis (LAR), Belgium. These divestitures reflect its strategy ofstreamlining its international business portfolio, thereby focusing more strongly onits principal markets, and taking advantage of opportunities for growth andprofitability.

Information on the company Winterthur30
STRATEGY
Winterthur’s life and non-life operations expect to maintain their focus on selectedcore markets that are believed to offer the best opportunities to achieve scale andprofitability. In addition, Winterthur aims to further develop its active approach toinvestment management, continue innovation in asset/liability matching and tocontinue improvements in claims and cost management efficiency.
LIFE & PENSIONS
Overview Winterthur’s Life & Pensions segment provides life insurance and pension solutionsfor private and corporate clients through multiple distribution channels.
The principal market units of the Life & Pensions segment are in Western Europe,where the focus is on Switzerland and Germany, and, to a lesser extent, the UnitedKingdom, Belgium, Spain and the Netherlands. In addition, it has operations inCentral and Eastern Europe and in selected Asian markets. All Life & Pensionsoperations are managed as part of the combined Life & Pensions and Non-Lifemarket units in the individual countries. The merger of the Life & Pensions and Non-Life operations in Switzerland took place in 2004. In terms of 2003 total businessvolume, Life & Pensions ranked as the eleventh largest life insurer in Europe.
Within its home market of Switzerland, Life & Pensions was the leading provider oflife insurance, based on 2003 total business volume. The majority of total businessvolume of the Swiss market unit is derived from traditional group life business.
The Life & Pensions operations in Germany principally sell traditional insuranceproducts to individual clients. In the United Kingdom, Life & Pensions offers a widerange of unit-linked products and is one of the leading providers of tailor-madepersonal pension schemes, predominantly for affluent private clients.
The majority of total business volume in Belgium relates to the traditional individuallife business, while the market unit continues to develop its unit-linked business. InSpain, traditional individual business is also the primary line of business, as is thecase in the Netherlands. In its Central and Eastern European markets, where it isthe leader in the Czech Republic’s pension market and where there have beensignificant developments in terms of pension reform over the past several years,Winterthur administers pension funds and seeks to offer supplementary personalpension schemes as well as unit-linked life insurance policies. Winterthur also hasoperations in Japan, Hong Kong, Taiwan and Indonesia.

Information on the company Winterthur 31
Products and servicesLife & Pensions’ products consist of traditional and non-traditional life insurance,both of which are offered on an individual and group basis. The majority of Life &Pensions’ products are participating products, which provide guaranteed benefits anddividends based on legal or contractual obligations, or at management’s discretion.Life & Pensions also provides disability insurance, as well as a number of additionalproducts, to group pension funds, on a defined benefit or defined contribution basis.Winterthur is continuing to develop innovative solutions for its key markets and totake measures to increase sales of non-traditional products, which are primarily unit-linked.
Traditional products Traditional products consist of endowments and annuities for which the investmentrisk is borne by the insurer and not by the policyholder. The insurer also bearsmortality risk for the life of the product. These products include pure protection, orterm insurance, designed to provide a lump sum at the end of a fixed term anddeath coverage during the term. Endowments and annuities can be regular or singlepremium products. For traditional with-profit products, the insurer investspolicyholder premiums in a range of assets, including equities, real estate and fixedincome securities. With-profit policyholders receive a share of the profits, resultingfrom the insurance company’s business. In 2004, Life & Pensions’ gross premiumswritten from traditional products represented approximately 71% of its total businessvolume.
Non-traditional productsNon-traditional products are medium-term to long-term savings products with lifeinsurance coverage for which the investment risk is borne in whole or in part by thepolicyholder, depending upon whether there is a guaranteed minimum payment.These products include variable annuities and guaranteed investment contracts.Non-traditional products may be regular or single premium and either with-profit orunit-linked.
With-profit policyholders receive a share of the profits resulting from the insurancecompany’s investments. Unit-linked policyholders are entitled to a return based uponthe performance of segregated accounts. In 2004, Life & Pensions’ gross premiumsand policyholder deposits from non-traditional products represented approximately29% of its total business volume.
Disability insuranceThe most significant disability products that Life & Pensions offers are waiver ofpremium and disability pensions, on a stand-alone basis or as policy riders. In theapplication, the policyholder typically may choose the period following disability afterwhich the payments begin.

Information on the company Winterthur32
Group pensions Winterthur offers a variety of group pension solutions, either with-profit or unit-linked, on a defined benefit or defined contribution basis for small, medium-sizedand large companies. These products include asset accumulation or investmentvehicles, protection for death and disability and income or annuity components.Swiss group pension plans, which are part of the “second pillar” of the Swissretirement savings system, are subject to a minimum return which is set by theSwiss government on the basis of the Swiss federal law on occupational benefitplans (second pillar). This rate was initially reduced from 4% to 3.25% as of January1, 2003, to 2.25% as of January 1, 2004, and increased to 2.50% effectiveJanuary 1, 2005. As of December 31, 2004, the share of business subject to theminimum rate of return represented 11% of Life & Pensions’ technical reserves.
Effective January 1, 2004, Life & Pensions introduced its new employee benefitbusiness model for Swiss group pension plans, as announced in the first half of2003. This new model is more closely aligned with the current economicenvironment and developments in terms of life expectancy. The key elements of thismodel comprise a separation of the insurance and pensions relationship, bringingabout partial independence and strengthening of the collective foundations, whichadminister the pension schemes, and a distinction between mandatory and non-mandatory occupational benefits.
On March 24, 2004, the Swiss government passed legislation that provides for amandatory participation in profits to policyholders in respect of the regulatedemployee benefit business in Switzerland. In addition to the ongoing allocation topolicyholders in respect of this business, initial provisions reflecting this change inlegislation were recorded in the first quarter of 2004 and amounted to CHF 117million, with an after-tax impact of CHF 91 million.
Marketing and distribution Sharing many of the same distribution channels with the Non-Life segment, Life &Pensions products are distributed principally through tied or exclusive agents,brokers and banks. In 2004, approximately 60% of Life & Pensions’ total businessvolume production was derived from tied agents, including agents of the Non-Lifesegment, approximately 27% was derived from brokers and approximately 7% wasderived from banks, including Credit Suisse. Other channels accounted for theremaining 6%.
Group life products are sold principally through tied agents for small and medium-sized companies, and through brokers and an organization of employee benefitconsultants with insurance and banking skills, for multinational corporate customers.
Following the restructuring of the sales organization in Switzerland in 2003,Winterthur restructured its Life & Pensions and Non-Life organization in Switzerlandin 2004, bringing management responsibility for the unified organization together.This reorganization is more in line with current customer requirements and isintended to improve operating efficiency.

Information on the company Winterthur 33
Operating environment and competitionOperating environmentWinterthur’s operating environment remains challenging. An uncertain investmentclimate, combined with declining financial returns from lower yielding reinvestments,affect both Winterthur’s operating results and customer demand for life and pensionsproducts, particularly those with a strong savings component. However, the impactof an aging population and the increasing inability of governments to financepensions and retirement benefits are increasingly likely to provide opportunities forprivate pension providers in many of the countries where Winterthur operates. As theprivate sector increases its role in the pension and retirement benefits field,customers and regulators are demanding greater transparency regarding the design,pricing and costs of products as well as more protection for individual customers.These trends may impose extra reporting, training and distribution costs.
Following significant losses in the insurance industry in recent years, there is strongpressure from regulators, customers, rating agencies and shareholders forcompanies to have adequate capitalization, while still improving returns on equity.Regulators are increasing their efforts to develop more detailed and responsivecapital models, which are likely to result in increased capital requirements and alsodifferent approaches to setting the appropriate level of capital required to operatebusinesses.
CompetitionAs a result of the pressures outlined above, competition remains intense in theinsurance industry. Insurers with advanced asset/liability, investment and capitalmanagement techniques and functions, good underwriting and claims managementsystems and processes and strong levels of capital, are likely to be those that cancompete most successfully in the current environment. The biggest competitor inSwitzerland is Swiss Life. In foreign markets, competitors include subsidiaries ofglobal insurance companies such as AXA, Generali and Allianz, in addition to somedomestic insurers.

Information on the company Winterthur34
NON-LIFE
Overview The Non-Life segment (previously known as the “Insurance” segment) provides non-life and health insurance to private, and small and medium-sized corporate clientsthrough a range of distribution channels.
The principal market units of Non-Life are Switzerland, Germany, Spain andBelgium. In addition, it has large operations in North America. All Non-Lifeoperations are managed as part of the combined Life & Pensions and Non-Lifemarket units in the individual countries. The merger of the Life & Pensions and Non-Life operations in Switzerland took place in 2004. Non-Life is increasingly focusingits resources on markets where it has a strong position or opportunities for growth,while withdrawing from those markets where it cannot achieve sufficient scale andprofitability. In terms of 2003 gross premiums written, Winterthur ranked as thetenth largest non-life insurer in Europe (after the sale of Churchill Insurance Groupand its Italian operations).
Within its home market of Switzerland, based on 2003 gross premiums written,Winterthur was the leading Swiss all-line carrier of non-life insurance with anextensive service network. The main lines of business in this market are motor andaccident and health.
In Germany, the non-life operations have a particular focus on health and generalliability insurance. Based on 2003 gross premiums written, Winterthur was the fifthlargest insurer in Belgium and the sixth largest in Spain. The majority of thesemarket units’ business is motor insurance. Winterthur operates its North Americannon-life business through three regional insurance companies in the United Statesand one insurance company in Canada.
Products and servicesWinterthur offers motor insurance, non-motor insurance (including fire and propertyand general liability insurance), and accident and health insurance for individual andsmall and medium-sized corporate customers in its Non-Life segment. It focuses onpersonal and commercial lines of insurance designed to provide a high level ofcustomer service. For small and medium-sized corporate clients, it offers packagedproducts combining different lines of insurance.
Motor insurance Motor insurance is the largest single product line of the Non-Life segment andcontributed approximately 35% to total gross premiums written in 2004. InSwitzerland and most other European countries, every motor vehicle owner isrequired to maintain third-party liability coverage.

Information on the company Winterthur 35
Non-motor insurance (excluding accident and health) Winterthur’s fire, property and general liability products include building insurancecovering damage from fire, flood and weather-related incidents, and insurancecovering liability claims against individuals and businesses. It sells property insuranceto individual customers, commercial property insurance and business interruptioninsurance. Winterthur’s general liability business provides a wide range of personaland commercial liability insurance products, covering the liability of private personsand small and medium-sized businesses arising from their activities and premises.Commercial product lines include insurance for operations, products, professionalactivities and environmental liability. In 2004, non-motor business (excluding accidentand health) contributed approximately 32% to total gross premiums written.
Accident and health insuranceWinterthur offers individual health insurance covering medical expenses, per diemhospital expenses and lost pay in the event of illness. It also provides individualaccident insurance covering these expenses, as well as death and disability claims.In addition to personal product lines, Winterthur sells commercial group accidentinsurance, covering medical and per diem hospital expenses, as well as providingannuities in the event of death or disability caused by accidents at work or at home.It also offers collective accident insurance, as well as collective health insurancecovering per diem hospital expenses for illness or the birth of a child. In 2004, theaccident and health business contributed approximately 33% to total gross premiumswritten.
Marketing and distribution Winterthur’s non-life products are distributed through a range of different distributionchannels, including tied agents, brokers, banks and direct channels and, to a lesserextent, call centers and the internet. In 2004, approximately 46% of Non-Life’s totalgross premiums written were derived from tied agents and approximately 50% werederived from brokers. The remaining 4% was generated through call centers, banksand other distribution channels, including the internet.
Following the restructuring of the sales organization in Switzerland in 2003,Winterthur restructured its Life & Pensions and Non-Life organization in Switzerlandin 2004, bringing management responsibility for the unified organization together.This reorganization is more in line with current customer requirements and isintended to improve operating efficiency.
Operating environment and competitionOperating environmentThe non-life insurance market has been characterized by strong tariff increases inrecent years to compensate for poor underwriting results and weak investmentperformance, but these increases are likely to slow down or reverse as the businesscycle changes and competitors seek increased market share through price cuts.

Information on the company Winterthur36
Following significant losses in the insurance industry in recent years, there is strongpressure from regulators, customers, rating agencies and shareholders forcompanies to have adequate capitalization, while still improving returns on equity.Regulators are increasing their efforts to develop more detailed and responsivecapital models, which are likely to result in increased capital requirements and alsodifferent approaches to setting the appropriate level of capital required to operatebusinesses.
CompetitionAs a result of the pressures outlined above, competition remains intense in theinsurance industry. Insurers with advanced asset/liability, investment and capitalmanagement techniques and functions, good underwriting and claims managementsystems and processes and strong levels of capital, are likely to be those that cancompete most successfully in the current environment. The biggest competitor inSwitzerland is Zurich Financial Services. In foreign markets, competitors includesubsidiaries of global insurance companies such as AXA, Generali and Allianz, inaddition to some domestic insurers.

OPERATING AND FINANCIAL REVIEW
Net income contributions
by segment in 2004
Non-Life3 %
Life & Pensions9 %
Wealth & Asset Management9 %
Institutional Securities22 %
Corporate & Retail Banking15 %
Private Banking42 %

Operating and financial review Overview38
OPERATING AND FINANCIAL REVIEW
Overview
FACTORS AFFECTING RESULTS OF OPERATIONS
Throughout 2004 the impact of a mixed market environment, weakening US dollar,higher commodity prices and geopolitical issues affected all businesses. Thisimpacted client activity, which briefly increased during the first quarter but decreasedagain for the remainder of the year, impacting fees and commissions in the bankingsegments.
The credit environment continued to be favorable throughout 2004, with an increaseglobally in the number of companies upgraded by rating agencies together with adecline in the number of downgrades. The number of global defaults also decreasednoticeably as economic fundamentals continued to improve. This had a positiveimpact on the Group’s provisions for credit losses in 2004 compared to 2003.
In the global capital markets, global bond underwriting grew by 4.3% while globalIPO volumes more than doubled. The volume of global equity and equity-relatedissuances increased compared to 2003; however, global convertible offerings andUS mortgage-backed underwriting both recorded declines compared to 2003. TheUS also saw an increase in merger activity of over 46%, with a resulting positiveimpact on underwriting activity and lending. due to a demand for additional financingto finance bids. Growth was particularly strong in US syndicated loan activity and USleveraged loan activity, which grew 36% and 15%, respectively, compared to 2003.
The trading environment proved to be difficult throughout the year due to risinginterest rates and geopolitical uncertainties.
The business environment in the insurance industry was characterized by continuingpressure as a result of declining financial returns from lower yielding reinvestment,slowing growth in many markets, the need to maintain adequate levels of capital andclient demand for greater transparency in respect of products and pricing. Inaddition, new legislation was passed by the Swiss government relating to theregulated employee benefit business in Switzerland.
On January 1, 2004, Credit Suisse Group changed the basis of accounting for itsfinancial statements from Swiss GAAP to US GAAP and prior year financialstatements were restated to US GAAP. The basis under which the business ismanaged and for which management evaluates segment results was also changed toUS GAAP. Accordingly, all financial information presented herein is based on resultsof operations and financial condition determined in accordance with US GAAP, withprior year information restated to conform to the current year basis.

Operating and financial review Overview 39
CREDIT SUISSE GROUP STRUCTURE
Credit Suisse Group is a global financial services company engaging in privatebanking, corporate and retail banking, investment banking, asset management andinsurance.
As discussed in the section Information on the company, on July 13, 2004, CreditSuisse Group restructured the organization into three business units, which resultedin no change to the existing segments. The business units and related reportingsegments were: Private Banking and Corporate & Retail Banking under the businessunit Credit Suisse; Institutional Securities and Wealth & Asset Management underthe business unit Credit Suisse First Boston; and Life & Pensions and Non-Lifeunder the business unit Winterthur. In addition, the Corporate Center includesexpenses for activities sponsored by the Group as well as consolidation adjustments.
On December 7, 2004, Credit Suisse Group held an Investor Day at which itannounced its plans to create a fully integrated bank by the end of 2006, combiningthe current business units Credit Suisse and Credit Suisse First Boston to betteraddress client needs in a rapidly changing market environment, as well as makingmore efficient use of its resources. Activities geared towards the needs of privateclients and those targeting corporate and investment banking clients will be bundledin two distinct lines of business, Private Client Services and Corporate & InvestmentBanking. A third business line will comprise Credit Suisse Group’s assetmanagement services, reflecting the Group’s core strength and one of the keyelements in its generation of value for clients across all its businesses. The objectiveof the new integrated bank is to operate more efficiently and provide enhancedadvisory services and products with a sharper focus on client needs, enablingincreased revenues and cost savings. The first step in the integration is the mergerof the two banks in Switzerland, which is scheduled for the second quarter of 2005,but remains subject to final internal and regulatory approvals.
CREDIT SUISSE GROUP MANAGEMENT
For a discussion of changes in the Group’s management during 2004, refer toCorporate Governance.

Operating and financial review Summary of Group results40
Summary of Group results
In 2004, a mixed market environment, a weakening US dollar, higher commodityprices and geopolitical issues affected all businesses. Although the markets regainedsome momentum towards the end of the fourth quarter, volatility remained lowrelative to historical norms. However, the businesses responded well to the changingenvironment and the Group reported higher net income for the year 2004, withparticularly strong results in Private Banking, Corporate & Retail Banking and Life &Pensions, and improvements in Institutional Securities and Wealth & AssetManagement. Net revenues in 2004 increased to CHF 54,014 million, a 5%increase compared to 2003, while total operating expenses declined 6% to CHF24,623 million in 2004. The provision for credit losses declined 87% to CHF 78million in 2004. Net income increased to CHF 5,628 million from CHF 770 million in2003. A number of divestitures were made during the course of 2004, including thedisposal of a minority holding in Warburg Pincus and a number of disposals byWinterthur.
In 2002 and 2003, the Group focused on efficiency and on returning its corebusinesses to profitability, maintaining leading positions in key markets and buildingits client franchise. In 2003, a number of divestitures were made, most significantlyat Winterthur, with the sale of Republic Financial Services in the US, ChurchillInsurance Group in the UK and Winterthur’s operations in Italy. The sale of Pershing,Credit Suisse First Boston’s clearing and execution platform, was also completed. In2003, market and economic conditions generally improved from 2002, but remainedchallenging and very competitive. Net revenues in 2003 increased to CHF 51,353million, a 9% increase compared to 2002, with a decrease in commissions and fees,due to reduced investment banking activity and lower client activity, offset by anincrease in net gains from investment securities. Total operating expenses declined11% from 2002 to CHF 26,141 million for 2003 with a goodwill impairment chargeof CHF 1,510 million more than offset by decreases in compensation and benefits,as well as lower discretionary expenses and litigation provisions. The provision forcredit losses declined 79% in 2003 to CHF 600 million. Net income increased toCHF 770 million in 2003 from a net loss of CHF 4,448 million in 2002.

Operating and financial review Summary of segment results 41
Summary of segment results
The Credit Suisse business unit performed well in 2004, with results being driven bystrong increases in revenues in Private Banking, as well as solid revenues and lowprovisions for credit losses at Corporate & Retail Banking. In addition, bothsegments benefited from ongoing cost containment and process improvementsdesigned to ensure a clear focus on clients. In 2003, the business unit performedwell compared to 2002, benefiting from a better global market environment and theimplementation of efficiency measures. Key developments within each segment wereas follows:
– Private Banking reported net income of CHF 2,473 million in 2004, an increaseof 28%, or CHF 537 million, compared to 2003, due primarily to asset-drivenrevenues and efficiency improvements. In 2003, net income of CHF 1,936million was reported, an increase of CHF 755 million compared to 2002,primarily as a result of decreased operating expenses achieved through efficiencymeasures and decreased headcount. In addition, increased trading revenueswere reported, due mainly to an increase in the fair value of interest ratederivatives used for risk management purposes that do not qualify for hedgeaccounting.
– Corporate & Retail Banking reported net income of CHF 901 million, an increaseof 54%, or CHF 315 million, compared to 2003, which was primarily attributableto continued efficiency improvements and a low level of credit provisions. In2003, net income of CHF 586 million was reported, an increase of CHF 880million compared to a net loss of CHF 294 million in 2002, resulting primarilyfrom increased trading revenues, a decrease in other expenses due to theimplementation of efficiency measures and lower credit provisions.
In 2004, Credit Suisse First Boston continued to improve its financial performancewith a full-year result driven by revenue growth, particularly in debt underwriting, andequity and fixed income trading. In addition, it made continued investments in itsfranchise by maintaining industry-competitive compensation levels and by certainorganizational changes. In 2003, Credit Suisse First Boston enjoyed a successfulturnaround from a loss in 2002, while focusing on profitability and cost discipline,and also benefited from lower credit provisions as a result of a continuedimprovement in the credit markets. Key developments within Institutional Securitiesand Wealth & Asset Management were as follows:
– Institutional Securities reported net income of CHF 1,313 million in 2004, anincrease of 47%, or CHF 421 million, compared to 2003, reflecting higher fixedincome and equity trading results, gains on legacy investments, lower creditprovisions and lower income tax expense, offset in part by higher operatingexpenses. In 2003, net income of CHF 892 million was reported, a substantialimprovement over the net loss of CHF 1,032 million in 2002. This resultedprimarily from a significant decline in provisions for credit losses and also fromlower compensation-related expenses and other operating expenses, whichresulted from the implementation of its efficiency measures.

Operating and financial review Summary of segment results42
– Wealth & Asset Management reported net income of CHF 530 million in 2004,an increase of 127%, or CHF 297 million, compared to 2003, primarily due tosignificant private equity investment-related gains. In 2003, net income of CHF233 million was reported, a significant improvement over the net loss of CHF477 million for 2002. This improvement resulted principally from a loss on thesale of Pershing in 2002 and a gain from the sale of a holding in a Japaneseonline broker in 2003.
The Winterthur business unit recorded a solid performance in 2004. This was inspite of the business environment being characterized by slowing growth in manymarkets, the insurance industry’s focus on maintaining adequate levels of capital,client demand for greater transparency in respect of products and pricing, anddeclining financial returns resulting from lower yielding reinvestments. In 2003, thebusiness unit made a number of divestitures, which had a significant impact on totalbusiness volumes. However, investment income improved due to a significantdecrease in realized losses due to improved market conditions.
– Life & Pensions reported net income of CHF 522 million in 2004, compared to anet loss of CHF 2,035 million in 2003, primarily driven by cost containment,efficiency improvements and stable investment income. In 2003, the net lossincreased by CHF 107 million from a net loss of CHF 1,928 million recorded in2002, due largely to a goodwill impairment charge and the cumulative effect of achange in accounting for provisions for policyholder guarantees and annuities,despite an increase in investment income due to improved market conditions.
– Non-Life reported net income of CHF 206 million in 2004 compared to a netloss of CHF 374 million in 2003, driven primarily by continued cost containment,an improved underwriting result and higher investment income, partially offset bya charge relating to the increase in the provision for contingencies related to thesale of Winterthur International in 2001. In 2003, a net loss of CHF 374 millionwas reported compared to a net loss of CHF 1,099 million in 2002, reflectinghigher investment income, lower administration costs and improved underwritingresults. In addition, Non-Life recognized losses on disposals of operations andstrengthened certain provisions related to its current and former internationalbusiness portfolio in 2003.

Operating and financial review Credit Suisse Group 43
The following table presents the Group’s consolidated statements of income:
Year ended December 31, in CHF m 2004 2003 2002
Interest and dividend income 30,973 28,359 32,196
Interest expense (19,007) (16,637) (21,191)
Net interest income 11,966 11,722 11,005
Commissions and fees 13,577 12,917 15,316
Trading revenues 4,559 3,528 3,443
Realized gains/(losses) from investment securities, net 1,156 1,534 (4,205)
Insurance net premiums earned 20,874 21,708 22,195
Other revenues 1,882 (56) (509)
Total noninterest revenues 42,048 39,631 36,240
Net revenues 54,014 51,353 47,245
Policyholder benefits, claims and dividends 21,011 22,801 19,191
Provision for credit losses 78 600 2,822
Total benefits, claims and credit losses 21,089 23,401 22,013
Insurance underwriting, acquisition and administration expenses 4,190 4,504 4,871
Banking compensation and benefits 11,951 11,042 13,495
Other expenses 8,397 8,950 11,068
Goodwill impairment 0 1,510 0
Restructuring charges 85 135 32
Total operating expenses 24,623 26,141 29,466
Income/(loss) from continuing operations before taxes, minority interests,extraordinary items and cumulative effect of accounting changes 8,302 1,811 (4,234)
Income tax expense/(benefit) 1,441 (3) (114)
Dividends on preferred securities for consolidated entities 0 133 133
Minority interests, net of tax 1,127 (31) (193)
Income/(loss) from continuing operations before extraordinaryitems and cumulative effect of accounting changes 5,734 1,712 (4,060)
Income/(loss) from discontinued operations, net of tax (100) (383) (466)
Extraordinary items, net of tax 0 7 18
Cumulative effect of accounting changes, net of tax (6) (566) 60
Net income/(loss) 5,628 770 (4,448)
Credit Suisse Group
The presentation of the Group’s results reflects the business unit and segmentstructure in place at December 31, 2004, and should be read in conjunction with theconsolidated financial statements and the related notes, in particular note 5.

Operating and financial review Credit Suisse Group44
Year ended December 31, 2004 compared to year ended December 31, 2003
Net interest incomeThe Group reported net interest income of CHF 11,966 million in 2004, an increaseof CHF 244 million, or 2%, compared to 2003. Increased lending volumes resultedin higher net interest income in Private Banking, while a decrease in Corporate &Retail Banking was due to a greater volume of interest rate derivatives qualifying forhedge accounting during 2004. Net interest income in Institutional Securities alsodeclined, mainly due to increased interest expenses as a result of higher short-terminterest rates.
Noninterest revenuesThe Group reported total noninterest revenues of CHF 42,048 million in 2004, anincrease of CHF 2,417 million, or 6%, compared to 2003.
Commissions and fees increased CHF 660 million, or 5%, due mainly to an increasein Private Banking as a result of higher asset-based commissions on the increasedaverage asset base.
Trading revenues increased CHF 1,031 million, or 29%, to CHF 4,559 million,driven mainly by an increase in both fixed income and equity trading results in theInstitutional Securities segment. There was also a decline in net realizedgains/(losses) from investment securities in both insurance segments as a result ofhigher realized gains on available-for-sale securities in 2003.
Insurance net premiums earned decreased CHF 834 million, or 4%, to CHF 20,874million, due mainly to a decrease in gross premiums written in Life & Pensions ofCHF 1,196 million, or 10%. The primary driver behind this decline was a decline inthe Swiss group life business. This decrease was partially offset by an increase ingross premiums written in Non-Life, primarily reflecting tariff increases and thetransfer of the non-mandatory part of the Swiss health insurance business to aconsolidated entity.
The following table presents the Group’s basic and diluted earnings per share:
Year ended December 31, in CHF 2004 2003 2002
Basic earnings per share
Income/(loss) from continuing operations before extraordinary items and cumulative effect of accounting changes 4.90 1.45 (3.52)
Income/(loss) from discontinued operations, net of tax (0.09) (0.33) (0.40)
Extraordinary items, net of tax 0.00 0.01 0.02
Cumulative effect of accounting changes, net of tax (0.01) (0.49) 0.05
Net income/(loss) available for common shares 4.80 0.64 (3.85)
Diluted earnings per share
Income/(loss) from continuing operations before extraordinary items and cumulative effect of accounting changes 4.83 1.43 (3.52)
Income/(loss) from discontinued operations, net of tax (0.08) (0.33) (0.40)
Extraordinary items, net of tax 0.00 0.01 0.02
Cumulative effect of accounting changes, net of tax 0.00 (0.48) 0.05
Net income/(loss) available for common shares 4.75 0.63 (3.85)

Operating and financial review Credit Suisse Group 45
Other revenues of CHF 1,882 million were reported compared to a loss of CHF 56million in the previous year, mainly reflecting the impact of entities required to beconsolidated in accordance with FIN 46R, “Consolidation of Variable Interest Entities– An Interpretation of ARB No. 51”, in the Wealth & Asset Management segment.This increase however, had no impact on net income as offsetting minority interestswere recorded. In addition, other revenues in Life & Pensions increased, due mainlyto favorable deposit premium growth relating to new business in the UK and Asia.This was partially offset by a loss in the Corporate Center of CHF 157 million beforetax on the sale of a 19.9% stake in the private equity activities of Warburg Pincus.
Total benefits, claims and credit losses Provisions for credit losses continued to be positively impacted by the generallyfavorable credit environment throughout 2004. The Group reported a provision forcredit losses of CHF 78 million for the full-year 2004, representing a decrease ofCHF 522 million, or 87%, compared to 2003. This included a significant release inthe Institutional Securities segment, due mainly to a recovery related to the sale ofan impaired loan.
Policyholder benefits, claims and dividends decreased by 8%, or CHF 1,790 million,to CHF 21,011 million, due to a decrease in benefits and policyholder dividends inthe Life & Pensions segment. This decrease in benefits was primarily driven by lowerpremium income, which resulted in a lower charge in provisions for future benefits.The change in policyholder dividends was due to lower provisions for future dividendsto policyholders of CHF 501 million, driven largely by a change in German tax lawsin 2003.
Operating expensesThe Group reported total operating expenses of CHF 24,623 million for 2004, adecrease of CHF 1,518 million, or 6%, compared to 2003. The decrease is mainlydue to a 2003 goodwill impairment of CHF 1,510 million in the Life & Pensionssegment.
Insurance underwriting, acquisition and administration expenses of CHF 4,190million decreased by CHF 314 million, or 7%, due primarily to lower charges in2004 as a result of additional write-downs of deferred acquisition costs and presentvalue of future profits in Life & Pensions in 2003. In addition, administrationexpenses in both insurance segments decreased, reflecting further cost savings.
Banking compensation and benefits increased CHF 909 million, or 8%, reflectingincreased incentive-related compensation in the banking segments, which was in linewith improved results. Institutional Securities accounted for a substantial portion ofthis increase. Additionally, banking compensation and benefits were negativelyimpacted by combined severance costs of CHF 156 million in the InstitutionalSecurities and Wealth & Asset Management segments resulting from a change inbusiness structure within these segments.
Other expenses included a charge relating to the sale of Winterthur International ofCHF 321 million, as discussed below in Loss contingencies, whereas the 2003balance included provisioning for the former and current international portfolio.
In comparison with 2003, operating expenses in 2004 also declined due to chargesin 2003 related to a write-off of intangible assets in Wealth & Asset Management of

Operating and financial review Credit Suisse Group46
CHF 270 million, as well as an impairment of goodwill in the amount of CHF 1,510million in Life & Pensions, both of which did not reoccur in 2004.
Income tax expenseThe Group recorded income tax expense of CHF 1,441 million compared to anincome tax benefit of CHF 3 million in 2003, reflecting the Group’s improved resultsin 2004. Additionally, the increase was impacted by tax benefits recorded in 2003 inthe insurance segments as a result of a tax law change in Germany. In this respect,in 2003 Life & Pensions had recorded a tax benefit of CHF 658 million and Non-Life had recorded a tax benefit of CHF 124 million. Additionally, Life & Pensionsand Non-Life recorded benefits of CHF 72 million and CHF 59 million in 2004,respectively, due to the increase in the valuation of deferred tax assets (bydecreasing the related valuation allowance) in relation to tax loss carry-forwardscreated in prior years.
The 2004 tax expense was positively impacted by the release of tax contingencyaccruals totaling CHF 153 million in Institutional Securities, following the favorableresolution of matters with local tax authorities during the year.
The Group tax expense was further reduced by a tax benefit of CHF 268 millionrelating to non-taxable income arising on investments that are required to beconsolidated under accounting rules (FIN 46R).
The Group tax rate benefited from higher dividend income with a reduced tax rateand the release of tax contingency accruals following the favorable resolution ofopen matters in Private Banking.
Due largely to the items identified above, the Group’s effective tax rate in 2004 was17%, compared to the Swiss statutory rate of 25%, and is not predictive of theGroup’s future income tax rate.
Loss contingenciesIn accordance with the terms of the Sale and Purchase Agreement (SPA) betweenXL Insurance (Bermuda) Limited (XL or the purchaser) and Winterthur SwissInsurance (Winterthur) for Winterthur International, Winterthur is required toparticipate with the purchaser in a review for any adverse development of loss andunearned premium reserves during a three-year post-completion seasoning period,which expired on June 30, 2004. This seasoning process will result in a balancingpayment being due to the purchaser.
The provision recorded by Winterthur at December 31, 2004 for this sale-relatedcontingency, net of pre-payments to and risks retained by XL, amounted to CHF623 million (USD 550 million). The provision, which reflects the adversedevelopment of CHF 737 million (USD 651 million) included in Winterthur’ssubmitted Seasoned Net Reserve Amount (SNRA), is based on an extensive analysisof data recently provided by XL. Winterthur utilized leading third-party claims,actuarial and legal specialists to assist in estimating the reserves required for thisliability. On the basis of facts known, Credit Suisse Group believes that the currentlyrecorded provision is adequate to cover the contingencies related to this transaction.
The amount payable to XL for the SNRA is ultimately subject to an assessment bythe Independent Actuary designated in the SPA, who will determine which of the

Operating and financial review Credit Suisse Group 47
estimates submitted by the two parties is closest to the amount which theIndependent Actuary believes to be the correct amount, and that estimate will beconclusively deemed to be the relevant SNRA. This process is ongoing and,consequently, the ultimate resolution of this matter could result in a further significantincrease in the required provision for the Winterthur International sale-relatedcontingencies. Winterthur and XL submitted in February 2005 their respectivedeterminations of the SNRA to the Independent Actuary. The current differencebetween the two positions under review by the Independent Actuary is CHF 1,029million (USD 909 million).
In addition to the SPA, Winterthur has several other agreements, includingretrocession agreements with XL, which could result in payments to XL. Furthermore,XL submitted in the fourth quarter of 2004 the first details of its claims relating toalleged breach of warranties in connection with the 2001 sale. With the assistance ofoutside counsel, Winterthur has evaluated these claims and on the basis of factsknown, believes that the currently recorded provisions are adequate to cover thecontingencies related to this litigation and any other agreements with XL.
Year ended December 31, 2003 compared to year ended December 31, 2002
Net interest incomeThe Group reported net interest income of CHF 11,722 million in 2003, an increaseof CHF 717 million, or 7%, compared to 2002, with a decline in interest income ofCHF 3,837 million more than offset by the decline in interest expenses of CHF 4,554million.
Generally, interest rates continued to fall during 2003, which particularly impacted theaverage rates earned from Swiss domestic investments. In addition, average interestincome from central bank funds sold, securities purchased under resale agreementsand securities borrowing transactions declined significantly due to lower averagebalances in 2003.
The decline in interest rates had a positive impact on the average rate paid on Swissdomestic trading liabilities, which decreased from 6.2% in 2002 to 2.0% in 2003.The decrease in interest expense was further positively impacted by lower averagelong-term debt during 2003.
Noninterest revenuesThe Group reported total noninterest revenues of CHF 39,631 million, an increase ofCHF 3,391 million, or 9% compared to 2002.
Commissions and fees amounted to CHF 12,917 million, representing a decrease ofCHF 2,399 million, or 16%, which was due mainly to a decline in investment bankingrevenues and advisory fees in the Institutional Securities segment. This reflected adecrease in revenues due to low volumes in mergers and acquisitions activity, as wellas a decrease in new equity issuances. In addition, commissions and fees declined inPrivate Banking due to lower client activity.
Trading revenues of CHF 3,528 million represented a 2% increase from 2003, withdeclines in fixed income and equity trading results in the Institutional Securitiessegment more than offset by increases in Private Banking and Corporate & Retail

Operating and financial review Credit Suisse Group48
Banking, which were positively impacted by changes in the fair value of interest ratederivatives used for risk management purposes that do not qualify for hedgeaccounting.
Net realized gains from investment securities of CHF 1,534 million were reported in2003, compared to a loss of CHF 4,205 million in 2002. This increase was primarilydue to a significant decrease in realized losses in Life & Pensions as a result ofimprovements in the equity markets and reduced equity positions.
Insurance net premiums earned decreased CHF 487 million, or 2%, to CHF 21,708million due mainly to a decrease in Life & Pensions as a result of a higher volume ofsingle premiums in 2002 and lower client demand for individual life products as aresult of adapting the business to market conditions in 2003. This was partiallyoffset by an increase in Non-Life as a result of the continued implementation of tariffincreases across all major markets.
Total benefits, claims and credit lossesThe Group reported a decrease in provisions for credit losses of CHF 2,222 million,or 79%, in 2003 due to the improved credit environment and a release of provisionsin Institutional Securities relating to impaired and non-impaired loans, as well as thelegacy real estate portfolio.
Policyholder benefits, claims and dividends increased CHF 3,610 million, or 19%, toCHF 22,801 million in 2003 compared to 2002. In the Life & Pensions segment,dividends to policyholders increased by CHF 3,638 million from 2002 due to higherinvestment results, the impact of German tax law changes, as described below, anda refinement of the methodology for the calculation of the deferred bonus reserve.This increase was partially offset by a decrease in policyholder benefits due to adecrease in the provision for future policyholder benefits, in line with thedevelopment of net premiums earned and benefits paid.
Operating expensesThe Group recorded total operating expenses of CHF 26,141 million in 2003, adecrease of CHF 3,325 million, or 11%, largely as a result of a decrease in bankingcompensation and benefits, and other expenses in Institutional Securities.
Insurance underwriting, acquisition and administration expenses of CHF 4,504million were reported, a decrease of CHF 367 million, or 8%, compared to 2002.This was due largely to a decrease in administration expenses in the insurancesegments, which reflected mainly ongoing efficiency measures.
Banking compensation and benefits decreased by CHF 2,453 million, or 18%, toCHF 11,042 million due primarily to declines in both Institutional Securities andWealth & Asset Management. These declines were due mainly to reducedheadcount, the change in vesting for future awards, a decline in the amortization ofretention awards and lower severance-related costs.
Other expenses of CHF 8,950 million represented a decrease of CHF 2,118 million,or 19%, compared to 2002. This reflected lower litigation provisions and reduceddiscretionary expenses in Institutional Securities. In addition, other expenses inPrivate Banking and Corporate & Retail Banking decreased by CHF 165 million andCHF 337 million, respectively, reflecting the results of efficiency measures. The

Operating and financial review Credit Suisse Group 49
2003 charge also included provisioning for the former and current internationalportfolio.
A goodwill impairment of CHF 1,510 million was recorded in Life & Pensions in2003, as the Group had identified an excess in the carrying amount of goodwill overits implied fair value as a result of the changing environment.
Income tax benefitIn 2003, the Group recorded an income tax benefit of CHF 3 million compared to abenefit of CHF 114 million in 2002.
Life & Pensions and Non-Life recorded a combined tax benefit of CHF 1,224 millionin 2003. In December 2003, the German government abolished the tax exemptionfor realized gains on equities and dividend income for investments held by life andhealth insurance companies. Retroactive changes were also made to the taxation ofinvestment funds. This change resulted in a release of the deferred tax provision thatthe Group was holding in respect of realized and unrealized gains in investmentfunds. The change resulted in a tax benefit in Life & Pensions and Non-Life of CHF658 million and CHF 124 million, respectively, of which CHF 711 million wasallocated to the policyholders.
Due mainly to the above, the Group’s effective tax rate in 2003 was not predictiveof its future tax rates.
Discontinued operations and accounting changesIn line with the Group’s focus on returning to profitability in core businesses, anumber of divestitures were made during 2003.
In May 2003, the clearing and execution platform Pershing was sold, as a result ofwhich Wealth & Asset Management recorded a loss of CHF 576 million in 2002 andincome of CHF 18 million in 2003.
The main components of the discontinued operations reported by Life & Pensionsand Non-Life were the sale of the Churchill Insurance Group, Republic FinancialServices in the US, and Winterthur operations in Italy.
A cumulative effect of accounting changes, net of tax of CHF 566 million wasrecorded in 2003. This was related mainly to the early adoption of Statement ofPosition 03-1, “Accounting and Reporting by Insurance Enterprises for CertainNontraditional Long-Duration Contracts and for Separate Accounts” and the adoptionof FIN 46. For further information on accounting policies, see note 1 in the Notes tothe consolidated financial statements.

Operating and financial review Credit Suisse50
Credit SuisseThe Credit Suisse business unit is a leading provider of comprehensivefinancial services in Switzerland and a large number of other marketsworldwide. The business unit offers investment and lending products as wellas financial advisory services for private and corporate clients.
For the periods under discussion, the Credit Suisse business unit was comprised oftwo reporting segments: Private Banking and Corporate & Retail Banking. Forinformation relating to the services provided by Credit Suisse, refer to Information onthe Company – Credit Suisse.
On September 1, 2003, Credit Suisse First Boston transferred its securities andtreasury execution platform in Switzerland to Credit Suisse. It also transferred itsPrivate Client Services UK business from Wealth & Asset Management to PrivateBanking. The results for all periods presented have been restated to reflect thesetransfers.
The following table presents selected information of Credit Suisse:
Year ended December 31, in CHF m 2004 2003 2002
Net revenues 10,518 9,792 8,675
Total operating expenses 6,194 6,157 6,779
Net income 3,374 2,522 887
Cost/income ratio 58.9% 62.9% 78.1%
Return on average allocated capital 40.7% 31.7% 11.4%
Average allocated capital 8,335 8,001 7,908
The following table presents selected other data of Credit Suisse:
December 31 2004 2003 2002
Assets under management in CHF bn 593.0 564.9 516.3
Number of employees (full-time equivalents) 20,656 20,329 22,248

Operating and financial review Credit Suisse 51
The following table presents the results of the Private Banking segment:
Year ended December 31, in CHF m 2004 2003 2002
Net interest income 1,932 1,525 1,476
Commissions and fees 4,732 4,274 4,375
Trading revenues including realized gains/(losses) from investment securities, net 374 507 79
Other revenues 132 193 82
Total noninterest revenues 5,238 4,974 4,536
Net revenues 7,170 6,499 6,012
Provision for credit losses (6) 12 62
Compensation and benefits 2,095 2,051 2,215
Other expenses 2,050 1,942 2,107
Restructuring charges (2) 12 17
Total operating expenses 4,143 4,005 4,339
Income from continuing operations before taxes, minority interests,extraordinary items and cumulative effect of accounting changes 3,033 2,482 1,611
Income tax expense 541 532 397
Minority interests, net of tax 19 15 15
Income from continuing operations before extraordinary items and cumulative effect of accounting changes 2,473 1,935 1,199
Income/(loss) from discontinued operations, net of tax 0 1 (35)
Extraordinary items, net of tax 0 7 17
Cumulative effect of accounting changes, net of tax 0 (7) 0
Net income 2,473 1,936 1,181
PRIVATE BANKING
Year ended December 31, 2004 compared to year ended December 31, 2003Private Banking reported net income of CHF 2,473 million for 2004, up CHF 537million, or 28%, compared to 2003. Net revenues increased by CHF 671 million, or10%, to CHF 7,170 million for 2004. This increase in net revenues was drivenmainly by higher net interest income as a result of increased lending volumes andhigher dividend income. The year 2004 also benefited from the increased averageasset base, generating higher asset-based commissions. In addition, commissionsand fees increased as a result of higher transaction-related commissions such asbrokerage and product issuing fees.
Provision for credit losses declined by CHF 18 million to a net recovery of CHF 6million in 2004, reflecting a favorable credit environment.
Total operating expenses amounted to CHF 4,143 million in 2004, up CHF 138million, or 3%, compared to 2003. This increase in total operating expenses wasdriven mainly by higher commission expenses – related to increased commissionincome – and a rise in performance-related compensation reflecting the improvedresult. Higher expenses attributable to the targeted expansion of Private Banking’sdistribution capabilities, particularly in its international operations, were more thanoffset by ongoing cost containment and efficiency improvements. Private Bankingrecorded a cost/income ratio of 57.8% for 2004, down 3.8 percentage pointscompared to 2003.

Operating and financial review Credit Suisse52
The following table presents key information of the Private Banking segment:
Year ended December 31 2004 2003 2002
Cost/income ratio 57.8% 61.6% 72.2%
Gross margin 133.7 bp 133.3 bp 120.4 bp
of which asset-driven 81.9 bp 77.2 bp 79.7 bp
of which transaction-driven 45.0 bp 45.5 bp 34.5 bp
of which other 6.8 bp 10.6 bp 6.2 bp
Net margin 46.5 bp 40.0 bp 23.9 bp
Net new assets in CHF bn 26.4 17.9 19.1
Average allocated capital in CHF m 3,331 2,973 2,851
The following table outlines selected balance sheet and other data of the Private Banking segment:
December 31 2004 2003 2002
Assets under management in CHF bn 539.1 511.3 465.1
Total assets in CHF bn 188.7 174.9 176.4
Number of employees (full-time equivalents) 12,342 11,850 12,967
The Private Banking segment’s income tax rate in 2004 amounted to 18%compared to 21% in 2003, benefiting from higher dividend income with a reducedtax rate and the release of tax contingency accruals following the favorableresolution of open matters.
Private Banking reported net new assets of CHF 26.4 billion for 2004, representingan annual growth rate of 5.2%, exceeding the mid-term target of 5.0%. PrivateBanking continued to achieve healthy inflows from Asia and the European onshoremarket, recording double-digit growth rates. In 2004, the gross margin on averageassets under management amounted to 133.7 basis points, virtually unchanged fromthe high level in 2003. The gross margin in 2004 also reflected an increase in itsasset-driven component, due mainly to higher lending volumes and higher portfoliomanagement fees. Assets under management amounted to CHF 539.1 billion at theend of 2004, up CHF 27.8 billion, or 5.4%, from the end of 2003. Assets undermanagement in 2004 were positively impacted by the aforementioned net new assetinflows and stronger equity and bond markets, nearly offset by foreign exchangeimpacts – especially as a result of the weakening of the US dollar.
Year ended December 31, 2003 compared to year ended December 31, 2002 Private Banking reported net income of CHF 1,936 million for 2003, up CHF 755million, or 64%, compared to 2002. Net revenues amounted to CHF 6,499 million,up CHF 487 million, or 8%, compared to 2002. This increase in net revenues wasprimarily a result of increased trading revenues, which included changes in the fairvalue of interest rate derivatives used for risk management purposes that do notqualify for hedge accounting. Higher trading revenues were partially offset by lowercommissions and fees, mainly as a result of lower client activity.
As a result of a favorable credit environment, as well as improved risk management,provision for credit losses decreased by CHF 50 million, or 81%, to CHF 12 millionfor the year 2003.

Operating and financial review Credit Suisse 53
Total operating expenses amounted to CHF 4,005 million in 2003, down CHF 334million, or 8%, compared to 2002. Mainly as a result of a reduction in headcount,compensation and benefits decreased CHF 164 million, or 7%, to CHF 2,051million. Other expenses declined by CHF 165 million, or 8%, to CHF 1,942 millionfor the year 2003. The decrease in 2003 was driven primarily by efficiencymeasures and cost containment.
The growth in net new assets of 3.8% remained virtually unchanged in 2003compared to 2002. The gross margin on average assets under management of133.3 basis points improved by 12.9 basis points, due mainly to substantially highertrading income as well as improved interest income and other revenues. At the endof 2003, assets under management were CHF 511.3 billion, up CHF 46.2 billion, or9.9%, compared to year-end 2002. Assets under management benefited mainlyfrom stronger equity markets as well as from inflows of net new assets, whichtotaled CHF 17.9 billion in 2003.
CORPORATE & RETAIL BANKING
Year ended December 31, 2004 compared to year ended December 31, 2003Corporate & Retail Banking reported net income of CHF 901 million in 2004, anincrease of CHF 315 million, or 54%, compared to 2003.
The following table presents the results of the Corporate & Retail Banking segment:
Year ended December 31, in CHF m 2004 2003 2002
Net interest income 2,069 2,311 2,181
Commissions and fees 823 714 739
Trading revenues including realized gains/(losses) from investment securities, net 328 181 (430)
Other revenues 128 87 173
Total noninterest revenues 1,279 982 482
Net revenues 3,348 3,293 2,663
Provision for credit losses 122 391 628
Compensation and benefits 1,047 1,114 1,065
Other expenses 1,004 1,038 1,375
Total operating expenses 2,051 2,152 2,440
Income/(loss) from continuing operations before taxes, minority interests and cumulative effect of accounting changes 1,175 750 (405)
Income tax expense/(benefit) 272 158 (111)
Minority interests, net of tax 2 1 0
Income/(loss) from continuing operations before cumulative effect of accounting changes 901 591 (294)
Cumulative effect of accounting changes, net of tax 0 (5) 0
Net income/(loss) 901 586 (294)

Operating and financial review Credit Suisse54
Net revenues amounted to CHF 3,348 million, up CHF 55 million, or 2%, comparedto 2003. The increase in net revenues was driven mainly by higher commission andfee income, reflecting higher brokerage income, the sale of structured investmentproducts, as well as higher private mortgage volumes, which were up 9% comparedto 2003, representing growth that was significantly above the market rate. Theseeffects were partially offset by lower gains from changes in the fair value of interestrate derivatives used for risk management purposes that do not qualify for hedgeaccounting. The decrease in net interest income and the increase in tradingrevenues year-on-year are the result of an increased amount of interest ratederivatives that qualify for hedge accounting in 2004 compared to 2003.
Corporate & Retail Banking reported total operating expenses of CHF 2,051 million,down CHF 101 million, or 5%, compared to 2003. Higher performance-relatedcompensation in line with higher net income, and higher commission expensesrelated to higher commission income, were more than offset by cost containmentand further efficiency improvements.
For 2004, provision for credit losses amounted to CHF 122 million, down CHF 269million, or 69%, from 2003. The improvement mainly reflects a significant reductionof impaired loans by CHF 1.2 billion to a level of CHF 3.7 billion, a favorable creditenvironment and improved risk management requiring a low level of new provisions.
Corporate & Retail Banking reported a return on average allocated capital of 18.0%,up 6.3 percentage points from 2003. The segment’s second key performanceindicator – its cost/income ratio – improved from 65.4% in 2003 to 61.3% in 2004.
The following table presents key information of the Corporate & Retail Banking segment:
Year ended December 31 2004 2003 2002
Cost/income ratio 61.3% 65.4% 91.6%
Net new assets in CHF bn 1.4 0.7 (0.7)
Return on average allocated capital 18.0% 11.7% (5.8%)
Average allocated capital in CHF m 5,004 5,028 5,057
The following table outlines selected balance sheet and other data of the Corporate & Retail Banking segment:
December 31 2004 2003 2002
Assets under management in CHF bn 53.9 53.6 51.2
Total assets in CHF bn 99.5 98.5 97.1
Mortgages in CHF bn 63.0 59.8 56.6
Other loans in CHF bn 23.7 25.1 27.1
Number of branches 214 214 223
Number of employees (full-time equivalents) 8,314 8,479 9,281

Operating and financial review Credit Suisse 55
Year ended December 31, 2003 compared to year ended December 31, 2002 Corporate & Retail Banking reported net income of CHF 586 million in 2003, anincrease of CHF 880 million compared to 2002.
Net revenues amounted to CHF 3,293 million, up CHF 630 million, or 24%,compared to 2002. This increase in net revenues was mainly attributable to highertrading revenues as a result of gains in 2003 from changes in the fair value ofinterest rate derivatives used for risk management purposes that do not qualify forhedge accounting instead of losses reported on such derivatives in 2002.
Total operating expenses amounted to CHF 2,152 million in 2003, down CHF 288million, or 12%, compared to 2002. Compensation and benefits increased by CHF49 million, or 5%, whereas other expenses declined by CHF 337 million, or 25%, asa result of efficiency measures to CHF 1,038 million in 2003.
Provision for credit losses declined by CHF 237 million, or 38%, to CHF 391 millionin 2003, reflecting an improved credit environment as well as improved riskmanagement.
Corporate & Retail Banking reported a return on average allocated capital of 11.7%in 2003, up from –5.8% in 2002. The segment’s second key performance indicator– its cost/income ratio – improved from 91.6% in 2002 to 65.4% in 2003.

Operating and financial review Credit Suisse First Boston56
Credit Suisse First BostonThe Credit Suisse First Boston business unit serves global institutional,corporate, government and high-net-worth clients as a financial intermediarythrough two segments, Institutional Securities and Wealth & AssetManagement.
The Institutional Securities segment provides securities underwriting, financialadvisory, lending and capital raising services, and sales and trading for users andsuppliers of capital globally. The Wealth & Asset Management segment providesinternational asset management services to institutional, mutual fund and privateinvestors through its asset management business, which operates under the nameCredit Suisse Asset Management; it advises and invests in alternative investmentvehicles, including private equity funds, through the Alternative Capital business; andit provides financial advisory services to high-net-worth individuals and corporateinvestors through Private Client Services. For information relating to the servicesprovided by the Credit Suisse First Boston business unit, refer to Information on theCompany – Credit Suisse First Boston.
In 2004, Credit Suisse First Boston reorganized its operations by transferring theprivate equity and private funds group activities previously included in the InstitutionalSecurities segment to the CSFB Financial Services segment, which was renamedWealth & Asset Management. Credit Suisse First Boston also reorganized thebusinesses within the Institutional Securities segment along the lines of itsinvestment banking and trading businesses and realigned the businesses within the
The following table presents selected information of Credit Suisse First Boston:
Year ended December 31, in CHF m 2004 2003 2002
Net revenues 17,322 15,180 17,364
Total operating expenses 13,914 13,226 17,459
Net income 1,843 1,125 (1,509)
Cost/income ratio 80.3% 87.1% 100.5%
Compensation/revenue ratio 49.8% 50.8% 57.7%
Pre-tax margin 19.9% 11.8% (12.2%)
Return on average allocated capital 16.1% 9.6% (10.6%)
Average allocated capital 11,419 11,776 14,253
Other data excluding minority interests
Net revenues 1) 16,234 15,180 17,364
Cost/income ratio 1) 2) 85.6% 87.1% 100.5%
Compensation/revenue ratio 1) 53.1% 50.8% 57.7%
Pre-tax margin 1) 2) 14.6% 11.8% (12.2%)
1) Excluding CHF 1,088 million in 2004 in minority interest revenues relating to the FIN 46R consolidation of certain private equity funds. 2) Excluding CHF 16 million in 2004in expenses associated in minority interests relating to the FIN 46R consolidation of certain private equity funds.
The following table presents selected other data of Credit Suisse First Boston:
December 31 2004 2003 2002
Assets under management in CHF bn 488.1 477.0 481.5
Number of employees (full-time equivalents) 19,479 18,341 22,801

Operating and financial review Credit Suisse First Boston 57
Wealth & Asset Management segment to bring together its alternative investmentactivities, including the private equity and private funds groups.
On September 1, 2003, Credit Suisse First Boston transferred its securities andtreasury execution platform in Switzerland to Credit Suisse. It also transferred itsPrivate Client Services UK business from Wealth & Asset Management to PrivateBanking.
The results for all periods presented have been restated to reflect these transfers.
Effective January 1, 2004, Credit Suisse Group’s net revenues and operatingexpenses include the consolidation of certain private equity funds within CreditSuisse First Boston under Financial Accounting Standards Board Interpretation No.46 Revised (FIN 46R). This consolidation did not impact net income as the increaseto net revenues and expenses was offset by an equivalent increase in minorityinterests. Net revenues, operating expenses and certain ratios have also beenpresented excluding these minority interest-related revenues and expenses becauseCredit Suisse First Boston does not have an economic interest in them. For afurther discussion of the impact of FIN 46R refer to note 1 and note 39 in the Notesto the consolidated financial statements.
Credit Suisse First Boston’s businesses are managed on a US dollar basis, and amajority of its revenues, expenses and assets are US dollar-based. The US dollarweakened 8% and 13% against the Swiss franc in 2004 and 2003, respectively,adversely affecting revenues and favorably impacting expenses when translated intoSwiss francs.
INSTITUTIONAL SECURITIES
Year ended December 31, 2004 compared to year ended December 31, 2003Institutional Securities reported net income of CHF 1,313 million in 2004, comparedwith CHF 892 million in 2003, primarily due to higher revenues, lower creditprovisions (including the release of significant credit provisions) and lower income taxexpense, offset in part by higher operating expenses. Institutional Securitiesmeasures performance based on pre-tax margin. For 2004, pre-tax margin was13.6%, an increase of 0.9 percentage points from 2003. Excluding minority-interest-related revenues, pre-tax margin in 2004 was 12.7%, unchanged comparedto 2003.
In 2004, Institutional Securities had net revenues of CHF 13,120 million, anincrease of CHF 930 million, or 8%, from CHF 12,190 million in 2003. Theincrease was primarily related to higher fixed income and equity trading results,higher debt underwriting and gains on legacy investments recorded in the first half of2004. These increased revenues were offset in part by declines in advisory fees andequity underwriting revenues.
Investment banking net revenues include debt underwriting, equity underwriting andadvisory and other fees. Total investment banking revenues declined 4%, or CHF137 million, to CHF 3,328 million in 2004, with solid increases in debt underwritingoffset by decreases in advisory fees and equity underwriting. Debt underwriting feesimproved CHF 109 million, or 7%, in 2004, principally as a result of increased

Operating and financial review Credit Suisse First Boston58
leverage finance and syndicated finance activity. Advisory and other fee incomedeclined CHF 208 million, or 18%, primarily reflecting a decline in mergers andacquisitions market share. Equity underwriting revenues declined CHF 38 million, or5%, reflecting several large transactions in 2003. The 2003 results reflecteddecreased equity new issuance activity during the early part of the year.
Total trading revenues of CHF 8,979 million increased CHF 666 million, or 8%,compared to 2003. Fixed income trading revenues increased CHF 397 million, or8%, to CHF 5,507 million compared to 2003, reflecting strong results in thestructured products businesses, including commercial and residential mortgage-backed securities due to business expansion efforts as well as an industry-wideincrease in securitization activity. The increased revenues also reflected improvedrisk-taking and positioning activity, offset in part by overall declines in interest rateand credit products. Equity trading revenues increased CHF 269 million, or 8%, toCHF 3,472 million compared to 2003, principally due to improvements in the cashbusiness driven by higher transaction volumes and customer activity, stronger equityrisk-taking and positioning activity, which benefited from increased volatility at thebeginning and end of 2004, and improved results in the options and structuredproducts business due to an increased focus on flow derivatives. These increaseswere partially offset by lower results from trading in convertible securities due toweaker volumes and customer flows.
Other revenues, including results from the loan portfolio, increased CHF 401 million,or 97%, to CHF 813 million in 2004, primarily due to an increase in gains on legacyinvestments and minority-interest-related revenues of CHF 128 million. The netexposure, including unfunded commitments, of the legacy portfolio was CHF 1.3
The following table presents the results of the Institutional Securities segment:
Year ended December 31, in CHF m 2004 2003 2002
Net interest income 3,720 4,015 3,697
Investment banking 3,328 3,464 4,389
Commissions and fees 2,702 2,508 3,301
Trading revenues including realized gains/(losses) from investment securities, net 2,680 1,938 3,376
Other revenues 690 265 (437)
Total noninterest revenues 9,400 8,175 10,629
Net revenues 13,120 12,190 14,326
Provision for credit losses (35) 167 2,023
Compensation and benefits 7,429 6,598 8,635
Other expenses 3,946 3,881 5,859
Total operating expenses 11,375 10,479 14,494
Income/(loss) from continuing operations before taxes, minorityinterests and cumulative effect of accounting changes 1,780 1,544 (2,191)
Income tax expense/(benefit) 344 632 (1,095)
Minority interests, net of tax 123 0 0
Income/(loss) from continuing operations before cumulative effect of accounting changes 1,313 912 (1,096)
Cumulative effect of accounting changes, net of tax 0 (20) 64
Net income/(loss) 1,313 892 (1,032)

Operating and financial review Credit Suisse First Boston 59
billion as of December 31, 2004, a decrease of CHF 1.4 billion from December 31,2003.
Provision for credit losses decreased from a net provision of CHF 167 million in2003, to a net release of CHF 35 million in 2004, primarily as a result of asignificant recovery related to the sale of an impaired loan as well as the continuedfavorable credit environment. Impaired loans at December 31, 2004 decreased CHF1.2 billion, or 65%, to CHF 649 million compared to December 31, 2003. Non-performing loans at December 31, 2004 decreased CHF 965 million, or 78%, toCHF 277 million compared with December 31, 2003. The decrease in impaired andnon-performing loans was primarily attributable to write-offs and loan sales.
Operating expenses increased CHF 896 million, or 9%, to CHF 11,375 million in2004 compared with 2003. Compensation and benefits expenses increased CHF
The following table presents key information of the Institutional Securities segment:
Year ended December 31 2004 2003 2002
Cost/income ratio 86.7% 86.0% 101.2%
Compensation/revenue ratio 56.6% 54.1% 60.3%
Pre-tax margin 13.6% 12.7% (15.3%)
Return on average allocated capital 12.8% 8.5% (8.4%)
Average allocated capital in CHF m 10,261 10,546 12,222
Other data excluding minority interest
Cost/income ratio 1) 2) 87.5% 86.0% 101.2%
Compensation/revenue ratio 1) 57.2% 54.1% 60.3%
Pre-tax margin 1) 2) 12.7% 12.7% (15.3%)
1) Excluding CHF 128 million in 2004 in minority interest revenues relating to the FIN 46R consolidation of certain private equity funds. 2) Excluding CHF 5 million in 2004 inexpenses associated in minority interests relating to the FIN 46R consolidation of certain private equity funds.
The following table presents selected balance sheet and other data of the Institutional Securities segment:
December 31 2004 2003 2002
Total assets in CHF bn 707.9 644.4 654.5
Number of employees (full-time equivalents) 16,498 15,374 15,666
The following table presents the revenue details of the Institutional Securities segment:
Year ended December 31, in CHF m 2004 2003 2002
Debt underwriting 1,620 1,511 1,394
Equity underwriting 745 783 1,236
Underwriting 2,365 2,294 2,630
Advisory and other fees 963 1,171 1,759
Total investment banking 3,328 3,465 4,389
Fixed income 5,507 5,110 6,577
Equity 3,472 3,203 3,674
Total trading 8,979 8,313 10,251
Other (including loan portfolio) 813 412 (314)
Net revenues 13,120 12,190 14,326

Operating and financial review Credit Suisse First Boston60
831 million, or 13%, to CHF 7,429 million, due primarily to increased incentivecompensation costs, higher salaries – mainly due to increased headcount – andincreased severance costs. The 2003 compensation and benefits expense reflectedthe introduction of three-year vesting for future stock awards, which are described ingreater detail below. Other expenses increased CHF 65 million, or 2%, to CHF3,946 million, which reflected higher professional fees and travel and entertainmentcosts relating to increased business activity, offset by lower provision expenses. Thelower provision expenses reflected higher expenses for expected litigation fees offsetby an insurance settlement in 2004.
Income tax expense decreased CHF 288 million, or 46%, to CHF 344 million in2004. The 2004 tax expense was positively impacted by the release of taxcontingency accruals totaling CHF 153 million following the favorable resolution ofmatters with local tax authorities during the year.
Year ended December 31, 2003 compared to year ended December 31, 2002Institutional Securities reported net income of CHF 892 million in 2003, comparedwith a net loss of CHF 1,032 million in 2002, primarily due to a significant decline inprovisions for credit losses and lower operating expenses, mainly comprisingcompensation and benefits costs. For 2003, pre-tax margin was 12.7%, an increaseof 28.0 percentage points from 2002.
In 2003, net revenues of CHF 12,190 million were recorded in InstitutionalSecurities, a decrease of 15% from CHF 14,326 million in 2002. The decline wasrelated primarily to total trading and underwriting revenues, reflecting difficult marketconditions, particularly during the early part of 2003, continued low merger andacquisition volume, and a CHF 981 million gain on the sale of the remainder of thestrategic investment in Swiss Re in 2002. This decline was partially offset byimproved results in the legacy portfolio in 2003.
Investment banking revenues declined 21%, or CHF 924 million, to CHF 3,465million in 2003, primarily as a result of declines in mergers and acquisition advisoryfees and equity underwriting fees offset by improved debt underwriting fees.Advisory and other fee income declined CHF 588 million, or 33%, primarily as aresult of significant declines in mergers and acquisitions revenues, reflectingcontinued low mergers and acquisitions volume, as well as lower structured productadvisory fees. Equity underwriting fees declined CHF 453 million, or 37%, reflectinga decrease in equity new issuance activity during the early part of 2003. Debtunderwriting fees improved CHF 117 million, or 8%, in 2003 principally as a resultof increased high yield new issuance activity.
Total trading revenues of CHF 8,313 million declined CHF 1,938 million, or 19%,compared to 2002. Fixed income trading revenues decreased 22%, compared to2002, to CHF 5,110 million, reflecting a decline from particularly strong results inBrazil, and in risk taking and positioning activity in 2002. This decline was partiallyoffset by the benefits of a low interest rate environment, which benefited high yieldand structured products, and an increase in emerging markets trading, in 2003. The2002 results included significant gains from interest derivatives used for riskmanagements purposes but not qualifying for hedge accounting. The 2002 resultsalso included a write-down of CHF 332 million of notes issued by National CenturyFinancial Enterprises, Inc. Equity trading declined CHF 471 million, or 13%, to CHF

Operating and financial review Credit Suisse First Boston 61
3,203 million compared to 2002, principally due to a decrease in the cash business,particularly in the United States, which was adversely impacted by declines in volumeand general margin compression and a decrease in equity new issuance activityduring the early part of 2003, partially offset by improvements from trading inconvertible securities.
Other revenues, including results from the loan portfolio, increased CHF 726 millionto CHF 412 million in 2003. The increase primarily reflected a positive performancein the legacy portfolio in 2003 compared to significant losses from write-downs in2002, which were offset in part by a CHF 981 million gain in 2002 from the sale ofthe remainder of the strategic investment in Swiss Re. The improvement in otherrevenues in 2003 was partially offset by declines on credit default swaps. The netexposure, including unfunded commitments, of the legacy portfolio was CHF 2.7billion as of December 31, 2003, a decrease of CHF 1.5 billion from December 31,2002.
Provision for credit losses decreased CHF 1,856 million, or 92%, to CHF 167million in 2003, due primarily to a significant improvement in credit conditions, therelease of credit provisions, and fewer reserves related to loans and the legacy realestate portfolio. Impaired loans at December 31, 2003 decreased CHF 3.6 billion,or 66%, compared to December 31, 2002. Non-performing loans at December 31,2003 decreased CHF 2.3 billion, or 65%, compared with December 31, 2002.These decreases were due, in part, to higher write-offs in 2003 and to real estateloans held-for-sale, previously presented on the basis of lower of cost or market, netof related credit provisions, and no longer reported as impaired loans. Real estateloans of CHF 752 million were included in impaired loans as of December 31, 2002.
Operating expenses decreased CHF 4,015 million, or 28%, in 2003, compared with2002. Compensation and benefits decreased CHF 2,037 million, or 24%, to CHF6,598 million, primarily due to reduced headcount, the change in vesting for futureshare awards described below, a decline in amortization of retention awards due tothe substantial completion of DLJ retention awards in June 2003 and lowerseverance-related costs. Other expenses decreased CHF 1,978 million, or 34%, toCHF 3,881 million, reflecting lower litigation provisions and reduced discretionaryexpenses, including professional fees, technology and occupancy costs. In 2002,litigation provisions included a pre-tax charge of CHF 234 million, or CHF 193million after tax, related to the provision for the agreement in principle with variousUS regulators involving research analyst independence and the allocation of IPOshares to corporate executive officers, and a pre-tax provision of CHF 702 million,or CHF 456 million after tax, for private litigation involving research analystindependence, certain IPO allocation practices, Enron and other related litigation.
In 2003, Credit Suisse First Boston introduced a three-year vesting period for futureshare awards in line with its long-term service and retention strategy and industrypractice. As a result of the change, Credit Suisse First Boston increased the amountof compensation deferred in the form of share awards and replaced performance-based plans and share option awards with share awards. In 2003, Credit SuisseFirst Boston (in the Institutional Securities and Wealth & Asset Managementsegments on a combined basis) deferred CHF 1,179 million of compensation in theform of share awards into future periods, compared to CHF 1,356 million awarded in2002 that was deferred or otherwise not expensed (in the case of share optionawards).

Operating and financial review Credit Suisse First Boston62
WEALTH & ASSET MANAGEMENT
Year ended December 31, 2004 compared to year ended December 31, 2003The Wealth & Asset Management segment reported net income of CHF 530 millionin 2004 compared with net income of CHF 233 million in 2003. The increaseprimarily reflected significant levels of private equity investment-related gainsrecorded during 2004 and a CHF 270 million charge in 2003 for the impairment ofacquired intangible assets related to Credit Suisse Asset Management’s high-net-worth business. For 2004, the pre-tax margin was 39.6%, an increase of 31.5percentage points from 2003. Excluding minority-interest-related revenues, the pre-tax margin in 2004 was 22.0%, an increase of 13.9 percentage points from 2003.
Wealth & Asset Management measures business performance based on assetsunder management, discretionary assets under management and net new assets.Assets under management as of December 31, 2004 of CHF 482.4 billionincreased CHF 7.9 billion, or 1.7%, while discretionary assets under managementdecreased CHF 3.0 billion, or 0.9%. Wealth & Asset Management had a net assetinflow of CHF 2.6 billion, an improvement from the 2003 net asset outflow of CHF12.7 billion.
Wealth & Asset Management reported revenues of CHF 4,202 million in 2004, anincrease of CHF 1,212 million, or 41%, compared to 2003, primarily reflectingminority-interest-related revenue of CHF 960 million from the consolidation ofcertain private equity funds under FIN 46R. Revenues before investment-relatedgains increased 4% from 2003 to CHF 2,654 million, due primarily to improvementsin Alternative Capital and Credit Suisse Asset Management, offset in part by declinesin Private Client Services revenues. In 2004, investment-related gains increased
The following table presents the results of the Wealth & Asset Management segment:
Year ended December 31, in CHF m 2004 2003 2002
Net interest income 55 58 48
Asset management and administrative fees 2,466 2,417 2,944
Trading revenues including realized gains/(losses) from investment securities, net 182 143 186
Other revenues 1,499 372 (140)
Total noninterest revenues 4,147 2,932 2,990
Net revenues 4,202 2,990 3,038
Compensation and benefits 1,196 1,107 1,391
Other expenses 1,343 1,640 1,574
of which commission and distribution expenses 766 767 856
of which intangible asset impairment 5 270 0
Total operating expenses 2,539 2,747 2,965
Income from continuing operations before taxes, minorityinterests and cumulative effect of accounting changes 1,663 243 73
Income tax expense 184 27 (30)
Minority interests, net of tax 949 0 0
Income from continuing operations before cumulative effect of accounting changes 530 216 103
Income/(loss) from discontinued operations, net of tax 0 18 (576)
Cumulative effect of accounting changes, net of tax 0 (1) (4)
Net income/(loss) 530 233 (477)

Operating and financial review Credit Suisse First Boston 63
31% to CHF 588 million, due primarily to gains from the sale of private equityinvestments in the first half of 2004. In 2003, investment-related gains included aCHF 134 million (CHF 96 million after tax) gain from the sale of a 50% interest in aJapanese online broker.
Operating expenses in 2004 decreased CHF 208 million, or 8%, to CHF 2,539million from 2003, primarily reflecting the CHF 270 million intangible asset write-offin 2003. Operating expenses in 2004 included higher incentive and non-incentivecompensation expenses including severance costs of CHF 103 million primarilyassociated with the changes in the structure of the Alternative Capital business.These increases were offset by lower other expenses, which were primarily due tothe 2003 charge for the impairment of acquired intangible assets.
In 2004, Wealth & Asset Management’s assets under management increased CHF7.9 billion, or 1.7%, to CHF 482.4 billion. Of the increase in assets undermanagement, CHF 2.6 billion was attributable to net asset inflows. The remainingincrease was attributable to CHF 20.5 billion in market performance gains, partiallyoffset by CHF 15.2 billion in foreign exchange declines. Credit Suisse AssetManagement’s assets under management increased CHF 5.1 billion, or 1.3%, toCHF 386.7 billion. Of the increase in assets under management, CHF 17.5 billionwas attributable to market performance gains offset by CHF 12.4 billion of foreignexchange declines, transfers and outflow of assets. Alternative Capital’s assetsunder management increased CHF 5.5 billion, or 17.7%, to CHF 36.6 billion. Of theincrease in assets under management, CHF 8.9 billion was due to transfers, inflowof assets and market performance gains, which were partially offset by CHF 3.4billion of foreign exchange declines. Private Client Services’ assets undermanagement decreased CHF 2.7 billion, or 4.4%, to CHF 59.1 billion. Of thedecline in assets under management, CHF 5.4 billion was attributable to foreignexchange declines, which was partially offset by CHF 2.7 billion of net asset inflowsand market performance gains.
The following table presents the revenue details of the Wealth & Asset Management segment:
Year ended December 31, in CHF m 2004 2003 2002
Credit Suisse Asset Management 1) 1,841 1,768 2,106
Alternative Capital 1) 549 478 512
Private Client Services 264 292 423
Other 0 2 (34)
Total before investment-related gains 2,654 2,540 3,007
Investment-related gains 2) 588 450 31
Net revenues before minority interests 3,242 2,990 3,038
Minority interest revenues 3) 960 0 0
Net revenues 4,202 2,990 3,038
1) Alternative Capital has been presented as a separate division from Credit Suisse Asset Management and prior periods have been adjusted to conform to the currentpresentation. 2) Includes realized and unrealized gains/losses from investments as well as net interest income, trading and other revenues associated with the AlternativeCapital division and Other. 3) Reflects minority interest revenues relating to the FIN 46R consolidation.

Operating and financial review Credit Suisse First Boston64
Year ended December 31, 2003 compared to year ended December 31, 2002The Wealth & Asset Management segment reported net income of CHF 233 millionin 2003, a CHF 710 million increase from the CHF 477 million net loss in 2002.This increase reflected the after-tax losses of CHF 390 million from Pershing,reflected in discontinued operations, and the after-tax gain of CHF 96 million fromthe sale of a 50% interest in a Japanese online broker in 2003, offset in part by theCHF 176 million after-tax charge for the impairment of acquired intangible assetsassociated with the high-net-worth asset management business in 2003. For 2003,the pre-tax margin was 8.1%, an increase of 5.7 percentage points from 2002.
Wealth & Asset Management recorded income from discontinued operations relatedto Pershing in 2003 of CHF 18 million and a loss from discontinued operations in2002 of CHF 576 million related to the sale of Pershing, which closed in May 2003.
The following table presents key information for the Wealth & Asset Management segment:
Year ended December 31 2004 2003 2002
Cost/income ratio 60.4% 91.9% 97.6%
Compensation/revenue ratio 28.5% 37.0% 45.8%
Pre-tax margin 39.6% 8.1% 2.4%
Return on average allocated capital 45.8% 18.6% (23.4%)
Average allocated capital in CHF m 1,158 1,252 2,040
Net new assets in CHF bn
Credit Suisse Asset Management 1) (2.3) (11.5) (32.0)
Alternative Capital 3.3 0.8 (0.3)
Private Client Services 1.6 (2.0) 8.0
Total net new assets 2.6 (12.7) (24.3)
Other data excluding minority interest
Cost/income ratio 2) 3) 78.0% 91.9% 97.6%
Compensation/revenue ratio 2) 36.9% 37.0% 45.8%
Pre-tax margin 2) 3) 22.0% 8.1% 2.4%
1) Credit Suisse Asset Management balances for Assets under management and Net new assets include assets managed on behalf of other entities within Credit Suisse Group.This differs from the presentation in the overview of Credit Suisse Group, where such assets are eliminated. 2) Excluding CHF 960 million in 2004 in minority interestrevenues relating to the FIN 46R consolidation of certain private equity funds. 3) Excluding CHF 11 million in 2004 in expenses associated in minority interests relating to theFIN 46R consolidation of certain private equity funds.
The following table presents selected balance sheet and other data of the Wealth & Asset Management segment:
December 31, in CHF bn, except where indicated 2004 2003 2002
Assets under management
Credit Suisse Asset Management 1) 386.7 381.6 395.7
Alternative Capital 36.6 31.1 33.1
Private Client Services 59.1 61.8 69.1
Total assets under management 482.4 474.5 499.9 2)
of which advisory 169.2 158.3 185.3
of which discretionary 313.2 316.2 314.6
Active private equity investments 1.1 1.3 1.4
Number of employees (full-time equivalents) 2,981 2,967 7,135
1) Credit Suisse Asset Management balances for Assets under management and Net new assets include assets managed on behalf of other entities within Credit Suisse Group.This differs from the presentation in the overview of Credit Suisse Group, where such assets are eliminated. 2) Includes CHF 2.0 bn relating to an online broker which wassold in 2003.

Operating and financial review Credit Suisse First Boston 65
Assets under management decreased by CHF 25.4 billion, or 5.1%, whilediscretionary assets under management increased CHF 1.6 billion, or 0.5%. The netasset outflow of CHF 12.7 billion reported in 2003 was an improvement over the2002 net asset outflow of CHF 24.3 billion.
Wealth & Asset Management net revenues were CHF 2,990 million in 2003, adecrease of 2% compared to 2002, with a CHF 467 million decline in net revenuesbefore investment-related gains offset in part by a CHF 419 million increase inAlternative Capital investment-related gains related primarily to private equityinvestments and the CHF 134 million (CHF 96 million after tax) gain from the saleof a 50% interest in a Japanese online broker. The decrease in revenue beforeinvestment-related gains resulted primarily from the negative impact of a lower USdollar/Swiss franc exchange rate at Credit Suisse Asset Management and theimpact of a reduced sales staff and lower client balances at Private Client Services.
Operating expenses in 2003 decreased CHF 218 million, or 7%, from 2002. Thedecrease reflected a CHF 284 million, or 20%, decrease in compensation andbenefits due primarily to a decline in the amortization of retention awards followingthe substantial completion of DLJ retention awards in June 2003, and a 7%decrease in headcount excluding the impact of discontinued operations. Otherexpenses increased CHF 66 million, or 4%, reflecting the CHF 270 millionintangible asset impairment offset in part by a CHF 89 million decline in commissionand distribution expense mostly from Credit Suisse Asset Management.
In 2003, Wealth & Asset Management’s assets under management decreased CHF25.4 billion, or 5.1%, to CHF 474.5 billion. Of the decline in assets undermanagement, CHF 24.8 billion was attributable to changes in reporting, primarily toconform to new Swiss Federal Banking Commission (SFBC), definitions. Theremaining CHF 0.6 billion decrease was attributable to CHF 11.9 billion in foreignexchange declines, CHF 12.7 billion in net asset outflows and CHF 1.2 billion indivestitures, partially offset by CHF 25.2 billion in market performance gains. CreditSuisse Asset Management’s assets under management decreased CHF 14.1 billion,or 3.6%, to CHF 381.6 billion. Of the decline in assets under management, CHF24.4 billion was attributable to a change in the definition of assets undermanagement to conform to new SFBC definitions. Excluding these changes, assetsunder management increased by CHF 10.3 billion, due to CHF 21.8 billion ofmarket performance gains and transfers offset by a CHF 11.5 billion net outflow ofassets. Alternative Capital’s assets under management decreased CHF 2.0 billion,or 6.0%, to CHF 31.1 billion. Of the decline in assets under management, CHF 4.6billion was due to foreign exchange declines and transfers, which were offset byCHF 1.8 billion of market performance gains and a CHF 0.8 billion inflow of assets.Private Client Services’ assets under management decreased CHF 7.3 billion, or10.6%, to CHF 61.8 billion. Of the decline in assets under management, CHF 3.9billion was attributable to a change in the definition of assets under management toconform to new SFBC definitions, CHF 7.9 billion to foreign exchange declines andCHF 2.0 billion to a net outflow of assets, which was partially offset by CHF 5.4billion of market performance gains and CHF 1.1 billion from the Volaris acquisition.

Operating and financial review Winterthur66
WinterthurThe Winterthur business unit is an all-lines insurer, based in Switzerland andoperating in selected markets. The business unit offers insurance and pensionsolutions for private and corporate clients. Winterthur is one of the marketleaders in Switzerland. The company predominantly focuses on WesternEuropean markets and also has businesses in Central and Eastern Europe,North America and selected Asian countries.
For the periods under discussion, the Winterthur business unit was comprised of tworeporting segments: Life & Pensions and Non-Life. For information relating to theservices provided, refer to Information on the Company – Winterthur.
During the third quarter of 2004, Winterthur combined its life and non-lifeorganizations in Switzerland. The new organization is expected to enable Winterthurto further increase operating efficiency and strengthen its position as Switzerland’sleading insurance carrier.
The following table presents selected information of Winterthur:
Year ended December 31, in CHF m, except where indicated 2004 2003 2002
Total gross premiums written 21,392 22,352 22,817
Net investment income 5,496 5,117 (94)
Administration expenses 2,148 2,244 2,643
Net income/(loss) 728 (2,409) (3,027)
Combined ratio (Non-Life) 99.7% 101.4% 104.6%
Return on average allocated capital 10.3% (26.4%) (28.2%)
Average allocated capital 7,538 9,289 11,485
The following table outlines selected balance sheet and other data of Winterthur:
December 31, in CHF bn, except where indicated 2004 2003 2002
Investments 131.2 128.0 124.9
Technical provisions 135.5 128.8 126.1
Assets under management 139.6 139.2 140.8
Number of employees (full-time equivalents) 19,368 20,866 32,130

Operating and financial review Winterthur 67
LIFE & PENSIONS
Year ended December 31, 2004 compared to year ended December 31, 2003In 2004, Life & Pensions reported net income of CHF 522 million, compared with anet loss of CHF 2,035 million in the previous year. The strong result in 2004 wasprimarily driven by cost containment, efficiency improvements and stable investmentincome. The 2003 net loss resulted largely from a goodwill impairment of CHF1,510 million and a cumulative effect of accounting changes, net of tax, forprovisions for policyholder guarantees and annuities of CHF 530 million.
In 2004, Life & Pensions reported a decrease in gross premiums written of CHF1,196 million, or 10%, to CHF 10,298 million, compared to the previous year. TheSwiss group life business was the primary driver behind this decrease, as discussedfurther below.
Total business volume, which consists of gross premiums written and policyholderdeposits, increased by 1%. The 2004 decrease in gross premiums written wasalmost entirely offset by a 28% increase in deposit business, which included agrowth of 36% in unit-linked business driven by the United Kingdom, Central andEastern Europe, Asian and Belgium operations, reflecting Life & Pensions’ ongoingstrategy of increasing its focus on less capital-intensive investment-type products.
The following table presents the results of the Life & Pensions segment:
Year ended December 31, in CHF m 2004 2003 2002
Gross premiums written 10,298 11,494 12,268
Net premiums earned 10,235 11,404 12,193
Net investment income 4,403 4,193 188
Other revenues including fees and net revenuesfrom deposit business 528 351 326
Net revenues 15,166 15,948 12,707
Policyholder benefits incurred 11,791 12,828 13,482
Dividends to policyholders incurred 901 1,758 (1,880)
Provision for credit losses (6) 13 23
Total benefits, dividends and credit losses 12,686 14,599 11,625
Insurance underwriting and acquisition expenses 542 743 801
Administration expenses 991 1,041 1,316
Other expenses 232 288 183
Goodwill impairment 0 1,510 0
Restructuring charges 11 39 0
Total operating expenses 1,776 3,621 2,300
Income/(loss) from continuing operations before taxes, minorityinterests and cumulative effect of accounting changes 704 (2,272) (1,218)
Income tax expense/(benefit) 149 (926) 772
Minority interests, net of tax 22 (39) (93)
Income/(loss) from continuing operations before cumulative effect of accounting changes 533 (1,307) (1,897)
Income/(loss) from discontinued operations, net of tax (12) (198) (31)
Cumulative effect of accounting changes, net of tax 1 (530) 0
Net income/(loss) 522 (2,035) (1,928)
Prior periods have been adjusted for discontinued operations.

Operating and financial review Winterthur68
The following table presents key information of the Life & Pensions segment:
Year ended December 31 2004 2003 2002
Total business volume in CHF m 1) 16,777 16,572 17,821
Expense ratio 2) 9.1% 10.8% 11.9%
Return on average allocated capital 10.1% (33.1%) (28.1%)
Average allocated capital in CHF m 5,371 6,268 7,187
1) Includes gross premiums written and policyholder deposits. 2) Insurance underwriting, acquisition and administration expenses as a percentage of total business volume.
The following table outlines selected balance sheet and other data of the Life & Pensions segment:
December 31 2004 2003 2002
Assets under management (discretionary) in CHF bn 1) 115.5 113.8 111.3
Technical provisions in CHF bn 110.5 104.7 94.6
Number of employees (full-time equivalents) 6,524 7,193 7,815
1) Based on savings-related provisions for policyholders plus off-balance sheet assets.
The following table presents Life & Pensions’ breakdown of gross premiums written by market units:
Year ended December 31, in CHF m 2004 2003 2002
Switzerland 6,312 7,410 7,864
Germany 2,618 2,593 2,759
United Kingdom 218 248 480
Rest of Europe 693 766 787
Outside Europe 457 477 378
Gross premiums written 10,298 11,494 12,268
The following table presents the investment income of the Life & Pensions segment:
Year ended December 31, in CHF m 2004 2003 2002
Net current investment income 4,007 3,864 3,441
of which backing traditional life policies 3,735 3,669 3,441
of which backing unit-linked liabilities general account 272 195 0
Realized gains/(losses), net 1,848 1,781 (2,992)
of which backing traditional life policies 923 712 (2,992)
of which backing unit-linked liabilities general account 925 1,069 0
Net investment income before credited investment income to deposit business general account 5,855 5,645 449
Credited investment income to deposit business general account (1,452) (1,452) (261)
Net investment income 4,403 4,193 188
Investment income separate account 258 403 (1,716)

Operating and financial review Winterthur 69
In Switzerland, gross premiums written decreased by CHF 1,098 million, or 15%,and total business volume decreased by CHF 702 million, or 8%, in 2004. Thedecreases were due to a restrictive underwriting policy initiated in 2003, whichresulted in lower single premiums for group life policies in 2004. Annual premiums inthe individual life and in the group life businesses remained stable.
In the German market unit, gross premiums written increased by CHF 25 million, or1%, and total business volume increased by CHF 83 million, or 3%, in 2004, mainlydriven by its Dutch subsidiary.
In the United Kingdom market unit, gross premiums written, relating predominatelyto a closed block of business in run-off, decreased by CHF 30 million, or 12%.However, total business volume increased CHF 405 million, or 17%, due to strongnew business resulting mainly from the individual unit-linked and group pensionbusiness.
In the Rest of Europe, gross premiums written decreased by CHF 73 million, or10%, in 2004, whereas total business volume increased by CHF 300 million, or16%. The increase in deposit business related primarily to Poland and Belgium. InPoland, the increase related to the single premium business in the individual pensionfund business. In Belgium, the increase was due to strong sales of traditionaldeposit and unit-linked products.
Outside Europe, gross premiums written decreased by CHF 20 million, or 4%,whereas total business volume increased by CHF 119 million, or 9%. The increasein total business volume related to Japan and Hong Kong and was due to growth inindividual life business.
Net investment income, which consists of net current investment income andrealized gains/(losses), net, less investment income credited to the deposit businessin the general account, increased from CHF 4,193 million in 2003 to CHF 4,403million in 2004.
In 2004, Life & Pensions’ net current investment income backing traditional lifepolicies and unit-linked liabilities general account was CHF 3,735 million and CHF272 million, respectively, generating a total of CHF 4,007 million compared withCHF 3,864 million in 2003. The increase was partially due to the shift in the mix ofinvestments in the investment portfolio from government bonds to corporate andhigh-yield bonds, allowing Winterthur to compensate for lower yields onreinvestment.
The following table presents the investment return of the Life & Pensions segment:
in %, except where indicated 2004 2003 2002
Net current investment return backing traditional life policies 3.8% 3.9% 3.8%
Realized gains/(losses) backing traditional life policies 1.0% 0.7% (3.3%)
Net investment return backing traditional life policies 4.8% 4.6% 0.5%
Average assets backing traditional life policies in CHF bn 97.3 95.0 90.7

Operating and financial review Winterthur70
Net current investment income related to the investments backing unit-linkedliabilities in the general account rose 40%, from CHF 195 million in 2003 to CHF272 million in 2004. The increase was due to a higher level of underlying assets.
Life & Pensions’ realized gains, net, which consist of realized gains and losses oninvestments and derivatives, less depreciation on real estate held-for-investment,rose from CHF 1,781 million in 2003 to CHF 1,848 million in 2004, whichrepresented an overall growth of CHF 67 million, or 4%. Realized gains, net,backing traditional life policies and unit-linked liabilities general account were CHF923 million and CHF 925 million, respectively, for a total of CHF 1,848 million.
The growth in realized gains/(losses), net, relating to traditional life policies reflectedthe positive performance of equity investments, corporate and high-yield bonds, aswell as alternative investments in 2004. In the area of equity investments, Winterthurfocused on value stocks, which achieved a sound performance. Furthermore, netrealized losses on derivatives decreased significantly due to declining hedging costson the equity portfolio. Certain corporate and high-yield bonds were sold, whichstrongly contributed to a net realized gain position. The appreciation of investmentsin hedge funds contributed significantly to realized gains. Private equities showed astrong performance.
Other revenues, including fees, and net revenues from deposit business increasedCHF 177 million, or 50%. The increase was mainly due to favorable depositpremium growth relating to new business in the UK and Asia.
Policyholder benefits incurred decreased CHF 1,037 million, or 8%. This decreasewas primarily driven by lower premium income, which resulted in a lower change inprovisions for future benefits. Additionally, in 2004, a lower level of benefits waspaid compared to 2003, mainly in Switzerland, driven by maturities in 2003 relatingto policies underwritten in 1998 before the introduction of stamp tax, but also due tolower benefits paid in group life in 2004. Additionally, certain group contracts, inGermany and Spain, were cancelled in 2003 but resulted in a minor impact onpolicyholder benefits incurred due to an offsetting effect in the change in provisionsfor future benefits.
Dividends to policyholders incurred decreased by CHF 857 million, or 49%, in 2004compared to 2003. The decrease was mainly due to the 2003 increase in dividendsto policyholder incurred of CHF 605 million, reflecting the policyholder’s share of thetax benefit of CHF 658 million, arising from tax law changes in Germany in 2003.On March 24, 2004, the Swiss government passed amendments to the LifeInsurance Ordinance that provides for a mandatory allocation of profits from theregulated employee benefit business in Switzerland to policyholders. The amendedordinance requires that, subject to the level of the investment result of the employeebenefit business a minimum of 90% of gross contributions or, in certain cases, 90%of net contributions be distributed to policyholders (the legal quota). This legislationimpacts the determination of the provision for future dividends to policyholders. Inaddition to the ongoing allocation to policyholders in respect of this business, initialprovisions reflecting this legislation were recorded in the first quarter of 2004 andamounted to CHF 117 million (CHF 91 million after tax).
In 2004, insurance underwriting and acquisition expenses decreased by CHF 201million, or 27%, due to a lower level of charges in 2004 compared to 2003 relating

Operating and financial review Winterthur 71
to additional write-downs in 2003 of deferred acquisition costs (DAC) and presentvalue of future profits (PVFP).
Administration expenses declined CHF 50 million, or 5%, compared to 2003. Thisimprovement was mainly due to ongoing cost savings in almost all markets. Theexpense ratio improved by 1.7 percentage points down to 9.1%.
Income tax expense for 2004 of CHF 149 million included a benefit from theincrease in the valuation of deferred tax assets (by decreasing the related valuationallowance) in relation to tax loss carry-forwards created in prior years of CHF 72million. The total tax benefit of CHF 926 million in 2003 was primarily due to a taxlaw change in Germany resulting in a benefit of CHF 658 million, largely offset by anincrease in dividends to policyholders, as discussed above.
Life & Pensions reported a loss from discontinued operations, net of tax, of CHF 12million in 2004. This relates to the divestiture of PPML, a wholly owned subsidiary ofWinterthur Life UK, to Capita Group Plc., which was completed in 2004. The sale ofPPML enabled Life & Pensions to increase its focus on its core life business in theUK.
Year ended December 31, 2003 compared to year ended December 31, 2002Life & Pensions reported a net loss of CHF 2,035 million in 2003, compared with anet loss of CHF 1,928 million in 2002. The loss in 2003 was primarily due to agoodwill impairment of CHF 1,510 million, and the cumulative effect of accountingchanges, net of tax, related to provisions for policyholder guarantees and annuitiesof CHF 530 million.
In 2003, Life & Pensions’ total business volume declined by 7% compared to 2002.In original currency, the decline was 3%. The decline in reported total businessvolume was due to a higher volume of single premiums in 2002 and lower customerdemand for individual life products as a result of adapting the business to marketconditions in 2003.
In Switzerland, gross premiums written decreased by CHF 454 million in 2003,mainly due to the reduced demand for single premium individual life products andselective underwriting.
In Spain, gross premiums written decreased CHF 139 million, or 43%, in 2003. Thedecline was due to the termination of a regulation in Spain in 2002, which requiredcompanies to transfer their own pension funds to external financial institutions.
Net investment income increased by CHF 4,005 million in 2003. This increase wasprimarily due to a significant decrease in realized losses as a result of improvementsin the equity markets and a reduced equity position. Additionally, the realization ofgains on bonds and equities in Switzerland, Germany, Belgium and Italy, as well ason real estate in Switzerland, contributed to the increase in investment income.
Policyholder benefits incurred decreased CHF 654 million, or 5%, in 2003. Thisdecrease was primarily driven by the lower premium income, which resulted in alower change in provisions for future benefits.

Operating and financial review Winterthur72
Dividends to policyholders incurred increased CHF 3,638 million in 2003 comparedto 2002 due to higher investment results, the impact of German tax law changesand a refinement of the methodology used for the calculation of the deferred bonusreserve. During 2002, the deferred bonus reserve declined primarily due to realizedlosses on equity investments. Investment income was much higher in 2003 than in2002, particularly in Germany, leading to an increase in dividends to policyholdersincurred. Additionally, the increase in dividends to policyholders incurred includes anamount of CHF 605 million, which reflects the policyholder share of the tax benefitof CHF 658 million which resulted from changes in the tax law in Germany in 2003.
Insurance underwriting and acquisition expenses decreased CHF 58 million, or 7%,primarily driven by a lower level of charges related to write-downs of DAC and PVFP.
Administration expenses decreased by CHF 275 million, or 21%, in 2003. Thisimprovement was mainly due to ongoing efficiency measures. This resulted in animproved expense ratio of 10.8% in 2003, compared to 11.9% in 2002, despitelower business volumes.
In 2003, Life & Pensions recognized restructuring charges of CHF 39 million. Thecharges reflect costs related to the reorganization announced in February 2003 torealign the organizational structure in response to the decline in the industry. Inparticular, restructuring activities were initiated to bring the Winterthur Group under ajoint management structure and assess all processes and activities with the intentionof increasing efficiency and reducing costs.
Life & Pensions recorded an income tax benefit of 926 million in 2003, compared toan income tax expense of 772 million in 2002.The main reason for the improvement was the change in the German tax lawsenacted in December 2003, as discussed above, and the non-taxable investmentlosses in Germany in 2002.
In 2003, Life & Pensions recorded a loss of CHF 198 million on discontinuedoperations related primarily to the disposals of the Italian and Portuguesebusinesses.

Operating and financial review Winterthur 73
NON-LIFE
Year ended December 31, 2004 compared to year ended December 31, 2003In 2004, Non-Life reported net income of CHF 206 million compared to a net lossof CHF 374 million in 2003. This increase was primarily driven by continued costcontainment, improved underwriting results and higher investment income. This waspartially offset by a pre-tax charge of CHF 321 million (CHF 250 million after tax)related to the increase in the provisions for contingencies relating to the sale ofWinterthur International in 2001, which was recorded in other expenses. In 2003,Non-Life recognized losses on disposals of operations of CHF 226 million and thestrengthening of certain provisions by CHF 383 million in the third quarter of 2003,related to the current and former international business portfolio.
The Non-Life segment measures underwriting performance based on the combinedratio. This ratio is intended to measure the underwriting quality by comparing theclaims and annuities incurred, policyholder benefits incurred, insurance underwritingand policy acquisition expenses and administration expenses as a percentage of netpremiums earned. In 2004, the combined ratio improved by 1.7 percentage points to99.7%. This decrease occurred despite hailstorms in Europe and accident claims inthe Swiss portfolio related to the tsunami catastrophe in South Asia. The improvedratio mainly benefited from the continued implementation of tariff increases across all
The following table presents the results of the Non-Life segment:
Year ended December 31, in CHF m 2004 2003 2002
Gross premiums written 11,094 10,858 10,549
Reinsurance ceded (380) (439) (330)
Change in provisions for unearned premiums (75) (115) (217)
Net premiums earned 10,639 10,304 10,002
Net investment income 1,093 924 (282)
Other revenues including fees 128 (56) 11
Net revenues 11,860 11,172 9,731
Claims and annuities incurred 7,939 7,716 7,705
Dividends to policyholders incurred 380 500 (117)
Provision for credit losses 0 9 15
Total claims, dividends and credit losses 8,319 8,225 7,603
Insurance underwriting and acquisition expenses 1,511 1,525 1,436
Administration expenses 1,157 1,203 1,327
Other expenses 478 608 667
Restructuring charges 77 83 15
Total operating expenses 3,223 3,419 3,445
Income/(loss) from continuing operations before taxes and minority interests 318 (472) (1,317)
Income tax expense/(benefit) 1 (298) 75
Minority interests, net of tax 24 (7) (117)
Income/(loss) from continuing operations beforecumulative effect of accounting changes 293 (167) (1,275)
Income/(loss) from discontinued operations, net of tax (87) (204) 176
Cumulative effect of accounting changes, net of tax 0 (3) 0
Net income/(loss) 206 (374) (1,099)
Prior periods have been adjusted for discontinued operations.

Operating and financial review Winterthur74
The following table presents key information for the Non-Life segment:
Year ended December 31 2004 2003 2002
Combined ratio 99.7% 101.4% 104.6%
Expense ratio 1) 25.1% 26.5% 27.6%
Claims ratio 2) 74.6% 74.9% 77.0%
Return on average allocated capital 10.6% (11.8%) (26.9%)
Average allocated capital in CHF m 2,167 3,233 4,522
1) Insurance underwriting, acquisition and administration expenses as a percentage of net premiums earned. 2) Claims and annuities incurred as a percentage of net premiumsearned.
The following table outlines selected balance sheet and other data of the Non-Life segment:
December 31 2004 2003 2002
Assets under management (discretionary) in CHF bn 24.1 25.4 29.5
Technical provisions in CHF bn 25.0 24.1 31.5
Number of employees (full-time equivalents) 12,844 13,673 24,315
The following table presents Non-Life’s breakdown of gross premiums written by market units:
Year ended December 31, in CHF m 2004 2003 1) 2002 1)
Switzerland 3,369 3,241 2,981
Germany 2,895 2,657 2,523
Rest of Europe 2,608 2,522 2,268
Outside Europe 2,222 2,438 2,777
Gross premiums written 11,094 10,858 10,549
1) Certain reclassifications have been made to conform to the current presentation.
The following table presents the investment income of the Non-Life segment:
Years ended December 31, in CHF m 2004 2003 2002
Net current investment income 864 819 776
Realized gains/(losses), net 229 105 (1,058)
Net investment income 1,093 924 (282)
The following table presents the investment return of the Non-Life segment:
Year ended December 31, in %, except where indicated 2004 2003 2002
Net current investment return 3.5% 3.6% 3.7%
Realized gains/(losses), net 1.0% 0.5% (5.1%)
Net investment return 4.5% 4.1% (1.4%)
Average assets in CHF bn 24.4 22.8 20.8

Operating and financial review Winterthur 75
major markets, improved claims management, a further reduction of administrationexpenses and a strict underwriting policy, as well as the continued streamlining ofthe business portfolio.
In 2004, the Non-Life segment’s gross premiums written increased by CHF 236million, or 2%, to CHF 11,094 million, compared to the previous year.
In Switzerland, gross premiums written increased by CHF 128 million, or 4%, in2004. This growth primarily reflected tariff increases and the transfer of the non-mandatory part of the Swiss health insurance business to a consolidated entity witheffect from the third quarter of 2003.
In the German market unit, gross premiums written increased by CHF 238 million, or9%, in 2004. This was mainly due to an increase in premiums for bonuses in thehealth insurance business, which were used to cover the additional insurancecoverage and tariff increases.
In Rest of Europe, gross premiums written slightly increased by CHF 86 million, or3%.
Outside Europe, gross premiums written decreased by CHF 216 million, or 9%, in2004, primarily due to the declining US dollar.
Net investment income, which consists of net current investment income andrealized gains/(losses), net, increased from CHF 924 million in 2003 to CHF 1,093million in 2004.
Non-Life’s net current investment income increased CHF 45 million, or 5%, fromCHF 819 million in 2003 to CHF 864 million in 2004. The increase was partiallydue to a shift in the mix of investments in the investment portfolio from governmentbonds to corporate and high-yield bonds, allowing the group to compensate for lowerreinvestment rates.
Realized gains, net, which consist of realized gains and losses on investments andderivatives, less depreciation on real estate held for investment, rose from CHF 105million in 2003 to CHF 229 million in 2004, which represented an overall growth ofCHF 124 million, reflecting primarily lower losses on equity securities.
The growth in realized gains, net, reflected the positive performance of equityinvestments, corporate and high-yield bonds, as well as alternative investments in2004. In the area of equity investments, Winterthur focused on value stocks, whichachieved a sound performance. Furthermore, net realized losses on derivativesdecreased significantly due to declining hedging costs on the equity portfolio.Corporate and high-yield bonds were sold, which contributed to a net realized gainposition. Appreciation on investments in hedge funds significantly contributed torealized gains. Private equities showed a strong performance.
Other revenues, including fees improved by CHF 184 million from an expense ofCHF 56 million in 2003 to an income of CHF 128 million in 2004, primarily due tohigher fee income.

Operating and financial review Winterthur76
The claims ratio decreased by 0.3 percentage points to 74.6% in 2004 versus theprevious year, reflecting improved claims management in several countries. Thisdecrease occurred despite hailstorms in Europe and accident claims in the Swissportfolio related to the tsunami catastrophe in South Asia.
Dividends to policyholders incurred decreased by CHF 120 million, to CHF 380million in 2004, mostly due to the German market unit. The decrease was mainlydue to the 2003 increase of dividends to policyholder incurred of CHF 106 millionreflecting the policyholder’s share of the tax benefit of CHF 124 million from tax lawchanges in Germany in 2003.
In 2004, insurance underwriting and acquisition expenses remained stable despitegrowth in net premiums earned of 3%. This was primarily driven by the fact that thepremium for bonus in the German health business had no underlying acquisitioncosts.
Administration expenses decreased by 4%, or CHF 46 million, over the same period,reflecting further cost savings. This improvement was mainly due to further efficiencygains, especially in Germany and North America.
The expense ratio decreased by 1.4 percentage points, down to 25.1% in 2004,compared to the previous year, as insurance underwriting, acquisition andadministration expenses were reduced despite premium growth.
Other expenses decreased by CHF 130 million, from CHF 608 million in 2003 toCHF 478 million in 2004. The 2004 other expenses balance included the above-mentioned charge of CHF 321 million, relating to the sale of WinterthurInternational, whereas the 2003 balance included provisioning for the formerinternational business portfolio.
Restructuring charges of CHF 77 million in 2004 related primarily to restructuring inSpain and Switzerland.
Income tax expense included a benefit from the increase in the valuation of deferredtax assets (by decreasing the related valuation allowance) in relation to tax losscarry-forwards created in prior years of CHF 59 million, reducing income taxexpense to CHF 1 million. The income tax benefit of CHF 298 million in 2003included the effect of a change in a tax law in Germany of CHF 124 million, whichwas largely offset by an increase in dividends to policyholders as discussed above.
Non-Life reported a net loss from discontinued operations of CHF 87 million in2004, compared to a net loss of CHF 204 million in 2003. The 2004 results wereprimarily related to the sale of Non-Life’s French subsidiary Rhodia Assurances S.A.and a charge for credit risk related to the business sold in the UK in 2003. In 2004,Non-Life also divested L’Unique Compagnie d’Assurances Générales, a whollyowned subsidiary in Canada, at a small loss. These charges were partially offset bythe gain on the sale of the Dutch branch of Les Assurés Réunis (LAR) Belgium.
Year ended December 31, 2003 compared to year ended December 31, 2002Non-Life reported a net loss of CHF 374 million in 2003 compared with a net lossof CHF 1,099 million in 2002. The CHF 725 million, or 66%, improvement wasprimarily due to increased net investment income of CHF 1,206 million and strong

Operating and financial review Winterthur 77
technical improvements. These improvements were offset by losses of CHF 226million related to the sale of businesses and provisions of CHF 383 million related tothe current and former international business portfolio.
In 2003, the combined ratio improved by 3.2 percentage points to 101.4%. Thecombined ratio mainly benefited from the continued implementation of tariffincreases across all major markets, a strict underwriting policy, reduced expensesand the continued streamlining of the business portfolio through divestitures. Inaddition, a lower level of losses resulting from natural catastrophes was reported in2003.
In 2003, the Non-Life segment’s gross premiums written increased by 3%. Inoriginal currency, the increase was 5%.
Net investment income increased by CHF 1,206 million in 2003. This increase wasmainly attributable to the significant decrease in realized losses due to improvedmarket conditions in 2003.
Dividends to policyholders incurred increased CHF 617 million in 2003 compared to2002 due to higher investment results, the impact of German tax law changes and arefinement of the methodology used for the calculation of the deferred bonusreserve. During 2002, deferred bonus reserves declined due to realized losses ininvestment. Investment income in the German health business was higher in 2003than in 2002, leading to an increase in dividends to policyholders incurred.Additionally in 2003, an increase of dividends to policyholders incurred of CHF 117million, which was attributable to the tax benefit of CHF 124 million from tax lawchanges in Germany in the same year, was also reported, reflecting the policyholdershare of this benefit.
In line with premium growth, insurance underwriting and acquisition expensesincreased CHF 89 million, or 6%.
Administration costs decreased by CHF 124 million, or 9%, in 2003.
The expense ratio declined to 26.5% in 2003, down 1.1 percentage pointscompared to 2002, primarily as a result of lower administration costs relative to netpremiums earned.
In 2003, Non-Life recognized restructuring charges of CHF 83 million inSwitzerland, Spain and Germany. The charges reflect costs related to thereorganization announced in February 2003 to realign the organizational structure inresponse to the decline in the industry. In particular, restructuring activities wereinitiated to bring the Winterthur under a joint management structure and assess allprocesses and activities with the intention of increasing efficiency and reducingcosts.
Non-Life reported an income tax benefit of CHF 298 million in 2003, compared toan income tax expense of 75 million in 2002. The main reason for the improvementwas the change in the German tax laws enacted in December 2003, as discussedabove, and the non-taxable investment losses in Germany in 2002.

Operating and financial review Winterthur78
Income/(loss) from discontinued operations in 2003 and 2002 include the netincome from disposed operations and the gains or losses on their respective sales.The main components relate to the disposals of Churchill Insurance Group, theItalian operations and Republic Financial Services in the US.
INVESTMENTS FOR LIFE & PENSIONS AND NON-LIFE
Winterthur’s investment portfolios are managed within a defined process and set ofguidelines in order to meet the diversification, credit quality, yield and liquidityrequirements of policy liabilities.
Investments include debt instruments such as government and corporate bonds,loans and mortgage loans, real estate, equities and alternative assets.
The following table illustrates the investment portfolio of Life & Pensions and Non-Life by investment type:
2004 2003
December 31, in CHF m Book value Fair value Book value Fair value
Debt securities - held-to-maturity 10,141 10,336 10,186 10,021
Debt securities - available-for-sale 70,937 70,937 71,324 71,324
Equity securities - available-for-sale 5,950 5,950 5,122 5,122
Debt securities - trading 1,771 1,771 1,071 1,071
Equity securities - trading 10,818 10,818 8,591 8,591
Mortgage loans 10,028 10,028 11,054 11,054
Loans 5,063 5,063 4,523 4,523
Real estate 8,417 8,825 8,388 8,682
Other investments 3,562 3,562 3,733 3,733
Investments, general account 126,687 127,290 123,992 124,121
Investments, separate account 4,490 4,490 3,991 3,991
Total investments 131,177 131,780 127,983 128,112
of which Life & Pensions 109,857 110,224 105,018 104,923
of which Non-Life 21,320 21,556 22,965 23,189
Debt and Equity securities - trading include CHF 12,358 million (December 31, 2003: CHF 9,337 million) held to back unit-linked liabilities in the general account.
The following table illustrates held-to-maturity and available-for-sale securities of Life & Pensions and Non-Life:
2004 2003
Gross Gross Gross GrossAmortized unrealized unrealized Amortized unrealized unrealized
December 31, in CHF m cost gains losses Fair value cost gains losses Fair value
Debt securities - held-to-maturity 10,141 198 3 10,336 10,186 – 165 10,021
Debt securities - available-for-sale 67,914 4,035 1,012 70,937 69,546 2,671 893 71,324
Equity securities - available-for-sale 5,330 686 66 5,950 4,622 553 53 5,122
Securities - available-for-sale 73,244 4,721 1,078 76,887 74,168 3,224 946 76,446

Operating and financial review Corporate Center 79
Corporate CenterCorporate Center results include the parent company operations whichencompasses Group financing initiatives and income and expense itemsrelated to centrally managed, own-use real estate, mainly comprised of bankpremises within Switzerland. In addition, it includes consolidation andelimination adjustments.
The Corporate Center includes expenses for activities sponsored by the Group aswell as consolidation adjustments. Costs and revenues attributable to operatingbusinesses have been allocated to the respective segments. The Corporate Centertypically reports a loss from continuing operations before taxes, minority interests,extraordinary items and cumulative effect of accounting changes. A substantialportion of the movements on individual revenue and expense lines representconsolidation adjustments required to eliminate intercompany revenues andexpenses. A comparison of the Income/(loss) from continuing operations beforetaxes, minority interests, extraordinary items and cumulative effect of accountingchanges is therefore presented below as it reflects the results including eliminationentries with respect to revenues and expenses.
The following table shows the results of the Corporate Center:
Year ended December 31, in CHF m 2004 2003 2002
Net revenues (852) (739) (1,232)
Policyholder benefits, claims and dividends 0 (1) 1
Provision for credit losses 3 8 71
Total benefits, claims and credit losses 3 7 72
Insurance underwriting, acquisition and administration expenses (11) (8) (9)
Banking compensation and benefits 184 172 189
Other expenses (656) (447) (697)
Restructuring charges (1) 1 0
Total operating expenses (484) (282) (517)
Income/(loss) from continuing operations before taxes, minority interests,extraordinary items and cumulative effect of accounting changes (371) (464) (787)
Income tax expense/(benefit) (50) (128) (122)
Dividends on preferred securities for consolidated entities 0 133 133
Minority interests, net of tax (12) (1) 2
Income/(loss) from continuing operations before extraordinary itemsand cumulative effect of accounting changes (309) (468) (800)
Income/(loss) from discontinued operations, net of tax (1) 0 0
Extraordinary items, net of tax 0 0 1
Cumulative effect of accounting changes, net of tax (7) 0 0
Net income/(loss) (317) (468) (799)

Operating and financial review Corporate Center80
Year ended December 31, 2004 compared to year ended December 31, 2003The Corporate Center recorded a loss on the sale of a 19.9% stake in the privateequity activities of Warburg Pincus of CHF 157 million before tax (CHF 148 millionafter tax). This comprises a CHF 32 million loss compared to the carrying value atthe time of sale, and a foreign exchange loss of CHF 125 million previouslyrecognized as a reduction to equity.
Included in total operating expenses is an increase in professional fees associatedwith the above-mentioned sale of Warburg Pincus. Additionally, bankingcompensation and benefits have risen due to increased headcount resulting partiallyfrom the transfer of employees between segments.
Dividends on preferred securities for consolidated entities stood at zero in 2004,compared to CHF 133 million in 2003, due to the deconsolidation of the issuingentities. These securities were issued through wholly-owned special purposesubsidiaries in Guernsey, Channel Islands, that were established exclusively for thispurpose. In accordance with the provisions of FIN 46R, these entities weredeconsolidated during the first quarter of 2004.
Year ended December 31, 2003 compared to year ended December 31, 2002The loss from continuing operations before taxes, minority interests, extraordinaryitems and cumulative effect of accounting changes was CHF 464 million in 2003compared to CHF 787 million in 2002. This decrease was due primarily to losses onCorporate Center-held investments in 2002. In addition, provisions for credit lossesdecreased mainly due to two significant impairments recorded in 2002.

RISK MANAGEMENT
Principles
Protection of financial strength
Protection of reputation
Risk transparency
Management accountability
Independent oversight

Risk management82
RISK MANAGEMENT
OVERVIEW
Risk management principlesCredit Suisse Group’s business involves the prudent taking of risk. The primaryobjectives of the risk management strategy are to protect the financial strength andthe reputation of the Group. The Group’s risk management framework is based onthe following principles, which apply universally across all businesses and risk types.
– Protection of financial strength: Credit Suisse Group controls risk in order to limitthe impact of potentially adverse events on the Group’s capital and incomestreams. The Group’s risk appetite is to be consistent with its financial resources.
– Protection of reputation: The value of the Credit Suisse Group franchise dependson the Group’s reputation. Protecting a strong reputation is both fundamentaland an overriding concern for all staff members.
– Risk transparency: Risk transparency is essential so that risks are wellunderstood by senior management and can be balanced against business goals.
– Management accountability: The various segments are organized into businessunits that own the comprehensive risks assumed through their operations.Business unit management is responsible for the active management of theirrespective risk exposures and the return for the risks taken.
– Independent oversight: Risk management is a structured process to identify,measure, monitor and report risk. The risk management, controlling and legal andcompliance functions operate independently of the front office units to ensure theintegrity of the risk and control processes.
Risk management oversightRisk management oversight is performed at several levels of the organization. Keyresponsibilities lie with the following management bodies and committees.
Risk management oversight at the Board level– Group Board of Directors: Responsible to shareholders for the strategic direction,
supervision and control of the Group and for defining the Group’s overalltolerance for risk.
– Board of Directors of other Group legal entities: Responsible for the strategicdirection, supervision and control of the respective legal entity and for definingthe legal entity’s tolerance for risk.
– Risk Committees: Responsible for assisting the Board of Directors of the Groupand other Group legal entities in fulfilling their oversight responsibilities byproviding guidance regarding risk governance and the development of the riskprofile, including the regular review of major risk exposures and the approval ofrisk limits.
– Audit Committees: Responsible for assisting the Boards of Directors of the Groupand other Group legal entities in fulfilling their oversight responsibilities bymonitoring management’s approach with respect to financial reporting, internalcontrols, accounting, risk management and legal and regulatory compliance.Additionally, the Audit Committees are responsible for monitoring theindependence and the performance of the internal and external auditors.
– Internal auditors: Responsible for assisting the Boards of Directors, the AuditCommittees and management in fulfilling their responsibilities by providing an

83Risk management
objective and the effectiveness of control, risk management and governanceprocesses.
Risk management oversight at the Group management level– Group Executive Management (Group CEO, Group Executive Board Committee
and Group Executive Board): Responsible for implementing the Group’s strategy,managing the Group’s portfolio of businesses and managing the risk profile ofthe Group as a whole within the risk tolerance defined by the Group Board ofDirectors.
– Group Chief Risk Officer: Responsible for providing risk management oversightfor the Group as a whole in order to ensure that the Group’s aggregate riskappetite is consistent with its financial resources as well as the risk tolerancedefined by the Group Board of Directors. Additionally, risk management identifiesgroup-wide risk concentrations, reviews and ratifies high risk exposures andunusual or special transactions, ensures consistent and thorough riskmanagement practices and processes throughout the Group and recommendscorrective action if necessary.
– Group Risk Processes & Standards Committee (GRIPS): Responsible forestablishing and approving standards regarding risk management and riskmeasurement.
– Credit Portfolio & Provisions Review Committee: Responsible for reviewing thequality of the credit portfolio, with a focus on the development of impaired assetsand the assessment of related provisions and valuation allowances.
Risk management oversight at the business unit, segment and divisionmanagement level– Business unit Executive Management (Chief Executive Officers, Executive
Boards): Responsible for implementing the business unit’s strategy and activelymanaging its portfolio of businesses and its risk profile to ensure that risk andreturn are balanced and appropriate for current market conditions.
– Strategic Risk Management: At Credit Suisse and Credit Suisse First Boston,Strategic Risk Management is an independent function headed by the businessunit’s Chief Risk Officer with responsibility for assessing the overall risk profile ofthe business unit on a consolidated basis and for recommending corrective actionif necessary. At Winterthur, the respective responsibilities are assigned to theChief Risk Officer and the Chief Risk Officer Department.
– Credit Risk Management: At both Credit Suisse and Credit Suisse First Boston,Credit Risk Management is an independent function headed by the businessunit’s Chief Credit Officer with responsibility for approving credit limits,monitoring and managing individual exposures and assessing and managing thequality of the business unit’s credit portfolio.
– Credit Suisse Risk Management Committee (CS RMC): Responsible forsupervising and directing the Credit Suisse risk profile on a consolidated basis,for approving risk management policies, recommending risk limits to the CreditSuisse Board of Directors and its Risk Committee and establishing and allocatingrisk limits within Credit Suisse.
– Credit Suisse First Boston Capital Allocation and Risk Management Committee(CARMC): Responsible for supervising and directing the Credit Suisse FirstBoston risk profile on a consolidated basis, approving risk management policies,recommending risk limits to the Credit Suisse First Boston Board of Directorsand its Risk Committee and for establishing and allocating risk limits within CreditSuisse First Boston.

Risk management84
– Credit Suisse First Boston Operational Risk Review Committee: Responsible forreviewing and addressing operational risk issues at Credit Suisse First Boston.
– Winterthur Risk Management Committee (WGR RMC): Responsible forsupervising and directing the Winterthur risk profile on a consolidated basis,approving risk management policies, recommending risk limits to the WinterthurBoard of Directors and its Risk Committee and establishing and allocating risklimits within Winterthur.
– Winterthur Investment Committee: Responsible for defining the Winterthurinvestment strategy in light of Winterthur’s overall risk profile.
– Credit Suisse Asset and Liability Management Committee: Responsible forsupervising the development of the Credit Suisse banking segments’ balancesheets.
Risk management oversight: key management bodies and committees
WGRRisk Management
Committee (WGR RMC)
WGRInvestment Committee
CSRisk Management
Committee (CS RMC)
CSAsset and Liability
Management Committee
Capital Allocation and Risk
Management Committee
(CARMC)
Operational Risk
Review Committee
Credit Portfolio &
Provisions Review
Committee
Operational Risk
Steering Committee
Group Risk Processes &
Standards Committee
(GRIPS)
ERCSteering Committee
Anti-Money-Laundering
& Reputational Risk
Review Committee
ExB Vice ChairmanStrategic Risk Management
Chief Credit Officer
CFOStrategic Risk Management
Chief Credit Officer
CFO CRO
Board oversight
Key risk committees
Credit Suisse GroupBoard of Directors
CSFBBoard of Directors
Credit SuisseBoard of Directors
Winterthur Board of Directors
Audit Committee
Risk Committee
Audit Committee
Risk Committee
Audit Committee
Risk Committee
Risk CommitteeAudit Committee
Internal Audit
Group CEO
Group Executive Board & Group Executive Board Committee
CEOExecutive Board
CEOExecutive Board
CEOExecutive Board
Chief InvestmentOfficer
Key management bodies & key risk management functions
Head CC &General Counsel
Group CFO Group CROGroup Risk Management

85Risk management
Risk categoriesThe Group is exposed to many risks and differentiates between them using thefollowing eight major risk categories:
– Market risk – the risk of loss arising from adverse changes in interest rates,foreign currency exchange rates, equity prices and other relevant market ratesand prices, such as commodity prices and volatilities;
– Credit risk – the risk of loss arising from adverse changes in the creditworthinessof counterparties;
– Insurance risk – the risk that product pricing and reserves do not appropriatelycover claims expectations;
– Business risk – the risk that the businesses are not able to cover their ongoingexpenses with ongoing income subsequent to a severe crisis, excluding expenseand income items already captured by the other risk categories;
– Liquidity and funding risk – the risk that the Group or one of its businesses isunable to fund assets or meet obligations at a reasonable or, in case of extrememarket disruptions, at any price;
– Operational risk – the risk of loss resulting from inadequate or failed internalprocesses, people and systems or from external events;
– Strategy risk – the risk that the business activities are not responsive to changesin industry trends; and
– Reputation risk – the risk that the Group’s market or service image declines.
While most segments are exposed to all risk types, their relative significance varies.Group-wide risk management and measurement approaches are applied whereappropriate and meaningful.
Risk limitsFundamental to risk management is the establishment and maintenance of a soundsystem of risk limits to control the range of risks inherent in the business activities.The size of the limits reflects the Group’s risk appetite given the marketenvironment, the business strategy and the financial resources available to absorblosses.
Credit Suisse Group uses an Economic Risk Capital (ERC) limit structure to limitoverall position risk-taking. The level of risk incurred by the business units is furtherrestricted by specific limits with respect to trading exposures, the mismatch ofinterest-earning assets and interest-bearing liabilities at the banking segments,private equity and seed money investments, emerging market country exposures, theasset allocation of Winterthur and the reinsurance coverage of Winterthur. Within thebusiness units and segments, the risk limits are allocated to lower organizationallevels, numerous other limits are established to control specific risks and a system ofindividual counterparty credit limits is used to limit concentration risks.
ECONOMIC RISK CAPITAL
Introduction Economic capital represents current market best practice for measuring andreporting all quantifiable risks. It is called “economic” capital because it measuresrisk in terms of economic realities rather than regulatory or accounting rules. CreditSuisse Group uses an economic capital model – called ERC – as a consistent and

Risk management86
comprehensive risk management tool, which also forms an important element in thecapital management and planning process and an element in the performancemeasurement process.
As the Group’s standard for assessing risk, ERC considerably strengthens theGroup’s ability to manage its risk profile on a consolidated basis and to assess theaggregate risk appetite in relation to the financial resources. By providing a commonterminology for risk across the Group, ERC has also increased risk transparency andknowledge-sharing across the Group. As with other risk measures, the primary meritof ERC lies in its ability to provide meaningful signals regarding risk trends over time.In contrast, comparisons with other firms’ economic capital estimates are notmeaningful, as there are substantial variations across institutions in terms of thedefinition of economic capital, model coverage, assumptions, underlying data seriesand implementation specifics.
ConceptThe ERC model is designed to measure all quantifiable risks associated with theGroup’s activities on a consistent and comprehensive basis. It is based on thefollowing general definition: “Economic Risk Capital” is the economic capital neededto remain solvent and in business even under extreme market, business andoperational conditions, given the institution’s target financial strength (i.e. a creditrating, in the Group’s case, of AA).
Depending on the underlying source of risk, Credit Suisse Group distinguishesbetween three fundamental risk categories:
– Position risk ERC — the level of unexpected loss in economic value on theGroup’s portfolio of positions over a one-year horizon that is exceeded with agiven, small probability (1% for risk management purposes; 0.03% for capitalmanagement purposes).
– Operational risk ERC — the level of loss resulting from inadequate or failedinternal processes, people and systems or from external events over a one-yearhorizon that is exceeded with a small probability (0.03%). Estimating this type ofERC is inherently more subjective, and reflects both quantitative tools as well assenior management judgment.
– Business risk ERC — the difference between expenses and revenues in a severemarket event, exclusive of the elements captured by position risk ERC andoperational risk ERC.
Position risk ERC: This includes all risks associated with the Group’s positions,regardless of whether they translate into balance sheet exposures. The term positionrisk is not confined to the positions typically held by banks, but also includes therisks associated with the investment portfolios of the Winterthur entities as well asthe insurance underwriting risks incurred by the Winterthur entities. In order torepresent a comprehensive risk measure, ERC aims to reflect the underlying sourcesof risk in an integrated way. ERC therefore not only treats all financial positions on aconsistent economic basis, ignoring potential differences along other dimensions(e.g. in terms of their accounting treatment), but it also does not distinguish betweenmarket and credit risks in the conventional way. For example, while the foreignexchange risk associated with a rouble foreign exchange position is typically treatedas a market risk, it is considered an emerging market country risk in the ERC model,

87Risk management
because the underlying source of risk is from an emerging market country. Hence,ERC reflects the Group’s risk universe in a way that provides for an integratedmeasure based on the underlying source of risk, while maintaining sufficientgranularity to take account of the different modeling approaches needed to capturethe subtleties of the different businesses or risks.
While position risks constitute the most direct and significant source of risk for theGroup, ERC also takes account of more indirect risks to the Group’s financialresources. Although these indirect risks may not easily lend themselves toquantification (operational risk) or give rise to challenging conceptual issues(business risk), they can have a substantial impact on the Group and must thereforebe identified, addressed and reflected in the assessment of the Group’s solvency.
Operational risk ERC: While capital charges – either external or internal – do notrepresent an effective substitute for adequate management processes, the ability toabsorb operational risk-related losses is reflected in the ERC framework. Due to thelimitations of existing modeling techniques for operational risk (especially withrespect to “low frequency – high impact” operational risk events that are relevantfrom a capital and risk perspective), ERC estimates for operational risk are primarilyintended to integrate these risks into the overall capital process and to provide anadequate capital reserve for them. The quantitative approach is complemented byreviews performed by line specialists and senior management to reflect the context-specific nature of operational risk and to ensure the integration of qualitative aspectsderived from business experience.
Business risk ERC: An economic capital model should take account of the fact thatfinancial organizations do not simply represent warehouses of financial assets butalso act as originators and distributors of financial services. Origination, assetmanagement and advisory services have become important sources of firm-wideincome as well as firm-wide risks. Although there is widespread recognition that therisk and return characteristics of non-warehouse businesses have profoundimplications on the need for economic capital and the capacity to bear risks, noindustry consensus has emerged as to how exactly to alter the asset-basedeconomic capital calculations (e.g. based on Value-at-Risk type calculations) toreflect the non-warehouse businesses. Given the lack of consensus regarding theeconomic capital needs to cover business risk, Credit Suisse Group has adopted apragmatic approach. Specifically, the Group’s business risk ERC estimates aredesigned to measure the potential difference between expenses and revenues in asevere market event, excluding the elements captured by position risk ERC andoperational risk ERC, using conservative assumptions regarding the earningscapacity and the ability to reduce the cost base in a crisis situation.
ApplicationsERC represents Credit Suisse Group’s core top-level risk management tool. ERC isused to assess, monitor, report and limit risk exposures at all levels of theorganization. The Board of Directors and senior management at the Group and thebusiness units are regularly provided with ERC estimates, ERC trend information andsupporting explanations to create transparency on key risk exposures and to supportsenior management in managing risk.

Risk management88
ERC is also being used in the capital allocation process, which defines the businessunits’ capital requirement as the higher of Total ERC or “respectability capital,” whichis the minimum capital base a business needs in order to be accepted as a reliablebusiness partner or as defined by peer consideration. Moreover, ERC serves as areference point for the structured assessment of the Group’s aggregate risk appetitein relation to its financial resources, recognizing that a comprehensive analysis mustalso take into account factors that are outside the scope of the ERC framework (e.g.strategy, economic and competitive environment and external constraints such asthose imposed by regulators or rating agencies). Furthermore, ERC forms the basefor a performance metric that provides information on the return of a business inrelation to the total amount of ERC needed to support that business.
Key position risk trends 2004Over the course of 2004, the consolidated 1-year, 99% position risk ERC increasedby 3% year-on-year. The key movements in the major risk categories in 2004 wereas follows:
– Interest rate, credit spread and foreign exchange ERC: +4%, due to higher creditspread risk at Credit Suisse First Boston and higher interest rate risk in thebanking book of Credit Suisse, partially offset by lower foreign exchange risk atWinterthur;
– Equity investment ERC: +23%, due to an increase in Winterthur’s equityexposures, partially offset by lower equity risks at Credit Suisse, Credit SuisseFirst Boston and the Corporate Center;
– Swiss and retail lending ERC: –10%, due to the reduction in impaired loans atCorporate & Retail Banking and lower mortgage exposures at the Winterthurentities;
– International lending ERC: –9%, due to the impact of the lower US dollar rateused to translate Credit Suisse First Boston’s US dollar ERC into Swiss francsand reduced exposures at Winterthur;
The following table sets forth the Group’s risk profile, using ERC as the common risk denominator:
Credit Suisse Credit Suisse First Boston 1)
December 31, in CHF m 2004 2003 2002 2004 2003 2002
Interest rate, credit spread and FX ERC 488 301 306 1,667 1,573 1,320
Equity investment ERC 220 270 162 1,596 1,811 2,056
Swiss and retail lending ERC 1,559 1,725 1,944 0 0 0
International lending ERC 30 46 0 2,121 2,194 3,484
Emerging markets ERC 182 214 229 1,370 1,485 1,672
Real estate and structured asset ERC 3) 351 375 385 1,933 1,499 2,099
Insurance underwriting ERC 0 0 0 0 0 0
Simple sum across risk categories 2,830 2,931 3,026 8,687 8,562 10,631
Diversification benefit (791) (786) (733) (2,155) (2,110) (2,534)
Total position risk ERC 2,039 2,145 2,293 6,532 6,452 8,097
1-year, 99% position risk ERC, excluding foreign exchange translation risk. For an assessment of the total risk profile, operational risk ERC and business risk ERC need to beconsidered as well. Note that prior periods data have been restated for methodology changes in order to maintain consistency over time.
1) Note that Credit Suisse First Boston is managed using the USD as its base currency. Reported numbers have been translated into CHF using the respective year-endcurrency translation rates. The 1-year, 99% position risk ERC numbers for Credit Suisse First Boston expressed in USD are as follows: USD 5,770 m, USD 5,222 m and USD5,825 m as of December 31, 2004, 2003 and 2002, respectively. 2) Credit Suisse Group amounts include the Corporate Center, but are net of diversification benefitsbetween Credit Suisse, Credit Suisse First Boston, Winterthur and the Corporate Center (numbers therefore do not add up). 3) This category comprises the real estateinvestments of Winterthur, Credit Suisse First Boston’s commercial and residential real estate exposures, Credit Suisse First Boston’s asset-backed securities exposures, CreditSuisse’ real estate acquired at auction and the Credit Suisse, Credit Suisse First Boston, Winterthur and Corporate Center real estate for own use in Switzerland.

89Risk management
– Emerging markets ERC: –5%, mainly due to the impact of the lower US dollarrate used to translate Credit Suisse First Boston’s US dollar ERC into Swissfrancs, partially offset by higher exposures at Winterthur;
– Real estate & structured asset ERC: +14%, due to an increase in Credit SuisseFirst Boston’s commercial and residential real estate exposures;
– Insurance underwriting ERC: –6%, primarily due to changes in foreign exchangerates.
MARKET RISK
OverviewMarket risk is the risk of loss arising from adverse changes in interest rates, foreigncurrency exchange rates, equity prices and other relevant market parameters, suchas commodity prices and volatilities. The Group defines its market risk as potentialchanges in fair values of financial instruments in response to market movements. Atypical transaction may be exposed to a number of different market risks.
Credit Suisse Group assumes market risk primarily through trading activities in theInstitutional Securities segment of Credit Suisse First Boston and the risk exposuresembedded in the insurance segments’ balance sheets (investment portfolio andinterest rate risk associated with the insurance liabilities). Further market risks arisein the other businesses, but to a much lesser extent.
Trading and non-trading portfolios are managed at the business unit, segment anddivision level. The business units, segments and divisions use market riskmeasurement and management methods designed to meet or exceed industrystandards. The risk management techniques and policies are regularly reviewed toensure that the risks taken are captured and appropriately managed. The core toolsused to measure, monitor and limit market risks are the following:
Winterthur Credit Suisse Group 2)
2004 2003 2002 2004 2003 2002
2,914 3,349 3,101 4,224 4,045 3,541
1,454 967 1,554 3,001 2,447 3,869
90 100 152 1,649 1,825 2,095
37 176 258 2,188 2,416 3,742
309 253 83 1,862 1,952 1,983
1,371 1,341 1,479 3,607 3,161 3,920
656 695 944 656 695 944
6,831 6,881 7,571 17,187 16,541 20,094
(2,315) (2,455) (2,999) (5,305) (4,986) (6,659)
4,516 4,426 4,572 11,882 11,555 13,435

Risk management90
– The Value-at-Risk (VaR) method estimates the potential economic loss arisingfrom a given portfolio for a predetermined probability and holding period, usingmarket movements determined from historical data. The VaR methodology ismost useful for day-to-day risk monitoring in the context of “normal” markets.
– Scenario analysis estimates the potential loss after stressing market parameters.These changes are modeled on past extreme events and hypothetical scenarios.Scenario analysis is especially useful for assessing sensitivity to large pricemovements and for examining risk in cases where market conditions aredisrupted.
– All market risk exposures are also reflected in the Group’s ERC calculations.
The VaR and scenario analysis techniques are described in more detail at the end ofthis section under the heading How Credit Suisse Group measures market risk, theERC methodology is described in the section entitled Economic Risk Capital above.
In order to show the aggregate market risk inherent in the Group’s businesses, themarket risk exposures are presented on a Group consolidated level, using VaR andtaking into account diversification benefits across the businesses. The VaR estimatesalso take account of the impact of derivatives and other risk modification strategies,which the segments use to modify their exposure to market risks. The derivativeinstruments used in such hedging or trading activities primarily include forwards,options, futures, swaps and combinations of these instruments.
Our consolidated primary market risk exposures in the trading portfolios at December31, 2004, were to the interest rate category, which included exposures togovernment bonds, interest rate swaps and other interest rate sensitive exposures inthe trading portfolios such as exposures to credit spreads. Our consolidated primarymarket risk exposures in the non-trading portfolios at December 31, 2004, were tothe interest rate category, which included the interest rate exposures of theinsurance segments and the interest rate exposures in the banking books of thebanking segments.
Trading portfoliosRisk measurement and managementThe Group’s trading portfolios and the associated market risk exposures relate totrading activities primarily at the Institutional Securities segment and also the PrivateBanking and Corporate & Retail Banking segments. The other segments do notengage in trading activities.
Credit Suisse First Boston is active in most of the principal trading markets of theworld, using the majority of the common trading and hedging products, includingderivatives such as swaps, futures, options and structured products (which arecustomized transactions using combinations of derivatives and executed to meetspecific client or proprietary needs). As a result of its broad participation in productsand markets, Credit Suisse First Boston’s trading strategies are correspondinglydiverse and variable, and exposures are generally spread across a diversified rangeof risk factors and locations.
Credit Suisse is active in the Swiss trading market and – to a lesser extent – in otherprincipal trading markets. The trading portfolio includes a variety of tradinginstruments, such as bonds, swaps, options, structured products and products from

91Risk management
the alternative investment segment. Market risk is principally concentrated in equityexposures associated with inventory positions in structured investment products, forwhich Credit Suisse acts as secondary market maker.
The segments with trading book activity perform daily Value-at-Risk (VaR)calculations to assess their market risk exposure. The calculations are usually basedon a ten-day holding period with a 99% confidence level and risk movements thatare generally determined from two years of historical data. For some purposes, suchas backtesting, disclosure and benchmarking with competitors, the resulting VaRfigures are scaled down or calculated as one-day holding period values.
The segments with trading portfolios use backtesting to assess the accuracy of theVaR model. Daily backtesting profit and loss is compared to VaR with a one-dayholding period. Backtesting profit and loss is a subset of actual trading revenue andincludes only the profit and loss effects relevant to the VaR model, excluding suchitems as fees, commissions, certain provisions and any trading subsequent to theprevious night’s positions. It is appropriate to compare this measure with VaR forbacktesting purposes, since VaR assesses only the potential change in position valuedue to overnight movements in financial market variables such as prices, interestrates and volatilities. Backtesting is performed at various organizational levels, fromthe segment level down to more specific trading areas. On average, an accurateone-day, 99% VaR model should have no more than four backtesting exceptions peryear. A backtesting exception occurs when the daily loss exceeds the daily VaRestimate.
Development of trading portfolio risksThe table on page 92 shows the trading-related market risk exposure for CreditSuisse First Boston, Credit Suisse and Credit Suisse Group on a consolidated basis,as measured by scaled one-day, 99% VaR. Numbers are shown in Swiss francs.Institutional Securities measures trading book VaR using the US dollar as the basecurrency (the respective VaR figures were translated into Swiss francs using therespective month-end currency translation rates). VaR estimates are computedseparately for each risk type and for the whole portfolio using the historicalsimulation methodology. Diversification benefit reflects the net difference betweenthe sum of the 99th percentile loss for each individual risk type and for the totalportfolio.
Credit Suisse First Boston’s one-day, 99% VaR at December 31, 2004, was CHF59 million, compared to CHF 58 million at December 31, 2003. In US dollar terms,Credit Suisse First Boston’s one-day, 99% VaR increased 11% during the year2004 (USD 52 million at December 31, 2004, versus USD 47 million at December31, 2003). The increase in VaR primarily reflects changing market opportunities infixed income markets, in particular in the rates segment, as well as increasedposition taking in equity markets. These factors were partially offset by the rollout ofmarket volatility during 2002 leading to a more benign rolling two-year data set usedto determine VaR. The average VaR for Credit Suisse First Boston decreased slightlyfrom USD 52 million in 2003 to USD 51 million in 2004. During 2004, interest rateand equity exposures were higher in the first half of the year than in the second half,with the decrease in the second half of the year reflecting market volatility changesmentioned above.

Risk management92
Credit Suisse’ one-day, 99% VaR at December 31, 2004, was CHF 13 million,compared to CHF 14 million at December 31, 2003. The average one-day, 99%VaR in 2004 was CHF 12 million, compared to CHF 14 million in 2003. Thedecrease in the average VaR was mainly due to a larger diversification benefitbetween inventory positions in Structured Investment Products (SIP) and other equitypositions.
The following table sets forth the trading-related market risk exposure for Credit Suisse, Credit Suisse First Bostonand Credit Suisse Group on a consolidated basis, as measured by scaled one-day, 99% VaR:
2004 2003
in CHF m Minimum Maximum Average 31.12.04 Minimum Maximum Average 31.12.03
Credit Suisse
Interest rate and credit spread 2.7 9.2 4.1 4.5 1.1 7.9 3.2 4.7
Foreign exchange rate 1.7 6.9 2.8 3.8 1.2 5.7 2.5 2.0
Equity 5.2 30.4 9.6 9.5 8.7 20.0 12.9 12.7
Commodity 0.4 1.7 0.8 1.4 0.1 1.5 0.3 0.5
Diversification benefit – 1) – 1) (5.2) (6.4) – 1) – 1) (4.5) (6.4)
Total 6.8 32.8 12.1 12.8 10.1 20.8 14.4 13.5
Credit Suisse First Boston 2)
Interest rate and credit spread 36.6 94.4 55.7 44.6 31.0 167.0 67.6 58.2
Foreign exchange rate 8.6 31.1 17.9 18.2 7.2 28.3 15.0 15.9
Equity 21.5 53.1 34.8 35.4 16.7 52.0 26.4 23.6
Commodity 0.0 1.0 0.4 0.4 0.3 3.5 0.9 0.9
Diversification benefit – 1) – 1) (45.6) (39.5) – 1) – 1) (41.0) (40.3)
Total 40.9 104.5 63.2 59.1 35.1 157.5 68.9 58.3
Credit Suisse Group 3)
Interest rate and credit spread 38.6 73.9 54.8 46.8 36.9 119.5 64.7 58.9
Foreign exchange rate 10.9 20.6 15.7 19.4 10.9 24.3 15.6 16.8
Equity 23.6 48.4 37.1 39.2 17.2 47.3 27.3 24.9
Commodity 0.5 1.3 0.7 1.0 0.6 1.7 1.0 0.8
Diversification benefit – 1) – 1) (42.1) (43.5) – 1) – 1) (44.4) (45.3)
Total 41.8 91.3 66.2 62.9 45.5 99.9 64.2 56.1
Represents 10-day VaR scaled to a 1-day holding period.
1) As the minimum and maximum occur on different days for different risk types, it is not meaningful to calculate a portfolio diversification benefit. 2) The Credit Suisse FirstBoston VaR is calculated using the USD as the base currency. For the purpose of this disclosure, the Credit Suisse First Boston VaR estimates are translated into CHF usingthe respective currency translation rates. Specifically, the average, maximum and minimum daily VaR estimates in CHF are calculated using the respective month-end currencytranslation rate; the year-end VaR is calculated using the year-end currency translation rate. The underlying data for 2003 consists of month-end values (until March 31, 2003)and daily values (from April 1, 2003). 3) As Credit Suisse Group does not manage its trading portfolios on a consolidated level, the consolidated VaR estimates are performedon a monthly basis only and the VaR statistics for Credit Suisse Group therefore refer to monthly numbers. The consolidated VaR estimates for Credit Suisse Group are net ofdiversification benefits between Credit Suisse First Boston and Credit Suisse (numbers therefore do not add up).

93Risk management
VaR results and distribution of trading revenuesCredit Suisse First Boston had one backtesting exception in 2004, as evidenced inthe graph below. The graph illustrates the relationship between daily backtestingprofit and loss, which includes only the effects of the previous night’s positions, andthe daily one-day, 99% VaR for Credit Suisse First Boston in 2004. As noted above,it is appropriate to compare this measure with VaR for backtesting purposes.
The following histogram compares the trading revenues for 2004 with those for2003. The trading revenue shown in this graph is the actual daily trading revenue,which includes not only backtesting profit and loss but also such items as fees,commissions, certain provisions and the profit and loss effects associated with anytrading subsequent to the previous night’s positions.
Credit Suisse First Boston backtesting
Daily adjusted trading revenue 1-day VaR (99%)
100
50
0
-50
-100
in USD m
1Q 2004 2Q 2004 3Q 2004 4Q 2004
Frequency of trading revenue for Credit Suisse First Boston
Frequency of trading revenue 2004 Frequency of trading revenue 2003
70
65
60
55
50
45
40
35
30
25
20
15
10
5
0
< (
80)
(80)
– (
70)
(70)
– (
60)
(60)
– (
50)
(50)
– (
40)
(40)
– (
30)
(30)
– (
20)
(20)
– (
10)
(10)
– 0
0 –
10
10 –
20
20 –
30
30 –
40
40 –
50
50 –
60
60 –
70
70 –
80
80 –
90
90 –
100
100
– 11
0
110
– 12
0
120
– 13
0
130
– 14
0
140
– 15
0
150
– 16
0
160
>
Number of days
USD m

Risk management94
Non-trading portfoliosRisk measurement and managementThe market risks associated with the Group’s non-trading portfolios primarily relateto the risk exposures embedded in Winterthur’s balance sheet (investment portfolioand interest rate risk associated with the insurance liabilities) as well as – but to amuch lesser extent – the banking books of the banking segments.
The Group’s non-trading portfolios and the associated market risk exposures cover awide range of positions, including the banking segments’ banking book positions,such as asset and liability mismatch exposures, equity instrument participations andinvestments in bonds and money market instruments, as well as Winterthur’sinvestment portfolio and liabilities. All segments and the Corporate Center have non-trading portfolios that carry market risks. The market risks associated with the non-trading portfolios are measured, monitored and limited using several tools, includingERC, scenario analysis, sensitivity analysis and VaR. For the purpose of thisdisclosure, the aggregated market risks associated with the non-trading portfolios ofCredit Suisse Group are measured using VaR, taking into account the impact ofderivatives and other risk modification strategies. VaR for the non-trading activitiesmeasures the amount of potential change in economic value; it is not a measure forthe potential impact on reported earnings, since the non-trading activities generallyare not marked to market through earnings. Real estate investments and foreignexchange translation risks are not included in the following analysis.
Development of non-trading portfolio risksThe table below shows the non-trading related market risk exposure for CreditSuisse Group on a consolidated basis, as measured by scaled one-day, 99% VaR.Numbers are shown in Swiss francs. Institutional Securities measures the riskassociated with its non-trading portfolios using the US dollar as the base currency(the respective VaR figures were translated into Swiss francs using the respectivemonth-end currency translation rates). VaR estimates are computed separately foreach risk type and for the whole portfolio using the historical simulationmethodology. Diversification benefit reflects the net difference between the sum ofthe 99th percentile loss for each individual risk type and for the total portfolio.
Credit Suisse Group’s one-day, 99% VaR at December 31, 2004, was CHF 299million, compared to CHF 333 million at December 31, 2003. The average one-day,
The following table sets forth the non-trading market risk exposure for Credit Suisse Group, as measured by scaledone-day, 99% VaR:
2004 2003
in CHF m Minimum Maximum Average 31.12.04 Minimum Maximum Average 31.12.03
Interest rate and credit spread 170.6 271.2 198.1 182.5 124.7 218.2 173.9 124.7
Foreign exchange rate 43.4 125.3 83.7 56.3 92.7 206.8 138.0 109.3
Equity 137.2 241.1 203.7 168.1 210.1 341.0 287.4 210.1
Commodity 0.2 1.0 0.5 0.4 0.0 0.8 0.3 0.7
Diversification benefit – 1) – 1) (120.0) (108.5) – 1) – 1) (179.0) (111.6)
Total 265.8 441.7 366.0 298.8 333.2 560.8 420.6 333.2
Represents 10-day VaR scaled to a 1-day holding period. The VaR statistics refer to monthly numbers. The consolidated VaR estimates for Credit Suisse Group are net ofdiversification benefits between Credit Suisse First Boston, Credit Suisse, Winterthur and the Corporate Center.
1) As the minimum and maximum occur on different days for different risk types, it is not meaningful to calculate a portfolio diversification benefit.

95Risk management
99% VaR in 2004 was CHF 366 million, compared to CHF 421 million in 2003. Thedecrease in the average VaR was mainly due to lower foreign exchange risks atWinterthur as well as lower equity risks at the Corporate Center.
For Credit Suisse First Boston, the primary market risk exposure in the non-tradingportfolios at December 31, 2004, was to equity prices, principally due toinvestments in private equity funds. With respect to foreign exchange risks, CreditSuisse First Boston’s policy is to take neutral positions in foreign exchangeexposures (except for exposure to Swiss francs). This means that, to the extent thatis practical and possible, hedging instruments and other measures are used toeliminate the market risk resulting from changes in foreign exchange rates in non-trading portfolios. A similar approach is applied to the interest rate exposuresassociated with Credit Suisse First Boston’s long-term debt. Swaps, forward rateagreements and options are used as hedging instruments.
For Credit Suisse, the primary market risk exposure in the non-trading portfolios atDecember 31, 2004, was to interest rates. The interest rate risk exposures in thenon-trading portfolios include the impact of non-maturing banking products withvariable interest rates such as variable rate mortgages and savings deposits. Theinterest rate sensitivity of non-maturing banking products with variable interest ratesis estimated using the methodology of replicating portfolios. Based on the pastbehavior of interest rates and associated product balances, this methodology assignsthe position balance associated with a non-maturing banking product transaction witha variable interest rate to several time bands. These schedules can then be used tocalculate the transaction’s interest rate sensitivity.
For Winterthur, the primary market risk exposures in the non-trading portfolios atDecember 31, 2004, were to interest rates, foreign exchange rates and equityprices. The market risk exposures cover both the investment portfolio and theinsurance liabilities, which are reflected in the risk calculations on a fair value basis.The risk reduction to shareholders’ exposures provided by participating life contractsis reflected in this disclosure. For participating contracts, the policyholder shares inthe earnings or surplus of the insurance company through the distribution ofpolicyholder dividends. Therefore, policyholders and Life & Pensions shareholdersshare risk and reward.
For the Corporate Center, the primary market risk exposure in the non-tradingportfolios at December 31, 2004, was to equity prices, principally due to privateequity investments, and foreign exchange rates and interest rates.

Risk management96
CREDIT RISK FOR THE BANKING BUSINESSES
Definition of credit riskCredit risk is the possibility of loss incurred as a result of a borrower or counterpartyfailing to meet its financial obligations. In the event of a default, a bank generallyincurs a loss equal to the amount owed by the debtor, less any recoveries resultingfrom foreclosure, liquidation of collateral or the restructuring of the debtor company.
The majority of Credit Suisse Group’s credit risk is concentrated at Corporate &Retail Banking (within Credit Suisse) and Institutional Securities (within Credit SuisseFirst Boston). The credit risks taken on by Private Banking are mostly collateralizedand primarily have an operational risk nature. Credit risk exists within lendingproducts, commitments and letters of credit, and results from counterparty exposurearising from derivative, foreign exchange and other transactions.
Credit risk management approachEffective credit risk management is a structured process to assess, quantify, price,monitor and manage risk on a consistent basis. This requires careful consideration ofproposed extensions of credit, the setting of specific limits, diligent ongoingmonitoring during the life of the exposure, active use of credit mitigation tools and adisciplined approach to recognizing credit impairment. All of these elements areintegral parts of the Group’s approach.
This credit risk management framework is regularly refined and covers all bankingbusinesses that are exposed to credit risk. The framework is designed to covervirtually all of the credit exposures in the banking business and comprises seven corecomponents:
– An individual counterparty and country rating system; – A transaction rating system; – A counterparty credit limit system;– Country and regional concentration limits;– A risk-based pricing methodology;– Active credit portfolio management; and– A credit risk provisioning methodology.
The Group evaluates credit risk through a credit request and approval process,ongoing credit and counterparty monitoring and a credit quality review process.Experienced credit officers prepare credit requests and assign internal ratings basedon their analysis and evaluation of the clients’ creditworthiness and the type of credittransaction. The analysis emphasizes a forward looking approach, concentrating oneconomic trends and financial fundamentals. In addition, analysts make use of peeranalysis, industry comparisons and other quantitative tools. The final rating alsorequires the consideration of qualitative factors relating to the counterparty, itsindustry and management. Credit Suisse Group has established a counterparty creditrisk classification system with which counterparties are rated and classified on aregular basis. This system affords consistency in (i) statistical and other credit riskanalysis; (ii) credit risk monitoring; (iii) risk-adjusted performance measurement; and(iv) economic risk capital usage/allocation. It is also used for certain financialaccounting purposes.
97Risk management
Each counterparty that generates a potential or actual credit risk exposure isassigned to a risk rating class. Additionally, the Group assigns an estimate of theexpected loss on a transaction in the event of a counterparty default, based on thetransaction structure. The counterparty credit rating is used in combination withcredit (or credit equivalent) exposure and the loss given default assumption toestimate the potential credit loss. These inputs allow the Group to price transactionsinvolving credit risk more accurately, based on risk/return estimates. Pricing and theterms of the credit extension are sensitive to many of the credit risk factorsdescribed in this section, and are intended to reflect more accurately the situation ofthe borrower as well as the Group’s interests and priorities in negotiating the credit.
Credit committees and senior credit managers make credit decisions on atransaction-by-transaction basis, determined by levels appropriate to the amount andcomplexity of the transactions, as well as based on the overall exposures tocounterparties and their related entities. These approval authority levels are set outwithin the governing principles of the legal entities.
A system of individual credit limits is used to manage individual counterparty creditrisk. Certain other limits are also established to address concentration issues in theportfolio, including a comprehensive set of country and regional limits and limits forcertain products. Credit exposures to individual counterparties or segments andadherence to the related limits are monitored by credit officers, industry analysts andother relevant specialists. In addition, credit risk is regularly supervised by credit andrisk management committees taking current market conditions and trends analysisinto consideration. Credit Suisse Group regularly analyzes its industry diversificationand concentration in selected segments.
A rigorous credit quality review process has been established to provide an earlyidentification of possible changes in the creditworthiness of clients and includesregular asset and collateral quality reviews, business and financial statement analysisand relevant economic and industry studies. Other key factors considered in thereview process include business and economic conditions, historical experience,regulatory requirements and concentrations of credit volume by industry, country,product and counterparty rating. Regularly updated watch-lists and review meetingsare used for the identification of counterparties where adverse changes increditworthiness could occur due to events such as announced mergers, earningsweakness, and lawsuits. In addition, credit protection, such as credit derivatives, isused in particular to mitigate certain exposures.
The review process culminates in a quarterly determination of the appropriateness ofallowances for credit losses. A systematic provisioning methodology is used toidentify potential credit risk-related losses. Impaired transactions are classified aspotential problem exposure, non-performing exposure or non-interest earningexposure and the exposures are generally managed within credit recovery units. Therisk management and credit committees of the segments and the Group determinethe adequacy of allowances, taking into consideration whether the levels aresufficient for credit losses and whether allowances can be released or if they shouldbe increased.

Risk management98
The following table sets forth the gross loan exposure:
Credit Suisse Credit Suisse First Boston Credit Suisse Group 1)
December 31, in CHF m 2004 2003 2004 2003 2004 2003
Consumer loans
Mortgages 67,119 61,196 0 0 75,604 69,856
Loans collateralized by securities 15,018 14,376 0 0 15,022 14,379
Other 2,319 2,338 540 1,172 2,859 3,511
Consumer loans 84,456 77,910 540 1,172 93,485 87,746
Corporate loans
Real estate 26,135 27,122 613 188 28,124 28,589
Commercial and industrial loans 33,126 32,260 13,501 13,859 47,585 47,956
Loans to financial institutions 6,279 6,347 5,351 4,473 13,726 12,847
Governments and public institutions 1,898 1,637 402 1,152 4,401 4,581
Corporate loans 67,438 67,366 19,867 19,672 93,836 93,973
Loans, gross 151,894 145,276 20,407 20,844 187,321 181,719
(Unearned income)/deferredexpenses, net 142 131 (32) (25) 116 106
Allowance for loan losses (2,438) (3,113) (533) (1,383) (3,038) (4,646)
Total loans, net 149,598 142,294 19,842 19,436 184,399 177,179
This disclosure presents the lending exposure of the Group from a risk management perspective. This presentation differs from other disclosures in this document.
1) Consolidated numbers, including Winterthur.
LoansFurther information on the lending portfolio of Credit Suisse and Credit Suisse FirstBoston distributed across internal rating classifications is presented below.

99Risk management
Risk mitigationCredit Suisse First Boston actively manages its credit exposure utilizing credithedges and cash and marketable securities for risk mitigation. “Credit hedges”represent the notional exposure that has been transferred to high grade marketcounterparties, generally through the use of credit default swaps. Credit hedges arenot available for many of the Credit Suisse counterparties; however, a large portionof the lending portfolio of Credit Suisse is secured with collateral that can readily beliquidated, primarily cash and marketable securities. The tables below illustrate theeffects of risk mitigation on loans and undrawn irrevocable credit facilities.
The following table outlines the risk mitigation impact for Credit Suisse:
Risk mitigation
Cash andGross Credit marketable Net
December 31, 2004, in CHF m exposure hedges securities exposure
Internal ratings
AAA 0 0 0 0
AA 12,041 0 (1,611) 10,430
A 23,526 0 (3,375) 20,151
BBB 179,692 (143) (58,057) 121,492
BB 0 0 0 0
B 15,175 0 (5,400) 9,775
CCC 2,327 0 (344) 1,983
CC 0 0 0 0
C 0 0 0 0
D 3,619 0 (76) 3,543
Total 236,380 (143) (68,863) 167,374
The following table outlines the risk mitigation impact for Credit Suisse First Boston:
Risk mitigation
Cash andGross Credit marketable Net
December 31, 2004, in CHF m exposure hedges securities exposure
Internal ratings
AAA 9,495 0 (138) 9,357
AA 9,974 (400) 0 9,574
A 24,052 (4,544) (278) 19,230
BBB 19,196 (6,354) (1,300) 11,542
BB 9,180 (1,954) (306) 6,920
B 8,809 (894) (249) 7,666
CCC 892 (119) (23) 750
CC 277 0 0 277
C 330 0 0 330
D 2,543 (19) (7) 2,517
Total 84,748 (14,284) (2,301) 68,163

Risk management100
Loss given defaultThe tables below present loans, net of risk mitigation, of Credit Suisse and CreditSuisse First Boston, spread across loss given default (LGD) buckets. LGDrepresents the expectation of the extent of loss on a transaction should defaultoccur and takes into account structure, collateral, seniority of the claim and incertain segments, the type of counterparty. LGD estimates have been developedseparately by Credit Suisse and Credit Suisse First Boston reflecting historicalexperience. The concentration in BBB rated counterparties with low LGDassumptions at Credit Suisse largely reflects its residential mortgage business, whichhas a low expected loss. The majority of net loans at Credit Suisse First Boston aresenior unsecured which have an expected LGD of 50%.
The following table shows an overiew of loss given default for Credit Suisse:
Loss given default buckets
Fundednet
December 31, 2004, in CHF m exposure 0-10% 11-20% 21-40% 41-60% 61-80% 81-100%
Internal ratings
AAA 0 0 0 0 0 0 0
AA 9,519 8,556 1 0 27 236 699
A 17,179 14,298 538 2 65 34 2,242
BBB 91,506 26,462 24,975 21,945 7,525 347 10,252
BB 0 0 0 0 0 0 0
B 4,878 117 113 621 3,834 12 181
CCC 1,179 1 15 422 146 554 41
CC 0 0 0 0 0 0 0
C 0 0 0 0 0 0 0
D 3,534 4 286 3 191 2,103 947
Total 127,795 49,438 25,928 22,993 11,788 3,286 14,362
The following table shows an overiew of loss given default for Credit Suisse First Boston:
Loss given default buckets
Fundednet
December 31, 2004, in CHF m exposure 0-10% 11-20% 21-40% 41-60% 61-80% 81-100%
Internal ratings
AAA 1,934 0 0 134 1,800 0 0
AA 1,879 84 0 7 1,778 0 10
A 1,260 2 0 14 1,244 0 0
BBB 1,579 0 0 90 1,399 90 0
BB 3,634 76 0 2,034 1,524 0 0
B 3,269 2 0 1,737 1,528 2 0
CCC 570 0 0 210 217 8 135
CC 247 0 0 223 24 0 0
C 289 0 0 22 256 11 0
D 888 0 0 167 721 0 0
Total 15,549 164 0 4,638 10,491 111 145
101Risk management
Non-performing loansA loan is considered impaired when the Group believes it will be unable to collect allprincipal and/or interest in accordance with the contractual terms of the loanagreement. A loan is automatically classified as non-performing when the contractualpayments of principal and/or interest are in arrears for 90 days. A loan can also beclassified as non-performing if the contractual payments of principal and/or interestare less than 90 days past due, based on the judgment of the respective creditofficer. Credit Suisse Group continues to accrue interest for collection purposes;however, a corresponding provision against the accrual is booked through the incomestatement. In addition, for any accrued but unpaid interest at the date the loan isplaced on non-performing status, a corresponding provision is booked against theaccrual through the income statement. At the time a loan is placed on non-performing status and on a periodic basis going forward, the remaining principal isevaluated for collectibility and an allowance is established for the shortfall betweenthe net recoverable amount and the remaining principal balance.
A loan can be further downgraded to non-interest earning when the collection ofinterest is in such a doubtful state that further accrual of interest is deemedinappropriate. At that time and on a periodic basis going forward, any unreservedremaining principal balance is evaluated for collectibility and an additional provision isestablished as required. A write-off of a loan occurs when the Group is certain thatthere is no possibility to recover the principal. Write-offs also occur due to sales,settlements or restructurings of loans or when uncertainty as to the repayment ofeither principal or accrued interest exists.
Generally, a loan may be restored to performing status when all delinquent principaland interest payments become current in accordance with the terms of the loanagreement and certain performance criteria are met. Credit Suisse Group appliesthese policies worldwide.
Total non-performing and Total impaired loans declined substantially for Credit SuisseGroup in 2004, with Total non-performing loans declining CHF 1.7 billion as ofDecember 31, 2004, in comparison with December 31, 2003, and Total otherimpaired loans declining CHF 841 million. Notable reductions were reported at bothCredit Suisse and Credit Suisse First Boston and were attributable to the improvedcredit environment, settlements and recoveries. Coverage of Total non-performingloans by valuation allowances increased at Credit Suisse Group and Credit SuisseFirst Boston, but declined slightly at Credit Suisse. Coverage of total impaired loansimproved at Credit Suisse and Credit Suisse First Boston.
Potential problem loansAt December 31, 2004 and 2003, the Group had potential problem loans amountingto CHF 1.5 billion and CHF 2.2 billion, respectively. These loans are consideredpotential problem loans because, although interest payments are being made, thereexists some doubt in the credit officer’s judgment as to the timing and/or certaintyof the repayment of contractual principal.

Risk management102
Credit provisions The Group maintains valuation allowances on loans that it considers adequate toabsorb losses arising from the existing credit portfolio. Valuation allowances arededucted from total assets, while provisions are included in total liabilities. CreditSuisse Group provides for credit losses based on a regular and detailed analysis ofevery counterparty, taking collateral value into consideration. If uncertainty exists asto the repayment of either principal or interest, a valuation allowance is eithercreated or adjusted accordingly. Each business unit creates valuation allowancesbased on Group guidelines. Credit provisions are reviewed on a quarterly basis bysenior management at both the segment and the Group level.
In determining the amount of the credit provisions, loans are assessed on a case-by-case basis, and the following factors are considered:
– The financial standing of a customer, including a realistic assessment – based onfinancial and business information – of the likelihood of repayment of the loanwithin an acceptable period of time considering the net present value of futurecash flows;
– The extent of the Group’s other commitments to the same customer; – The realizable fair value of any collateral for the loans; – The recovery rate; and– The costs associated with obtaining repayment and realization of any such
collateral.
Judgment is exercised in determining the extent of the valuation allowance and isbased on management’s evaluation of the risk in the portfolio, current economicconditions, recent loss experience, and credit and geographic concentration trends.Vulnerable sectors continue to be tracked and monitored closely, with activemanagement leading to the requirement of collateral, the purchase of creditprotection facilities and/or the tightening of credit terms or maturities whereappropriate.
Loan valuation allowances and provisions for inherent credit losses The inherent loss allowance is estimated for all loans not specifically identified asimpaired, which on a portfolio basis, are considered to contain probable inherent
The following table sets forth the impaired loan portfolio:
Credit Suisse Credit Suisse First Boston Credit Suisse Group 1)
December 31, in CHF m 2004 2003 2004 2003 2004 2003
Non-performing loans 1,481 1,917 268 996 1,771 2,977
Non-interest earning loans 1,259 1,517 9 246 1,281 1,769
Total non-performing loans 2,740 3,434 277 1,242 3,052 4,746
Restructured loans 95 24 17 256 117 283
Potential problem loans 1,077 1,641 355 361 1,503 2,178
Total other impaired loans 1,172 1,665 372 617 1,620 2,461
Total impaired loans 3,912 5,099 649 1,859 4,672 7,207
Valuation allowances as % of
Total non-performing loans 89.0% 90.7% 192.4% 111.4% 99.5% 97.9%
Total impaired loans 62.3% 61.1% 82.1% 74.4% 65.0% 64.5%
1) Consolidated numbers, including Winterthur.

103Risk management
The following table sets forth the movements in the provisions for credit losses:
Credit Suisse Credit Suisse First Boston Credit Suisse Group 1)
in CHF m 2004 2003 2004 2003 2004 2003
Balance January 1 3,113 4,030 1,383 3,268 4,646 7,427
New provisions 422 913 381 750 816 1,686
Releases of provisions (300) (503) (419) (567) (737) (1,071)
Net additions charged to income statement 122 410 (38) 183 79 615
Gross write-offs (861) (1,383) (839) (1,950) (1,781) (3,333)
Recoveries 25 32 32 17 58 48
Net write-offs (836) (1,351) (807) (1,933) (1,723) (3,285)
Allowances acquired 0 2 (24) 25 (24) 26
Provisions for interest 30 29 62 126 92 155
Foreign currency translation impactand other adjustments, net 9 (7) (43) (286) (32) (292)
Balance December 31 2,438 3,113 533 1,383 3,038 4,646
1) Consolidated numbers, including Winterthur.
loss. Inherent losses in the consumer portfolio are determined by applying ahistorical loss experience, adjusted to reflect current market conditions, tounimpaired homogenous pools based on risk rating and product type. Commercialloans are segregated by risk, industry or country rating in order to estimate theinherent losses. Inherent losses on loans and lending-related commitments areestimated based on historical loss and recovery experience and recorded in Valuationallowances and provisions. A provision for inherent loss for off-balance sheet lendingrelated exposure (contingent liabilities and irrevocable commitments) is alsocomputed, using a methodology similar to that used for the loan portfolio.
Summary of loan valuation allowance experienceNet additions to the loan valuation allowance in 2004 were CHF 79 million, an 87%reduction from the net additions reported for 2003. The level of net additions to loanvaluation allowances was lower due to a significant reduction in new valuationallowances as a result of the improved credit environment as well as the release ofvaluation allowances no longer required.
In 2004, gross write-offs declined 47% for the Group. Gross write-offs decreased atCredit Suisse First Boston in comparison to 2003, due to a sizeable write-off in2003 of older highly covered loans. Gross write-offs also declined at Credit Suisse.
INSURANCE RISK
IntroductionProtecting Winterthur from insurance risk accumulations, such as natural catastropheexposure, is a core risk management activity performed within the insurancebusiness. Premiums earned by selling insurance policies are invested to cover claimsoccurring at a future date, sometimes many years later. Therefore, Winterthur strivesto:
– Manage and limit insurance risk, e.g. by using reinsurance contracts;

Risk management104
– Manage the financial market risks associated with the assets and liabilities(reserves); and
– Manage and control the risks associated with their respective assets and reinsurancecontracts.
Asset accumulation by insurance companies results predominantly from premiums beingpaid earlier than claims are settled. The resulting time differences, which may exceed50 years for annuity business, have implications for risk management. First, funds haveto be invested in assets in such a way that they generate cash flows in line with theanticipated cash outflows embedded in the liability structure. Second, product-specificcharacteristics, such as maturity, profit participating bonuses and inflation-dependentinsurance claims, must be treated appropriately.
Risk structure in the insurance businessWinterthur follows stringent guidelines for assuming insurance risk, the selection of risksand the sums insured. The insurance businesses face several risk types stemming fromtheir insurance underwriting activities.
Non-LifeIn non-life business, insurance risk relates to claims which may be more frequent orlarger than forecast, and/or which may have to be paid earlier than expected. Premiumlevels are developed considering the expected frequency and amounts of claimsresulting from insured risks. Since better diversified insurance portfolios tend to implysmaller differences between expected and actual claims, Non-Life holds a diversifiedinsurance portfolio in terms of both geographic and industry structure.
A well-diversified insurance portfolio with many business lines spread over manypolicyholders might, nevertheless, be vulnerable to natural hazards. In suchcircumstances, the portfolios, although well-diversified, can be exposed to a largeaccumulation of risk. If adequate reinsurance protection were not in place, substantiallosses could be triggered by a single natural catastrophe. Non-Life therefore usesreinsurance to limit the loss triggered by a single event. In 2004, reinsurance treaties inplace in Europe covered losses exceeding CHF 50 million up to a limit of CHF 225million, which corresponds to a one in 100 years catastrophe event. For North America,reinsurance treaties covered losses exceeding USD 25 million (USD 15 million lossdeductible plus an additional yearly aggregate deductible of USD 10 million) up to a limitof USD 125 million, which corresponds to a one in 250 years catastrophe event.
LifeIn life insurance the basic insurance risk characteristics are similar to those in the non-life business. The insurance risk in the life business includes deviations from expectedmortality, disability and longevity and expected surrender rates. Life insurance riskmanagement consists of product profit testing and monitoring, product portfoliodiversification and reinsurance.
ReinsuranceThe non-life and life insurance businesses require specific levels of reinsurance toprotect their business and capital. Reinsurance protection covers all levels of theorganization. A global reinsurance program protects Winterthur against catastropheevents and limits the potential for losses arising from large risks. This reinsuranceincludes a set of internal and external reinsurance contracts to absorb all risks thatexceed a prudent risk retention level. Reinsurance protection follows the Winterthurorganizational structure based on the principle that each organizational entity runs

105Risk management
insurance risk in accordance with its portfolio and its capital base. Winterthur hasestablished specific guidelines regarding the quality and rating of its reinsurancecounterparties.
BUSINESS RISK
Business risk is the risk that the Group’s non-position-related revenues could fall shortof ongoing expenses, which could occur in the event of a major market contraction.Business risk excludes the revenue and expense elements captured by the other riskcategories.
The ability to cover the expense base after an adverse event is crucial for an orderlycontinuation of the Group’s activities – possibly on a reduced level – in the event of afinancial crisis. While many economic capital models do not include this risk, CreditSuisse Group believes that it is prudent to consider this risk when assessing theGroup’s capital needs.
Business risk is linked to the price and activity levels in the financial markets. The pricelevel in the financial markets is relevant for the fee and commission income derived fromthe management of clients’ investment portfolios. The activity level in financial marketsis the key driver for brokerage commissions, underwriting commissions and advisoryfees. Business risk varies across the Group’s segments, depending on the cost/incomeratio, the likely stability of the revenue stream and the ability to reduce expenses in acrisis.
LIQUIDITY AND FUNDING RISK
Liquidity and funding risk is the risk that the Group will not be able to fund assets ormeet obligations at a reasonable or, in case of extreme market disruptions, at any price.This risk is managed at the business unit level – in line with Credit Suisse Group’sgeneral governance principles – which allows a specifically tailored approach to theindividual cash flow structure within the business units. The Group works in closepartnership with the business units to identify, measure and monitor this risk and tofoster sound liquidity management practices across the Group.
Credit Suisse Group manages its funding requirements based on business needs,regulatory requirements, rating agency criteria, tax, capital, liquidity and otherconsiderations. Although the Group operates through separate business units, liquidityneeds must be satisfied on a Credit Suisse Group consolidated basis and, in the case ofbanking units, on both a consolidated and legal entity basis. Winterthur legal entitiesmust satisfy liquidity requirements under insurance laws. Accordingly, Credit SuisseGroup – as obligor or guarantor for a range of finance subsidiaries in variousjurisdictions – and Credit Suisse First Boston, Credit Suisse and Winterthur, at the legalentity level, have independent sources of funding. The primary responsibility formeasuring and managing funding requirements lies with these legal entities and therespective business units.
Structures and processes are in place at the legal entity and business unit levels tomanage the relevant liquidity risks and to ensure appropriate liquidity profiles undervarious stress scenarios. Liquidity management at the business unit level is reinforcedby coordination at the Group level. Practices regarding market access, such as

Risk management106
diversification of liabilities and investor relations, are reviewed at the Group level. Inaddition, the Group sets the framework for contingency planning, including proceduresto ensure that information flow remains timely and uninterrupted and that division ofresponsibility remains clear.
OPERATIONAL RISK
Operational risk is the risk of loss resulting from inadequate or failed internal processes,people and systems or from external events. The Group’s primary aim is the earlyidentification, recording, assessment, monitoring, prevention and mitigation ofoperational risks, as well as timely and meaningful management reporting. Whereappropriate, the Group transfers operational risks to third-party insurance companies.Credit Suisse Group’s business units have put in place business continuity plans toensure the maintenance of core business processes and the resumption of ordinarybusiness activity.
Operational risk is inherent in most aspects of the Group’s activities and comprises alarge number of disparate risks. While market and credit risk are often chosen for theprospect of gain, operational risk is normally accepted as a necessary consequence ofdoing business. In comparison to market or credit risk, the sources of operational riskare difficult to identify comprehensively and the amount of risk is also intrinsicallydifficult to measure. The Group therefore manages operational risk differently frommarket and credit risk. The Group believes that effective management of operationalrisks requires ownership by the management responsible for the relevant businessprocess. Operational risk is thus controlled through a network of controls, procedures,reports and responsibilities. Within the Group, each individual department andmanagement level takes responsibility for its own operational risks and providesadequate resources and procedures for the management of those risks.
Each business unit takes responsibility for its own operational risks and has a dedicatedcentral Operational Risk function. These functions act independently but in concert withthe relevant departments to control and coordinate the management of operational riskacross the relevant business unit. They are responsible for the development andimplementation of policies and methodologies for management, measurement,monitoring and reporting of relevant operational risks.
Regular Group-wide meetings take place to promote a common understanding ofpriorities and to foster a dialogue between the Corporate Center and the business units.Knowledge and experience are shared throughout the Group to maintain a coordinatedapproach.
Credit Suisse Group continues to enhance its operational risk framework. The keyinitiatives in 2004 included:
– Further enhancements of the global and regional governance structure for managingoperational risk;
– Establishing a senior management committee to periodically review operational riskERC;
– Rolling out the scenario-based operational risk ERC determination to WinterthurGroup;
– Continued refinement of the ERC and allocation methodologies for operational risk inCredit Suisse and Credit Suisse First Boston;

107Risk management
– Further developments of global and regional Key Risk Indicator (“KRI”) reporting atbusiness unit level;
– Preparing the operational risk management and measurement framework for thecompliance requirements of the Advanced Measurement Approach within Basel II;
– Refining operational risk loss collation policies and processes and the initiation of aquarterly operational risk loss data reporting to the Group’s home supervisor; and
– Regular review of the state of operations and their inherent risks based on extensiveaudits and follow-up reviews, and the resulting use of information and analysis asearly-warning indicators for potential issues.
HOW CREDIT SUISSE GROUP MEASURES MARKET RISK
IntroductionEach of the segments uses market risk measurement and management methodologiesdesigned to meet or exceed industry standards. These include both general toolscapable of calculating comparable exposures across the Group’s many activities as wellas focused tools that can specifically model unique characteristics of certain units’functions. The tools are used for internal market risk management, internal market riskreporting and external disclosure purposes. The principal measurement methodologiesare VaR and scenario analysis. Additionally, the market risk exposures are also reflectedin the Group’s ERC calculations. VaR and scenario analysis are described in thefollowing paragraphs; the ERC methodology is described in the section above entitledEconomic Risk Capital.
Value-at-RiskVaR measures the potential loss in terms of fair value changes over a given time intervalunder normal market conditions at a given confidence level. VaR as a concept isapplicable for all financial risk types with valid regular price histories. Positions areaggregated by risk type rather than by product. For example, interest rate risk includesrisk arising from money market and swap transactions, bonds, and interest rate, foreignexchange, equity and commodity options. The use of VaR allows the comparison of riskin different businesses, such as fixed income and equities, and also provides a means ofaggregating and netting a variety of positions within a portfolio to reflect actualcorrelations and offsets between different assets.
The history of financial market rates and prices serves as a basis for the statistical VaRmodel underlying the potential loss estimation. All of the Group’s segments that modeltheir trading portfolios with VaR use a 10-day holding period and a confidence level of99% calculated using, in general, a rolling two-year history of market data. Theseassumptions are in agreement with the “Amendment to the Capital Accord toIncorporate Market Risks” published by the Basel Committee on Banking Supervision in1996 and other related international standards for market risk management. For somepurposes, such as backtesting, disclosure and benchmarking with competitors, theresulting VaR figures are scaled down or calculated as one-day holding period values.
The Credit Suisse First Boston VaR model was originally approved by the Swiss FederalBanking Commission (FBC) for use in the calculation of Credit Suisse First Bostontrading book market risk capital in 1998. This approval followed extensive reviews in1997 by Credit Suisse First Boston of the previous variance-covariance model and therelated processes and controls. With the introduction of the historical simulation modelthe FBC re-examined and re-approved the VaR model and related processes and

Risk management108
controls for this purpose during the first half of 2000. Credit Suisse First Bostoncontinues to receive regulatory approval for ongoing enhancements to the methodology.In 2004, Credit Suisse VaR model was approved by the FBC for use in the calculationof Credit Suisse trading book market risk capital.
AssumptionsThe Group’s segments with trading portfolios use a historical simulation model for themajority of risk types and businesses. Where insufficient data is available for such anapproach, an extreme move methodology is used. The model is based on the profit andloss distribution resulting from the historical changes of market rates applied to evaluatethe portfolio using, in general, a rolling two-year history. This methodology also avoidsany explicit assumptions on correlation between risk factors.
LimitationsVaR as a risk measure quantifies the potential loss on a portfolio under normal marketconditions only. It is not intended to cover losses associated with unusually severemarket movements (these are covered by scenario analysis). VaR also assumes that theprice data from the recent past can be used to predict future events. If future marketconditions differ substantially from past market conditions, then the risk predicted byVaR may be too conservative or too liberal.
Scenario analysisAll businesses exposed to market risk regularly perform scenario analysis to estimatethe potential economic loss that could arise from extreme, but plausible, stress events.The scenario analysis calculations performed by the businesses are specifically tailoredtowards their respective risk profile. In order to identify areas of risk concentration andpotential vulnerability to stress events across the Group, the Group has developed a setof scenarios, which are consistently applied across all businesses. Key scenarios includesignificant movements in interest rates, equity prices and exchange rates, as well asadverse changes in counterparty default rates. In 2004, the Group refined its scenarioanalysis framework by extending the set of scenarios analyzed and by estimating theimpact of the various scenarios on key capital adequacy measures such as regulatorycapital and economic capital ratios. The Board of Directors and senior management atthe Group and the business units are regularly provided with scenario analysisestimates, scenario analysis trend information and supporting explanations to createtransparency on key risk exposures and to support senior management in managingrisk.
AssumptionsScenario analysis estimates the impact that could arise from extreme, but plausible,stress events by applying predefined scenarios to the relevant portfolios. Scenarioanalysis represents a “what-if” measure for risk, as no attempt is made to estimate theprobability of occurrence. Scenarios are typically defined in light of past economic orfinancial market stress periods.
LimitationsScenario analysis estimates the loss that could arise if specific events in the economy orin financial markets were to occur. Seldom do past events repeat themselves in theexact same way. Therefore, it is necessary to use business experience to choose a setof meaningful scenarios and to assess the scenario results in light of current economicand market conditions.

FINANCIAL INFORMATION
Key information
Total assets
Shareholders´ equity
Assets under management in CHF bn
BIS tier 1 ratio
BIS total capital ratio
31.12.04in CHF m, except where indicated 31.12.03
1,089,485
36,273
1,220.7
12.3 %
16.6 %
1,004,308
33,991
1,181.1
11.7 %
17.4 %

Financial information Content110
Consolidated financial statementsConsolidated statements of income 112Consolidated balance sheets 113Statement of changes in shareholders’ equity 114Consolidated statements of cash flows 115
Notes to the consolidated financial statements1 Summary of significant accounting policies 1172 Recently issued accounting standards 1313 Business developments and subsequent events 1374 Discontinued operations 1395 Segment information 1396 Interest and dividend income and interest expense 1437 Trading activities 1438 Noninterest revenues and expenses 1449 Insurance premiums, claims and related reinsurance 14610 Securities borrowed, lent and subject to repurchase agreements 14811 Investment securities 14912 Other investments 15213 Real estate held for investment 15314 Loans 15315 Premises and equipment 15516 Goodwill 15517 Intangible assets 15618 Present value of future profits 15719 Other assets 15820 Brokerage receivables and brokerage payables 15921 Deferred policy acquisition costs 15922 Deposits 16023 Provisions from the insurance businesses 16024 Provisions for unpaid losses and loss adjustment expenses from
the non-life insurance businesses 16125 Participating policies of the insurance businesses 16326 Long-term debt 16427 Other liabilities 16628 Restructuring liabilities 16629 Accumulated other comprehensive income 16730 Earnings per share 168

Content 111Financial information
31 Income taxes 16932 Employee share-based compensation and other benefits 17133 Compensation to and equity holdings of members of the
most senior executive body 17634 Pension and other post-retirement benefits 17935 Related party transactions 18636 Derivatives and hedging activities 18837 Guarantees and commitments 19038 Securitization activity 19539 Variable interest entities 19740 Concentrations of credit risk 20141 Fair value of financial instruments 20142 Assets pledged or assigned 20343 Capital adequacy 20344 Assets under management 20745 Litigation 20846 Foreign currency translation rates 20947 Significant subsidiaries and associates 20948 Significant valuation and income recognition differences between
US GAAP and Swiss GAAP (true and fair view) 21549 Credit Suisse Group, Parent Company 218
Report of Independent registered public accounting firm 220

Financial information Consolidated financial statements112
Reference toYear ended December 31, in CHF m notes 2004 2003 2002
Interest and dividend income 6 30,973 28,359 32,196
Interest expense 6 (19,007) (16,637) (21,191)
Net interest income 6 11,966 11,722 11,005
Commissions and fees 8 13,577 12,917 15,316
Trading revenues 7 4,559 3,528 3,443
Realized gains/(losses) from investment securities, net 11 1,156 1,534 (4,205)
Insurance net premiums earned 9 20,874 21,708 22,195
Other revenues 8 1,882 (56) (509)
Total noninterest revenues 42,048 39,631 36,240
Net revenues 54,014 51,353 47,245
Policyholder benefits, claims and dividends 8 21,011 22,801 19,191
Provision for credit losses 14 78 600 2,822
Total benefits, claims and credit losses 21,089 23,401 22,013
Insurance underwriting, acquisition and administration expenses 4,190 4,504 4,871
Banking compensation and benefits 8 11,951 11,042 13,495
Other expenses 8 8,397 8,950 11,068
Goodwill impairment 16 0 1,510 0
Restructuring charges 28 85 135 32
Total operating expenses 24,623 26,141 29,466
Income/(loss) from continuing operations before taxes, minority interests, extraordinary items and cumulative effect of accounting changes 8,302 1,811 (4,234)
Income tax expense/(benefit) 31 1,441 (3) (114)
Dividends on preferred securities for consolidated entities 0 133 133
Minority interests, net of tax 1,127 (31) (193)
Income/(loss) from continuing operations before extraordinary items and cumulative effect of accounting changes 5,734 1,712 (4,060)
Income/(loss) from discontinued operations, net of tax 4 (100) (383) (466)
Extraordinary items, net of tax 0 7 18
Cumulative effect of accounting changes, net of tax (6) (566) 60
Net income/(loss) 5,628 770 (4,448)
Basic earnings per share, in CHF
Income/(loss) from continuing operations before extraordinary items and cumulative effect of accounting changes 30 4.90 1.45 (3.52)
Income/(loss) from discontinued operations, net of tax 30 (0.09) (0.33) (0.40)
Extraordinary items, net of tax 30 0.00 0.01 0.02
Cumulative effect of accounting changes, net of tax 30 (0.01) (0.49) 0.05
Net income/(loss) available for common shares 30 4.80 0.64 (3.85)
Diluted earnings per share, in CHF
Income/(loss) from continuing operations before extraordinary items and cumulative effect of accounting changes 30 4.83 1.43 (3.52)
Income/(loss) from discontinued operations, net of tax 30 (0.08) (0.33) (0.40)
Extraordinary items, net of tax 30 0.00 0.01 0.02
Cumulative effect of accounting changes, net of tax 30 0.00 (0.48) 0.05
Net income/(loss) available for common shares 30 4.75 0.63 (3.85)
Consolidated statements of income
The accompanying notes to the consolidated financial statements are an integral part of these statements.

Consolidated financial statements 113Financial information
Reference toDecember 31, in CHF m notes 2004 2003
Assets
Cash and due from banks 25,648 24,799
Interest-bearing deposits with banks 4,947 2,992
Central bank funds sold, securities purchased under resale agreements and securities borrowing transactions 10 267,169 257,083
Securities received as collateral 20,289 15,151
Trading assets (of which CHF 110,047 m and CHF 103,286 m encumbered) 7 346,469 297,778
Investment securities (of which CHF 2,346 m and CHF 857m encumbered) 11 100,365 105,807
Other investments 12 13,288 7,894
Real estate held for investment 13 8,970 9,148
Loans, net of allowance for loan losses of CHF 3,038 m and CHF 4,646 m 14 184,399 177,179
Premises and equipment 15 7,231 7,819
Goodwill 16 11,564 12,325
Intangible assets 17 3,689 4,056
Assets held for separate accounts 4,490 3,991
Other assets (of which CHF 4,785 m and CHF 2,644 m encumbered) 19 90,966 78,286
Discontinued operations - assets 1 0
Total assets 1,089,485 1,004,308
Liabilities and shareholders’ equity
Deposits 22 299,341 261,989
Central bank funds purchased, securities sold under repurchase agreements and securities lending transactions 10 239,724 236,847
Obligation to return securities received as collateral 20,289 15,151
Trading liabilities 7 150,130 156,331
Short-term borrowings 15,343 11,497
Provisions from the insurance business 23 137,161 130,537
Long-term debt 26 106,261 89,697
Liabilities held for separate accounts 4,489 3,987
Other liabilities 27 74,295 61,300
Discontinued operations - liabilities 1 24
Preferred securities 0 2,214
Minority interests 6,178 743
Total liabilities 1,053,212 970,317
Common shares 607 1,195
Additional paid-in capital 23,435 23,586
Retained earnings 20,501 14,873
Treasury shares, at cost (4,547) (3,144)
Accumulated other comprehensive income/(loss) 29 (3,723) (2,519)
Total shareholders’ equity 36,273 33,991
Total liabilities and shareholders’ equity 1,089,485 1,004,308
Commitments and contingencies refer to notes 31, 37 and 45.
Consolidated balance sheets
The accompanying notes to the consolidated financial statements are an integral part of these statements.

Financial information Consolidated financial statements114
Year ended December 31, in CHF m 2004 2003 2002
Net income/(loss) 5,628 770 (4,448)
Other comprehensive income/(loss) (1,204) (1,263) (3,919)
Comprehensive income/(loss) 4,424 (493) (8,367)
Consolidated statements of changes in shareholders’ equity
The accompanying notes to the consolidated financial statements are an integral part of these statements.
Comprehensive income
Net income – – – 5,628 – – 5,628
Other comprehensive income/(loss), net of tax – – – – – (1,204) (1,204)
Issuance of common shares 18,900,303 11 65 – – – 76
Issuance of treasury shares 343,821,036 – (34) – 15,245 – 15,211
Repurchase of treasury shares (403,834,466) – – – (17,950) – (17,950)
Share-based compensation 21,569,660 – (220) – 1,302 – 1,082
Repayment out of share capital 2) – (599) 8 – – – (591)
Other – – 30 – – – 30
Balance December 31, 2004 1,110,819,481 3) 607 23,435 20,501 (4,547) (3,723) 36,273
1) At par value CHF 1.00 each, fully paid, net of 64,642,966 treasury shares. In addition to the treasury shares, a maximum of 272,718,007 unissued shares (conditional andauthorized capital) were available for issuance without further approval of the shareholders. 2) On April 30, 2004, the shareholders of Credit Suisse Group approved a parvalue reduction of CHF 0.50 per share, in lieu of a dividend, which was paid out on July 12, 2004. 3) At par value CHF 0.50 each, fully paid, net of 103,086,736 treasuryshares. In addition to the treasury shares, a maximum of 253,744,616 unissued shares (conditional and authorized capital) were available for issuance without further approvalof the shareholders.
AccumulatedCommon other
Additional shares in comprehen-Common shares Common paid in Retained treasury sive income/
in CHF m, except common shares outstanding outstanding shares capital earnings at cost (loss) Total
Balance December 31, 2001 1,120,723,235 3,590 25,080 18,986 (6,258) 2,663 44,061
Net income – – – (4,448) – – (4,448)
Other comprehensive income/(loss), net of tax – – – – – (3,919) (3,919)
Issuance of common shares 1,011,909 2 26 – – – 28
Cancellation of repurchased shares (7,730,000) (23) (69) (450) – – (542)
Issuance of treasury shares 141,837,418 – (482) – 4,884 – 4,402
Repurchase of treasury shares (163,895,110) – – – (4,811) – (4,811)
Share-based compensation 24,110,853 – (147) – 1,798 – 1,651
Net premium/discount on treasury share and own share derivative activity – – 9 – – – 9
Repayment out of share capital (CHF 2.00 per share) – (2,379) – – – – (2,379)
Cash dividends paid – – – 126 – – 126
Balance December 31, 2002 1,116,058,305 1,190 24,417 14,214 (4,387) (1,256) 34,178
Net income – – 770 – – 770
Other comprehensive income/(loss), net of tax – – – – (1,263) (1,263)
Issuance of common shares 5,114,194 5 14 – – – 19
Issuance of treasury shares 182,622,865 – – – 6,913 – 6,913
Repurchase of treasury shares (191,245,719) – – – (7,009) – (7,009)
Share-based compensation 17,813,303 – (844) – 1,339 – 495
Net premium/discount on treasury share and own share derivative activity – – (1) – – – (1)
Cash dividends paid – – – (111) – – (111)
Balance December 31, 2003 1,130,362,948 1) 1,195 23,586 14,873 (3,144) (2,519) 33,991

Consolidated financial statements 115Financial information
Year ended December 31, in CHF m 2004 2003 2002
Operating activities of continuing operations
Net income/(loss) 5,628 770 (4,448)
(Income)/loss from discontinued operations, net of tax 100 383 466
Income/(loss) from continuing operations 5,728 1,153 (3,982)
Adjustments to reconcile net income/(loss) to net cash provided by/(used in)operating activities of continuing operations
Impairment, depreciation and amortization 2,026 4,428 3,104
Provision for credit losses 78 600 2,822
Deferred tax provision (73) (659) (644)
Restructuring charges 85 107 43
Change in technical provisions from the insurance business 6,894 5,803 1,949
(Gain)/loss from investment securities (1,156) (1,534) 4,224
Share of net income from equity method investments (199) (45) 106
Cumulative effect of accounting changes, net of tax 6 566 (60)
Receivables from the insurance business 1,296 294 (901)
Payables from the insurance business (1,832) 1,116 1,342
Trading assets and liabilities (52,153) (9,618) 34,503
Deferred policy acquisition costs (461) (178) (521)
(Increase)/decrease in accrued interest, fees receivable and other assets (25,656) (19,597) (4,281)
Increase/(decrease) in accrued expenses and other liabilities 17,840 (7,844) (15,656)
Other, net 288 2,193 235
Total adjustments (53,017) (24,368) 26,265
Net cash provided by/(used in) operating activities of continuing operations (47,289) (23,215) 22,283
Investing activities of continuing operations
(Increase)/decrease in interest-bearing deposits with banks (2,289) (6,969) (14,657)
(Increase)/decrease in central bank funds sold, securities purchased under resale agreements and securities borrowing transactions (30,021) (9,804) (28,265)
Purchase of investment securities (52,960) (117,687) (140,596)
Proceeds from sale of investment securities 36,673 55,277 60,927
Maturities of investment securities 20,890 46,637 78,881
Investments in subsidiaries and other investments (4,571) (3,368) (7,761)
Proceeds from sale of other investments 4,280 2,884 1,141
(Increase)/decrease in loans (16,932) (4,777) (8,378)
Proceeds from sales of loans 5,319 5,660 2,151
Capital expenditures for premises and equipment and intangible assets (994) (883) (1,365)
Proceeds from sale of premises and equipment and intangible assets 81 240 290
Other, net (191) (520) 298
Net cash provided by/(used in) investing activities of continuing operations (40,715) (33,310) (57,334)
Consolidated statements of cash flows
The accompanying notes to the consolidated financial statements are an integral part of these statements.

Financial information Consolidated financial statements116
Year ended December 31, in CHF m 2004 2003 2002
Financing activities of continuing operations
Increase/(decrease) in deposits 46,354 46,886 1,811
Increase/(decrease) in short-term borrowings 3,249 (677) 155
Increase/(decrease) in central bank funds purchased, securities sold under repurchase agreements and securities lending transactions 21,163 4,107 13,397
Issuances of long-term debt 43,087 23,782 39,499
Repayments of long-term debt (17,007) (26,255) (31,564)
Issuances of common shares 76 19 28
Issuances of treasury shares 15,211 6,913 4,402
Repurchase of treasury shares (17,950) (7,009) (4,811)
Dividends paid/capital repayments (including minority interest and trust preferred securities) (609) (273) (2,437)
Other, net (2,168) 733 548
Net cash provided by/(used in) financing activities of continuing operations 91,406 48,226 21,028
Effect of exchange rate changes on cash and due from banks (2,515) (2,582) 827
Discontinued operations
Net cash provided by discontinued operations (122) (396) (1,070)
Proceeds from sale of stock by subsidiaries 84 7,615 235
Net increase/(decrease) in cash and due from banks 849 (3,662) (14,031)
Cash and due from banks at beginning of financial year 24,799 28,461 42,492
Cash and due from banks at end of financial year 25,648 24,799 28,461
Supplemental disclosures of cash flow information
Cash paid during the year for income taxes 1,662 1,176 1,409
Cash paid during the year for interest 18,905 16,730 20,922
Assets acquired and liabilities assumed in business acquisitions
Fair value of assets acquired 161 573 767
Fair value of liabilities assumed (76) (472) (204)
Assets and liabilities sold in business divestitures
Assets sold (1,002) (41,600) (1,310)
Liabilities sold 904 34,164 1,137
Consolidated statements of cash flows (continued)
The accompanying notes to the consolidated financial statements are an integral part of these statements.

Notes to the consolidated financial statements 117Financial information
1 Summary of significant accounting policies
The accompanying consolidated financial statements of Credit Suisse Group (theGroup) are prepared in accordance with accounting principles generally accepted inthe United States of America (US GAAP), and are stated in Swiss francs (CHF).The financial year for the Group ends on December 31. Certain reclassificationshave been made to the prior year’s financial statements to conform to the currentyear’s presentation and had no impact on net income or shareholders’ equity.
In preparing the consolidated financial statements, management is required to makeestimates and assumptions that affect the reported amounts of assets and liabilitiesand disclosure of contingent assets and liabilities at the date of the consolidatedbalance sheets and the reported amounts of revenues and expenses during thereporting period. Actual results could differ from those estimates.
PRINCIPLES OF CONSOLIDATION
The consolidated financial statements include the financial statements of the Groupand its subsidiaries. The Group’s subsidiaries are entities in which it holds, directly orindirectly, more than 50% of the voting rights or where it exercises control, forentities in which the equity holders have substantive voting interests. EffectiveDecember 31, 2003, the Group also consolidates variable interest entities (VIEs)where the Group is the primary beneficiary in accordance with the FinancialAccounting Standards Board (FASB) Interpretation (FIN) No. 46 (FIN 46), asrevised. The effects of intercompany transactions and balances have beeneliminated.
The Group accounts for investments in which it has the ability to exercise significantinfluence, which generally are investments in which the Group holds 20% to 50% ofthe voting rights, using the equity method of accounting under Other investments.The Group’s share of the profit or loss, as well as any impairment losses on theinvestee, if applicable, are included in Other revenues.
FOREIGN CURRENCY TRANSLATION
Transactions denominated in currencies other than the functional currency of therelated entity are recorded by translating to the functional currency of the relatedentity at the exchange rate on the date of the transaction. At the balance sheetdate, monetary assets and liabilities such as receivables and payables are reportedusing the year-end spot exchange rates. Exchange rate differences are reported inthe statement of income.
For the purpose of consolidation, the assets and liabilities of Group companies withfunctional currencies other than CHF are translated into CHF equivalents using year-end spot foreign exchange rates, whereas revenues and expenses are translatedusing the average foreign exchange rate for the year. Translation adjustments arisingfrom consolidation are included in Accumulated other comprehensive income/(loss)(AOCI) within Shareholders’ equity.
Financial information Notes to the consolidated financial statements118
CASH AND CASH EQUIVALENTS
Cash equivalents are defined as short-term, highly liquid instruments with originalmaturities of three months or less and that are held for cash management purposes.
REVERSE REPURCHASE AND REPURCHASE AGREEMENTS
Purchases of securities under resale agreements (reverse repurchase agreements)and securities sold under agreements to repurchase substantially identical securities(repurchase agreements) normally do not constitute economic sales and aretherefore treated as collateralized financing transactions and are carried at theamount of cash disbursed or received, respectively. Reverse repurchase agreementsare recorded as collateralized assets while repurchase agreements are recorded asliabilities, with the underlying securities sold continuing to be recognized in Tradingassets or Investment securities. Assets and liabilities recorded under theseagreements are accounted for on an accrual basis, with interest earned on reverserepurchase agreements and interest incurred on repurchase agreements reported inInterest and dividend income and Interest expense, respectively. Reverse repurchaseand repurchase agreements are netted if they are with the same counterparty, havethe same maturity date, settle through the same clearing institution and are subjectto the same master netting agreement.
SECURITIES LENDING AND BORROWING (SLB) TRANSACTIONS
Securities borrowed and securities loaned that are cash-collateralized are included inthe balance sheet at amounts equal to the cash advanced or received. If securitiesreceived in an SLB transaction as collateral may be sold or re-pledged, they arerecorded as securities received as collateral and a corresponding liability to returnthe security is recorded. Fees and interest received or paid are recorded in Interestand dividend income and Interest expense, respectively, on an accrual basis.
TRADING ASSETS AND LIABILITIES
Trading assets and liabilities include debt and equity securities, derivativeinstruments, loans and precious metals. Items included in the trading portfolio arecarried at fair value and classified as held for trading purposes based onmanagement’s intent for the individual item. Regular-way security transactions arerecorded on a trade date basis.
Fair value is defined as the amount for which an asset could be exchanged or aliability settled between knowledgeable, willing parties in an arms’ length transactionother than an involuntary liquidation or distressed sale. Quoted market prices areused when available to measure fair value. In cases where quoted market prices arenot available, fair value is estimated using valuation models that consider prices forsimilar assets or similar liabilities and other valuation techniques.

Notes to the consolidated financial statements 119Financial information
Unrealized and realized gains and losses on trading positions, including amortizationof premium/discount arising at acquisition of debt securities, are recorded in Tradingrevenues. Interest from debt securities and dividends on equity securities arerecorded in Interest and dividend income.
Derivatives All freestanding derivative contracts are carried at fair value in the balance sheetregardless of whether these instruments are held for trading or risk managementpurposes. Commitments to originate mortgage loans that will be held for sale areconsidered derivatives for accounting purposes. When derivative features embeddedin certain contracts that meet the definition of a derivative are not considered clearlyand closely related to the host instrument, the embedded feature will be accountedfor separately at fair value, with changes in fair value recorded in the statement ofincome. Once separated, the derivative is recorded in the same line in theconsolidated balance sheet as the host instrument.
Derivatives classified as trading assets and liabilities include those held for tradingpurposes and those used for risk management purposes that do not qualify forhedge accounting. Derivatives held for trading purposes arise from proprietarytrading activity and from customer-based activity. Changes in realized and unrealizedgains and losses and interest flows are included in Trading revenues. Derivativecontracts designated and qualifying as fair value hedges, cash flow hedges or netinvestment hedges are reported as other assets or other liabilities and hedgeaccounting is applied.
The fair value of a derivative is the amount for which that derivative could beexchanged between knowledgeable, willing parties in an arms’ length transaction.Fair values recorded for derivative instruments do not indicate future gains or losses,but rather the unrealized gains and losses from valuing all derivatives at a particularpoint in time. The fair value of exchange-traded derivatives is typically derived fromobservable market prices and/or observable market parameters. Fair values for over-the-counter (OTC) derivatives are determined on the basis of internally developedproprietary models using various input parameters. Where the input parameterscannot be validated using observable market data, reserves are established forunrealized gains evident at the inception of the contracts so that no gain is recordedat inception. Such reserves are amortized to income over the life of the instrument orreleased into income when observable market data becomes available. Derivativecontracts are recorded on a net basis per counterparty, where an enforceable masternetting agreement exists. Where no such agreement exists, replacement values arerecorded on a gross basis.
Where hedge accounting is applied, the Group formally documents all relationshipsbetween hedging instruments and hedged items, including the risk managementobjectives and strategy for undertaking hedge transactions. At inception of a hedgeand on an ongoing basis, the hedge relationship is formally assessed to determinewhether the derivatives that are used in hedging transactions are highly effective inoffsetting changes in fair values or cash flows of hedged items attributable to thehedged risk. The Group discontinues hedge accounting prospectively in the followingcircumstances:
(1) It is determined that the derivative is no longer effective in offsetting changes inthe fair value or cash flows of a hedged item (including forecasted transactions);

Financial information Notes to the consolidated financial statements120
(2) The derivative expires or is sold, terminated, or exercised;(3) The derivative is no longer designated as a hedging instrument because it is
unlikely that the forecasted transaction will occur; or(4) The Group otherwise determines that designation of the derivative as a hedging
instrument is no longer appropriate.
For derivatives that are designated and qualify as fair value hedges, the carryingvalue of the underlying hedged items is adjusted to fair value for the risk beinghedged. Changes in the fair value of these derivatives are recorded in the same lineitem of the consolidated statement of income as the change in fair value of the riskbeing hedged for the hedged assets or liabilities to the extent the hedge is effective.Hedge ineffectiveness is separately recorded in Trading revenues.
When the Group discontinues fair value hedge accounting because it determines thatthe derivative no longer qualifies as an effective fair value hedge, the derivative willcontinue to be carried on the balance sheet at its fair value, and the hedged asset orliability will no longer be adjusted for changes in fair value attributable to the hedgedrisk. Interest-related fair value adjustments made to the underlying hedged items willbe amortized to the statement of income over the remaining life of the hedged item.Any unamortized interest-related fair value adjustment is recorded in the statementof income upon sale or extinguishment of the hedged asset or liability, respectively.Any other fair value hedge adjustments remain part of the carrying amount of thehedged asset or liability and are recognized in the statement of income upondisposition of the hedged item as part of the gain or loss on disposition.
For hedges of the variability of cash flows from forecasted transactions and floatingrate assets or liabilities, the effective portion of the change in the fair value of adesignated derivative is recorded in AOCI. These amounts are reclassified into thestatement of income when the variable cash flow from the hedged item impactsearnings (e.g. when periodic settlements on a variable rate asset or liability arerecorded in the statement of income or when the hedged item is disposed of).Hedge ineffectiveness is recorded in Trading revenues.
When hedge accounting is discontinued on a cash flow hedge, the net gain or losswill remain in AOCI and be reclassified into the statement of income in the sameperiod or periods during which the formerly hedged transaction is reported in thestatement of income. When the Group discontinues hedge accounting because it isno longer probable that a forecasted transaction will occur within the required timeperiod, the derivative will continue to be carried on the balance sheet at its fair value,and gains and losses that were previously recorded in AOCI will be recognizedimmediately in the statement of income.
For hedges of a net investment in a foreign operation, the change in the fair value ofthe hedging derivative is recorded in AOCI, to the extent the hedge is effective. Thechange in fair value representing hedge ineffectiveness is recorded in Tradingrevenues. The Group uses the forward method of determining effectiveness for netinvestment hedges, which results in the time value portion of a foreign currencyforward being reported in AOCI, to the extent the hedge is effective.

Notes to the consolidated financial statements 121Financial information
INVESTMENT SECURITIES
Investment securities include debt securities classified as held-to-maturity, and debtand marketable equity securities classified as available-for-sale. Regular-way securitytransactions are recorded on a trade date basis.
Debt securities where the Group has the positive intent and ability to hold suchsecurities to maturity are classified as such and are carried at amortized cost, net ofany unamortized premium or discount.
Debt and equity securities classified as available-for-sale are carried at fair value.Unrealized gains and losses, which represent the difference between fair value andamortized cost, are recorded in AOCI within Shareholders’ equity. Amounts reportedin AOCI are net of income taxes and in the insurance businesses, adjustments toinsurance policyholder liabilities and deferred acquisition costs and present value offuture profits (shadow adjustments).
Amortization of premiums or discounts is recorded in Interest and dividend incomeusing the effective yield method through the maturity date of the security. Gains orlosses on the sales of securities classified as available-for-sale are recorded inRealized gains/(losses) from investment securities, net at the time of sale on thebasis of specific identification.
Recognition of an impairment loss on debt securities is recorded in the statement ofincome if a decline in fair value below amortized cost is considered other-than-temporary, that is, amounts due according to the contractual terms of the securityare not considered collectible, typically due to a deterioration in the creditworthinessof the issuer. No impairment is recorded in connection with declines resulting fromchanges in market interest rates to the extent the Group has the intent and ability tohold the debt security to maturity.
Recognition of an impairment loss on equity securities is recorded in the statementof income if a decline in fair value below the cost basis of an investment isconsidered other-than-temporary. The Group generally considers unrealized losses onequity securities to be other-than-temporary if the fair value has been below cost formore than six months or by more than 20%.
Recognition of an impairment loss for debt or equity securities establishes a newcost basis, which is not adjusted for subsequent recoveries.
Unrealized losses are recognized in the statement of income when a decision hasbeen taken to sell a security.
OTHER INVESTMENTS
Other investments include equity method investments and non-marketable equitysecurities such as private equity and restricted stock investments, as well as certaininvestments in non-marketable mutual funds for which the Group has neithersignificant influence nor control over the investee.

Financial information Notes to the consolidated financial statements122
The valuation for non-marketable equity securities depends on the type of entity inwhich the securities are held. Non-marketable equity securities held by the Group’ssubsidiaries that are considered investment companies or broker/dealer entities arecarried at their estimated fair value, with changes in fair value recorded in thestatement of income. Non-marketable equity securities held in the insurancebusiness are carried at fair value with changes in fair value recorded in AOCI withinShareholders’ equity. The Group’s other non-marketable equity securities are carriedat cost less other-than-temporary impairment.
LOANS
Loans are carried at outstanding principal balances net of unamortized premiums anddiscounts on purchased loans, deferred loan origination fees and direct loanorigination costs on originated loans. Interest income is accrued on the unpaidprincipal balance and net deferred premiums/discounts and fees/costs are amortizedas an adjustment to the loan yield over the term of the related loans.
Allowance for loan lossesThe allowance for loan losses is comprised of two components: probable creditlosses inherent in the portfolio and those losses specifically identified. Changes inthe allowance for loan losses are recorded in the statement of income in Provisionfor credit losses.
Many factors can affect the Group’s estimate of the allowance for loan losses,including volatility of default probabilities, rating migrations and loss severity. Thecomponent of the allowance representing probable losses inherent in the portfolio isfor loans not specifically identified as impaired which, on a portfolio basis, areconsidered to contain probable inherent loss. The estimation of this component ofthe allowance for the consumer portfolio involves applying historical loss experience,adjusted to reflect current market conditions, to homogenous loans based on riskrating and product type. To estimate this component of the allowance for commercialloans, the Group segregates loans by risk, industry or country rating. Excluded fromthis estimation process are consumer and commercial loans where a specificallyidentified loss has been included in the specific component of the allowance for loanlosses. For lending-related commitments, a provision for losses is estimated basedon historical loss and recovery experience, which is recorded in Other liabilities.Changes in the estimated calculation of losses are recorded in the statement ofincome in Provision for credit losses.
The estimate of the component of the allowance for specifically identified creditlosses on impaired loans is based on a regular and detailed analysis of each loan inthe portfolio considering collateral and counterparty risk. If uncertainty exists as tothe repayment of either principal or interest, a specific provision is either establishedor adjusted accordingly. For certain non-collateral dependent impaired loans,impairment charges are measured using the present value of future cash flows. TheGroup considers a loan impaired when, based on current information and events, it isprobable that it will be unable to collect the amounts due according to thecontractual terms of the loan agreement. A loan is classified as non-performing nolater than when the contractual payments of principal and/or interest are more than90 days past due. However, management may determine that a loan should beclassified as non-performing notwithstanding that contractual payments of principal

Notes to the consolidated financial statements 123Financial information
and/or interest are less than 90 days past due. For non-performing loans, the Groupcontinues to accrue interest for collection purposes; however, a provision is recordedresulting in no income recognition. In addition, for any accrued but unpaid interest atthe date the loan is classified as non-performing, a provision is recorded in theamount of the accrual, resulting in a charge to the statement of income. On aregular basis thereafter, the outstanding principal balance is evaluated forcollectibility and a provision is established for any shortfall between the estimated netrecoverable amount and the principal balance.
A loan can be further downgraded to noninterest earning when the collection ofinterest is considered so doubtful that further accrual of interest is deemedinappropriate. At that time and on a regular basis thereafter, the outstandingprincipal balance net of provisions previously recorded is evaluated for collectibilityand additional provisions are established as required. Charge-off of a loan occurswhen it is considered certain that there is no possibility of recovering the outstandingprincipal. Recoveries of loans previously charged-off are recorded based on the cashor estimated fair market value of other amounts received.
The amortization of net loan fees or costs on impaired loans is generallydiscontinued during the periods in which matured and unpaid interest or principal isoutstanding. Cash amounts received relating to fees are applied to the outstandingprincipal loan balance during this period. On settlement of a loan, if the loan balanceis not collected in full, the loan is charged-off, net of any deferred loan fees andcosts.
Interest collected on non-performing loans is accounted for using the cash basis orthe cost recovery method or a combination of both, as appropriate. Interest collectedon noninterest earning loans is accounted for using the cost recovery method only.Generally, an impaired loan may be restored to performing status only whendelinquent principal and interest are brought up to date in accordance with the termsof the loan agreement and when certain performance criteria are met.
Loans held-for-sale are carried at the lower of amortized cost or market value andare included in Other assets. Lease financing transactions where the Group is thelessor are included in Loans at amounts representing the gross receivable less anyunearned lease income. Lease payments received are recorded as a reduction of thegross lease receivable, and a portion is recorded as Interest and dividend income.
REAL ESTATE, PREMISES AND EQUIPMENT
Real estate is carried at cost less accumulated depreciation and is depreciated overits estimated useful life, generally 40 to 67 years. Land is carried at historical costand is not depreciated. Alterations and improvements to rented premises aredepreciated over the shorter of the lease term or estimated useful lives. Othertangible fixed assets such as computers, machinery, furnishings, vehicles and otherequipment are depreciated using the straight-line method over their estimated usefullife, generally three to five years.
The Group capitalizes costs relating to the acquisition, installation and developmentof software with a measurable economic benefit, but only if such costs areidentifiable and can be reliably measured. The Group depreciates capitalized

Financial information Notes to the consolidated financial statements124
software costs on a straight-line basis over the estimated useful life of the software,generally not exceeding three years, taking into consideration the effects ofobsolescence, technology, competition and other economic factors.
The Group reflects finance leasing activities for which it is the lessee by recording anasset in Premises and equipment, and a corresponding liability in Other liabilities atan amount equal to the smaller of the present value of the minimum lease paymentsor fair value, and the leased asset is depreciated over the shorter of the asset’sestimated useful life or the lease term.
GOODWILL AND OTHER INTANGIBLE ASSETS
Goodwill represents the excess of the purchase price of an acquired entity over theestimated fair value of its net assets acquired at the acquisition date. Otherintangible assets may be acquired individually or as part of a group of assetsassumed in a business combination. Other intangible assets include but are notlimited to: patents, licenses, copyrights, trademarks, branch networks, mortgageservicing rights, customer base and deposit relationships. Acquired intangible assetsare initially measured based on the amount of cash disbursed or the fair value ofother assets distributed. Goodwill is tested for impairment annually, or morefrequently if events or changes in circumstances indicate that goodwill may beimpaired. Goodwill is allocated to the Group’s reporting units for the purposes of theimpairment test. Other intangible assets that have a finite useful life are amortizedover that period. Other intangible assets acquired after January 1, 2002, that aredetermined to have an indefinite useful life, are not amortized.
PRESENT VALUE OF FUTURE PROFITS
The present value of future profits (PVFP) is the actuarially determined present valueof anticipated profits to be realized from life and health insurance in force at the dateof the Group’s acquisition of insurance businesses. Interest accrues on PVFP basedupon the earned rate or credited rate. PVFP is amortized over the years that suchprofits are anticipated to be received in proportion to the estimated gross margins orestimated gross profits for participating traditional life products and non-traditionallife products, respectively, and over the premium paying period in proportion topremiums for other traditional life products.
Expected future profits used in determining PVFP are based on actuarialdeterminations of future premium collection, mortality, morbidity, policy surrenders,operating expenses and yields on assets supporting policy liabilities, as well as otherfactors. The discount rate used to determine the PVFP is the rate of return requiredto invest in the business being acquired. Additionally, PVFP is adjusted for theimpact on estimated gross margins and profits of net unrealized gains and losses onsecurities. Amortization of PVFP is recorded in Insurance underwriting, acquisitionand administration expenses.

Notes to the consolidated financial statements 125Financial information
RECOGNITION OF IMPAIRMENT LOSSES ON TANGIBLE FIXED ASSETSAND OTHER INTANGIBLE ASSETS
The Group evaluates Premises and equipment and Other intangible assets forimpairment losses at least annually and whenever events or changes incircumstances indicate that the carrying amount may not be recoverable or is greaterthan its fair value. An impairment loss is deemed to have occurred if the carryingvalue of a tangible fixed or intangible asset exceeds its implied fair value. Reversalsof previously recorded impairment losses are prohibited.
In the insurance business, PVFP is periodically evaluated for recoverability. If thepresent value of future gross margins/profits from the insurance business acquiredis insufficient to recover PVFP, the difference is charged to expense as a write-downof the PVFP.
INCOME TAXES
Deferred tax assets and liabilities are recorded for the expected future taxconsequences of temporary differences between the carrying amounts of assets andliabilities at the balance sheet date and their respective tax bases. Deferred taxassets and liabilities are computed using currently enacted tax rates and arerecorded in Other assets and Other liabilities, respectively. Income tax expense orbenefit is recorded in Income tax expense/(benefit), except to the extent the changerelates to transactions recorded directly in Shareholders’ equity. Deferred tax assetsare reduced by a valuation allowance, if necessary, to the amount that managementbelieves will more likely than not be realized. Deferred tax assets and liabilities areadjusted for the effect of changes in tax laws and rates in the period in whichchanges are approved by the relevant authority. Deferred tax assets and liabilities arepresented on a net basis for the same tax-paying component within the same taxjurisdiction.
ASSETS AND LIABILITIES HELD FOR SEPARATE ACCOUNTS
Assets and liabilities held for separate accounts are maintained separately for non-traditional life products designed to meet the specific investment objectives ofpolicyholders. Separate accounts include investments for the benefit of life insurancepolicyholders who bear the investment risk associated with the products, andinvestment income and investment gains and losses accrue directly to thepolicyholders. These separate accounts are carried at fair value. The assets arelegally segregated. Net revenues from the separate account business are included inOther revenues. In some countries, contracts offer additional guaranteed benefits.Provisions for such guarantees are recorded in Provisions from the insurancebusiness.

Financial information Notes to the consolidated financial statements126
OTHER ASSETS
Other assets include brokerage receivables, real estate and loans held-for-sale,interest and fees receivables, deferred tax assets, premiums and other receivablesfrom agents and policyholders, deferred policy acquisition costs, reinsurancerecoverables, derivative instruments used for hedging purposes, time and preciousmetals time accounts related to certain brokerage transactions and policy loans andother miscellaneous receivables.
Derivatives used for hedging purposesDerivatives are carried at fair value. The fair values of derivatives held for hedgingpurposes are included as Other assets or Other liabilities in the consolidated balancesheet. The accounting treatment used for changes in fair value of hedgingderivatives depends on the designation of the derivative as either a fair value hedge,cash flow hedge or hedge of a net investment in a foreign operation. Changes in fairvalue representing hedge ineffectiveness are reported in Trading revenues.
Deferred policy acquisition costsPolicy acquisition costs consist primarily of commissions, underwriting expenses andpolicy issuance costs. Acquisition costs that vary with and are directly related to theacquisition of insurance contracts are deferred to the extent they are deemedrecoverable from future profits on the related contracts. Future investment incomeattributable to related premiums is taken into account in measuring the recoverabilityof the carrying value of this asset. When deferred policy acquisition costs (DAC) isnot considered recoverable, it is written off to income and, if required, a premiumdeficiencies reserve is established by a charge to income.
DAC on participating traditional life products are amortized over the life of theinsurance contracts in proportion to the estimated gross margins. DAC on othertraditional life products are amortized over the premium paying period of the relatedpolicies in proportion to net premiums using assumptions consistent with those usedin computing the provision for future policyholder benefits. DAC on non-traditionallife products are amortized over the expected life of the contracts as a constantpercentage of the estimated gross profit.
The effect on the amortization of DAC for revisions to estimated gross margins orprofits for all insurance contracts is reflected in the current period. DAC related toparticipating traditional life products and non-traditional life products is adjusted forthe impact on estimated gross margins or profits of net unrealized gains and losseson securities. DAC for non-life products are amortized over the periods in which thepremiums are earned. Amortization of DAC is recorded in Insurance underwriting,acquisition and administration expenses.
Reinsurance recoverablesReinsurance recoverables include the balances due from reinsurance agreements forpaid and unpaid losses and loss adjustment expenses, ceded unearned premiumsand ceded future policy benefits and benefits paid and unpaid.

Notes to the consolidated financial statements 127Financial information
PROVISIONS FROM THE INSURANCE BUSINESSES
Provision for future policyholder benefits The provision for future policyholder benefits for participating traditional life productsis computed using the net level premium method, which represents the present valueof future policyholder benefits less the present value of future net premiums. Thismethod uses assumptions for mortality and interest rates that are guaranteed in thecontracts or used in determining dividends.
The provision for future policyholder benefits for other traditional life products iscomputed using the net level premium method. The assumptions are based on theGroup’s experience and industry standards, including provision for adverse deviationsthat were in effect as of the issue date of the contract.
The provision for future policyholder benefits also includes liabilities for non-traditional life products for which the assets cannot be legally segregated. Theprovision is equal to the account value, which represents premiums received and theallocated investment return credited to the policy less deductions for mortality costsand expense charges.
When the provision for future policyholder benefits plus the present value ofexpected future gross premiums for a product are insufficient to provide for expectedfuture benefits and expenses for the line of business, deferred policy acquisitioncosts are written-off to income and, if required, a premium deficiency reserve isestablished by a charge to income. A premium deficiency reserve is adjusted for theimpact of net unrealized gains and losses.
From 2003 onwards, provisions for future policyholder benefits also include liabilitiesfor guaranteed minimum death and similar mortality and morbidity benefits related tolife products, where the investment risk is borne by the policyholder, annuitizationoptions as well as sales inducements; such liabilities are calculated based oncontractual obligations using actuarial assumptions. An additional liability forannuitization benefits is accrued over the period of the contract. The liability iscalculated as the difference between the present value of expected annuitizationpayments using the current annuity conversion rate and the expected accountbalance at the expected annuitization date multiplied by the proportion ofassessments made to expected total assessments. Contractually agreed salesinducements to policyholders include persistency bonuses and are accrued over theperiod in which the insurance contract must remain in force to qualify for theinducement.
Provision for unearned revenue liability The unearned revenue liability represents prepaid fees, which are deferred andrecognized in proportion to the estimated gross profits over the life of the contractand are recorded in Other revenues. These deferred fees are adjusted for the impacton estimated gross profits of net unrealized gains and losses on securities.
Provision for death and other benefits Provisions for death and other benefits represents amounts due on life and accidentand health claims that have been incurred as of the balance sheet date but have notyet been paid. This includes claims incurred but not reported (IBNR) and lossadjustment expenses. The interest rate used to discount future payments is

Financial information Notes to the consolidated financial statements128
impacted by the net unrealized gains and losses on securities, resulting in anadjustment to claim provisions.
Provision for future dividends to policyholders Dividends on participating traditional life products are accrued when earned andcomputed in accordance with local statutory or contractual requirements. Theprovision for future dividends to policyholder also includes a deferred bonus reserve(DBR), which represents amounts that result from differences between theconsolidated financial statements and the local statutory financial statements that willreverse and enter into future policyholder dividends calculations. The calculation ofthe DBR reflects only the contractual or regulatory defined minimum distribution topolicyholders.
The provision for future policyholder dividends to policyholders is adjusted for theimpact of net unrealized gains and losses on securities to the extent that thepolicyholder will participate in such gains and losses on the basis of contractual orregulatory requirements when they are realized.
Provision for unpaid losses and loss adjustment expenses Losses and loss adjustment expenses (LAE) are recorded as incurred. Provisions forunpaid losses comprise estimates of the unpaid portion of the reported losses andestimates of the amount of losses IBNR to the insurer. Management periodicallyreviews the estimates, which may change in light of new information. Anysubsequent adjustments are recorded in the period in which they are determined.
Certain provisions for unpaid losses and LAE for which the payment pattern and theultimate cost are fixed and reliably determinable on an individual claim basis arediscounted at the rate used for statutory accounting but not exceeding the long-termrisk free rate.
REINSURANCE
Contracts providing for indemnification against loss or liability relating to insurancerisk are accounted for as reinsurance. Reinsurance contracts that do not transfersignificant insurance risk are accounted for as deposits. Gains on retroactivereinsurance ceded are deferred and amortized over the estimated remainingsettlement period.
OTHER LIABILITIES
GuaranteesIn cases where the Group acts as a guarantor, the Group recognizes in Otherliabilities, at the inception of a guarantee, a liability for the fair value of theobligations undertaken in issuing such guarantee, including our ongoing obligation toperform over the term of the guarantee in the event that certain events or conditionsoccur.

Notes to the consolidated financial statements 129Financial information
Pensions and other post-retirement benefits The Group uses the projected unit credit actuarial method to determine the presentvalue of its projected benefit obligations and the current and past service costsrelated to its defined benefit and other post retirement benefit plans. Themeasurement date used by the Group to perform the actuarial revaluations isSeptember 30.
Certain key assumptions are used in performing the actuarial valuations that requiresignificant judgment and estimate on behalf of Group management. The expectedlong-term rate of return on plan assets is determined on a plan-by-plan basis, takinginto account asset allocation, historical rate of return, benchmark indices for similartype pension plan assets, long-term expectations of future returns and investmentstrategy. The expected rate of return for insured plans is determined based on theguaranteed interest on the insurance contract plus an estimate of the expectedparticipation of the pension fund in the investment returns of the insurer in excess ofthe minimal contractual interest rate. The discount rate is determined based uponeither high-quality, fixed-income corporate bonds or government bonds adjusted by apremium to reflect the additional risk for corporate bonds. Health care cost trendrates are determined by reviewing external data and the Group’s own historicaltrends for health care costs.
Unrecognized actuarial gains and losses in excess of 10% of the greater of theprojected benefit obligation or the market-related value of plan assets as well asunrecognized prior service costs and transition obligations and assets are amortizedto net periodic pension and other post-retirement cost on a straight-line basis overthe average remaining service life of active employees expected to receive benefits.
The Group recognizes an additional minimum liability at each measurement date forthe excess of the accumulated benefit obligation over the fair value of plan assets asan intangible asset to the extent there are unrecognized prior service costs with anyremaining difference, net of tax, being reflected in AOCI.
The Group records pension expense for defined contribution plans when theemployee renders service to the company, essentially coinciding with the cashcontributions to the plans.
SHARE-BASED COMPENSATION
Through December 31, 2002, the Group accounted for its employee share-basedcompensation program under the intrinsic value method in accordance withAccounting Principles Board Opinion No. 25, Accounting for Stock Issued toEmployees (APB 25). Under APB 25, for shares granted as compensation inrelation to the annual bonus that vested immediately upon grant, compensationexpense was recognized in the applicable performance year in which the award wasearned. For shares granted as retention incentive awards, compensation expensewas recognized over the required service period on a straight-line basis. For all shareawards granted, compensation expense was measured based on the number ofshares granted and the current market value of the share at the date of grant. Nocompensation expense was generally recognized for share options because theywere granted with an exercise price greater than or equal to the market price at thedate of grant.

Financial information Notes to the consolidated financial statements130
OWN SHARES AND OWN BONDS
The Group may buy and sell own shares, own bonds and derivatives on own shareswithin its normal trading and market-making activities. In addition, the Group mayhold its own shares to satisfy commitments arising from employee share-basedcompensation awards. Own shares are recorded at cost and reported as Treasuryshares, resulting in a reduction to Shareholders’ equity. Derivatives on own sharesare recorded as assets or liabilities. Dividends received on own shares and unrealizedand realized gains and losses on own shares classified in Shareholders’ equity areexcluded from the statement of income. Purchases of own bonds are recorded as anextinguishment of debt.
The following table presents net income and basic and diluted earnings per share as reported, and as if alloutstanding awards were accounted for at fair value under SFAS 123.
Year ended December 31, in CHF m, except the per share amounts 2004 2003 2002
Net income/(loss) - as reported 5,628 770 (4,448)
Add: share-based compensation expense included in reported net income/(loss), net of related tax effects 702 740 1,040
Deduct: total share-based compensation expense determined under the fair value method for all awards vested during the year, net of related tax effects (702) (761) (1,557)
Net income/(loss) - pro forma 5,628 749 (4,965)
Net income/(loss) available for common shares for basic EPS - pro forma 5,455 727 (4,965)
Net income/(loss) available for common shares for diluted EPS - pro forma 5,744 727 (4,965)
Basic earnings/(loss) per share - as reported 4.80 0.64 (3.85)
Basic earnings/(loss) per share - pro forma 4.80 0.62 (4.30)
Diluted earnings/(loss) per share - as reported 4.75 0.63 (3.85)
Diluted earnings/(loss) per share - pro forma 4.75 0.62 (4.30)
Effective January 1, 2003, the Group adopted, using the prospective method, thefair value recognition provisions of Statement of Financial Accounting Standards(SFAS) No. 123, Accounting for Stock-based Compensation (SFAS 123) asamended by SFAS No. 148, Accounting for Stock-based Compensation – Transitionand Disclosure (SFAS 148). Under the prospective method, all new equity-basedcompensation awards granted to employees and existing awards modified on or afterJanuary 1, 2003, are accounted for at fair value. Compensation expense ismeasured at the grant or modification date based on the fair value of the award andis recognized in the statement of income over the required service period on astraight-line basis. The fair value of the share awards is based on the current marketvalue of the share at the date of grant and the fair value of share options isdetermined using a standard option-pricing model. The financial and marketassumptions used in the option-pricing model are based on the best informationavailable to management at the date of grant and different variations of theseassumptions could result in different fair value estimates. Share options outstandingas of December 31, 2002, if not subsequently modified, continue to be accountedfor under APB 25.
The Group has certain option plans outstanding, primarily related to the years 1999and prior, which include a cash settlement feature. For those plans, variable planaccounting will continue to be applied until settlement of the awards.

Notes to the consolidated financial statements 131Financial information
COMMISSIONS AND FEES
Fee revenue is recognized when all of the following criteria have been met:persuasive evidence of an agreement exists, services have been rendered, the priceis fixed or determinable and collectibility is reasonably assured. Commissions andfees earned for investment and portfolio management, customer trading and custodyservices are recognized at the time or over the period, respectively, that the relatedservice is provided. Revenues from underwriting and fees from mergers andacquisitions and other corporate finance advisory services are recorded at the timewhen the underlying transactions are substantially completed, as long as there areno other contingencies associated with the fees. Transaction-related expenses aredeferred until the related revenue is recognized.
NET INSURANCE PREMIUMS EARNED
Premiums from traditional life products, both participating and non-participating, arerecognized as revenue when due from the policyholder. Profit for contracts with alimited number of premium payments is deferred and recognized over the period forwhich coverage is provided.
Premiums from non-life products are recorded at inception of the contract and areearned primarily on a pro-rata basis over the term of the related policy coverage withthe unearned portion being deferred in the balance sheet as unearned premiums.
OTHER REVENUES
Other revenues include fees and net revenues from deposit business. Net revenuesfrom deposit business represent the revenue from non-traditional life insurancecontracts used to cover the costs and the insurance risks of the underlying policies.
2 Recently issued accounting standards
RECENTLY ADOPTED STANDARDS
On July 16, 2004, the FASB ratified the Emerging Issues Task Force (EITF)consensus on Issue No. 02-14, Whether the Equity Method of Accounting AppliesWhen an Investor Does Not Have an Investment in Voting Stock of an Investee butExercises Significant Influence through Other Means (EITF 02-14). The consensusconcludes that an investor should apply the equity method of accounting when it canexercise significant influence over an entity through a means other than holdingvoting rights. The consensus is effective for reporting periods beginning afterSeptember 15, 2004. The adoption of EITF 02-14 did not have a material impact onthe Group’s financial position, results of operations or cash flows.
Financial information Notes to the consolidated financial statements132
In March 2004, the EITF released Issue No. 03-6, Participating Securities and theTwo-Class Method under FASB Statement No.128 (EITF 03-6). In EITF 03-6, theFASB staff clarifies that securities which may participate in dividends and that areconvertible into common stock should be included in the determination of earningsper share. The adoption of EITF 03-6 requires that our Mandatory ConvertibleSecurities be considered in the calculation. As a result, basic earnings per sharehave been restated for all periods affected by the requirements of EITF 03-6.
In December 2003, the FASB revised SFAS No. 132, Employers’ Disclosures aboutPensions and Other Postretirement Benefits (SFAS 132R). The new disclosurerequirements apply to the Group’s domestic (Swiss) plans for 2003. SFAS 132Rretained the disclosure requirements from the original statement and requiresadditional disclosures. SFAS 132R is effective for financial statements with fiscalyears ending after December 15, 2003, and the interim disclosures are required forperiods beginning after December 15, 2003. The Group has adopted the newdisclosure requirements of SFAS 132R. See note 34 for additional information.
In November 2003, the EITF reached a consensus on certain additional quantitativeand qualitative disclosure requirements in connection with its deliberations of Issue03-1, The Meaning of Other-than-Temporary Impairment and Its Application toCertain Investments, which also discussed the impairment model for available-for-sale and held-to-maturity securities under SFAS No. 115 (EITF 03-1). The Grouphas adopted the new disclosure requirements of EITF 03-1. See note 11 and 12 foradditional information.
In July 2003, the Accounting Standards Executive Committee (AcSEC) of theAmerican Institute of Certified Public Accountants (AICPA) issued SOP 03-1,Accounting and Reporting by Insurance Enterprises for Certain Nontraditional Long-Duration Contracts and for Separate Accounts. The most significant accountingimplications of SOP 03-1 for the Group are as follows: (1) for contracts containingan annuitization benefit option contract feature, an additional liability is established, ifa provision for such a contract feature is not required under other applicableaccounting standards and if the present value of expected annuitization payments atthe expected annuitization date exceeds the expected account balance at theexpected annuitization date; (2) reporting and measuring assets and liabilities ofseparate account products as general account assets and liabilities, when specifiedcriteria are not met; (3) reporting and measuring seed money in separate accountsas general account assets based on the insurer’s proportionate beneficial interest inthe separate account’s underlying assets; (4) capitalizing sales inducements thatmeet specified criteria and amortizing such amounts over the life of the contractsusing the same methodology as used for amortizing deferred acquisition costs, butimmediately expensing those sales inducements accrued or credited if such criteriaare not met; (5) recognizing contract holder liabilities for persistency bonuses andother sales inducements; and (6) establishing an additional liability for guaranteedminimum death and similar mortality and morbidity benefits only for contractsdetermined to have mortality and morbidity risk that is other than nominal and whenthe risk charges made for a period are not proportionate to the risk borne during thatperiod. The Group early adopted SOP 03-1 as of January 1, 2003. The effect ofinitially adopting SOP 03-1 is reported as a cumulative effect of a change inaccounting principle in the 2003 results of operations in the amount of CHF 530million, net of taxes. This charge is caused primarily by the impact of establishingadditional liabilities for certain group pension and individual life insurance contracts
Notes to the consolidated financial statements 133Financial information
with annuitization options, reclassifying certain separate account assets to thegeneral account and applying the respective valuation principles, establishingliabilities for sales inducements and increasing reserves for guaranteed minimumdeath benefits.
In May 2003, the FASB issued SFAS No. 150, Accounting for Certain FinancialInstruments with Characteristics of both Liabilities and Equity (SFAS 150). SFAS150 establishes standards for an issuer’s classification of certain financialinstruments that have both liability and equity characteristics and imposes additionaldisclosure requirements. Effective September 30, 2003, the Group adopted SFAS150 for financial instruments entered into or modified after May 31, 2003. Theadoption of SFAS 150 did not have a material impact on the Group’s financialposition, results of operations or cash flows.
In April 2003, the FASB issued SFAS No. 149, Amendment of Statement 133 onDerivative Instruments and Hedging Activities (SFAS 149), which amends andclarifies accounting for derivative instruments, including certain derivative instrumentsembedded in other contracts, and for hedging activities under SFAS No. 133,Accounting for Derivatives and Hedging Activities (SFAS 133). Specifically, SFAS149 clarifies the circumstances under which a contract with an initial net investmentmeets the characteristics of a derivative and when a derivative contains a financingcomponent that warrants special reporting in the consolidated statement of cashflows. Certain derivative instruments entered into or modified after June 30, 2003,and that the Group has determined to contain a financing element at inception andwhere the Group is deemed the borrower, are now included as a separatecomponent within Cash flows from financing activities. Prior to July 1, 2003, thesederivative instruments were included within Cash flows from operating activities. Theadoption of SFAS 149 did not have a material impact on the Group’s financialposition, results of operations or cash flows.
In January 2003, the FASB issued FIN 46, which requires the Group to consolidateall VIEs for which it is the primary beneficiary, defined as the entity that will absorb amajority of expected losses, receive a majority of the expected residual returns, orboth. In December 2003, the FASB modified FIN 46, through the issuance of FIN46R, to provide companies with the option of deferring the adoption of FIN 46 toperiods ending after March 15, 2004, for certain VIEs. As of December 31, 2003,with the exception of certain private equity investment companies, mutual funds andVIE counterparties to certain derivatives transactions that were subject to deferral,the Group consolidated all VIEs under FIN 46 for which it is the primary beneficiary.The cumulative effect of the Group’s adoption of FIN 46 was an after-tax loss ofCHF 15 million reported separately in the Consolidated statement of income as theCumulative effect of accounting changes, net of tax. The cumulative effect wasdetermined by recording the assets, liabilities and non-controlling interests in the VIEat their carrying amounts as of the date of consolidation. The difference between thenet amount added to the consolidated statement of financial condition and theamount of previously recognized interest represents the cumulative effect. As aresult of the adoption of FIN 46R as of March 31, 2004, the Group consolidatedcertain private equity funds with third party and employee investors, resulting in anincrease in assets and liabilities of CHF 1.5 billion. The effect of initially adoptingFIN 46R is reported as a cumulative effect of a change in accounting principle in the2004 results of operations as an after-tax loss of CHF 6 million. In addition, the

Financial information Notes to the consolidated financial statements134
Group deconsolidated certain entities that issue redeemable preferred securities asof March 31, 2004. See note 39 for additional information regarding VIEs.
In November 2002, the FASB issued FIN No. 45, Guarantor’s Accounting andDisclosure Requirements for Guarantees, Including Indirect Guarantees ofIndebtedness of Others – an Interpretation of FASB Statements No. 5, 57, and 107and Rescission of FASB Interpretation No. 34 (FIN 45). FIN 45 requires certaindisclosures to be made by a guarantor in its financial statements for periods endingafter December 15, 2002, about its obligations under certain guarantees it hasissued. It also requires a guarantor to recognize, at the inception of a guaranteeissued or amended after December 31, 2002, a liability for the fair value of theobligation undertaken in issuing the guarantee. The adoption of FIN 45 did not havea material impact on the Group’s financial position, results of operations or cashflows. See note 37 for more information on the Group’s guarantees under FIN 45.
In November 2002, the EITF released Issue No. 02-3, Issues Involved in Accountingfor Derivative Contracts Held for Trading Purposes and Contracts Involved in EnergyTrading and Risk Management Activities (EITF 02-3). In EITF 02-3 the FASB staffclarified that, in the absence of (a) quoted market prices in an active market, (b)observable prices of other current market transactions or (c) other observable datasupporting a valuation technique, the transaction price represents the bestinformation available with which to estimate fair value at the inception of thearrangement for all derivatives. The adoption of EITF 02-3 did not have a materialimpact on the Group’s financial position, results of operations or cash flows.
In June 2002, the FASB issued SFAS No. 146, Accounting for Costs Associatedwith Exit or Disposal Activities (SFAS 146), which requires companies to recognizecosts associated with exit or disposal activities when they are incurred, rather than atthe date of a commitment to an exit or disposal plan. In addition, SFAS 146 requiresthat the liability be measured at fair value and be adjusted for changes in estimatedcash flows. Examples of costs covered by the standard include lease terminationcosts and certain employee severance costs that are associated with a restructuring,discontinued operations, a plant closing or other exit or disposal activity. Theadoption of SFAS 146 did not have a material impact on the Group’s financialposition, results of operations or cash flows.
In April 2002, the FASB issued SFAS No. 145, Rescission of FASB Statements No.4, 44 and 64, Amendment of FASB Statement No. 13, and Technical Corrections(SFAS 145). SFAS 145 rescinds SFAS No. 4, Reporting Gains and Losses fromExtinguishment of Debt (SFAS 4) and an amendment of that statement, SFAS No.64, Extinguishments of Debt Made to Satisfy Sinking-Fund Requirements (SFAS64). SFAS 145 also amends SFAS No. 13, Accounting for Leases (SFAS 13), toeliminate an inconsistency between the required accounting for sale-leasebacktransactions and the required accounting for certain lease modifications that haveeconomic effects that are similar to sale-leaseback transactions. The statementbecame effective for fiscal year 2003. The adoption of SFAS 145 did not have amaterial impact on the Group’s consolidated financial position, results of operationsor cash flows.
In October 2001, the FASB issued SFAS No. 144, Accounting for the Impairment orDisposal of Long-Lived Assets (SFAS 144). The Group adopted the standard onJanuary 1, 2002. SFAS 144 requires all long-lived assets to be disposed of and
Notes to the consolidated financial statements 135Financial information
discontinued operations to be measured at the lower of the carrying amount or fairvalue less costs to sell. SFAS 144 establishes additional criteria for determiningwhen a long-lived asset is held-for-sale. It also broadens the definition ofdiscontinued operations but does not allow for the accrual of future operating losses,as was previously permitted. Other than the presentation of discontinued operationsin the statement of income, and the classification of related assets and liabilities asheld-for-sale in the consolidated balance sheets, the adoption of SFAS 144 did nothave a material impact on the Group’s consolidated financial position, results ofoperations or cash flows.
In June 2001, the FASB issued SFAS No. 143, Accounting for Asset RetirementObligations (SFAS 143), which addresses financial accounting and reporting forobligations associated with the retirement of tangible long-lived assets and theassociated asset retirement costs. SFAS 143 requires that the fair value of a liabilityfor an asset retirement obligation be recognized in the period in which it is incurredand that the associated asset retirement costs be capitalized as part of the carryingamount of the long-lived asset. The statement became effective for fiscal yearsbeginning after June 15, 2002. The effect of initially adopting SFAS 143 is reportedas a cumulative effect of a change in accounting principle in the 2003 results ofoperations as an after-tax loss of CHF 21 million.
Effective July 1, 2001, the Group adopted the provisions of SFAS No. 141,Business Combinations (SFAS 141) and certain provisions of SFAS No. 142,Goodwill and Other Intangible Assets (SFAS 142), as required for goodwill andindefinite-lived intangible assets resulting from business combinations consummatedafter June 30, 2001. SFAS 141 requires that all business combinationsconsummated after June 30, 2001, be accounted for using the purchase method.Effective January 1, 2002, the Group adopted the remaining provisions of SFAS142 under which goodwill and indefinite-lived intangible assets are no longeramortized but are subject to impairment tests, at least annually. The Groupcompleted the required transitional impairment test of goodwill and indefinite-livedintangible assets as of January 1, 2002, and determined that there was noimpairment of goodwill or intangible assets and no effect on the Group’sconsolidated financial condition or results of operations as of January 1, 2002.Additionally, upon adoption, the Group reclassified certain intangible assets asfollows: CHF 1,946 million from finite lived intangibles to goodwill and CHF 71million from goodwill to finite-lived intangibles. See notes 16 and 17 for additionalinformation on goodwill and identifiable intangible assets.
STANDARDS TO BE ADOPTED IN FUTURE PERIODS
In December 2004, the FASB issued SFAS No. 123 (Revised 2004), Share-BasedPayment (SFAS 123R). SFAS 123R is effective for interim or annual reportingperiods beginning after June 15, 2005. The Group had previously adopted therecognition provisions of SFAS 123, as discussed in note 1. Under SFAS 123R, acompany that has previously adopted the recognition provisions of SFAS 123 mustadopt the revised standard using the modified prospective method, and may alsochoose to apply the modified retrospective method to prior reporting periods. TheGroup has chosen to early adopt the new standard as of January 1, 2005, applyingthe modified prospective method.

Financial information Notes to the consolidated financial statements136
The most significant accounting implications of the adoption of SFAS 123R for theGroup are as follows: (i) Inclusion of forfeitures in the estimate of compensationexpense determined at the grant date rather than as they occur. The Group recordeda cumulative adjustment of approximately CHF 14 million during the first quarter of2005, to reverse the expense previously recognized on all outstanding unvestedawards expected to be forfeited. For new grants after January 1, 2005, forfeitureswill be included in the initial estimation of the compensation expense at the grantdate; (ii) Recognition of compensation cost for all outstanding unvested awards as ofJanuary 1, 2005, that were previously accounted for under APB 25 and for whichno expense was previously recognized, based on the original grant-date fair value ofeach award over the remaining requisite service period of the respective award. Theeffect of this change has been quantified and will not have a material impact on theGroup’s 2005 net income; (iii) Adoption of changes to the presentation of thestatement of cash flows in accordance with the revised standard.
In December 2004, the FASB issued SFAS No. 153, Exchanges of NonmonetaryAssets, which becomes effective for financial statements for fiscal years beginningafter June 15, 2005. According to Accounting Principles Board Opinion No. 29(APB 29), exchanges of nonmonetary assets are generally measured based on thefair value of the assets exchanged, with certain exceptions. SFAS 153 amends APB29 to eliminate the exception for nonmonetary exchanges of similar productiveassets, which were exchanged at carrying values, and replaces it with a generalexception for exchanges of nonmonetary assets that do not have commercialsubstance. A nonmonetary exchange has commercial substance if the future cashflows of the entity are expected to change significantly as a result of the exchange.The adoption of SFAS 153 is not expected to have a material impact on the Group’sfinancial position, results of operations or cash flows.
In December 2003, the AICPA issued Statement of Position (SOP) 03-3,Accounting for Certain Loans or Debt Securities Acquired in a Transfer (SOP 03-3).SOP 03-3 provides guidance on the accounting for differences between contractualand expected cash flows from the purchaser’s initial investment in loans or debtsecurities acquired in a transfer, if those differences are attributable, at least in part,to credit quality. Among other things, SOP 03-3: (1) prohibits the recognition of theexcess of contractual cash flows as an adjustment of yield, loss accrual or valuationallowance at the time of purchase; (2) requires that subsequent increases inexpected cash flows be recognized prospectively through an adjustment of yield; and(3) requires that subsequent decreases in expected cash flows be recognized as animpairment. In addition, SOP 03-3 prohibits the creation or carrying over of avaluation allowance in the initial accounting of all loans within its scope that areacquired in a transfer. SOP 03-3 becomes effective for loans or debt securitiesacquired in fiscal years beginning after December 15, 2004. The adoption of SOP03-3 is not expected to have a material impact on the Group’s financial position,results of operations or cash flows.

Notes to the consolidated financial statements 137Financial information
3 Business developments and subsequent events
The Group’s significant divestitures and acquisitions for the years ended December31, 2004, 2003 and 2002 are discussed below.
DIVESTITURES
In December 2004, Credit Suisse Group agreed to sell its 19.9% stake in theprivate equity activities of Warburg Pincus, which it acquired in July 1999. Theinvestment was repurchased by Warburg Pincus with effect from January 1, 2005.In connection with this transaction, the Group recorded a pre-tax loss of CHF 157million, which comprises a CHF 32 million loss compared to carrying value at thetime of sale, and a foreign exchange loss of CHF 125 million already recognizedearlier as a reduction to equity.
Effective November 22, 2004, Winterthur finalized the divestiture of one of its twoCanadian operations, L’Unique Compagnie d’Assurances Générales, based inQuebec, to La Capitale Assurances Générales, Inc. The sale price, which was paidin cash, was CHF 46 million. In connection with this transaction, the Group recordeda pre-tax loss of CHF 7 million.
Effective August 11, 2004, the Group’s Belgian operations finalized the divestitureof the Dutch branch of its subsidiary, Les Assurés Réunis (LAR), to DAS Legalassistance. Both parties to the transaction agreed not to disclose the price andconditions of the sale.
Effective July 8, 2004, Winterthur finalized the divestiture of its French non -lifesubsidiary Rhodia Assurances S.A (Rhodia) to April Group. Both parties to thetransaction agreed not to disclose the price and conditions of the sale. In connectionwith this transaction, the Group recorded a pre-tax loss of CHF 32 million.
Effective July 1, 2004, Winterthur finalized the divestiture of its Life & Pensionssubsidiary Personal Pension Management Limited (PPML), a wholly ownedsubsidiary of Winterthur Life UK, to the Capita Group Plc. Both parties to thetransaction agreed not to disclose the price and conditions of the sale. In connectionwith this transaction, the Group recorded a pre-tax loss of CHF 11 million.
Effective September 1, 2003, the Group finalized the sale of Churchill InsuranceGroup, plc (Churchill), its UK non-life insurance operations, to the Royal Bank ofScotland. Cash consideration of CHF 2.4 billion was received. In connection withthis transaction, the Group recorded a pre-tax loss of CHF 291 million.
Effective August 27, 2003, the Group finalized the sale of Republic FinancialServices, Inc. formerly part of Winterthur’s US non-life insurance operations, to a USinvestor group led by Wand Partners Inc. The sale price was CHF 167 million. Inconnection with this transaction, the Group recorded a pre-tax loss of CHF 125million.
Effective August 26, 2003, the Group finalized the sale of Winterthur Italia HoldingS.p.A., Winterthur Assicurazioni S.p.A. and Winterthur Vita S.p.A., its Italianinsurance operations, to Unipol Assicurazioni SpA. The sale price was CHF 2.3

Financial information Notes to the consolidated financial statements138
billion. In connection with this transaction, the Group recorded a pre-tax gain of CHF190 million.
Effective May 1, 2003, the Group sold Credit Suisse First Boston’s clearing andexecution platform, Pershing LLC, to The Bank of New York Company, Inc. for CHF2.7 billion in cash, the repayment of a CHF 653 million subordinated loan and acontingent payment of up to CHF 68 million based on future performance. Inconnection with this transaction, the Group recognized a pre-tax loss of CHF 275million, of which CHF 246 million was recorded in 2002 and CHF 29 million wasrecorded in 2003.
Effective January 1, 2002, the Group sold Winterthur Versicherungs AG, WinterthurPensionskassen AG und Wintisa Management and Consulting AG, its insurance andpension fund business in Austria, to Zürich Kosmos Versicherungs AG, a subsidiaryof Zurich Financial Services Group. Both parties to the transaction agreed not todisclose the price and conditions of the sale. In connection with this transaction, theGroup recorded a pre-tax loss of CHF 185 million.
Effective January 1, 2002, the Group transferred the insurance operations andcertain assets and liabilities of Winterthur Assurances, Paris, and Winterthur Vie,Paris, France, to Mutuelles du Mans Assurances. Both parties to the transactionagreed not to disclose the price and conditions of the sale. In connection with thistransaction, the Group recorded a pre-tax loss of CHF 32 million.
The Group sold Winterthur’s large corporate risks insurance operations (WinterthurInternational) to XL Capital Ltd. (XL) in 2001 for an initial cash consideration ofCHF 730 million. The sale price was subject to final determination in December2003, agreement was reached with XL on the final sale price, which resulted in thereturn of CHF 93 million of the purchase price to XL and an overall loss on the saleof CHF 50 million. The sale is subject to additional indemnification provisions.
Contingencies with respect to significant indemnification provisions provided by theGroup are discussed in note 37.
ACQUISITIONS
On September 17, 2002, the Group acquired 100% of the shares of Premier LifeLtd., Luxembourg, and the portfolio of Premier Life Ltd., Bermuda, for a purchaseprice of CHF 30 million and CHF 14 million, respectively. The Luxembourgacquisition was accounted for under the purchase method of accounting and,accordingly, the results of operations were included in the consolidated financialstatements for the first time in the fourth quarter of 2002. The total goodwill wasCHF 9 million. The portfolio in Bermuda was also accounted for as a purchase andfirst included in the results of operations in the third quarter of 2002.
SUBSEQUENT EVENTS
There were no material events subsequent to December 31, 2004, that wouldrequire disclosure or adjustment to the financial statements.

Notes to the consolidated financial statements 139Financial information
The following table summarizes the results of discontinued operations, including gains and losses on sales:
Year ended December 31, in CHF m 2004 2003 2002
Total revenues 78 5,442 7,870
Total expenses (71) (5,477)1) (7,805)
Income/(loss) before taxes from discontinued operations 7 (35) 65
Gain/(loss) on disposal of stock (139) (234) (526)
Income tax expense/(benefit) (32) 114 5
Income/(loss) from discontinued operations, net of tax (100) (383) (466)
1) Including charges from indemnification provisions.
4 Discontinued operations
The results of operations of entities disposed of or classified as held-for-sale werereported as Discontinued operations in the consolidated statement of income for allyears presented.
The Group presents the assets and liabilities of entities classified as held-for-sale asDiscontinued operations – assets and Discontinued operations – liabilities,respectively, in the consolidated balance sheets. Assets and liabilities are reclassifiedas held-for-sale in the period in which the disposal determination is made and priorperiods are not reclassified.
5 Segment information
OVERVIEW
Credit Suisse Group is a global financial services company domiciled in Zurich,Switzerland. The Group’s activities are divided into three main business units,described below, and the Corporate Center. The business units are further dividedinto six operating segments, detailed below. The Corporate Center performs typicalparent company functions such as internal audit, group communications, accountingand financial reporting, tax, investor relations, capital and liquidity management,corporate development, legal and compliance and risk management. The CorporateCenter accounts include parent company operations and certain centrally managedinvestments and functions. Corporate Center costs and revenues attributable tooperating other Group-wide businesses have been allocated to the respectivesegments. The Corporate Center accounts also include expenses for projectssponsored by the Group, as well as consolidation adjustments. As of December 31,2004, the Group’s reportable operating segments were as discussed below.

Financial information Notes to the consolidated financial statements140
The Credit Suisse business unit operates through two segments:
– Private Banking, providing high-net-worth clients in Switzerland and innumerous other markets around the world with wealth management products andservices.
– Corporate & Retail Banking, offering banking products and services tocorporate and retail clients in Switzerland.
The Credit Suisse First Boston business unit operates through two segments:
– Institutional Securities, providing financial advisory and capital raising servicesand sales and trading for global users and suppliers.
– Wealth & Asset Management, offering international asset managementservices to institutional, mutual fund and private investors, making private equityinvestments and managing private equity funds, and providing financial advisoryservices to high-net-worth individuals and corporate investors.
The Winterthur business unit operates through two segments:
– Life & Pensions, offering life insurance products through multiple distributionchannels to private and corporate clients in Switzerland and selected markets inEurope and Asia.
– Non-Life, providing non-life insurance products to private and small and medium-sized corporate clients in Switzerland, North America and certain markets inEurope.
On January 1, 2004, Credit Suisse Group changed the basis for its financialstatements from Swiss GAAP to US GAAP and prior year financial statements wererestated to US GAAP. Accordingly, segment information for the year endedDecember 31, 2004 is on a US GAAP basis and prior periods have been restated toconform to the current year basis.
SEGMENT REPORTING
Inter-segment revenue sharing and cost allocation Responsibility for each product is allocated to a segment, which records all relatedrevenues and expenses. Revenue-sharing agreements govern the compensationreceived by one segment for generating revenue on behalf of another. Theseagreements are negotiated periodically by the relevant segments on a product-by-product basis. Allocated revenues are added to, or deducted from, the revenue lineitem of the respective segments.
Certain administrative, processing and information technology services may be basedin one segment but shared by other segments. The segment supplying the servicereceives compensation from the recipient segment on the basis of service levelagreements and transfer payments. Service level agreements are negotiatedperiodically by the relevant segments with regard to each individual product or

Notes to the consolidated financial statements 141Financial information
service. The costs of shared services and their related allocations are added to, ordeducted from, Other expenses for the respective segments.
The aim of the revenue-sharing and cost allocation agreements is to reflect thepricing structure of unrelated third-party transactions. Where this is not possible, theagreements are negotiated by the affected segments.
Taxes Taxes are calculated individually for each segment on the basis of average tax ratesacross its various geographic markets, as if the segment operated on a stand-alonebasis. The difference between these average tax rates and our actual consolidatedtax expense results in an adjustment to taxes at the Corporate Center.
2004
Net revenues 7,170 3,348 13,120 1) 4,202 2) 15,166 11,860 (852) 54,014
Income/(loss) from continuingoperations before taxes, minority interests,extraordinary items andcumulative effect ofaccounting changes 3,033 1,175 1,780 3) 1,663 4) 704 318 (371) 8,302
Net income/(loss) 2,473 901 1,313 530 522 206 (317) 5,628
Total assets 5) 188,697 99,469 707,918 6) 12,664 7) 165,275 (84,538) 1,089,485
1) Including CHF 128 million in minority interest revenues relating to the FIN 46R consolidation of certain private equity funds. 2) Including CHF 960 million in minority interestrevenues relating to the FIN 46R consolidation of certain private equity funds. 3) Including CHF 123 million in minority interest revenues/expenses relating to the FIN 46Rconsolidation of certain private equity funds. 4) Including CHF 949 million in minority interest revenues/expenses relating to the FIN 46R consolidation of certain private equityfunds. 5) Segment split for Life & Pensions and Non-Life not available. 6) Includes total assets in VIEs of CHF 8,928 million as of December 31, 2004, which wereconsolidated under FIN 46R. 7) Includes total assets in VIEs of CHF 2,632 million as of December 31, 2004, which were consolidated under FIN 46R.
The following table presents selected line items relating to the Group’s operating segments and the CorporateCenter:
Corporate & Wealth & CreditPrivate Retail Institutional Asset Life & Corporate Suisse
in CHF m Banking Banking Securities Management Pensions Non-Life Center Group
2002
Net revenues 6,012 2,663 14,326 3,038 12,707 9,731 (1,232) 47,245
Income/(loss) from continuingoperations before taxes,minority interests,extraordinary items andcumulative effect ofaccounting changes 1,611 (405) (2,191) 73 (1,218) (1,317) (787) (4,234)
Net income/(loss) 1,181 (294) (1,032) (477) (1,928) (1,099) (799) (4,448)
2003
Net revenues 6,499 3,293 12,190 2,990 15,948 11,172 (739) 51,353
Income/(loss) from continuingoperations before taxes, minority interests,extraordinary items andcumulative effect ofaccounting changes 2,482 750 1,544 243 (2,272) (472) (464) 1,811
Net income/(loss) 1,936 586 892 233 (2,035) (374) (468) 770
Total assets 5) 174,934 98,468 644,375 7,418 163,028 (83,915) 1,004,308

Credit Suisse Group Annual Report 2004142
SEGMENT REPORTING BY GEOGRAPHIC LOCATION
2004
Net revenues 20,381 18,434 12,594 2,605 54,014
Total expenses 1) (18,263) (16,214) (9,060) (2,175) (45,712)
Income from continuing operations before taxes, minority interests, extraordinary items and cumulative effect of accounting changes 2,118 2,220 3,534 430 8,302
1) Includes total benefits, claims and credit losses and total operating expenses.
The following table sets forth the consolidated results by geographic location, based on the location of the officerecording the transactions. This presentation does not reflect the way the Group is managed.
Europe Asia/(excluding Pacific/
Year ended December 31, in CHF m Switzerland Switzerland) Americas Africa Total
2002
Net revenues 19,322 15,227 10,302 2,394 47,245
Total expenses 1) (21,947) (13,914) (13,257) (2,361) (51,479)
Income/(loss) from continuing operations before taxes,minority interests, extraordinary items andcumulative effect of accounting changes (2,625) 1,313 (2,955) 33 (4,234)
2003
Net revenues 20,186 20,220 8,657 2,290 51,353
Total expenses 1) (20,947) (17,257) (9,264) (2,074) (49,542)
Income/(loss) from continuing operations before taxes,minority interests, extraordinary items andcumulative effect of accounting changes (761) 2,963 (607) 216 1,811
2004
Premises and equipment 4,279 1,978 833 141 7,231
Total assets 226,487 363,486 403,233 96,279 1,089,485
The following table sets forth details of assets by geographic location. The analysis of premises and equipment isbased on the location of the reporting entities, whereas the analysis of total assets reflects the customers’ domicile.
Europe Asia/(excluding Pacific/
December 31, in CHF m Switzerland Switzerland) Americas Africa Total
2003
Premises and equipment 4,531 2,152 1,004 132 7,819
Total assets 188,733 358,511 376,484 80,580 1,004,308
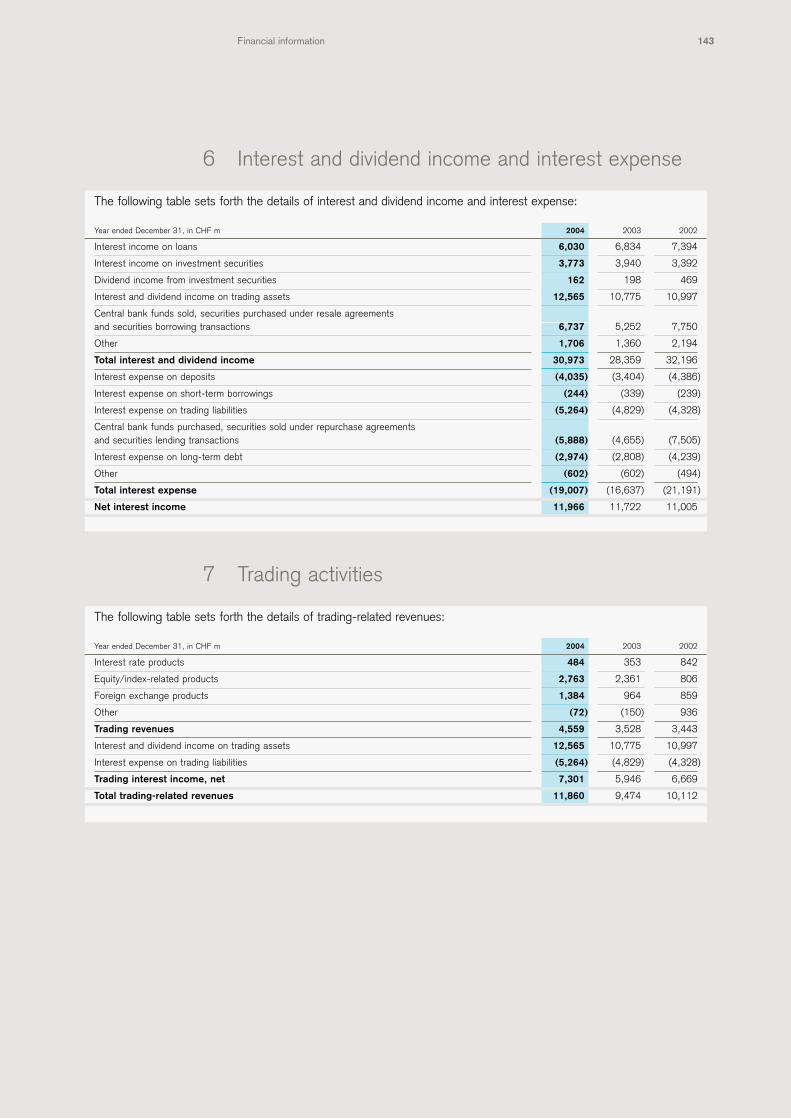
143Financial information
The following table sets forth the details of trading-related revenues:
Year ended December 31, in CHF m 2004 2003 2002
Interest rate products 484 353 842
Equity/index-related products 2,763 2,361 806
Foreign exchange products 1,384 964 859
Other (72) (150) 936
Trading revenues 4,559 3,528 3,443
Interest and dividend income on trading assets 12,565 10,775 10,997
Interest expense on trading liabilities (5,264) (4,829) (4,328)
Trading interest income, net 7,301 5,946 6,669
Total trading-related revenues 11,860 9,474 10,112
The following table sets forth the details of interest and dividend income and interest expense:
Year ended December 31, in CHF m 2004 2003 2002
Interest income on loans 6,030 6,834 7,394
Interest income on investment securities 3,773 3,940 3,392
Dividend income from investment securities 162 198 469
Interest and dividend income on trading assets 12,565 10,775 10,997
Central bank funds sold, securities purchased under resale agreements and securities borrowing transactions 6,737 5,252 7,750
Other 1,706 1,360 2,194
Total interest and dividend income 30,973 28,359 32,196
Interest expense on deposits (4,035) (3,404) (4,386)
Interest expense on short-term borrowings (244) (339) (239)
Interest expense on trading liabilities (5,264) (4,829) (4,328)
Central bank funds purchased, securities sold under repurchase agreementsand securities lending transactions (5,888) (4,655) (7,505)
Interest expense on long-term debt (2,974) (2,808) (4,239)
Other (602) (602) (494)
Total interest expense (19,007) (16,637) (21,191)
Net interest income 11,966 11,722 11,005
6 Interest and dividend income and interest expense
7 Trading activities

Financial information Notes to the consolidated financial statements144
The following table sets forth the details of commissions and fees:
Year ended December 31, in CHF m 2004 2003 2002
Commissions from lending business 1,029 865 892
Investment and portfolio management fees 4,479 3,935 4,728
Commissions for other securities business 166 202 224
Commissions and fees from fiduciary activities 4,645 4,137 4,952
Underwriting fees 2,493 2,541 3,041
Brokerage fees 3,364 3,093 3,816
Commissions, brokerage, securities underwriting and other securities activities 5,857 5,634 6,857
Fees for other customer services 2,046 2,281 2,615
Commissions and fees 13,577 12,917 15,316
The following table sets forth the details of other revenues:
Year ended December 31, in CHF m 2004 2003 2002
Gains/(losses) from loans held-for-sale (27) (104) (199)
Gains/(losses) from long-lived assets held-for-sale 153 (21) (31)
Income/(loss) from equity method investments 217 38 (183)
Gains/(losses) from other investments 1,935 366 (641)
Business classified as deposit accounting 1) (1,068) (1,138) (15)
Other 672 803 560
Other revenues 1,882 (56) (509)
1) This line represents the sum of premiums, benefits and change in provisions for future policyholder benefits from the insurance business which has to be classified as depositaccounting. The change in provisions for future policyholder benefits includes a credited investment income as a charge but the corresponding investment revenues are part ofnet interest income, trading revenues and realized gains/losses from investment securities. Additionally, effective January 1, 2003, upon adoption of SOP 03-1, the assets andliabilities related to certain separate account products were required to be accounted for as general account assets and liabilities, due to certain criteria not being met. As aresult, the investment revenues for certain unit-linked policies are included in trading revenue, while the investment credited to the policyholder is recorded in other revenues asa charge, which explains the large difference between 2002 and 2003.
8 Noninterest revenues and expenses
The following table summarizes the details of trading assets and liabilities:
December 31, in CHF m 2004 2003
Trading assets
Debt securities 176,493 163,391
Equity securities 99,388 67,004
Positive replacement values of derivative trading positions 52,447 51,842
Other 18,141 15,541
Total trading assets 346,469 297,778
Trading liabilities
Short positions 92,401 98,424
Negative replacement values of derivative trading positions 57,729 57,907
Total trading liabilities 150,130 156,331

Notes to the consolidated financial statements 145Financial information
The following table sets forth the details of policyholder benefits, claims and dividends:
Year ended December 31, in CHF m 2004 2003 2002
Policyholder benefits and claims 19,730 20,543 21,187
Dividends to policyholders 1,281 2,258 (1,996)
Policyholder benefits, claims and dividends 21,011 22,801 19,191
The following table sets forth the details of banking compensation and benefits:
Year ended December 31, in CHF m 2004 2003 2002
Salaries and bonuses 10,753 9,721 11,851
Social security 740 669 679
Other 458 652 965
Banking compensation and benefits 11,951 11,042 13,495
The following table sets forth the details of other expenses:
Year ended December 31, in CHF m 2004 2003 2002
Occupancy expenses 834 848 988
IT, machinery, etc. 504 475 573
Depreciation expenses 1,026 1,346 1,597
Amortization and impairment of other intangible assets 57 353 93
Provisions and losses 311 484 1,374
Commission expenses 1,853 1,580 1,836
Travel and entertainment 481 411 543
Professional services 1,666 1,578 1,960
Other 1,665 1,875 2,104
Other expenses 8,397 8,950 11,068

Financial information Notes to the consolidated financial statements146
The following table sets forth insurance premiums, claims and related reinsurance for Life & Pensions and Non-Life:
December 31, in CHF m 2004 2003 2002
Life & Pensions
Direct 10,272 11,418 12,027
Assumed 26 76 241
Ceded (54) (83) (33)
Net premiums written 10,244 11,411 12,235
Direct 10,269 11,416 12,023
Assumed 20 71 203
Ceded (54) (83) (34)
Net premiums earned 10,235 11,404 12,192
Direct (11,806) (12,815) (13,104)
Assumed (25) (58) (382)
Ceded 40 45 4
Death and other benefits incurred (11,791) (12,828) (13,482)
Non-Life
Direct 11,036 10,751 10,359
Assumed 58 107 190
Ceded (380) (438) (330)
Net premiums written 10,714 10,420 10,219
Direct 10,956 10,619 10,173
Assumed 61 129 173
Ceded (378) (444) (343)
Net premiums earned 10,639 10,304 10,003
Direct (7,876) (7,984) (8,037)
Assumed (206) 99 (275)
Ceded 143 170 607
Claims and annuities incurred (7,939) (7,715) (7,705)
9 Insurance premiums, claims and related reinsurance

Notes to the consolidated financial statements 147Financial information
REINSURANCE
The Group’s Life & Pensions and Non-Life insurance subsidiaries cede some oftheir insurance risks to third parties in order to provide greater diversification of theirbusinesses, to provide additional capacity for future growth, to implement businesssharing arrangements, to protect against catastrophic events and to limit thepotential for losses arising from large risks.
The reinsurance arrangements do not relieve the Group of its direct obligation to itspolicyholders. Hence, a credit exposure exists to the extent that any reinsurer isunable to meet the obligations assumed under the reinsurance arrangements. TheGroup evaluates the financial condition of its reinsurers and monitors concentrationsof credit risk to reinsurers to minimize its exposure to significant losses fromreinsurers’ insolvencies. The Group’s current policy is generally to place itsreinsurance with companies rated “A” or better by Standard & Poor’s. A balancesheet provision has been recorded for estimated unrecoverable reinsurance of CHF12 million and CHF 6 million as of December 31, 2004 and 2003, respectively. Inaddition, certain reinsurance purchased on behalf of the Group by H.S. Weavers isuncollectible. However, uncollectible reinsurance on the H.S. Weavers business iscovered by the retroactive reinsurance agreement discussed below. In addition, theGroup’s policy is generally to hold collateral in the form of cash, securities andletters of credit as under the related reinsurance agreements. Concentrations withindividual reinsurers are not material to the Group and the Group is not substantiallydependent upon any individual reinsurance arrangements.
LIFE & PENSIONS REINSURANCE
The Group limits its exposure to losses on any single life. For traditional insuranceproducts, Life & Pensions retains a maximum of approximately CHF 4 million perindividual life. There are smaller retentions for certain geographic regions and otherproducts. Life reinsurance is entered into principally under surplus agreements onyearly renewable terms or on a modified co-insurance basis. Amounts recoverablefrom life reinsurers are estimated in a manner consistent with the assumptions usedfor the underlying policy benefits.
NON-LIFE REINSURANCE
The Group has a global catastrophe reinsurance protection program providingcoverage for losses arising from any one incident in excess of CHF 50 million inEurope and CHF 28 million (USD 25 million) in North America. Retention limits aregenerally based on the line of business and the jurisdiction of coverage. Reinsuranceassumed by the Group from other companies is done on a facultative basis.Following the sale of Churchill Insurance Group in the UK, Republic in the US and itsItalian operation in 2003, Winterthur’s catastrophe exposure has been significantlyreduced.
H.S. Weavers was an underwriting agent that wrote business on behalf of“Winterthur” Swiss Insurance Company through 1983. Such business included

Financial information Notes to the consolidated financial statements148
commercial umbrella and excess casualty business from US companies, and, as aresult, the Group has significant exposure to asbestos, pollution and other healthhazard claims. Effective July 1, 2000, Winterthur purchased retroactive reinsurancecoverage from National Indemnity Corporation to limit the exposure from this book ofbusiness. As a result of this retroactive reinsurance transaction, the Group recordeda net deferred gain in the amount of CHF 404 million. The deferred gain resultedfrom a carried provision of CHF 954 million, which was net of existing reinsurance ofCHF 258 million, exceeding the premium paid of CHF 550 million. As of December31, 2004 and 2003, the net deferred gain was CHF 140 million and CHF 153million, respectively. The decrease is due to fluctuations on the currency exchangerates.
10 Securities borrowed, lent and subject to repurchaseagreements
The following table summarizes the securities borrowed or purchased under agreements to resell, at their respectivecarrying values:
December 31, in CHF m 2004 2003
Central bank funds sold and securities purchased under resale agreements 140,471 149,336
Deposits paid for securities borrowed 126,698 107,747
Total central bank funds sold, securities purchased under resale agreements, and securities borrowing transactions 267,169 257,083
The following table summarizes the securities lent or sold under agreements to repurchase, at their respectivecarrying values:
December 31, in CHF m 2004 2003
Central bank funds purchased and securities sold under agreements to repurchase 207,004 192,638
Deposits received for securities lent 32,720 44,209
Total central bank funds purchased, securities sold under repurchase agreements, and securities lending transactions 239,724 236,847
The maximum month-end amount of securities purchased under agreements to resellwas CHF 349,429 million and CHF 272,412 million in 2004 and 2003, respectively.The average amount of securities purchased under agreements to resell during theyear was CHF 297,640 million and CHF 262,988 million in 2004 and 2003,respectively.
Purchase and reverse repurchase agreements represent collateralized financingtransactions used to earn net interest income, increase liquidity or facilitate tradingactivity. These instruments are collateralized principally by government securities andmoney market instruments and generally have terms ranging from overnight to alonger or unspecified period of time. The Group monitors the fair value of securitiesreceived or delivered on a daily basis. For reverse repurchase agreements, theGroup requests additional securities or the return of a portion of the cash disbursedwhen appropriate in response to a decline in the market value of the securitiesreceived. Similarly, the return of excess securities or additional cash is requestedwhen appropriate in response to an increase in the market value of securities soldunder repurchase agreements.

149Financial information
Securities borrowing and securities lending transactions are principally collateralizedby cash or marketable securities. Securities borrowed and securities lent that arecollateralized by cash are recorded at the amount of cash advanced and received.Securities lending transactions against non-cash collateral where the Group has theright to resell or repledge the collateral received are recorded at the fair value of thecollateral received. For securities lending transactions, the Group receives cash orsecurities collateral in an amount generally in excess of the market value ofsecurities lent. The Group monitors the market value of securities borrowed andsecurities lent on a daily basis and additional collateral is obtained as necessary.
In the event of counterparty default, the financing agreement provides the Groupwith the right to liquidate the collateral held. In the Group’s normal course ofbusiness, substantially all of the collateral received that may be sold or repledgedhas been sold or repledged as of December 31, 2004 and 2003, respectively.
The following tables summarize the details of debt and equity investment securities:
December 31, in CHF m 2004 2003
Debt securities held-to-maturity 15,355 17,386
Securities available-for-sale 85,010 88,421
Total investment securities 100,365 105,807
Gross GrossAmortized unrealized unrealized
December 31, 2004 in CHF m cost gains losses Fair value
Debt securities issued by the Swiss Federal Government,cantonal or local governmental entities 7,093 185 2 7,276
Debt securities issued by foreign governments 5,209 3 1 5,211
Corporate debt securities 1,204 7 0 1,211
Other 1,849 6 1 1,854
Debt securities held-to-maturity 15,355 201 4 15,552
Debt securities issued by the Swiss Federal Government,cantonal or local governmental entities 5,091 754 1 5,844
Debt securities issued by foreign governments 22,276 998 123 23,151
Corporate debt securities 39,817 1,964 866 40,915
Other 8,788 350 53 9,085
Debt securities available-for-sale 75,972 4,066 1,043 78,995
Public utilities 81 11 0 92
Banks, trust and insurance companies 1,313 238 21 1,530
Industrial and all other 3,987 452 46 4,393
Equity securities available-for-sale 5,381 701 67 6,015
Securities available-for-sale 81,353 4,767 1,110 85,010
11 Investment securities

Credit Suisse Group Annual Report 2004150
Gross GrossAmortized unrealized unrealized
December 31, 2003 in CHF m cost gains losses Fair value
Debt securities issued by the Swiss Federal Government,cantonal or local governmental entities 7,145 0 118 7,027
Debt securities issued by foreign governments 7,201 1 1 7,201
Corporate debt securities 1,196 0 17 1,179
Other 1,844 0 30 1,814
Debt securities held-to-maturity 17,386 1 166 17,221
Debt securities issued by the Swiss Federal Government,cantonal or local governmental entities 4,245 457 7 4,695
Debt securities issued by foreign governments 26,963 696 199 27,460
Corporate debt securities 41,730 1,400 659 42,471
Other 7,839 190 45 7,984
Debt securities available-for-sale 80,777 2,743 910 82,610
Public utilities 104 10 0 114
Banks, trust and insurance companies 1,539 185 26 1,698
Industrial and all other 3,670 357 28 3,999
Equity securities available-for-sale 5,313 552 54 5,811
Securities available-for-sale 86,090 3,295 964 88,421
The following table sets forth gross unrealized losses on investment securities and the related fair value, segregatedby investment category and length of time such investments have been in a continuous unrealized loss position:
Less than 12 months 12 months or more Total
Gross Gross Grossunrealized unrealized unrealized
December 31, 2004 in CHF m Fair value losses Fair value losses Fair value losses
Debt securities issued by the Swiss Federal Government, cantonal or local governmental entities 367 2 0 0 367 2
Debt securities issued by foreign governments 863 1 0 0 863 1
Corporate debt securities 145 0 0 0 145 0
Other 589 1 0 0 589 1
Debt securities held-to-maturity 1,964 4 0 0 1,964 4
Debt securities issued by the Swiss Federal Government, cantonal or local governmental entities 130 1 3 0 133 1
Debt securities issued by foreign governments 3,845 85 2,478 38 6,323 123
Corporate debt securities 6,377 809 657 57 7,034 866
Other 953 42 189 11 1,142 53
Debt securities available-for-sale 11,305 937 3,327 106 14,632 1,043
Equity securities available-for-sale 1,362 67 0 0 1,362 67
Securities available-for-sale 12,667 1,004 3,327 106 15,994 1,110
As of December 31, 2004, the aggregate investments in debt securities from twospecific counterparties were each in excess of 10% of consolidated shareholders’equity. Aggregate investments in debt securities issued by two Europeangovernments represented approximately 27% and 11%, of the December 31, 2004,balance of consolidated shareholders’ equity. The Standard & Poor’s ratings forthese were AAA and AA.

Notes to the consolidated financial statements 151Financial information
The following table sets forth proceeds from sales and realized gains and losses from available-for-sale securities:
Debt securities Equity securities
Year ended December 31, in CHF m 2004 2003 2002 2004 2003 2002
Proceeds from sales 28,673 44,279 42,001 8,000 11,148 18,873
Realized gains 1,292 1,846 1,112 769 802 2,748
Realized losses (486) (290) (592) (419) (824) (7,473)
Management determined that the unrealized losses on debt securities are primarilyattributable to general market interest, credit spread or exchange rate movements.Impairment has not been recorded as the Group has the intent and ability to hold thedebt securities to maturity. The unrealized losses on investments in equity securitiesare primarily attributable to market fluctuations rather than to specific adverseconditions.
Transfers of debt securities from available-for-sale to trading account assets resultedin gross realized gains of CHF 2 million during 2002. In 2004 and 2003, no suchtransfers occurred.
To meet asset and liability management requirements, the Group reclassified certaindebt securities with an amortized cost value of CHF 11,227 million from available-for-sale to held-to-maturity during 2003. The unrealized gain of CHF 583 million onthese securities, included in Accumulated other comprehensive income a separatecomponent of shareholders’ equity, will be amortized over the remaining life of thesecurities as an adjustment to yield. In 2004, no such debt securities werereclassified.
The Group recognized other-than-temporary impairments on available-for-sale andheld-to-maturity securities of CHF 195 million, CHF 629 million and CHF 4,837million in 2004, 2003 and 2002, respectively. Of these amounts, CHF 306 millionare included in the results of discontinued operations for 2002. No such amountsare included in the results of discontinued operations for 2004 and 2003.
The following table sets forth amortized cost, fair value and average yield of debt securities classified as available-for-sale and held-to-maturity:
Debt securities held-to-maturity Debt securities available-for-sale
Amortized AmortizedDecember 31, 2004, in CHF m cost Fair value Yield cost Fair value Yield
Due within 1 year 3,178 3,178 1.68% 4,840 5,597 2.63%
Due from 1 to 5 years 4,550 4,282 1.67% 28,906 29,786 3.77%
Due from 5 to 10 years 3,713 3,984 2.26% 28,766 29,598 4.52%
Due after 10 years 3,914 4,108 2.99% 13,460 14,014 4.85%
Total debt securities 15,355 15,552 2.15% 75,972 78,995 4.18%
As of December 31, 2004, financial investments from the insurance business withthe fair value and book value of CHF 122 million and CHF 120 million, respectively,were on deposit with regulatory authorities. The Group retains ownership of allsecurities on deposit with regulatory authorities and receives the related investmentincome.

Financial information Notes to the consolidated financial statements152
The following table sets forth the net change in unrealized gains and losses for investment securities from theinsurance businesses:
Year ended December 31, in CHF m 2004 2003 2002
Debt securities 959 (1,827) 2,644
Equity securities 99 583 292
Transfers of equity securities and securities classifiedas available-for-sale to held-to-maturity 0 372 0
Change in unrealized investment gains/(losses) 1,058 (872) 2,936
Adjustments
Deferred policy acquisition costs (4) 212 (141)
Present value of future profits 158 34 (250)
Policyholder liabilities (1,143) (182) (842)
Deferred income taxes (30) 297 (406)
Net change in unrealized investment gains/(losses) from the insurance business before minority interests 39 (511) 1,297
Minority interests 64 (3) 108
Net change in unrealized investment gains/(losses) from the insurance business 103 (514) 1,405
The following table summarizes details of other investments:
December 31, in CHF m 2004 2003
Equity method investments 1,708 1,690
Non-marketable equity securities 11,580 6,204
Total other investments 13,288 7,894
12 Other investments
Gross unrealized losses on non-marketable equity securities, which have been in acontinuous unrealized loss position for less than 12 months, amount to CHF 3million. At December 31, 2004, these securities had a fair value of CHF 32 million.There were no gross unrealized losses above 12 months.
Unrealized gains and losses, which represent the difference between fair value andamortized cost, are recorded in Accumulated other comprehensive income withinShareholders’ equity, net of income taxes and adjustments to insurance policyholderliabilities and deferred acquisition costs on participating policies (shadowadjustments).

Notes to the consolidated financial statements 153Financial information
The following table summarizes details of real estate held for investment:
December 31, in CHF m 2004 2003
Land 2,425 2,538
Buildings and improvements 8,126 8,118
Cost value 10,551 10,656
Accumulated depreciation (1,581) (1,508)
Net book value 8,970 9,148
13 Real estate held for investment
As a result of a decrease in market values for real estate, predominantly inSwitzerland, the Group performed an impairment evaluation of its real estateportfolios in both 2004 and 2003, and certain properties were identified as impaired.The carrying values of the impaired properties were written down to the fair value,establishing a new cost basis. For these properties, fair values were measured basedon either discounted cash flow analyses or external market appraisals. Accordingly,impairment charges of CHF 6 million, CHF 36 million and CHF 29 million wererecorded in 2004, 2003 and 2002, respectively, and are included in Other revenuesin the consolidated income statement.
The following table sets forth details of the domestic (Switzerland) and foreign loan portfolio:
December 31, in CHF m 2004 2003
Banks 1,558 1,254
Commercial 43,000 42,811
Consumer 76,010 70,932
Public authorities 3,894 3,419
Lease financings 2,696 3,481
Switzerland 127,158 121,897
Banks 7,233 7,876
Commercial 33,873 31,264
Consumer 18,248 19,741
Public authorities 679 797
Lease financings 130 144
Foreign 60,163 59,822
Loans, gross 187,321 181,719
Deferred expenses, net 116 106
Allowance for loan losses (3,038) (4,646)
Total loans, net 184,399 177,179
14 Loans

Financial information Notes to the consolidated financial statements154
The following table sets forth the movements in the allowance for loan losses:
in CHF m 2004 2003 2002
Balance January 1 4,646 7,427 9,348
New provisions 816 1,686 3,194
Releases of provisions (737) (1,071) (690)
Net additions charged to income statement 79 615 2,504
Gross write-offs (1,781) (3,333) (3,692)
Recoveries 58 48 61
Net write-offs (1,723) (3,285) (3,631)
Allowances acquired/(deconsolidated) (24) 26 4
Provisions for interest 92 155 187
Foreign currency translation impact and other adjustments, net (32) (292) (985)
Balance December 31 3,038 4,646 7,427
As described in note 1, the allowance for loan losses is estimated considering avariety of sources of information including, as appropriate, discounted cash flowanalysis, fair value of collateral held less disposal costs and historical lossexperience.
The following table sets forth details of impaired loans, with or without a specific allowance. Loans are consideredimpaired when it is considered probable that the Group will not collect all amounts due under the loan terms.
December 31, in CHF m 2004 2003
With a specific allowance 3,910 6,459
Without a specific allowance 762 748
Total impaired loans, gross 4,672 7,207
Specific allowance for impaired loans 1) 2,659 4,193
1) Included in the allowances for loan losses.
The following table sets forth additional loan information:
Year ended December 31, in CHF m 2004 2003 2002
Average balance of impaired loans 5,465 8,204 13,397
Interest income which was recognized 23 52 107
Interest income recognized on a cash basis 71 119 158
Net gains/(losses) on the sale of loans 18 80 (188)
At December 31, 2004, the Group did not have any commitments to lend additionalfunds to debtors whose loan terms have been modified in troubled debtrestructurings.

Notes to the consolidated financial statements 155Financial information
The following table sets forth the details of premises (own-use real estate) and equipment:
December 31, in CHF m 2004 2003
Buildings and improvements 5,064 5,189
Land 1,351 1,392
Leasehold improvements 1,404 1,498
Software 2,440 2,447
Other 4,235 4,404
Premises and equipment 14,494 14,930
Accumulated depreciation (7,263) (7,111)
Total premises and equipment, net 7,231 7,819
15 Premises and equipment
The carrying value of internally developed software is assessed on a regular basis. In2004 and 2003, the Group recorded impairment charges of CHF 36 million andCHF 55 million, respectively, as a result of the assessments.
16 Goodwill
During 2004, there was no significant change in goodwill. The decrease in goodwillrelated to the weakening of the US dollar.
During 2003, as a result of the changing environment in the life and pensionsbusiness, the Group identified an excess in the carrying amount of goodwill over itsimplied fair value and recorded an impairment charge of CHF 1,510 million. TheGroup used projected cash flows and market multiples analyses to compute the fairvalue of this segment.
During 2003, primarily the disposals of Churchill Insurance Group, Republic FinancialServices and the Group’s Italian insurance operations resulted in a decrease of CHF1,633 million in goodwill in the consolidated balance sheet.
Goodwill acquired during year 0 2 0 0 0 3 5
Discontinued operations 0 0 0 0 (1) (10) (11)
Other 1) (12) (3) (544) (190) 0 (6) (755)
Balance December 31, 2004 502 200 7,167 2,377 432 886 11,564
1) Including foreign curreny translation impact on non-CHF denominated goodwill.
The following table sets forth the movements of goodwill by operating segment:
Wealth &Corporate & Asset Credit
Private Retail Institutional Manage- Life & Suissein CHF m Banking Banking Securities ment Pensions Non-Life Group
Balance December 31, 2002 516 199 8,494 2,856 2,198 2,401 16,664
Goodwill acquired during year 1 0 31 19 0 4 55
Impairment 0 0 0 0 (1,510) 0 (1,510)
Discontinued operations 0 0 0 0 (230) (1,403) (1,633)
Other 1) (3) 2 (814) (308) (25) (103) (1,251)
Balance December 31, 2003 514 201 7,711 2,567 433 899 12,325

Financial information Notes to the consolidated financial statements156
The following table sets forth the details of intangible assets:
2004 2003
Gross Accumu- Net Gross Accumu- Net carrying lated amor- carrying carrying lated amor- carrying
December 31, in CHF m amount tization amount amount tization amount
Amortized intangible assets (finite life)
Present value of future profits 4,810 (1,832) 2,978 4,834 (1,624) 3,210
Tradenames / trademarks 31 (7) 24 59 (27) 32
Client relationships 512 (160) 352 667 (243) 424
Other 342 (93) 249 365 (62) 303
Total amortizing intangible assets 5,695 (2,092) 3,603 5,925 (1,956) 3,969
Unamortized intangible assets (indefinite life) 86 – 86 87 – 87
Total intangible assets 5,781 (2,092) 3,689 6,012 (1,956) 4,056
Prior year has not been adjusted for discontinued operations.
The following table sets forth the estimated amortization expenses for intangible assets for the next five years:
Year ended December 31, in CHF m
2005 292
2006 268
2007 231
2008 221
2009 207
17 Intangible assets
At December 31, 2004 and 2003, CHF 86 million and CHF 87 million, respectively,of the Group’s acquired intangible assets were considered to have an indefinite lifeand therefore were not subject to amortization. All of the Group’s other acquiredintangible assets were subject to amortization.
During the year ended December 31, 2003, management decided to transfer theHigh Net Worth, or HNW, asset management business from the InstitutionalSecurities segment to the Wealth & Asset Management segment. A valuationanalysis was performed in 2003, and the Group determined that the carrying valueof its intangible assets relating to the management contracts and tradenamesassociated with the HNW business exceeded the expected future cash flows. Assuch, the Group recorded an impairment loss of CHF 270 million for the year endedDecember 31, 2003.
The aggregate amortization expenses for 2004, 2003 and 2002, were CHF 375million, CHF 609 million and CHF 632 million, respectively.

Notes to the consolidated financial statements 157Financial information
The following table sets forth the estimated amortization expense (net of accrued interest), before the effect ofunrealized gains and losses for the next five years:
Year ended December 31, in CHF m
2005 243
2006 223
2007 192
2008 182
2009 173
The following table sets forth the movements of present value of future profits:
in CHF m 2004 2003 2002
Balance January 1 3,550 4,182 4,893
Additions arising from acquisitions 0 0 17
Interest accrued during the year 160 166 175
Impairments and disposals 1) (7) (219) (59)
Amortization expenses (484) (690) (714)
Foreign currency translation impact and other (26) 111 (130)
Balance December 31 before adjustments 3,193 3,550 4,182
Adjustment for unrealized gains/(losses) on available-for-sale securities (215) (340) (401)
Balance December 31 2,978 3,210 3,781
PVFP is shown gross, prior to allocation of deferred bonus reserves.
1) Prior years have not been adjusted for discontinued operations.
18 Present value of future profits (PVFP)
In 2003, the PVFP was reduced by CHF 147 million due to the disposal ofWinterthur Italy. The remaining balance relates to impairments.

Financial information Notes to the consolidated financial statements158
The following table sets forth the details of other assets:
December 31, in CHF m 2004 2003
Positive replacement values of derivative instruments (hedging) 5,925 4,808
Brokerage receivables 30,733 21,140
Assets held for sale including:
Loans 10,477 8,768
Real estate held-for-sale 238 241
Assets held-for-sale 10,715 9,009
Interest and fees receivable 6,884 6,647
Deferred tax assets 4,688 4,988
Prepaid expenses 747 1,621
Other receivables from customers 14,344 12,323
Premiums and insurance balances receivable, net 6,945 8,008
Reinsurance recoverables 1) 1,646 2,103
Deferred policy acquisition costs, net 3,578 3,189
Other 4,761 4,450
Total other assets 90,966 78,286
1) Comprised of unearned premium reserves ceded and provisions from the insurance business ceded.
19 Other assets
As of December 31, 2004 and 2003, the Group held CHF 10.5 billion and CHF 8.8billion, respectively, of loans held-for-sale in its loan portfolio. The majority of theportfolio is comprised of floating rate commercial mortgages, which are purchased ororiginated with the intent of later securitizations. Loans held-for-sale are valued atthe lower of cost or market.
As of December 31, 2004 and 2003, the Group had a portfolio of CHF 238 millionand CHF 241 million, respectively, of real estate held-for-sale. These assets arevalued at the lower of the carrying amount or fair value less cost to sell. Nodepreciation charge is recognized but the assets are tested for impairment on anannual basis. For disposals where the expected sales proceeds for real estate held-for-sale are expected to be less than the respective carrying values, impairmentcharges of CHF 27 million, CHF 182 million and CHF 40 million were recorded in2004, 2003 and 2002, respectively.

Notes to the consolidated financial statements 159Financial information
The following table sets forth brokerage receivables and brokerage payables:
December 31, in CHF m 2004 2003
Due from customers 21,126 11,615
Due from banks, brokers and dealers 9,607 9,525
Total brokerage receivables 30,733 21,140
Due to customers 16,845 8,506
Due to banks, brokers and dealers 8,778 5,477
Total brokerage payables 25,623 13,983
20 Brokerage receivables and brokerage payables
The Group recognizes receivables and payables from transactions in financialinstruments purchased from and sold to customers, banks, brokers and dealers. TheGroup is exposed to a risk of loss resulting from the inability of counterparties to payfor or deliver financial instruments sold, in which case the Group would have to sellor purchase, respectively, these financial instruments at prevailing market prices. Tothe extent an exchange or clearing organization acts as a counterparty to atransaction, credit risk is generally considered to be reduced. The Group requirescustomers to maintain margin collateral in compliance with applicable regulatory andinternal guidelines.
The following table sets forth the movements of deferred policy acquisition costs:
Life & Pensions Non-Life Total
in CHF m 2004 2003 2002 2004 2003 2002 2004 2003 2002
Balance January 1 2,497 2,408 2,299 802 2,613 1,568 3,299 5,021 3,867
Disposals 0 (76) (112) (9) (2,169) (52) (9) (2,245) (164)
Costs deferred 739 746 684 1,601 1,951 3,860 2,340 2,697 4,544
Amortization expense (363) (626) (353) (1,517) (1,611) (2,575) (1,880) (2,237) (2,928)
Foreign currency translation impact (30) 45 (106) (18) 18 (172) (48) 63 (278)
Other 0 0 (4) 0 0 (16) 0 0 (20)
Balance December 31 before adjustments 2,843 2,497 2,408 859 802 2,613 3,702 3,299 5,021
Adjustment for unrealized gains/(losses)on available-for-sale securities (124) (110) (242) 0 0 0 (124) (110) (242)
Balance December 31 2,719 2,387 2,166 859 802 2,613 3,578 3,189 4,779
Prior years have not been adjusted for discontinued operations.
21 Deferred policy acquisition costs

Financial information Notes to the consolidated financial statements160
The following table sets forth the details of Swiss and foreign deposits. The designation of Switzerland versus foreignis based upon the location of the office recording the deposit.
2004 2003
December 31, in CHF m Switzerland Foreign Total Switzerland Foreign Total
Noninterest-bearing demand deposits 7,326 720 8,046 7,098 1,104 8,202
Interest-bearing demand deposits 47,400 9,394 56,794 50,267 7,121 57,388
Savings deposits 43,994 15 44,009 43,718 17 43,735
Time deposits 37,696 152,796 190,492 34,117 118,547 152,664
Total deposits 136,416 162,925 299,341 135,200 126,789 261,989
The following table sets forth the maturities of the Group’s time deposits:
December 31, in CHF m
2005 166,563
2006 15,714
2007 879
2008 480
2009 1,686
Thereafter 5,170
Total time deposits 190,492
22 Deposits
As of December 31, 2004 and 2003, CHF 1,753 million and CHF 373 million,respectively, of overdrawn deposit accounts were reclassified as loans.
The following table sets forth the details of provisions from the insurance business:
2004 2003
December 31, in CHF m Gross Net Gross Net
Unearned premiums 20 19 18 17
Unearned revenue liability 581 581 507 507
Future policyholder benefits 98,595 98,381 94,916 94,674
Future dividends to policyholders 4,393 4,395 2,696 2,695
Death and other benefits 5,202 5,129 4,621 4,574
Bonuses held on deposits 3,373 3,372 3,677 3,677
Provisions - Life & Pensions 112,164 111,877 106,435 106,144
Unearned premiums 2,621 2,549 2,686 2,615
Unpaid losses and loss adjustment expenses 13,639 12,366 13,489 11,759
Annuities 1,709 1,696 1,629 1,617
Future policyholder benefits (health care business) 5,073 5,073 4,571 4,571
Future dividends to policyholders (health care business) 1,955 1,955 1,727 1,727
Provisions - Non-Life 24,997 23,639 24,102 22,289
Total provisions from the insurance business 137,161 135,516 130,537 128,433
23 Provisions from the insurance business

Notes to the consolidated financial statements 161Financial information
The following table reconciles the gross provisions for unpaid losses and loss adjustment expenses (LAE) presentedin the balance sheets to the gross provisions for unpaid losses and LAE shown in the table below:
December 31, in CHF m 2004 2003 2002
Unpaid losses and loss adjustment expenses 13,639 13,489 18,105
Annuities 1,709 1,629 1,514
Provisions for unpaid losses and LAE, gross (balance sheet) 15,348 15,118 19,619
Winterthur reinsurance business 1) (132) (163) (282)
German health care business 2) (283) (236) (194)
Provisions for unpaid losses and LAE, gross 14,933 14,719 19,143
1) The Winterthur reinsurance business was divested in 1998. A 100% reinsurance contract was entered into for those contracts that were not novated. 2) German health carebusiness, which is included in the non-life business segment, has been excluded from the reclassification of unpaid losses and LAE in the following table as it is not a property-casualty like business.
The following table sets forth the movements of provisions for unpaid losses and LAE, including the effect ofreinsurance ceded, for the non-life insurance business:
in CHF m 2004 2003 2002
Unpaid losses and LAE, gross, January 1 14,719 19,143 19,588
Reinsurance recoverables on unpaid losses (1,578) (2,338) (2,892)
Provisions for unpaid losses and LAE, net, January 1 13,141 16,805 16,696
Discontinued operations 1) (67) (4,788) (221)
Current accident year 6,441 6,567 10,937
Prior accident years 2) 44 116 (172)
Losses and LAE incurred 6,485 6,683 10,765
Current accident year (2,853) (2,919) (5,173)
Prior accident years (2,730) (2,933) (3,928)
Losses and LAE paid (5,583) (5,852) (9,101)
Foreign currency translation impact (197) 293 (661)
Other 3) 0 0 (673)
Provisions for unpaid losses and LAE, net, December 31 13,779 13,141 16,805
Reinsurance recoverables on unpaid losses 1,154 1,578 2,338
Provisions for unpaid losses and LAE, gross, December 31 14,933 14,719 19,143
1) Includes provisions for losses and LAE related to disposed businesses (2004: France, USA, Canada and the Netherlands, 2003: Italy, UK and Republic and 2002: Portugaland Singapore). 2) The losses on prior accident years in 2004 and 2003 are impacted by certain reinsurance contracts related to discontinued businesses. The profit on prioraccident years in 2002 was primarily due to subsidiaries in Italy and the UK. 3) 2002 includes provisions of CHF –681 million for losses and LAE for subsidiaries/portfoliosthat Winterthur sold in 2002. Winterthur announced in 2001 the disposal of France and Austria and finalized it in 2002.
24 Provisions for unpaid losses and loss adjustmentexpenses from the non-life insurance business
Gross provisions for losses and LAE for asbestos and environmental claimswere CHF 596 million and CHF 704 million as of December 31, 2004 and2003, respectively. Of this amount, CHF 547 million in 2004 and CHF 613million in 2003 related to claims in North America. The change in reservespredominantly relates to foreign exchange differences.

Financial information Notes to the consolidated financial statements162
The following table sets forth the movement in liabilities for minimum guaranteed death benefits and annuitizationoptions reflected in the general account “Provisions for future policyholder benefits” as a result of the adoption ofSOP 03-1:
Minimum Minimumguaranteed guaranteed
death Annuitization Total death Annuitization Totalin CHF m benefits options 2004 benefits options 2003
Balance January 1 54 216 270 35 333 368
Incurred guaranteed benefits 25 (9) 16 20 (98) (78)
Paid guaranteed benefits (15) (33) (48) 0 (18) (18)
Foreign currency translation impact and other (3) 1 (2) (1) (1) (2)
Balance December 31 61 175 236 54 216 270
Net provisions for losses and LAE for asbestos and environmental claims were CHF182 million and CHF 202 million, as of December 31, 2004 and 2003, respectively.Of this amount, CHF 133 million in 2004 and CHF 129 million in 2003 related toclaims in North America. The difference between the gross and net provisions forlosses and LAE from asbestos and environmental claims is primarily due toreinsurance on H.S. Weavers (refer to note 9). Due to uncertainties, such aschanges in legislation, additional liabilities for asbestos and environmental claims mayarise for amounts in excess of the current provisions, of which the amounts cannotbe reasonably estimated. However, the Group believes it is not likely that any suchadditional losses will have a material adverse effect on the Group’s consolidatedfinancial position and results of operations.
As of December 31, 2004 and 2003, the carrying value of certain annuity type non-life reserves that are discounted, on a gross basis, were CHF 4,003 million andCHF 3,889 million, respectively. The discount amounts were CHF 1,903 million andCHF 1,863 million for 2004 and 2003, respectively. The discount rates used werebetween 3.3% and 6.0%.
LIFE CONTRACTS WITH GUARANTEES
The most significant guarantees were provided on the Swiss group life businesses forannuitization options. The actuarial assumptions used to determine the requiredreserve are based on the internally developed mortality tables 1996/2000, lapse ratesbased on internal statistics updated for 2004, a long-term investment return of 4.0%and a conversion rate ranging from 7.2% to 6.8%, depending on gender and age.
The Group had the following variable life insurance contracts with guarantees:
2004 2003
At AtEvent of annuiti- Event of annuiti-
December 31, in CHF m, except where indicated death zation death zation
Account value 1,176 110 910 116
Net amount at risk 8,917 1) 42 2) 8,689 1) 40 2)
Average attained age of contract holder (in years) 39 - 38 -
Weighted average period remaining until expected annuitization (in years) - 6 - 7
1) Current guaranteed minimum death benefit in excess of the current account balance at the balance sheet date. 2) Present value of the minimum guaranteed annuitypayments available to the contract holder determined in accordance with the terms of the contract in excess of the current account balance.

Notes to the consolidated financial statements 163Financial information
The following table shows the account balances for contracts with guarantees, which were invested in the followinginvestments at December 31:
December 31, in CHF m 2004 2003
Debt securities 71 10
Equity securities 1,141 932
Real estate 0 2
Cash and cash equivalents 74 82
Total 1,286 1,026
The balances above do not include investments made in connection with the Swiss group life business, as this business is not considered a separate account business underthe applicable accounting rules.
The following table shows unamortized sales inducements and persistency bonuses:
in CHF m 2004
Balance January 1 2
Amortized during the year 1
Balance December 31 3
25 Participating policies of the insurance businesses
Participating policies are policies where policyholders participate in the results basedon the experience of the insurer, depending on company practice, legal requirementsand/or market conditions and the jurisdiction. The amount of dividends to be paid isdetermined annually by the executive board of the respective companies where thedividends are paid.
Participating business for non-life insurance represented approximately 15% and12% of the total non-life insurance premium income for the years ended December31, 2004 and 2003, respectively. The increase in the percentage is mainly driven bythe increase in premium income from participating business (German health carebusiness).
Participating business for life insurance represents approximately 75% and 76% ofthe total life insurance sum assured in force as of December 31, 2004 and 2003,respectively, and approximately 89% and 97% of life insurance premium income for2004 and 2003, respectively.
As of December 31, 2004 and 2003, the amount of dividends to policyholdersincurred for the non-life business was an expense of CHF 291 million and of CHF397 million, respectively. The amount of dividends to policyholders paid for lifeinsurance was CHF 406 million and CHF 744 million for the years ended December31, 2004 and 2003, respectively.

Financial information Notes to the consolidated financial statements164
The following table sets forth the details of long-term debt:
December 31, in CHF m 2004 2003
Senior debt 86,424 70,616
Subordinated debt 19,837 19,081
Total long-term debt 106,261 89,697
The following table sets forth the details of maturities and interest rates for senior and subordinated debt:
December 31, in CHF m 2005 2006 2007 2008 2009 Thereafter Total 2004
Parent Company
Senior debt
Fixed Rate 0 641 748 406 349 465 2,609
Interest rates (range in %) - 4.0 4.0 3.5 3.5 7.3 –
Subordinated debt
Fixed rate 1,250 336 187 0 0 2,573 4,346
Interest rates (range in %) 6.0 3.6 3.5 – – 6.5-8.5 –
Subtotal - Parent Company 1,250 977 935 406 349 3,038 6,955
Subsidiaries
Senior debt
Fixed Rate 7,587 6,124 6,213 7,880 7,878 19,865 55,547
Variable rate 3,669 5,918 3,874 4,048 3,960 6,799 28,268
Interest rates (range in %) 0.0-22.0 0.0-19.9 0.0-20.0 0.0-10.5 0.0-7.6 0.0-18.4 –
Subordinated debt
Fixed rate 721 558 1,615 721 1,818 5,136 10,569
Variable rate 392 84 336 339 118 3,653 4,922
Interest rates (range in %) 0.0-8.3 0.0-7.8 2.3-11.2 0.0-6.1 0.0-8.3 0.0-10.3 –
Subtotal - Subsidiaries 12,369 12,684 12,038 12,988 13,774 35,453 99,306
Total long-term debt 13,619 13,661 12,973 13,394 14,123 38,491 106,261
26 Long-term debt
The Group issues both CHF and non-CHF denominated fixed and variable ratebonds. The weighted average coupon is based on the contractual terms, although forzero bonds the yield to maturity is applied. The Group uses derivative contracts,primarily interest rate and currency swaps, as hedges for some of its debt issues.The effects of these derivatives are not included in the interest rate range on theassociated debt. Included are various equity-linked and other indexed instruments.The interest on such instruments reflects the effective interest rate after theembedded derivative instrument has been separated.
During 2004, strong growth in the issuance of structured products in Credit Suisseand Credit Suisse First Boston was the main driver behind the increase in seniordebt issued.
In 2004, Credit Suisse Group and Credit Suisse First Boston (USA), Inc. chose notto renew their previously outstanding unsecured 364-day CHF 2.5 billion revolvingcredit facility with various banks. Credit Suisse First Boston, through various broker-dealer and bank subsidiaries, has negotiated secured bilateral committed creditarrangements with various third party banks. As of December 31, 2004, Credit

Notes to the consolidated financial statements 165Financial information
Suisse First Boston maintained seven such credit facilities that collectively totaledCHF 3.6 billion (USD 3.2 billion). These facilities require Credit Suisse FirstBoston’s various broker-dealer and bank subsidiaries to pledge unencumberedmarketable securities to secure any borrowings. Borrowings under each facility wouldbear interest at short-term rates related to either the Federal Funds rate or LIBORand can be used for general corporate purposes. The facilities contain customarycovenants that Credit Suisse First Boston believes will not impair its ability to obtainfunding. As of December 31, 2004, no borrowings were outstanding under any ofthe facilities.
MANDATORY CONVERTIBLE SECURITIES
On December 23, 2002, Credit Suisse Group Finance (Guernsey) Ltd. issuedsubordinated Mandatory Convertible Securities (“securities”) in the aggregate amountof CHF 1.25 billion. The securities were issued in the form of notes with adenomination of CHF 1,000 per note and a final maturity on December 23, 2005.Credit Suisse Group guaranteed the securities on a subordinated basis.
A fixed coupon amount of 6% per annum is payable at the discretion of the issuer –subject to certain coupon limitations – on December 23 of each year, beginning in2003 and up to and including the maturity date. On each date, Credit Suisse Grouppays a cash dividend or any other cash distribution to its shareholders or, subject tocertain exceptions, redeems any Credit Suisse Group shares (“shares”) or otherjunior or preferred obligations, an equivalent floating coupon amount per note ispayable in respect of such number of shares corresponding to 32.33107 shares pernote. Any coupon payment not due and payable will not remain owing or entitleholders to a claim in respect thereof upon a winding-up of the guarantor, or at anyother time (i.e. coupons are non-cumulative).
Mandatory conversion at maturity (redemption)Notes not converted before the 20th trading day prior to the maturity date will beredeemed through conversion into shares on the maturity date. Upon suchconversion, each note holder shall receive between 26.93966 and 32.33107 sharesper note converted based on the closing prices of the shares over a period prior tothe maturity date.
Voluntary conversion at the option of the note holdersNotes may be converted into shares any time after February 3, 2003, and beforethe 20th trading day prior to the maturity date at the election of each note holder.Upon such conversion, each note holder making such election shall receive26.93966 shares per note converted.
Early conversion at the option of the issuer Notes may be converted into shares at any time after February 3, 2003, and beforethe 20th trading day prior to the maturity date at the option of the issuer. Upon suchearly conversion, holders will receive 32.33107 shares per note plus all remainingfixed coupon amounts scheduled for payment up to and including the maturity date.This option can only be exercised if certain coupon limitations do not apply and if theshares to be delivered have the same entitlements (including dividends) as the otheroutstanding shares. As of December 31, 2004, none of the mandatory convertiblesecurities had been converted into shares.

Financial information Notes to the consolidated financial statements166
The following table sets forth the details of other liabilities:
December 31, in CHF m 2004 2003
Negative replacement values of derivative instruments (hedging) 1,712 1,169
Brokerage payables 25,623 13,983
Provisions 1) 1,778 1,998
Restructuring liabilities 49 92
Interest and fees payable 10,823 10,883
Current tax liabilities 2,486 2,413
Deferred tax liabilities 1,903 2,238
Liabilities related to the insurance business 7,225 8,822
Other 22,696 19,702
Total other liabilities 74,295 61,300
1) Includes provision for off-balance sheet risk of CHF 126 million and CHF 138 million as of December 31, 2004 and 2003, respectively.
27 Other liabilities
LIABILITIES DUE TO OWN PENSION FUNDS
Liabilities due to own pension funds as of December 31, 2004 and 2003 of CHF445 million and CHF 862 million, respectively, are partially included in abovebalances.
The charges of CHF 85 million in 2004, are primarily related to Winterthur andreflect expenses related to the reorganization plan announced in 2003 and the twolarger restructuring announcements in 2004 for Spain and Switzerland. In Spain,Winterthur streamlined the overall business structure to improve profitability andmarket competitiveness. In Switzerland, Winterthur combined the distributionstructures of the Life & Pensions and Non-Life segments and streamlined thestructure of the agencies. The majority of the reorganization activities werecompleted by the end of 2004, with the remaining total estimated cost of completingthe reorganizations in Switzerland, Germany and Spain to be approximately CHF 18million, CHF 12 million and CHF 3 million, respectively.
The following table sets forth the movements of restructuring and liabilities:
2004 2003 2002
in CHF m Personnel Other Total Personnel Other Total Personnel Other Total
Balance January 1 65 27 92 75 51 126 66 6 72
Net additions charged to income statement 62 23 85 80 31 111 33 10 43
Write-offs/recoveries, net 1) (100) (26) (126) (94) (57) (151) (64) (13) (77)
Transfers, foreign exchange 0 (2) (2) 4 2 6 40 48 88
Balance December 31 27 22 49 65 27 92 75 51 126
Prior years have not been adjusted for discontinued operations.
1) Includes cash paid or otherwise settled.
28 Restructuring liabilities

Notes to the consolidated financial statements 167Financial information
29 Accumulated other comprehensive income
Change 20 (1,062) 44 (243) (1,241)
Reclassification adjustments 4 150 (117) 0 37
Balance December 31, 2004 27 (3,998) 1,068 (820) (3,723)
1) Presented net of shadow adjustments.
The following table sets forth the movements of accumulated other comprehensive income, net of tax:
Gains/ Unrealized Minimum Accumulated(losses) Cumulative gains/ pension other com-
cash flow translation (losses) liability prehensivein CHF m hedge adjustment on securities 1) adjustment income/(loss)
Balance December 31, 2001 (255) 626 2,508 (216) 2,663
Change 221 (2,928) (489) (365) (3,561)
Reclassification adjustments 0 0 (358) 0 (358)
Balance December 31, 2002 (34) (2,302) 1,661 (581) (1,256)
Change 36 (1,019) (478) 4 (1,457)
Reclassification adjustments 1 235 (42) 0 194
Balance December 31, 2003 3 (3,086) 1,141 (577) (2,519)

Financial information Notes to the consolidated financial statements168
The following table sets forth details of the calculation of earnings per share:
Year ended December 31, in CHF m 2004 2003 2002
Income/(loss) from continuing operations before extraordinary items and cumulative effect of accounting changes 5,734 1,712 (4,060)
Income/(loss) from discontinued operations, net of tax (100) (383) (466)
Extraordinary items, net of tax 0 7 18
Cumulative effect of accounting changes, net of tax (6) (566) 60
Net income/(loss) - as reported 5,628 770 (4,448)
Net income/(loss) available for common shares for basic EPS 1) 5,455 748 (4,448)
Net income/(loss) available for common shares for diluted EPS 2) 5,744 748 (4,448)
Weighted-average common shares outstanding for basic EPS, in m 1,136.1 1,168.9 1,154.5
Effect of dilutive securities
Convertible securities 40.4 – 3) – 3)
Share options 8.0 7.6 – 3)
Share awards 24.9 2.1 – 3)
Adjusted weighted-average common shares for diluted EPS, in m 1,209.4 1,178.6 1,154.5
Basic earnings per share, in CHF
Income/(loss) from continuing operations before extraordinary items and cumulative effect of accounting changes 4.90 1.45 (3.52)
Income/(loss) from discontinued operations, net of tax (0.09) (0.33) (0.40)
Extraordinary items, net of tax 0.00 0.01 0.02
Cumulative effect of accounting changes, net of tax (0.01) (0.49) 0.05
Net income/(loss) available for common shares 4.80 0.64 (3.85)
Diluted earnings per share, in CHF
Income/(loss) from continuing operations before extraordinary items and cumulative effect of accounting changes 4.83 1.43 (3.52)
Income/(loss) from discontinued operations, net of tax (0.08) (0.33) (0.40)
Extraordinary items, net of tax 0.00 0.01 0.02
Cumulative effect of accounting changes, net of tax 0.00 (0.48) 0.05
Net income/(loss) available for common shares 4.75 0.63 (3.85)
1) In accordance with EITF 03-6, the basic earnings per share calculation considers the effect of participating securities. Specifically, the allocation of undistributed incomerelated to the mandatory convertible securities is a reduction to the net income available to common shareholders for the purposes of the calculation.The mandatory convertiblesecurities holders are not contractually obligated to participate in the losses of Credit Suisse Group, thus the calculation is not affected in a loss period. 2) Under the if-converted method for calculating diluted EPS, the interest on the mandatory convertible securities is included when the effect is dilutive. 3) The computation of the dilutedearnings per share excludes the effect of the potential exchange of convertible securities, the potential exercise of share options and the share awards as the effect would beanti-dilutive.
30 Earnings per share

Notes to the consolidated financial statements 169Financial information
31 Income taxes
The following table sets forth the details of current and deferred taxes:
Year ended December 31, in CHF m 2004 2003 2002
Switzerland 693 462 358
Foreign 821 194 172
Current income tax expense 1,514 656 530
Switzerland 1 43 (514)
Foreign (74) (702) (130)
Deferred income tax expense/(benefit) (73) (659) (644)
Income tax expense/(benefit) 1,441 (3) (114)
Income tax expense/(benefit) on discontinued operations (32) 114 5
Income tax expense/(benefit) on cumulative effect of accounting changes 0 (183) 0
Income tax expense/(benefit) reported in shareholders’ equity related to:
Cumulative translation adjustment (60) (16) 14
Unrealized gains/(losses) on securities 33 (217) (384)
Minimum pension liability adjustment (41) (59) (142)
Gains/(losses) cash flow hedges 1 3 (1)
Share based compensation and treasury shares (166) 58 8
The following table is a reconciliation of taxes computed at the Swiss statutory rate of 25% to the actual income taxexpense/(benefit):
Year ended December 31, in CHF m 2004 2003 2002
Income tax expense/(benefit) computed at the statutory tax rate 2,076 453 (1,059)
Increase/(decrease) in income taxes resulting from:
Foreign tax rate differential 1) 111 (598) (243)
Non-deductible amortization of intangible assets and goodwill impairment 10 391 165
Other non-deductible expenses 158 394 1,322
Additional taxable income 239 310 22
Lower taxed income 2) (1,064) (451) (968)
Changes in tax law and rates 1) (23) (471) 156
Changes in deferred tax valuation allowance 3) 117 (114) 856
Other 4) (183) 83 (365)
Income tax expense/(benefit) 1,441 (3) (114)
1) In December 2003 the German government abolished the tax exemption for realized gains on equities and dividend income for investments held by life and health insurancecompanies. Retroactive changes were also made to the taxation of investment funds. This change resulted in a release of the deferred tax provision that the Group was holdingin respect of realized and unrealized gains in investment funds. The change resulted in a tax benefit of CHF 782 million for the year ended December 31, 2003, of which CHF711 million was allocated to the policyholders, and accordingly the impact on net income was CHF 71 million for the year ended December 31, 2003. 2) Included in 2004 isan amount of CHF 268 million, representing the tax benefit from non-taxable income arising from investments that are required to be consolidated under FIN 46R. 3) In 2004there was a CHF 131 million tax benefit resulting from the release of valuation allowances on the deferred tax assets on net operating loss carry forwards, offset by currentyear additions. 4) Included in 2004 is an amount of CHF 230 million relating to the release of tax contingency accruals following the favorable resolution of tax matters withthe tax authorities.
The following table sets forth details of the income from continuing operations before taxes in Switzerland and foreigncountries:
Year ended December 31, in CHF m 2004 2003 2002
Switzerland 2,118 (761) (2,625)
Foreign 6,184 2,572 (1,609)
Income from continuing operations before taxes, minority interests,extraordinary items and cumulative effect of accounting changes 8,302 1,811 (4,234)

Financial information Notes to the consolidated financial statements170
The following table sets forth details of the tax effect of temporary differences that give rise to significant portions ofdeferred tax assets and deferred tax liabilities:
December 31, in CHF m 2004 2003
Insurance technical provisions 1,601 1,611
Employment compensation and benefits 1,572 1,512
Investment securities 499 420
Deferred policy acquisition costs 11 40
Provisions 901 1,231
Derivatives 226 349
Real estate 142 435
NOL carry-forwards 3,512 3,289
Other 1,857 1,621
Gross deferred tax asset before valuation allowance 10,321 10,508
Less valuation allowance (1,543) (1,653)
Gross deferred tax assets net of valuation allowance 8,778 8,855
Insurance technical provisions (615) (888)
Employment compensation and benefits (291) (240)
Investment securities (1,563) (1,209)
Present value of future profits (949) (1,155)
Deferred policy acquisition costs (1,093) (755)
Business combinations (261) (325)
Derivatives (169) (365)
Software capitalization (33) (83)
Leasing (109) (119)
Real estate (254) (411)
Other (656) (555)
Gross deferred tax liabilities (5,993) (6,105)
Net deferred tax assets 2,785 2,750
At December 31, 2004, the Group had accumulated undistributed earnings fromforeign subsidiaries of CHF 7,222 million. No deferred tax has been recorded, asthese earnings are considered indefinitely reinvested. It is not practicable to estimatethe amount of unrecognized deferred tax liabilities for these undistributed foreignearnings.
Net operating loss carry-forwards were CHF 12,139 million at December 31, 2004,of which CHF 2,631 million have no expiration date and CHF 9,508 million expire atvarious dates through to 2024.
Based upon the level of historical taxable income and projections for future taxableincome over the periods in which the temporary differences and tax loss carry-forwards are deductible, management believes it is more likely than not that theGroup will realize the benefits of these deductible differences and tax loss carry-forwards, net of existing valuation allowances as of December 31, 2004. Theamount of the deferred tax asset considered realizable, however, could be reduced inthe near term if estimates of future taxable income during the carry-forward periodare reduced.

Notes to the consolidated financial statements 171Financial information
The valuation allowance was CHF 1,400 million at January 1, 2002, increased byCHF 531 million in 2002, and decreased by CHF 278 million in 2003 and amountedto CHF 1,653 million as of December 31, 2003. During 2004, the valuationallowance decreased CHF 110 million to CHF 1,543 million at December 31, 2004.
Significant judgment is required in evaluating certain tax positions. The Groupaccrues for tax contingencies when, despite the belief that its tax return positionsare fully supportable, certain positions could be challenged and the Group’s positionsmay not be probable of being fully sustained. Once established, tax contingencyaccruals are adjusted due to changing facts and circumstances, such as case law,progress of audits or when an event occurs requiring a change to the taxcontingency accruals. Management regularly assesses the likelihood of adverseoutcomes to determine the appropriateness of provisions for income taxes. Althoughthe outcome of any dispute is uncertain, management believes that it hasappropriately accrued for any unfavorable outcome.
32 Employee share-based compensation and otherbenefits
SHARE-BASED COMPENSATION
The Group’s share-based compensation program is an important element of itsoverall compensation package for key employees and senior executives and is anintegral part of the Group’s annual compensation process. All share-based equityawards are granted under the provisions of the Credit Suisse Group Master SharePlan. Under the plan, share-based payment awards are granted in the form ofshares, share options or share units and represent retention incentives, specialawards, and a portion of the annual bonus. Shares and share options granted ascompensation awards generally vest upon grant, whereas shares and share optionsgranted as retention incentive awards generally vest between one and five years.The majority of share options cannot be exercised until at least one year after thegrant date and expire after ten years. Share options are granted with an exerciseprice at or above the market price of Credit Suisse Group’s shares on the date ofgrant.
In January 2005, as part of the 2004 compensation process, the Group also grantednew performance-based equity awards as retention incentive awards, which itbelieves better aligns the interest of its workforce with those of its shareholders. Thenew equity awards were granted in the form of share units. Each share unit providesthe holder with the potential to receive Credit Suisse Group common shares at theend of the five-year vesting period following the grant date, based on theachievement of certain performance and market criteria, continued employment withthe Group and certain other conditions such as restrictive covenants and forfeitureprovisions.
Total compensation expense for share-based payments recognized during 2004,2003 and 2002 was CHF 891 million, CHF 862 million and CHF 1,353 million,respectively. The Group generally repurchases its own shares on the open market tosatisfy these obligations but also has the possibility of issuing new shares out ofavailable conditional capital.

Financial information Notes to the consolidated financial statements172
The following table presents the share option activities during the periods indicated:
2004 2003 2002
Weighted- Weighted- Weighted-average average average
Number exercise Number exercise Number exerciseof options price of options price of options price
in m in CHF in m in CHF in m in CHF
OutstandingJanuary 1 69.5 53.07 139.2 54.85 87.5 66.81
Granted 1) 0.4 46.20 0.1 41.11 54.4 36.07
Exercised (3.9) 20.74 (0.8) 25.75 (0.4) 36.36
Settlements 0.0 74.00 (1.0) 67.38 (0.5) 64.12
Forfeited (1.1) 51.79 (2.5) 53.64 (1.8) 70.49
Exchanged, net - - (63.9) 56.65 - -
Expired (0.1) 72.50 (1.6) 67.50 - -
OutstandingDecember 31 64.8 55.01 69.5 53.07 139.2 54.85
ExercisableDecember 31 43.9 61.74 33.8 57.62 26.1 53.97
1) Includes options approved by the Compensation Committee subsequent to December 31 as part of the year-end compensation process. 0.07 million and 0.04 million of theseoptions granted in 2004 and 2003, respectively, are attributable to future service periods and are therefore not considered outstanding for SFAS 123 purposes.
Share options
The weighted-average fair value of options at the date of grant was CHF 13.78,CHF 13.78, and CHF 12.35 for 2004, 2003, and 2002, respectively. Theweighted-average calculation includes options granted subsequent to the financialyear-end as part of the financial year compensation.
The aggregate intrinsic value of options outstanding and options exercisable as ofDecember 31, 2004, is CHF 378 million and CHF 115 million, respectively. Thetotal intrinsic value of options exercised during 2004, 2003, and 2002 was CHF 97million, CHF 14 million, and CHF 10 million, respectively. Cash received from optionexercises during 2004, 2003, and 2002 was CHF 83 million, CHF 21 million, andCHF 13 million, respectively.
The table below provides additional information about share options outstanding as of December 31, 2004:
Options outstanding Options exercisable
Weighted- Weighted- Weighted- Weighted-Number of average average Number of average average
Range of options remaining exercise options remaining exerciseexercise price outstanding life price exercisable life pricein CHF in m in years in CHF in m in years in CHF
12.50 – 25.00 1.5 1.4 16.49 1.5 1.4 16.49
25.01 – 37.50 20.2 7.6 31.99 3.8 5.9 33.21
37.51 – 50.00 4.6 4.7 45.14 4.3 4.3 45.02
50.01 – 62.50 9.8 5.2 53.72 9.2 5.1 53.52
62.51 – 75.00 16.8 6.7 68.48 15.8 6.7 68.64
75.01 – 100.00 11.9 6.0 84.69 9.3 6.1 84.70
Total 64.8 6.4 55.01 43.9 5.7 61.74

Notes to the consolidated financial statements 173Financial information
As of January 1 and December 31, 2004, there were 4.2 million fully vested andexercisable options outstanding containing a cash settlement feature. These optionshave a weighted-average exercise price of CHF 65.94 and a weighted-averageremaining contractual term of 4.5 years. As of December 31, 2004, the outstandingand exercisable options did not have any intrinsic value and there were no significantexercises, settlements or forfeitures during 2004. During 2003 and 2002, cash paidto settle options was CHF 4 million.
On September 9, 2003, the Group completed its option reduction program, whichentitled employees to exchange on a value-for-value basis certain existing shareoptions for new share options and shares. The exercise price of the new shareoptions was 10% above the market price of the Group’s shares on the valuationdate. These share options were restricted for one year following the exchange andexpire seven years after the exchange. The new shares were granted at the marketprice of the Group’s shares on the valuation date and were restricted for one yearfollowing the exchange. In accordance with SFAS 123, the Group did not recognizeany compensation expense as a result of the exchange.
The following table provides a summary of the exchange resulting from the option reduction program:
Weighted- Weighted-average average Total
Number of exercise fair fairoptions/shares price value value
in m in CHF in CHF CHF m
Exchanged options (66.6) 56.40 14.40 (958.5)
New options 2.7 50.55 14.73 39.5
New shares 20.0 – 45.95 919.0
Share unitsIn January 2005, the Group granted 13.8 million share units with a fair value of CHF51.70 per unit on the grant date to a part of the workforce. These awards wereapproved by the Compensation Committee as part of the year-end compensationprocess. Total compensation expense will be determined based on the fair value ofthe share units multiplied by the total number of share units that ultimately vest. Thetotal number of share units that ultimately vest depends on the final outcome of theunderlying service and performance conditions over the course of the contractualterm. Each share unit has the potential to convert into a range of between 0 and 3share units depending on the outcome of the performance condition. Compensationexpense will be recognized over the vesting period based on management’s estimateof the number of share units that will vest, which is contingent upon the projectedoutcome of the underlying service and performance conditions and will be updatedon a periodic basis.

Financial information Notes to the consolidated financial statements174
The following table illustrates the significant assumptions used to estimate the fair value of share options and shareunits:
December 31 2004 2003 2002
Expected volatility, in % 1) 29.00 44.05 44.54
Expected dividend yield, in % 1) 3.03 1.99 1.83
Expected risk-free interest rate, in % 1.86 1.69 1.83
Expected term, in years 5 5 5
Includes assumptions used for the options and share units granted subsequent to December 31, 2004, as part of the year-end compensation process.
1) Due to current and changing market conditions, the Group refined its methodology in 2004 for estimating the expected volatility and expected dividend yield to includemanagement’s assessment of how future implied market yields impact the overall expected assumptions.
The expected volatility and dividend yield are based on the implied market volatilityand dividend yield of traded options on the Group’s stock, the historical volatility anddividend yield of the Group’s stock, and other relevant factors that indicate how thefuture is expected to differ from the past. The expected risk-free interest rate isbased on the current LIBOR rate at the date of grant which corresponds with theexpected term of the award. The LIBOR rates are used as a proxy for the risk-freeinterest rates because zero-coupon government issues do not exist in Switzerland.The expected term represents the period of time that the awards are expected to beoutstanding and is based on the contractual term of each instrument, taking intoaccount employees’ historical exercise and termination behavior.
Fair value assumptions for share-based paymentsIn estimating the fair value for equity-based instruments where an observableindependent quoted market price is not available, the Group uses valuationtechniques and/or option-pricing models that most accurately reflect the substantivecharacteristics of the instrument being valued. The underlying assumptions used inthe models are determined based on management’s assessment of the currentmarket and historical information available at the date of grant.

Notes to the consolidated financial statements 175Financial information
Shares
Granted 1) 1.7 47.35 26.5 46.62 28.2 46.66
Settled (9.3) 61.54 (27.2) 52.50 (36.5) 54.79
Forfeited (0.2) 51.90 (5.6) 46.00 (5.8) 46.24
Outstanding atDecember 31, 2004 13.5 59.97 81.3 45.35 94.8 47.43
1) Includes shares approved by the Compensation Committee subsequent to December 31 as part of the year-end-compensation process. 18.4 million, 26.6 million and 5.7million of these shares granted in 2004, 2003 and 2002, respectively, are attributable to future service periods and are therefore not considered outstanding for SFAS 123purposes. 2) Includes 20.0 million shares granted in the option reduction program and 19.2 million special equity retention awards.
The following table presents the share award activities during the periods indicated:
Weighted- Weighted- Weighted-average average average
Compensation grant-date Retention grant-date Total share grant-dateawards, fair value awards, fair value awards, fair value
Number of shares in m in CHF in m in CHF in m in CHF
Outstanding atDecember 31, 2001 24.8 74.19 46.1 75.63 70.9 75.13
Granted 1) 7.4 32.22 9.4 40.37 16.8 36.79
Settled (7.4) 71.58 (16.8) 75.87 (24.2) 74.56
Forfeited (0.3) 75.84 (2.5) 77.14 (2.8) 77.02
Outstanding atDecember 31, 2002 24.5 62.31 36.2 66.26 60.7 64.66
Granted 1) 2) 7.3 46.61 66.4 42.38 73.7 42.80
Settled (10.2) 52.97 (12.2) 74.90 (22.4) 64.89
Forfeited (0.3) 50.20 (2.8) 57.76 (3.1) 57.04
Outstanding atDecember 31, 2003 21.3 61.58 87.6 47.23 108.9 50.03
OTHER BENEFITS
In prior years, certain employees received a part of their compensation in the form ofa financial instrument linked to Credit Suisse First Boston’s long-term performance.Each unit entitles the holder to a potential future cash payment linked to CreditSuisse First Boston’s operating return on average allocated capital, taking intoaccount the Group’s cost of capital. Units have a three-year vesting period andcontractual term and are subject to forfeiture provisions. The number of unitsreceived by each individual was based upon a fixed monetary amount approved bythe Compensation Committee on the date of grant.
In 2002 and 2001, employees were granted 377,500 units with an initial value ofUSD 377 million. No additional units were granted in 2004 and 2003, and therewere 36,800 units forfeited as of December 31, 2004.

Financial information Notes to the consolidated financial statements176
33 Compensation to and equity holdings of membersof the Board of Directors and the most seniorexecutive body
COMPENSATION TO AND EQUITY HOLDINGS OF MEMBERS OF THEBOARD OF DIRECTORS
Compensation to Board members is set in accordance with the Articles ofAssociation and the Compensation Committee Charter. The annual compensationpaid to Board members for the period between two Annual Shareholders’ Meetingsis set by the Board of Directors based on the recommendation by the CompensationCommittee. Board compensation for members with no functional duties (eightindividuals) is in the form of blocked Credit Suisse Group registered shares of CHF0.50 nominal value, which are restricted for a period of four years. However, Boardmembers may elect to receive up to 35% of their compensation in cash.
Board members with functional duties (three individuals) receive a variablecomponent of compensation for their services as members of the Board in additionto the fixed compensation, as set by the Board of Directors. Such compensation ispaid in the form of cash and/or Credit Suisse Group registered shares, asdetermined by the Compensation Committee during the annual compensationprocess.
All Board members’ compensation is subject to a review of Board compensationlevels at comparable companies, which is conducted by an independentcompensation consultant, and self-assessment of Board performance.
The following table presents the allocation of 2004/05 compensation:
in CHF m, except Equity Total Number of Number of Pension andwhere indicated Cash value remuneration shares 1) options benefits
11 individuals 11.3 7.5 18.8 160,099 n/a 0.43
of which highest paid 2) 8.0 4.0 12.0 84,300 n/a 0.02
1) Value of shares included in total remuneration. 2) Highest paid is included in the consolidated Board of Directors figures above.
Additional fees and remunerationsCertain former members of the Board of Directors (three individuals) receivedbenefits in kind in the form of office use, secretarial support, etc.
No additional fees, severance payments or remuneration were paid to current orformer members of the Board of Directors or related parties during 2004.

Notes to the consolidated financial statements 177Financial information
COMPENSATION TO AND EQUITY HOLDINGS OF MEMBERS OF THEMOST SENIOR EXECUTIVE BODY
Compensation to the members of the Group’s senior executives is set by theCompensation Committee in accordance with its Charter, based on an extensivereview of competitor market data as well as individual contributions and companyperformance.
Credit Suisse Group’s most senior executive body is the Group Executive BoardCommittee (six individuals, including the Group Chief Executive Officer as Chairman),which was established effective July 13, 2004. The Group Executive Board was thesenior executive body prior to the establishment of the Group Executive BoardCommittee. For the period prior to July 13, 2004, data for the entire GroupExecutive Board is included.
The members of the Group Executive Board Committee and Group Executive Boardreceived their base salaries and a portion of their variable compensation in cash orshares, and the remaining part of their variable compensation in the form ofrestricted, performance-based Credit Suisse Group equity awards. Reference ismade to note 32 for a description of the Group’s equity awards.
In addition, the Compensation Committee granted a limited number of incentiveoptions under the provisions of the Credit Suisse Group Master Share Plan to certainmembers of the Group Executive Board as described above. Such options weregranted at a price not less than the fair market value of the underlying Credit SuisseGroup share at the date of grant. The options awarded for 2004 vest and becomeexercisable on each of the first, second and third anniversaries of the grant date andexpire after ten years.
The following table shows options on shares granted to one member of the Board of Directors, as of December 31,2004, as part of his prior years compensation:
ExerciseYear of Number of pricegrant options Expiry date in CHF
2002 75,000 03.12.12 34.10
2001 97,792 25.01.11 84.75
2000 100,000 01.03.10 74.00
1999 100,000 18.02.09 57.75
The following table shows the aggregate number of Credit Suisse Group registered shares held by members of theBoard of Directors (ten individuals):
NumberDecember 31 of shares
2004 568,323

Financial information Notes to the consolidated financial statements178
The following table shows the aggregate number of Credit Suisse Group shares held by members of the Groupexecutive Board Committee (four individuals):
NumberDecember 31 of shares
2004 1,833,693
The following table shows options on shares granted to two members of the Group Executive Board Committee, asof December 31, 2004, as part of their prior years’ compensation:
ExerciseYear of Number of pricegrant options Expiry date in CHF
2004 169,924 30.04.14 45.70
2003 1,000,000 22.01.13 30.60
2001 368,400 25.01.11 84.75
2000 140,000 01.03.10 74.00
Individuals who retired from their functions during the 2004 financial year receivedcash compensation relating to the performance of their respective duties.
Additional fees and remunerationsCertain former members of the Group Executive Board (three individuals) receivedbenefits in kind in the form of office use, secretarial support, etc.
No additional fees, severance payments or remuneration were paid to current orformer members of the Group Executive Board Committee or Group Executive Boardor related parties during 2004.
The following table presents the allocation of 2004 compensation:
Valuein CHF m, except of equity Total Number of Number of Pension andwhere indicated Cash awards remuneration equity awards 1) options 1) benefits
13 individuals as of January 1, 2004,and 6 individuals as of July 13, 2004and December 31, 2004 70.4 57.9 128.3 1,165,083 169,924 2.8
1) Value of shares and options included in equity value and total remuneration.

Notes to the consolidated financial statements 179Financial information
34 Pension and other post-retirement benefits
The Group has defined benefit pension plans, defined contribution pension plans andother post-retirement defined benefit plans. The Group’s principal plans are locatedin Switzerland, the United States, the United Kingdom and Germany. Themeasurement date for the Group’s defined benefit pension and other post-retirementdefined benefit plans is September 30.
SWISS PENSION PLANS
The pension funds of the Group in Switzerland are defined benefit plans and are setup as trusts domiciled in Zurich and Winterthur. All employees in Switzerland arecovered by these plans. The pension plan benefits exceed the minimum benefitsrequired under Swiss law. The defined benefit plans in Switzerland compriseapproximately 60% of all the Group’s employees participating in defined benefitplans, approximately 84% of the fair value of plan assets and approximately 80% ofthe pension benefit obligation of all defined benefit plans of the Group.
Employee contributions are calculated as a percentage of the employees’ salary leveland age, varying between 7.5% and 10.5%. The Group’s contributions are 167% ofthe employees’ contributions for the Credit Suisse Group main pension plan. For theWinterthur Swiss pension plan, the Group contributes at least the differencebetween the statutory costs of the plan and the contributions of the insured, theyield on the pension fund assets and the surplus from the Group insurancecontracts, but in any event an amount equal to at least 100% of the employees’contribution.
INTERNATIONAL PENSION PLANS
Various pension plans cover the Group’s employees in non-Swiss locations, includingboth defined benefit and defined contribution pension plans. Retirement benefitsunder the plans depend on age, contributions and salary. The Group’s funding policywith respect to these plans is consistent with local government and tax requirements.The assumptions used are derived based on local economic conditions. These plansprovide defined benefits in the event of retirement, death, disability or employmenttermination.
OTHER POST-RETIREMENT DEFINED BENEFIT PLANS
In the United States and Canada, the Group sponsors other post-retirement definedbenefit plans that provide health and welfare benefits for certain retired employees.

Financial information Notes to the consolidated financial statements180
The following table sets forth details of the net periodic pension cost for the Swiss and international defined benefitpension and other post-retirement defined benefit plans:
Other post-retirementDefined benefit pension plans defined benefit plans
Switzerland International International
Year ended December 31, in CHF m 2004 2003 2002 2004 2003 2002 2004 2003 2002
Service costs on benefit obligation 288 308 355 113 182 199 2 2 1
Interest costs on benefit obligation 530 505 510 180 178 177 5 6 5
Expected return on plan assets (761) (732) (763) (178) (165) (173) – – –
Amortization of
Unrecognized transition obligation/(asset) – 71 70 (5) (2) (2) – – –
Prior service cost 36 36 32 3 4 4 – – –
Unrecognized (gains)/losses – – 3 42 32 8 – 2 –
Net periodic pension costs 93 188 207 155 229 213 7 10 6
Settlement (gains)/losses – – – 3 4 6 – – –
Curtailment (gains)/losses – – – 5 – 17 – – –
Termination losses 13 44 35 5 5 4 – – –
Total pension costs 106 232 242 168 238 240 7 10 6
DEFINED BENEFIT PENSION AND OTHER POST-RETIREMENT DEFINEDBENEFIT PLANS

Notes to the consolidated financial statements 181Financial information
The following table shows the changes in the projected benefit obligation and the fair value of plan assets during2004 and 2003, and the amounts included in the Group’s consolidated balance sheet for the Group’s definedbenefit pension and other post-retirement defined benefit plans as of December 31, 2004 and 2003, respectively:
Otherpost-retirement
definedDefined benefit pension plans benefit plans
Switzerland International International
in CHF m 2004 2003 2004 2003 2004 2003
Projected benefit obligation - beginning of themeasurement period 14,550 13,492 3,232 3,289 93 72
Projected benefit obligation of countries added in current year – 285 36 (85) – –
Plan participant contributions 206 213 4 2 1 1
Service cost 288 308 113 182 2 2
Interest cost 530 505 180 178 5 6
Plan amendments – – 6 3 – –
Settlements – – (8) (76) – –
Curtailments – – (19) (25) – –
Special termination benefits 13 44 5 5 – –
Actuarial (gains)/losses (128) 363 174 (50) (6) 28
Business combinations – – – – – –
Benefit payments (713) (660) (94) (118) (6) (6)
Exchange rate (gains)/losses – – (125) (73) (7) (10)
Projected benefit obligation - end of themeasurement period 14,746 14,550 3,504 3,232 82 93
Fair value of plan assets - beginning of themeasurement period 13,507 12,648 2,069 1,716 – –
Assets of countries added in current year – 275 26 – – –
Actual return on plan assets 430 491 168 229 – –
Group contributions 411 540 547 361 5 5
Plan participant contributions 206 213 4 2 1 1
Settlements – – (8) (66) – –
Curtailments – – – – – –
Special termination benefits – – – – – –
Business combinations – – – – – –
Benefit payments (713) (660) (94) (118) (6) (6)
Exchange rate gains/(losses) – – (109) (55) – –
Fair value of plan assets - end of themeasurement period 13,841 13,507 2,603 2,069 – –
Total amount recognized
Funded status of the plan (905) (1,043) (901) (1,163) (82) (93)
Unrecognized
Net transition obligation/(asset) – – (4) (9) – –
Prior service cost 276 312 26 29 – (1)
Net actuarial (gains)/losses 1,681 1,479 1,013 935 15 24
Fourth quarter employer contributions 85 94 21 22 1 1
Net amount recognized December 31 1,137 842 155 (186) (66) (69)
Amounts recognized in the balance sheet consist of
Prepaid benefit costs 549 475 393 72 – –
Accrued benefit liability (232) (214) (755) (784) (66) (69)
Intangible asset 222 252 6 14 – –
Accumulated other comprehensive income 598 329 511 512 – –
Net amount recognized December 31 1,137 842 155 (186) (66) (69)
Accumulated benefit obligation - end of themeasurement period 13,975 13,665 3,189 2,795 – –

Financial information Notes to the consolidated financial statements182
In 2005, the Group expects to contribute CHF 613 million to the Swiss andInternational defined benefit pension plans, and CHF 5 million to other post-retirement defined benefit plans.
At September 30, 2004 and 2003, the total fair value of Credit Suisse Group debtsecurities included in plan assets were CHF 28 million and CHF 25 million,respectively, and the total fair value of Credit Suisse Group equity securities andoptions was CHF 547 million and CHF 201 million, respectively. At September 30,2004 and 2003, CHF 4,197 million and CHF 4,193 million, respectively, of the planassets of the Winterthur defined benefit pension plan were fully insured withWinterthur Life.
As of the measurement date, the projected benefit obligation (PBO), accumulated benefit obligation (ABO), and fairvalue of plan assets for defined benefit pension plans with a PBO in excess of plan assets and defined benefitpension plans with an ABO in excess of plan assets were as follows:
PBO exceeds fair value of plan assets ABO exceeds fair value of plan assets
Switzerland International Switzerland International
September 30, in CHF m 2004 2003 2004 2003 2004 2003 2004 2003
Projected benefit obligation 14,367 14,550 2,771 3,124 10,307 10,137 2,418 2,892
Accumulated benefit obligation 13,613 13,665 2,498 2,701 9,757 9,462 2,186 2,494
Fair value of plan assets 13,433 13,507 1,825 1,946 9,468 9,193 1,495 1,729
As of the measurement date in 2004 and 2003, defined benefit pension plans withan accumulated benefit obligation in excess of plan assets resulted in a CHF 271million and CHF 98 million increase in the minimum pension liability included inAccumulated other comprehensive income, respectively.

Notes to the consolidated financial statements 183Financial information
The weighted-average assumptions used in the measurement of the benefit obligation and net periodic pension costfor the defined benefit pension plans as of the measurement date were as follows:
Defined benefitpension plans
September 30, in % 2004 2003
Benefit obligations
Discount rate
Switzerland 3.8 3.8
International 5.4 5.6
Salary increases
Switzerland 2.3 2.3
International 3.8 3.7
Net benefit pension cost
Discount rate
Switzerland 3.8 3.8
International 5.6 5.6
Salary increases
Switzerland 2.4 2.3
International 3.7 3.9
Expected long-term rate of return on plan assets
Switzerland 5.2 5.6
International 6.6 7.0
ASSUMPTIONS
As of September 30, 2004 and 2003, an annual weighted average discount rate of6.0% was assumed in measuring the other post-retirement defined benefitobligation. For 2004 and 2003, an average discount rate of 6.0% and 6.3%,respectively, was assumed in measuring the other post-retirement defined benefitcosts.
In determining other post-retirement defined benefits cost for 2004 and 2003, anannual weighted-average rate of increase of 8.0% and 7.2%, respectively, in thecost of covered health care benefits was assumed. The rate is assumed to decreasegradually to 4.8% by 2010 and remain at that level thereafter. A 1% increase ordecrease in the health care cost trend rate assumption would not have had amaterial impact on the accumulated post-retirement defined benefit obligation orexpense.

Financial information Notes to the consolidated financial statements184
PLAN ASSETS AND INVESTMENT STRATEGY
The following table sets forth the weighted average asset allocation of the Group’s defined benefit pension planassets as at the measurement date:
Switzerland International
September 30, in % 2004 2003 2004 2003
Equity securities 13.5 9.9 43.6 41.4
Debt securities 33.1 31.9 18.4 20.0
Real estate 13.1 13.9 1.2 2.5
Alternative investments 3.7 3.5 6.6 4.5
Insurance 26.4 27.1 23.0 27.3
Liquidity 10.2 13.7 7.2 4.3
Total 100.0 100.0 100.0 100.0
The Credit Suisse Group defined benefit pension plans employ a total returninvestment approach, whereby a diversified mix of equities, fixed income investmentsand alternative investments are used to maximize the long-term return of plan assetswhile incurring a prudent level of risk. The intent of this strategy is to outperformplan liabilities over the long term in order to minimize plan expenses. Risk toleranceis established through careful consideration of plan liabilities, plan funded status andcorporate financial condition. Furthermore, equity investments are diversified acrossSwiss and non-Swiss stocks as well as between growth, value, and small and largecapitalization stocks. Other assets, such as real estate, private equity and hedgefunds, are used to enhance long-term returns while improving portfoliodiversification. Derivatives may be used to take market exposure but are not used toleverage the portfolio beyond the market value of the underlying investments.Investment risk is measured and monitored on an ongoing basis through annualliability measurements, periodic asset/liability studies and quarterly investmentportfolio reviews. To limit investment risk, the Credit Suisse Group pension planfollows defined strategic asset allocation guidelines. Depending on the marketconditions, these guidelines are even more limited on a short-term basis.
The Winterthur defined pension plan is an insured plan. The determination of thelong-term rate of return is based on the bonus expectations of the insurancecontracts with Winterthur Life. The plan assets are invested in insurance contractswith Winterthur Life and in Winterthur managed funds. The Investment Committee ofthe plan decided not to invest at its own risk until it expects to achieve a higher rateof return on assets than the return on the Winterthur portfolio. This decision isreviewed quarterly.

Notes to the consolidated financial statements 185Financial information
The following table presents benefit payments for defined benefit pension and other post-retirement defined benefitplans expected to be paid, which include the effect of expected future service for the years indicated:
Defined Other post-benefit retirement
pension definedin CHF m plans benefit plans
2005 894 5
2006 902 5
2007 915 5
2008 925 6
2009 946 6
Years 2010-2014 4,946 36
The weighted average target asset allocation of the Group’s defined benefit pension plan assets as at themeasurement date was:
September 30, 2004, in % Switzerland International
Equity securities 15.0 40.0
Debt securities 30.0 20.0
Real estate 15.0 5.0
Alternative investments 5.0 5.0
Insurance 25.0 25.0
Liquidity 10.0 5.0
ESTIMATED FUTURE BENEFIT PAYMENTS FOR DEFINED BENEFITPENSION AND OTHER POST-RETIREMENT DEFINED BENEFIT PLANS
DEFINED CONTRIBUTION PENSION PLANS
Credit Suisse Group also contributes to various defined contribution pension plansprimarily in the United States and the United Kingdom but also in other countriesthroughout the world. The contribution to these plans during 2004, 2003 and 2002,was CHF 280 million, CHF 122 million and CHF 164 million, respectively.

Financial information Notes to the consolidated financial statements186
Loans to members of the Board of Directors of Credit Suisse Group: 1)
in CHF m 2004 2003 2002
Balance January 1 24 30 21
Additions 3 6 9
Reductions 1 12 0
Balance December 31 26 24 30
1) None of the members of the Board of Directors has any executive function within the Group, which would require aggregated disclosure of outstanding loans with those of themembers of the most senior executive body. The number of individuals with outstanding loans at the beginning and at the end of the year was nine and six, respectively.
35 Related party transactions
A large majority of loans outstanding to members of the Board of Directors of CreditSuisse Group and the most senior executive body, the Group Executive BoardCommittee, are mortgages or loans against securities. Such loans are made on thesame terms available to third-party customers or pursuant to widely availableemployee benefit plans.
All mortgage loans to members of the Group Executive Board Committee aregranted either with variable interest rates or with fixed interest rates over a certainperiod. Typically, fixed mortgages are granted for periods of up to five years. Interestrates applied are based on refinancing costs plus a margin and interest rates andother terms are consistent with those applicable to other employees. When grantinga loan to these individuals, the same credit approval and risk assessment proceduresapply as for loans to all employees. Loans against securities are granted at interestrates and on terms applicable to such loans granted to other employees. Interestrates applied are based on refinancing costs plus a margin. In addition, someindividuals have outstanding loans in connection with certain private equityinvestment opportunities that the Group provides to certain of its employees underwidely available employee benefit plans. Interest rates applied are based onrefinancing costs plus a margin.
Loans to members of the most senior executive body: 1)
in CHF m 2004 2003 2002
Balance January 1 6 22 33
Additions 13 6 3
Reductions 6 22 14
Balance December 31 13 6 22
1) The number of individuals with outstanding loans at the beginning of the year and at the end of the year was six and four, respectively.
Loans outstanding made by the Group or any subsidiaries to equity method investees:
in CHF m 2004 2003 2002
Balance January 1 604 728 276
Movements 190 (124) 452
Balance December 31 794 604 728

Notes to the consolidated financial statements 187Financial information
In principle, members of the Board of Directors are not granted employee conditionson any loans extended to them, but such loans are subject to conditions applied tocustomers with a comparable credit standing. In addition to loans extended directlyto members of the Board, banking subsidiaries of Credit Suisse Group have enteredinto financing and other banking agreements with companies in which currentmembers of the Board of Directors have a significant influence. As of December 31,2004, the total exposure to such related parties amounted to CHF 61 million,including all advances and contingent liabilities. The highest exposure to such relatedparties for any of the years in the three-year period ended December 31, 2004 didnot exceed CHF 87 million.
Credit Suisse Group, together with its subsidiaries, is a global financial servicesprovider and, in particular, has major corporate banking operations in Switzerland.The Group, therefore, typically has relationships with many large companies includingthose in which Credit Suisse Group Board members assume management functionsor board member responsibilities. With one exception, none of the members of theBoard of Directors or companies affiliated with them have important businessrelationships with Credit Suisse Group or its banking subsidiaries. All relationshipswith the directors and their affiliated companies are in the ordinary course ofbusiness and are granted at arms’-length.
In addition, one of the Group’s indirect subsidiaries has agreed to invest USD 100million in an investment fund managed by a registered investment adviser owned andcontrolled by two close family members of a member of the Group Executive Board.The terms of the Group’s investment, including the fund’s structure and feearrangements, were negotiated on an arms’-length basis with the investment adviser.

Financial information Notes to the consolidated financial statements188
36 Derivatives and hedging activities
Derivatives are generally either privately negotiated over-the-counter (OTC) contractsor standard contracts transacted through regulated exchanges. The Group’s mostfrequently used freestanding derivative products, entered into for trading and riskmanagement purposes, include interest rate, cross-currency and credit defaultswaps, interest rate and foreign currency options, foreign exchange forwardcontracts, and foreign currency and interest rate futures.
Further, the Group enters into contracts that are not considered derivatives in theirentirety but include embedded derivative features. Such transactions primarily includeissued and purchased structured debt instruments where the return may becalculated by reference to an equity security, index, or third-party credit risk, or thathave non-standard interest or foreign currency terms.
On the date the derivative contract is entered into, the Group designates thederivative as belonging to one of the following categories:
(1) Trading activities;(2) A risk management transaction that does not qualify as a hedge under
accounting standards (referred to as an economic hedge);(3) A hedge of the fair value of a recognized asset or liability;(4) A hedge of the variability of cash flows to be received or paid related to a
recognized asset or liability or a forecasted transaction; or(5) A hedge of a net investment in a foreign operation.
TRADING ACTIVITIES
The Group is active in most of the principal trading markets and transacts in manypopular trading and hedging products. As noted above, this includes the use ofswaps, futures, options and structured products (custom transactions usingcombinations of derivatives) in connection with its sales and trading activities.Trading activities include market-making, positioning and arbitrage activities. Themajority of the Group’s derivatives held as of December 31, 2004, were used fortrading activities.
ECONOMIC HEDGES
The Group uses interest rate derivatives to manage its net interest rate risk oncertain of its core banking business assets and liabilities. However, these economichedge relationships, while used to manage risk, do not qualify for hedge accountingtreatment under US GAAP.
The Group also uses credit derivatives to manage the credit risk on certain of itsloan portfolios. These derivatives also do not qualify for hedge accounting treatmentunder US GAAP.

Notes to the consolidated financial statements 189Financial information
The following table sets forth details of net investment hedges:
December 31, in CHF m 2004 2003 2002
Net gain/(loss) hedges included in the AOCI (117) 15 0
The following table sets forth details of fair value hedges:
December 31, in CHF m 2004 2003 2002
Net gain/(loss) of the ineffective portion 32 50 (6)
Fair value of open derivative transactions used as fair value hedges 4,190 3,755 2,342
The following table sets forth details of cash flow hedges:
December 31, in CHF m 2004 2003 2002
Net gain/(loss) of the ineffective portion 0 1 0
Expected reclassification from AOCI into earnings during the next twelve months (1) (2) (5)
Fair value of open derivative transactions used as cash flow hedges 23 94 69
FAIR VALUE HEDGES
The Group designates fair value hedges as part of an overall interest rate riskmanagement strategy that incorporates the use of derivative instruments to minimizefluctuations in earnings that are caused by interest rate volatility. In addition tohedging changes in fair value due to interest rate risk, the Group uses:
– Cross-currency swaps to convert foreign currency denominated fixed rate assetsor liabilities to floating rate functional currency assets or liabilities, and
– Foreign currency forward contracts to hedge the foreign currency risk associatedwith available-for-sale-securities.
CASH FLOW HEDGES
The Group uses cash flow hedging strategies to mitigate its risk to variability of cashflows on loans, deposits and other debt obligations by using interest rate swaps toconvert variable rate assets or liabilities to fixed rates. The Group also uses cross-currency swaps to convert foreign currency denominated fixed and floating rateassets or liabilities to fixed rate CHF assets or liabilities. Further, the Group usesderivatives to hedge the cash flows associated with forecasted transactions.The maximum length of time over which the Group hedges its exposure to thevariability in future cash flows for forecasted transactions, excluding those forecastedtransactions related to the payment of variable interest on existing financialinstruments, is 16 months.
NET INVESTMENT HEDGES
The Group typically uses forward foreign exchange contracts to hedge selected netinvestments in foreign operations. The objective of these hedging transactions is toprotect against adverse movements in foreign exchange rates.

Financial information Notes to the consolidated financial statements190
37 Guarantees and commitments
GUARANTEES
The following tables set forth details of contingent liabilities associated with guarantees:
Maturity Maturity Maturity Maturityless than between between greater Total gross Total net Collateral Carrying
December 31, 2004, in CHF m 1 year 1 to 3 years 3 to 5 years than 5 years amount amount 1) received Value 2)
Credit guaranteesand similar instruments 3,167 1,353 3,308 2,597 10,425 8,907 3,992 12
Perfomance guaranteesand similar instruments 3,371 1,445 780 790 6,386 5,694 3,552 112
Securities lending indemnifications 24,808 0 0 0 24,808 24,808 24,808 0
Derivatives 50,087 58,764 96,103 42,500 247,454 247,454 186 2,482
Other guarantees 3) 2,314 271 171 356 3,112 3,112 1,348 25
Total guarantees 83,747 61,833 100,362 46,243 292,185 289,975 33,886 2,631
Credit guarantees are contracts that require the Group to make payments, shoulda third party fail to do so under a specified existing credit obligation. For example, inconnection with its corporate lending business and other corporate activities, theGroup provides guarantees to counterparties in the form of standby letters of credit,which represent obligations to make payments to third parties if the counterpartyfails to fulfill its obligation under a borrowing arrangement or other contractualobligation.
As part of the Group’s commercial mortgage activities in the US, the Group sellscertain commercial and residential mortgages that it has originated or purchased tothe Federal National Mortgage Association (FNMA) and agrees to bear a percentageof the losses, should the borrowers fail to perform. The Group also issuesguarantees that require it to reimburse FNMA for losses on certain whole loansunderlying mortgage-backed securities issued by FNMA.
The Group also provides guarantees to variable interest entities and othercounterparties under which it may be required to buy assets from such entities uponthe occurrence of certain triggering events.
Maturity Maturity Maturity Maturityless than between between greater Total gross Total net Collateral
December 31, 2003, in CHF m 1 year 1 to 3 years 3 to 5 years than 5 years amount amount 1) received
Credit guaranteesand similar instruments 4,933 2,206 1,901 1,107 10,147 8,194 4,504
Performance guaranteesand similar instruments 3,240 1,043 1,063 194 5,540 4,841 2,156
Securities lending indemnifications 21,888 0 0 0 21,888 21,888 21,888
Derivatives 89,509 37,797 72,383 17,049 216,738 216,738 228
Other guarantees 3) 2,017 235 79 370 2,701 2,701 1,056
Total guarantees 121,587 41,281 75,426 18,720 257,014 254,362 29,832
1) Total net amount relates to gross amount less any participations. 2) As of December 31, 2003, the Group’s carrying value was CHF 4.0 billion. 3) Contingentconsiderations in business combinations, residual value guarantees and other indemnifications.

Notes to the consolidated financial statements 191Financial information
Performance guarantees and similar instruments are arrangements that requirecontingent payments to be made when certain performance-related targets orcovenants are not met. Such covenants may include a customer’s obligation todeliver certain products and services or to perform under a construction contract.Performance-related guarantees are frequently executed as part of project financetransactions.
Under certain circumstances, the Group has provided investors in private equityfunds sponsored by a Group entity, guarantees of potential obligations of certaingeneral partners to return amounts previously paid as carried interest to thosegeneral partners. To manage its exposure, the Group generally withholds a portion ofcarried interest distributions to cover any repayment obligations. In addition, pursuantto certain contractual arrangements, the Group is obligated to make cash paymentsto certain investors in certain private equity funds if specified performance thresholdsare not met.
Further, as part of the Group’s residential mortgage securitization activities in theUnited States, the Group at times guarantees the collection by the servicer andremittance to the securitization trust of prepayment penalties.
Securities lending indemnifications are arrangements whereby the Group agreesto indemnify securities lending customers against losses incurred in the event thatsecurity borrowers do not return securities subject to the lending agreement and thecollateral held is insufficient to cover the market value of the securities borrowed.
Derivatives disclosed as guarantees are issued in the ordinary course of business,generally in the form of written put options and credit default swaps. FIN 45 doesnot require disclosures about derivative contracts if such contracts may be cashsettled, and the Group has no basis for concluding that it is probable that thecounterparties held the underlying instruments at the inception of the contracts. Forderivative contracts executed with counterparties which generally act as financialintermediaries, such as investment banks, hedge funds and security dealers, theGroup has concluded that there is no basis to assume that these counterparties holdthe underlying instruments related to the derivative contracts, and therefore does notreport such contracts as guarantees.
The Group manages its exposure to these derivatives by engaging in various hedgingstrategies to reduce its exposure. For some contracts, such as written interest ratecaps or foreign exchange options, the maximum payout is not determinable, asinterest rates or exchange rates could theoretically rise without limit. For thesecontracts, notional amounts are disclosed in the table above in order to provide anindication of the underlying exposure. In addition, the Group carries all derivatives atfair value in the balance sheet.
Other guarantees include acceptances, residual value guarantees and all otherguarantees that are not allocated to one of the captions above.
The Group has certain guarantees for which its maximum contingent liability cannotbe quantified. These guarantees are not reflected in the table above and arediscussed below.

Financial information Notes to the consolidated financial statements192
Disposals-related contingenciesIn connection with the sale of assets or businesses, the Group sometimes providesthe acquirer with certain indemnification provisions. These indemnification provisionsvary by counterparty in scope and duration and depend upon the type of assets orbusinesses sold. These indemnification provisions generally shift the potential risk ofcertain unquantifiable and unknowable loss contingencies (e.g. relating to litigation,tax, intellectual property matters and adequacy of claims reserves) from the acquirerto the seller. The Group closely monitors all such contractual agreements to ensurethat indemnification provisions are adequately provided for in the Group’s financialstatements. These indemnification provisions, sales price adjustments and the costof reinsurance protection for risk retained resulted in charges to the statement ofincome of CHF 413 million, CHF 341 million and CHF 93 million in the years endedDecember 31, 2004, 2003 and 2002, respectively. Contingencies with respect tosignificant indemnification provisions provided by the Group are discussed below.
In accordance with the terms of the Sale and Purchase Agreement (SPA) betweenXL Insurance (Bermuda) Limited (XL or the purchaser) and Winterthur SwissInsurance (Winterthur) for Winterthur International, Winterthur is required toparticipate with the purchaser in a review of any adverse development of loss andunearned premium reserves during a three-year post-completion seasoning period,which expired on June 30, 2004. This seasoning process will result in a balancingpayment being due to the purchaser.
The provision recorded by Winterthur at December 31, 2004 for this sale-relatedcontingency, net of pre-payments to and risks retained by XL, amounted to CHF623 million (USD 550 million). The provision, which reflects the adversedevelopment of CHF 737 million (USD 651 million) included in Winterthur’ssubmitted Seasoned Net Reserves Amount (SNRA), is based on an extensiveanalysis of data recently provided by XL. Winterthur utilized leading third-partyclaims, actuarial and legal specialists to assist in estimating the reserves required forthis liability. On the basis of the facts known, Credit Suisse Group believes that thecurrently recorded provision is adequate to cover the contingencies related to thistransaction.
The amount payable to XL for the SNRA is ultimately subject to an assessment bythe independent actuary designated in the SPA, who will determine which of theestimates submitted by the two parties is closest to the amount which theindependent actuary believes to be the correct amount, and that estimate will beconclusively deemed to be the relevant SNRA. This process is ongoing and,consequently, the ultimate resolution of this matter could result in a furthersignificant increase in the required provision for Winterthur International sale-relatedcontingencies. In February 2005, Winterthur and XL submitted their respectivedeterminations of the SNRA to the independent actuary. The current differencebetween the two positions under review by the independent actuary is CHF 1,029million (USD 909 million).
In addition to the SPA, Winterthur has several other agreements, includingretrocession agreements with XL, which could result in payments to XL.Furthermore, in the fourth quarter of 2004, XL submitted the first details of itsclaims relating to an alleged breach of warranties in connection with the 2001 sale.With the assistance of outside counsel, Winterthur has evaluated these claims andon the basis of the facts known, believes that the currently recorded provisions are

Notes to the consolidated financial statements 193Financial information
adequate to cover the contingencies related to this litigation and any otheragreements with XL.
In 2003, the Group entered into a profit and loss sharing agreement with thepurchaser of Churchill. In accordance with the terms of the SPA for Churchill, theGroup is required to reimburse the purchaser for a proportion of any losses in onespecific line of business of a subsidiary of Churchill. Profits in this one line ofbusiness are shared under similar terms. The amount payable or receivable underthe provisions of the Churchill SPA is determined based primarily on actuarialvaluations, which are updated and settled quarterly, with an independent actuarialvaluation of the provisions being performed twice each year.
Other indemnificationsThe Group provides indemnifications to certain counterparties in connection with itsnormal operating activities, for which it is not possible to estimate the maximumamount it could be obligated to pay. As a normal part of issuing its own securities,the Group typically agrees to reimburse holders for additional tax withholding chargesor assessments resulting from changes in applicable tax laws or the interpretation ofthose laws. Securities that include these agreements to pay additional amountsgenerally also include a related redemption or call provision if the obligation to paythe additional amounts results from a change in law or its interpretation and theobligation cannot be avoided by the issuer taking reasonable steps to avoid thepayment of additional amounts. Since such potential obligations are dependent onfuture changes in tax laws, the related liabilities the Group may incur as a result ofsuch changes cannot be reasonably estimated. In light of the related call provisionstypically included, the Group does not expect any potential liabilities in respect of taxgross-ups to be material.
The Group is a member of numerous securities exchanges and clearing houses, andmay, as a result of its membership arrangements, be required to perform if anothermember defaults. The Group has determined that it is not possible to estimate themaximum amount of these obligations and believes that any potential requirement tomake payments under these arrangements is remote.
LEASE COMMITMENTS
The following table sets forth details of future minimum operating lease commitments under non-cancellableoperating leases:
Year ended December 31, in CHF m
2005 675
2006 611
2007 540
2008 499
2009 455
Thereafter 5,288
Future operating lease commitments 8,068
Less minimum non-cancellable sublease rentals 1,152
Total net future minimum lease commitments 6,916

Financial information Notes to the consolidated financial statements194
The following table sets forth details of rental expenses for all operating leases:
Year ended December 31, in CHF m 2004 2003 2002
Minimum rentals 946 896 943
Sublease rental income (154) (57) (34)
Total net rental expenses 792 839 909
The following table sets forth details of other commitments:
Maturity Maturity Maturity Maturityless than between between greater Total gross Total net Collateral
December 31, 2004, in CHF m 1 year 1 to 3 years 3 to 5 years than 5 years amount amount received
Irrevocable commitments underdocumentary credits 4,356 5 28 1 4,390 4,076 1,577
Loan commitments 56,994 39,793 25,400 27,420 149,607 149,607 83,209
Forward reverse repurchase agreements 15,268 58 0 0 15,326 15,326 15,326
Other 1,003 419 216 987 2,625 2,625 567
Total other commitments 77,621 40,275 25,644 28,408 171,948 171,634 100,679
Maturity Maturity Maturity Maturityless than between between greater Total gross Total net Collateral
December 31, 2003, in CHF m 1 year 1 to 3 years 3 to 5 years than 5 years amount amount received
Irrevocable commitments underdocumentary credits 3,463 12 6 0 3,481 3,212 599
Loan commitments 61,989 43,605 14,608 25,728 145,930 145,930 84,821
Forward reverse repurchase agreements 12,537 0 0 0 12,537 12,537 12,537
Other 293 133 317 1,541 2,284 2,283 396
Total other commitments 78,282 43,750 14,931 27,269 164,232 163,962 98,353
OTHER COMMITMENTS
Irrevocable commitments under documentary credits include exposures fromtrade finance related to commercial letters of credit under which the Groupguarantees payment to an exporter against presentation of shipping and otherdocuments.
Loan commitments represent unused irrevocable credit facilities that cannot berevoked at any time without prior notice.
Forward reverse repurchase agreements represent transactions in which theinitial cash exchange of the reverse repurchase transaction takes place on aspecified future date.
Other commitments include private equity commitments, firm commitments inunderwriting securities, commitments arising from deferred payment letters of creditand from acceptances in circulation and liabilities for calls on shares and other equityinstruments.

Notes to the consolidated financial statements 195Financial information
The following table summarizes cash flows received from securitization trusts and pre-tax gains/(losses) recognizedby the Group on securitizations:
Year ended December 31, in CHF m 2004 2003 2002
Commercial mortgage loans
Proceeds from new securitizations 13,396 10,045 7,928
Gains/(losses) on securitizations and underwriting fees received 1) 368 333 226
Residential mortgage loans
Proceeds from new securitizations 53,795 91,027 35,685
Gains/(losses) on securitizations and underwriting fees received 1) 72 (122) (217)
Collateralized debt obligations (CDO)
Proceeds from new securitizations 8,612 17,056 16,108
Gains/(losses) on securitizations and underwriting fees received 1) 85 95 108
Other asset-backed securities 2)
Proceeds from new securitizations 9,775 7,047 1,963
Gains/(losses) on securitizations and underwriting fees received 1) 5 55 30
1) Includes the effects of hedging, underwriting and retained interest gains and losses but excludes all gains or losses, including net interest revenues, on assets prior tosecuritization. The net revenues earned while holding the residential mortgage loans prior to securitization significantly exceeded the amount of the losses from securitization.2) Primarily includes home equity loans.
38 Securitization activity
The Group originates and purchases commercial and residential mortgages for thepurpose of securitization. The Group sells these mortgage loans to qualified specialpurpose entities (QSPEs) or other variable interest entities (VIEs), which are notconsolidated by the Group. These QSPEs issue securities that are backed by theassets transferred to the QSPEs and pay a return based on the returns on thoseassets. Investors in these mortgage-backed securities typically have recourse to theassets in the QSPE. The investors and the QSPEs have no recourse to the Group’sassets. The Group is an underwriter of, and makes a market in, these securities.
The Group purchases loans and other debt obligations from clients for the purposeof securitization. The loans and other debt obligations are sold by the Group directly,or indirectly through affiliates, to QSPEs or other VIEs that issue collateralized debtobligations (CDOs). The Group structures, underwrites and makes a market in theseCDOs. CDOs are securities backed by the assets transferred to the CDO VIEs andpay a return based on the returns on those assets. Investors typically have recourseto the assets in the CDO VIEs. The investors and the CDO VIEs have no recourse tothe Group’s assets.
Included in residential mortgage loans in the table above are proceeds of CHF 18.4billion and CHF 54.4 billion related to the securitization of agency mortgage-backedsecurities for the years ended December 31, 2004 and 2003, respectively. For theyears ended December 31, 2004 and 2003, the Group realized gains of CHF 6million and CHF 61 million, respectively, from these securitizations.
The Group may retain interests in these securitized assets in connection with itsunderwriting and market-making activities. The Group’s exposure in its securitizationactivities is generally limited to its retained interests. Retained interests in securitizedfinancial assets are included at fair value in Trading assets in the consolidatedbalance sheet. Any changes in the fair value of these retained interests arerecognized in the consolidated statement of income. The fair values of retainedinterests are determined using fair value estimation techniques, such as the present

Financial information Notes to the consolidated financial statements196
Key economic assumptions used in measuring, at the date of securitization, the fair value of the retained interestsresulting from securitizations completed during the years ended December 31, 2004 and 2003, were as follows:
2004 2003
Commer- Other Commer- Othercial Residential Collaterali- asset- cial Residential Collaterali- asset-
mortgage mortgage zed debt backed mortgage mortgage zed debt backedDecember 31, in CHF m loans 1) loans obligations 2) securities loans 1) loans obligations 2) securities
Weighted-average life(in years) 4.0 3.6 16.7 2.2 3.0 4.5 8.6 3.1
Prepayment speed assumption(in rate per annum), in % 3) n/a 187-500 n/a 417-500 n/a 200-1,167 n/a 583
Cash flow discount rate(in rate per annum), in % 4) 7.3 2.8-39.5 4.8-16.0 11.1-15.0 7.8-12.8 11.9-38.9 2.9-5.9 2.3-10.4
Expected credit losses(in rate per annum), in % 0.2-19.3 0.1-39.9 0.2-16.3 0.4-11.6 1.1-23.3 0.2-30.6 0.1-29.4 1.2-7.7
The following table sets forth the fair value of retained interests from securitizations as of December 31, 2004, keyeconomic assumptions used to determine the fair value and the sensitivity of the fair value to immediate adversechanges in those assumptions:
Commercial Residential Collateralized Other asset-mortgage mortgage debt backed
in CHF m, except where indicated loans 1) loans obligations 2) securities
Carrying amount / fair value of retained interests 19 2,077 258 67
Weighted-average life (in years) 3.4 4.1 12.3 2.2
Prepayment speed assumption, in % 3) n/a 17-2,381 n/a 300-900
Impact on fair value from 10% adverse change n/a (7.3) n/a –
Impact on fair value from 20% adverse change n/a (11.1) n/a –
Cash flow discount rate, in % 4) 9.6 2.3-5.5 10.4 13.5
Impact on fair value from 10% adverse change – (29.8) (11.5) (1.1)
Impact on fair value from 20% adverse change (1.1) (58.5) (24.2) (2.3)
Expected credit losses 5.4 1.9 5.3 9.3
Impact on fair value from 10% adverse change – (7.1) (5.4) (1.1)
Impact on fair value from 20% adverse change – (14.3) (12.0) (1.1)
1) To deter prepayment, commercial mortgage loans typically have prepayment protection in the form of prepayment lockouts and yield maintenances. 2) Collateralized debtobligations are generally structured to be protected from prepayment risk. 3) Prepayment speed assumption (PSA) is an industry standard prepayment speed metric used forprojecting prepayments over the life of a residential mortgage loan. PSA utilizes the Constant Prepayment Rate (CPR) assumptions. A 100% prepayment assumption assumesa prepayment rate of 0.2% per annum of the outstanding principal balance of mortgage loans in the first month. This increases by 0.2 % thereafter during the term of themortgage loan, leveling off to a CPR of 6% per annum beginning in the thirtieth month and each month thereafter during the term of the mortgage loan. 100 PSA equals 6CPR. 4) The rate is based on the weighted-average yield on the retained interest.
value of estimated future cash flows that incorporate assumptions that marketparticipants customarily use in these valuation techniques. The Group does not retainmaterial servicing responsibilities from its securitization transactions.
Gains and losses on securitization transactions depend in part on the carrying valuesof mortgages and CDOs involved in the transfer, and are allocated between themortgages and CDOs sold and any retained interests according to the relative fairvalues at the date of sale.

Notes to the consolidated financial statements 197Financial information
These sensitivities are hypothetical and do not reflect the benefits of hedgingactivities and therefore should be used with caution. Changes in fair value based ona 10% or 20% variation in assumptions generally cannot be extrapolated becausethe relationship of the change in assumption to the change in fair value may not belinear. Also, the effect of a variation in a particular assumption on the fair value ofthe retained interests is calculated without changing any other assumption. Inpractice, changes in one assumption may result in changes in other assumptions (forexample, increases in market interest rates may result in lower prepayments andincreased credit losses), which might magnify or counteract the sensitivities.
39 Variable interest entities
FIN 46R “Consolidation of Variable Interest Entities – An Interpretation of ARB No.51”, requires the Group to consolidate all variable interest entities (VIEs) for which itis the primary beneficiary, defined as the entity that will absorb a majority ofexpected losses, receive a majority of the expected residual returns, or both. InDecember 2003, the FASB issued a revision to the original pronouncement, FIN 46,in order to address various implementation issues that had arisen and to providecompanies with the option of deferring the adoption of FIN 46R for certain VIEs toperiods ending after March 15, 2004.
As a normal part of its business, the Group engages in transactions with entities thatare considered VIEs. These transactions include selling or purchasing assets, actingas a counterparty in derivatives transactions and providing liquidity, credit or othersupport. Transactions with VIEs are generally executed to facilitate securitizationactivities or to meet specific client needs, such as providing liquidity or investmentopportunities. As a part of these activities, the Group may retain interests in VIEs.Substantially all of the consolidated assets of the VIEs act as collateral for relatedconsolidated liabilities. In general, investors in consolidated VIEs do not haverecourse to the Group in the event of a default, except where a guarantee wasprovided to the investors or where the Group is the counterparty to a derivativetransaction involving VIEs.
As of December 31, 2004 the Group consolidated all VIEs for which it is the primarybeneficiary under FIN 46R or the original provisions of FIN 46. For the year endedDecember 31, 2004, the Group recorded net revenue of CHF 1,073 million as aresult of the consolidation of VIEs under FIN 46R. Net income was unaffected asoffsetting minority interests were recorded in the Consolidated statements ofincome.

Financial information Notes to the consolidated financial statements198
The following table summarizes the estimated total assets by category related to non-consolidated VIEs:
Carrying Carryingvalue value
of VIEs’ of VIEs’total assets total assets
December 31, in CHF m 2004 2003
Collateralized debt obligations 57,517 45,982
Commercial paper conduits 4,456 7,730
Financial intermediation 67,326 88,367
Total 129,299 142,079
The following table summarizes the total assets, by category, related to VIEs consolidated as a result of the Groupbeing the primary beneficiary:
VIEs VIEstotal assets total assets
December 31, in CHF m 2004 2003
Collateralized debt obligations 1,398 2,425
Commercial paper conduits 3 1,715
Financial intermediation 11,119 1,401
Total assets consolidated pursuant to FIN 46R and FIN 46 12,520 5,541
In 2003, the cumulative effect of the Group’s adoption of FIN 46 for VIEs createdbefore February 1, 2003, was an after-tax loss of CHF 15 million reported in theConsolidated statements of income as Cumulative effect of accounting changes, netof tax. For further details on the adoption of FIN 46, refer to note 2. In accordancewith FIN 46R, prior period balances have not been restated.
The Group’s involvement with VIEs may be broadly grouped into three primarycategories: collateralized debt obligations (CDOs), commercial paper conduits andfinancial intermediation.
COLLATERALIZED DEBT OBLIGATIONS
As part of its structured finance business, the Group purchases loans and other debtobligations from and on behalf of clients for the purpose of securitization. The loansand other debt obligations are sold to qualifying special purpose entities (QSPEs) orVIEs that issue CDOs. VIEs issue CDOs to fund the purchase of assets such asinvestment-grade and high-yield corporate debt instruments. The Group engages inCDO transactions to meet client and investor needs, earn fees and sell financialassets.
In connection with its CDO activities, the Group may act as underwriter, placementagent or asset manager and may warehouse assets prior to the closing of atransaction. The Group may also act as a derivatives counterparty to the VIEs andmay invest in portions of the notes or equity issued by the VIEs. The Group alsoparticipates in synthetic CDO transactions, which use credit default swaps toexchange the underlying credit risk instead of using cash assets in a separate legalentity. The CDO entities may have actively managed (open) portfolios or static orunmanaged (closed) portfolios.

Notes to the consolidated financial statements 199Financial information
The Group has consolidated all CDO VIEs for which it is the primary beneficiary asof December 31, 2004, resulting in the inclusion by the Group of approximatelyCHF 1.4 billion of assets and liabilities of these VIEs. The beneficial interests issuedby these VIEs are payable solely from the cash flows of the related collateral, andthe creditors of these VIEs do not have recourse to the Group in the event ofdefault.
The Group also retains certain debt and equity interests in open CDO VIEs that arenot consolidated because the Group is not the primary beneficiary. The Group’sexposure in these CDO transactions typically consists of the interests retained inconnection with its underwriting or market-making activities. The Group’s maximumloss exposure is equal to the carrying value of these retained interests, which arereported as trading assets and carried at fair value and totaled CHF 2.3 billion as ofDecember 31, 2004.
COMMERCIAL PAPER CONDUITS
During 2004, the Group acted as the administrator and provider of liquidity andcredit enhancement facilities for several commercial paper conduit vehicles (CPconduits). These CP conduits purchase assets, primarily receivables, from clientsand provide liquidity through the issuance of commercial paper backed by theseassets. The clients provide credit support to investors of the CP conduits in the formof over-collateralization and other asset-specific enhancements as described below.The Group does not sell assets to the CP conduits and does not have any ownershipinterest in the CP conduits. Several CP conduits were restructured and combined in2003 and the combined CP conduit transferred the risk relating to a majority of itsexpected losses to a third party. This vehicle, which had issued commercial paper inthe amount of CHF 7.7 billion as of December 31, 2003, was not consolidated bythe Group.
The Group’s commitments to CP conduits consist of obligations under liquidityagreements and credit enhancement. The liquidity agreements are asset-specificarrangements, which require the Group to purchase assets from the CP conduits incertain circumstances, such as if the CP conduits are unable to access thecommercial paper markets. Credit enhancement agreements, which may be asset-specific or program-wide, require the Group to purchase certain assets under anycondition, including default. In entering into such agreements, the Group reviews thecredit risk associated with these transactions on the same basis that would apply toother extensions of credit.
As of December 31, 2004, the Group’s maximum loss exposure to non-consolidatedCP conduits was CHF 9.6 billion, which consisted of CHF 4.5 billion of fundedassets and the CP conduit’s commitments to purchase CHF 5.1 billion of additionalassets.
The Group believes that the likelihood of incurring a loss equal to this maximumexposure is remote because the assets held by the CP conduits, after giving effectto related asset-specific credit enhancement primarily provided by the clients, mustbe classified as investment grade when acquired by the CP conduits.
Financial information Notes to the consolidated financial statements200
FINANCIAL INTERMEDIATION
The Group has significant involvement with VIEs in its role as a financial intermediaryon behalf of clients. These activities include the use of VIEs to structure variousfund-linked products to provide clients with investment opportunities in alternativeinvestments. In addition, the Group provides financing to client sponsored VIEs,established to purchase or lease certain types of assets. For certain productsstructured to provide clients with investment opportunities, a VIE holds underlyinginvestments and issues securities that provide investors with a return based on theperformance of those investments. The investors typically retain the risk of loss onsuch transactions but the Group may provide principal protection on the securities tolimit the investors’ exposure to downside risk.
As a financial intermediary, the Group may administer or sponsor the VIE, transferassets to the VIE, provide collateralized financing, act as a derivatives counterparty,advise on the transaction, act as investment advisor or investment manager, act asunderwriter or placement agent or provide credit enhancement, liquidity or othersupport to the VIE. The Group also owns securities issued by the VIEs structured toprovide clients with investment opportunities, for market-making purposes and asinvestments. The Group’s maximum loss exposure to non-consolidated VIEs relatedto financial intermediation activities is estimated to be CHF 22.6 billion, as ofDecember 31, 2004, which represents the notional amount of any guarantees andthe fair value of all other interests held. Commencing from the fourth quarter of2004, the methodology for calculating maximum exposure to loss was harmonizedacross the Group, which is reflected in the significant reduction compared toDecember 31, 2003. This impacted mainly the balances reported by Credit SuisseFirst Boston, which previously reported the maximum exposure to loss as beingequal to the total assets of the VIEs in which it was involved. However, as disclosedin previous reports, the fair value of the contracts was considered to be morerepresentative of the actual maximum risk of loss. Further, the Group considers thelikelihood of incurring a loss equal to the maximum exposure to be remote becauseof the Group’s risk mitigation efforts, including hedging strategies, and the risk ofloss, which is retained by investors.
As of December 31, 2003, the Group deconsolidated approximately CHF 22.1billion of assets and liabilities related to certain financial intermediation productentities. These entities were previously consolidated by the Group through its holdingof voting interests, but they are considered as VIEs under FIN 46R. For theseentities, the Group was not the primary beneficiary and accordingly, discontinuedconsolidation of these entities upon adoption of FIN 46R.

Notes to the consolidated financial statements 201Financial information
40 Concentrations of credit risk
Credit risk concentrations arise and exist when any particular exposure typebecomes material relative to the size and capital of the Group. The Group monitorsexposures by counterparties, country, industry, product and business segments toensure that such concentrations are identified. Possible material exposures of anycounterparty or counterparties are regularly identified as part of regulatory reportingof large exposures. The approval of country and regional limits aims to avoid anyundue country risk concentration. From an industry exposure point of view, thecombined credit exposure of the Group is diversified. Within Credit Suisse, and to alesser extent within Winterthur, a large portion of exposure is from individual clients,particularly in residential mortgages in Switzerland. At Credit Suisse First Boston, alarge portion of the exposure relates to transactions with financial institutions.However, in both cases, the customer base is extensive and the number and varietyof transactions are broad. For Credit Suisse First Boston the business is alsogeographically diverse with operations focused in the Americas, Europe and, to alesser extent, Asia.
41 Fair value of financial instruments
The disclosure requirements of SFAS No. 107, Disclosure about Fair Value ofFinancial Instruments (SFAS 107), encompass the disclosure of fair value offinancial instruments for which it is practicable to estimate that value, whether or notthis is recognized in the financial statements. SFAS 107 excludes all non-financialinstruments such as lease transactions, real estate and premises, equity methodinvestments and pension and benefit obligations.
Quoted market prices, when available, are used as the measure of fair value. Incases where quoted market prices are not available, fair values are determined usingpresent value estimates or other valuation techniques, for example, the present valueof estimated expected future cash flows using discount rates commensurate with therisks involved, option-pricing models, matrix pricing, option-adjusted spread models,and fundamental analysis. Fair value estimation techniques normally incorporateassumptions that market participants would use in their estimates of values, futurerevenues, and future expenses, including assumptions about interest rates, default,prepayment and volatility. Because assumptions are inherently subjective in nature,the estimated fair values cannot be substantiated by comparison to independentmarket quotes and, in many cases, the estimated fair values would not necessarilybe realized in an immediate sale or settlement of the instrument. Accordingly, the fairvalue amounts presented do not represent management’s estimation of theunderlying value of the Group as a whole.
For cash and other liquid assets and money market papers maturing within threemonths, the fair value is assumed to be approximate to book value, given the short-term nature of these instruments. This assumption is also applied to receivables andpayables from the insurance business. For those items with a stated maturityexceeding three months, fair value is calculated using a discounted cash flowanalysis.
For non-impaired loans where quoted market prices are available, the fair value isbased on such prices. For variable rate loans which reprice within three months, the

Financial information Notes to the consolidated financial statements202
book value is used as a reasonable estimate of fair value. For other non-impairedloans, the fair value is estimated by discounting contractual cash flows using themarket interest rates for loans with similar characteristics. For impaired loans, thebook value, net of valuation adjustments, is approximate to fair value.
The securities and precious metals trading portfolio is carried on the balance sheetat fair value.
The fair values of positive replacement values of derivative instruments, negativereplacement values of derivative instruments, financial investments from the bankingbusiness, investments from the insurance business, and non-consolidatedparticipations are based on quoted market prices. Where these are not available, fairvalues are based on the quoted market prices of comparable instruments, or areestimated by discounting estimated future cash flows or using other valuationtechniques.
For deposit instruments, the fair value is calculated as follows: for depositinstruments with no stated maturity and those with original maturities of less thanthree months, the book value is assumed to approximate fair value due to the short-term nature of these liabilities. For deposit instruments with a stated maturityexceeding three months, fair value is calculated using a discounted cash flowanalysis.
For medium-term notes, bonds and mortgage-backed bonds, fair values areestimated using quoted market prices or by discounting the remaining contractualcash flows using a rate at which the Group could issue debt with a similar remainingmaturity as of the balance sheet date.
The following table sets forth the carrying value and the estimated fair values of the Group’s financial instrumentsrecognized in the consolidated balance sheet:
2004 2003
December 31, in CHF m Book value Fair value Book value Fair value
Financial assets
Cash and due from banks 25,648 25,648 24,799 24,799
Interest bearing deposits with banks 4,947 4,958 2,992 3,015
Central bank funds sold, securities purchased under resale agreementsand securities borrowing transactions 267,169 267,190 257,083 257,269
Securities received as collateral 20,289 20,289 15,151 15,151
Trading assets 346,469 346,469 297,778 297,778
Investment securities 100,365 100,562 105,807 105,642
Loans 184,399 186,772 177,179 179,714
Other financial assets 11,580 11,735 6,205 6,441
Financial liabilities
Deposits 299,341 301,080 261,989 262,444
Central bank funds purchased, securities sold under repurchase agreementsand securities lending transactions 239,724 239,576 236,847 236,813
Obligations to return securities received as collateral 20,289 20,289 15,151 15,151
Trading liabilities 150,130 150,130 156,331 156,331
Short-term borrowings 15,343 15,342 11,497 11,497
Long-term debt 106,261 108,930 89,697 90,961

Notes to the consolidated financial statements 203Financial information
The following table sets forth details of assets pledged or assigned:
December 31, in CHF m 2004 2003
Book value of assets pledged and assigned as collateral 143,949 142,320
of which assets provided with the right to sell or repledge 117,178 123,161
Fair value of collateral received with the right to sell or repledge 463,732 429,040
of which sold or repledged 428,837 406,910
The following table shows other information:
December 31, in CHF m 2004 2003
Cash restricted under foreign banking regulations 11,559 8,923
Swiss National Bank Liquidity 1 required cash reserves 2,051 2,047
Cash restricted under Swiss and foreign banking regulations 13,610 10,970
42 Assets pledged or assigned
As of December 31, 2004 and 2003, collateral was received in connection withresale agreements, securities borrowings and loans, derivative transactions andmargined broker loans. As of such dates, a substantial portion of the collateralreceived by the Group had been sold or repledged in connection with repurchaseagreements, securities sold, not yet purchased, securities borrowings and loans,pledges to clearing organizations, segregation requirement under securities laws andregulations, derivative transactions and bank loans.
43 Capital adequacy
BANKING BUSINESSES
The Group, on a consolidated basis, is subject to risk-based capital and leverageguidelines under Swiss Federal Banking Commission, or SFBC, and Bank forInternational Settlements, or BIS, guidelines. These guidelines are used to evaluaterisk-based capital adequacy. All calculations through December 31, 2003 wereperformed on the basis of financial reporting under Swiss GAAP, the basis for thecapital supervision by the Swiss regulator. As of January 1, 2004, the Group basesits capital adequacy calculations on US GAAP, which is in accordance with the SFBCnewsletter 32 (dated December 18, 2003). The SFBC has advised the Group that itmay continue to include as Tier 1 capital CHF 2.1 billion of equity from specialpurpose entities, which have been deconsolidated under FIN 46R.
For purposes of complying with SFBC and BIS capital requirements, total capital isdivided into three categories. Tier 1 capital comprises shareholders’ equity accordingto US GAAP or Swiss GAAP, respectively, with US GAAP shareholders’ equity beingincreased by the Group’s mandatory convertible securities and the equity fromspecial purpose entities as described above. Among other items, this is adjusted byanticipated dividends, the Group’s holdings of its own shares outside the tradingbook, goodwill and an adjustment for the Group’s investment in Winterthur asdescribed below. Tier 1 capital is supplemented for capital adequacy purposes byTier 2 capital, which consists primarily of hybrid capital and subordinated debt

Financial information Notes to the consolidated financial statements204
instruments. A further supplement is Tier 3 capital, which consists of certainunsecured subordinated debt obligations with repayment restrictions. The sum of allthree capital tiers, less non-consolidated participations in the industries of banking,finance and insurance, equals total capital. Under both SFBC and BIS guidelines, abank must have a ratio of total eligible capital to aggregate risk-weighted assets ofat least 8%, of which the Tier 1 capital element must be at least 4%.
The ratios measure capital adequacy by comparing eligible capital with risk-weightedassets positions, which include balance sheet assets, net positions in securities notheld in the trading portfolio, off-balance sheet transactions converted into creditequivalents and market positions in the trading portfolio.
In 2003, the SFBC refined the capital treatment of the Group’s investment inWinterthur. According to the new decree, which came effective as of August 28,2003, the capital charge for the insurance business is no longer reflected as anaddition to risk-weighted assets but as a reduction to the eligible tier capitals.
At December 31, 2004 and 2003, the Group was adequately capitalized under theregulatory provisions outlined under both SFBC and BIS guidelines.
The following table sets forth details of BIS data (risk-weighted assets, capital and ratios):
December 31, in CHF m, except where indicated 2004
Risk-weighted positions 187,775
Market risk equivalents 11,474
Total risk-weighted assets 199,249
Total shareholders’ equity 36,273
Adjustments to shareholders’ equity
Mandatory convertible securities 1,250
Non-cumulative perpetual preferred securities 2,118
Investment in Winterthur (50%) (3,455)
Adjustments for goodwill, minority interests, disallowed unrealized gains on fair value measurement,own shares and dividend accruals (11,590)
Tier 1 capital 24,596
Tier 2 capital
Upper Tier 2 3,446
Lower Tier 2 9,089
Tier 2 capital 12,535
Total Tier 3 capital –
Less deductions
Participations in and subordinated bonds of banks and financing companies (555)
Investment in Winterthur (50%) (3,455)
Total capital 33,121
Tier 1 capital 24,596
of which non-cumulative perpetual preferred securities 2,118
Tier 1 ratio 12.3%
Total capital 33,121
Total capital ratio 16.6%

Notes to the consolidated financial statements 205Financial information
The following table sets forth details of BIS data (risk-weighted assets, capital and ratios):
December 31, in CHF m, except where indicated 2003
Risk-weighted positions 176,911
Market risk equivalents 13,850
Total risk-weighted assets 190,761
Total shareholders’ equity 34,692
Adjustments to shareholders’ equity
Investment in Winterthur (50%) (2,611)
Adjustments for goodwill, minority interests, own shares and dividend accruals (9,794)
Tier 1 capital 22,287
Tier 2 capital
Upper Tier 2 3,497
Lower Tier 2 10,622
Tier 2 capital 14,119
Total Tier 3 capital –
Less deductions
Participations in and subordinated bonds of banks and financing companies (588)
Investment in Winterthur (50%) (2,611)
Total capital 33,207
Tier 1 capital 22,287
of which non-cumulative perpetual preferred securities 2,167
Tier 1 ratio 11.7%
Total capital 33,207
Total capital ratio 17.4%
All calculations as of December 31, on the basis of Swiss GAAP. In 2003, the method for the capital treatment of Winterthur was adapted in line with the new requirementsdefined by the Swiss regulator.
BROKER-DEALER OPERATIONS
Certain Group broker-dealer subsidiaries are subject to capital adequacyrequirements. As of December 31, 2004, the Group and its subsidiaries compliedwith all applicable regulatory capital adequacy requirements.

Financial information Notes to the consolidated financial statements206
INSURANCE BUSINESSES
The insurance entities of the Group are required to maintain minimum solvencymargins in accordance with local insurance regulatory requirements. Insurancecompanies granted an insurance license in Switzerland are required to maintainsolvency margins.
The solvency margin for non-life is the greater of two calculations: (1) the premiummargin based on the gross premium income for the latest financial year; and (2) theclaims margin, based on the gross average claims expense for the last threefinancial years. The premium margin is calculated by taking 16-18% of theappropriate premium income less a deduction of up to 50% for the average grossclaims incurred in the last three financial years that were reinsured. The claimsmargin is calculated by multiplying 23-26% by the appropriate claims expense of upto 50% for the average gross claims incurred in the last three financial years thatwere reinsured. The required solvency margin is the higher of the above twomargins. In addition, the requirement for liability business is increased by 50%.
Life insurance companies are required to maintain a margin of approximately 4% ofinsurance reserves (1% of separate account reserves) plus 0.03% of the amount atrisk under insurance policies.
The minimum solvency margin requirements in Switzerland are similar to therequirements for European Union (EU) member countries in accordance with EUdirectives. Regulators outside the EU impose various capital and solvencyrequirements on insurers operating within their jurisdiction. Additionally, some localregulators require companies to maintain solvency margins that are higher than thesolvency margins provided for by the regulations.
At December 31, 2004, the Group’s major insurance subsidiaries were incompliance with all applicable solvency requirements.
As an insurance group, Winterthur is subject to supervision by the Swiss insuranceregulator, the Federal Office of Private Insurance (FOPI). The FOPI group solvencycalculation is very similar to the EU group model, but differs in detail, with the aim of reducing complexity. The available capital under the new model is based on USGAAP consolidated equity including minority interests increased by balance sheet items with equity characters and reduced by intangible assets. The capitalrequirements follow Swiss statutory requirements, which are identical to those of the EU.
As of year-end 2004, the available solvency capital of Winterthur exceeded theminimum required solvency margin.
DIVIDEND RESTRICTIONS
Certain of the Group’s subsidiaries are subject to legal restrictions governing theamount of dividends they can pay, for example, corporate law as defined by theSwiss Code of Obligations. At December 31, 2004, the Group was not subject tosignificant restrictions on its ability to pay dividends.

Notes to the consolidated financial statements 207Financial information
The following table sets forth details of assets under management and net new assets as prescribed by the SwissFederal Banking Commission:
December 31, in CHF bn 2004 2003
Assets in own-managed funds 220.1 218.7
Assets with discretionary mandates 375.7 367.2
Other assets under management 624.9 595.2
Assets under management (including double counting) 1,220.7 1,181.1
of which double counting 1) 125.7 133.6
Additional information
Assets under management from the insurance business included in assets in own-managed funds and assets with discretionary mandates 139.6 139.2
Year ended December 31, in CHF bn
Net new assets 32.9 5.0
Assets under management are stated according to the guidelines of the accounting regulations of the Swiss Federal Banking Commission (SFBC Newsletter No. 29 on thedisclosure of assets under management).
1) Double counting consists of own-managed funds included in assets with discretionary mandate or in other assets under management.
44 Assets under management

Financial information Notes to the consolidated financial statements208
45 Litigation
In accordance with SFAS No. 5, Accounting for Contingencies (SFAS 5), CreditSuisse Group recorded in 2002 reserves for certain significant matters, including areserve of USD 150 million for the agreement in principle with various US regulatorsrelating to research analyst independence and the allocation of IPO shares tocorporate executives and directors and a USD 450 million reserve for privatelitigation involving research analyst independence, certain IPO allocation practices,Enron and other related litigation. In 2003, Credit Suisse Group paid approximatelyUSD 150 million with respect to the agreement with the US regulators relating toresearch analyst independence and the allocation of IPO shares to corporateexecutives and directors. Management’s best estimate of the potential exposurepursuant to SFAS 5, related to research analyst independence, certain IPO allocationpractices, Enron and other related private litigation has not changed except that USD15 million of the reserve has been applied to settlements of claims covered by suchreserve through December 31, 2004.
The UK tax authority has issued formal assessments relating to national insurancecontributions on the exercise of certain categories of options over shares andsecurities granted to employees in respect of the years 1997 to 2001 only. Themaximum additional amount of national insurance payable would be CHF 381million. The Group disputes the claim and intends to vigorously defend its position,including the pursuit of appropriate judicial procedures. Although the final resolutionof the claim is uncertain, based on currently available information, managementbelieves that it has appropriately accrued for this claim.
Credit Suisse Group is also involved in a number of other judicial, regulatory andarbitration proceedings concerning matters arising in connection with the conduct ofits businesses. These actions have been brought on behalf of various classes ofclaimants and, unless otherwise specified, seek damages of material and/orindeterminate amounts. The Group believes, based on currently available informationand advice of counsel, that the results of such proceedings, in the aggregate, arenot likely to have a material adverse effect on its financial condition but might bematerial to operating results for any particular period, depending, in part, upon theoperating results for such period. Contingencies with respect to significant provisionsprovided by the Group are discussed below. Also refer to the discussion on theWinterthur International matter discussed in note 37.
It is inherently difficult to predict the outcome of many of these matters. Inpresenting the consolidated financial statements, management makes estimatesregarding the outcome of these matters and records a reserve and takes a charge toincome when losses with respect to such matters are probable and can bereasonably estimated. Estimates, by their nature, are based on judgment andcurrently available information and involve a variety of factors, including, but notlimited to, the type and nature of the litigation, claim or proceeding, the progress ofthe matter, the advice of legal counsel, Credit Suisse Group’s defenses and itsexperience in similar cases or proceedings.

Notes to the consolidated financial statements 209Financial information
The following table shows the principal rates used to translate the financial statements of foreign entities into Swissfrancs:
Year-end rate used in Average rate used inthe balance sheet the income statement
in CHF 31.12.04 31.12.03 2004 2003 2002
1 US dollar (USD) 1.1320 1.2357 1.2400 1.3500 1.5600
1 Euro (EUR) 1.5439 1.5590 1.5400 1.5200 1.4700
1 British pound sterling (GBP) 2.1834 2.2023 2.2800 2.2000 2.3300
1 Canadian dollar (CAD) 0.9411 0.9569 0.9600 0.9600 1.0000
1 Singapore dollar (SGD) 0.6933 0.7267 0.7400 0.7700 0.8700
1 Hong Kong dollar (HKD) 0.1456 0.1592 0.1596 0.1728 0.1995
100 Japanese yen (JPY) 1.1023 1.1556 1.1500 1.1600 1.2400
46 Foreign currency translation rates
As of December 31, 2004:
% of equity Capitalcapital held Company name Domicile Currency in m
Credit Suisse Group Zurich, Switzerland
100 Credit Suisse Zurich, Switzerland CHF 3,114.7
100 Credit Suisse First Boston Zurich, Switzerland CHF 4,399.7
100 “Winterthur” Swiss Insurance Company Winterthur, Switzerland CHF 260.0
99 Neue Aargauer Bank Aarau, Switzerland CHF 136.9
100 Bank Leu AG Zurich, Switzerland CHF 200.0
100 1) Bank Hofmann AG Zurich, Switzerland CHF 30.0
88 Clariden Holding AG Zurich, Switzerland CHF 8.1
100 BGP Banca di Gestione Patrimoniale S.A. Lugano, Switzerland CHF 50.0
100 Credit Suisse Fides Zurich, Switzerland CHF 5.0
100 Credit Suisse Trust AG Zurich, Switzerland CHF 5.0
100 Credit Suisse Trust Holdings Ltd. St. Peter Port, Guernsey GBP 2.0
100 Credit Suisse IT Assets AG Zurich, Switzerland CHF 2.4
100 Fides Information Services Zurich, Switzerland CHF 1.0
100 Credit Suisse Group Finance (U.S.) Inc. Wilmington, United States USD 600.0
100 Credit Suisse Group Finance (Luxembourg) S.A. Luxembourg, Luxembourg EUR 0.1
100 CSFB LP Holding Zug, Switzerland CHF 0.1
100 CSFB IGP Zug, Switzerland CHF 0.1
100 Credit Suisse Group PE Holding AG Zug, Switzerland CHF 12.0
100 2) Credit Suisse First Boston International London, United Kingdom USD 682.3
100 3) Credit Suisse (Luxembourg) S.A. Luxembourg, Luxembourg CHF 43.0
88 Hotel Savoy Baur en Ville Zurich, Switzerland CHF 7.5
100 Wincasa Winterthur, Switzerland CHF 1.5
100 Inreska Ltd. St. Peter Port, Guernsey GBP 3.0
1) 33% held by Credit Suisse. 2) 80% held directly and indirectly by Credit Suisse First Boston. 3) 58% held by Credit Suisse.
47 Significant subsidiaries and associates
SIGNIFICANT SUBSIDIARIES

Financial information Notes to the consolidated financial statements210
As of December 31, 2004:
% of equity Capitalcapital held Company name Domicile Currency in m
Credit Suisse Zurich, Switzerland
96 City Bank Zurich, Switzerland CHF 7.5
100 Credit Suisse (Bahamas) Ltd. Nassau, Bahamas USD 12.0
100 Credit Suisse Wealth Management Limited Nassau, Bahamas USD 32.5
100 Credit Suisse (Deutschland) Aktiengesellschaft Frankfurt, Germany EUR 60.0
100 Credit Suisse (France) Holding SA Paris, France EUR 8.6
100 Credit Suisse (Gibraltar) Ltd. Gibraltar, Gibraltar GBP 5.0
100 Credit Suisse (Guernsey) Limited St. Peter Port, Guernsey USD 6.1
100 Credit Suisse (Italy) S.p.A. Milan, Italy EUR 67.6
100 Credit Suisse (Monaco) S.A.M. Monte Carlo, Monaco EUR 12.0
100 Credit Suisse (UK) Limited London, United Kingdom GBP 50.0
100 Credit Suisse Hottinguer Paris, France EUR 52.9
100 Credit Suisse Private Advisors Zurich, Switzerland CHF 15.0
100 CS Non-Traditional Products Ltd. Nassau, Bahamas USD 0.1
100 FLCM Holding Co., Inc. Wilmington, United States USD 23.7
55 Global Asset Program Balanced AG Frankfurt, Germany EUR 0.1
0 1) Global Asset Program (Luxembourg) SA Luxembourg, Luxembourg EUR 0.1
100 JOHIM CS Limited London, United Kingdom GBP 0.0
100 Pearl Investment Management Ltd. Nassau, Bahamas USD 0.1
100 Swiss American Corporation New York, United States USD 38.9
1) Voting rights 0%, controlled by other means.

Notes to the consolidated financial statements 211Financial information
As of December 31, 2004:
% of equity Capitalcapital held Company name Domicile Currency in m
Credit Suisse First Boston Zurich, Switzerland
100 AJP Cayman Ltd. George Town, Cayman Islands JPY 8,025.6
100 Banco de Investimentos Credit Suisse First Boston S.A. Sao Paulo, Brazil BRL 164.8
100 ZAO Bank Credit Suisse First Boston Moscow, Russia USD 37.8
100 Credit Suisse First Boston Australia Equities Limited Sydney, Australia AUD 13.0
100 Credit Suisse First Boston (Bahamas) Limited Nassau, Bahamas USD 16.9
100 Credit Suisse First Boston (Cayman) Limited George Town, Cayman Islands USD 0.0
100 Credit Suisse First Boston (Europe) Limited London, United Kingdom USD 27.3
100 Credit Suisse First Boston (Hong Kong) Limited Hong Kong, China HKD 397.7
75 Credit Suisse First Boston (India) Securities Private Limited Mumbai, India INR 979.8
100 Credit Suisse First Boston (Singapore) Limited Singapore, Singapore SGD 278.4
100 Credit Suisse First Boston (USA), Inc. Wilmington, United States USD 184.8
100 Credit Suisse First Boston Australia Limited Sydney, Australia AUD 34.1
100 Credit Suisse First Boston Australia Securities Limited Sydney, Australia AUD 38.4
100 Credit Suisse First Boston Canada Inc. Toronto, Canada CAD 3.4
100 Credit Suisse First Boston Capital LLC Wilmington, United States USD 337.6
100 Credit Suisse First Boston LLC Wilmington, United States USD 5,484.2
100 Credit Suisse First Boston Equities Limited London, United Kingdom GBP 15.0
100 Credit Suisse First Boston Management LLC Wilmington, United States USD 897.7
100 Credit Suisse First Boston Securities (Japan) Limited Hong Kong, China USD 730.6
100 Credit Suisse First Boston Private Equity, Inc. Wilmington, United States USD 0.0
100 DLJ Capital Funding, Inc. Wilmington, United States USD 0.0
100 DLJ Capital Corporation Wilmington, United States USD 0.0
100 Merban Equity Zug, Switzerland USD 0.1
100 Credit Suisse Asset Management (Australia) Limited. Sydney, Australia AUD 0.3
100 Credit Suisse Asset Management (Deutschland) GmbH Frankfurt, Germany EUR 2.6
100 Credit Suisse Asset Management (France) SA Paris, France EUR 31.6
100 Credit Suisse Asset Management (UK) Holding Limited London, United Kingdom GBP 14.2
100 Credit Suisse Asset Management, LLC Wilmington, United States USD 0.0
100 Credit Suisse Asset Management Ltd London, United Kingdom GBP 0.0
100 Credit Suisse Asset Management SIM S.p.A. Milan, Italy EUR 7.0

Financial information Notes to the consolidated financial statements212
As of December 31, 2004:
% of equity Capitalcapital held Company name Domicile Currency in m
100 Credit Suisse Trust and Banking Co., Ltd. Tokyo, Japan JPY 9,000.0
100 Credit Suisse Asset Management International Holding Zurich, Switzerland CHF 20.0
100 Credit Suisse First Boston (International) Holding AG Zug, Switzerland CHF 37.5
100 Credit Suisse First Boston (Latam Holdings) LLC George Town, Cayman Islands USD 23.8
100 Credit Suisse First Boston Australia (Finance) Limited Sydney, Australia AUD 10.0
100 Credit Suisse First Boston Australia (Holdings) Limited Sydney, Australia AUD 42.0
100 Credit Suisse First Boston Finance (Guernsey) Ltd St Peter Port, Guernsey USD 0.2
100 Credit Suisse First Boston Finance B.V. Amsterdam, The Netherlands EUR 0.0
100 1) Credit Suisse First Boston, Inc. Wilmington, United States USD 187.1
100 Credit Suisse Asset Management Funds Zurich, Switzerland CHF 7.0
100 Credit Suisse Bond Fund Management Company Luxembourg, Luxembourg CHF 0.3
100 Credit Suisse Equity Fund Management Company Luxembourg, Luxembourg CHF 0.3
100 Credit Suisse Money Market Fund Management Company Luxembourg, Luxembourg CHF 0.3
100 Credit Suisse Portfolio Fund Management Company Luxembourg, Luxembourg CHF 0.3
100 Credit Suisse Asset Management Fund Holding (Luxembourg) S.A. Luxembourg, Luxembourg CHF 29.6
100 Column Financial, Inc. Wilmington, United States USD 0.0
80 Column Guaranteed LLC Wilmington, United States USD 32.9
100 Credit Suisse First Boston Mortgage Capital LLC Wilmington, United States USD 356.6
100 DLJ Mortgage Capital, Inc. Wilmington, United States USD 0.0
100 Column Canada Financial Corp. Toronto, Canada USD 0.0
100 Credit Suisse First Boston Financial Corporation Wilmington, United States USD 0.0
100 Banco Credit Suisse First Boston (Mexico), S.A. Mexico City, Mexico MXN 726.6
100 Credit Suisse Leasing 92A, L.P. New York, United States USD 86.0
100 Boston RE Ltd. Hamilton, Bermuda USD 2.0
1) 43% of voting rights held by Credit Suisse Group, Guernsey Branch.

Notes to the consolidated financial statements 213Financial information
As of December 31, 2004:
% of equity Capitalcapital held Company name Domicile Currency in m
Winterthur Group Winterthur, Switzerland
100 Winterthur Life Winterthur, Switzerland CHF 175.0
100 Credit Suisse Life Insurance Co. Ltd Tokyo, Japan JPY 18,860.0
80 Credit Suisse Life & Pensions penzijni fond a.s. Brno, Czech Republic CZK 142.2
65 Credit Suisse Life & Pensions pojištovna a.s. Prague, Czech Republic CZK 374.0
100 Credit Suisse Life & Pensions Aktiengesellschaft Vaduz, Liechtenstein CHF 15.0
Credit Suisse Life & Pensions Powszechne Towarzystwo70 Emerytalne S.A. Warsaw, Poland PLN 105.0
65 Credit Suisse Life & Pensions Towarzystwo Ubezpieczen na Zycie S.A. Warsaw, Poland PLN 54.0
100 Winterthur Alternative Investment Strategies Limited George Town, Cayman Islands USD 550.0
100 Credit Suisse Life & Pensions (Bermuda) Ltd Hamilton, Bermuda USD 0.3
100 Credit Suisse Life & Pensions (Luxembourg) S.A. Luxembourg, Luxembourg EUR 12.8
100 Vitur PCC Ltd St. Peter Port, Guernsey CHF 115.0
65 Credit Suisse Life & Pensions, Biztositó Rt. Budapest, Hungary HUF 3,604.0
65 Credit Suisse Life & Pensions Pénztárszolgáltató Rt. Budapest, Hungary HUF 701.0
51 Credit Suisse Life & Pensions Slovensko, a.s. Bratislava, Slovakia SKK 773.0
100 Credit Suisse Life & Pensions poistovna, a.s. Bratislava, Slovakia SKK 135.0
96 Winterthur-Europe Assurances Brussels, Belgium EUR 200.0
97 Winterthur-Europe Vie S.A. Luxembourg, Luxembourg EUR 10.7
100 Touring Assurances SA Brussels, Belgium EUR 9.2
100 Les Assurés Réunis Brussels, Belgium EUR 4.2
100 Hispanowin S.A. Barcelona, Spain EUR 97.8
100 Winterthur Seguros Generales, S.A. de Seguros y Reaseguros Barcelona, Spain EUR 62.7
100 Winterthur Inmuebles S.A. Barcelona, Spain EUR 56.8
Winterthur Vida Sociedad Anónima de Seguros y100 Reaseguros sobre la Vida Barcelona, Spain EUR 53.0
100 Winterthur Inmuebles 2 S.A. Barcelona, Spain EUR 55.9
100 Winterthur Salud de Seguros Barcelona, Spain EUR 7.9
100 Winterthur U.S. Holdings Inc. Sun Prairie, United States USD 0.0
100 Unigard Incorporated Bellevue, United States USD 0.0
100 Southern Guaranty Insurance Company Montgomery, United States USD 2.0
100 General Casualty Company of Wisconsin Sun Prairie, United States USD 3.0
100 Winterthur Beteiligungsgesellschaft mbH Wiesbaden, Germany EUR 0.3
100 WinCom Versicherungs-Holding AG Wiesbaden, Germany EUR 52.5
72 DBV-Winterthur Holding Wiesbaden, Germany EUR 87.2
100 Winterthur Verzekeringen Holding BV Amsterdam, The Netherlands EUR 0.0
100 Winterthur Levensverzekeringen Maatschappij NV Amsterdam, The Netherlands EUR 0.0
100 Winterthur Schadeverzekeringen Maatschappij NV Amsterdam, The Netherlands EUR 0.0
100 Winterthur (UK) Holdings Ltd London, United Kingdom GBP 200.0
100 Winterthur UK Financial Services Group Ltd Basingstoke, United Kingdom GBP 0.0
100 Winterthur Canada Financial Corp. Toronto, Canada CAD 0.0
100 The Citadel General Toronto, Canada CAD 36.4
100 Winterthur Capital Ltd Hamilton, Bermuda EUR 0.0
100 Harrington International Insurance Ltd Hamilton, Bermuda USD 70.0
100 Wincare Zusatzversicherungen Winterthur, Switzerland CHF 8.0
67 Winterthur-ARAG Legal Assistance Zurich, Switzerland CHF 9.0

Financial information Notes to the consolidated financial statements214
Equity interest Capitalin % Company name Domicile Currency in m
50 Swisscard AECS AG Zurich, Switzerland CHF 0.1
26 Capital Union Dubai, UAE USD 50.0
25 SECB Swiss Euro Clearing Bank GmbH Frankfurt, Germany EUR 9.2
21 Swiss Prime Site AG Olten, Switzerland CHF 684.5
36 Zürcher Freilager AG Zurich, Switzerland CHF 4.0
33 Technopark Immobilien AG Zurich, Switzerland CHF 40.0
63 1) Sauber Holding AG Vaduz, Liechtenstein CHF 17.0
22 SIS Swiss Financial Services Group AG Zurich, Switzerland CHF 26.0
1) Voting rights 33%
SIGNIFICANT ASSOCIATES

Notes to the consolidated financial statements 215Financial information
48 Significant valuation and income recognitiondifferences between US GAAP and Swiss GAAP(true and fair view)
Credit Suisse Group’s consolidated financial statements have been prepared inaccordance with accounting principles generally accepted in the United States ofAmerica (US GAAP). For a detailed description of the Groups accounting policiesplease refer to note 1.
The Swiss Federal Banking Commission requires Swiss-domiciled banks whichpresent their financial statements on either US GAAP or International FinancialReporting Standards (IFRS) to provide a narrative explanation of the majordifferences between Swiss GAAP and its primary accounting standard.
The principle provisions of the Banking Ordinance and the Guidelines of the SwissFederal Banking Commission governing financial statement reporting (Swiss GAAP)differ in certain aspects from US GAAP. The following are the major differences:
SCOPE OF CONSOLIDATION
Under US GAAP the Group deconsolidated certain entities that issue redeemablepreferred securities as of March 31, 2004 due to the issuance FIN 46R. UnderSwiss GAAP these entities would continue to be consolidated as the Group holds100% of the voting rights.
Under Swiss GAAP, majority owned subsidiaries that are not considered long-terminvestments or do not operate in the core business of the Group are eitheraccounted for as financial investments or as equity method investments. US GAAPhas no such exception relating to the consolidation of majority owned subsidiaries.
DISCONTINUED OPERATIONS
Under US GAAP, the assets and liabilities of an entity held-for-sale are separatedfrom the ordinary balance sheet captions and are measured at the lower of thecarrying value or fair value less cost to sell. Under Swiss GAAP, these positionsremain in their initial balance sheet positions until disposed and are valued accordingto the respective positions.
REAL ESTATE HELD FOR INVESTMENT
Under US GAAP, real estate held for investment is valued at cost less accumulateddepreciation.
For Swiss GAAP, real estate held for investment that the group intended to holdpermanently is also accounted at cost less accumulated depreciation. If the Group,however, does not intend to hold real estate permanently, real estate is accountedfor at the lower of cost or market (LOCOM).

Financial information Notes to the consolidated financial statements216
INVESTMENT IN SECURITIES
Available-for-sale securitiesUnder US GAAP available-for-sale (AFS) securities are valued at fair value.Unrealized holding gains and losses (incl. foreign exchange) due to fluctuations infair value are not recorded in the Income Statement but reported in AccumulatedOther Comprehensive Income, which is part of Shareholders Equity. Declines in fairvalue below cost value deemed to be other-than-temporary are recognized asimpairment losses through the Income Statement. The new cost basis should not bechanged for subsequent recoveries in fair value.
Under Swiss GAAP AFS securities are accounted for at LOCOM with marketfluctuations recorded in Other revenues. Foreign exchange gains and losses arerecognized as Trading revenues.
Non-marketable equity securities are valued at cost less other-than-temporaryimpairment or at fair value (depending on the status of reporting entity) under USGAAP, whereas under Swiss GAAP non-marketable equity securities are accountedfor at LOCOM.
Impairments on held-to-maturity securitiesUnder US GAAP declines in fair value of held-to-maturity (HTM) securities belowcost value deemed to be other-than-temporary are recognized as impairment lossesthrough the Income Statement. The impairment is not to be reversed.
Under Swiss GAAP impairment losses recognized on HTM securities are reversed upto the amortized cost if the fair value of the instrument subsequently recovers. Thereversal is recorded in the Income Statement.
TRADING POSITIONS
Under US GAAP as well as under Swiss GAAP, positions classified as trading assetsare valued at fair value. Under US GAAP this classification is based onmanagement’s intent for the specific instrument, whereas the prevailing criteriaunder Swiss GAAP is the active management of the specific instrument.
INVESTMENTS IN PRECIOUS METALS
Physical precious metal (e.g. gold) positions held for other-than-trading purposes arevalued at fair value under US GAAP. Under Swiss GAAP they are accounted for atLOCOM.

Notes to the consolidated financial statements 217Financial information
BIFURCATION OF PRECIOUS METAL LOANS
Under US GAAP precious metal loans and deposits are considered hybridinstruments. As precious metals are considered a commodity, which is not clearlyand closely related to a loan or deposit host, the embedded derivative is bifurcatedunder US GAAP.
Under Swiss GAAP precious metals loans and deposits are not considered hybridinstruments. Precious metals are rather considered as a currency than a commodity.
INTANGIBLE ASSETS, INCLUDING GOODWILL
Intangible assets with infinite livesUnder US GAAP intangible assets with infinite lives are not amortized but are testedfor impairment annually, or more frequently if events or changes in circumstancesindicate that the asset might be impaired.
Under Swiss GAAP intangibles assets with infinite lives are amortized over the usefullife, with a maximum of five years. Additionally these assets are tested forimpairment.
Goodwill amortizationUnder US GAAP goodwill is not amortized but has to be tested for impairment on anannual basis or more frequently if an event occurs or circumstances change thatindicate that goodwill may be impaired.
Under Swiss GAAP goodwill is amortized over its useful life, normally not exceeding5 years, except in justified cases (up to 20 years). In addition goodwill is tested forimpairment.
PENSIONS AND POST-RETIREMENTS BENEFITS
US GAAP and Swiss GAAP differ in their definition of defined benefit versus definedcontribution plans. US GAAP defines a defined benefit plan as a plan that bearsactuarial risk, i.e. risk that the pension or post-retirement benefit obligation will behigher than expected. Under Swiss GAAP, however, a defined benefit plan is a planwhere the employer bears the actuarial risk.
RESERVES FOR GENERAL BANKING RISKS
Under Swiss GAAP reserves for general banking risks are recorded as a separatecomponent of shareholders’ equity. US GAAP does not allow general unallocatedprovisions.

Financial information Notes to the consolidated financial statements218
Year ended December 31, in CHF m 2004 2003 2002
Interest income and income from securities 395 258 1,624
Income from investments in subsidiaries 960 1,590 1,820
Other income 345 313 335
Total income 1,700 2,161 3,779
Interest expenses 431 471 471
Compensation, benefits and directors’ fees 117 59 105
Other expenses 274 228 134
Depreciation, write-offs and provisions 9 102 851
Tax expense/(benefit) 38 20 (2)
Total expenses 869 880 1,559
Net income 831 1,281 2,220
49 Credit Suisse Group, Parent Company
Condensed Credit Suisse Group Parent Company financial information is prepared inaccordance with the Swiss Code of Obligations.
CONDENSED STATEMENT OF INCOME
December 31, in CHF m 2004 2003
Assets
Cash and due from banks 1,015 2,231
Securities 1,299 1,183
Advances to subsidiaries 5,162 5,344
Investment in subsidiaries 33,932 34,108
Other assets 460 500
Total assets 41,868 43,366
Liabilities and shareholders’ equity
Advances from subsidiaries 3,875 5,070
Bonds 2,800 2,800
Other liabilities 697 1,323
Total liabilities 7,372 9,193
Share capital 607 1,195
Legal reserve 13,181 13,101
Reserve for own shares 1,950 1,950
Free reserves 14,540 14,540
Retained earnings brought forward 3,387 2,106
Net income 831 1,281
Total shareholders’ equity 34,496 34,173
Total liabilities and shareholders’ equity 41,868 43,366
CONDENSED BALANCE SHEET

Notes to the consolidated financial statements 219Financial information
Year ended December 31, in CHF m 2004 2003 2002
Cash flows from operating activities
Net income 831 1,281 2,220
Net adjustments to reconcile net income to net cash provided by/(used in) operating activities (176) 422 81
Net cash provided by/(used in) operating activities 655 1,703 2,301
Cash flows from investing activities
Purchases of securities (1,138) (831) (805)
Proceeds from sale of securities 1,210 543 3,814
(Increase)/decrease of investments in and advances to subsidiaries 358 (1,003) (3,907)
Net cash provided by/(used in) investing activities 430 (1,291) (898)
Cash flows from financing activities
Increase/(decrease) of advances from subsidiaries (1,192) (476) 840
Repayments of bonds (600) (250) 0
Proceeds from Mandatory Convertible Securities 0 0 1,250
Proceeds from issuances of common shares 90 25 28
Dividends paid/repayment out of share capital (599) (119) (2,379)
Net cash provided by/(used in) financing activities (2,301) (820) (261)
Net increase/(decrease) in cash and due from banks (1,216) (408) 1,142
Cash and due from banks at beginning of financial year 2,231 2,639 1,497
Cash and due from banks at end of financial year 1,015 2,231 2,639
Supplemental disclosures of cash flow information
Cash paid during the year for income taxes 0 22 53
Cash paid during the year for interests 473 498 483
Cash dividends received from subsidiaries 960 1,590 1,819
CONDENSED STATEMENT OF CASH FLOW

Financial information Report of the Independent Registered Public Accounting Firm220
Report of the Independent Registered PublicAccounting Firm to the General Meeting of Credit Suisse Group, Zurich
We have audited the accompanying consolidated balance sheets of Credit SuisseGroup and subsidiaries (the “Group”) as of December 31, 2004 and 2003, and therelated consolidated statements of income, changes in shareholders’ equity, andcash flows, and notes thereto, for each of the years in the three-year period endedDecember 31, 2004. These consolidated financial statements are the responsibilityof management and the Board of Directors. Our responsibility is to express anopinion on these consolidated financial statements based on our audits. We confirmthat we meet the legal requirements concerning professional qualification andindependence.
We conducted our audits in accordance with the standards of the Public CompanyAccounting Oversight Board (United States) and auditing standards promulgated bythe Swiss profession. Those standards require that we plan and perform the audit toobtain reasonable assurance about whether the financial statements are free ofmaterial misstatement. An audit includes examining, on a test basis, evidencesupporting the amounts and disclosures in the financial statements. An audit alsoincludes assessing the accounting principles used and significant estimates made bymanagement, as well as evaluating the overall financial statement presentation. Webelieve that our audits provide a reasonable basis for our opinion.
In our opinion, the consolidated financial statements referred to above present fairly,in all material respects, the financial position of the Group as of December 31, 2004and 2003, and the results of its operations and its cash flows for each of the yearsin the three-year period ended December 31, 2004, in conformity with accountingprinciples generally accepted in the United States of America, and comply with Swisslaw.
In accordance with Swiss law, we recommend that the consolidated financialstatements submitted to you be approved.
As discussed in Notes 1 and 2 to the consolidated financial statements, in 2004 theGroup changed its method of accounting for certain variable interest entities, in2003 the Group changed its methods of accounting for certain nontraditional long-duration contracts and separate accounts, variable interest entities and share-basedcompensation and in 2002 the Group changed its methods of accounting forgoodwill and intangible assets.
KPMG Klynveld Peat Marwick Goerdeler SA
Brendan R. Nelson Peter Hanimann Chartered Accountant Certified AccountantAuditors in Charge
Zurich, SwitzerlandMarch 24, 2005

221
222223
224224224224224224224225225225226
227228228228
229
230
Parent Company Content
Financial statements
Income statementBalance sheet before appropriation of retained earnings
Notes to the parent company financial statements1 Contingent liabilities2 Balance sheet assets with retention of title to secure own obligations3 Off-balance sheet obligations relating to leasing contracts4 Fire insurance value of tangible fixed assets5 Liabilities relating to pension plans and other retirement benefit obligations6 Bonds issued7 Principal participations8 Release of undisclosed reserves9 Revaluation of long-term assets to higher than cost10 Own shares held by the company and by Group companies11 Share capital, conditional and authorized capital of Credit Suisse Group
Report of the Capital Increase Auditors to the Board of Directors ofCredit Suisse Group, Zurich, on Conditional Capital Increase
12 Significant shareholders13 Legal reserves14 Provisions
Proposal to the Annual General Meeting
Report of the Statutory Auditors

222
Income statement
in CHF 1,000 2004 2003 Change Change in %
Income
Interest income and income from securities 394,962 257,677 137,285 53
Income from investments in Group companies 960,076 1,589,525 (629,449) (40)
Other income 345,682 313,067 32,615 10
Total income 1,700,720 2,160,269 (459,549) (21)
Expenses
Interest expenses 430,528 470,589 (40,061) (9)
Compensation, benefits and directors’ fees 117,202 58,688 58,514 100
Other expenses 274,045 227,878 46,167 20
Depreciation, write-offs and provisions 9,482 102,197 (92,715) (91)
Tax expense 38,034 19,783 18,251 92
Total expenses 869,291 879,135 (9,844) (1)
Net income 831,429 1,281,134 (449,705) (35)
Parent Company Financial statements

223
Balance sheet before appropriation of retained earnings
in CHF 1,000 Notes 31.12.04 31.12.03 Change Change in %
Assets
Investments in Group companies 7 33,931,601 34,108,216 (176,615) (1)
Long-term loans to Group companies 5,162,088 5,344,224 (182,136) (3)
Securities 187,512 791,822 (604,310) (76)
Long-term assets 39,281,201 40,244,262 (963,061) (2)
Cash with third parties 352 60 292 487
Cash with Group companies 1,014,506 2,231,048 (1,216,542) (55)
Securities 1,111,844 390,589 721,255 185
Other receivables from third parties 3,996 6,282 (2,286) (36)
Accrued income and prepaid expenses 455,725 493,692 (37,967) (8)
Current assets 2,586,423 3,121,671 (535,248) (17)
Total assets 41,867,624 43,365,933 (1,498,309) (3)
Shareholders’ equity and liabilities
Share capital 11 606,953 1,195,006 (588,053) (49)
Legal reserve 13 13,180,789 13,101,439 79,350 1
Reserve for own shares 10 1,950,228 1,950,228 0 0
Free reserves 14,540,000 14,540,000 0 0
Retained earnings:
retained earnings brought forward 3,386,649 2,105,515 1,281,134 61
net income 831,429 1,281,134 (449,705) (35)
Shareholders’ equity 34,496,048 34,173,322 322,726 1
Bonds 6 2,800,000 2,800,000 0 0
Long-term loans from Group companies 3,561,884 3,726,924 (165,040) (4)
Provisions 14 352,741 344,548 8,193 2
Long-term liabilities 6,714,625 6,871,472 (156,847) (2)
Payables to third parties 1,376 606,401 (605,025) (100)
Payables to Group companies 312,720 1,343,306 (1,030,586) (77)
Accrued expenses and deferred income 342,855 371,432 (28,577) (8)
Current liabilities 656,951 2,321,139 (1,664,188) (72)
Total liabilities 7,371,576 9,192,611 (1,821,035) (20)
Total shareholders’ equity and liabilities 41,867,624 43,365,933 (1,498,309) (3)
Parent Company Financial statements

224
1 Contingent liabilities
in CHF 1,000 31.12.04 31.12.03
Aggregate indemnity liabilities, guarantees and other contingent liabilities(net of exposures recorded as liabilities) 12,984,023 12,082,625
of which have been entered into on behalf of subsidiaries 12,961,658 12,060,043
The company belongs to the Swiss value-added tax (VAT) group of Credit Suisse Group, and thus carries joint liability to the Swiss federal tax authority for value-added taxdebts of the entire Group.
Parent Company Notes to the financial statements
2 Balance sheet assets with retention of title to secure own obligations
There are no such assets.
3 Off-balance sheet obligations relating to leasing contracts
There are no such obligations.
4 Fire insurance value of tangible fixed assets
There are no such assets.
5 Liabilities relating to pension plans and other retirement benefit obligations
There are no such liabilities.
6 Bonds issued
Interest Year of issue/in CHF m rate maturity date 31.12.04 31.12.03
Bonds 4.000% 1997 - 31.10.06 800 800
Bonds 4.000% 1997 - 23.05.07 1,000 1,000
Bonds 3.500% 1998 - 15.09.08 500 500
Bonds 3.500% 1999 - 02.07.09 500 500
Bonds 4.125% 2000 - 04.10.04 – 600
Bonds with a maturity of less than one year are recorded as payables to third parties.
7 Principal participations
The company’s principal participations are shown in the notes to the consolidated financial statements.
Credit Suisse Group Parent Company financial statements are prepared in accordance with Swiss Code of Obligation.

225Parent Company Notes to the financial statements
8 Release of undisclosed reserves
No significant undisclosed reserves were released.
9 Revaluation of long-term assets to higher than cost
There was no such revaluation.
10 Own shares held by the company and by Group companies
2004 2003
Share equivalents in CHF 1,000 Share equivalents in CHF 1,000
At beginning of financial year
Physical holdings 1) 64,642,966 2,902,339 73,833,716 2,215,014
Holdings, net of pending obligations 1,553,403 70,291 1,642,786 49,286
At end of financial year
Physical holdings 1) 103,086,736 4,921,427 64,642,966 2,902,339
Holdings, net of pending obligations 1,089,220 52,065 1,553,403 70,291
1) Representing 8.5%, 5.4% and 6.2% of issued shares as of 31.12.04, 31.12.03 and 31.12.02, respectively.

226 Parent Company Notes to the financial statements
11 Share capital, conditional and authorized capital of Credit Suisse Group
No. of Par value No. of Par valueregistered shares in CHF registered shares in CHF
Share capital as of December 31, 2003 1,195,005,914 1,195,005,914
Issued capital
Par value reduction payment (597,502,957)
Conditional capital
Warrants and convertible bonds
AGM of May 31, 2002 50,000,000 50,000,000
AGM of April 30, 2004 (par value reduction) – (25,000,000)
AGM of April 30, 2004 50,000,000 25,000,000
Securities converted January 1 - December 31, 2004 – – – –
Remaining capital 1) 50,000,000 25,000,000
Warrants and convertible bonds
AGM of April 25, 2003 50,000,000 50,000,000
AGM of April 30, 2004 (par value reduction) – (25,000,000)
Remaining capital 50,000,000 25,000,000
Staff shares
AGM of May 31, 2002 117,200,000 117,200,000
Subscriptions exercised January 1, 2002 - December 31, 2003 (4,739,574) (4,739,574)
AGM of April 30, 2004 (par value reduction) – (56,230,213)
AGM of April 30, 2004 112,460,426 56,230,213
Subscriptions exercised January 1 - December 31, 2004 (15,946,015) (7,973,008) 15,946,015 7,973,008
Remaining capital 96,514,411 48,257,205
Staff shares (Donaldson, Lufkin & Jenrette option programs)
AGM of May 31, 2002 19,076,749 19,076,749
Subscriptions exercised January 1, 2002 - December 31, 2003 (735,829) (735,829)
AGM of April 30, 2004 (par value reduction) – (9,170,460)
AGM of April 30, 2004 18,340,920 9,170,460
Subscriptions exercised January 1 - December 31, 2004 (2,954,288) (1,477,144) 2,954,288 1,477,144
Remaining capital 15,386,632 7,693,316
Authorized capital
Acquisitions of companies/participations
AGM of April 25, 2003 45,480,000 45,480,000
AGM of April 30, 2004 (par value reduction) – (22,740,000)
Remaining capital 45,480,000 22,740,000
Share capital as of December 31, 2004 1,213,906,217 606,953,109
1) 40,413,838 shares are reserved for the Mandatory Convertible Securities issued by Credit Suisse Group Finance (Guernsey) Ltd. on 23.12.02.

227Parent Company Report of the Capital Increase Auditors
Report of the Capital Increase Auditors to theBoard of Directors of Credit Suisse Group, Zurich,on Conditional Capital Increase
We have examined the issuance of shares for the period from January 1, 2004 toDecember 31, 2004 in accordance with the resolution passed by the GeneralMeeting of Shareholders of September 29, 2000 in accordance with Swiss law andCredit Suisse Group’s (the “Group”) Articles of Association. It is the responsibility ofthe Board of Directors to execute the issuance of new shares in accordance with theGroup’s Articles of Association. Our responsibility is to examine whether theissuance of new shares was done in accordance with Swiss law, the Group’s Articlesof Association, regulations and contracts. We confirm that we meet the legalrequirements concerning professional qualification and independence.
Our examination was conducted in accordance with the auditing standardspromulgated by the Swiss profession, which require that our examination be plannedand performed to obtain reasonable assurance about whether the issuance of newshares is free from material errors. We have performed the audit procedures requiredin the circumstances and are of the opinion that they form a reasonable basis for ouropinion.
In our opinion the issuance of 18’900’303 registered shares is in agreement withSwiss law, the Group’s Articles of Association, regulations and contracts.
KPMG Klynveld Peat Marwick Goerdeler SA
Zurich, SwitzerlandAugust 12, 2004 and March 2, 2005

228 Parent Company Notes to the financial statements
12 Significant shareholders
As of December 31, 2004 Credit Suisse Group has no shareholders and groups of shareholders, whose participationexceed 5% of all voting rights. With respect to own shares refer to note 10 to the financial statements.
13 Legal reserves
The change in legal reserves compared to December 31, 2003 equals the capital surplus of CHF 80.2 millionreceived for newly issued shares, less issuing costs of CHF 0.8 million.
14 Provisions
This item includes general provisions of CHF 311 million.

229Parent Company Proposal to the Annual General Meeting
Proposed appropriation of retained earnings
in CHF
Retained earnings brought forward 3,386,649,182
Net income 831,429,012
Retained earnings available for appropriation 4,218,078,194
Dividend
CHF 1.50 per registered share of CHF 0.50 par value(1’213’906’217 registered shares eligible for dividend as of December 31, 2004) 1,820,859,326
To be carried forward 2,397,218,868
Total 4,218,078,194
The number of registered shares eligible for dividend at the dividend payment date may increase due to the issuance of new registered shares.

230 Parent Company Report of the Statutory Auditors
Report of the Statutory Auditors to the General Meeting of Credit Suisse Group, Zurich
As statutory auditors of Credit Suisse Group, we have audited the accountingrecords and the financial statements (income statement, balance sheet and notes)for the year ended December 31, 2004. These financial statements are theresponsibility of the Board of Directors. Our responsibility is to express an opinion onthese financial statements based on our audit. We confirm that we meet the legalrequirements concerning professional qualification and independence.
Our audit was conducted in accordance with auditing standards promulgated by theSwiss profession, which require that an audit be planned and performed to obtainreasonable assurance about whether the financial statements are free from materialmisstatement. We have examined on a test basis evidence supporting the amountsand disclosures in the financial statements. We have also assessed the accountingprinciples used, significant estimates made and the overall financial statementpresentation. We believe that our audit provides a reasonable basis for our opinion.
In our opinion, the accounting records, financial statements and the proposedappropriation of retained earnings comply with Swiss law and Credit Suisse Group’sArticles of Association.
We recommend that the financial statements submitted to you be approved.
KPMG Klynveld Peat Marwick Goerdeler SA
Brendan R. Nelson Peter HanimannChartered Accountant Certified AccountantAuditors in Charge
Zurich, SwitzerlandMarch 24, 2005

CORPORATE GOVERNANCE
» The governing bodies of Credit Suisse Group
endeavor to increase the value of the company
in a sustainable and responsible manner. «

Corporate Governance232
Introduction
Credit Suisse Group’s corporate governance policies and procedures comply withinternationally accepted high standards of corporate governance. The Group strivesto adequately safeguard the interests of all of its stakeholders and acknowledgesthat good corporate governance and transparency in the disclosure of itsorganizational and management structure and other aspects of its corporategovernance helps stakeholders to better assess the quality of the company and itsmanagement and assists investors in their investment decisions.
Credit Suisse Group adheres to the principles stipulated in the Swiss Code of BestPractice and, as a company listed on the SWX Swiss Exchange, is also subject tothe SWX Directive Governing the Disclosure of Information on CorporateGovernance. Moreover, Credit Suisse Group’s shares are listed on the New YorkStock Exchange (NYSE) in the form of American Depositary Shares. As a result, theGroup is subject to certain US rules and regulations. Moreover, the Group largelyadheres to the NYSE’s Corporate Governance rules, although many of these rulesare not technically applicable to foreign private issuers such as Credit Suisse Group.
The following are the significant differences between the Group’s corporategovernance standards and the corporate governance standards applicable to USdomestic issuers listed on the NYSE (NYSE rules):
– Board committee membership: the NYSE rules require that a listed company’snominating and corporate governance committees each be made up entirely ofindependent directors. Swiss corporate governance standards generally requirethat only a majority of those committee members be independent. The Group’sChairman’s and Governance Committee, which also assumes the function of anominating/governance committee, is currently comprised of four independentmembers and one non-independent member.
– Approval of employee benefit plans: the NYSE rules require shareholder approvalof the establishment of, and material revisions to, all equity compensation plans.The definition of “equity compensation plans” covers plans that provide for thedelivery to employees or directors of either newly issued securities or securitiesacquired by the issuer in the secondary market. Swiss law requires thatshareholders approve the creation of the conditional capital used to set asideshares for employee benefit plans and other equity compensation plans but doesnot require shareholders to approve the terms of those plans.
– Risk Assessment and Risk Management: the NYSE rules allocate responsibilityfor the discussion of guidelines and policies governing the process by which riskassessment and risk management is undertaken to the Audit Committee, whilethe Group’s corporate governance standards allocate these duties to theseparate Risk Committee. While the Group’s Audit Committee members satisfythe NYSE independence requirements, the Chairman of the Group’s RiskCommittee is not considered independent due to his status as former Chief RiskOfficer of the Group.
– Reporting: the NYSE rules require that certain board committees report specifiedinformation directly to shareholders, while under Swiss law, only the Board of

233Corporate Governance
Directors reports directly to the shareholders, while the committees submit theirreports to the full Board.
The Group’s corporate governance policies and procedures may be derived from anumber of different governing documents. To facilitate an understanding and tosummarize the most important elements of Credit Suisse Group’s corporategovernance, the Board of Directors of Credit Suisse Group has adopted CorporateGovernance Guidelines. These guidelines create the basis for a sound corporategovernance framework and refer to other documents, which regulate certaingovernance aspects in more detail. Other key corporate governance documents,many of which can be downloaded from the Group’s website, include:
– Credit Suisse Group’s Articles of Association, which define its business purposeand basic organizational framework;
– Credit Suisse Group’s Internal Regulations Governing the Conduct of Business,which define the responsibilities and authorities of the various bodies withinCredit Suisse Group, as well as the reporting procedures;
– Credit Suisse Group’s Board of Directors Committee Charters, which define theduties and responsibilities of each committee; and
– Credit Suisse Group’s Code of Conduct, which lists 12 core ethical andperformance values. The Code of Conduct is a form of voluntary self-regulation,with which all Credit Suisse Group companies and their employees must comply.It was first established in 1999 in an effort to ensure that all employeesworldwide share a common set of values across the organization and to guide theGroup’s efforts to inspire and maintain the trust and confidence of all itsstakeholders. Effective January 1, 2004, an updated version of the Code wasapproved by the Board of Directors to further clarify its existing principles andmake it compliant with the requirements of Section 406 of the Sarbanes-OxleyAct and the NYSE rules. In particular, the Code of Conduct was expanded toinclude provisions on ethics for the Group’s Chief Executive Officer and theGroup’s principle financial and accounting officers, or other persons performingsimilar functions. No waivers to the Code of Conduct have been made since itsadoption. Information regarding any future amendments or waivers granted willbe published on the Group’s website.
Company
Credit Suisse Group has three business units, Credit Suisse, Credit Suisse FirstBoston and Winterthur. For details of the principal areas of activity of each businessunit, please refer to “Information on the Company.” A detailed review of therespective business unit results and activities in 2004 can be found in the section“Operating and Financial Review.” A list of significant subsidiaries and associates ofCredit Suisse Group can be found in note 47 to the consolidated financialstatements. With the exception of Neue Aargauer Bank, Aarau, Switzerland, 99% ofwhich is held by Credit Suisse Group and which is listed on the SWX SwissExchange (Swiss Security Number 397719, market capitalization as of December31, 2004, of CHF 1,626.0 million) and DBV Winterthur Holding AG, Wiesbaden,Germany, 71% of which is held indirectly by Credit Suisse Group and which is listedon the Frankfurt Stock Exchange (ISIN DE0008416900, market capitalization as ofDecember 31, 2004, of EUR 910.3 million), no other subsidiaries have shares listedon the SWX Swiss Exchange or any foreign stock exchange.

Corporate Governance234
Major shareholders
As of December 31, 2004, no shareholder was recorded in the share register asholding 5% or more of our stock. However, as of December 31, 2004, CreditSuisse Group and its affiliates held 103.1 million registered shares that, as a resultof such ownership, have no voting rights. This corresponds to 8.5% of the totalregistered shares of Credit Suisse Group. During 2004 no shareholder reached thethreshold of 5% of total shares, which would have required disclosure with the SWXSwiss Exchange.
As of December 31, 2004, according to the share register, 8.5 million shares, or0.7% of the total shares outstanding, were held by shareholders with registeredaddresses in the US. To the best of the Group’s knowledge, approximately 44.4million shares, including American Depositary Shares, or 3.65% of the total sharesoutstanding, were held in the US as of that date. To the best of its knowledge,Credit Suisse Group is not directly or indirectly owned or controlled by anothercorporation or any government or other person, and, to the best of its knowledge,there are no arrangements in place that could lead to a change in control of CreditSuisse Group.
Capital structure
Credit Suisse Group’s total outstanding share capital as of December 31, 2004, wasCHF 606,953,108.50, divided into 1,213,906,217 registered shares with a nominalvalue of CHF 0.5 per share. Credit Suisse Group’s shares are listed on the SWXSwiss Exchange and in the form of American Depositary Shares on the NYSE.
Details of changes to the share capital occurring in the course of the business yearand information as to the authorized and conditional capital and changes theretoduring the year can be found in note 11 to the parent company financial statementsas well as in the Articles of Association (articles 26, 26a, 26b and 27). For the twoprevious years’ information, reference is made to Credit Suisse Group’s 2003Annual Report or the 2003 Annual Report on Form 20-F.
Information on employee participation plans, including option plans, is contained innote 32 to the consolidated financial statements. Traded options and optionsconnected to derivative or structured market instruments issued by subsidiaries ofCredit Suisse Group are not disclosed separately in this Annual Report. Subsidiariesissuing such instruments to the capital markets pursue independent hedgingstrategies.
Board of Directors of Credit Suisse Group
MEMBERSHIP AND QUALIFICATIONS
The Articles of Association provide that the Board of Directors, or the Board, shallconsist of a minimum of seven members. Credit Suisse Group believes that the sizeof the Board must be such that the standing committees can be staffed withqualified members, but, at the same time, the Board must be small enough to

235Corporate Governance
enable an effective and rapid decision-making process. The members are electedindividually for a period of three years and are eligible for re-election. There is norequirement in the Articles of Association for a staggered board. One year of officeis understood to be the period of time from one ordinary Annual General Meeting ofShareholders (AGM) to the close of the next ordinary AGM. While the Articles ofAssociation do not provide for any age or term limitations, Credit Suisse Group’sInternal Regulations Governing the Conduct of Business specify that the members ofthe Board shall retire at the ordinary AGM in the year in which they reach the age of70. None of the Group’s directors has a service contract with the Group or any of itssubsidiaries providing for benefits upon termination of their service.
The Chairman’s and Governance Committee recruits and evaluates candidates forBoard membership based on a set of criteria established by the Committee. TheCommittee may also retain outside consultants with respect to the identification andrecruitment of potential new Board members. In assessing candidates, theChairman’s and Governance Committee considers the requisite skills andcharacteristics of Board members as well as the composition of the Board as awhole. Among other considerations, the Committee takes into accountindependence, diversity, age, skills and management experience in the context of theneeds of the Board to fulfill its responsibilities. Any newly appointed directorparticipates in an orientation program to familiarize himself or herself with CreditSuisse Group’s organizational structure, strategic plans, significant financial,accounting and risk issues and other important matters. The orientation program isdesigned to take into account the new Board member’s individual background andlevel of experience in each specific area. Moreover, the program’s focus is alignedwith any Committee memberships of the person concerned. Board members areencouraged to engage in continuous training. From time to time, the Board or aCommittee of the Board may ask a specialist within the Group to speak about aspecific topic at one of its meetings to improve the Board members’ understandingof emerging issues that already are or may become of particular importance to theGroup’s business.
INDEPENDENCE
The Board currently consists solely of directors who have no executive functionswithin the Group and includes a majority of independent directors, as determined bythe Board in its sole discretion, taking into account the factors set forth in theInternal Regulations Governing the Conduct of Business, the Committee Chartersand applicable laws and listing standards. The Chairman’s and GovernanceCommittee performs an annual assessment of the independence of each Boardmember and reports its findings to the Board for the final determination ofindependence of each individual member. In general, a director is consideredindependent if he or she is not, and has not been for the prior three years, employedas an executive officer of Credit Suisse Group or any of its subsidiaries, is not andhas not been for the prior three years an employee or affiliate of the Group’sexternal auditor and does not maintain, in the sole determination of the Board, amaterial direct or indirect business relationship with Credit Suisse Group or any of itssubsidiaries. Moreover, a Board member is not considered independent if he or sheis, or has been at any time during the prior three years, part of an interlockingdirectorate in which a member of the Group Executive Board serves on thecompensation committee of another company that employs the Board member.

Corporate Governance236
Board members with immediate family members who would not qualify asindependent are also not considered independent. Credit Suisse Group’s definition ofindependence is in line with the NYSE definition.
Whether or not a relationship between Credit Suisse Group or any of its subsidiariesand a member of the Board is considered material depends in particular on thefollowing factors:
– The volume and the size of any transactions concluded in relation to the financialstatus and credit rating of the Board member concerned or the organization inwhich he or she is a partner, significant shareholder or executive officer.
– The terms and conditions applied to such transactions in comparison to thoseapplied to transactions with counterparties of a similar credit standing.
– Whether the transactions are subject to the same internal approval processesand procedures as transactions that are concluded with parties that are notrelated to a Board member.
– Whether the transactions are performed in the ordinary course of business.– Whether the transactions are structured in such a way and on such terms and
conditions that the transaction could be concluded with a third-party provider oncomparable terms and conditions.
MEETINGS
The Board holds at least six regular, generally full-day meetings per year. In addition,the Board convenes as often as required to discuss any urgent matters. Themembers of the Board are expected to attend all or substantially all meetings of theBoard and the committees on which they serve. In 2004, each member of the Boardand its committees attended most of the scheduled meetings. All members of theBoard are also expected to spend the time away from these meetings needed todischarge their responsibilities appropriately. The Chairman calls the meeting withsufficient notice and prepares an agenda for each meeting. However, any otherBoard member has the right to call an extraordinary meeting, if deemed necessary.The Chairman has the discretion to invite members of management to attend themeetings. Generally, all members of the Group Executive Board Committee and theGroup Executive Board attend the meetings to ensure effective interaction with theBoard. At most meetings, the Board holds separate private sessions, withoutmanagement present, to discuss particular issues. Minutes are kept of theproceedings and resolutions of the Board.
BOARD RESPONSIBILITIES
By establishing the Internal Regulations Governing the Conduct of Business of CreditSuisse Group, the Board has delegated the management of the company and thepreparation and implementation of its resolutions to committees of the Board and tocertain management bodies or executive officers to the extent permitted by law, inparticular article 716a and 716b of the Swiss Code of Obligations, and Credit SuisseGroup’s Articles of Association.
With responsibility for the overall direction, supervision and control of the company,the Board regularly assesses the Group’s competitive position and approves its

237Corporate Governance
strategic and financial plans. At each meeting, the Board receives a status report onthe financial results of the Group. In addition, the Board regularly receivesmanagement information packages, which provide detailed information on theperformance and financial status of the Group, as well as risk reports outliningrecent developments and outlook scenarios. Management also provides the Boardmembers with regular updates on key issues, as is deemed appropriate orrequested. All members of the Board have access to all information concerning theGroup. Should a member of the Board require information or wish to review Groupdocuments outside a meeting, he or she can address this request to the Chairmanof the Board.
The Board also reviews and approves significant changes in the Group’s structureand organization and is actively involved in significant projects including acquisitions,divestitures, investments and other major projects. The Board and its committees areentitled, without consulting with management and at the expense of the Group, toengage independent legal, financial or other advisors – as they deem appropriate –with respect to any matters subject to their respective authority. The Board alsoperforms a self-assessment once a year.
BOARD COMMITTEES
The Board currently has four standing committees: the Chairman’s and GovernanceCommittee, the Audit Committee, the Compensation Committee and the RiskCommittee. The committee members are appointed for a term of one year.
Chairman’s and Governance Committee The Chairman’s and Governance Committee consists of the Chairman of the Boardand not less than two other members, a majority of whom must be independentpursuant to its charter. The current members are: Walter B. Kielholz (Chairman),Peter Brabeck-Letmathe, Hans-Ulrich Doerig, Aziz R.D. Syriani and Peter F. Weibel.The Chairman’s and Governance Committee has its own charter, which has beenapproved by the Board. It meets as often as required to discharge its responsibilities,generally eight to ten times per year. The length of the meetings depends on theagenda, but the meetings normally last about two hours. The Chairman may askmembers of management to attend all or part of a meeting.
The Chairman’s and Governance Committee acts as counselor to the Chairman anddiscusses a broad variety of topics in preparation for Board meetings. In addition, theChairman’s and Governance Committee is responsible for developing andrecommending a set of Corporate Governance Guidelines to the Board and forreviewing these guidelines from time to time. At least once annually, the Chairman’sand Governance Committee reviews the independence of the Board members andreports its findings to the Board for final determination. The Chairman’s andGovernance Committee is also responsible for identifying, evaluating, recruiting andnominating new Board members in accordance with the criteria established by theCommittee, subject to the applicable laws and regulations.
Moreover, at least once annually, the Chairman’s and Governance Committeereviews and evaluates the performance of the Chairman of the Board and of theChief Executive Officer and makes recommendations to the Board. The Chairman of

Corporate Governance238
the Board does not participate in the discussion of his own performance. TheChairman’s and Governance Committee proposes to the Board the appointment,promotion, dismissal or replacement of members of the Group Executive BoardCommittee and the Group Executive Board. The Chairman’s and GovernanceCommittee also reviews the succession plans relating to positions held by seniorexecutive officers of the Group with the Chairman and the Chief Executive Officerand makes recommendations to the Board regarding the selection of individuals tooccupy these positions.
Audit Committee The Audit Committee consists of not less than three members, all of whom must beindependent pursuant to the Audit Committee charter. The current members are:Peter F. Weibel (Chairman), Aziz R.D. Syriani and David W. Syz. The AuditCommittee has its own charter, which has been approved by the Board.
Pursuant to its charter, the members of the Audit Committee are subject toadditional independence requirements, which exceed those applied to other membersof the Board. None of the Audit Committee members may be an affiliated person ofthe Group or may, directly or indirectly, accept any consulting, advisory or othercompensatory fees from the Group other than their regular compensation as Boardand committee members. In line with the Audit Committee charter, all AuditCommittee members must be financially literate. In addition, they may not serve onthe audit committee of more than two other companies, unless the Board deemsthat such membership would not impair the member’s ability to serve on CreditSuisse Group’s Audit Committee. All of the Group’s Audit Committee members meetthese standards.
Moreover, the SEC stipulates that one member of the Audit Committee must be anaudit committee financial expert within the meaning of the US Sarbanes-Oxley Act of2002. The Board has determined Peter F. Weibel to be an audit committee financialexpert.
Pursuant to its charter, the Audit Committee holds full-day or half-day meetings atleast once each quarter prior to the publication of the financial statements. Typically,the Audit Committee convenes for a number of additional shorter meetings andconference calls throughout the year to adequately discharge its responsibilities. Themeetings are attended by management representatives, as required in accordancewith the agenda of the meeting. In addition, the Head of Internal Audit and seniorrepresentatives of the external auditor attend the meetings. At most AuditCommittee meetings, a private session with Internal Audit and the external auditorsis scheduled, which provides them with an opportunity to discuss issues with theAudit Committee without management being present. At some meetings, a jointsession with the Risk Committee members is arranged, where topics of interest toboth committees are discussed.
The primary function of the Audit Committee is to assist the Board in fulfilling itsoversight responsibilities by monitoring and assessing the integrity of the financialstatements and disclosures of the financial condition, results of operations and cashflows of the Group, monitoring processes designed to ensure the Group’scompliance with legal and regulatory requirements, monitoring the qualifications,independence and performance of the external auditors and of Internal Audit and

239Corporate Governance
monitoring the adequacy of financial reporting processes and systems of internalaccounting and financial controls. The Audit Committee is regularly updated onsignificant projects aimed at further improving such processes. The Audit Committeealso pre-approves the retention of, and fees paid to, the external auditor for all auditand non-audit services. For this purpose, it has developed and approved a policy,which is designed to help ensure that the independence of the external auditor ismaintained. The policy limits the scope of services that may be provided to CreditSuisse Group or any of its subsidiaries by the external auditor to audit and certainpermissible types of non-audit services, including audit-related services, tax servicesand other services that have been pre-approved by the Audit Committee. The AuditCommittee pre-approves all other services on a case-by-case basis. The externalauditor is required to periodically report to the Audit Committee regarding the extentof services provided by the external auditor and the fees for the services performedto date. The Audit Committee performs a self-assessment once a year.
Compensation Committee The Compensation Committee consists of not less than three members, all of whommust be independent pursuant to its charter. The current members are: Aziz R. D.Syriani (Chairman), Robert H. Benmosche and Peter Brabeck-Letmathe. TheCompensation Committee has its own charter, which has been approved by theBoard. Besides a number of shorter meetings throughout the year, as needed toperform its duties and responsibilities, the Compensation Committee has two main,generally half-day meetings per year, where it convenes for the primary purpose ofreviewing the performance of the business units and the respective managementteams, and determining and approving the overall compensation pools, thecompensation payable to the members of the Executive Boards of the Group and thebusiness units, Internal Audit and other members of senior management. Otherduties and responsibilities include approving newly established compensation plans orchanges made to existing plans. In order to support the analysis and diligence of thework of the Compensation Committee, an independent global compensationconsulting firm specialized in supporting companies in their compensation decisionsand processes has been retained by the Committee. Further information on thecompensation philosophy of the Group can be found in the section on“Compensation” below. The Compensation Committee performs a self-assessmentonce a year.
Risk Committee The Risk Committee consists of not less than three members. Pursuant to itscharter, it may include non-independent members. The current members are: Hans-Ulrich Doerig (Chairman), Thomas W. Bechtler, Noreen Doyle and Ernst Tanner. TheRisk Committee has its own charter, which has been approved by the Board. TheRisk Committee holds at least four, generally half-day meetings a year. In addition,the Risk Committee usually convenes for additional, shorter meetings throughout theyear to appropriately discharge its responsibilities. The Risk Committee’s main dutiesare to assist the Board in assessing the different types of risk and the riskmanagement structure, organization and processes in the Group. The RiskCommittee approves selected risk limits and makes recommendations to the Boardon all its risk-related responsibilities including the review of major risk managementand capital adequacy requirements. The Risk Committee performs a self-assessmentonce a year.

Corporate Governance240
Members of the Board of Directors and theCommittees
Walter B. Kielholz Chairman1)
Peter Brabeck-Letmathe Vice-Chairman 1) 2)
Hans-Ulrich Doerig Vice-Chairman 1) 4)
Thomas W. Bechtler 4)
Robert H. Benmosche 2)
Noreen Doyle 4)
Aziz R. D. Syriani 1) 2) 3)
David W. Syz 3)
Ernst Tanner 4)
Peter F. Weibel 1) 3)
1) Member of the Chairman’s and Governance Committee, chaired by Walter B. Kielholz
2) Member of the Compensation Committee, chaired by Aziz R. D. Syriani3) Member of the Audit Committee, chaired by Peter F. Weibel 4) Member of the Risk Committee, chaired by Hans-Ulrich Doerig
The composition of the Boards of Directors of the Group’s principal subsidiaries,Credit Suisse, Credit Suisse First Boston, “Winterthur” Swiss Insurance Companyand Winterthur Life, is the same as the composition of the Board of Directors ofCredit Suisse Group.
The Boards of Directors of Credit Suisse Group, Credit Suisse and Credit SuisseFirst Boston have resolved to merge the Credit Suisse legal entity with the CreditSuisse First Boston legal entity in Switzerland during the second quarter of 2005.The composition of the Board of Directors of the new Credit Suisse will be the sameas the composition of the Board of Directors of Credit Suisse Group.
CHANGE IN THE BOARD OF DIRECTORS
Thomas D. Bell retired from the Board of Directors effective October 1, 2004.

Chairman of the Board of Directors and the Chairman’s and Governance Committeesince January 1, 2003. Prior to that appointment, Mr. Kielholz served as Vice-Chairman of the Board (from May 2002, to December 2002) and Chairman of theAudit Committee (from May 1999 to December 2002). He was first appointed to theBoard in 1999. His term as a member of the Board expires at the AGM in 2006.The Board has determined him to be independent under the Group’s independencestandards.
Walter B. Kielholz studied Business Administration at the University of St. Gallen,and graduated in 1976 with a degree in Business Finance and Accounting.
His career began at the General Reinsurance Corporation, Zurich. After working inthe US, the UK and Italy, he assumed responsibility for the company’s Europeanmarketing. In 1986, he moved to Credit Suisse, Zurich, where he was responsiblefor client relations with large insurance groups in the Multinational Servicesdepartment.
Mr. Kielholz joined Swiss Re, Zurich, at the beginning of 1989. He became amember of Swiss Re’s Executive Board in January 1993 and was Swiss Re’s ChiefExecutive Officer from January 1997 to December 2002. A Board member sinceJune 1998, the Board of Directors of Swiss Re appointed him Vice-Chairman witheffect from January 1, 2003. Walter B. Kielholz is a member of the Board of theInternational Association for the Study of Insurance Economics (“The GenevaAssociation”), President of the Supervisory Board of Avenir Suisse, a member of theBoard and the Committee of economiesuisse and a member of the InternationalBusiness Leader Advisory Committee of the Mayor of Shanghai. In addition, he is amember of the Board of Trustees of the Lucerne Festival and Chairman of theZurich Art Society.
241Corporate Governance
Walter B. Kielholz
Born 1951, Swiss Citizen
Credit Suisse Group
Paradeplatz 8
P.O. Box 1
8070 Zurich, Switzerland
Vice-Chairman of the Board since 2000, member of the Chairman’s and GovernanceCommittee since 2003 and member of the Compensation Committee since 2000(Chairman from 2000 to 2004). Mr. Brabeck-Letmathe was first appointed to theBoard in 1997. He served as Lead Independent Director from March 2001 until theend of 2002. His term as a member of the Board expires at the Annual GeneralMeeting in 2005. The Board has determined him to be independent under theGroup’s independence standards.
Peter Brabeck-Letmathe studied Economics at the University of World Trade inVienna. After graduation in 1968, he joined Nestlé’s sales operations in Austria. Hiscareer within Nestlé includes a variety of assignments in several European countriesas well as in Latin America. Since 1987, he has been based at Nestlé’sheadquarters in Vevey. Since 1997, Mr. Brabeck-Letmathe has served as the ChiefExecutive Officer of Nestlé and has also been a member of Nestlé’s Board ofDirectors as of that date, currently serving as its Vice-Chairman (since 2001). Nestléhas announced that, effective April 14, 2005, he will also become Chairman of theBoard of Directors.
Mr. Brabeck-Letmathe is a member of the Boards of Directors of L’Oréal SA, Paris(since 1997) and Roche Holding SA, Basel (since 2000). He is also DeputyChairman of the Board of The Prince of Wales International Business Leaders Forumand a member of ERT (European Round Table of Industrialists), the Bretton WoodsCommittee’s International Council, Avenir Suisse, the World Economic Forum andthe Foundation for the International Federation of Red Cross and Red CrescentSocieties.
Peter Brabeck-Letmathe
Born 1944, Austrian Citizen
Nestlé SA
Avenue Nestlé 55
1800 Vevey, Switzerland

Corporate Governance242
Full-time Vice-Chairman of the Board and Chairman of the Risk Committee since2003. Prior to that appointment, Mr. Doerig served as Vice-Chairman of the GroupExecutive Board from 1998 to 2003 and as Chief Risk Officer from 1998 until2002. His term as a member of the Board expires at the Annual General Meeting in2006. The Board has determined him to be non-independent under the Group’sindependence standards due to his former executive function at the Group.
After completing his studies at the University of St. Gallen with degrees inEconomics and Law, including a doctorate received in 1968, and after five years atJP Morgan in New York, he joined Credit Suisse in 1973. In 1982, he wasappointed a member of the Executive Board of Credit Suisse with responsibility forthe multinational division, securities trading, capital markets, corporate finance andcommercial banking Asia. From 1993 to 1996, he served as Vice-Chairman of theBoard of Directors of Credit Suisse. In 1996, he became President of the ExecutiveBoard of Credit Suisse. During 1997, he served as Chief Executive Officer of CreditSuisse First Boston.
Mr. Doerig is a member of the supervisory bodies of various companies, foundationsas well as academic, arts, charitable and professional organizations, including theBoard of Directors of Bühler AG, Uzwil, and of the University of Zurich. He is theauthor of a number of publications on finance, education and management.
Hans-Ulrich Doerig
Born 1940, Swiss Citizen
Credit Suisse Group
Paradeplatz 8
P.O. Box 1
8070 Zurich, Switzerland
Member of the Board since 1994 and member of the Risk Committee since 2003.From 1999 to 2003, Mr. Bechtler served on the Audit Committee and from 2003 to2004 on the Compensation Committee. His term as a member of the Board expiresat the AGM in 2005.
Thomas W. Bechtler studied Law at the universities of Zurich and Geneva. Aftergraduating in 1973, he obtained a Master of Laws degree from Harvard University,Cambridge, in 1975, and a doctorate from Zurich University in 1976. Mr. Bechtler isthe Vice-Chairman and the delegate of the Boards of Directors of Hesta AG, Zug,and Hesta Tex AG, Zug, both largely family-owned companies which own ZellwegerLuwa AG, Uster, and Schiesser Group AG, Küsnacht. Mr. Bechtler has beenChairman of the latter companies since 1994 and 1992, respectively. Bankingsubsidiaries of the Group maintain significant banking relationships with Mr. Bechtleror companies affiliated with him. As a result, the Board has determined him to benon-independent under the Group’s independence standards.
Mr. Bechtler’s other board memberships include: Bucher Industries, Niederwenigen(since 1987), Conzzetta Holding AG, Zurich (since 1987), Sika AG, Baar (Vice-Chairman; since 1989), and Swiss Reinsurance Company, Zurich (since 1993). Mr.Bechtler is a member of the Board of Trustees of Swisscontact, Zurich.
Thomas W. Bechtler
Born 1949, Swiss Citizen
Seestrasse 21
8700 Küsnacht, Switzerland

243Corporate Governance
Member of the Board since 2002 and member of the Compensation Committeesince 2003. Mr. Benmosche’s term as a member of the Board expires at the AGMin 2005. The Board has determined him to be independent under the Group’sindependence standards.
Robert H. Benmosche has been Chairman of the Board and Chief Executive Officerof MetLife, Inc., New York, since the demutualization of the company in 2000 andof Metropolitan Life Insurance Company, New York, since 1998. Before joiningMetLife in 1995, Mr. Benmosche was with PaineWebber, New York, for 13 years,most recently in the position of an Executive Vice President and a member of thecompany’s Board of Directors. He received a B.A. degree in Mathematics fromAlfred University in 1966.
Robert H. Benmosche
Born 1944, US Citizen
Metropolitan Life
Insurance Company
One Madison Avenue
New York, NY 10010, USA
Member of the Board and the Risk Committee since 2004. Ms. Doyle’s term as amember of the Board expires at the AGM in 2007. The Board has determined her tobe independent under the Group’s independence standards.
Noreen Doyle was appointed First Vice President and Head of Banking of theEuropean Bank for Reconstruction and Development (EBRD) in 2001. She joinedthe EBRD in 1992 as head of syndications, was appointed Chief Credit Officer in1994 and became Deputy Vice President, Risk Management, in 1997. Prior tojoining the EBRD, Noreen Doyle spent 18 years at Bankers Trust Company withassignments in Houston, New York and London most recently as Managing Director,European loan syndications.
Ms. Doyle received a B.A. in Mathematics from The College of Mount Saint Vincent,New York, in 1971 and an MBA from The Amos Tuck School of BusinessAdministration at Dartmouth College, New Hampshire, in 1974.
She currently serves on the Board of Overseers of the Amos Tuck School ofBusiness Administration. In the past, she has served on the supervisory boards ofBudapest Bank in Hungary (from 1996 to 2001), and of BNP Dresdner Bank inBulgaria (from 1995 to 2001). She was also a member of the investment advisoryboard of the Alliance ScanEast Fund and has served on the Board of Trustees ofThe College of Mount Saint Vincent.
Noreen Doyle
Born 1949,
US and Irish Citizen
European Bank for
Reconstruction and
Development
One Exchange Square
London EC2A 2JN, UK

Corporate Governance244
Member of the Board since 1998, Chairman of the Compensation Committee since2004, member of the Chairman’s and Governance Committee since 2003 and theAudit Committee since 2003 (Chairman from 2003 to 2004). Mr. Syriani’s term as amember of the Board expires at the AGM in 2007. The Board has determined himto be independent under the Group’s independence standards.
Aziz R.D. Syriani holds a law degree from the University of St. Joseph in Beirut(obtained in 1965) and a Master of Laws degree from Harvard University,Cambridge (obtained in 1972). Mr. Syriani has been with the Olayan Group since1978 and currently serves as President (since 1978) and Chief Executive Officer(since 2002). The Olayan Group is a private multinational enterprise engaged indistribution, manufacturing and global investment.
Mr. Syriani serves on the Board of Occidental Petroleum Corporation, Los Angeles(since 1983), where he is currently the Lead Independent Director and Chairman ofthe Audit Committee, as well as serving on the Executive and the CorporateGovernance Committee.
Aziz R. D. Syriani
Born 1942, Canadian
Citizen
The Olayan Group
111 Poseidonos Avenue
P.O. Box 70228
Glyfada, Athens 16610,
Greece
Member of the Board and the Audit Committee since 2004. Mr. Syz’s term as amember of the Board expires at the AGM in 2007. The Board has determined himto be independent under the Group’s independence standards.
After completing his studies at the Law School of the University of Zurich andreceiving a doctorate from the same university in 1972 and an MBA at INSEAD,Fontainebleau, in 1973, David W. Syz started his career as Assistant to Director atthe Union Bank of Switzerland in Zurich and subsequently held the equivalentposition at Elektrowatt AG, Zurich. In 1975, he was appointed Head of Finance atStaefa Control System AG, Stäfa, and became Managing Director after four years.From 1982 to 1984, he was also Chief Executive Officer of Cerberus AG,Männedorf. In 1985, David Syz returned to Elektrowatt AG as Director and Head ofIndustries and Electronics. In 1996, he was appointed Chief Executive Officer andManaging Director of Schweizerische Industrie-Gesellschaft Holding AG (SIG),Neuhausen.
Appointed State Secretary in May 1999, David Syz took charge of the new StateSecretariat for Economic Affairs in 1999, a function from which he retired in 2004.
Since 2004, Mr. Syz has been Vice-Chairman of the Board of Huber & Suhner AG,Pfäffikon. Effective April 20, 2005, he will become Chairman of the Board of thatcompany. Prior to his appointment as State Secretary in 1999, he served on theBoards of Huber & Suhner AG, Pfäffikon; Georg Fischer AG, Schaffhausen; SIG,Schweizerische Industrie Gesellschaft AG, Neuhausen; Pestalozzi und Co. AG,Dietikon; and Banque Nationale de Paris (Suisse) SA, Zurich.
David W. Syz
Born 1944, Swiss Citizen
Dufourstrasse 21
8702 Zollikon, Switzerland

245Corporate Governance
Member of the Board since 2002 and member of the Risk Committee since 2003.Mr. Tanner’s term as a member of the Board expires at the AGM in 2005. TheBoard has determined him to be independent under the Group’s independencestandards.
Ernst Tanner is Chairman of the Board (since 1994) and Chief Executive Officer(since 1993) of Lindt & Sprüngli AG, Kilchberg, a Swiss chocolate producer listedon the SWX Swiss Exchange. Before joining Lindt & Sprüngli, Mr. Tanner worked atJohnson & Johnson, which he joined in 1969, most recently as Company GroupChairman of Johnson & Johnson Europe.
Mr. Tanner serves on the Board of The Swatch Group, Biel (since 1995). He is alsoa member of the Board of the Zurich Chamber of Commerce and delegate of theSociety for the Promotion of Swiss Economy. From 2000 to 2004, he served on theBoard of Adecco SA, Wallisellen.
Ernst Tanner
Born 1946, Swiss Citizen
Chocoladenfabriken
Lindt & Sprüngli AG
Seestrasse 204
8802 Kilchberg,
Switzerland
Member of the Board, the Chairman’s and Governance Committee and Chairman ofthe Audit Committee since 2004. Mr. Weibel’s term as a member of the Boardexpires at the AGM in 2007. The Board has determined him to be independentunder the Group’s independence standards. It has also determined him to be anaudit committee financial expert within the meaning of the US Sarbanes-Oxley Act of2002.
After completing his studies in Economics at the University of Zurich in 1968,including a doctorate which he obtained in 1972, and after working as a consultantat IBM Switzerland for three years, Peter F. Weibel joined UBS’ Central AccountingDepartment in 1975 and later became a Senior Vice President in its CorporateBanking division. In 1988, he was appointed Chief Executive Officer of Revisuisse,one of the predecessor companies of PricewaterhouseCoopers AG, Zurich, andserved as a member of the PricewaterhouseCoopers Global Oversight Board from1998 to 2001. He retired from his function as Chief Executive Officer ofPricewaterhouseCoopers AG, Zurich, in the summer of 2003 and thereafter joinedthe Boards of Credit Suisse, Credit Suisse First Boston and the two main Winterthurentities.
Mr. Weibel is Chairman of the Executive MBA Program of the University of Zurich, amember of the Board of the Greater Zurich Area AG and serves on the SwissAdvisory Council of the American Swiss Foundation and the Trend & Review Boardand the Nominating Committee of the Swiss-American Chamber of Commerce. Healso serves as Chairman of the Pestalozzi Foundation and the Zurich Art Festival.
Peter F. Weibel
Born 1942, Swiss Citizen
Credit Suisse Group
Paradeplatz 8
P.O. Box 1
8070 Zurich, Switzerland

Corporate Governance246
HONORARY CHAIRMAN OF CREDIT SUISSE GROUP
Rainer E. Gut was appointed Honorary Chairman of Credit Suisse Group in 2000,after he retired as Chairman of the Board, a position he had held since 1986. Mr.Gut is Chairman of the Board of Directors of Nestlé SA, Vevey (since 2000, Vice-Chairman since 1991 and member of the Board since 1981). At Nestlé’sforthcoming Annual General Meeting on April 14, 2005, he will retire from thisfunction. Effective April 26, 2005, Mr. Gut will also step down as Vice-Chairman ofthe Board of L’Oréal SA, Paris, of which he has been a member since 2000.
As Honorary Chairman, Mr. Gut maintains an office at Credit Suisse Group.However, he does not have any formal function and does not attend the meetings ofthe Board of Directors.
SECRETARIES OF THE BOARD OF DIRECTORS
Pierre Schreiber
Béatrice Fischer
PROPOSED MEMBERS OF THE BOARD OF DIRECTORS
In addition, to the re-election of Messrs. Brabeck, Bechtler, Benmosche and Tanner,the Board has proposed the following individuals for election to the Board ofDirectors at the Annual General Meeting of April 29, 2005, for a term of threeyears:
Rainer E. Gut
Born 1932, Swiss Citizen
Credit Suisse Group
Paradeplatz 8
P.O. Box 1
8070 Zurich, Switzerland
Jean Lanier is the former Chairman of the Managing Board and Group ChiefExecutive Officer of Euler Hermes, Paris, and was also the Chairman of theSupervisory Board of Euler Hermes SFAC, Euler Hermes ACI Inc. and of Eurofactor.He held these functions from 1998 until 2004. Prior to that, he was the ChiefOperating Officer and Managing Director of SFAC, which later become EulerHermes SFAC (from 1990 to 1997).
Mr. Lanier started his career at the Paribas Group in 1970, where he worked until1983 and held among others the functions of Senior Vice President of ParibasGroup Finance division and Senior Executive for North America of the Paribas Groupin New York. In 1983, he joined the Pargesa Group, where he held the positions ofPresident of Lambert Brussells Capital Corporation in New York from 1983 to 1989and Managing Director of Pargesa – based in Paris and Geneva – from 1988 to1990.
Jean Lanier holds a Masters of Engineering from the Ecole Centrale des Arts etManufactures, Paris (1969) and a Masters of Sciences from Cornell University,Ithaca, New York (1970).
Mr. Lanier is a Chevalier de la Légion d’Honneur in France and Chairman of theFoundation Les Amis de l’Arche. He does not currently hold any other significantboard memberships.
Jean Lanier
Born 1946, French Citizen
5, Square Lamartine
75016 Paris, France

Anton van Rossum was the Chief Executive Officer of Fortis, the leading Beneluxbanking and insurance group from 2000 to 2004. He was also a member of theBoard of Directors of Fortis and chaired the Boards of the principal subsidiaries ofthe group.
Prior to that, Mr. Van Rossum worked for 28 years with McKinsey and Company,where he led a number of top management consulting assignments with a focus onthe banking and insurance sectors. He was elected Principal and a Director of thefirm in 1979 and 1986, respectively, and worked in the Amsterdam and Copenhagenoffices, as well as the Brussels office of which he was a founding member.
He studied economics and business administration at the Erasmus University inRotterdam, where he obtained a bachelor’s degree in 1965 and a master’s degreein 1969.
While at Fortis, he was a member of the European Roundtable of Financial Servicesand a member of the Board of the Geneva Association. He is currently a Trustee andmember of the Global Advisory Council of the Conference Board and holds a numberof board positions in a variety of cultural and philanthropic institutions.
247Corporate Governance
Management
GROUP EXECUTIVE BOARD COMMITTEE
The Board of Directors generally delegates management authority and the power toimplement its resolutions to executive management bodies or executive officers. Themost senior executive body with a policy-making function is the Group ExecutiveBoard Committee, which was established effective July 13, 2004. Together with theChief Executive Officer, the Group Executive Board Committee is responsible for theday-to-day operational management of the Group and the implementation of theprincipal business strategy and the financial plans approved by the Board, as well asfor the definition of the guidelines for the internal organization and other generalpolicies of the Group.
Members of the Group Executive Board Committee
Oswald J. Grübel, Chief Executive Officer
Walter Berchtold
Brady W. Dougan
Renato Fassbind
Leonhard H. Fischer
Urs Rohner
Anton van Rossum
Born 1945, Dutch Citizen
10, Avenue de la Petite
Epinette
1180 Brussels, Belgium

Corporate Governance248
Executive Board of Credit Suisse Group1Renato Fassbind*Chief Financial Officer,Credit Suisse Group
2Michael PhilippChairman and ChiefExecutive Officer, Credit Suisse First BostonEurope, Middle East andAfrica
3Paul CalelloChairman and Chief Executive Officer,Credit Suisse First BostonAsia Pacific
4Leonhard H. Fischer*Chief Executive Officer,Winterthur
5Walter Berchtold*Chief Executive Officer, Credit Suisse
6Tobias GuldimannChief Risk Officer,Credit Suisse Group
*Member of the Group Executive Board Committee

249Corporate Governance
9Gary G. LynchExecutive Vice Chairman and General Counsel,Credit Suisse First Boston
10Urs Rohner*Head of the CorporateCenter and GroupGeneral Counsel,Credit Suisse Group
13Brady W. Dougan*Chief Executive Officer, Credit Suisse First Boston
11Ulrich KörnerChief OperatingOfficer and ChiefFinancial Officer,Credit Suisse
12Brian D. FinnPresident,Credit Suisse First Boston
7Richard E. ThornburghExecutive Vice Chairman,Credit Suisse First Boston
8Oswald J. Grübel*Chief Executive Officer,Credit Suisse Group

Corporate Governance250
Oswald J. Grübel is Chief Executive Officer of Credit Suisse Group (since July 13,2004) and chairs the Group Executive Board Committee and the Group ExecutiveBoard. A member of the Group Executive Board from 1997 to 2001 and since July2002, he served as Co-Chief Executive Officer of Credit Suisse Group from January2003 until his appointment as sole Chief Executive Officer.
After starting his career with Deutsche Bank, Mr. Grübel joined the trading area ofWhite Weld Securities, Zurich and London (which was later merged into CreditSuisse First Boston) in 1970 and was appointed Chief Executive Officer in 1978.After holding a variety of positions within the trading activities of the bank, includingmanagement responsibilities in Singapore and Hong Kong, Mr. Grübel was appointeda member of the Executive Board of Credit Suisse in 1991, where he wasresponsible for equities, fixed income, global foreign exchange, money markets andasset/liability management. In 1998, Mr. Grübel was appointed Chief ExecutiveOfficer of Credit Suisse Private Banking and from 2002 to 2004, he served as ChiefExecutive Officer of Credit Suisse Financial Services.
Mr. Grübel does not hold any significant board memberships outside Credit SuisseGroup.
Oswald J. Grübel
Born 1943, German Citizen
Credit Suisse Group
Paradeplatz 8
P.O. Box 1
8070 Zurich, Switzerland
Walter Berchtold is a member of the Group Executive Board Committee (since July13, 2004) and the Group Executive Board (since July 2003). Effective July 13,2004, he was appointed Chief Executive Officer of Credit Suisse. Prior to that, hewas the Chief Executive Officer of Banking at Credit Suisse Financial Services (April2004 to July 2004) and the Head of Trading & Sales at Credit Suisse FinancialServices (2003 to July 2004).
After obtaining a commercial diploma, he joined Credit Suisse First Boston ServicesAG, Zurich, in 1982, and, a year later, transferred as a trader to the precious metaland currency options unit of Valeurs White Weld SA in Geneva, which was laterrenamed Credit Suisse First Boston Futures Trading SA. In January 1987, he wasgiven the task of heading the Japanese convertible notes trading team, and in 1988,he assumed shared responsibility for all the business activities of Credit Suisse FirstBoston Futures Trading AG in Zurich.
In 1991, Walter Berchtold joined Credit Suisse in Zurich as Head of Arbitrage in theSecurities Trading department. In the following year he became Head of the EquityDerivatives Trading department. In 1993, he managed the Equity Trading unit, and in1994, he took on overall responsibility for Credit Suisse’s Securities Trading & Salesactivities globally.
From 1997 to 2000, Walter Berchtold was Head of Trading & Sales of Credit SuisseFirst Boston, Switzerland and thereafter became Country Manager of Credit SuisseFirst Boston, where he was responsible for the entire Swiss business of CreditSuisse First Boston.
Mr. Berchtold is a member of the Boards of the SWX Swiss Exchange (since 1996),Eurex (since 1998), Virt-x (since 2001) and the Swiss Bankers Association (since2004).
Walter Berchtold
Born 1962, Swiss Citizen
Credit Suisse
Paradeplatz 8
P.O. Box 2
8070 Zurich, Switzerland

251Corporate Governance
Brady W. Dougan is a member of the Group Executive Board Committee (since July13, 2004) and the Group Executive Board (since January 2003). Effective July 13,2004, he was appointed Chief Executive Officer of Credit Suisse First Boston. Priorto that, he was Co-President, Institutional Securities of Credit Suisse First Boston(2002 to July 2004).
Mr. Dougan received a B.A. in Economics in 1981 and an M.B.A. in Finance in1982 from the University of Chicago. After starting his career in the derivativesgroup at Bankers Trust, he joined Credit Suisse First Boston in 1990. He was theHead of the Equities Division for five years, before he was appointed Global Head ofthe Securities Division in 2001.
Mr. Dougan does not hold any significant board memberships outside Credit SuisseGroup.
Brady W. Dougan
Born 1959, US Citizen
Credit Suisse First Boston
11 Madison Avenue
New York, NY 10010, USA
Renato Fassbind is a member of the Group Executive Board Committee (since July13, 2004) and the Group Executive Board (since June 1, 2004). He is ChiefFinancial Officer of Credit Suisse Group, a function he assumed as of August 5,2004.
Mr. Fassbind graduated from the University of Zurich in 1979 with an Economicsdegree and received a doctorate from the same university in 1982. Moreover, Mr.Fassbind has been a Certified Public Accountant since 1986.
After two years with Kunz Consulting AG, Zurich, Mr. Fassbind joined F. Hoffmann-La Roche AG, Basel, where he worked in the Internal Audit Department from 1984to 1990, and was appointed Head of Internal Audit in 1988. In 1990, he joined ABBAG, Zurich, where he was Head of Internal Audit from 1990 to 1996 and ChiefFinancial Officer and member of the Group Executive Board from 1997 to 2002. In2002, he moved on to the Diethelm Keller Group, Zurich, where he was ChiefExecutive Officer, before joining Credit Suisse Group in June 2004.
Mr. Fassbind is a member of the Swiss Association of Public Trustees and theAmerican Institute for Certified Public Accountants. He does not have any significantboard memberships outside Credit Suisse Group.
Renato Fassbind
Born 1955, Swiss Citizen
Credit Suisse Group
Paradeplatz 8
P.O. Box 1
8070 Zurich, Switzerland

Corporate Governance252
Leonhard H. Fischer is a member of the Group Executive Board Committee (sinceJuly 13, 2004) and the Group Executive Board (since July 2003). He is ChiefExecutive Officer of Winterthur Group (since January 2003).
Mr. Fischer joined Winterthur Group from Allianz AG, Frankfurt, where he was Headof Corporate and Markets and Chief Executive Officer of Dresdner KleinwortWasserstein (2001 to 2002). Prior to that, he was with Dresdner Bank, Frankfurt(1998 to 2001), most recently as Head of Investment Banking.
He obtained a Business Management degree from the University of Bielefeld (in1986) and a Masters degree from the University of Georgia (in 1987).
Mr. Fischer is a member of the Supervisory Board of Axel Springer Verlag, AG,Berlin (since 2002).
Leonhard H. Fischer
Born 1963, German Citizen
Winterthur Group
General Guisan-Strasse 40
8401 Winterthur,
Switzerland
Urs Rohner is a member of the Group Executive Board Committee (since July 13,2004) and the Group Executive Board (since June 1, 2004). He is the Head ofCorporate Center and Group General Counsel (since June 1, 2004).
Mr. Rohner graduated from the Law School of the University of Zurich in 1983 andjoined the Swiss law firm Lenz & Stähelin in the same year. From 1988 to 1989, heworked with Sullivan & Cromwell, a New York-based law firm, as a ForeignAssociate before returning to Lenz & Stähelin, where he became a partner in 1992,focusing on capital markets, banking, competition and media law. Mr. Rohner is amember of the Zurich and New York bars. In 2000, he became Chief ExecutiveOfficer of ProSiebenMedia AG, Unterföhring, and later, after the merger with Sat1,Chairman of the Executive Board and Chief Executive Officer of ProSiebenSat.1Media AG, Unterföhring, before joining Credit Suisse Group in June 2004.
Mr. Rohner is a member of the Admission Board and of the Committee of theAdmission Board of the SWX Swiss Exchange, Zurich (since 2004) and serves onthe Board of the Zurich Opera House (since January 2005).
Urs Rohner
Born 1959, Swiss Citizen
Credit Suisse Group
Paradeplatz 8
P.O. Box 1
8070 Zurich, Switzerland

253Corporate Governance
GROUP EXECUTIVE BOARD
The Group Executive Board represents the next level of Group management andconsists of the members of the Group Executive Board Committee and additionalmembers appointed by the Board of Directors. The Group Executive Board isresponsible for aligning the business units to the strategic direction, values andprinciples of the Group. It develops the principal business strategy and the financialplans, coordinates matters across business units and discusses issues ofsignificance to the whole Group.
In addition to the members of the Group Executive Board Committee, the membersof the Group Executive Board are:
Paul Calello
Brian D. Finn
Tobias Guldimann
Ulrich Körner
Gary G. Lynch
Michael Philipp
Richard E. Thornburgh

Corporate Governance254
Paul Calello is a member of the Group Executive Board (since July 13, 2004) andChairman and Chief Executive Officer of the Asia Pacific Region of Credit SuisseFirst Boston (since 2002).
Mr. Calello joined Credit Suisse First Boston in 1990 as a founding member ofCredit Suisse Financial Products, the former financial derivatives subsidiary of CreditSuisse First Boston. Prior to his current function, Mr. Calello held severalmanagement positions in the firm’s global derivatives operations and worked inTokyo, London and New York. He is currently based in Hong Kong.
Before joining Credit Suisse First Boston Mr. Calello worked for Bankers Trust in theGlobal Markets Group in New York and Tokyo, and for the Federal Reserve Systemin the Monetary and Economic Policy Group in Boston and Washington.
Mr. Calello obtained an MBA from Columbia Business School and a B.A. fromVillanova University. He does not hold any significant Board memberships outsideCredit Suisse Group.
Paul Calello
Born 1961, US Citizen
Credit Suisse First Boston
Two Exchange Square
8 Connaught Place
Hong Kong, People’s
Republic of China
Brian D. Finn is a member of the Group Executive Board (since January 2003) andPresident of Credit Suisse First Boston (since July 13, 2004). He also has aleadership role in the day-to-day management and strategy of Credit Suisse FirstBoston’s Alternative Capital Division and has responsibility for the Global Corporateand Investment Banking Division. Prior to his current role, he was Co-President ofInstitutional Securities at Credit Suisse First Boston (from 2002 to July 2004).
Mr. Finn joined Credit Suisse First Boston in April 2002 from Clayton, Dubilier &Rice, a New York-based private equity firm, where he had been since 1997. Prior tothat, Mr. Finn was a Managing Director and Co-Head of Mergers & Acquisitions atCredit Suisse First Boston, New York, where he spent 15 years advising a widevariety of corporate clients.
Mr. Finn obtained a BSc in Economics from The Wharton School of the University ofPennsylvania in 1982. Besides several mandates in educational and charitableorganizations, he does not hold any significant board memberships outside CreditSuisse Group.
Brian D. Finn
Born 1960, US Citizen
Credit Suisse First Boston
11 Madison Avenue
New York, NY 10010, USA

255Corporate Governance
Tobias Guldimann is a member of the Group Executive Board and the Group ChiefRisk Officer (since July 13, 2004).
Mr. Guldimann studied Economics at the University of Zurich and received adoctorate from the same university in 1986. He joined Credit Suisse’s Internal AuditDepartment in 1986 before transferring to the Investment Banking area in 1990. Helater became Head of Derivatives Sales (in 1992), Head of Treasury Sales (in 1993)and Head of Global Treasury Coordination of Credit Suisse (in 1994). In 1997 hewas made responsible for the management support of the Chief Executive Officer ofCredit Suisse First Boston before becoming Deputy Chief Risk Officer of CreditSuisse Group, a function he held from 1998 to July 2004. From 2002 to 2004, healso served as Head of Strategic Risk Management at Credit Suisse.
Mr. Guldimann was a member of the Admission Board of the SWX Swiss Exchangeuntil 2004. He does not currently hold any significant board memberships outsideCredit Suisse Group.
Tobias Guldimann
Born 1961, Swiss Citizen
Credit Suisse Group
Paradeplatz 8
P.O. Box 1
8070 Zurich, Switzerland
Ulrich Körner is a member of the Group Executive Board (since January 2003) andthe Chief Operating Officer and Chief Financial Officer of Credit Suisse (since July13, 2004). Prior to that, he served as Chief Financial Officer of Credit SuisseFinancial Services (from 2002 to July 2004).
Mr. Körner graduated from the University of St. Gallen in 1988, majoring in Banking,and received a doctorate from the same university in 1993. From 1989 to 1993, hewas an auditor with PricewaterhouseCoopers and from 1993 to 1998, he was amanagement consultant with McKinsey & Company in Zurich. In 1998, he joinedCredit Suisse as its Chief Financial Officer. From July 2000 to the end of 2001, heserved as Head of Technology and Services at Credit Suisse Financial Services.
Mr. Körner does not hold any significant board memberships outside Credit SuisseGroup.
Ulrich Körner
Born 1962, German Citizen
Credit Suisse
Paradeplatz 8
P.O. Box 2
8070 Zurich, Switzerland
Corporate Governance256
Gary G. Lynch is a member of the Executive Board of Credit Suisse Group (sinceJuly 13, 2004) and Executive Vice Chairman and General Counsel of Credit SuisseFirst Boston, with responsibility for overseeing both the Research and Legal &Compliance departments.
Mr. Lynch joined Credit Suisse First Boston in 2001 from Davis Polk & Wardwell,where he was a partner since 1989. Previously, he spent 13 years at the Securitiesand Exchange Commission, and was Director of the Enforcement Division from1985 and 1989.
He graduated from Syracuse University in 1972 and received his JD from DukeUniversity School of Law in 1975. He does not hold any significant boardmemberships outside Credit Suisse Group.
Gary G. Lynch
Born 1950, US Citizen
Credit Suisse First Boston
11 Madison Avenue
New York, NY 10010, USA
Michael Philipp is a member of the Group Executive Board (since February 1, 2005)and Chairman and Chief Executive Officer of Credit Suisse First Boston Europe,Middle East and Africa (since 2005).
From 1995 to 2002, Mr. Philipp worked for Deutsche Bank, where he held anumber of senior management positions including Chairman and Chief ExecutiveOfficer of the Bank’s Asset Management business, Head of Global Equities andHead of Global Markets Sales. After he was elected to the Board of ManagingDirectors in 2000, he was also given responsibility for Deutsche Bank’s business inthe Middle East and South Africa.
Prior to that, Mr. Philipp spent over a decade in the global futures and optionsindustry and held management positions at Merrill Lynch and Goldman Sachs. Mr.Philipp is a founder and former Chief Executive Officer of Gyre Capital Management,which specializes in alternative investments. Prior to founding Gyre, he was Co-Chairman of Artist Network Ltd., a UK-based media and entertainment company.
He holds a B.A., an MBA in Finance and an honorary PhD from the University ofMassachusetts. Mr. Philipp serves on the Advisory Board of the Dubai InternationalFinancial Center and the Board of the Dubai International Financial Exchange.
Michael Philipp
Born 1953, US Citizen
Credit Suisse First Boston
One Cabot Square
London, E14 4QJ, United
Kingdom

257Corporate Governance
Richard E. Thornburgh is a member of the Group Executive Board (from 1997 to2001 and since September 2002) and Executive Vice Chairman of Credit SuisseFirst Boston. From 2003 to July 12, 2004, he was the Chief Risk Officer of CreditSuisse Group. In addition to his current responsibilities, Mr. Thornburgh has recentlyassumed the leading role in the Group’s integration project.
Mr. Thornburgh began his investment banking career in New York with The FirstBoston Corporation, a predecessor firm of Credit Suisse First Boston, in 1976. In1995, Mr. Thornburgh was appointed Chief Financial and Administrative Officer anda member of the Executive Board of CS First Boston. From 1997 to 1999, Mr.Thornburgh served as Chief Financial Officer of Credit Suisse Group and a memberof the Credit Suisse Group Executive Board, and from 1999 to 2002, he was ViceChairman of the Executive Board of Credit Suisse First Boston. In addition, heperformed the function of Chief Financial Officer of Credit Suisse First Boston fromMay 2000 through 2002. In his current function as Executive Vice Chairman, heoversees Credit Suisse Asset Management and Private Client Services and isresponsible for a number of other areas, including credit risk management, strategicrisk management, human resources, corporate services and corporatecommunications.
Mr. Thornburgh received a BBA from the University of Cincinnati in 1974 and anMBA from the Harvard Business School in 1976. He serves on the Board of theFinancial Services Roundtable Program Committee and is a member of theInternational Institute of Finance. He also serves on the Executive Committee of theUniversity of Cincinnati Foundation.
Richard E. Thornburgh
Born 1952, US Citizen
Credit Suisse First Boston
11 Madison Avenue
New York, NY 10010, USA
Changes in Management Structure
On June 24, 2004, the Board of Directors decided to implement a newmanagement structure. It was decided to discontinue the Co-CEO model at theGroup and to discontinue the Credit Suisse Financial Services business unit as anoverarching management unit for Credit Suisse and Winterthur, effective July 13,2004. As a result, John J. Mack, until then Co-CEO of Credit Suisse Group andChief Executive Officer of Credit Suisse First Boston, did not renew his contract thatexpired on July 12, 2004, and stepped down from his functions within the Group.Effective July 13, 2004, Oswald J. Grübel was appointed sole Chief ExecutiveOfficer of Credit Suisse Group, while Walter Berchtold and Brady W. Dougan wereappointed the Chief Executive Officers of Credit Suisse and Credit Suisse FirstBoston, respectively.
In addition, the Board established the Group Executive Board Committee, which isresponsible for the day-to-day management of the Group. This new committee tookover a substantial part of the responsibilities formerly performed by the full GroupExecutive Board, which continues to exist with a changed focus of responsibilities.As described above, the current members of the Group Executive Board Committeeare Messrs. O.J. Grübel, W. Berchtold, B.W. Dougan, R. Fassbind, L.H. Fischer andU. Rohner.
Since the beginning of 2004, the following changes in the composition of the GroupExecutive Board have occurred: Effective March 31, 2004, Alex W. Widmer retiredfrom his function as Head of Private Banking at Credit Suisse Financial Services and

Corporate Governance258
left the Group Executive Board. He remains with the Group as Senior Advisor inPrivate Banking. Effective June 1, 2004, Urs Rohner, newly appointed Head of theCorporate Center and Group General Counsel, and Renato Fassbind, designatedGroup Chief Financial Officer, joined the Group Executive Board.
In the context of the new management structure established effective July 13,2004, Barbara A. Yastine stepped down as Chief Financial Officer of Credit SuisseFirst Boston and left the Group Executive Board. In addition, David P. Frick, Head ofGroup Legal & Compliance, left the Group Executive Board and Paul Calello andGary G. Lynch were appointed new members. Finally, the Board appointed TobiasGuldimann as the new Group Chief Risk Officer and member of the Group ExecutiveBoard, replacing Richard E Thornburgh, who assumed new responsibilities withinCredit Suisse First Boston. Mr. Thornburgh remained on the Group Executive Board.
Effective July 29, 2004, Stephen R. Volk left the Group Executive Board andeffective August 5, 2005, upon handing over the Group Chief Financial Officerfunction to Mr. Fassbind, Philip K. Ryan retired from the Group Executive Board.Finally, effective February 1, 2005, Michael Philipp, newly appointed Chairman andChief Executive Officer of Credit Suisse First Boston Europe, Middle East andAfrica, joined the Group Executive Board.
DEPARTMENT HEADS AT THE CREDIT SUISSE GROUP CORPORATECENTER
Alois Bischofberger, Head of Economic Research
Rudolf A. Bless, Group Chief Accounting Officer
Kim Fox-Moertl, Head of Group Liquidity and Capital Management
David P. Frick, Head of Group Legal & Compliance
Timothy S. Gardner, Head of Human Resources
Stefan M. Goetz, Head of Group Corporate Development
Philip Hess, Chief of Staff
Heinz Leibundgut, Group Chief Auditor
Ann F. Lopez, Head of Credit Risk Management
Fritz Müller, Head of Tax
Charles Naylor, Group Chief Communications Officer
Yuji Suzuki, Chairman Japan
Marco Taborelli, Head of Group Marketing
Chris B. Zumstein, Security

259Corporate Governance
Executive Boards of the business units
EXECUTIVE BOARD OF CREDIT SUISSE
Walter Berchtold, Chief Executive Officer
Ulrich Körner, Chief Operating Officer and Chief Financial Officer
Alois Bättig, Private Banking Europe
David Blumer, Trading & Sales
Daniel Brupbacher, Investment Management
Romeo Lacher, Operations
Karl Landert, Technology & Operations
Josef Meier, Corporate & Retail Banking
Joachim H. Straehle, Private Banking International
Arthur Vayloyan, Private Banking Switzerland
Urs Hofmann, 1) Credit Suisse Business School
Denise Stüdi, 1) Human Resources
Marco Taborelli, 1) Marketing
1) Member of the Extended Executive Board

Corporate Governance260
EXECUTIVE BOARD OF CREDIT SUISSE FIRST BOSTON
Brady W. Dougan, Chief Executive Officer
Paul Calello, Chairman and Chief Executive Officer of the Asia Pacific Region
John A. Ehinger, Co-Head of the Equity Division
Brian D. Finn, President
Mark D. Granetz, Co-Head of Global Corporate and Investment Banking
John S. Harrison, Managing Director
James P. Healy, Head of Global Fixed Income
Michael E. Kenneally, Chairman and Global Chief Executive Officer of Credit SuisseAsset Management
James E. Kreitman, Co-Head of the Equity Division
Gary G. Lynch, Executive Vice Chairman and Global General Counsel
Neil Moskowitz, Chief Financial Officer
Eileen K. Murray, Head of Global Technology and Operations and Product Control
Adebayo O. Ogunlesi, Executive Vice Chairman and Chief Client Officer
Joanne Pace, Global Head of Human Resources
Michael Philipp, Chairman and Chief Executive Officer of Europe, Middle East andAfrica
Richard E. Thornburgh, Executive Vice Chairman
Eric M. Varvel, Co-Head of Global Corporate and Investment Banking

261Corporate Governance
EXECUTIVE BOARD OF WINTERTHUR GROUP
Leonhard H. Fischer, Chief Executive Officer
John R. Dacey, Strategy
Philippe Egger, Switzerland
Frank Keuper, DBV Winterthur
Hans F. Lauber, Chief Investment Officer
Hans Ulrich Lienau, Chief Financial Officer
Heinrich K. Linz, Corporate Center
Severin Moser, Chief Underwriting Officer
Wolfgang Schmidt-Soelch, Head Market Group 2
Christen Schnor, Chief Operating Officer and Head Market Group 1

Corporate Governance262
Advisory Board of Credit Suisse Group
The Credit Suisse Group Advisory Board discusses topics which are of significanceto the Group’s main activities, with a particular focus on its businesses in Switzerlandand Europe. While not involved in the governance of the Group, the members of theAdvisory Board provide input and advice to management on strategic issues, keyoperational priorities and organizational development.
Flavio Cotti, ChairmanFormer Federal Councilor, Brione sopra Minusio, Switzerland
Herbert A. Henzler, Vice-ChairmanHonorary Professor for Strategy and Organization at the Ludwig-Maximilians-University, Munich, Germany
Andreas N. Koopmann, Vice-ChairmanChief Executive Officer of Bobst SA, Lausanne, Switzerland
Franz AlbersPartner of Albers & Co., Zurich, Switzerland
Lino BenassiVice-Chairman of Toro Assicurazioni S.p.A., Torino, Italy
Susy BrüschweilerChief Executive Officer of SV Group, Zurich, Switzerland
Martin CandrianChairman of the Board of Candrian Catering AG, Zurich, Switzerland
Brigitta M. GadientLawyer and member of the Swiss National Council, Chur, Switzerland
Felix GutzwillerProfessor and Director of the Institute for Social and Preventive Medicine of theUniversity of Zurich and member of the Swiss National Council, Zurich, Switzerland
Michael HiltiChairman of the Board of Hilti Corporation, Schaan, Liechtenstein
Norbert HochreutenerHead of Public Affairs of the Swiss Insurance Association and member of the SwissNational Council, Berne, Switzerland
Andreas W. KellerChairman of the Board of Diethelm Keller Holding AG, Zurich, Switzerland
André KudelskiChairman of the Board and Chief Executive Officer of Kudelski SA, Cheseaux-sur-Lausanne, Switzerland

263Corporate Governance
Klaus-Michael KuehneChairman of the Board of Kuehne + Nagel International AG, Schindellegi,Switzerland
Andreas SchmidChairman of the Board of Barry Callebaut AG, Zurich, Switzerland
Manfred SchneiderChairman of the Board of Bayer Aktiengesellschaft, Leverkusen, Germany
Marco SolariChairman of the International Film Festival, Locarno, Switzerland
Hans-Peter ZehnderChairman of the Board and the Group Executive Committee of Zehnder Group AG,Gränichen, Switzerland
Compensation
Credit Suisse Group is committed to employing a compensation philosophy thatrewards excellence, encourages personal contribution and professional growth, andaligns the employees’ values with the Group’s core ethical and performance valuesand thus motivates the creation of shareholder value. Long-term corporate successdepends upon the strength of human capital, and Credit Suisse Group’s goal istherefore to be the employer of choice in all the markets and business segments inwhich it operates.
As such, Credit Suisse Group’s compensation programs are designed to:
– Support a merit-based, performance-oriented culture that allows high performersto achieve superior recognition;
– Attract a suitably qualified, diverse work force by offering market-competitivecompensation practices throughout the respective business units, divisions andbusiness lines; and
– Motivate employees to create sustainable value.
CORE COMPENSATION PRINCIPLES
Credit Suisse Group’s four core compensation principles are:
Performance basedThe Group’s programs are designed to create a high-performance culture. Thespecific measures of success that apply and the forms of compensation that aregranted vary by business unit, geographic market and employee job function andlevel. Most employees, however, have their pay linked to a combination of Group,business unit, division, department and individual performance.
Value orientedThere is a strong link between compensation programs and company values. Thedesign and administration of the compensation programs are guided and supported

Corporate Governance264
by the Credit Suisse Group Code of Conduct, the respective business unit’s corevalues and the Group’s commitment to diversity. Individual performance evaluationsmeasure results and the extent to which each employee upholds these values.
Market drivenCompensation levels must be competitive with those of peers in each of the marketsin which Credit Suisse Group competes. The Group’s programs are structured tocompete both in design and in total compensation relative to the benchmarks ofcompetitive practices and performance. Appropriate pay positioning at all levels andfor all components of compensation including base salary, variable cashcompensation, equity awards and other deferred programs, is assessed andreviewed regularly.
Shareholder alignedCompensation should reflect not only short-term business performance but alsogrowth over the long term. The Group’s long-term incentive compensation programsare designed to encourage the creation of shareholder value by linking annual pay tothe Group financial results and by providing a competitively balanced pay mixbetween cash and equity.
COMPENSATION ELEMENTS
Compensation can be split into two main categories:
– Fixed compensation (base salary and local allowances); and– Variable compensation (cash bonus, deferred bonus and long-term incentives).
The compensation mix varies by functional level within the organization. A majority ofthe compensation awarded to general staff is fixed. At management level, thecompensation mix varies by business, position and location – with a greateremphasis on incentive elements at executive level. The principles associated witheach category of compensation are described below. Regional and business segmentmodifications are taken into consideration in accordance with local laws, customs orpractice or collective bargaining agreements.
Fixed compensation As part of its compensation philosophy, Credit Suisse Group seeks to pay all full-time employees competitive base salaries that attract, motivate and retain highlyqualified professionals. Base salaries for employees take into consideration position,experience and skill sets and acknowledge individual performance.
Credit Suisse Group’s base salary structure is generally aimed at the median level ofthe industry in the relevant markets. The period of review, generally annually, is setaccording to local practice. The Group also seeks to provide competitive pension andfringe benefit packages in accordance with local market practice in each jurisdictionin which it operates.
Variable compensationThe awarding of any variable compensation and the value thereof is determined on abusiness-by-business and on an individual basis and, unless dictated by contractualobligation, is solely at the discretion of the Group.

265Corporate Governance
– The cash bonus element is intended to reward and drive performance above andbeyond the core requirements of the job function, providing greater earningpotential for employees exceeding predetermined goals. In addition, the Groupmay pay commissions to employees operating in specific areas of the businesswhere such compensation practices are warranted. The value of commissionspaid is determined by formulae which are regularly reviewed to ensure theyremain competitive in respect of market benchmarks.
– The deferred bonus element is designed to promote employee retention and alignemployee and shareholder interests. In certain jurisdictions, this may have taxbenefits. The principal vehicle for delivery of the deferred bonus is the CreditSuisse Group Master Share Plan. Under the Master Share Plan, a portion of thebonus may be delivered in the form of registered shares, phantom shares,options or other equity-based instruments. The mandatory deferral percentage isbased upon the employee’s position and compensation level in accordance withthe terms of the applicable business unit regulations. All equity awards aresubject to restrictive covenants such as vesting, forfeiture or blocking, accordingto local regulations. In addition to mandatory deferrals, voluntary deferrals areoffered in certain jurisdictions and may include such elements as contributions topension/retirement plans and deferred cash compensation plans.
– The Group also employs a variety of other long-term incentive plans or programsto assist in hiring at competitive levels, to enhance the link between theemployees and the shareholders, and to further encourage retention. Theseusually consist of special equity grants with terms and conditions designed tomeet the plan’s objectives.
METRICS
Competitive market analysis and performance evaluations are completed annuallyand reviewed with the Compensation Committee in support of annual incentivecompensation recommendations. The analysis consists of data obtained from varioussources including competitor analysis completed by an appointed independent globalcompensation consulting firm, benchmarking statistics directly from competitors andsurvey providers, proxy data and general market intelligence.
Within the context of the respective markets, Credit Suisse Group evaluatesperformance at several levels:
The Company– Overall Credit Suisse Group financial results are examined, analyzing quantitative
performance goals including: net income, net operating profit, pre-taxmargin/return on equity and ratio of compensation expense to net revenue.Performance targets for the ensuing year are set during the annual strategicplanning process.
The business unit, division and/or department– The actual versus budget and prior-year contribution is measured, as well as
strategic initiatives, market share and the control environment.
Corporate Governance266
The individual employee– The individual employee’s performance is assessed against objectives and
accomplishments using a number of methods such as employee reviews, a 360°evaluation process, a “management-by-objectives” process, as well as by lookingat qualitative measures such as the employee’s participation in activities whichpromote Credit Suisse Group’s vision and strategy or his or her compliance withthe values stipulated in the Group’s Code of Conduct.
During 2004, the Compensation Committee received reports and guidance from anindependent global compensation consulting firm to ensure that the programs, in thejudgment of the Compensation Committee, remain competitive and correspond tomarket practice, are in line with Credit Suisse Group’s compensation principles andtake shareholder interests into consideration.
Additional information on “Compensation to and equity holdings of members of theBoard of Directors and the most senior executive body” can be found in note 33 tothe Consolidated Financial Statements. Information on “Related party transactions” isavailable in note 35 to the Consolidated Financial Statements.
Shareholders
VOTING RIGHTS, TRANSFER OF SHARES
There is no limitation under Swiss law or Credit Suisse Group’s Articles ofAssociation, or AoA, on the right of non-Swiss residents or nationals to own CreditSuisse Group shares. Credit Suisse Group recognizes as a shareholder with votingrights the person whose name is entered in the share register. A person who hasacquired shares will, upon application and disclosure of his or her name, address andcitizenship, be entered without limitations in the share register as having voting rightsprovided that he or she expressly states that the shares were acquired in his or herown name for his or her own account (Art. 4, Section 1 and 2 of the AoA). Anyperson not expressly making such a statement, which is referred to as a “nominee,”may be entered for a maximum of 2% of the total outstanding share capital withvoting rights in the share register. In excess of this limit, registered shares held by anominee will only be granted voting rights if the nominee declares in writing that heor she is prepared to disclose the name, address and shareholding of any person forwhose account he or she is holding 0.5% or more of the outstanding share capital(Art. 4, Section 3 of the AoA).
In principle, each share represents one vote at the Annual General Meeting, or AGM,with the exception of the shares held by Credit Suisse Group, which, in accordancewith Swiss law, do not have any voting rights. However, the shares for which asingle shareholder can directly or indirectly exercise voting rights, for his or her ownshares or as a proxy, may not exceed 2% of the total outstanding share capital,unless one of the exemptions discussed below applies (Art. 10, Section 1 of theAoA). For the purposes of the restrictions on voting rights, legal entities,partnerships or groups of joint owners or other groups in which individuals or legalentities are related to one another through capital ownership or voting rights or havecommon management or are otherwise interrelated are regarded as being a singleshareholder. The same applies to individuals, legal entities or partnerships that act in

267Corporate Governance
concert with intent to evade the limitation on voting rights (Art. 10, Section 2 of theAoA).
The restrictions on voting rights do not apply to the exercise of voting rights by theCredit Suisse Group proxy or by the independent proxy as designated by CreditSuisse Group (Art. 689c of the Swiss Code of Obligations, or CO) or by personsacting as proxies for deposited shares (Art. 689d of the CO) provided all suchpersons have been instructed by shareholders to act as proxies (Art. 10, Section 3of the AoA). Nor do the restrictions on voting rights apply to shares in respect ofwhich the shareholder confirms to Credit Suisse Group in the application forregistration that he or she has acquired the shares in his or her name for his or herown account and in respect of which the disclosure requirements in accordance withthe Federal Act on Stock Exchange and Securities Trading and the relevantordinances and regulations have been fulfilled (Art. 10, Sections 4 and 6 of theAoA). In addition, the restrictions on voting rights do not apply to shares which areregistered in the name of a nominee, provided that this nominee furnishes CreditSuisse Group with the name, address and shareholding of the person(s) for whoseaccount he or she holds 0.5% or more of the total share capital outstanding at thetime and for which he or she has satisfied the disclosure requirements in accordancewith the Federal Act on Stock Exchanges and Securities and the relevant ordinancesand regulations. The Board of Directors has the right to conclude separateagreements with nominees concerning both their disclosure requirements and theexercise of voting rights (Art. 10, Section 5 AoA). At December 31, 2004, no suchagreements were in place.
The AoA provide that Credit Suisse Group may elect not to print and delivercertificates in respect of registered shares. Shareholders may, however, request atany time that such certificates be printed and delivered free of charge. In the case ofshares not physically represented by certificates, the transfer of shares is effectedby a corresponding entry in the custody records of a bank or the depositaryinstitution following an assignment in writing by the selling shareholder andnotification of such assignment to Credit Suisse Group by the transferor, the bank ordepositary institution. The transfer of shares further requires that the purchaser file ashare registration form to be registered in the share register as a shareholder. Failingsuch registration, the purchaser may not vote or participate in shareholders’meetings.
Each shareholder, whether registered in the share register or not, is entitled toreceive dividends, if and when approved at the AGM. The same principle applies forcapital repayments in the event of a reduction of the share capital and for liquidationproceeds in the event Credit Suisse Group is dissolved or liquidated. Under Swisslaw, a shareholder has no liability for capital calls, but is also not entitled to reclaimhis or her capital contribution. Swiss law further requires a company to apply theprinciple of equal treatment to all shareholders.

Corporate Governance268
ANNUAL GENERAL MEETING
Under Swiss law, the AGM must be held within six months after the end of the fiscalyear. For Credit Suisse Group, the fiscal year ends December 31, which means thatthe AGM can be held no later than June 30. The AGM may be convened by theBoard of Directors or, if necessary, by the statutory auditors, with 20 days’ advancenotice. The Board of Directors is further required to convene an extraordinaryshareholders’ meeting if so resolved at a shareholders’ meeting or if so requested byshareholders holding in aggregate at least 10% of the nominal share capital. Therequest to call an extraordinary shareholders’ meeting must be submitted in writingto the Board of Directors, and, at the same time, shares of Credit Suisse Grouprepresenting at least 10% of the share capital must be deposited. Shareholdersholding shares with an aggregate par value of CHF 0.5 million have the right torequest that a specific item be put on the agenda and voted upon at the next AGM.The request to include a particular item on the agenda, together with a relevantproposal, must be submitted in writing to the Board of Directors not later than 45days before the meeting and, at the same time, shares of Credit Suisse Group witha par value of at least CHF 0.5 million must be deposited for safekeeping. Theshares remain in safekeeping until the day after the AGM (Art. 7 of the AoA). Noticeof an AGM, including agenda items and proposals submitted by the Board ofDirectors and by shareholders, must be published in the Swiss Gazette of Commerce(Schweizerisches Handelsamtsblatt) at least 20 days prior to the meeting.
Holders of shares may request a registration in the share register at any time. Thereis, in particular, no deadline for registering shares before an AGM. However,technical considerations may make a registration on the same day as the AGMimpossible.
The AGM may, in principle, pass resolutions without regard to the number ofshareholders present at the meeting or represented by proxy. Resolutions andelections by the AGM generally require the approval of a majority of the votesrepresented at the meeting, except as otherwise prescribed by mandatory provisionsof law or by the Articles of Association (Art. 13, Section 1 of the AoA). For example,shareholders’ resolutions requiring a vote by a majority of the votes representedinclude (i) amendments to the AoA, unless a supermajority is necessary; (ii) electionof directors and statutory auditors; (iii) approval of the annual report and thestatutory and consolidated accounts; and (iv) determination of allocation ofdistributable profit. However, under Swiss law, a quorum of at least half of the sharecapital and a two-thirds majority of the votes represented is required for resolutionson (i) change of the purpose of the company; (ii) creation of shares with increasedvoting powers; (iii) implementation of transfer restrictions on shares; (iv) authorizedor conditional increase in the share capital; (v) increase of capital by way ofconversion of capital surplus or by contribution in kind; (vi) restriction or suspensionof preferential rights; (vii) change of location of the principal office; and (viii)dissolution of the company without liquidation. A quorum of at least half of the sharecapital and approval by at least three-quarters of the votes cast is required forresolutions on (i) the conversion of registered shares into bearer shares; (ii)amendments to the provision of the AoA relating to registration and voting rights ofnominee holders; and (iii) the dissolution of the company. A quorum of at least halfof the share capital and the approval of at least seven-eighths of votes cast isrequired for amendments to provisions of the AoA relating to voting rights (Art. 12,Section 2 and Art. 13 Section 2 of the AoA).

269Corporate Governance
Changes of control and defense measures
DUTY TO MAKE AN OFFER
Unless otherwise provided in the AoA, anyone who, directly or indirectly or acting inconcert with third parties, acquires 33 1/3% or more of the voting rights of a listedSwiss company, whether or not such rights are exercisable, must make an offer toacquire all of the listed equity securities of such company (Art. 32 of the Federal Acton Stock Exchanges and Securities Trading, or Stock Exchange Act). The AoA donot include a contrary provision. This mandatory offer obligation may be waivedunder certain circumstances by the Swiss Takeover Board or the Federal BankingCommission. If no waiver is granted, the mandatory offer must be made pursuant toprocedural rules set forth in the Stock Exchange Act and the implementingordinances.
CLAUSES ON CHANGES OF CONTROL
Subject to certain provisions in the Group’s employee benefit plans providing for thetreatment of outstanding awards in the case of a change of control, there are noprovisions that require the payment of extraordinary benefits in case of a change ofcontrol in the agreements and plans benefiting members of the Board of Directorsand Group Executive Board or any other members of senior management.Specifically, there are no contractually agreed severance payments in the case of achange of control of the Group. Moreover, none of the employment contracts withmembers of the Group Executive Board or other members of senior managementprovides for extraordinary benefits that would be triggered by a change of control.
Internal and External Auditors
INTERNAL AUDIT
At year-end, Credit Suisse Group’s Internal Audit Department consisted ofapproximately 290 professionals, more than 250 of which are engaged directly inaudit activities. The head of Internal Audit is Heinz Leibundgut, who reports directlyto the Audit Committee.
Internal auditing is an independent, objective assurance and consulting activitydesigned to add value and improve Credit Suisse Group’s operations. It uses asystematic, disciplined approach to evaluating and improving the effectiveness of theGroup’s risk management, control and governance processes. Internal Audit isresponsible for carrying out audits in the Group’s banking and insurance businessareas on a periodic basis in line with Auditing Regulations as approved by the AuditCommittee or the Board of Directors. Internal Audit regularly and independentlyassesses the risks of the various business activities, taking into account, amongother things, industry developments, strategic and organizational decisions, bestpractice and regulatory concerns. Based on the results of its assessment, InternalAudit develops detailed annual audit objectives, defining areas of audit concentrationand required resources to be approved by the Audit Committee. Internal Auditcoordinates its efforts with the activities of the external auditor to leverage the totaleffect. Striving for best practice, Internal Audit regularly benchmarks its methods andtools with peers. Management as well as the Chairman of the Board and the

Corporate Governance270
Chairman of the Audit Committee regularly receive individual reports or summariesprepared by Internal Audit. In addition, the head of Internal Audit reports thedepartment’s findings to the Audit Committee at each quarterly meeting
EXTERNAL AUDITORS
Credit Suisse Group’s statutory and group auditor is KPMG Klynveld Peat MarwickGoerdeler SA, Zurich, or KPMG. The mandate was first given to KPMG for thebusiness year 1989/1990. The lead Group engagement partners, Brendan Nelson,who is the Global Lead Partner, and Peter Hanimann, who is the Leading BankAuditor, assumed these roles in 1997 and 1998, respectively. In line with theapplicable regulations, both are in the process of handing over their responsibilitiesto a new team which will be responsible for the audit of the 2005 financialstatements. The lead Group engagement partners as of January 1, 2005 are: DavidJahnke, Global Lead Partner, and Roland Müller, Leading Bank Auditor. In addition,Credit Suisse Group has mandated BDO Visura, Zurich, as special auditor for thepurposes of issuing the legally required report for capital increases in accordancewith Article 652f of the Swiss Code of Obligations.
The Audit Committee monitors and pre-approves the fees to be paid to KPMG for itsservices.
KPMG received the following fees related to the years 2003 and 2004:
Type of Service (in CHF m) 2004 2003
Audit services 48.9 51.1
Audit-related services 1) 14.4 3.7
Tax services 2) 10.0 8.1
All other services 3) 0.2 3.5
1) Audit-related services are primarily in respect of: (i) reports related to the Group’s compliance with provisions of or calculations required by agreements; (ii) internal controlrelated reports; (iii) accounting advice; (iv) audits of private equity funds and employee benefit plans; and (v) regulatory advisory services. 2) Tax services are in respect of taxcompliance and consultation services, including: (i) preparation and or review of tax returns of the Group and its subsidiaries; (ii) assistance with tax audits and appeals; (iii)expatriate tax return preparation services; and (iv) confirmations relating to the Qualified Intermediary status of Group entities. 3) All other services are primarily in respect of:(i) information risk management advisory services; and (ii) accounting and tax advice provided to front office personnel in connection with client transactions.
KPMG attends all meetings of the Audit Committee. At each meeting, KPMG reportson the findings of its audit and/or review work. The Audit Committee approves on anannual basis KPMG’s audit plan and evaluates the performance of KPMG and itssenior representatives in fulfilling its responsibilities. Moreover, the Audit Committeerecommends to the Board the appointment or replacement of the external auditor,subject to shareholder approval.
KPMG provides a report as to its independence to the Audit Committee at least oncea year. In addition, Credit Suisse Group’s policy on the engagement of publicaccounting firms, which has been approved by the Audit Committee, strives tofurther ensure an appropriate degree of independence of its external auditor. Thepolicy limits the scope of services that may be provided to Credit Suisse Group orany of its subsidiaries by KPMG to audit and certain permissible types of non-auditservices, including audit-related services, tax services and other services that havebeen pre-approved by the Audit Committee. The Audit Committee pre-approves allother services on a case-by-case basis. All KPMG services in 2004 were pre-

271Corporate Governance
approved. KPMG is required to periodically report to the Audit Committee regardingthe extent of services provided by KPMG and the fees for the services performed todate.
Employees
As of December 31, 2004, we employed 60,532 employees worldwide. Of the totalnumber of employees, 25,705 were employed in Switzerland and 34,827 wereemployed abroad.
In 2004, our total number of employees increased by 55. In 2003, our total numberof employees decreased by 17,980 or 22.9%. These declines primarily resultedfrom divestitures of businesses within the Group. A majority of our employees do notbelong to unions. We have not experienced any significant strike, work stoppage orlabor dispute in recent years. We consider our relations with employees to be good.
The following table sets forth the number of employees by segment as of December 31:
2004 2003 2002
Private Banking 12,342 11,850 12,967
Corporate & Retail Banking 8,314 8,479 9,281
Institutional Securities 16,498 15,374 15,666
Wealth & Asset Management 2,981 2,967 7,135
Life & Pensions 6,524 7,193 7,815
Non-Life 12,844 13,673 24,315
Corporate Center 1,029 941 1,278
Total 60,532 60,477 78,457

Corporate Governance272
Information policy
Credit Suisse Group is committed to an open and fair information policy vis-à-vis itsshareholders as well as other stakeholders. Credit Suisse Group’s Investor RelationsDepartment and Media Relations Department are responsible for enquiries.
All shareholders registered in the Credit Suisse Group share register automaticallyreceive an invitation to the Group’s AGM including an order form to receive the fullAnnual Report of Credit Suisse Group and/or the Business Review. Each registeredshareholder will automatically receive a quarterly shareholders’ letter providing anoverview on the Group’s performance in a short and concise format. In addition, theGroup produces detailed Quarterly Reports on its financial performance.Shareholders can elect whether they would like to regularly receive the QuarterlyReports. All of these reports, the annual report on Form 20-F and other regularlyupdated information can be found on Credit Suisse Group’s website www.credit-suisse.com.

MAIN OFFICES
Main offices274
Main Offices
Credit Suisse GroupParadeplatz 8P.O. Box 18070 ZurichSwitzerlandTel. +41 44 212 1616Fax. +41 44 333 2587
Credit SuisseParadeplatz 8P.O. Box 28070 ZurichSwitzerlandTel. +41 44 334 4020Fax. +41 44 334 9010
Credit SuissePrivate BankingParadeplatz 8P.O. Box 5008070 Zurich SwitzerlandTel. +41 44 333 4444Fax. +41 44 334 9010
Credit SuisseCorporate & Retail BankingParadeplatz 8P.O. Box 1008070 ZurichSwitzerlandTel. +41 44 333 1111Fax. +41 44 332 5555
Winterthur GroupGeneral Guisan-Strasse 40P.O. Box 3578400 WinterthurSwitzerlandTel. +41 52 261 1111Fax. +41 52 213 6620

275Main offices
Credit Suisse First BostonUetlibergstrasse 231P.O. Box 9008070 ZurichSwitzerlandTel. +41 44 333 5555Fax. +41 44 333 5599
Credit Suisse First BostonEleven Madison AvenueNew York, NY 10010-3629USATel. +1 212 325 2000Fax. +1 212 325 6665
Credit Suisse First BostonOne Cabot SquareLondon E14 4QJUnited KingdomTel. +44 20 7888 8888Fax +44 20 7888 1600
Credit Suisse Asset ManagementGiesshübelstrasse 30P.O. Box 8008070 ZurichSwitzerlandTel. +41 44 335 1111Fax. +41 44 333 2225
Credit Suisse Asset Management466 Lexington Ave.New York, NY 10017USATel. +1 212 875 3500Fax +1 646 658 0728
Credit Suisse Asset ManagementBeaufort House15 St. Botolph StreetLondon EC3A 7JJUnited KingdomTel. +44 20 7426 2626Fax. +44 20 7426 2828

276
Impressum
Design: Claus Koch Corporate Communications, DüsseldorfPhotography: Beat Streuli, Zurich and DüsseldorfPhotography Executive Board: Claudia Kempf, WuppertalProduction: Management Digital Data AG, ZurichPrinter: NZZ Fretz AG, Zurich
Credit Suisse Group’s Annual Report 2004 is printed on totally chlorine-free (TCF)paper and is fully recyclable.
Enquiries
Credit Suisse GroupInvestor RelationsMarc Buchheister, Manuela LuzioTel. +41 44 333 3169/+41 44 332 6098Fax +41 44 333 2587
Credit Suisse GroupMedia RelationsCharles Naylor, Andres LutherTel. +41 44 333 8844Fax +41 44 333 8877

Cautionary statement regarding forward-looking information This Annual Report contains statements that constitute forward-looking statementswithin the meaning of the Private Securities Litigation Reform Act. In addition, in thefuture we, and others on our behalf, may make statements that constitute forward-looking statements. Such forward-looking statements may include, without limitation,statements relating to the following:– Our plans, objectives or goals; – Our future economic performance or prospects; – The potential effect on our future performance of certain contingencies; and – Assumptions underlying any such statements.
Words such as “believes,” “anticipates,” “expects,” “intends” and “plans” and similarexpressions are intended to identify forward-looking statements but are not the exclu-sive means of identifying such statements. We do not intend to update these forward-looking statements except as may be required by applicable securities laws.
By their very nature, forward-looking statements involve inherent risks and uncertain-ties, both general and specific, and risks exist that predictions, forecasts, projectionsand other outcomes described or implied in forward-looking statements will not beachieved. We caution you that a number of important factors could cause results todiffer materially from the plans, objectives, expectations, estimates and intentionsexpressed in such forward-looking statements. These factors include: – Market and interest rate fluctuations; – The strength of the global economy in general and the strength of the economies
of the countries in which we conduct our operations in particular; – The ability of counterparties to meet their obligations to us; – The effects of, and changes in, fiscal, monetary, trade and tax policies, and
currency fluctuations; – Political and social developments, including war, civil unrest or terrorist activity; – The possibility of foreign exchange controls, expropriation, nationalization or
confiscation of assets in countries in which we conduct our operations; – The ability to maintain sufficient liquidity and access capital markets; – Operational factors such as systems failure, human error, or the failure properly to
implement procedures; – Actions taken by regulators with respect to our business and practices in one or
more of the countries in which we conduct our operations; – The effects of changes in laws, regulations or accounting policies or practices; – Competition in geographic and business areas in which we conduct our operations; – The ability to retain and recruit qualified personnel; – The ability to maintain our reputation and promote our brands; – The ability to increase market share and control expenses; – Technological changes; – The timely development and acceptance of our new products and services and the
perceived overall value of these products and services by users; – Acquisitions, including the ability to integrate successfully acquired businesses; – The adverse resolution of litigation and other contingencies; and – Our success at managing the risks involved in the foregoing.
We caution you that the foregoing list of important factors is not exclusive. When eval-uating forward-looking statements, you should carefully consider the foregoing factorsand other uncertainties and events, as well as the information set forth in our Form20-F Item 3 - Key Information - Risk factors.

Credit Suisse GroupParadeplatz 8P.O. Box 18070 ZurichSwitzerlandTel. +41 44 212 16 16Fax +41 44 333 25 87www.credit-suisse.com
5520014English
![[Lehman Brothers] Structured Credit Strategy - Annual 2004](https://static.documents.pub/doc/80x56/5533a0f15503464f7d8b4973/lehman-brothers-structured-credit-strategy-annual-2004.jpg)


