22
LETTER TO SHAREHOLDERS 1999 INTERIM RESULTS
| Date post: | 12-Apr-2017 |
| Category: |
Economy & Finance |
| Upload: | quarterlyearningsreports2 |
| View: | 358 times |
| Download: | 4 times |

LETTER TO SHAREHOLDERS1999 INTERIM RESULTS
ChangeShare data 30 June 1999 31 Dec. 1998 in %
Number of shares issued 272,101,488 269,086,369 1
Shares ranking for dividend 272,101,488 269,086,369 1
Market capitalisation (CHF m) 73,195 57,854 27
Share price (CHF) (at 3 Sept. 1999: 294) 269 215 25
high January – June 1999 310
low January – June 1999 211.8
Change1sthalf 1999 1st half 1998 in %
Earnings per share (CHF) 9.85 9.02 9
Average shares ranking for dividend 270,490,439 266,340,880 2
Financial calendar
Announcement of 1999 results Tuesday, 14 March 2000
2000 Annual General Meeting Friday, 26 May 2000
Contents
Commentary on the consolidated results 4
Consolidated income statement 8
Consolidated balance sheet 9
Consolidated off-balance-sheet business, selected notes to the consolidated financial statements 10
Credit Suisse 12
Credit Suisse Private Banking 14
Credit Suisse First Boston 16
Credit Suisse Asset Management 19
Winterthur 20
Closing 22
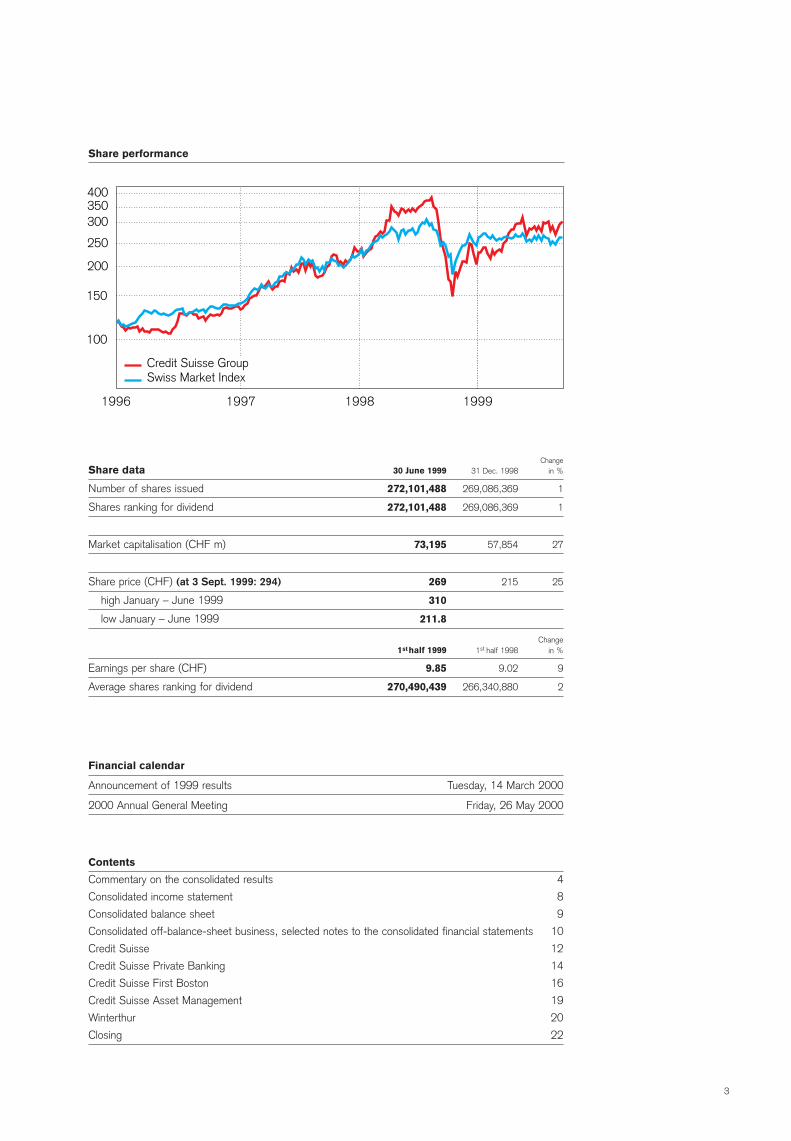
Share performance
400350300
250
200
150
100
1996 1997 1998 1999
Credit Suisse GroupSwiss Market Index
3
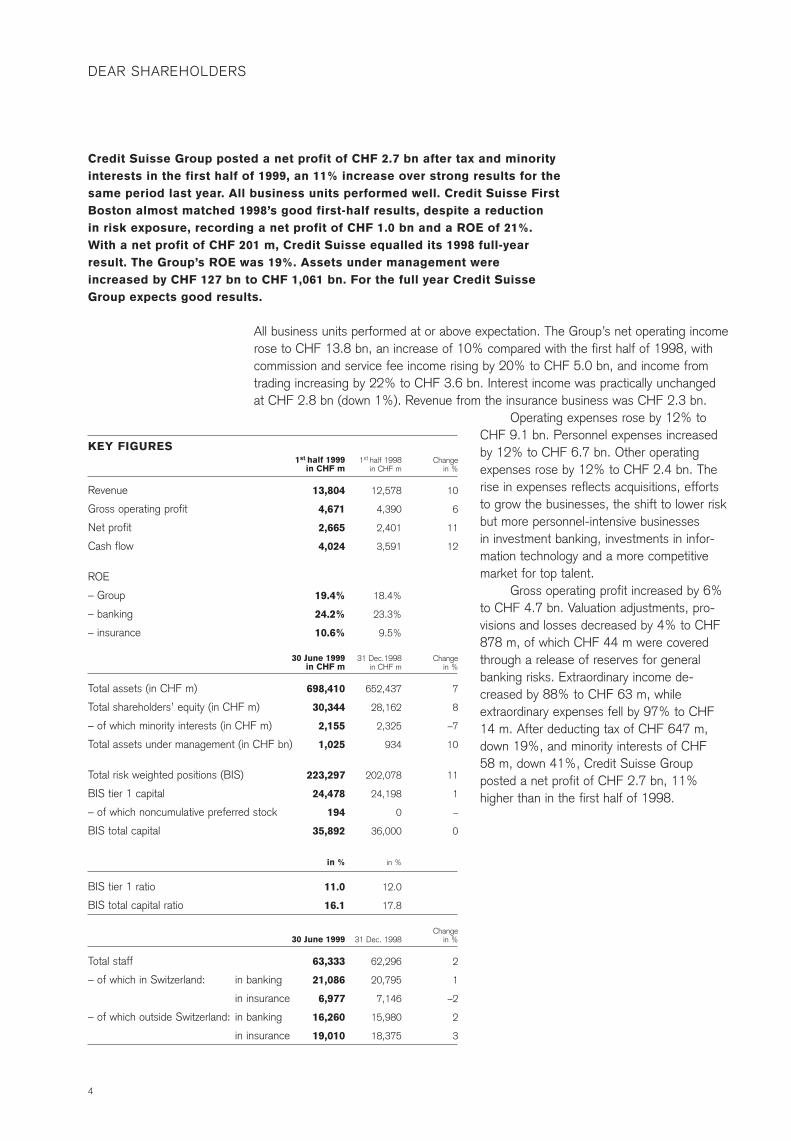
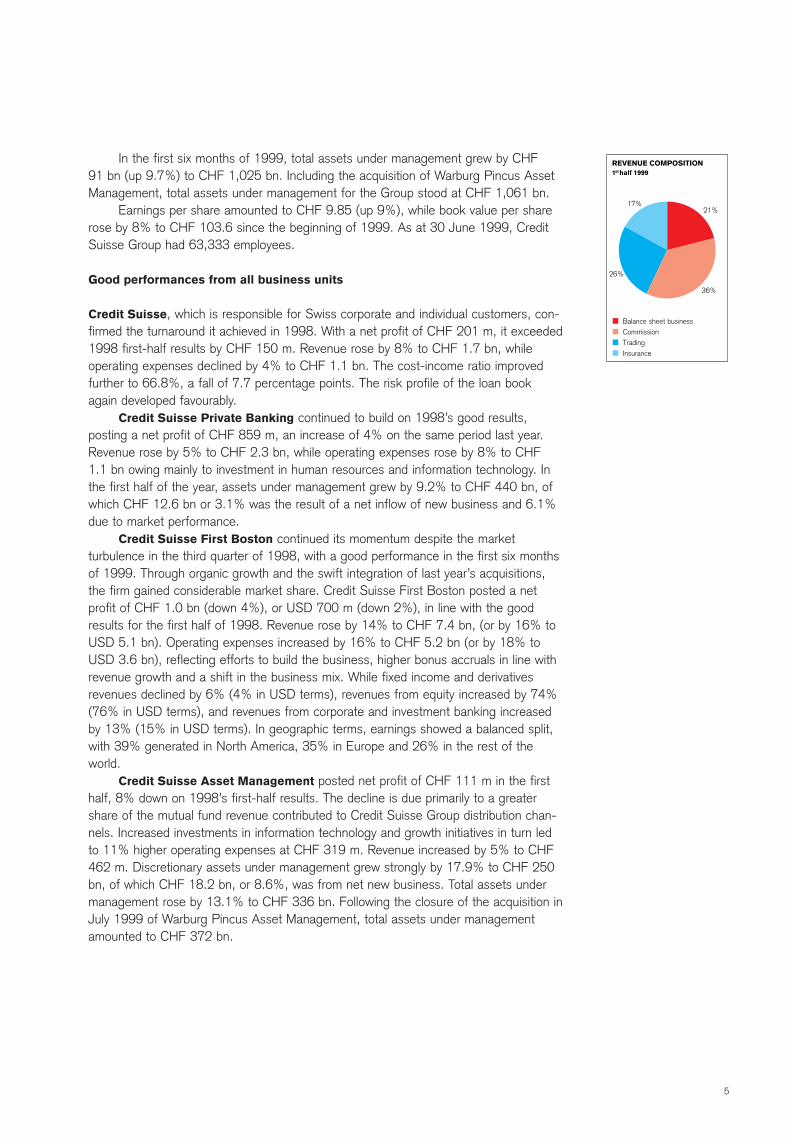
All business units performed at or above expectation. The Group’s net operating incomerose to CHF 13.8 bn, an increase of 10% compared with the first half of 1998, withcommission and service fee income rising by 20% to CHF 5.0 bn, and income fromtrading increasing by 22% to CHF 3.6 bn. Interest income was practically unchangedat CHF 2.8 bn (down 1%). Revenue from the insurance business was CHF 2.3 bn.
Operating expenses rose by 12% toCHF 9.1 bn. Personnel expenses increasedby 12% to CHF 6.7 bn. Other operatingexpenses rose by 12% to CHF 2.4 bn. Therise in expenses reflects acquisitions, effortsto grow the businesses, the shift to lower riskbut more personnel-intensive businesses in investment banking, investments in infor-mation technology and a more competitivemarket for top talent.
Gross operating profit increased by 6%to CHF 4.7 bn. Valuation adjustments, pro-visions and losses decreased by 4% to CHF878 m, of which CHF 44 m were coveredthrough a release of reserves for generalbanking risks. Extraordinary income de-creased by 88% to CHF 63 m, while extraordinary expenses fell by 97% to CHF14 m. After deducting tax of CHF 647 m,down 19%, and minority interests of CHF 58 m, down 41%, Credit Suisse Group posted a net profit of CHF 2.7 bn, 11%higher than in the first half of 1998.
DEAR SHAREHOLDERS
Changein %
10
6
11
12
Changein %
7
8
–7
10
11
1
–
0
Changein %
2
1
–2
2
3
1st half 1999in CHF m
13,804
4,671
2,665
4,024
19.4%
24.2%
10.6%
30 June 1999in CHF m
698,410
30,344
2,155
1,025
223,297
24,478
194
35,892
in %
11.0
16.1
30 June 1999
63,333
21,086
6,977
16,260
19,010
1st half 1998in CHF m
12,578
4,390
2,401
3,591
18.4%
23.3%
9.5%
31 Dec.1998in CHF m
652,437
28,162
2,325
934
202,078
24,198
0
36,000
in %
12.0
17.8
31 Dec. 1998
62,296
20,795
7,146
15,980
18,375
KEY FIGURES
Revenue
Gross operating profit
Net profit
Cash flow
ROE
– Group
– banking
– insurance
Total assets (in CHF m)
Total shareholders’ equity (in CHF m)
– of which minority interests (in CHF m)
Total assets under management (in CHF bn)
Total risk weighted positions (BIS)
BIS tier 1 capital
– of which noncumulative preferred stock
BIS total capital
BIS tier 1 ratio
BIS total capital ratio
Total staff
– of which in Switzerland: in banking
in insurance
– of which outside Switzerland: in banking
in insurance
Credit Suisse Group posted a net profit of CHF 2.7 bn after tax and minorityinterests in the first half of 1999, an 11% increase over strong results for thesame period last year. All business units performed well. Credit Suisse FirstBoston almost matched 1998’s good first-half results, despite a reduction in risk exposure, recording a net profit of CHF 1.0 bn and a ROE of 21%. With a net profit of CHF 201 m, Credit Suisse equalled its 1998 full-yearresult. The Group’s ROE was 19%. Assets under management wereincreased by CHF 127 bn to CHF 1,061 bn. For the full year Credit SuisseGroup expects good results.
4
In the first six months of 1999, total assets under management grew by CHF 91 bn (up 9.7%) to CHF 1,025 bn. Including the acquisition of Warburg Pincus AssetManagement, total assets under management for the Group stood at CHF 1,061 bn.
Earnings per share amounted to CHF 9.85 (up 9%), while book value per sharerose by 8% to CHF 103.6 since the beginning of 1999. As at 30 June 1999, CreditSuisse Group had 63,333 employees.
Good performances from all business units
Credit Suisse, which is responsible for Swiss corporate and individual customers, con-firmed the turnaround it achieved in 1998. With a net profit of CHF 201 m, it exceeded1998 first-half results by CHF 150 m. Revenue rose by 8% to CHF 1.7 bn, whileoperating expenses declined by 4% to CHF 1.1 bn. The cost-income ratio improvedfurther to 66.8%, a fall of 7.7 percentage points. The risk profile of the loan bookagain developed favourably.
Credit Suisse Private Banking continued to build on 1998’s good results, posting a net profit of CHF 859 m, an increase of 4% on the same period last year.Revenue rose by 5% to CHF 2.3 bn, while operating expenses rose by 8% to CHF 1.1 bn owing mainly to investment in human resources and information technology. Inthe first half of the year, assets under management grew by 9.2% to CHF 440 bn, ofwhich CHF 12.6 bn or 3.1% was the result of a net inflow of new business and 6.1%due to market performance.
Credit Suisse First Boston continued its momentum despite the market turbulence in the third quarter of 1998, with a good performance in the first six monthsof 1999. Through organic growth and the swift integration of last year’s acquisitions,the firm gained considerable market share. Credit Suisse First Boston posted a netprofit of CHF 1.0 bn (down 4%), or USD 700 m (down 2%), in line with the goodresults for the first half of 1998. Revenue rose by 14% to CHF 7.4 bn, (or by 16% toUSD 5.1 bn). Operating expenses increased by 16% to CHF 5.2 bn (or by 18% toUSD 3.6 bn), reflecting efforts to build the business, higher bonus accruals in line with revenue growth and a shift in the business mix. While fixed income and derivatives revenues declined by 6% (4% in USD terms), revenues from equity increased by 74%(76% in USD terms), and revenues from corporate and investment banking increasedby 13% (15% in USD terms). In geographic terms, earnings showed a balanced split,with 39% generated in North America, 35% in Europe and 26% in the rest of theworld.
Credit Suisse Asset Management posted net profit of CHF 111 m in the firsthalf, 8% down on 1998’s first-half results. The decline is due primarily to a greatershare of the mutual fund revenue contributed to Credit Suisse Group distribution chan-nels. Increased investments in information technology and growth initiatives in turn ledto 11% higher operating expenses at CHF 319 m. Revenue increased by 5% to CHF462 m. Discretionary assets under management grew strongly by 17.9% to CHF 250bn, of which CHF 18.2 bn, or 8.6%, was from net new business. Total assets undermanagement rose by 13.1% to CHF 336 bn. Following the closure of the acquisition inJuly 1999 of Warburg Pincus Asset Management, total assets under managementamounted to CHF 372 bn.
26%
21%
36%
17%
REVENUE COMPOSITION 1 half 1999
Balance sheet businessCommissionTrading
Insurance
st
5
6
Winterthur achieved a net profit of CHF 503 m, up 19%, benefiting from a lower effective tax rate and good operating results, up 1% to CHF 690 m, in spite ofsevere weather losses, lower investment income as a result of lower realised capitalgains, and the absence of profits from the divested reinsurance business. Gross premiums declined, as expected, by 3% to CHF 16.2 bn in the first half of 1999. Given the extraordinary tax-driven surge of Swiss life premiums in the first quarter of1998 (life premiums were up 39% in the first six months of 1998), the 7% decline to CHF 8.5 bn in life premiums for the first half still represents a strong 1999 perform-ance. As a better indication of core growth, the compounded annual growth rate for the half years 1997–1999 was 14%. Non-life business grew 2% to CHF 7.7 bn in thefirst half of 1999. Lower expenses in non-life operations reduced the combined ratiofrom 110.1% to 109.6%. Assets under management rose by 7% to CHF 119.2 bn.
Adjustments in risk management and compliance
Following the turmoil in international financial markets in 1998, Credit Suisse Groupreviewed its risk exposure, particularly at Credit Suisse First Boston, with the objectiveof reducing risk concentrations and earnings volatility. With respect to market risk, mea-surement methodologies have been harmonised and total adjusted exposure reducedsince the beginning of the year. At Credit Suisse First Boston, average allocated capitalis down from 1998 to the first half of 1999 and the balance sheet is down by 5% inUSD terms from the end of 1998. A more significant system of monitoring and manag-ing country risk exposure has been introduced. In addition, limits and relevant expo-sures have been cut back significantly. With respect to the recently restructured US realestate business, risk concentration has been reduced as a precautionary measure andprovisions increased.
The emphasis at Credit Suisse First Boston is on continuing to grow the client-driven businesses involving less capital and risk. On a Group level, the contribution tonet profit from the less volatile asset accumulation and asset management businesses(including insurance) increased from 58% for the first half of 1998 to 62% for the firsthalf of 1999.
The examination of Credit Suisse Group’s entities in Japan by the FinancialSupervisory Agency of Japan (FSA) led among other things to the revocation of the licence of the Tokyo branch of Credit Suisse Financial Products. Following the completion of the FSA’s examination, Credit Suisse Group initiated structural andorganisational adjustments as well as remedial measures to strengthen its compliance.
CreditSuisseGroup
13,804
6,723
2,410
9,133
4,671
472
878
3,321
63
14
647
2,723
58
2,665
Adjustmentsincluding
CorporateCentre
–202
248
–280
–32
–170
158
39
–367
35
–6
–303
–23
0
–23
CreditSuisseAsset
Management
462
184
135
319
143
5
0
138
0
5
22
111
0
111
241
n/a
294
0
WinterthurLife
774
255
164
419
355
23
0
332
WinterthurNon-life
1,415
633
399
1,032
383
25
0
358
CreditSuisse
1,685
680
424
1,104
581
21
303
257
19
5
69
202
1
201
4,409
9.2
4,389
–12
CreditSuisse
FirstBoston
7,420
4,010
1,200
5,210
2,210
219
497
1,494
0
0
478
1,016
2
1,014
9,910
20.5
10,555
58
CreditSuissePrivate
Banking
2,250
713
368
1,081
1,169
21
39
1,109
9
7
243
868
9
859
2,689
n/a
2,753
–9
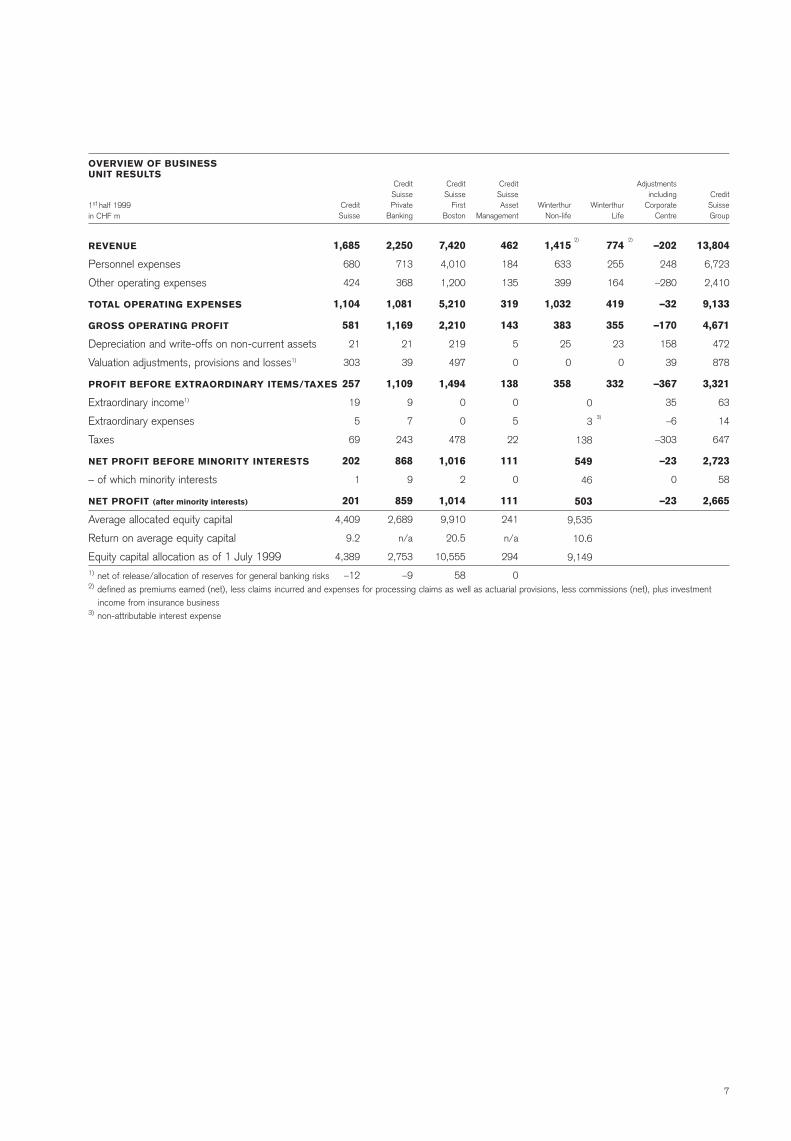
OVERVIEW OF BUSINESSUNIT RESULTS
1st half 1999in CHF m
REVENUE
Personnel expenses
Other operating expenses
TOTAL OPERATING EXPENSES
GROSS OPERATING PROFIT
Depreciation and write-offs on non-current assets
Valuation adjustments, provisions and losses1)
PROFIT BEFORE EXTRAORDINARY ITEMS/TAXES
Extraordinary income1)
Extraordinary expenses
Taxes
NET PROFIT BEFORE MINORITY INTERESTS
– of which minority interests
NET PROFIT (after minority interests)
Average allocated equity capital
Return on average equity capital
Equity capital allocation as of 1 July 19991) net of release/allocation of reserves for general banking risks2) defined as premiums earned (net), less claims incurred and expenses for processing claims as well as actuarial provisions, less commissions (net), plus investment
income from insurance business3) non-attributable interest expense
2) 2)
3)
0
3
138
549
46
503
9,535
10.6
9,149
7
Changein %
–25
–25
21
–31
–1
37
19
11
22
20
22
–13
–12
–19
–7
–5
18
–23
–59
–
80
51
81
–46
10
12
12
12
6
64
–
–4
13
4
–88
–97
–19
9
–41
11
Changein CHF m
–2,631
–757
42
–3,305
–41
77
764
20
43
818
664
–1,938
–1,878
–237
–286
–109
37
–20
–42
22
8
135
266
–106
1,226
695
250
945
281
185
39
–34
151
130
–479
–421
–152
224
–40
264
1st half 1998in CHF m
10,398
2,973
198
10,711
2,858
209
3,977
174
195
4,165
2,954
15,463
15,943
1,256
4,105
2,369
201
87
71
16
10
263
329
232
12,578
6,028
2,160
8,188
4,390
287
1
912
1,199
3,191
542
435
799
2,499
98
2,401
1st half 1999in CHF m
7,767
2 216
240
7,406
2,817
286
4,741
194
238
4,983
3,618
13,525
14,065
1,019
3,819
2,260
238
67
29
38
18
398
595
126
13,804
6,723
2,410
9,133
4,671
472
40
878
1,350
3,321
63
14
647
2,723
58
2,665
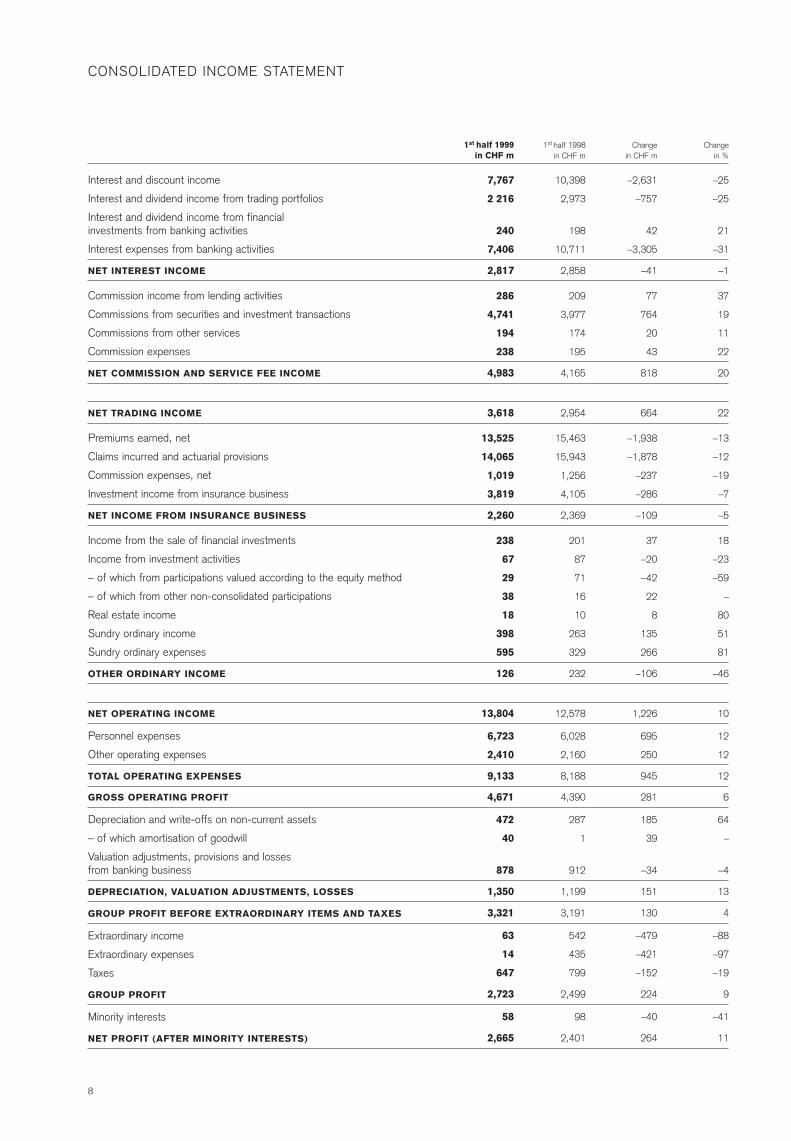
Interest and discount income
Interest and dividend income from trading portfolios
Interest and dividend income from financial investments from banking activities
Interest expenses from banking activities
NET INTEREST INCOME
Commission income from lending activities
Commissions from securities and investment transactions
Commissions from other services
Commission expenses
NET COMMISSION AND SERVICE FEE INCOME
NET TRADING INCOME
Premiums earned, net
Claims incurred and actuarial provisions
Commission expenses, net
Investment income from insurance business
NET INCOME FROM INSURANCE BUSINESS
Income from the sale of financial investments
Income from investment activities
– of which from participations valued according to the equity method
– of which from other non-consolidated participations
Real estate income
Sundry ordinary income
Sundry ordinary expenses
OTHER ORDINARY INCOME
NET OPERATING INCOME
Personnel expenses
Other operating expenses
TOTAL OPERATING EXPENSES
GROSS OPERATING PROFIT
Depreciation and write-offs on non-current assets
– of which amortisation of goodwill
Valuation adjustments, provisions and losses from banking business
DEPRECIATION, VALUATION ADJUSTMENTS, LOSSES
GROUP PROFIT BEFORE EXTRAORDINARY ITEMS AND TAXES
Extraordinary income
Extraordinary expenses
Taxes
GROUP PROFIT
Minority interests
NET PROFIT (AFTER MINORITY INTERESTS)
CONSOLIDATED INCOME STATEMENT
8
30 June 1999in CHF m
2,387
29,974
149,967
7,277
117,069
86,369
112,459
18,012
109,775
1,741
6,649
1,519
10,391
44,821
698,410
2,406
726
31 Dec.1998in CHF m
2,313
26,594
140,152
7,482
103,183
80,558
102,515
17,467
102,316
1,331
6,362
802
9,628
51,734
652,437
3,048
227
Changein CHF m
74
3,380
9,815
–205
13,886
5,811
9,944
545
7,459
410
287
717
763
–6,913
45,973
–642
499
Changein %
3
13
7
–3
13
7
10
3
7
31
5
89
8
–13
7
–21
–
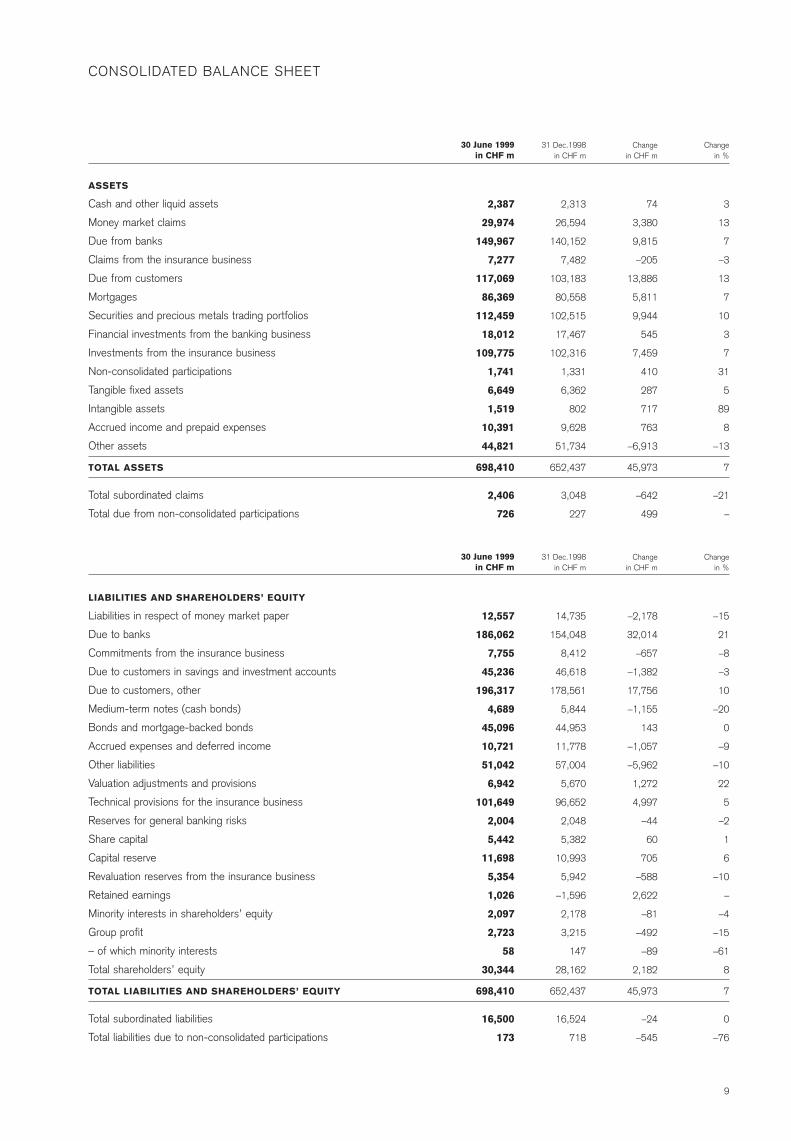
ASSETS
Cash and other liquid assets
Money market claims
Due from banks
Claims from the insurance business
Due from customers
Mortgages
Securities and precious metals trading portfolios
Financial investments from the banking business
Investments from the insurance business
Non-consolidated participations
Tangible fixed assets
Intangible assets
Accrued income and prepaid expenses
Other assets
TOTAL ASSETS
Total subordinated claims
Total due from non-consolidated participations
30 June 1999in CHF m
12,557
186,062
7,755
45,236
196,317
4,689
45,096
10,721
51,042
6,942
101,649
2,004
5,442
11,698
5,354
1,026
2,097
2,723
58
30,344
698,410
16,500
173
31 Dec.1998in CHF m
14,735
154,048
8,412
46,618
178,561
5,844
44,953
11,778
57,004
5,670
96,652
2,048
5,382
10,993
5,942
–1,596
2,178
3,215
147
28,162
652,437
16,524
718
Changein CHF m
–2,178
32,014
–657
–1,382
17,756
–1,155
143
–1,057
–5,962
1,272
4,997
–44
60
705
–588
2,622
–81
–492
–89
2,182
45,973
–24
–545
Changein %
–15
21
–8
–3
10
–20
0
–9
–10
22
5
–2
1
6
–10
–
–4
–15
–61
8
7
0
–76
LIABILITIES AND SHAREHOLDERS’ EQUITY
Liabilities in respect of money market paper
Due to banks
Commitments from the insurance business
Due to customers in savings and investment accounts
Due to customers, other
Medium-term notes (cash bonds)
Bonds and mortgage-backed bonds
Accrued expenses and deferred income
Other liabilities
Valuation adjustments and provisions
Technical provisions for the insurance business
Reserves for general banking risks
Share capital
Capital reserve
Revaluation reserves from the insurance business
Retained earnings
Minority interests in shareholders’ equity
Group profit
– of which minority interests
Total shareholders’ equity
TOTAL LIABILITIES AND SHAREHOLDERS’ EQUITY
Total subordinated liabilities
Total liabilities due to non-consolidated participations
CONSOLIDATED BALANCE SHEET
9
Changein %
0
2
25
–2
3
16
0
–10
9
Changein CHF m
–35
96
565
–86
540
13,184
0
–27
3,337
31 Dec. 1998in CHF m
8,870
4,471
2,225
3,710
19,276
84,775
59
262
35,216
30 June 1999in CHF m
8,835
4,567
2,790
3,624
19,816
97,959
59
235
38,553
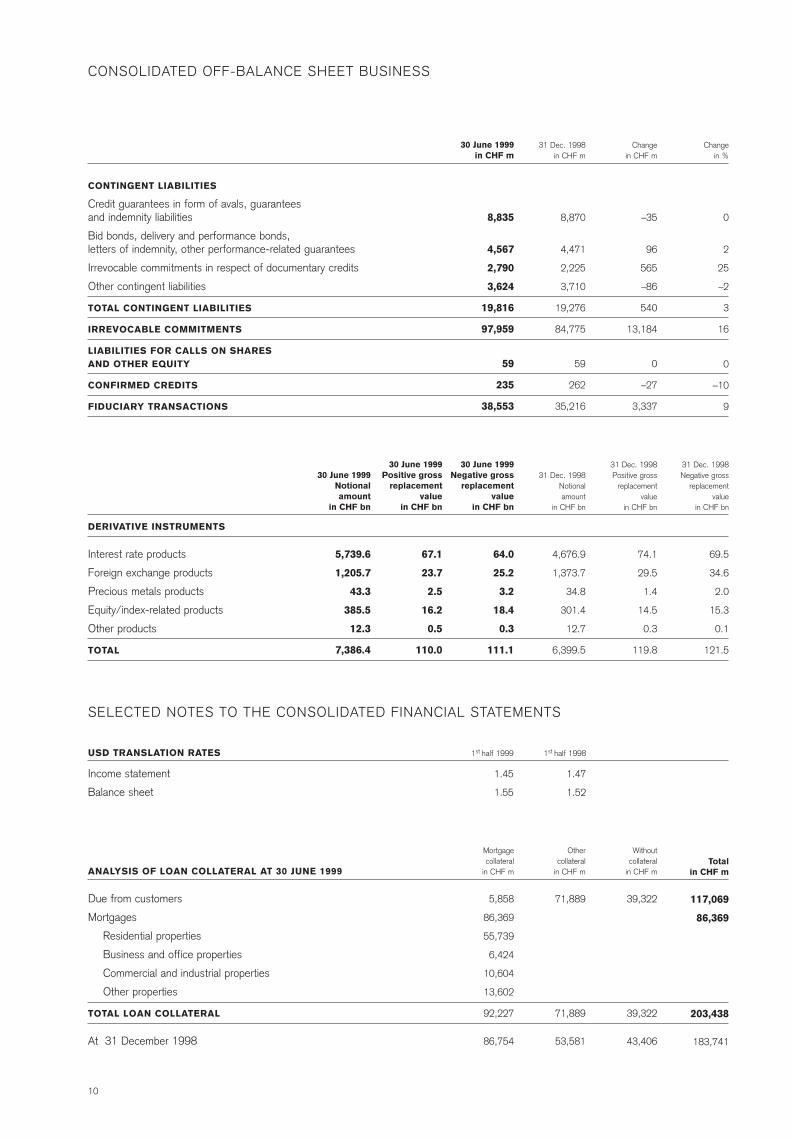
CONTINGENT LIABILITIES
Credit guarantees in form of avals, guarantees and indemnity liabilities
Bid bonds, delivery and performance bonds, letters of indemnity, other performance-related guarantees
Irrevocable commitments in respect of documentary credits
Other contingent liabilities
TOTAL CONTINGENT LIABILITIES
IRREVOCABLE COMMITMENTS
LIABILITIES FOR CALLS ON SHARES AND OTHER EQUITY
CONFIRMED CREDITS
FIDUCIARY TRANSACTIONS
CONSOLIDATED OFF-BALANCE SHEET BUSINESS
31 Dec. 1998Negative gross
replacementvalue
in CHF bn
69.5
34.6
2.0
15.3
0.1
121.5
31 Dec. 1998Positive gross
replacementvalue
in CHF bn
74.1
29.5
1.4
14.5
0.3
119.8
31 Dec. 1998Notionalamount
in CHF bn
4,676.9
1,373.7
34.8
301.4
12.7
6,399.5
30 June 1999Negative gross
replacementvalue
in CHF bn
64.0
25.2
3.2
18.4
0.3
111.1
30 June 1999Positive gross
replacementvalue
in CHF bn
67.1
23.7
2.5
16.2
0.5
110.0
30 June 1999Notionalamount
in CHF bn
5,739.6
1,205.7
43.3
385.5
12.3
7,386.4
Mortgagecollateral
in CHF m
5,858
86,369
55,739
6,424
10,604
13,602
92,227
86,754
Othercollateral
in CHF m
71,889
71,889
53,581
Without collateral
in CHF m
39,322
39,322
43,406
Totalin CHF m
117,069
86,369
203,438
183,741
DERIVATIVE INSTRUMENTS
Interest rate products
Foreign exchange products
Precious metals products
Equity/index-related products
Other products
TOTAL
ANALYSIS OF LOAN COLLATERAL AT 30 JUNE 1999
Due from customers
Mortgages
Residential properties
Business and office properties
Commercial and industrial properties
Other properties
TOTAL LOAN COLLATERAL
At 31 December 1998
SELECTED NOTES TO THE CONSOLIDATED FINANCIAL STATEMENTS
USD TRANSLATION RATES 1st half 1999 1st half 1998
Income statement 1.45 1.47
Balance sheet 1.55 1.52
10

SELECTED NOTES TO THE CONSOLIDATED FINANCIAL STATEMENTS
1st half 1998in CHF m
2,858
4,165
2,954
2,369
232
12,578
6,028
2,160
8,188
4,390
287
912
1,199
3,191
542
435
799
2,499
98
2,401
1st half 1999in CHF m
2,817
4,983
3,618
2,260
126
13,804
6,723
2,410
9,133
4,671
472
878
1,350
3,321
63
14
647
2,723
58
2,665
1st half 1998in CHF m
0
0
0
2,369
–188
2,181
920
576
1,496
685
0
0
0
685
0
14
211
460
37
423
1st half 1999in CHF m
0
0
0
2,260
–73
2,187
888
560
1,448
739
48
0
48
691
0
0
138
553
46
507
1st half 1998in CHF m
2,858
4,165
2,954
0
420
10,397
5,108
1,584
6,692
3,705
287
912
1,199
2,506
542
421
588
2,039
61
1,978
1st half 1999in CHF m
2,817
4,983
3,618
0
199
11,617
5,835
1,850
7,685
3,932
424
878
1,302
2,630
63
14
509
2,170
12
2,158
Banking business Insurance business TotalSPLIT OF INCOME STATEMENT INTO BANKINGAND INSURANCE BUSINESS
Net interest income
Net commission and service income
Net trading income
Net income from insurance business
Other ordinary income/expenses net
NET OPERATING INCOME
Personnel expenses
Other operating expenses
Total operating expenses
GROSS OPERATING PROFIT
Depreciation and write-offs on non-current assets
Valuation adjustments, provisions and losses
Total depreciation, valuation adjustments
GROUP PROFIT BEFORE EXTRAORDINARYITEMS AND TAXES
Extraordinary income
Extraordinary expenses
Taxes
GROUP PROFIT
Minority interests
NET PROFIT (AFTER MINORITY INTERESTS)
30 June 1999in CHF m
76,928
44,608
32,320
201
34,112
3,591
1,419
112,459
44,997
31 Dec. 1998in CHF m
68,830
41,138
27,692
333
31,886
2,344
1,799
102,515
28,186
Changein CHF m
8,098
3,470
4,628
–132
2,226
1,247
–380
9,944
16,811
Changein %
12
8
17
–40
7
53
–21
10
60
SECURITIES AND PRECIOUS METALS TRADING PORTFOLIOS
Interest bearing securities and rights
listed on stock exchange
unlisted
– of which own bonds and medium-term notes
Equities
– of which own shares
Precious metals
TOTAL SECURITIES AND PRECIOUS METALS TRADING PORTFOLIOS
– of which securities rediscountable or pledgeable at central banks
11
CORPORATE AND INDIVIDUAL CUSTOMERS IN SWITZERLAND
Credit Suisse enjoyed a successful first half. Revenues rose while costs fell, resulting ina further improvement in efficiency. New products were well received by the market. In only nine months since its launch, the MIX mortgage generated a volume of CHF2.7 bn, adding to the overall growth in mortgage business. Credit Suisse again set abenchmark for direct banking in Switzerland. Youtrade, which was launched on 12 April1999, was developed in the space of only four months in collaboration with CreditSuisse Private Banking. It offers investors the chance to trade – directly, rapidly andsecurely – on the stock exchange around the clock via the Internet or by phone onattractive terms and conditions. The exclusive offer of all three major credit cards(American Express, Eurocard, Visa) in Switzerland enabled Credit Suisse to significantlyexpand its credit card business. Approximately 50,000 new cards were sold.
In individual customer business, efforts to expand bancassurance are movingahead successfully. Earnings from client referrals between Winterthur and Credit Suissecontinued to increase aided by the trend towards greater securities saving, includingpension provision. Investment fund sales rose markedly and, at 17.5%, fund holdingsat Credit Suisse again expanded more strongly than the market as a whole. The newinterest-bearing euro account for private individuals exceeded expectations, with around80% of these new accounts showing an average balance of over 15,000 euros.
Earnings on corporate customer business improved due to the acquisition ofnew customers and more intensive productusage. Lendings to small and medium-sizedenterprises increased slightly and the overallrisk profile of the credit portfolio improved.The favourable economic outlook is encour-aging business and industry to plan moreinvestment, boosting the lending business.
Direct banking (telephone and Internettransactions around the clock) continued togrow rapidly. Since the end of 1998, thenumber of customers with online bankingcontracts has again risen substantially, toaround 142,000. In the first six months of1999, 6.5 million transactions wereprocessed via the Internet – as many as forthe whole of last year. Youtrade has attractedmore than 5,500 customers, of which halfare new clients. Direct Net and youtrade nowaccount for around 20% of securities tradesat Credit Suisse.
In the first half of 1999 Credit Suisse achieved a net profit of CHF 201 m,an increase of 294%, or CHF 150 m, on the previous year’s figure. ROEgrew from 2.4% to 9.2%. Total revenue rose by 8% to CHF 1,685 m, whileoperating expenses fell by 4%. As a result, the cost/income ratio againimproved substantially – from 74.5% to 66.8%.
1st half 1998in CHF m
1,031
400
111
18
1,560
733
412
1,145
415
17
0
333
65
24
22
16
51
0
51
–14
Changein %
7
15
–4
–17
8
–7
3
–4
40
24
–
–9
295
–21
–77
331
296
–
294
1st half 1999in CHF m
1,105
458
107
15
1,685
680
424
1,104
581
21
6
303
257
19
5
69
202
1
201
–12
INCOME STATEMENT
Net interest income
Net commission and service fee income
Net trading income
Other ordinary income
REVENUE
Personnel expenses
Other operating expenses
TOTAL OPERATING EXPENSES
GROSS OPERATING PROFIT
Depreciation and write-offs on non-current assets
– of which amortisation of goodwill
Valuation adjustments, provisions and losses*
PROFIT BEFORE EXTRAORDINARY ITEMS AND TAXES
Extraordinary income
Extraordinary expenses
Taxes
NET PROFIT
– of which minority interests
NET PROFIT (after minority interests)
* net of allocation of RGBR (reserves for general banking risks)
12
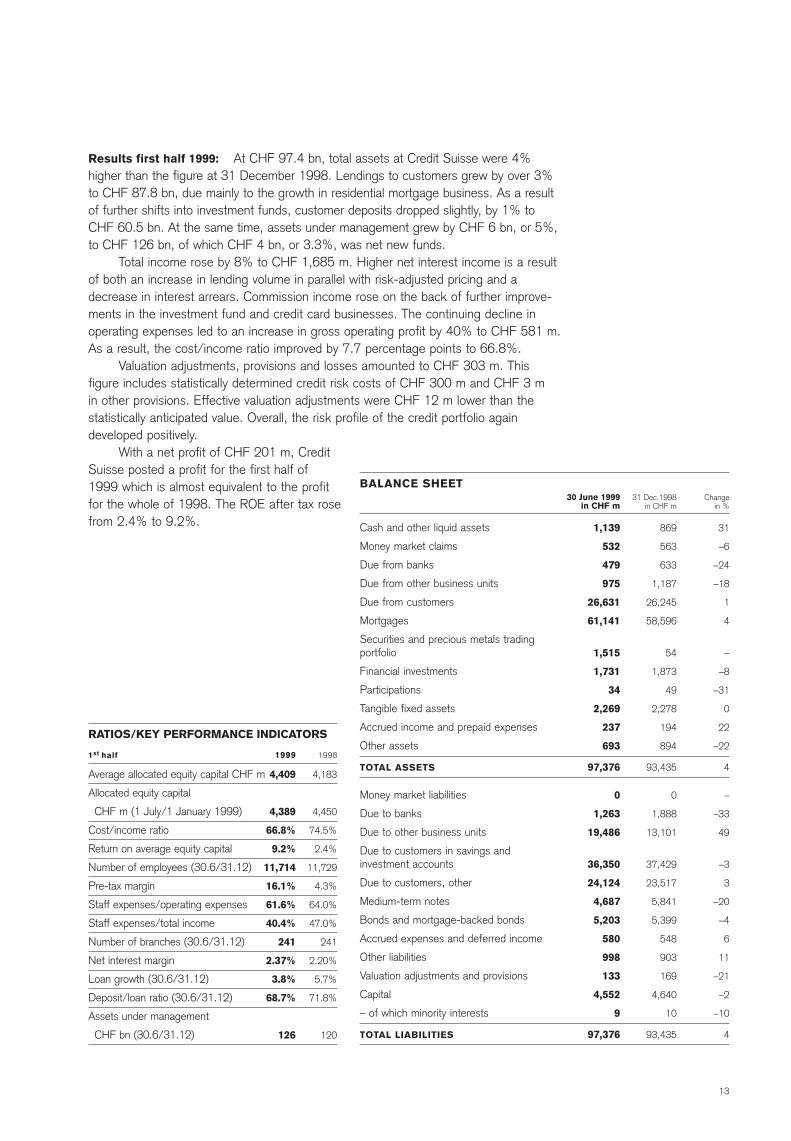
Results first half 1999: At CHF 97.4 bn, total assets at Credit Suisse were 4% higher than the figure at 31 December 1998. Lendings to customers grew by over 3%to CHF 87.8 bn, due mainly to the growth in residential mortgage business. As a resultof further shifts into investment funds, customer deposits dropped slightly, by 1% toCHF 60.5 bn. At the same time, assets under management grew by CHF 6 bn, or 5%,to CHF 126 bn, of which CHF 4 bn, or 3.3%, was net new funds.
Total income rose by 8% to CHF 1,685 m. Higher net interest income is a resultof both an increase in lending volume in parallel with risk-adjusted pricing and adecrease in interest arrears. Commission income rose on the back of further improve-ments in the investment fund and credit card businesses. The continuing decline in operating expenses led to an increase in gross operating profit by 40% to CHF 581 m.As a result, the cost/income ratio improved by 7.7 percentage points to 66.8%.
Valuation adjustments, provisions and losses amounted to CHF 303 m. This figure includes statistically determined credit risk costs of CHF 300 m and CHF 3 m in other provisions. Effective valuation adjustments were CHF 12 m lower than the statistically anticipated value. Overall, the risk profile of the credit portfolio again developed positively.
With a net profit of CHF 201 m, CreditSuisse posted a profit for the first half of1999 which is almost equivalent to the profitfor the whole of 1998. The ROE after tax rosefrom 2.4% to 9.2%.
BALANCE SHEET
Cash and other liquid assets
Money market claims
Due from banks
Due from other business units
Due from customers
Mortgages
Securities and precious metals tradingportfolio
Financial investments
Participations
Tangible fixed assets
Accrued income and prepaid expenses
Other assets
TOTAL ASSETS
Money market liabilities
Due to banks
Due to other business units
Due to customers in savings andinvestment accounts
Due to customers, other
Medium-term notes
Bonds and mortgage-backed bonds
Accrued expenses and deferred income
Other liabilities
Valuation adjustments and provisions
Capital
– of which minority interests
TOTAL LIABILITIES
RATIOS/KEY PERFORMANCE INDICATORS
1st half 1999 1998
Average allocated equity capital CHF m 4,409 4,183
Allocated equity capital
CHF m (1 July/1 January 1999) 4,389 4,450
Cost/income ratio 66.8% 74.5%
Return on average equity capital 9.2% 2.4%
Number of employees (30.6/31.12) 11,714 11,729
Pre-tax margin 16.1% 4.3%
Staff expenses/operating expenses 61.6% 64.0%
Staff expenses/total income 40.4% 47.0%
Number of branches (30.6/31.12) 241 241
Net interest margin 2.37% 2.20%
Loan growth (30.6/31.12) 3.8% 5.7%
Deposit/loan ratio (30.6/31.12) 68.7% 71.8%
Assets under management
CHF bn (30.6/31.12) 126 120
30 June 1999in CHF m
1,139
532
479
975
26,631
61,141
1,515
1,731
34
2,269
237
693
97,376
0
1,263
19,486
36,350
24,124
4,687
5,203
580
998
133
4,552
9
97,376
31 Dec.1998in CHF m
869
563
633
1,187
26,245
58,596
54
1,873
49
2,278
194
894
93,435
0
1,888
13,101
37,429
23,517
5,841
5,399
548
903
169
4,640
10
93,435
Changein %
31
–6
–24
–18
1
4
–
–8
–31
0
22
–22
4
–
–33
49
–3
3
–20
–4
6
11
–21
–2
–10
4
13
1st half 1998in CHF m
446
1,350
265
84
2,145
644
358
1,002
1,143
17
4
67
1,059
35
27
230
837
8
829
58
Changein %
–6
9
9
–20
5
11
3
8
2
24
0
–42
5
–74
–74
6
4
13
4
1st half 1999in CHF m
420
1,474
289
67
2,250
713
368
1,081
1,169
21
4
39
1,109
9
7
243
868
9
859
–9
INCOME STATEMENT
Net interest income
Net commission and service fee income
Net trading income
Other ordinary income
REVENUE
Personnel expenses
Other operating expenses
TOTAL OPERATING EXPENSES
GROSS OPERATING PROFIT
Depreciation and write-offs on non-current assets
– of which amortisation of goodwill
Valuation adjustments, provisions and losses*
PROFIT BEFORE EXTRAORDINARY ITEMSAND TAXES
Extraordinary income*
Extraordinary expenses
Taxes
NET PROFIT
– of which minority interests
NET PROFIT (after minority interests)
* net of release/allocation of RGBR (reserves for general banking risks)
With the launch of FundLab, an interactive investment fund database freely accessibleon the Internet, Credit Suisse Private Banking has become one of the most innovativeproviders of mutual funds worldwide. Valuations of the Group’s own funds as well asthird party funds are published on the Internet, and at the same time mutual fundsproducts are actively marketed. This has led to a 29% increase in mutual fund sales inthe first half of 1999.
Credit Suisse Private Banking’s philosophy of offering its clients innovative prod-ucts has been underlined by the development of FundLab and youtrade. Credit SuissePrivate Banking clients have the opportunity to register as members of the Internet-based Investors’ Circle, providing online access to research information on markets andcompanies. A significant quality push has been achieved with the setting up of anextranet for independent asset managers, enabling them to access information tounderpin their advisory and sales endeavours. Credit Suisse Private Banking will continueworking to exploit the far reaching possibilities of Internet technology in response torapidly changing client requirements.
In a market environment with unclear trends – weak euro, weak bond marketsand no direction to European equity markets – Credit Suisse Private Banking performed well. Net profit for the first half of 1999 rose by 4% to CHF 859 m.Assets under management grew by 9.2% or CHF 37 bn, with net new businesscontributing CHF 12.6 bn. Credit Suisse Private Banking extended its lead inproduct innovation and e-commerce.
SERVICES FOR PRIVATE INVESTORS IN SWITZERLAND AND ABROAD
14
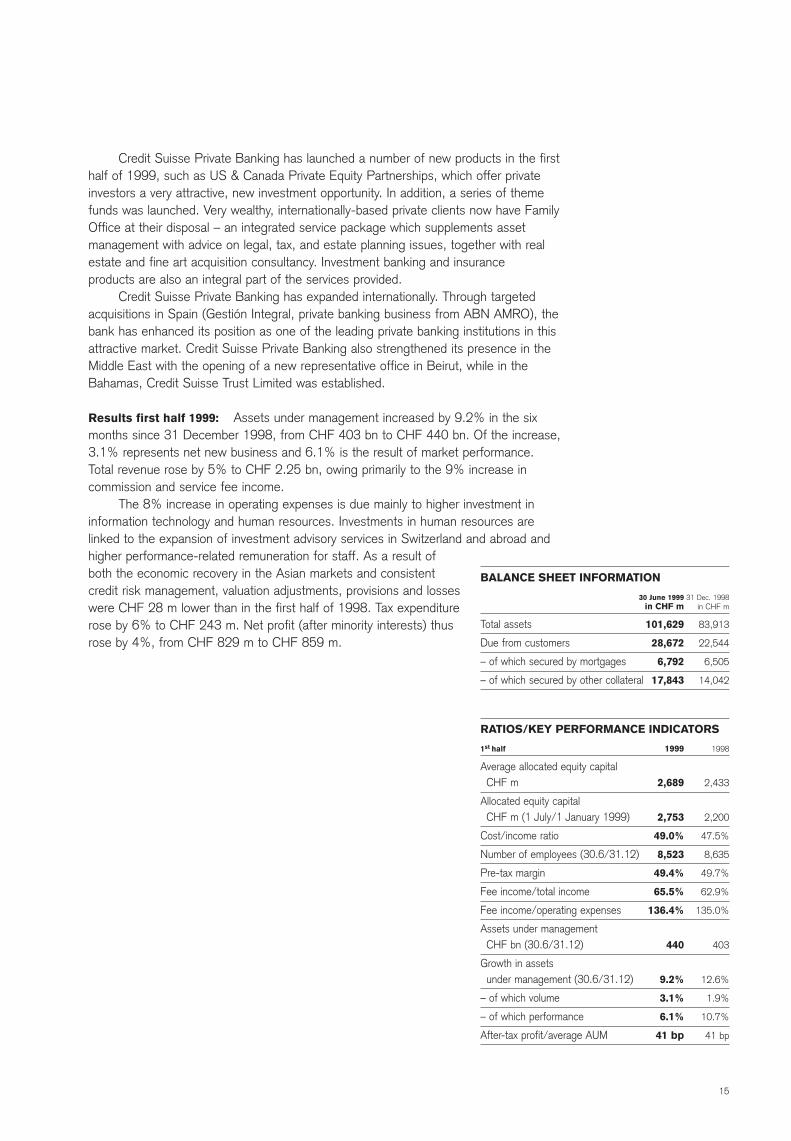
Credit Suisse Private Banking has launched a number of new products in the firsthalf of 1999, such as US & Canada Private Equity Partnerships, which offer privateinvestors a very attractive, new investment opportunity. In addition, a series of themefunds was launched. Very wealthy, internationally-based private clients now have FamilyOffice at their disposal – an integrated service package which supplements asset management with advice on legal, tax, and estate planning issues, together with realestate and fine art acquisition consultancy. Investment banking and insurance products are also an integral part of the services provided.
Credit Suisse Private Banking has expanded internationally. Through targeted acquisitions in Spain (Gestión Integral, private banking business from ABN AMRO), thebank has enhanced its position as one of the leading private banking institutions in thisattractive market. Credit Suisse Private Banking also strengthened its presence in theMiddle East with the opening of a new representative office in Beirut, while in theBahamas, Credit Suisse Trust Limited was established.
Results first half 1999: Assets under management increased by 9.2% in the sixmonths since 31 December 1998, from CHF 403 bn to CHF 440 bn. Of the increase,3.1% represents net new business and 6.1% is the result of market performance. Total revenue rose by 5% to CHF 2.25 bn, owing primarily to the 9% increase in commission and service fee income.
The 8% increase in operating expenses is due mainly to higher investment ininformation technology and human resources. Investments in human resources arelinked to the expansion of investment advisory services in Switzerland and abroad andhigher performance-related remuneration for staff. As a result ofboth the economic recovery in the Asian markets and consistentcredit risk management, valuation adjustments, provisions and losseswere CHF 28 m lower than in the first half of 1998. Tax expenditurerose by 6% to CHF 243 m. Net profit (after minority interests) thusrose by 4%, from CHF 829 m to CHF 859 m.
BALANCE SHEET INFORMATION
30 June 1999 31 Dec. 1998in CHF m in CHF m
Total assets 101,629 83,913
Due from customers 28,672 22,544
– of which secured by mortgages 6,792 6,505
– of which secured by other collateral 17,843 14,042
RATIOS/KEY PERFORMANCE INDICATORS
1st half 1999 1998
Average allocated equity capital CHF m 2,689 2,433
Allocated equity capitalCHF m (1 July/1 January 1999) 2,753 2,200
Cost/income ratio 49.0% 47.5%
Number of employees (30.6/31.12) 8,523 8,635
Pre-tax margin 49.4% 49.7%
Fee income/total income 65.5% 62.9%
Fee income/operating expenses 136.4% 135.0%
Assets under management CHF bn (30.6/31.12) 440 403
Growth in assets under management (30.6/31.12) 9.2% 12.6%
– of which volume 3.1% 1.9%
– of which performance 6.1% 10.7%
After-tax profit/average AUM 41 bp 41 bp
15
Changein %
–4
76
15
538
991
16
21
8
18
11
61
–
97
–7
–100
–100
–7
–7
–97
–2
1st half 1999in CHF m
3,564
2,450
1,506
74
–174
7,420
4,010
1,200
5,210
2,210
219
32
497
1,494
0
0
478
1,016
2
1,014
58
1st half 1998in CHF m
3,775
1,411
1,331
11
–16
6,512
3,366
1,128
4,494
2,018
138
1
256
1,624
9
4
521
1,108
57
1,051
82
Changein %
–6
74
13
573
988
14
19
6
16
10
59
–
94
–8
–100
–100
–8
–8
–96
–4
1st half 1999in USD m
2,458
1,690
1,038
51
–120
5,117
2,766
827
3,593
1,524
151
22
343
1,030
0
0
330
700
1
699
40
1st half 1998in USD m
2,568
960
905
8
–11
4,430
2,290
767
3,057
1,373
94
0
174
1,105
6
3
354
754
39
715
56
INCOME STATEMENT
Fixed Income & Derivatives
Equity
Corporate and Investment Banking
Private Equity
Other
REVENUE
Personnel expenses
Other operating expenses
TOTAL OPERATING EXPENSES
GROSS OPERATING PROFIT
Depreciation and write-offs on non-current assets
– of which amortisation of goodwill
Valuation adjustments, provisions and losses*
PROFIT BEFORE EXTRAORDINARY ITEMS AND TAXES
Extraordinary income*
Extraordinary expenses
Taxes
NET LOSS/PROFIT
– of which minority interests
NET PROFIT (after minority interests)
* net of release of RGBR (reserves for general banking risks)The business unit income statement differs from the Group’s legal accounts in presenting brokerage, execution and clearing expenses as part of operating expenses incommon with US competitors, rather than netted against revenues.
Credit Suisse First Boston produced a very good first-half performance infavourable market conditions. Revenues rose 16% to a record USD 5.1 bn(CHF 7.4 bn), producing a 21% return on equity. The improving quality ofearnings and marked strengthening of CSFB’s competitive position amongthe world’s leading investment banks is particularly gratifying. Action takenfollowing the losses in Russia in 1998 accelerated CSFB’s risk reduction,with value-at-risk and exposure levels down in the first half of 1999. Thegrowth of customer business more than replaced the revenues foregone.
GLOBAL INVESTMENT BANKING
In strategic terms Credit Suisse First Boston benefited from the successful acquisitionsof 1998, with smooth business integration and better-than-expected results. At thesame time, the Firm maintained a continued commitment to organic investment to generate future growth. Initiatives were taken to strengthen risk/regulatory controls andaccelerate e-commerce expansion.
CSFB’s strategy since 1997 has been to strengthen its global special bracket position through targeted growth of customer businesses and consolidation of the morecapital intensive fixed income and derivatives businesses (FID) in which the Firmremains a market leader. This emphasis was accentuated through the lessons learnt inRussia last year. In the first half of 1999, further progress was made in moderating value-at-risk, capital required and balance sheet utilisation, combined with very good
16
growth in customer business. The new “Strategic Risk Management” function hasalready made a strong contribution, especially to improving the quality of risk review andin reducing risk concentrations.
Credit Suisse First Boston has come through a very demanding period with anexcellent earnings recovery underpinned by strong market share advances and furtherinvestment in the future. Stability of people, strategic direction and investment supportthis achievement. The second half is unlikelyto offer such strong market conditions, butthe Firm is increasingly well positioned to faceits competitive challenges.
Results first half 1999: The conditions inthe financial markets were good overall duringthe first six months of the year, although theydeteriorated during the second quarter in anumber of fixed income areas. Strong rev-enue growth (16%) off 1998’s record first-half base reflects market share gains acrossthe board. The Firm’s quality of earningsimproved, with diversification in favour ofequities and investment banking and the cus-tomer segments of fixed income and deriva-tives businesses. Precautionary credit andrelated reserves were high based on anincreased medium-term cautionary outlook.The Firm’s business mix changed to greaterclient orientation reflecting a less capital-intensive, more people-intensive strategy.Consequently, average allocated equity forthe first half of 1999 declined 6% comparedto 1998, whilst a strong 8.4%* BIS tier 1 ratio was maintained; the pre-tax margindeclined due to this mix change, with employee headcount up 5% over the last
* applies to the bank Credit Suisse First Boston; core capital in-cludes USD 125 m noncumulative preferred stock issued by a subsidiary and sold to unaffiliated investors
30 June 1999in CHF m
822
21,811
154,773
107,771
1,837
70,221
37,140
9,658
108,389
7,343
754
2,372
526
6,895
43,732
40,262
429,133
276,860
18,887
215,904
66,894
17,722
134
77,481
36,373
33,233
7,638
44,715
41,217
2,107
11,312
2,263
429,133
276,860
RATIOS/KEY PERFORMANCE INDICATORS
1st half 1999 1998
Average allocated equity capital CHF m 9,910 10,567
Allocated equity capital CHF m (1 July/1 January 1999) 10,555 9,340
BIS tier 1 ratio* 8.4% 8.4%
Cost/income ratio 73.2% 71.1%
Return on average equity capital 20.5% 21.0%
Number of employees (30.6/31.12) 14,394 14,126
Pre-tax margin 20.1% 25.0%
Staff expenses/total expenses 77.0% 74.9%
Staff expenses/total income 54.1% 51.7%
Changein %
–30
16
12
38
–3
14
30
35
7
–27
73
22
–2
1
–12
–13
7
–5
–5
16
–11
8
–26
9
60
–1
–14
–16
–17
29
15
30
7
–5
31 Dec. 1998in CHF m
1,175
18,860
138,726
78,303
1,894
61,522
28,634
7,178
100,963
10,072
436
1,947
535
6,845
49,555
46,347
399,708
290,697
19,923
185,335
74,915
16,350
180
71,157
22,714
33,464
8,844
53,007
49,481
1,638
9,810
1,743
399,708
290,697
BALANCE SHEET
Cash
Money market paper
Due from banks
– of which securities lending andreverse repurchase agreements
Due from other business units
Due from customers
– of which securities lending andreverse repurchase agreements
Mortgages
Securities and precious metalstrading portfolio
Financial investments
Participations
Tangible fixed assets
Goodwill
Accrued income and prepaid expenses
Other assets
– of which replacement value of derivatives
TOTAL ASSETS
TOTAL ASSETS in USD m
Money market liabilities
Due to banks
– of which securities borrowing and repurchase agreements
Due to other business units
Due to customers, in savingsand investment deposits
Due to customers, other
– of which securities borrowing andrepurchase agreements
Bonds and mortgage-backed bonds
Accrued expenses and deferred income
Other liabilities
– of which replacement value of derivatives
Valuation adjustments and provisions
Capital
– of which minority interests
TOTAL LIABILITIES
TOTAL LIABILITIES in USD m
17
18
12 months. Operating expenses pre-bonuses rose 9%, owing to the headcountincrease. Total compensation accruals rose as a result of revenue increases, businessmix and competitor accruals.
In geographic terms, CSFB’s unique balance was again reflected by revenuessplit 39% North America, 35% Europe and 26% the rest of the world. The individualdivisions performed as follows (percentages reflect dollar figures):Equities: Revenues increased 76%, with ROE significantly exceeding 30% despitecontinued investment in people for further growth. The “cash” businesses boosted revenues by over 100% from the previous year’s record first-half base, while derivativesand other equity businesses also saw strong gains. Growth came from all geographicregions. Excellent gains in primary and secondary market shares and in research rank-ings around the world underpin this success. The positive impact of CSFB’s expandedtechnology industry activities particularly benefited Equities (and Investment Banking).Fixed Income & Derivatives (FID): In the first half, FID successfully tackled themajor challenges of integrating Credit Suisse Financial Products (following the repur-chase of the 20% minority stake from Swiss Re in April) and restructuring the divisionto accommodate tighter risk disciplines and capital availability. Despite reduced profitpotential following this risk reduction, revenues were held at the record levels of thefirst half of 1998, achieving a creditable 23% ROE. The merged activities in InterestRate and Credit Products enjoyed excellent growth, while Emerging Markets’ earningsstayed similar to the previous year’s first half. The outstanding performance in LatinAmerica offset the Russian gap and complemented good results from other regions.
A good recovery in Distressed Securities’ performance compensated declines inForeign Exchange and Money Markets. Real Estate products did not contribute to prof-its (compared to 15% of CSFB’s total in the first half of 1998), reflecting a precau-tionary reduction in risk concentration and increased provisioning levels. CSFB’s debtcapital markets underwriting position strengthened further to a global ranking of four.Investment Banking (IBD): Revenues increased 15%, with improved profitabilitydespite large reductions in net interest income due to a smaller loan book and theresultant 66% reduction in capital employed since 1997 (now on target at below USD1 bn). Underlying growth was excellent, with M&A revenues the star performer, up79% on the comparable 1998 period, and other investment banking product resultsalso rose. Credit Suisse First Boston has expanded its client coverage capacity in IBDsubstantially during the last 18 months. While this heavy investment implies an initialdrag on profits, the resultant market share gains, complementing those of Equities,enhance CSFB’s prospects for growth and diversified earnings.Private Equity: The investment of CSFB’s globally managed private equity funds,totalling USD 3.6 bn, is now accelerating. The current level of revenues reflect limitedharvesting of previous investments. Personnel was strengthened further in Europe.
First-half performance was strong, with discretionary assets under manage-ment growing 18% over the six months. Revenues and net profit for the firsthalf of 1999 were CHF 462 m and CHF 111 m compared to CHF 440 m andCHF 121 m for the same period last year. Total assets under management,including advisory, amounted to CHF 336 bn (up 13%) at 30 June 1999.
SERVICES FOR INSTITUTIONAL AND MUTUAL FUND INVESTORS WORLDWIDE
Credit Suisse Asset Management made significant progress in achieving its strategic objectives inthe first half of 1999, with all five geographic units – Switzerland, Europe (excluding Switzerland),the Americas, Japan and Australia all posting increased assets under management and revenue.On 6 July, CSAM closed the acquisition of Warburg Pincus Asset Management. This acquisitionsignificantly enhances CSAM’s American franchise, raising total assets under management in theUS to USD 62.2 bn. Other developments in the first half included the successful launch of thealternative investment mutual fund product in the European retail market and increased penetra-tion of the US defined contribution market.
Results first half 1999: Discretionary assets under management totalled CHF 250 bn, up17.9% since the beginning of the year; 8.6% due to net new business and 9.3% from marketappreciation. Mutual funds grew by 17.6%, while mutual fund fee income only increased by 1%owing to the shift in mutual fund revenues to the Group’s distribution channels. Total revenuegrowth of 5%, was driven primarily by a higher level of assets under management with advisoryfees up 13.6% offset by nearly flat mutual fund fees. Operating expenses were CHF 319 m versus CHF 287 m, up 11%, reflecting significant planned growth initiatives, investment spending on information technology, and development of the European retail business.
1st half 1998in CHF m
289
117
34
440
167
120
287
153
5
0
0
148
0
0
27
121
0
121
Changein %
13
1
–53
5
10
13
11
–7
0
–
–
–7
–
–
–19
–8
–
–8
1st half 1999in CHF m
328
118
16
462
184
135
319
143
5
1
0
138
0
5
22
111
0
111
INCOME STATEMENT
Management and advisory fees
Net mutual fund fees
Other revenues
REVENUE
Personnel expenses
Other operating expenses
TOTAL OPERATING EXPENSES
GROSS OPERATING PROFIT
Depreciation and write-offs on non-current assets
– of which amortisation of goodwill
Valuation adjustments, provisions and losses
PROFIT BEFORE EXTRAORDINARYITEMS AND TAXES
Extraordinary income
Extraordinary expenses
Taxes
NET PROFIT
– of which minority interests
NET PROFIT (after minority interests)
RATIOS/KEY PERFORMANCE INDICATORS
1st half 1999 1998
Average allocated equity capital CHF m 241 157
Allocated equity capital CHF m (1 July/1 January 1999) 294 170
Cost/income ratio 70.1% 66.4%
After-tax profit/average AUM 6.9 bp 8.5 bp
Number of employees (30.6/31.12) 1,644 1,577
Pre-tax margin 28.8% 33.6%
Staff expenses/total expenses 57.7% 58.2%
Staff expenses/total income 39.8% 38.0%
Total assets under managementCHF bn (30.6/31.12) 336 297
Total discretionary fundsCHF bn (30.6/31.12) 250 212
Total mutual funds distributed CHF bn (30.6/31.12) 87 74
Total advisory assetsCHF bn (30.6/31.12) 86 85
Growth in assets under management 13.1% 12.0%
Growth in discretionaryassets under management 17.9% 13.0%
– of which volume 8.6% 2.9%
– of which performance 9.3% 10.1%
19
In the first half of 1999, Winterthur Group achieved a net profit of CHF 503 m,up 19%, benefiting from a lower effective tax rate and good operating results,up 1% to CHF 690 m, in spite of severe weather losses, lower investmentincome as a result of lower realised capital gains, and the absence of profitsfrom the divested reinsurance business. Premium income fell by only 3% fromthe extraordinary tax-driven volume in 1998. Reported shareholders’ equitydecreased slightly by CHF 0.2 bn to CHF 9.1 bn.
INSURANCE FOR PRIVATE AND CORPORATE CUSTOMERS WORLDWIDE
The first six months of 1999 were characterised by a series of severe natural catastrophes andhigh-level losses. Heavy snowfalls in winter and severe floods in spring, particularly in Switzer-land, reduced the underlying improvement in claims in the first half of the year. Winterthur alsofaced difficult conditions in the Spanish and German motor insurance markets, and continuedpressure on prices in its global industrial business. Facing these market conditions, Winterthur will continue to focus on further improving the company’s results in relation to the market average.
In this context Winterthur has initiated a series of investments and restructuring measuresto further enhance its core insurance operations. These include major investments in new sys-tems for Winterthur International, investments in improving distribution, underwriting and claimsfunctions in the European operations, and major restructuring projects in domestic Swiss busi-ness. From 1 January 2000, the 14 regional branch offices in Switzerland will be regrouped insix new regional centres, increasing the efficiency of the Division.
Winterthur is further expanding its already strong position in the growth markets of Hungary,Poland and the Czech Republic, entering the newly liberalised Polish pension fund market in March1999. In Switzerland, Winterthur opened a new distribution channel by launching its own Internetdistribution at the beginning of August – the first Swiss insurer to offer complete motor insuranceonline. This is part of a broader strategy of investments in e-commerce capabilities in all Divi-sions. Winterthur continues to extend its bancassurance strategy within Credit Suisse Group. In conjunction with the new Credit Suisse Group initiative, Personal Financial Services (PFS),
Winterthur will further expand its asset-gath-ering capabilities, especially in SouthernEurope, where the recent introduction ofsophisticated life products has acceleratedsales.
Despite intense price competition andongoing restructuring investments, Winterthurachieved a strong result in the first six monthsof 1999, aided by an improved tax situation.With a normal level of large losses, the coreperformance improvements will be more ob-vious in the second half of the year, leadingto an expected double-digit increase in earnings for the whole year.
Results first half 1999: Winterthur Group’spre-tax operating profit increased 1% to CHF690 m despite the absence of profits fromthe divested reinsurance business and a 6%decrease in investment income as a result oflower realised capital gains. The effective taxrate fell from 31% to 20% due to higher tax-exempt investment income and a lower
FINANCIAL HIGHLIGHTS
1st half 1999 1st half 1998* Changein CHF m in CHF m in %
Gross premiums 16,211 16,693 –3
Net investment income 3,731 3,952 –6
Profit before tax/minority interests, extraordinaryitems and interest on bond issues 690 685 1
Interest on convertible bond and warrant issues 3 14 –79
Tax 138 211 –35
Net profit 549 460 19
– of which minority interests 46 37 24
Net profit (after minority interests) 503 423 19
30 June 1999 31 Dec. 1998 Changein CHF m in CHF m in %
Investments 119,202 111,505 7
Technical provisions 101,649 96,652 5
Debentures outstanding 164 465 –65
Shareholders’ equity (excl. minority interests) 9,149 9,358 –2
30 June 1999 31 Dec. 1998
Employees 25,987 25,521 2
* Adjusted for the sale of reinsurance business and for stamp duty
20
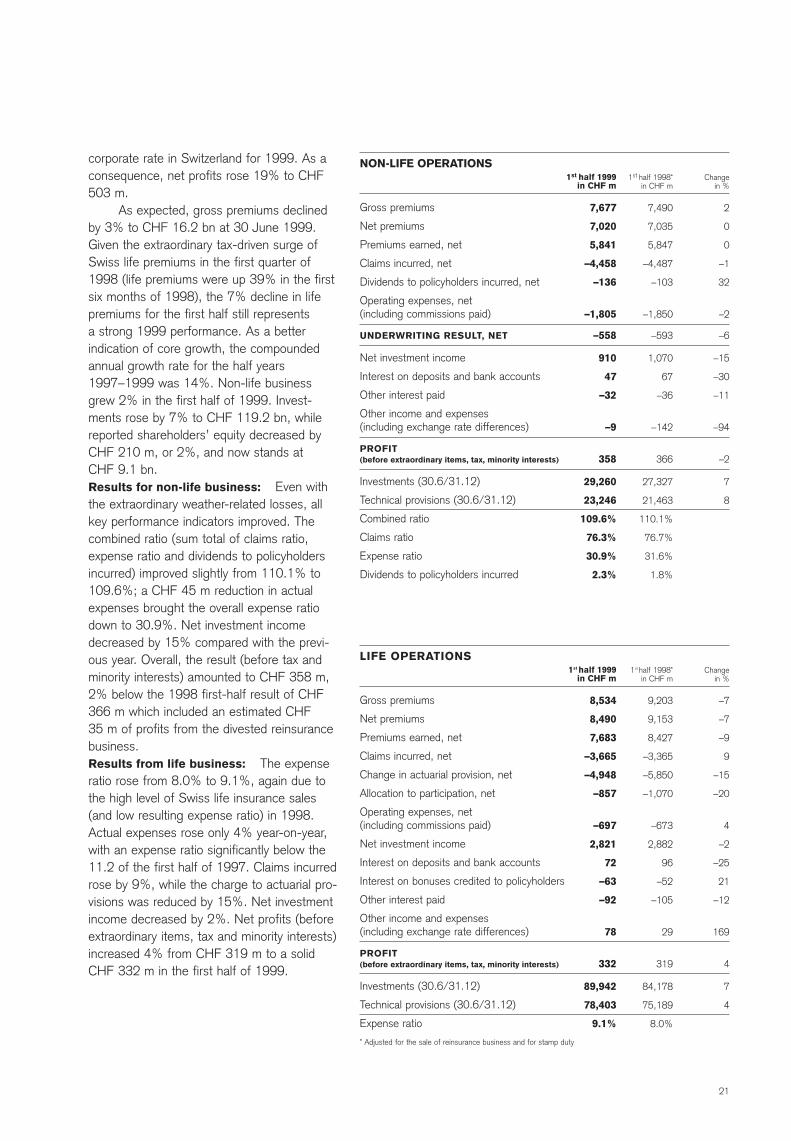
corporate rate in Switzerland for 1999. As aconsequence, net profits rose 19% to CHF503 m.
As expected, gross premiums declinedby 3% to CHF 16.2 bn at 30 June 1999.Given the extraordinary tax-driven surge ofSwiss life premiums in the first quarter of1998 (life premiums were up 39% in the firstsix months of 1998), the 7% decline in life premiums for the first half still represents a strong 1999 performance. As a better indication of core growth, the compounded annual growth rate for the half years1997–1999 was 14%. Non-life businessgrew 2% in the first half of 1999. Invest-ments rose by 7% to CHF 119.2 bn, whilereported shareholders’ equity decreased byCHF 210 m, or 2%, and now stands at CHF 9.1 bn.Results for non-life business: Even withthe extraordinary weather-related losses, allkey performance indicators improved. Thecombined ratio (sum total of claims ratio,expense ratio and dividends to policyholdersincurred) improved slightly from 110.1% to109.6%; a CHF 45 m reduction in actualexpenses brought the overall expense ratiodown to 30.9%. Net investment incomedecreased by 15% compared with the previ-ous year. Overall, the result (before tax andminority interests) amounted to CHF 358 m,2% below the 1998 first-half result of CHF 366 m which included an estimated CHF 35 m of profits from the divested reinsurance business.Results from life business: The expenseratio rose from 8.0% to 9.1%, again due tothe high level of Swiss life insurance sales(and low resulting expense ratio) in 1998.Actual expenses rose only 4% year-on-year,with an expense ratio significantly below the11.2 of the first half of 1997. Claims incurredrose by 9%, while the charge to actuarial pro-visions was reduced by 15%. Net investmentincome decreased by 2%. Net profits (beforeextraordinary items, tax and minority interests)increased 4% from CHF 319 m to a solidCHF 332 m in the first half of 1999.
1st half 1999in CHF m
8,534
8,490
7,683
–3,665
–4,948
–857
–697
2,821
72
–63
–92
78
332
89,942
78,403
9.1%
Changein %
–7
–7
–9
9
–15
–20
4
–2
–25
21
–12
169
4
7
4
1st half 1998*in CHF m
9,203
9,153
8,427
–3,365
–5,850
–1,070
–673
2,882
96
–52
–105
29
319
84,178
75,189
8.0%
LIFE OPERATIONS
Gross premiums
Net premiums
Premiums earned, net
Claims incurred, net
Change in actuarial provision, net
Allocation to participation, net
Operating expenses, net(including commissions paid)
Net investment income
Interest on deposits and bank accounts
Interest on bonuses credited to policyholders
Other interest paid
Other income and expenses (including exchange rate differences)
PROFIT(before extraordinary items, tax, minority interests)
Investments (30.6/31.12)
Technical provisions (30.6/31.12)
Expense ratio
1st half 1999in CHF m
7,677
7,020
5,841
–4,458
–136
–1,805
–558
910
47
–32
–9
358
29,260
23,246
109.6%
76.3%
30.9%
2.3%
Changein %
2
0
0
–1
32
–2
–6
–15
–30
–11
–94
–2
7
8
1st half 1998*in CHF m
7,490
7,035
5,847
–4,487
–103
–1,850
–593
1,070
67
–36
–142
366
27,327
21,463
110.1%
76.7%
31.6%
1.8%
NON-LIFE OPERATIONS
Gross premiums
Net premiums
Premiums earned, net
Claims incurred, net
Dividends to policyholders incurred, net
Operating expenses, net(including commissions paid)
UNDERWRITING RESULT, NET
Net investment income
Interest on deposits and bank accounts
Other interest paid
Other income and expenses(including exchange rate differences)
PROFIT(before extraordinary items, tax, minority interests)
Investments (30.6/31.12)
Technical provisions (30.6/31.12)
Combined ratio
Claims ratio
Expense ratio
Dividends to policyholders incurred
* Adjusted for the sale of reinsurance business and for stamp duty
21
Internet banking and web insuranceCredit Suisse Group is highly focused on developing the Internet as a key distribution channel. In thefirst few months of 1999, Credit Suisse Group launched additional online services. Youtrade, devel-oped by Credit Suisse and Credit Suisse Private Banking, was the first online discount brokeragefacility in Switzerland. The number of customers and transactions via youtrade are well ahead of plan.Through FundLab, an interactive investment fund database on the Internet, Credit Suisse PrivateBanking has become one of the most innovative fund distributors in the world. Credit Suisse FirstBoston remains a leader in institutional market making via the Internet, has extended its partnershipwith Charles Schwab and offers its research publications to customers online. At Winterthur, cus-tomers can now buy motor insurance policies on the web. In addition, plans are well advanced forWinterthur to become the first Swiss insurer to offer a complete line of insurance products over theInternet.
Personal Financial Services EuropeThrough the “Personal Financial Services Europe” strategy announced in March 1999, Credit SuisseGroup aims to combine the existing distribution and product capability of Credit Suisse Group withtechnology rich channels to directly target the needs of affluent customers in selected European mar-kets. The implementation of this strategy started well in the first half 1999, with the formation of adedicated team and work on the operations platform, product range and logistics. The pilot project inItaly, the new Credit Suisse (Italy), was officially launched in April 1999 and already has assets undermanagement of EUR 1.6 bn, well above expectations. The strategy will be implemented step by stepin key European markets.
Ready for the new millenniumCritical-system readiness is complete and non-critical systems are 96–99% complete in a Group-wide effort requiring more than 1,000 person years and costs of CHF 570 m. In addition, plans havebeen drawn up for processes and procedures which are dependent on the smooth functioning ofthird-party systems. Credit Suisse Group’s primary goal for the year 2000 is ensuring business asusual in all areas.
OutlookGiven the less favourable conditions on the financial markets since the beginning of the summer andexpectations of a challenging operating environment for the rest of the year, Credit Suisse Group’soverall performance in the second half of the year is not expected to match the strong results of thefirst six months. Nonetheless, the Group remains confident of achieving good results for the year as awhole and of making further advances in reaching its targets.
Yours sincerely
CLOSING
Rainer E. Gut Lukas MühlemannChairman of the Board of Directors Chief Executive Officer
22

CREDIT SUISSE GROUPParadeplatz 8 P.O. Box 1 8070 Zurich Switzerland
Telephone: + 41 1 212 16 16 Fax: + 41 1 333 25 87 Internet: http://www.csg.ch


