25
2017 CREDIT SUISSE ENERGY SUMMIT February 14, 2017
| Date post: | 21-Feb-2017 |
| Category: |
Investor Relations |
| Upload: | chesapeake-energy-corporation |
| View: | 3,908 times |
| Download: | 0 times |

2017 CREDIT SUISSE ENERGY SUMMITFebruary 14, 2017

FORWARD-LOOKING STATEMENTS
This presentation includes “forward-looking statements” within the meaning of Section 27A of the Securities Act of 1933 and Section 21E of the Securities Exchange Act of 1934. Forward-looking statements are statements other than statements of historical fact. They include statements that give our current expectations or forecasts of future events, production and well connection forecasts, estimates of operating costs, anticipated capital and operational efficiencies, planned development drilling and expected drilling cost reductions, general and administrative expenses, capital expenditures, the timing of anticipated noncore asset sales and proceeds to be received therefrom, projected cash flow and liquidity, our ability to enhance our cash flow and financial flexibility, plans and objectives for future operations (including our ability to optimize base production and execute gas gathering agreements), the ability of our employees, portfolio strength and operational leadership to create long-term value, and the assumptions on which such statements are based. Although we believe the expectations and forecasts reflected in the forward-looking statements are reasonable, we can give no assurance they will prove to have been correct. They can be affected by inaccurate or changed assumptions or by known or unknown risks and uncertainties.
Factors that could cause actual results to differ materially from expected results include those described under “Risk Factors” in Item 1A of our annual report on Form 10-K and any updates to those factors set forth in Chesapeake's subsequent quarterly reports on Form 10-Q or current reports on Form 8-K (available at http://www.chk.com/investors/sec-filings). These risk factors include the volatility of oil, natural gas and NGL prices; the limitations our level of indebtedness may have on our financial flexibility; our inability to access the capital markets on favorable terms or at all; the availability of cash flows from operations and other funds to finance reserve replacement costs or satisfy our debt obligations; a further downgrade in our credit rating requiring us to post more collateral under certain commercial arrangements; write-downs of our oil and natural gas asset carrying values due low commodity prices; our ability to replace reserves and sustain production; uncertainties inherent in estimating quantities of oil, natural gas and NGL reserves and projecting future rates of production and the amount and timing of development expenditures; our ability to generate profits or achieve targeted results in drilling and well operations; leasehold terms expiring before production can be established; commodity derivative activities resulting in lower prices realized on oil, natural gas and NGL sales; the need to secure derivative liabilities and the inability of counterparties to satisfy their obligations; adverse developments or losses from pending or future litigation and regulatory proceedings, including royalty claims; charges incurred in response to market conditions and in connection with our ongoing actions to reduce financial leverage and complexity; drilling and operating risks and resulting liabilities; effects of environmental protection laws and regulation on our business; legislative and regulatory initiatives further regulating hydraulic fracturing; our need to secure adequate supplies of water for our drilling operations and to dispose of or recycle the water used; impacts of potential legislative and regulatory actions addressing climate change; federal and state tax proposals affecting our industry; potential OTC derivatives regulation limiting our ability to hedge against commodity price fluctuations; competition in the oil and gas exploration and production industry; a deterioration in general economic, business or industry conditions; negative public perceptions of our industry; limited control over properties we do not operate; pipeline and gathering system capacity constraints and transportation interruptions; terrorist activities and cyber-attacks adversely impacting our operations; potential challenges of our spin-off of Seventy Seven Energy Inc. (SSE) in connection with SSE's recently completed bankruptcy under Chapter 11 of the U.S. Bankruptcy Code; an interruption in operations at our headquarters due to a catastrophic event; the continuation of suspended dividend payments on our common stock and preferred stock; certain anti-takeover provisions that affect shareholder rights; and our inability to increase or maintain our liquidity through debt repurchases, capital exchanges, asset sales, joint ventures, farmouts or other means.
In addition, disclosures concerning the estimated contribution of derivative contracts to our future results of operations are based upon market information as of a specific date. These market prices are subject to significant volatility. Our production forecasts are also dependent upon many assumptions, including estimates of production decline rates from existing wells and the outcome of future drilling activity. Expected asset sales may not be completed in the time frame anticipated or at all. We caution you not to place undue reliance on our forward-looking statements, which speak only as of the date of this presentation, and we undertake no obligation to update any of the information provided in this release or the accompanying Outlook, except as required by applicable law.
CREDIT SUISSE ENERGY SUMMIT - FEBRUARY 2017 2

3
OUR STRATEGYRELEVANT THROUGH COMMODITY PRICE CYCLES
Profitable and Efficient GrowthFrom Captured Resources
> Develop world-class inventory
> Target top-quartile operating and financial metrics
> Pursue continuous improvement
> Drive value leakage out of operations
Explore> Leverage innovative technology
and expertise
> Explore and exploit new growth opportunities
Business Development> Optimize portfolio through strategic
divestitures
> Target strategic acquisitions
> Enhance and expand the portfolio
Financial Discipline> Balance capital expenditures
with cash flow from operations
> Increase financial and operational flexibility
> Achieve investment grade metrics
CREDIT SUISSE ENERGY SUMMIT - FEBRUARY 2017

4
UNRECOGNIZED VALUE, UNLOCKED POTENTIALPOWER OF THE PORTFOLIO
(1) Price Deck: $3/mcf and $60/bbl oil flat
~6.2mm net acresDeveloped and undeveloped leasehold
5,600 locationsAbove 40% ROR(1)
Utica Shale1,000,000 Acres
Eagle Ford Shale260,000 Acres
Marcellus Shale715,000 Acres
Haynesville Shale255,000 Acres
Mid-Continent1,500,000 Acres
Powder River Basin300,000 Acres
Resilient production in 2017 after $2B+ in asset sales in 2016Significant exploration and technology upside
CREDIT SUISSE ENERGY SUMMIT - FEBRUARY 2017
Exploration & Technology Driving for additional resources
5
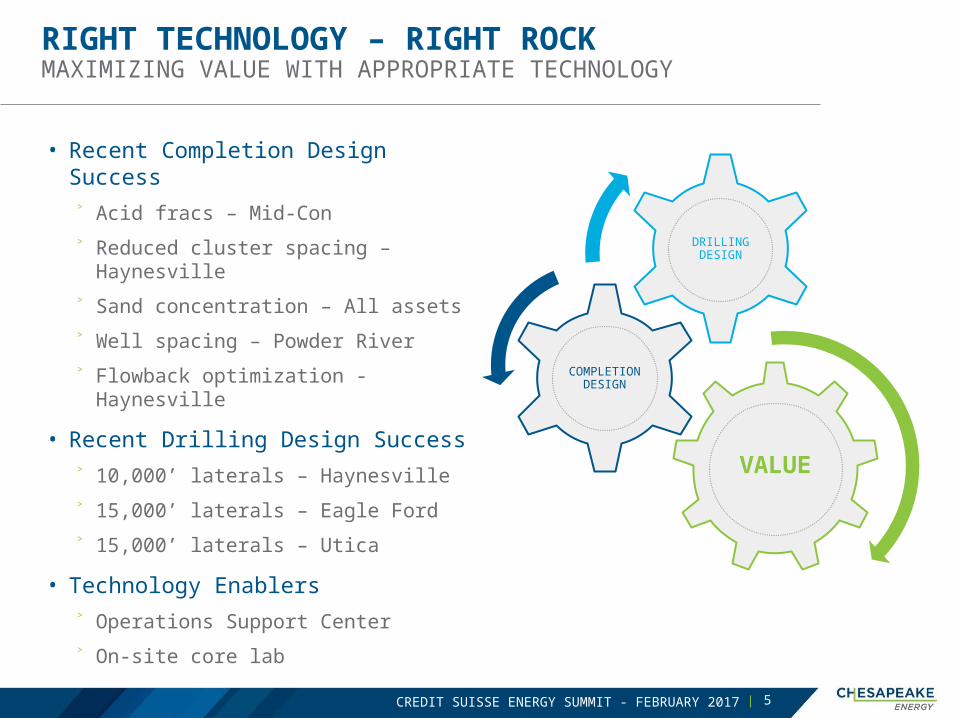
RIGHT TECHNOLOGY – RIGHT ROCKMAXIMIZING VALUE WITH APPROPRIATE TECHNOLOGY
• Recent Completion Design Success˃ Acid fracs – Mid-Con
˃ Reduced cluster spacing – Haynesville
˃ Sand concentration – All assets
˃ Well spacing – Powder River
˃ Flowback optimization - Haynesville
• Recent Drilling Design Success˃ 10,000’ laterals – Haynesville
˃ 15,000’ laterals – Eagle Ford
˃ 15,000’ laterals – Utica
• Technology Enablers˃ Operations Support Center
˃ On-site core lab
CREDIT SUISSE ENERGY SUMMIT - FEBRUARY 2017
VALUE
COMPLETION DESIGN
DRILLING DESIGN

CREDIT SUISSE ENERGY SUMMIT - FEBRUARY 2017 6
30%
15%
10%5%
5%
15%
20%
2017 D&C Asset Funding
Eagle Ford
Utica
Haynesville
Marcellus
OtherPowder
River
Mid-Continent
> Oil growth driven by Eagle Ford, Mid-Continent and the emerging PRB
2017 CAPITAL ALLOCATION AND FOCUSFLEXIBLE PROGRAM BUILDING FOR GROWTH IN 2018
> Strong gas economics from Haynesville, Utica and Marcellus provide >40% ROR (1)
Eagle Ford Shale175 – 195 Spuds155 – 175 TILS
Haynesville Shale30 – 35 Spuds32 – 37 TILS
Mid-Continent100 – 120 Spuds95 – 115 TILS
Powder River Basin25 – 30 Spuds28 – 33 TILS Utica Shale
40 – 50 Spuds70 – 80 TILS
Marcellus Shale10 – 15 Spuds50 – 60 TILS
(1) Price Deck: $3/mcf and $60/bbl oil flat

7
SOUTH TEXAS ASSET OVERVIEWUNDRILLED ACREAGE, POSITIONED FOR GROWTH
• Secure acreage position
• Best-in-class operations
• Extended laterals driving value, providing strong oil growth in 2017 and 2018
(1) Net processed production mix
~260,000 Net Acres in Eagle Ford – 99% HBP/HBO
56%19%
25%
Production Mix (1)
Oil NGL Natural Gas
Locations
Remaining Development
75%
Drilled25%
5 – 6 rigsActive in 2017 drilling 175 – 195 wells with 155 – 175 TILs
CREDIT SUISSE ENERGY SUMMIT - FEBRUARY 2017

8
ACCELERATING VALUE WITH EXTENDED LATERALSLOWER EAGLE FORD SHALE
14,416’ lateralBasin drilling record in 4Q ‘16 continuing to push technological limits to drive value
Extended laterals pay out
45% fasterCompared to basin standard due to higher IPs and lower cost per foot(1)(2)
~95% of 2017 drilling program
>40% ROR(1)
Avg. lateral length of 10,117’ 10+ wells planned >15,000’
2013 2014 2015 2016 2017E
$1,207$1,011
$866
$510 $435
Total Well Cost per Lateral Foot (2)
2013 2014 2015 2016 2017E0
200
400
600
800
1,000
5,000
6,000
7,000
8,000
9,000
10,000
11,000
Avg. 30 Day Oil IP Lateral Length
30-D
ay O
il IP
, bo/
d
Late
ral L
engt
h, fe
et
CREDIT SUISSE ENERGY SUMMIT - FEBRUARY 2017
(1) Price Deck: $3/mcf and $60/bbl oil flat(2) Average Cost per foot of wells drilled and/or completed within the time period

9
0 108 216 324 432 540 648 756 864 972 10801188129614040
5
10
15
20
25
30
35
2 - East
Days
Nor
mal
ized
Avg
. Cum
. Oil
(mbo
/$m
m)
INDUSTRY-LEADING LONG LATERAL DEVELOPMENT RESULTS IN FASTER PAYOUTS, SHORTER CYCLE TIMES
21
EastAvg LL: 12,600’
IP30: 1,346 boe/d94% Oil
CentralAvg LL: 12,950’IP30: 977 boe/d
92% Oil
0 102 204 306 408 510 612 714 816 918 102011221224132614280
5
10
15
20
25
30
35
1 - Central
Days
Nor
mal
ized
Avg
. Cum
. Oil
(mbo
/$m
m)
2016 Avg2013 – 2015 Avg
2016 Avg2013 – 2015 Avg
CREDIT SUISSE ENERGY SUMMIT - FEBRUARY 2017
Long laterals improve capital efficiency and create shorter reinvestment cycles

10
Wedge Play Cross Section Schematic
MID-CONTINENT WEDGE PLAY SUCCESSAPPRAISAL DRILLING YIELDS STRONG RESULTS
Schoeppel 1HMeramec Silt (St. Genevieve)
IP 30 = 977 boe/d, 50% oil
Hunt 1HMeramec Silt (Stack)
IP 30 = 1,050 boe/d, 45% oil
Hoskins 1HMeramec Silt (St. Genevieve)
IP 30 = 1,185 boe/d, 60% oil
Encouraging resultsMeramec Silt – St. Genevieve target creates additional Wedge play opportunities
~ 870,000 net acres~500 locations at 50% ROR(1)
~1,400 additional upside locations
~150 miles
~2 rigsActive in drilling 40 – 50 Wedge play wellswith 40 – 50 TILs
CREDIT SUISSE ENERGY SUMMIT - FEBRUARY 2017
(1) Price Deck: $3/mcf and $60/bbl oil flat

11
MID-CONTINENT OSWEGO RAPID OIL GROWTHLOW-COST, HIGH-RETURN OIL VOLUME
180% ROR(1)
400 mboe EUR (83% liquid)
Well Name IP 30 boe/d Oil %
Caldwell 1,813 80%
Lightle 1,462 88%
Hughes Trust 1,326 95%
Hill 1,223 86%
Farrar 1,059 87%
Hasty 1,033 87%
Themer 832 86%
Eugene 824 79%
Ingle 801 90%
Mueggenborg 733 87%
CREDIT SUISSE ENERGY SUMMIT - FEBRUARY 2017
1,100 boe/dTop 10 wells avg. IP 30Top 10 avg. cost $3.2mm
~ 2 rigs Active in 2017 drilling 60 – 70 wellswith 55 – 65 TILsCycle time 38 days spud to TIL
(1) Price Deck: $3/mcf and $60/bbl oil flat
40 MILES
40 MILE
S

12
POWDER RIVER BASIN2017 CAPITAL PROGRAM
2 rigsActive in 2017 drilling 25 – 30 wells with 28 – 33 TILs
CREDIT SUISSE ENERGY SUMMIT - FEBRUARY 2017
Teapot
ParkmanE, A, B/C & Deep
Surrey
Sussex
Niobrara
Turner
Frontier
Mowry
2017 Focus Areas
CREDIT SUISSE ENERGY SUMMIT - FEBRUARY 2017 13
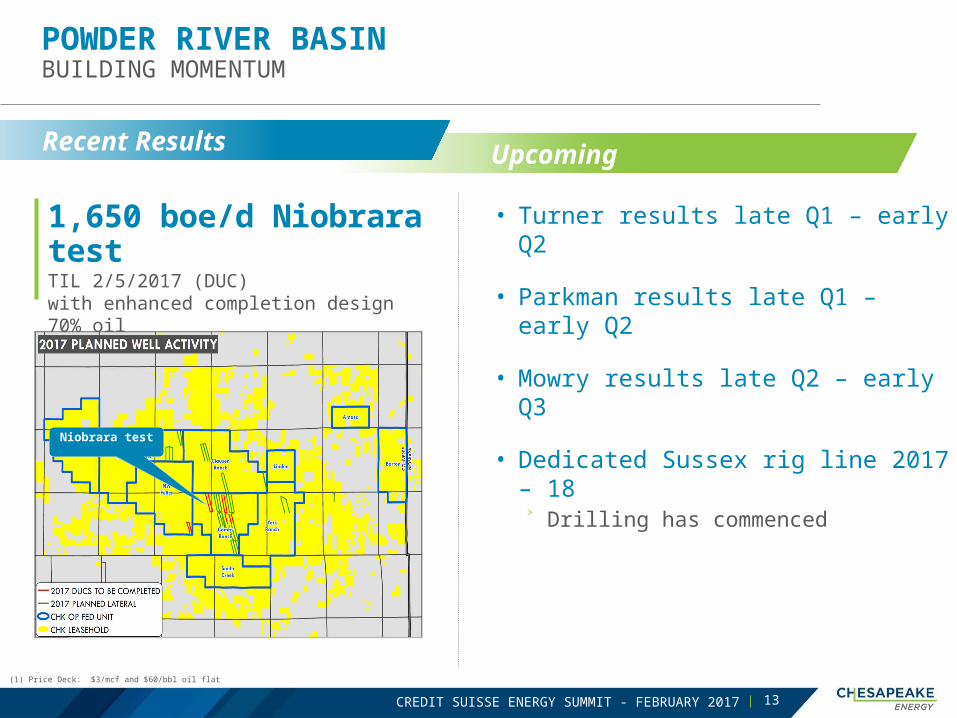
POWDER RIVER BASINBUILDING MOMENTUM
• Turner results late Q1 – early Q2
• Parkman results late Q1 – early Q2
• Mowry results late Q2 – early Q3
• Dedicated Sussex rig line 2017 – 18˃ Drilling has commenced
UpcomingRecent Results
1,650 boe/d Niobrara testTIL 2/5/2017 (DUC) with enhanced completion design70% oil
Niobrara test
(1) Price Deck: $3/mcf and $60/bbl oil flat

14
SUSSEX AND TURNER SANDSTONESOIL PLAYS: PROVEN RESERVOIRS – UNREALIZED VALUE
• Dominant, contiguous play position
• Results expected in August
• Targeted development˃ EUR: 825 – 1,350 mboe
˃ ROR: 50 – 70% (1)
˃ 2017 drilling program: ~20 wells
53%
12%
35%
Production Mix
Oil NGL Natural Gas
• Same play as northern hotspot
• Results expected in May
• Offset competitor activity proves potential
48%
14%
38%
Oil NGL Natural Gas
Turner SandstoneSussex Sandstone
CREDIT SUISSE ENERGY SUMMIT - FEBRUARY 2017
Production Mix
(1) Price Deck: $3/mcf and $60/bbl oil flat

15
2Q '16 10,000' Laterals w/ Modern Completion
10,000' Lateral w/ 3,000-5,000 lbs./ft.
Completion
Future Return Potential(1)
27%
50%
~70%
GULF COASTWORLD-CLASS RESOURCE
2016 2017+
Delivering monster IPsROTC 1H – 40 mmcf/d, 10,000' lateral, 5,200 lbs/ftCA 1H – 38 mmcf/d, 10,000' lateral, 3,000 lbs/ftNabors 2H – 19 mmcf/d, 5,200’ lateral, 5,000 lbs/ft~3 rigsActive in 2017 drilling 30 – 35 wells with 32 – 37 TILs
CREDIT SUISSE ENERGY SUMMIT - FEBRUARY 2017
Nabors 2H
ROTC 1HCA 1H
(1) Price Deck: $3/mcf and $60/bbl oil flat

16
HAYNESVILLE PAYOUTS TRANSFORMEDSTEP CHANGE IN SHORT-CYCLE CASH FLOW
0 10 20 30 40 50 60
-15
-10
-5
0
5
10
15
Producing MonthsNet
Cas
h Fl
ow ($
mm
)
CA 1H Projection
2015 Projection
> One-year reduction in payout time(1)
Longer laterals and modern completions have reduced payout time by greater than one year
2017 development2017 average lateral length: 9,000’+15,000’ lateral wells plannedCompletions of 3,000 – 5,000 lbs/ft
CREDIT SUISSE ENERGY SUMMIT - FEBRUARY 2017
Accelerated Haynesville payouts are improving the cash generating capabilities of the company

17
UTICA SHALEVALUE OPTIMIZATION
(1) Price deck: $3/mcf and $60/bbl flat
CREDIT SUISSE ENERGY SUMMIT - FEBRUARY 2017
~ 2 rigsActive in 2017 drilling 40 – 50 wells with 70 – 80 TILs
Value focused DUC ROR ~90%(1)
New drill ROR ~50%(1)
Operational highlightsAverage completed lateral length in 2017 ~9,600'> 90% of gas sent to Gulf markets
2017 Focus Areas

18
MARCELLUS SHALESUSTAINABLE FREE CASH GROWTH
(1) Price deck: $3/mcf and $60/bbl oil flat
CREDIT SUISSE ENERGY SUMMIT - FEBRUARY 2017
2015 2016 2017 2018 2019 2020 20210
200,000
400,000
600,000
800,000
1,000,000
1,200,000
1,400,000
1,600,000
1,800,000
2,000,000
2,200,000
2,400,000
Gros
s Pro
duct
ion,
MMC
FD
Future Opportunity
Future Opportunity
Actual Production Significant flexibility to
maximize with favorable pricing
Free cash machineDelivers ~$225mm in 2017(1)
Limited capital required
2017 DUC focusComplete – TIL: 40-45 DUCsDrill – TIL: 10-15 wells
Control the core~65% of Marcellus core is CHK operated ~92% of CHK acreage is HBP

19
RETURNING TO GROWTHPORTFOLIO STRENGTH AND OIL GROWTH WILL DRIVE MARGIN EXPANSION
(1) Production forecast subject to final capital allocation decisions for 2017 and 2018 and market conditions
4Q'16E 4Q'17E 4Q'18E450,000
500,000
550,000
600,000
650,000
700,000
750,000
Total Production (mboe/d) (1)
4Q'16E 4Q'17E 4Q'18E60,000
80,000
100,000
120,000
140,000
Oil Production (mbo/d) (1)
CREDIT SUISSE ENERGY SUMMIT - FEBRUARY 2017
~10% oil production growth projected from 4Q’16 to 4Q’17~20% oil production growth projected from 4Q’17 to 4Q’18

20
2020
Strategic targetsSubstantial progress on every front
Reduced total leverage by ~50% ($11.2 billion)
Improved cash costs by ~50% per boe
Reduced financial and balance sheet complexity
High-graded portfolio — 10,500+ locations above 20% ROR
Grow production 5 – 15% annually
Expand margin through 10 – 20% annual oil growth
Achievable free cash flowneutrality in 2018
Retire $2 – $3 billion of debt
Achieve 2x net debt/EBITDA
2016
CREDIT SUISSE ENERGY SUMMIT - FEBRUARY 2017

21CREDIT SUISSE ENERGY SUMMIT - FEBRUARY 2017

22
215
$1.9 – $2.5B
2017 CAPITAL BUDGET
• 2017 budget of $1.9 – $2.5 billion
˃ 2017 investment to deliver FCF in 2018
˃ Lower DUC working inventory
2017 Capital Budget
Drilled Uncompleted InventoryReducing DUC inventory
by 40-65 wells
2016 2017E
$1.7 – $2.3BD&C
$0.25B Cap Int.
$1.65 - $1.75B
2016 2017E
150 – 175
$1.4 - $1.5BD&C
CREDIT SUISSE ENERGY SUMMIT - FEBRUARY 2017
$0.2B Cap Int.

23
DEBT MATURITY PROFILE
• Pro forma tender results, OMRs, 6.25% Euro note maturity and 6.50% 2017 redemption
CREDIT SUISSE ENERGY SUMMIT - FEBRUARY 2017

24
HEDGING POSITION
(1) As of 2/6/16, using midpoints of total production from 2/14/2017 Outlook
Oil 2017 (1)
68%
Swaps $50.19/bbl
Natural Gas 2017 (1)
71%
68%Swaps
3%Collars $3.00/$3.48/mcf
NYMEX
$3.07/mcfNYMEX
~120 bcf hedged in 2018 with swaps at an average price of $3.13~47 bcf hedged in 2018 with collars at an average price of $3.00/$3.25
NGL 2017 (1)
7%
Ethane Swaps $0.28/gal
CREDIT SUISSE ENERGY SUMMIT - FEBRUARY 2017
25
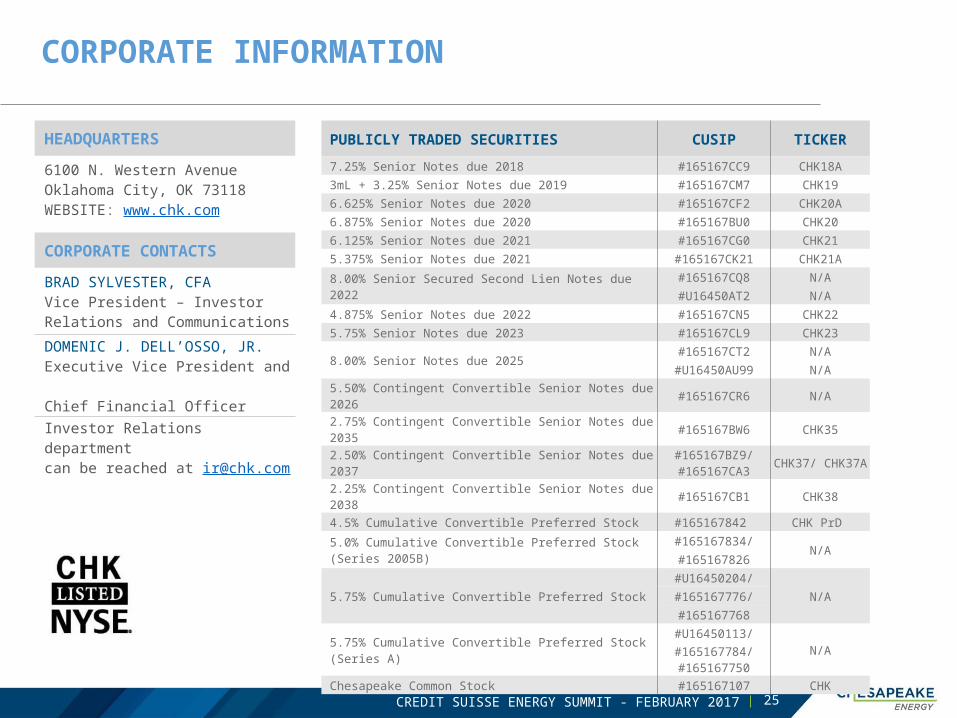
CORPORATE INFORMATION
HEADQUARTERS
6100 N. Western AvenueOklahoma City, OK 73118WEBSITE: www.chk.com
CORPORATE CONTACTS
BRAD SYLVESTER, CFAVice President – Investor Relations and Communications
DOMENIC J. DELL’OSSO, JR. Executive Vice President and Chief Financial Officer
Investor Relations department can be reached at [email protected]
PUBLICLY TRADED SECURITIES CUSIP TICKER
7.25% Senior Notes due 2018 #165167CC9 CHK18A3mL + 3.25% Senior Notes due 2019 #165167CM7 CHK196.625% Senior Notes due 2020 #165167CF2 CHK20A6.875% Senior Notes due 2020 #165167BU0 CHK206.125% Senior Notes due 2021 #165167CG0 CHK215.375% Senior Notes due 2021 #165167CK21 CHK21A
8.00% Senior Secured Second Lien Notes due 2022#165167CQ8 N/A#U16450AT2 N/A
4.875% Senior Notes due 2022 #165167CN5 CHK225.75% Senior Notes due 2023 #165167CL9 CHK23
8.00% Senior Notes due 2025#165167CT2 N/A
#U16450AU99 N/A5.50% Contingent Convertible Senior Notes due 2026 #165167CR6 N/A2.75% Contingent Convertible Senior Notes due 2035 #165167BW6 CHK35
2.50% Contingent Convertible Senior Notes due 2037 #165167BZ9/ #165167CA3 CHK37/ CHK37A
2.25% Contingent Convertible Senior Notes due 2038 #165167CB1 CHK384.5% Cumulative Convertible Preferred Stock #165167842 CHK PrD
5.0% Cumulative Convertible Preferred Stock (Series 2005B)#165167834/
N/A#165167826
5.75% Cumulative Convertible Preferred Stock#U16450204/
N/A#165167776/#165167768
5.75% Cumulative Convertible Preferred Stock (Series A)#U16450113/
N/A#165167784/ #165167750
Chesapeake Common Stock #165167107 CHK
CREDIT SUISSE ENERGY SUMMIT - FEBRUARY 2017


