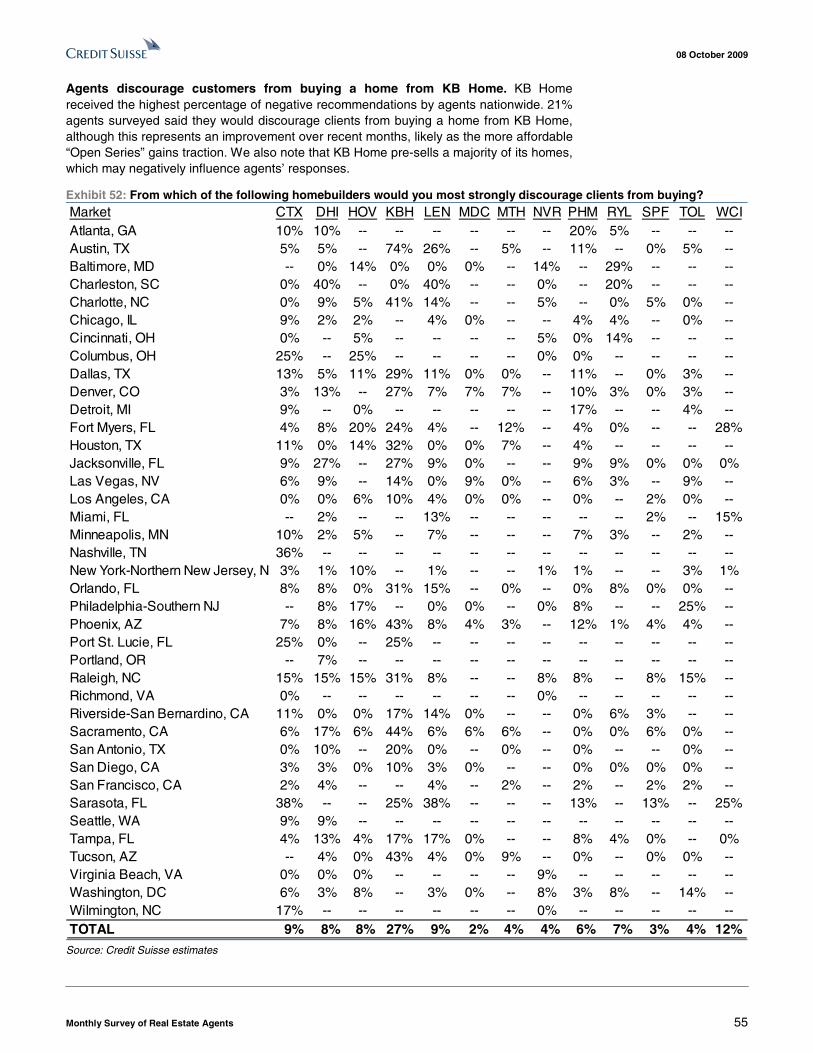
DISCLOSURE APPENDIX CONTAINS IMPORTANT DISCLOSURES, ANALYST CERTIFICATIONS, INFORMATION ON TRADE ALERTS, ANALYST MODEL PORTFOLIOS AND THE STATUS OF NON-U.S ANALYSTS. FOR OTHER IMPORTANT DISCLOSURES, visit www.credit-suisse.com/ researchdisclosures or call +1 (877) 291-2683. U.S. Disclosure: Credit Suisse does and seeks to do business with companies covered in its research reports. As a result, investors should be aware that the Firm may have a conflict of interest that could affect the objectivity of this report. Investors should consider this report as only a single factor in making their investment decision. 08 October 2009 Americas/United States Equity Research Homebuilding / MARKET WEIGHT Monthly Survey of Real Estate Agents CHANNEL CHECK The Flurry before the Lull First-time buyers rush to take advantage of the tax credit; expecting slowdown in October. Our September survey of real estate agents showed a slight increase in traffic (our buyer traffic index increased to 44.8 in September, from 44.5 in August). We think this was nearly completely tied to first-time buyers attempting to purchase a home before the expiration of the first-time buyer tax credit on November 30th. We now have significantly greater concern that this tax credit has pulled forward demand and that we will likely see a lull in buyer traffic over the next several months and leads us to expect risk to homebuilding stocks in the near-term. Traffic from mid-October onward will be crucial. We think that traffic trends from mid-October onward will likely indicate if demand will continue at current levels after the tax credit expires, or if demand has been pulled forward. We saw a sharp decline in low-end new home traffic in September, as buyers of to-be-built homes needed to start the purchase process before September in order to close on the home prior to the end of November. With existing homes, it was feasible to sign a contract through September (and possibly early October) and to still have the closing before the end of November. Thus, we think that it will be crucial to see what happens to existing home traffic from mid-October onward, as it will then generally be too late for a buyer of an existing home to take advantage of the tax credit. Tax credit likely to be extended, but traffic will still suffer. We see a significant chance that the tax credit will be extended, but even so, we think that demand will fall off, as we do not think that consumers assumed that the credit would be extended so that most first-time buyers contemplating a purchase planned so that closing could occur prior to November 30th. Markets with strong traffic levels broaden out due to first-time buyers. Our survey pointed to the highest levels of traffic in Ft Myers, Seattle, Los Angeles, Orlando, Washington, D.C., Minneapolis, and Las Vegas. Several of these markets (Ft Myers, Los Angeles, Orlando, Washington, D.C., and Las Vegas) are repeats from past months based on the tremendous affordability resulting from the sharp home price declines, but others (Seattle and Minneapolis) saw strong demand, as the first-time buyer tax credit increased the activity. Research Analysts Daniel Oppenheim, CFA 212 325 5726 [email protected]Michael Dahl 212 325 5882 [email protected]
Transcript
DISCLOSURE APPENDIX CONTAINS IMPORTANT DISCLOSURES, ANALYST CERTIFICATIONS, INFORMATION ON TRADE ALERTS, ANALYST MODEL PORTFOLIOS AND THE STATUS OF NON-U.S ANALYSTS. FOR OTHER IMPORTANT DISCLOSURES, visit www.credit-suisse.com/ researchdisclosures or call +1 (877) 291-2683. U.S. Disclosure: Credit Suisse does and seeks to do business with companies covered in its research reports. As a result, investors should be aware that the Firm may have a conflict of interest that could affect the objectivity of this report. Investors should consider this report as only a single factor in making their investment decision.
08 October 2009Americas/United States
Equity ResearchHomebuilding / MARKET WEIGHT
Monthly Survey of Real Estate Agents
CHANNEL CHECK
The Flurry before the Lull ■ First-time buyers rush to take advantage of the tax credit; expecting
slowdown in October. Our September survey of real estate agents showed a slight increase in traffic (our buyer traffic index increased to 44.8 in September, from 44.5 in August). We think this was nearly completely tied to first-time buyers attempting to purchase a home before the expiration of the first-time buyer tax credit on November 30th. We now have significantly greater concern that this tax credit has pulled forward demand and that we will likely see a lull in buyer traffic over the next several months and leads us to expect risk to homebuilding stocks in the near-term.
■ Traffic from mid-October onward will be crucial. We think that traffic trends from mid-October onward will likely indicate if demand will continue at current levels after the tax credit expires, or if demand has been pulled forward. We saw a sharp decline in low-end new home traffic in September, as buyers of to-be-built homes needed to start the purchase process before September in order to close on the home prior to the end of November. With existing homes, it was feasible to sign a contract through September (and possibly early October) and to still have the closing before the end of November. Thus, we think that it will be crucial to see what happens to existing home traffic from mid-October onward, as it will then generally be too late for a buyer of an existing home to take advantage of the tax credit.
■ Tax credit likely to be extended, but traffic will still suffer. We see a significant chance that the tax credit will be extended, but even so, we think that demand will fall off, as we do not think that consumers assumed that the credit would be extended so that most first-time buyers contemplating a purchase planned so that closing could occur prior to November 30th.
■ Markets with strong traffic levels broaden out due to first-time buyers. Our survey pointed to the highest levels of traffic in Ft Myers, Seattle, Los Angeles, Orlando, Washington, D.C., Minneapolis, and Las Vegas. Several of these markets (Ft Myers, Los Angeles, Orlando, Washington, D.C., and Las Vegas) are repeats from past months based on the tremendous affordability resulting from the sharp home price declines, but others (Seattle and Minneapolis) saw strong demand, as the first-time buyer tax credit increased the activity.
Table of Contents Overview of Results………………………………..…..3
Survey Methodology…………………………………...5
Top 20 Housing Markets Atlanta, Georgia 7 Austin, Texas 8 Charlotte, North Carolina 9 Chicago, Illinois 10 Dallas, Texas 11 Denver, Colorado 12 Fort Myers, Florida 13 Houston, Texas 14 Jacksonville, Florida 15 Las Vegas, Nevada 16 Los Angeles, California 17 Miami, Florida 18 Minneapolis, Minnesota 19 New York-Northern New Jersey 20 Orlando, Florida 21 Phoenix, Arizona 22 Riverside-San Bernardino [Inland Empire], California 23 Seattle, Washington 24 Tampa, Florida 25 Washington, D.C. 26
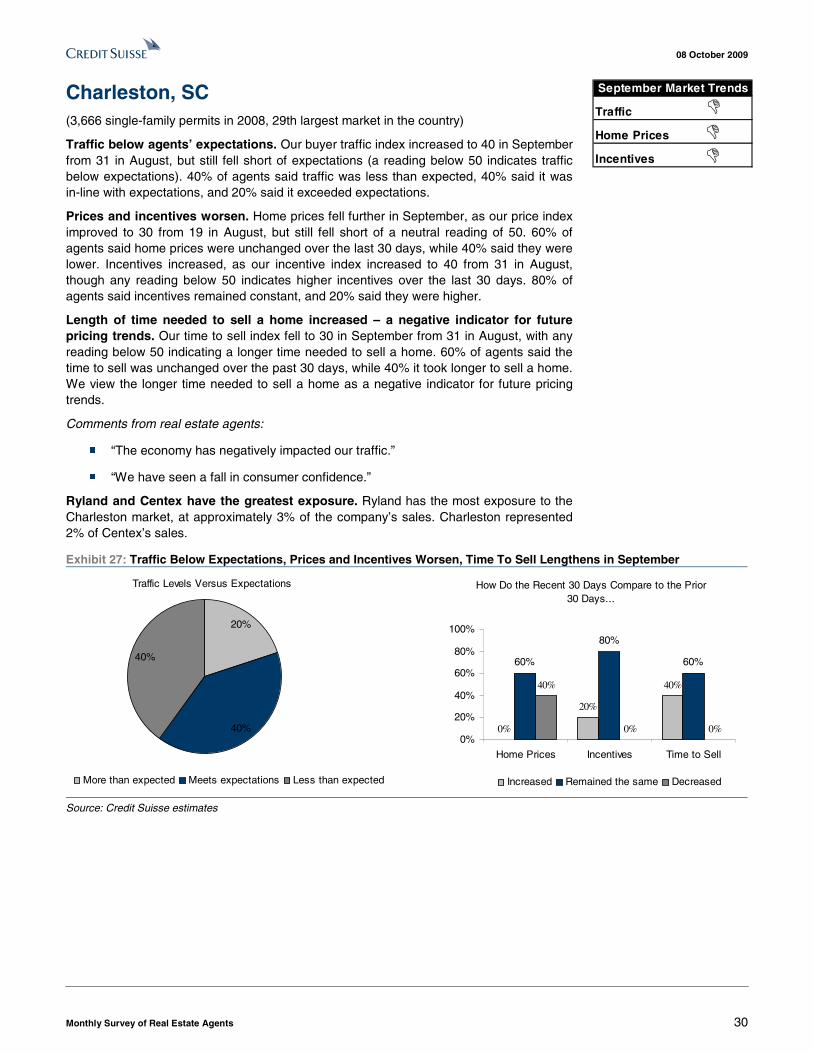
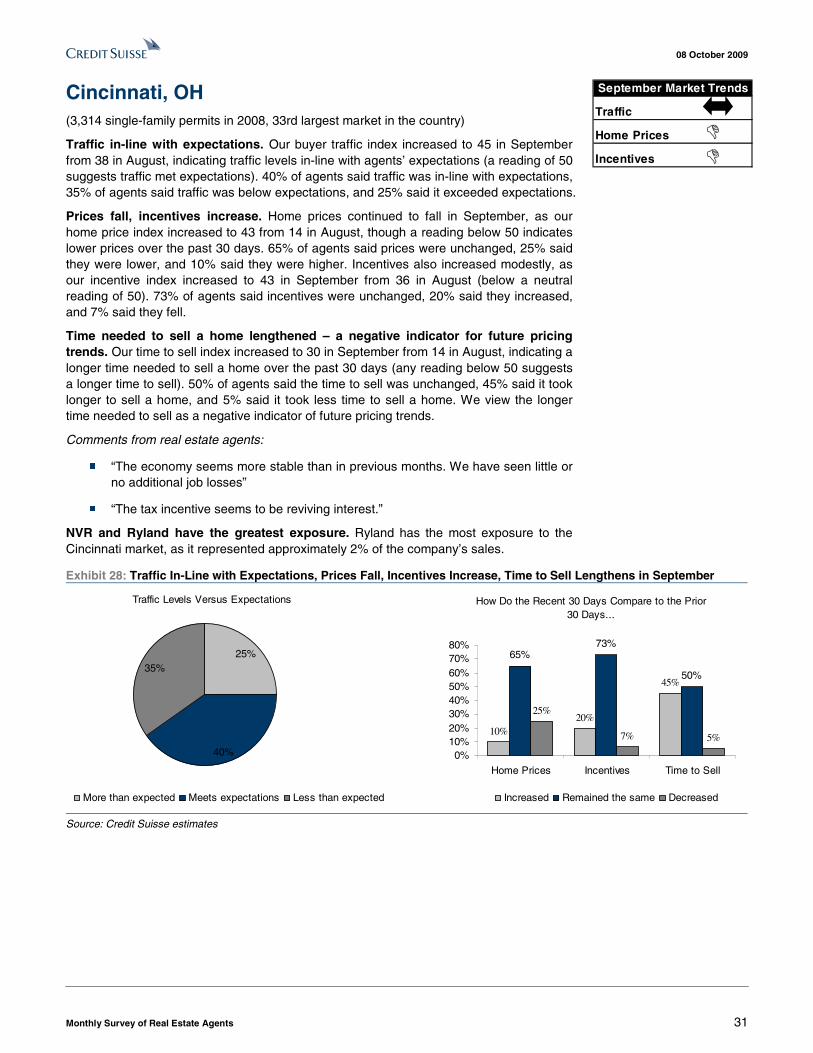
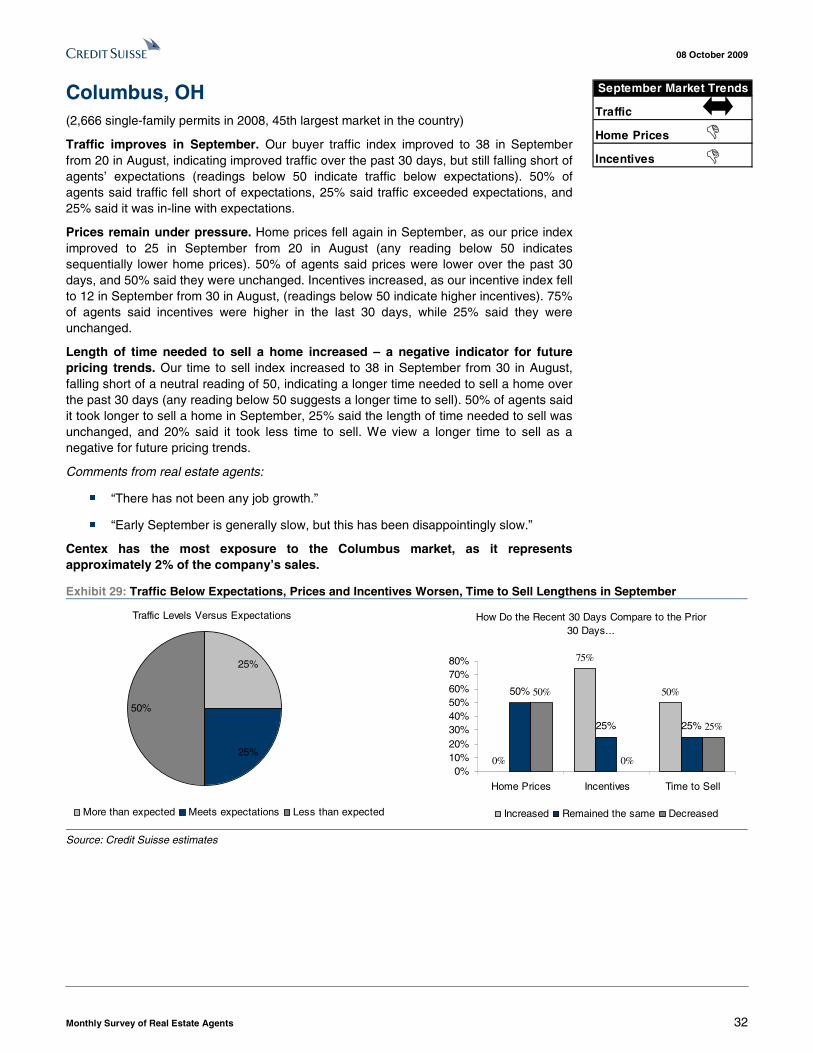
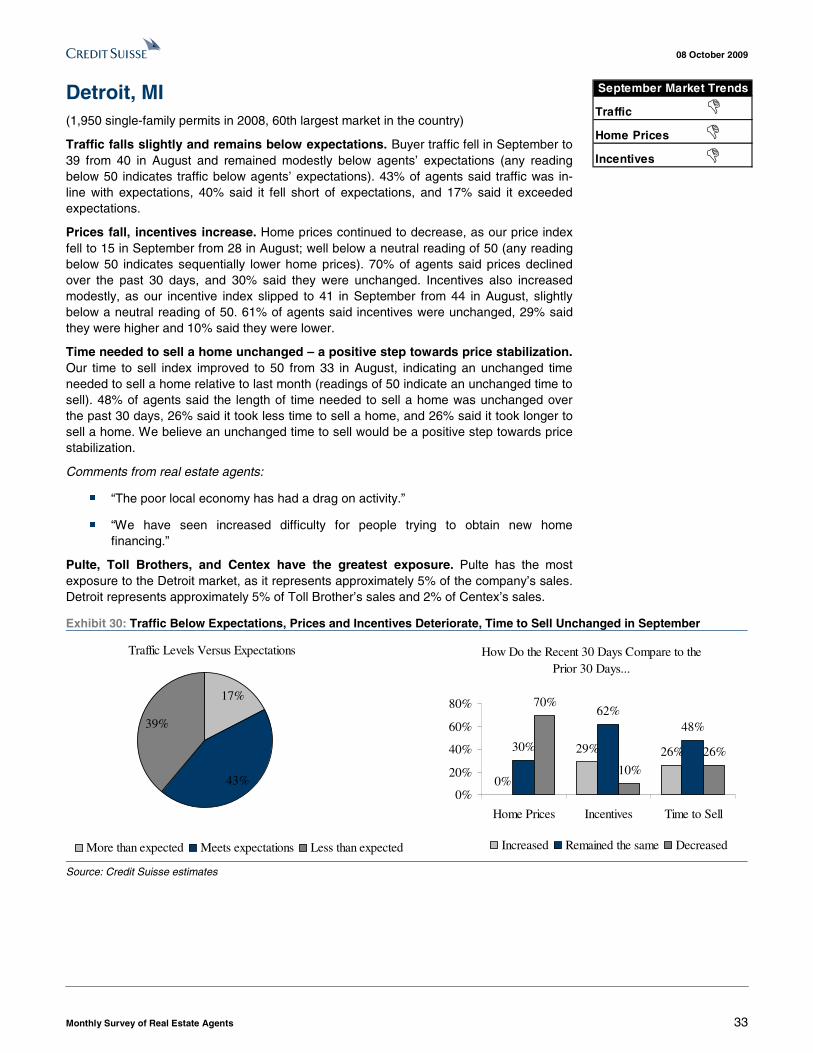
Additional Key Housing Markets…………………… 27 Baltimore, Maryland 28 Boston, Massachusetts 29 Charleston, South Carolina 30 Cincinnati, Ohio 31 Columbus, Ohio 32 Detroit, Michigan 33 Nashville, Tennessee 34 Philadelphia-Southern New Jersey 35 Port St. Lucie, Florida 36 Portland, Oregon 37 Raleigh, North Carolina 38 Richmond, Virginia 39 Sacramento, California 40 San Antonio, Texas 41 San Diego, California 42 San Francisco, California 43 Sarasota, Florida 44 Tucson, Arizona 45 Virginia Beach, Virginia 46 Wilmington, North Carolina 47
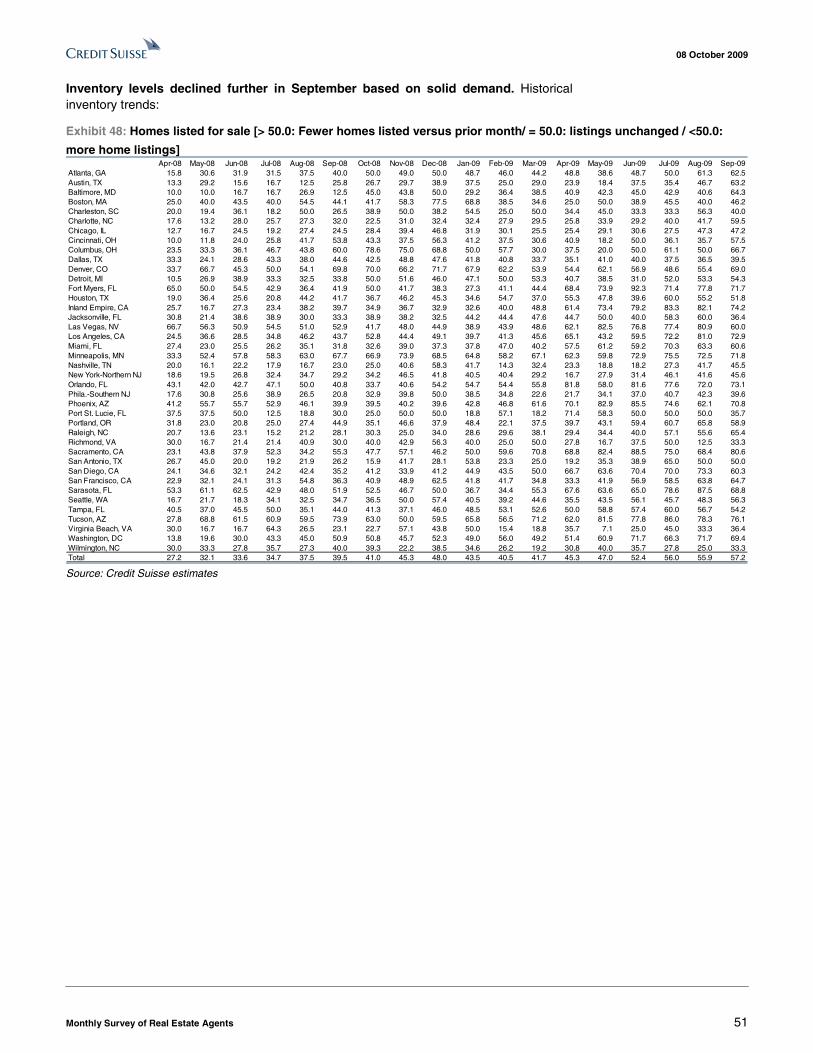
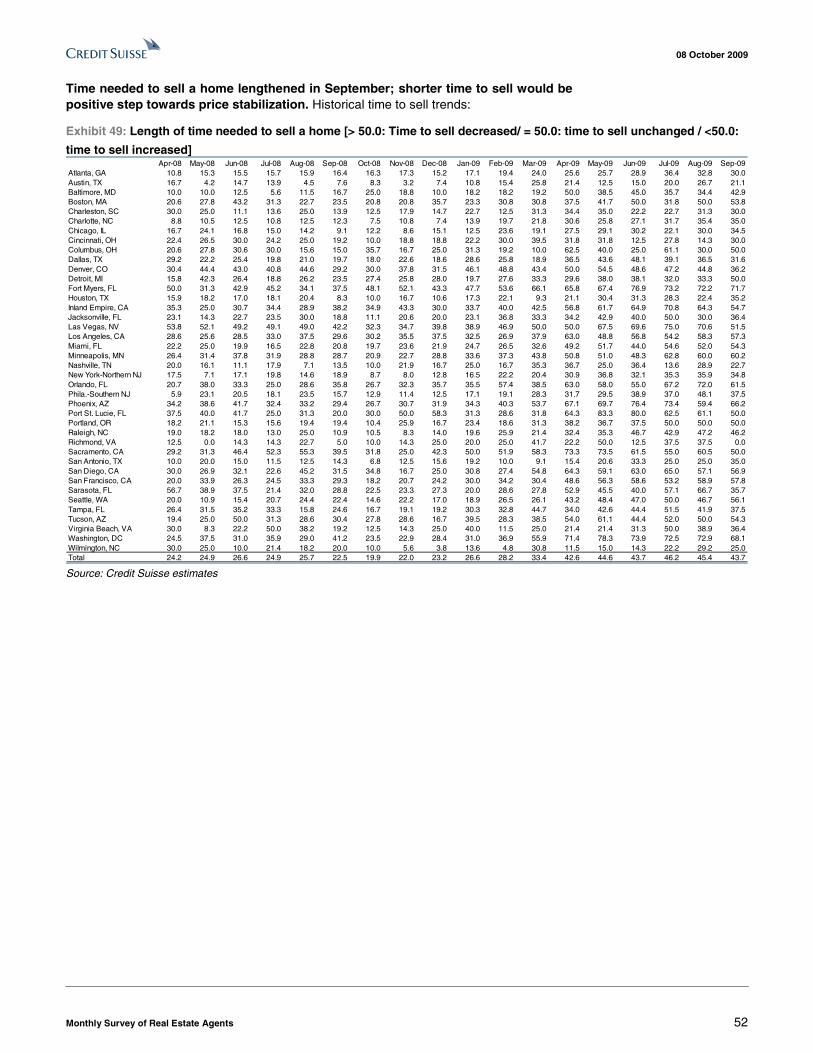
Historical Survey Trends by Market……………… 48
*Markets are characterized based on permit activity and listed in Alphabetical order
08 October 2009
Monthly Survey of Real Estate Agents 3
The Flurry before the Lull For those who may be unfamiliar with our survey, we center our indices around 50 so that readings above 50 indicate positive or improving trends and readings below 50 indicate negative or worsening trends. Please see page 5 for a full description of our survey methodology.
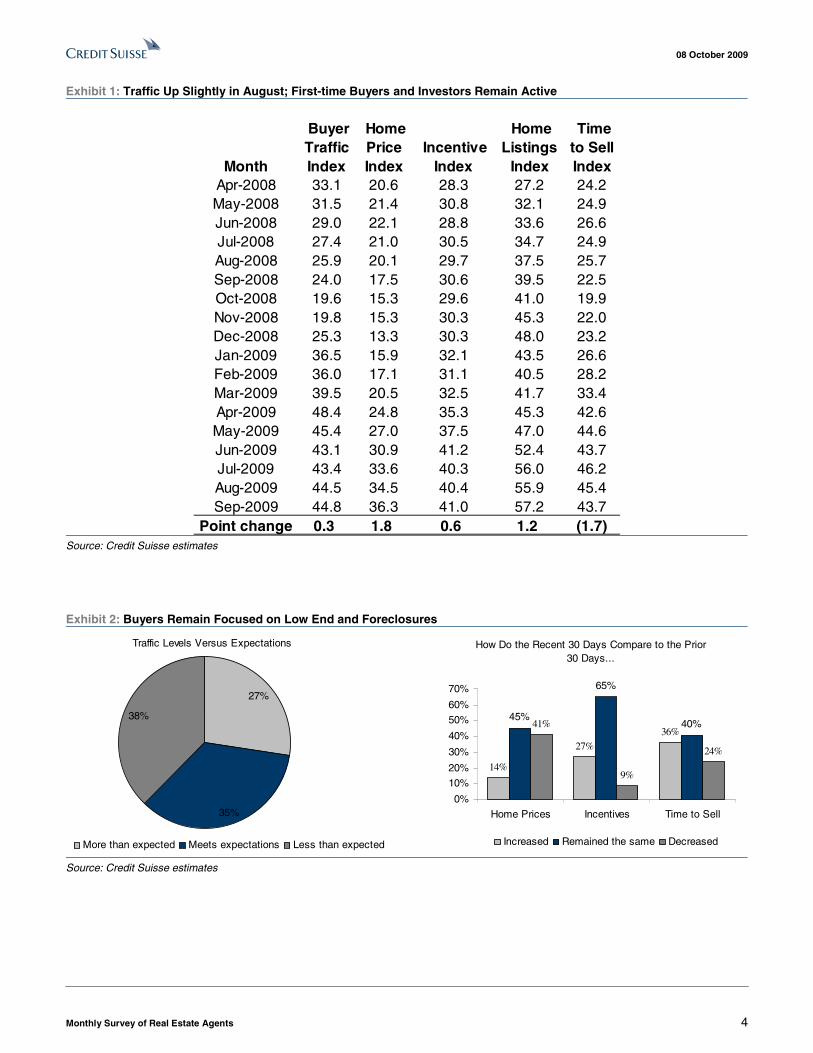
First-time buyers rush to take advantage of the tax credit; expecting slowdown in October. Our September survey of real estate agents showed a slight increase in traffic (our buyer traffic index increased to 44.8 in September, from 44.5 in August). We think this was nearly completely tied to first-time buyers attempting to purchase a home before the expiration of the first-time buyer tax credit on November 30th. We now have significantly greater concern that this tax credit has pulled forward demand and that we will likely see a lull in buyer traffic over the next several months and leads us to expect risk to homebuilding stocks in the near-term.
Traffic from mid-October onward will be crucial. We think that traffic trends from mid-October onward will likely indicate if demand will continue at current levels after the tax credit expires, or if demand has been pulled forward. We saw a sharp decline in low-end new home traffic in September, as buyers of to-be-built homes needed to start the purchase process before September in order to close on the home prior to the end of November. With existing homes, it was feasible to sign a contract through September (and possibly early October) and to still have the closing before the end of November. Thus, we think that it will be crucial to see what happens to existing home traffic from mid-October onward, as it will then generally be too late for a buyer of an existing home to take advantage of the tax credit.
Tax credit likely to be extended, but traffic will still suffer. We see a significant chance that the tax credit will be extended, but even so, we think that demand will fall off, as we do not think that consumers assumed that the credit would be extended so that most first-time buyers contemplating a purchase planned so that closing could occur prior to November 30th.
Markets with strong traffic levels broaden out as first-time buyers are active. Our survey pointed to the highest levels of traffic in Ft Myers, Seattle, Los Angeles, Orlando, Washington, D.C., Minneapolis, and Las Vegas. Several of these markets are repeats from past months based on the tremendous affordability resulting from the sharp home price declines, but others saw strong traffic, as the first-time buyer tax credit increased the activity.
Price stabilization at low end of the market, but will it last? Our price index moved slightly higher in September to 36.3, from 34.5 in August. We heard of the best pricing trends on low-end homes, likely due to the strength of the first-time buyer market and interest from investors. Agents indicated rising prices over the past 30 days in Ft Myers, the Inland Empire, Los Angeles, Phoenix, San Diego, San Francisco, and Washington, D.C. However, this price improvement may fall back should buyer traffic fall off (as expected following the end of the tax credit).
08 October 2009
Monthly Survey of Real Estate Agents 4
Exhibit 1: Traffic Up Slightly in August; First-time Buyers and Investors Remain Active
Exhibit 2: Buyers Remain Focused on Low End and Foreclosures
Traffic Levels Versus Expectations
35%
38%
27%
More than expected Meets expectations Less than expected
How Do the Recent 30 Days Compare to the Prior 30 Days...
14%
27%36%
45%
65%
40%41%
9%
24%
0%
10%
20%
30%
40%
50%
60%
70%
Home Prices Incentives Time to Sell
Increased Remained the same Decreased
Source: Credit Suisse estimates
08 October 2009
Monthly Survey of Real Estate Agents 5
Survey Methodology We survey real estate agents, as we believe that agents will provide an accurate assessment of housing market trends in both the new and existing home markets. Even though homebuilders sell new homes, we believe that it is crucial to have an understanding of the existing home market as the existing home market is substantially larger than the new home market (approximately 85%/15%) and trends in the existing home market dictate trends in the new home market.
Each month we ask five main questions, which are all listed below. In September, we received responses from 1,500 real estate agents across the country. We then review these responses and calculate an index for each of the questions with high numbers indicating positive or improving trends and low numbers indicating negative or worsening trends. An index of 50 would indicate a neutral trend. Note that for items such as incentives, a low index level would indicate a higher level of incentives, as higher incentives represent a negative trend. Similarly, for the number of listings and the length of time needed to sell a house, an increase in listings (a negative trend) and an increase in the time needed to sell a house (a negative trend) both correspond to low index values.
1) Are traffic levels in-line with, above, or below your expectations for this time of year? (Because of seasonality to traffic trends – generally more traffic in Spring and less in Fall/Winter – we ask about traffic relative to the expectations for this time of year rather than how traffic compared to the prior month.) A traffic index above 50 means that traffic was above the expectations of agents, a traffic index of 50 means that traffic was in-line with expectations, and a traffic index below 50 means that traffic was below expectations.
2) Have prices remained the same, increased, or decreased over the past 30 days? A price index above 50 indicates that prices increased over the past 30 days, a price index of 50 indicates that prices were flat, and a price index below 50 indicates that prices decreased.
3) Have incentives remained the same, increased, or decreased over the past 30 days? An incentive index above 50 indicates that incentives decreased over the past 30 days, an incentive index of 50 indicates that incentives were unchanged, and an incentive index below 50 indicates that incentives increased.
4) Do you see the same, more, or fewer, listings as compared with 30 days ago? An inventory (listings) index above 50 indicates that the inventory of homes for sale decreased over the past 30 days, an inventory index of 50 indicates that inventories were unchanged, and an inventory index below 50 indicates that inventories increased.
5) Does it take the same, more, or less time to sell a house? A time to sell index above 50 indicates that the time needed to sell a home decreased over the past 30 days, a time to sell index of 50 indicates that the time needed to sell a home was unchanged, and a time to sell index below 50 indicates that the time needed to sell a home increased.
08 October 2009
Monthly Survey of Real Estate Agents 6
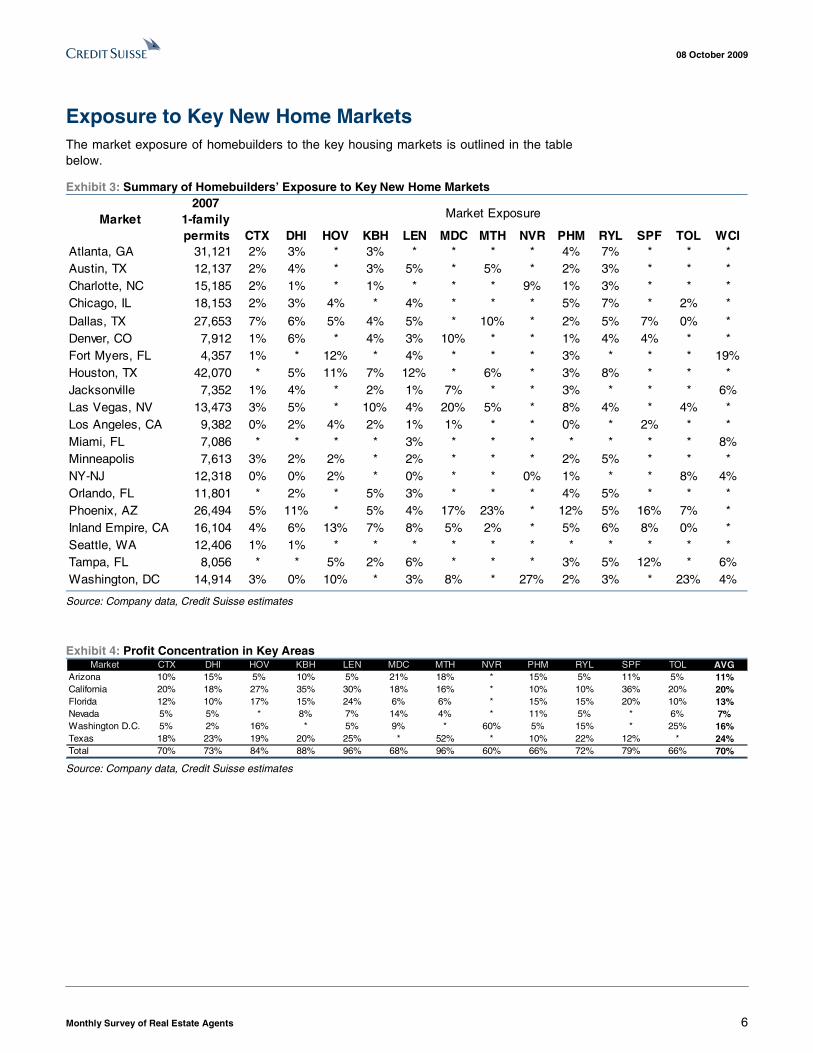
Exposure to Key New Home Markets The market exposure of homebuilders to the key housing markets is outlined in the table below.
Exhibit 3: Summary of Homebuilders’ Exposure to Key New Home Markets
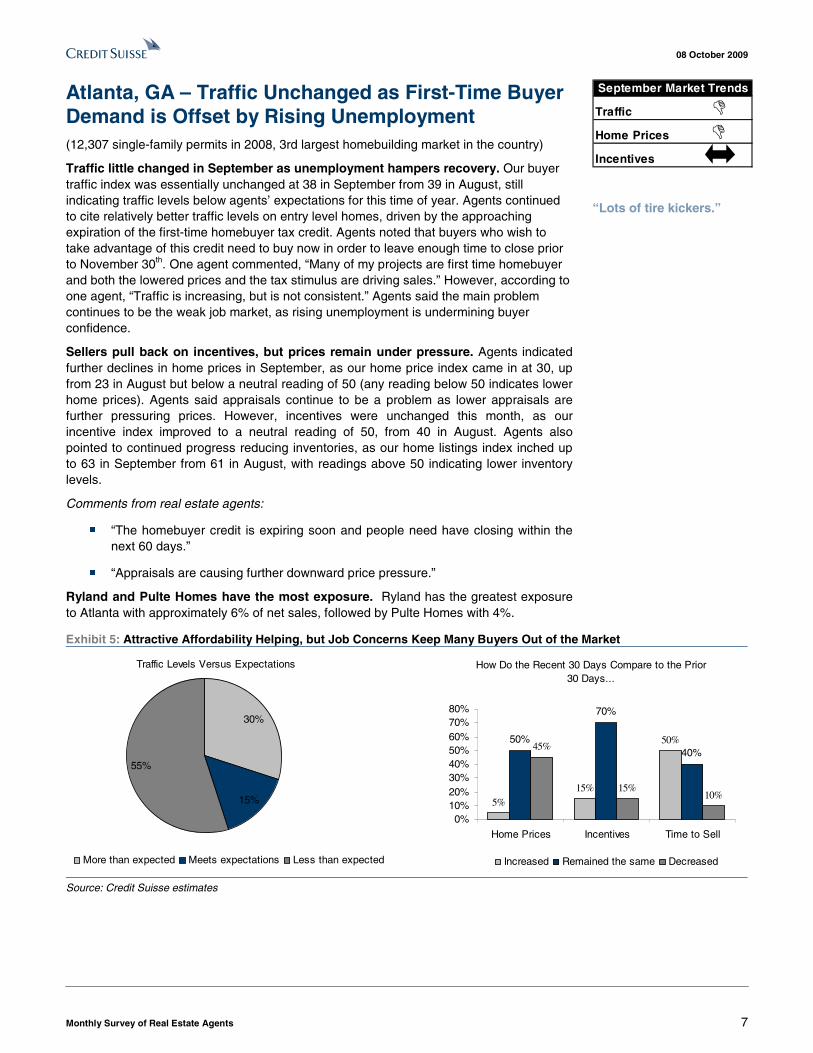
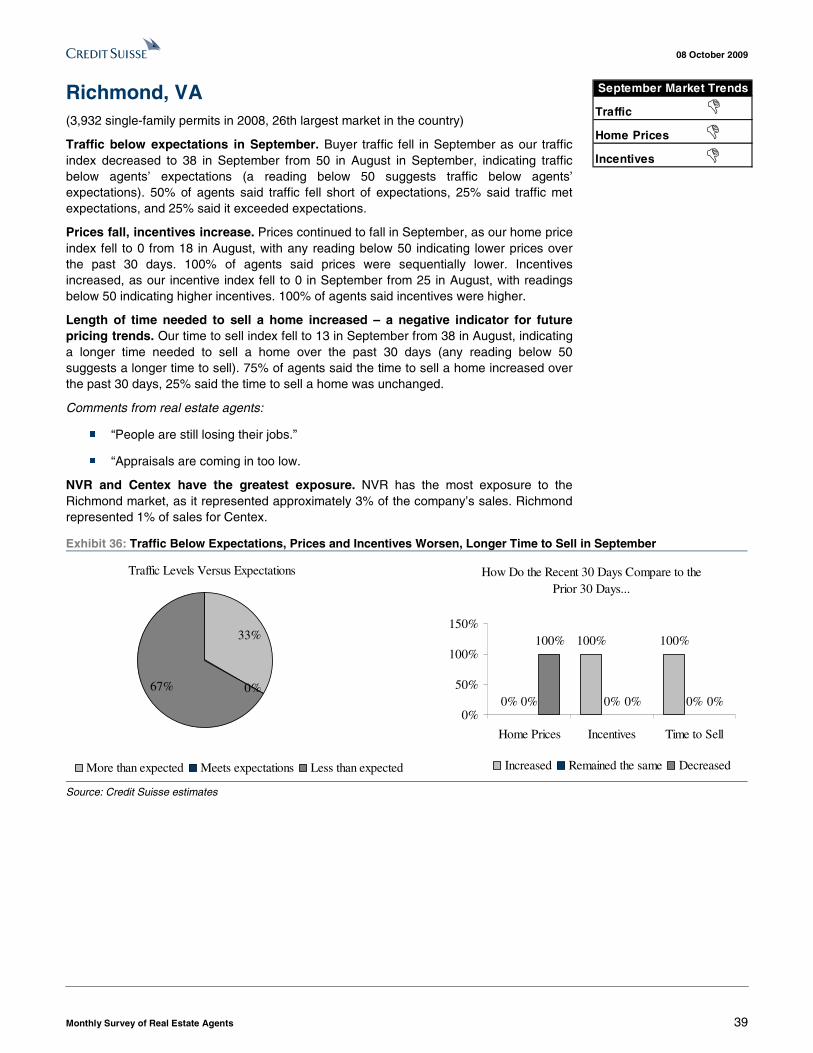
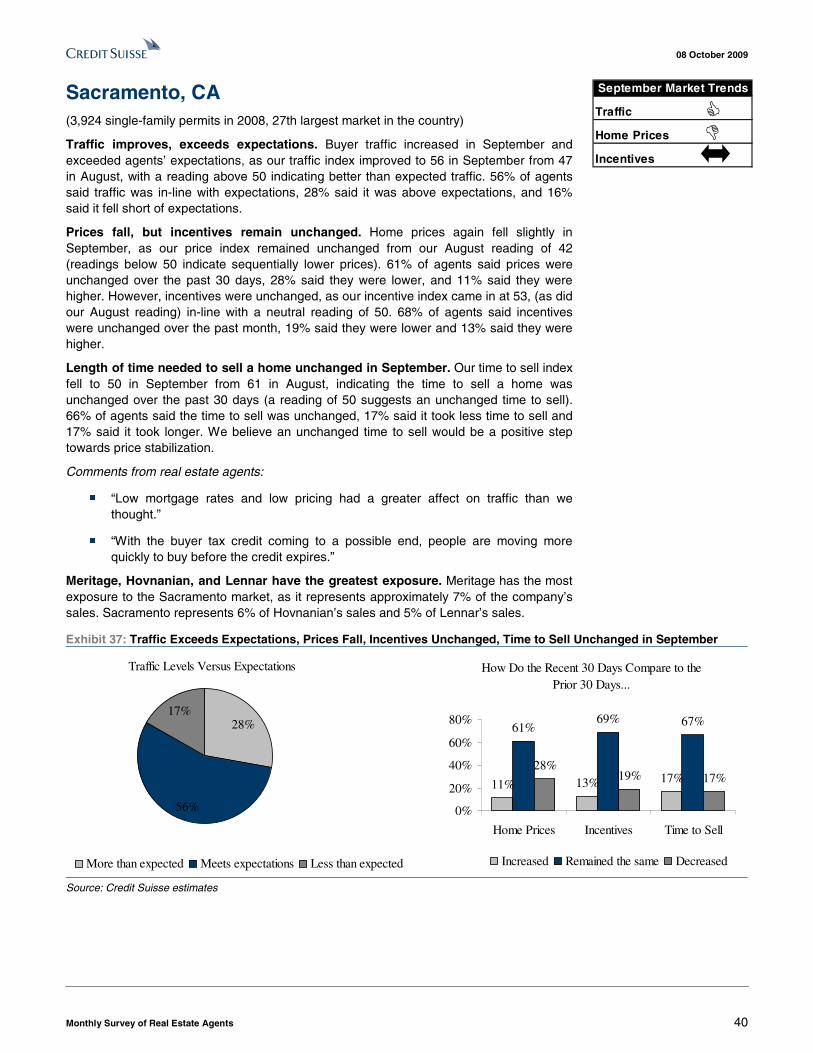
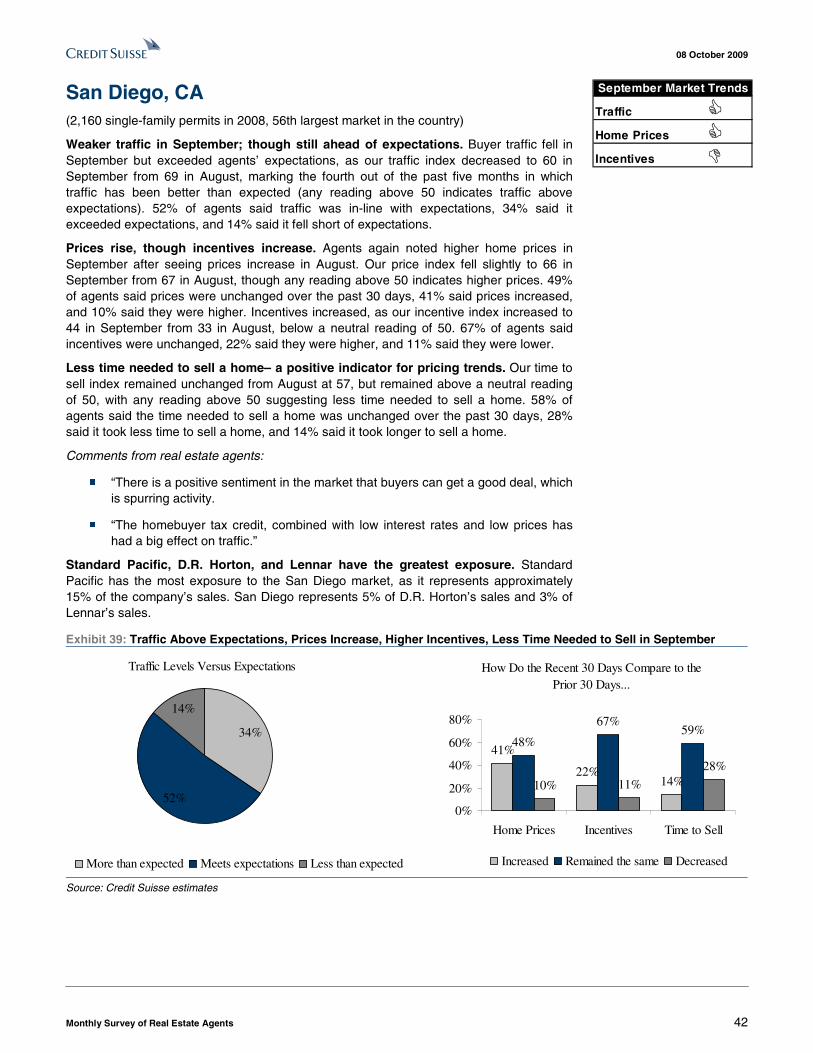
Atlanta, GA – Traffic Unchanged as First-Time Buyer Demand is Offset by Rising Unemployment (12,307 single-family permits in 2008, 3rd largest homebuilding market in the country)
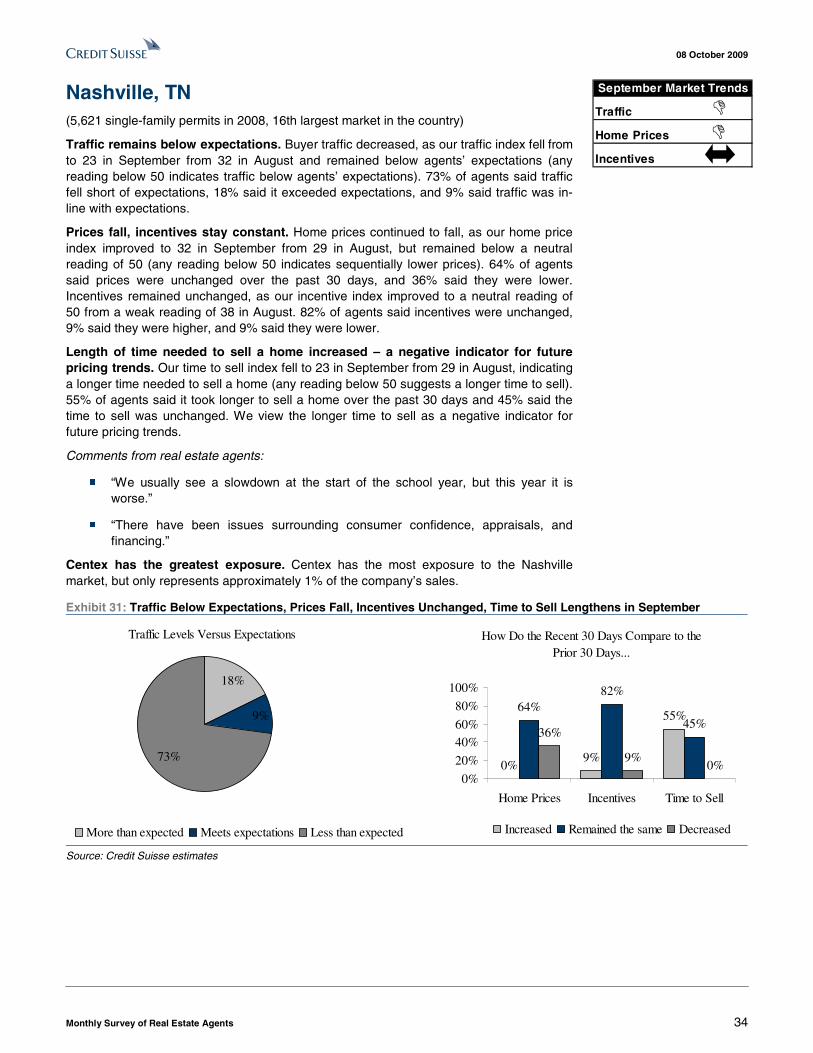
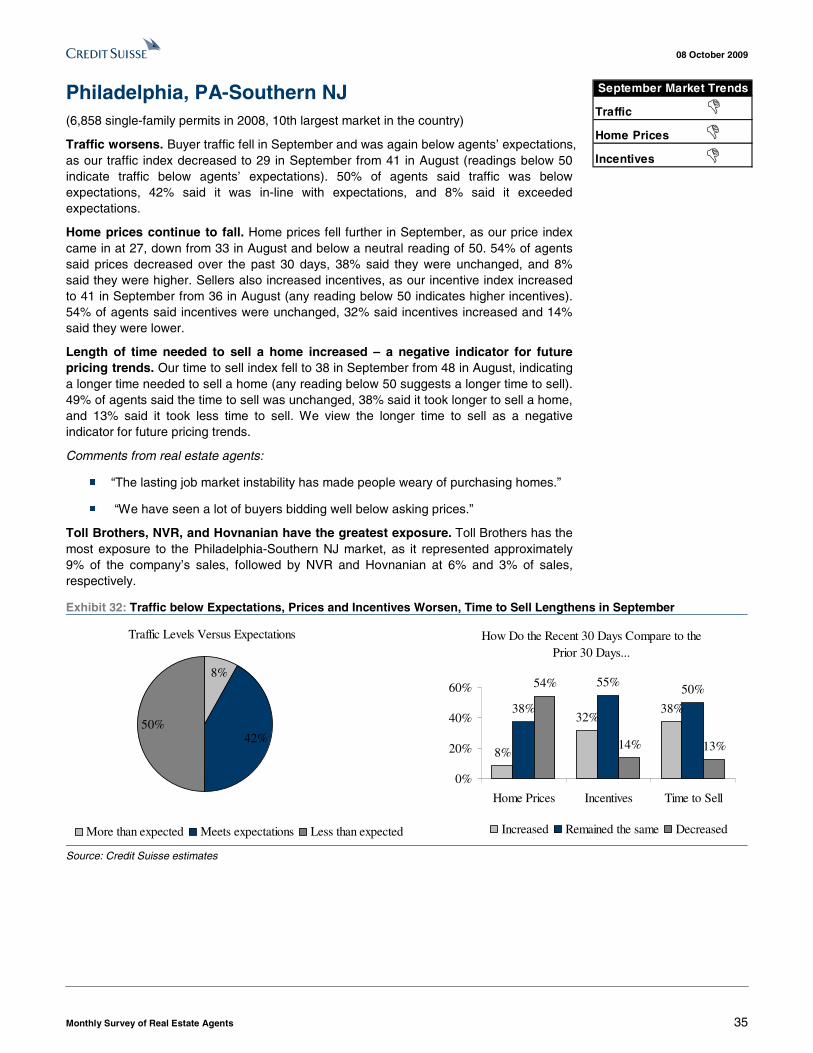
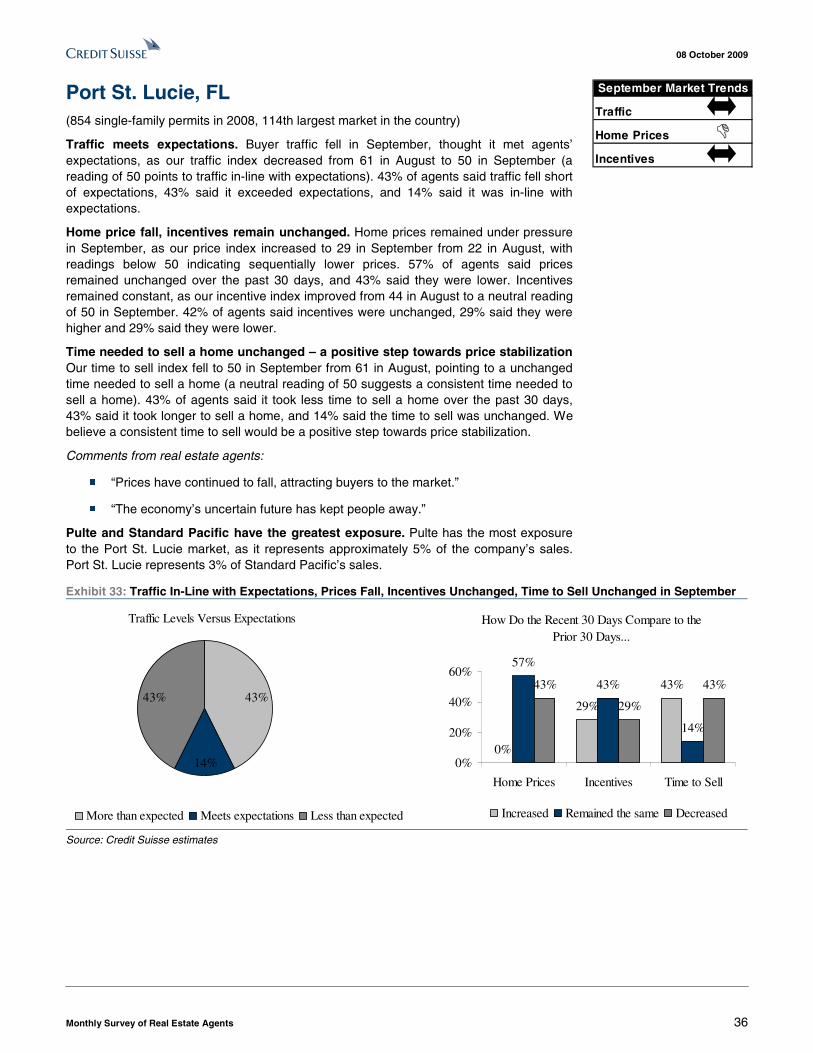
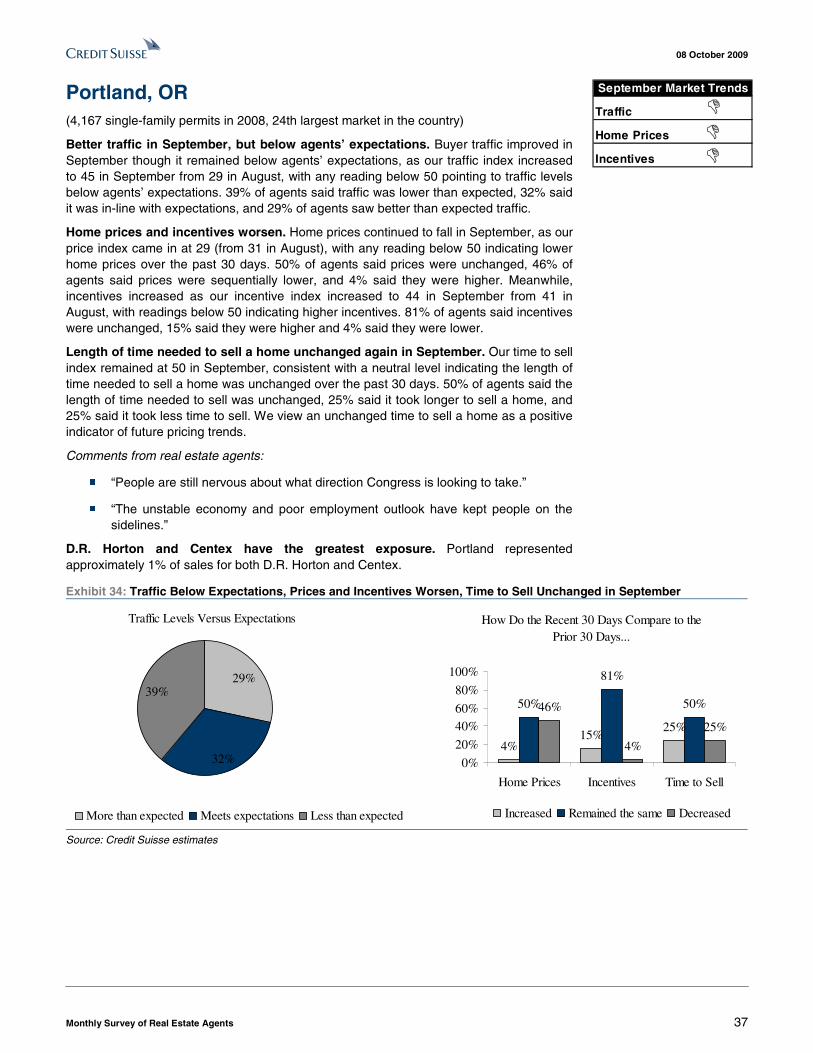
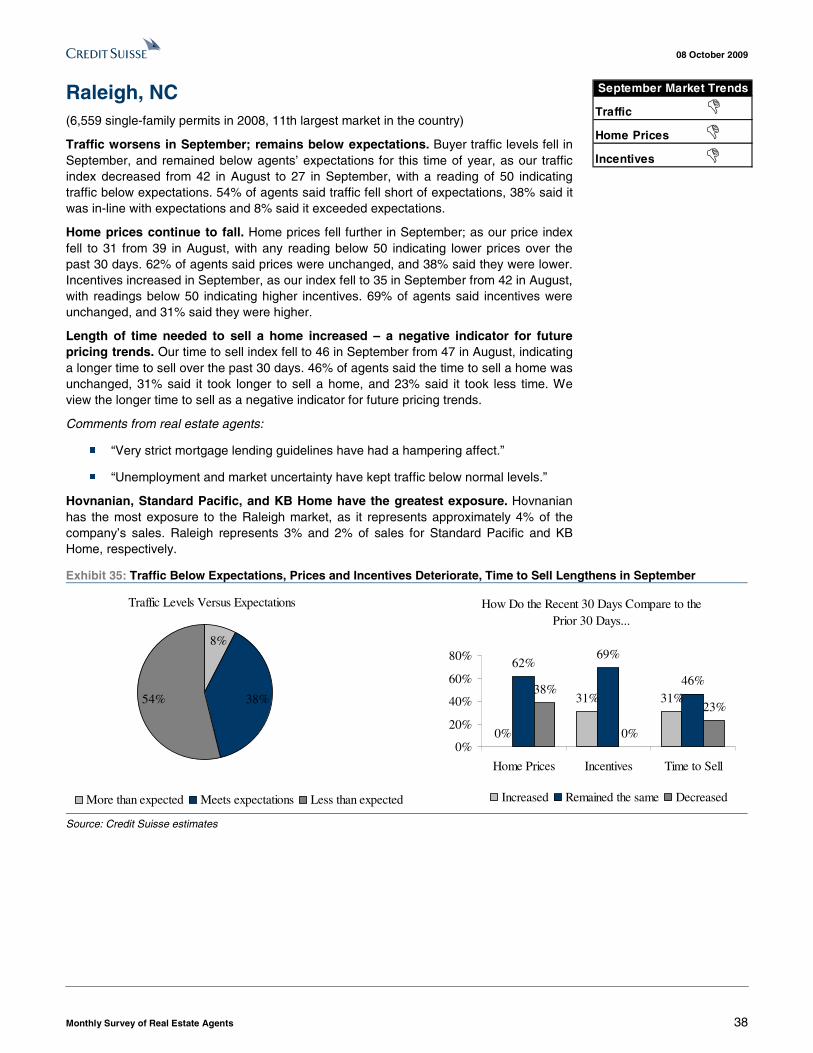
Traffic little changed in September as unemployment hampers recovery. Our buyer traffic index was essentially unchanged at 38 in September from 39 in August, still indicating traffic levels below agents’ expectations for this time of year. Agents continued to cite relatively better traffic levels on entry level homes, driven by the approaching expiration of the first-time homebuyer tax credit. Agents noted that buyers who wish to take advantage of this credit need to buy now in order to leave enough time to close prior to November 30th. One agent commented, “Many of my projects are first time homebuyer and both the lowered prices and the tax stimulus are driving sales.” However, according to one agent, “Traffic is increasing, but is not consistent.” Agents said the main problem continues to be the weak job market, as rising unemployment is undermining buyer confidence.
Sellers pull back on incentives, but prices remain under pressure. Agents indicated further declines in home prices in September, as our home price index came in at 30, up from 23 in August but below a neutral reading of 50 (any reading below 50 indicates lower home prices). Agents said appraisals continue to be a problem as lower appraisals are further pressuring prices. However, incentives were unchanged this month, as our incentive index improved to a neutral reading of 50, from 40 in August. Agents also pointed to continued progress reducing inventories, as our home listings index inched up to 63 in September from 61 in August, with readings above 50 indicating lower inventory levels.
Comments from real estate agents:
■ “The homebuyer credit is expiring soon and people need have closing within the next 60 days.”
■ “Appraisals are causing further downward price pressure.”
Ryland and Pulte Homes have the most exposure. Ryland has the greatest exposure to Atlanta with approximately 6% of net sales, followed by Pulte Homes with 4%.
Exhibit 5: Attractive Affordability Helping, but Job Concerns Keep Many Buyers Out of the Market
Traffic Levels Versus Expectations
15%
55%
30%
More than expected Meets expectations Less than expected
How Do the Recent 30 Days Compare to the Prior 30 Days...
5%15%
50%50%
70%
40%45%
15%10%
0%10%20%30%40%50%60%70%80%
Home Prices Incentives Time to Sell
Increased Remained the same Decreased
Source: Credit Suisse estimates
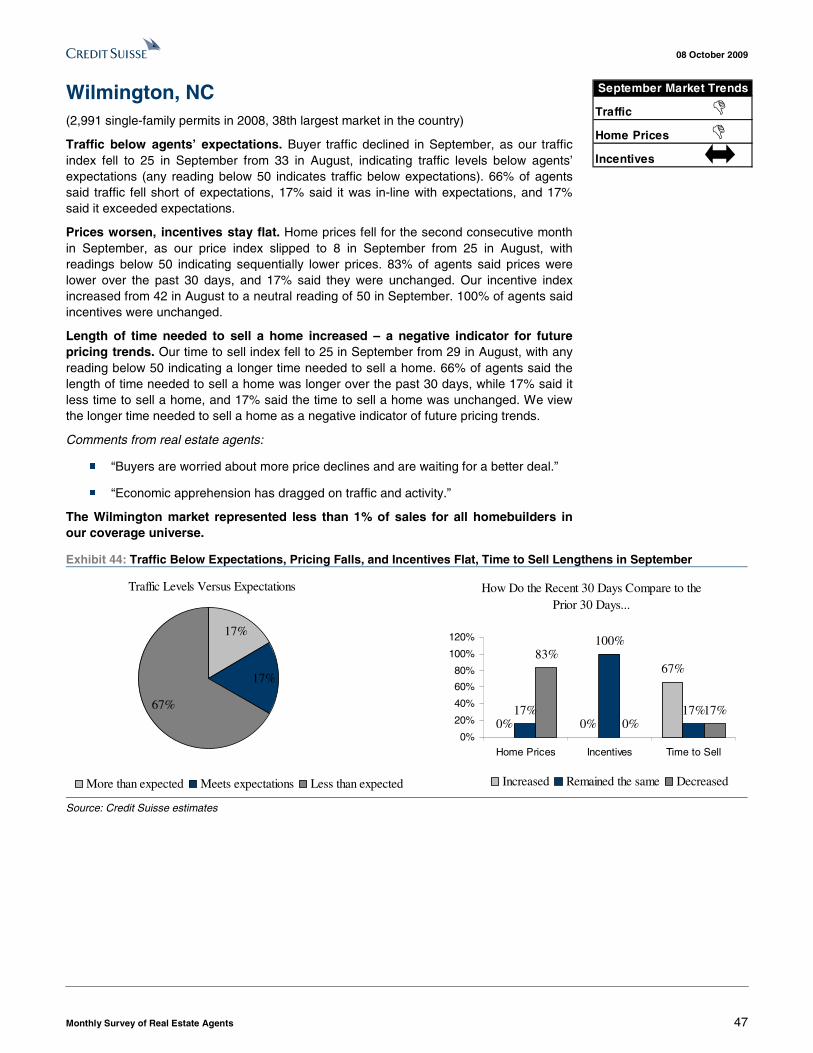
Traffic
Home Prices
Incentives
September Market Trends
!!
“Lots of tire kickers.”
08 October 2009
Monthly Survey of Real Estate Agents 8
Austin, TX – Traffic Improves as Lower Prices, End of Tax Credit Spur Demand (8,025 single-family permits in 2008, 7th largest market in the country)
Traffic improves as buyers look to purchase ahead of the tax credit expiration. Buyer traffic improved in September versus August, as our traffic index increased to 40 from 27, although this still indicates traffic modestly below agents’ expectations (a reading of 50 would suggest traffic in-line with expectations). Agents widely cited the upcoming expiration of the first-time homebuyer tax credit as the driving force behind better traffic levels as time is running out for buyers to sign contracts, secure financing and close by the end of November. Speaking of financing, agents continued to note challenges getting buyers qualified for loans, leading one agent to quip, “We are no longer in a buyer’s or seller’s market. We are experiencing a lender’s market.” Agents said the majority of loans they see done are still FHA-backed, and that the Home Valuation Code of Conduct appraisal standard continues to cause problems.
Prices fall as sellers look to entice buyers. Our home price index was little changed at 26 in September from 25 in August, similar to the index levels we’ve seen for much of this year and still indicating falling home prices (readings below 50 point to lower home prices over the past 30 days). Our sense is that prices remained under pressure as sellers looked to draw in buyers and offload inventory ahead of the tax credit expiration. Our home listings index suggests some success there, jumping to 63 in September from 47 in August and indicating sequentially lower inventory levels (readings above 50 indicate lower inventory). This is a positive step towards price stabilization.
Comments from real estate agents:
■ “While the high end market is dead, under $400k buyers are pretty active.”
■ “We’re seeing greater urgency due to the first-time buyer tax credit.”
Meritage and D.R. Horton have the most exposure. Meritage has the greatest exposure to Austin with approximately 7% of net sales, followed by D.R. Horton with 5%.
Exhibit 6: Prices Fell in September, but Lower Inventory Levels are a Positive Leading Indicator
Traffic Levels Versus Expectations
37%
21%
42%
More than expected Meets expectations Less than expected
How Do the Recent 30 Days Compare to the Prior 30 Days...
0%
37%
63%
53% 53%
32%
47%
11%5%
0%
10%
20%
30%
40%
50%
60%
70%
Home Prices Incentives Time to Sell
Increased Remained the same Decreased
Source: Credit Suisse estimates
Traffic
Home Prices
Incentives
September Market Trends
!!!
“People think we have hit bottom.”
08 October 2009
Monthly Survey of Real Estate Agents 9
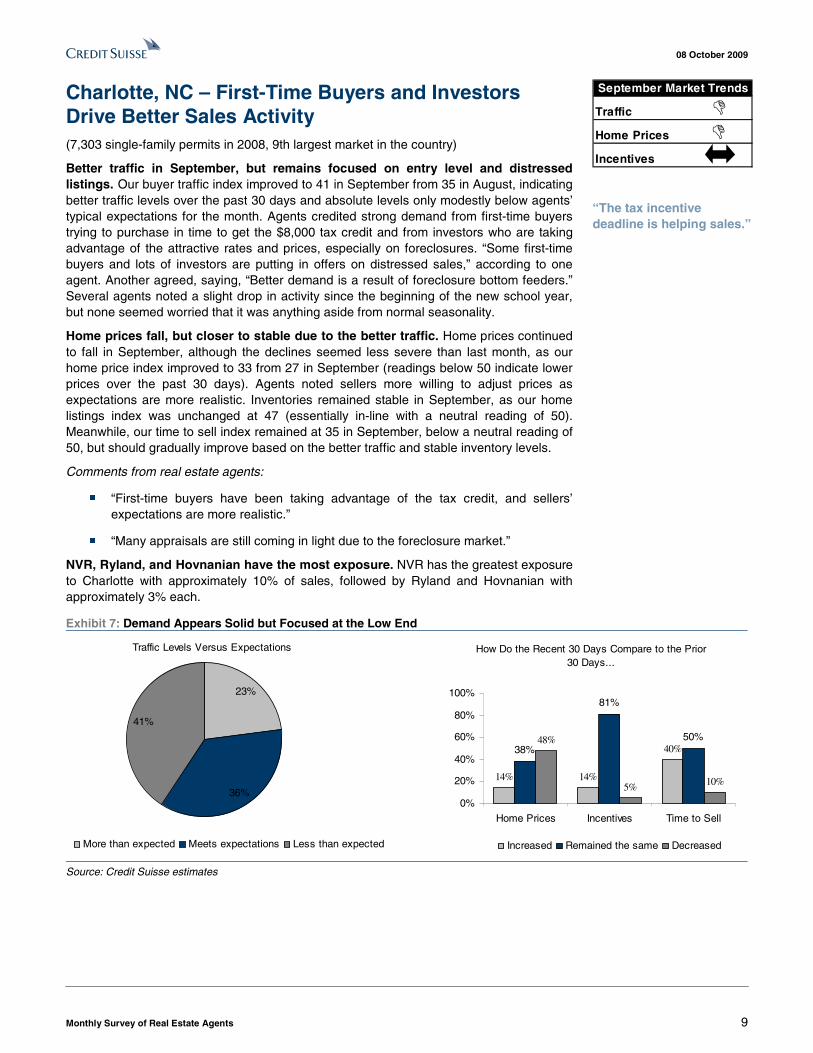
Charlotte, NC – First-Time Buyers and Investors Drive Better Sales Activity (7,303 single-family permits in 2008, 9th largest market in the country)
Better traffic in September, but remains focused on entry level and distressed listings. Our buyer traffic index improved to 41 in September from 35 in August, indicating better traffic levels over the past 30 days and absolute levels only modestly below agents’ typical expectations for the month. Agents credited strong demand from first-time buyers trying to purchase in time to get the $8,000 tax credit and from investors who are taking advantage of the attractive rates and prices, especially on foreclosures. “Some first-time buyers and lots of investors are putting in offers on distressed sales,” according to one agent. Another agreed, saying, “Better demand is a result of foreclosure bottom feeders.” Several agents noted a slight drop in activity since the beginning of the new school year, but none seemed worried that it was anything aside from normal seasonality.
Home prices fall, but closer to stable due to the better traffic. Home prices continued to fall in September, although the declines seemed less severe than last month, as our home price index improved to 33 from 27 in September (readings below 50 indicate lower prices over the past 30 days). Agents noted sellers more willing to adjust prices as expectations are more realistic. Inventories remained stable in September, as our home listings index was unchanged at 47 (essentially in-line with a neutral reading of 50). Meanwhile, our time to sell index remained at 35 in September, below a neutral reading of 50, but should gradually improve based on the better traffic and stable inventory levels.
Comments from real estate agents:
■ “First-time buyers have been taking advantage of the tax credit, and sellers’ expectations are more realistic.”
■ “Many appraisals are still coming in light due to the foreclosure market.”
NVR, Ryland, and Hovnanian have the most exposure. NVR has the greatest exposure to Charlotte with approximately 10% of sales, followed by Ryland and Hovnanian with approximately 3% each.
Exhibit 7: Demand Appears Solid but Focused at the Low End
Traffic Levels Versus Expectations
36%
41%
23%
More than expected Meets expectations Less than expected
How Do the Recent 30 Days Compare to the Prior 30 Days...
14% 14%
40%38%
81%
50%48%
5% 10%
0%
20%
40%
60%
80%
100%
Home Prices Incentives Time to Sell
Increased Remained the same Decreased
Source: Credit Suisse estimates
Traffic
Home Prices
Incentives
September Market Trends
!!
“The tax incentive deadline is helping sales.”
08 October 2009
Monthly Survey of Real Estate Agents 10
Chicago, IL – Buyers and Sellers Look to Make Deals Before the Tax Credit Expires (7,778 single-family permits in 2008, 8th largest market in the country)
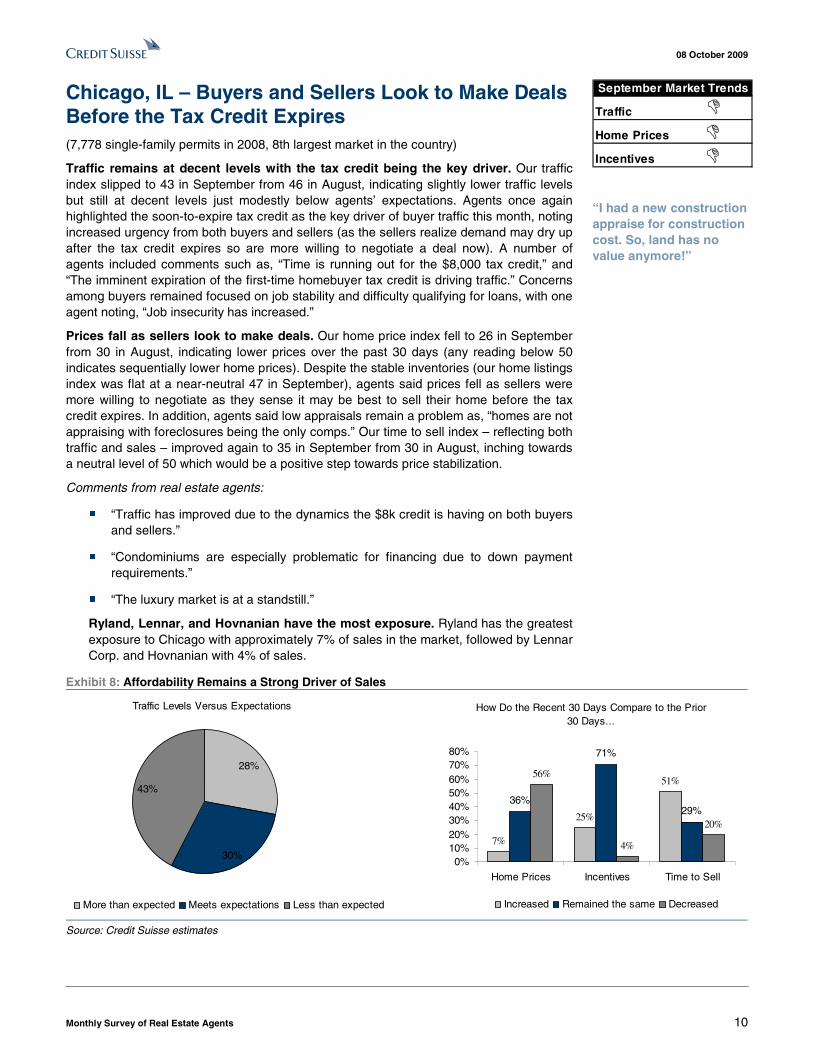
Traffic remains at decent levels with the tax credit being the key driver. Our traffic index slipped to 43 in September from 46 in August, indicating slightly lower traffic levels but still at decent levels just modestly below agents’ expectations. Agents once again highlighted the soon-to-expire tax credit as the key driver of buyer traffic this month, noting increased urgency from both buyers and sellers (as the sellers realize demand may dry up after the tax credit expires so are more willing to negotiate a deal now). A number of agents included comments such as, “Time is running out for the $8,000 tax credit,” and “The imminent expiration of the first-time homebuyer tax credit is driving traffic.” Concerns among buyers remained focused on job stability and difficulty qualifying for loans, with one agent noting, “Job insecurity has increased.”
Prices fall as sellers look to make deals. Our home price index fell to 26 in September from 30 in August, indicating lower prices over the past 30 days (any reading below 50 indicates sequentially lower home prices). Despite the stable inventories (our home listings index was flat at a near-neutral 47 in September), agents said prices fell as sellers were more willing to negotiate as they sense it may be best to sell their home before the tax credit expires. In addition, agents said low appraisals remain a problem as, “homes are not appraising with foreclosures being the only comps.” Our time to sell index – reflecting both traffic and sales – improved again to 35 in September from 30 in August, inching towards a neutral level of 50 which would be a positive step towards price stabilization.
Comments from real estate agents:
■ “Traffic has improved due to the dynamics the $8k credit is having on both buyers and sellers.”
■ “Condominiums are especially problematic for financing due to down payment requirements.”
■ “The luxury market is at a standstill.”
Ryland, Lennar, and Hovnanian have the most exposure. Ryland has the greatest exposure to Chicago with approximately 7% of sales in the market, followed by Lennar Corp. and Hovnanian with 4% of sales.
Exhibit 8: Affordability Remains a Strong Driver of Sales
Traffic Levels Versus Expectations
30%
43%
28%
More than expected Meets expectations Less than expected
How Do the Recent 30 Days Compare to the Prior 30 Days...
7%
25%
51%
36%
71%
29%
56%
4%
20%
0%10%20%30%40%50%60%70%80%
Home Prices Incentives Time to Sell
Increased Remained the same Decreased
Source: Credit Suisse estimates
Traffic
Home Prices
Incentives
September Market Trends
!!!
“I had a new construction appraise for construction cost. So, land has no value anymore!”
08 October 2009
Monthly Survey of Real Estate Agents 11
Dallas, TX –Traffic Unchanged as Pent-Up Demand Begins to Wane (17,841 single-family permits in 2008, 2nd largest market in the country)
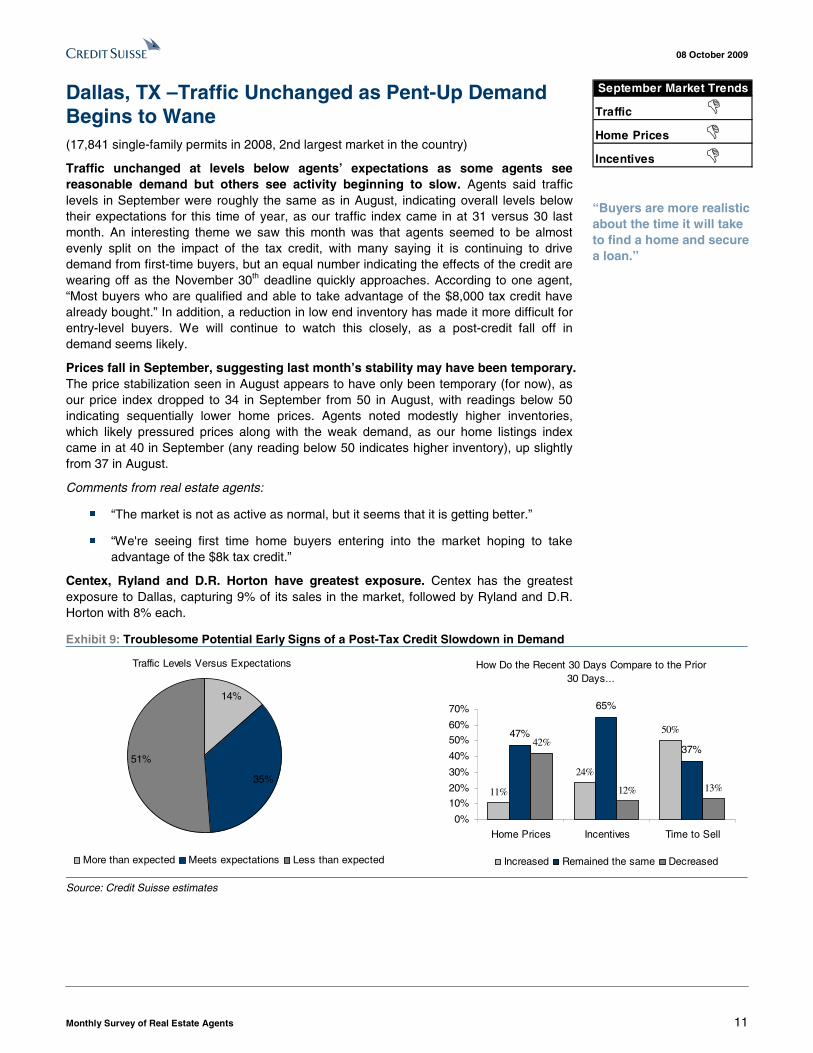
Traffic unchanged at levels below agents’ expectations as some agents see reasonable demand but others see activity beginning to slow. Agents said traffic levels in September were roughly the same as in August, indicating overall levels below their expectations for this time of year, as our traffic index came in at 31 versus 30 last month. An interesting theme we saw this month was that agents seemed to be almost evenly split on the impact of the tax credit, with many saying it is continuing to drive demand from first-time buyers, but an equal number indicating the effects of the credit are wearing off as the November 30th deadline quickly approaches. According to one agent, “Most buyers who are qualified and able to take advantage of the $8,000 tax credit have already bought.” In addition, a reduction in low end inventory has made it more difficult for entry-level buyers. We will continue to watch this closely, as a post-credit fall off in demand seems likely.
Prices fall in September, suggesting last month’s stability may have been temporary. The price stabilization seen in August appears to have only been temporary (for now), as our price index dropped to 34 in September from 50 in August, with readings below 50 indicating sequentially lower home prices. Agents noted modestly higher inventories, which likely pressured prices along with the weak demand, as our home listings index came in at 40 in September (any reading below 50 indicates higher inventory), up slightly from 37 in August.
Comments from real estate agents:
■ “The market is not as active as normal, but it seems that it is getting better.”
■ “We're seeing first time home buyers entering into the market hoping to take advantage of the $8k tax credit.”
Centex, Ryland and D.R. Horton have greatest exposure. Centex has the greatest exposure to Dallas, capturing 9% of its sales in the market, followed by Ryland and D.R. Horton with 8% each.
Exhibit 9: Troublesome Potential Early Signs of a Post-Tax Credit Slowdown in Demand
Traffic Levels Versus Expectations
35%
14%
51%
More than expected Meets expectations Less than expected
How Do the Recent 30 Days Compare to the Prior 30 Days...
11%
24%
50%47%
65%
37%42%
12% 13%
0%
10%
20%
30%
40%
50%
60%
70%
Home Prices Incentives Time to Sell
Increased Remained the same Decreased
Source: Credit Suisse estimates
Traffic
Home Prices
Incentives
September Market Trends
!!!
“Buyers are more realistic about the time it will take to find a home and secure a loan.”
08 October 2009
Monthly Survey of Real Estate Agents 12
Denver, CO – Lower Inventory Levels a Positive Sign for Future Price Trends (3,947 single-family permits in 2008, 25th largest market in the country)
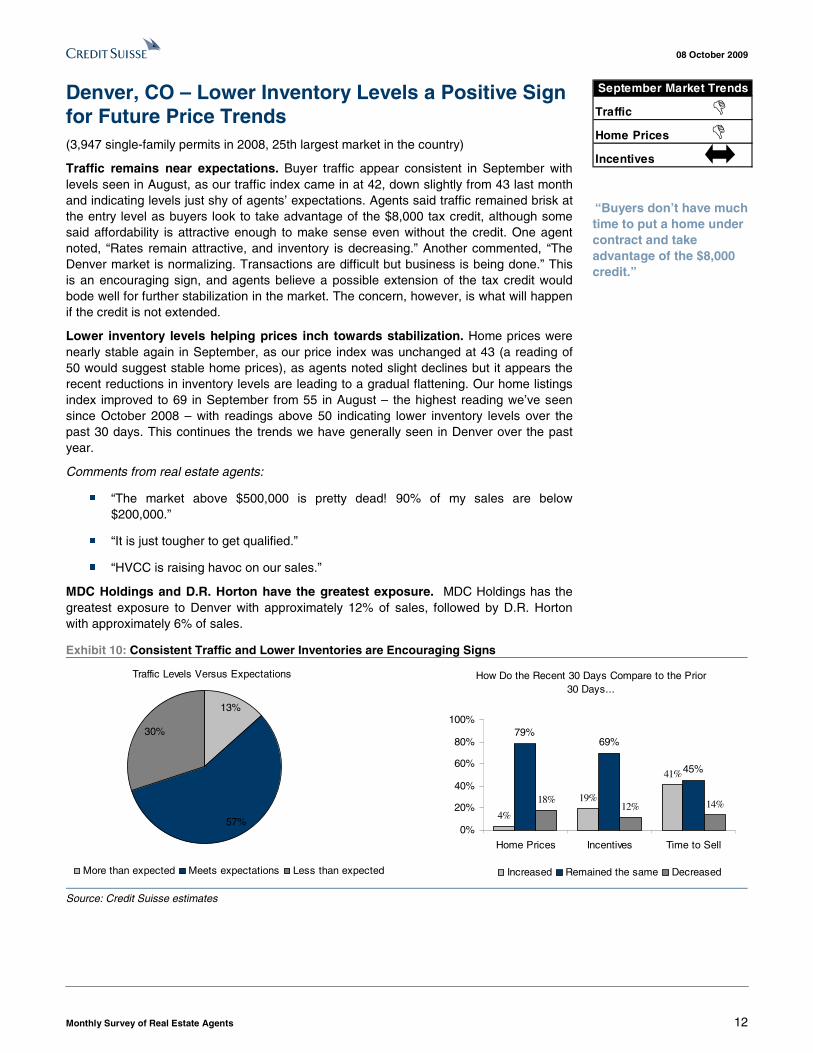
Traffic remains near expectations. Buyer traffic appear consistent in September with levels seen in August, as our traffic index came in at 42, down slightly from 43 last month and indicating levels just shy of agents’ expectations. Agents said traffic remained brisk at the entry level as buyers look to take advantage of the $8,000 tax credit, although some said affordability is attractive enough to make sense even without the credit. One agent noted, “Rates remain attractive, and inventory is decreasing.” Another commented, “The Denver market is normalizing. Transactions are difficult but business is being done.” This is an encouraging sign, and agents believe a possible extension of the tax credit would bode well for further stabilization in the market. The concern, however, is what will happen if the credit is not extended.
Lower inventory levels helping prices inch towards stabilization. Home prices were nearly stable again in September, as our price index was unchanged at 43 (a reading of 50 would suggest stable home prices), as agents noted slight declines but it appears the recent reductions in inventory levels are leading to a gradual flattening. Our home listings index improved to 69 in September from 55 in August – the highest reading we’ve seen since October 2008 – with readings above 50 indicating lower inventory levels over the past 30 days. This continues the trends we have generally seen in Denver over the past year.
Comments from real estate agents:
■ “The market above $500,000 is pretty dead! 90% of my sales are below $200,000.”
■ “It is just tougher to get qualified.”
■ “HVCC is raising havoc on our sales.”
MDC Holdings and D.R. Horton have the greatest exposure. MDC Holdings has the greatest exposure to Denver with approximately 12% of sales, followed by D.R. Horton with approximately 6% of sales.
Exhibit 10: Consistent Traffic and Lower Inventories are Encouraging Signs
Traffic Levels Versus Expectations
57%
30%
13%
More than expected Meets expectations Less than expected
How Do the Recent 30 Days Compare to the Prior 30 Days...
4%
19%
41%
79%69%
45%
18%12% 14%
0%
20%
40%
60%
80%
100%
Home Prices Incentives Time to Sell
Increased Remained the same Decreased
Source: Credit Suisse estimates
Traffic
Home Prices
Incentives
September Market Trends
!!
“Buyers don’t have much time to put a home under contract and take advantage of the $8,000 credit.”
08 October 2009
Monthly Survey of Real Estate Agents 13
Ft. Myers, FL – Strong Low End Demand Drives Further Stabilization in Prices (1,216 single-family permits in 2008, 86th largest market in the country)
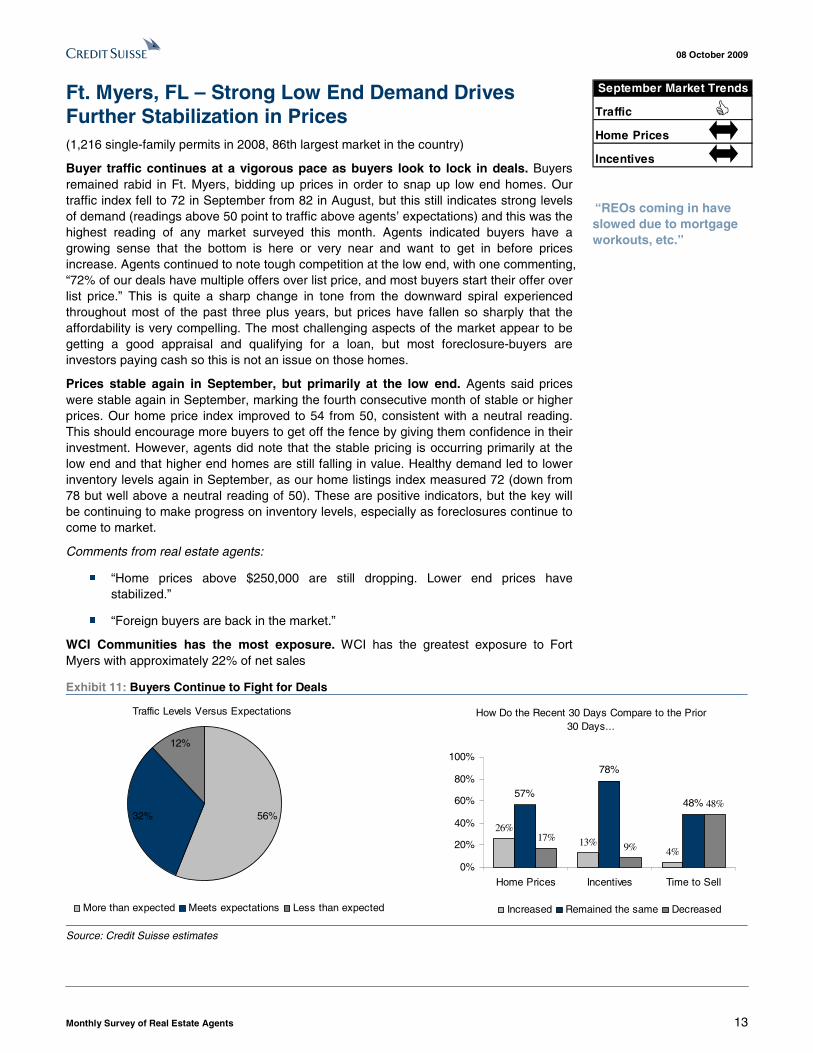
Buyer traffic continues at a vigorous pace as buyers look to lock in deals. Buyers remained rabid in Ft. Myers, bidding up prices in order to snap up low end homes. Our traffic index fell to 72 in September from 82 in August, but this still indicates strong levels of demand (readings above 50 point to traffic above agents’ expectations) and this was the highest reading of any market surveyed this month. Agents indicated buyers have a growing sense that the bottom is here or very near and want to get in before prices increase. Agents continued to note tough competition at the low end, with one commenting, “72% of our deals have multiple offers over list price, and most buyers start their offer over list price.” This is quite a sharp change in tone from the downward spiral experienced throughout most of the past three plus years, but prices have fallen so sharply that the affordability is very compelling. The most challenging aspects of the market appear to be getting a good appraisal and qualifying for a loan, but most foreclosure-buyers are investors paying cash so this is not an issue on those homes.
Prices stable again in September, but primarily at the low end. Agents said prices were stable again in September, marking the fourth consecutive month of stable or higher prices. Our home price index improved to 54 from 50, consistent with a neutral reading. This should encourage more buyers to get off the fence by giving them confidence in their investment. However, agents did note that the stable pricing is occurring primarily at the low end and that higher end homes are still falling in value. Healthy demand led to lower inventory levels again in September, as our home listings index measured 72 (down from 78 but well above a neutral reading of 50). These are positive indicators, but the key will be continuing to make progress on inventory levels, especially as foreclosures continue to come to market.
Comments from real estate agents:
■ “Home prices above $250,000 are still dropping. Lower end prices have stabilized.”
■ “Foreign buyers are back in the market.”
WCI Communities has the most exposure. WCI has the greatest exposure to Fort Myers with approximately 22% of net sales
Exhibit 11: Buyers Continue to Fight for Deals
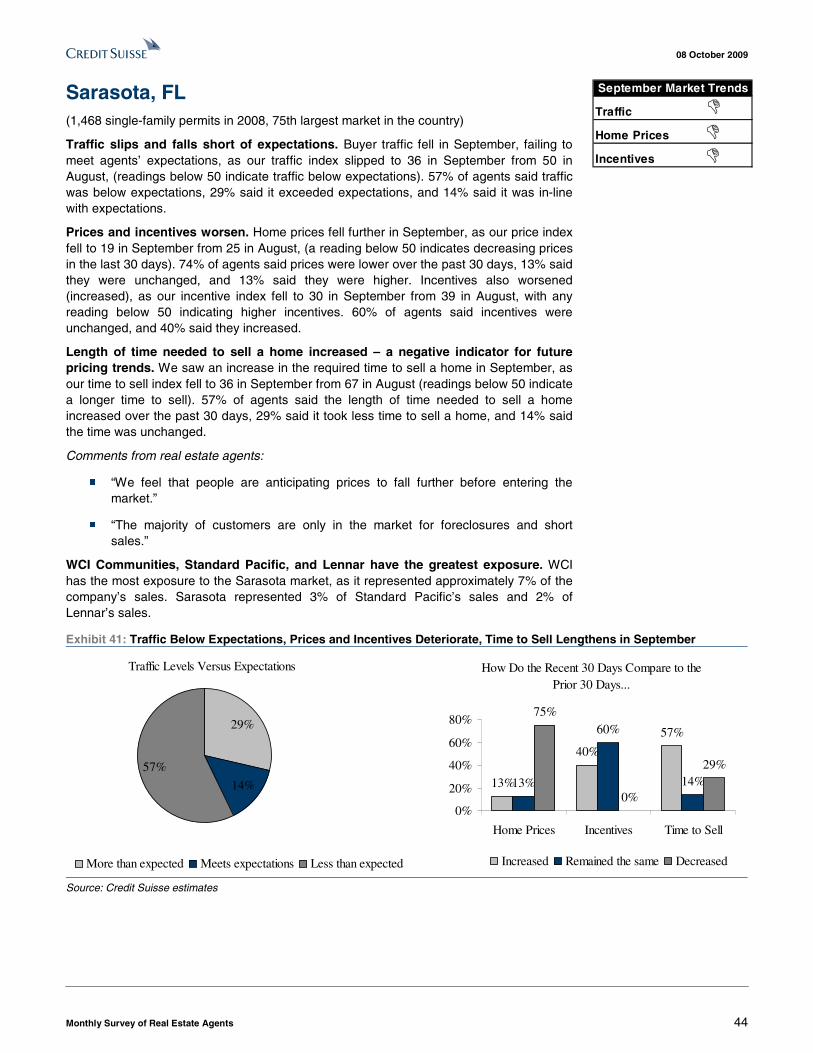
Traffic Levels Versus Expectations
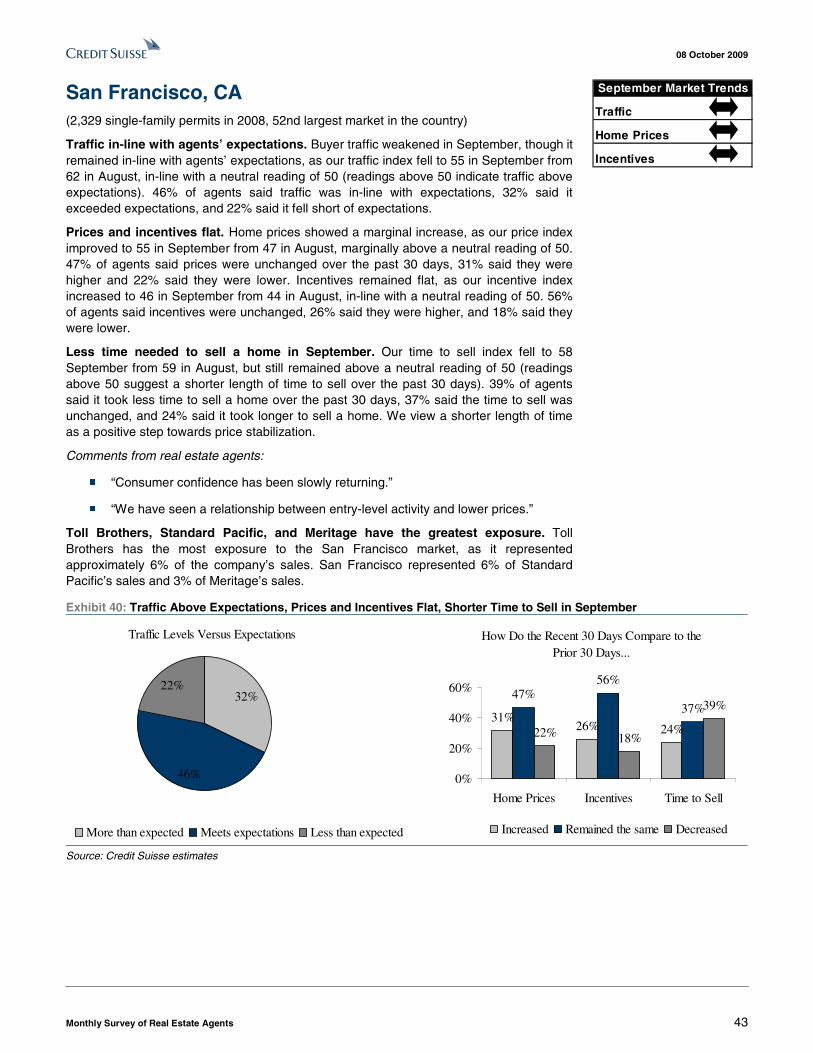
32% 56%
12%
More than expected Meets expectations Less than expected
How Do the Recent 30 Days Compare to the Prior 30 Days...
26%13%
4%
57%
78%
48%
17%9%
48%
0%
20%
40%
60%
80%
100%
Home Prices Incentives Time to Sell
Increased Remained the same Decreased
Source: Credit Suisse estimates
Traffic
Home Prices
Incentives
September Market Trends
“REOs coming in have slowed due to mortgage workouts, etc.”
08 October 2009
Monthly Survey of Real Estate Agents 14
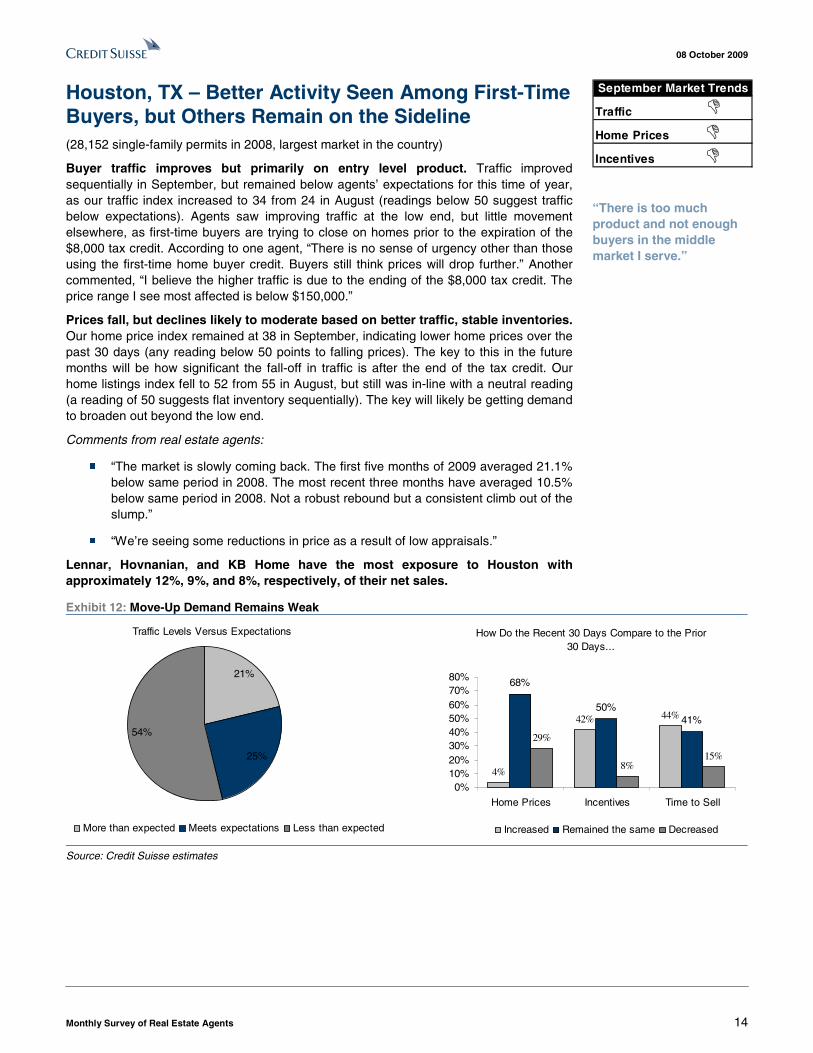
Houston, TX – Better Activity Seen Among First-Time Buyers, but Others Remain on the Sideline (28,152 single-family permits in 2008, largest market in the country)
Buyer traffic improves but primarily on entry level product. Traffic improved sequentially in September, but remained below agents’ expectations for this time of year, as our traffic index increased to 34 from 24 in August (readings below 50 suggest traffic below expectations). Agents saw improving traffic at the low end, but little movement elsewhere, as first-time buyers are trying to close on homes prior to the expiration of the $8,000 tax credit. According to one agent, “There is no sense of urgency other than those using the first-time home buyer credit. Buyers still think prices will drop further.” Another commented, “I believe the higher traffic is due to the ending of the $8,000 tax credit. The price range I see most affected is below $150,000.”
Prices fall, but declines likely to moderate based on better traffic, stable inventories. Our home price index remained at 38 in September, indicating lower home prices over the past 30 days (any reading below 50 points to falling prices). The key to this in the future months will be how significant the fall-off in traffic is after the end of the tax credit. Our home listings index fell to 52 from 55 in August, but still was in-line with a neutral reading (a reading of 50 suggests flat inventory sequentially). The key will likely be getting demand to broaden out beyond the low end.
Comments from real estate agents:
■ “The market is slowly coming back. The first five months of 2009 averaged 21.1% below same period in 2008. The most recent three months have averaged 10.5% below same period in 2008. Not a robust rebound but a consistent climb out of the slump.”
■ “We’re seeing some reductions in price as a result of low appraisals.”
Lennar, Hovnanian, and KB Home have the most exposure to Houston with approximately 12%, 9%, and 8%, respectively, of their net sales.
Exhibit 12: Move-Up Demand Remains Weak
Traffic Levels Versus Expectations
25%
54%
21%
More than expected Meets expectations Less than expected
How Do the Recent 30 Days Compare to the Prior 30 Days...
4%
42% 44%
68%
50%41%
29%
8%15%
0%10%20%30%40%50%60%70%80%
Home Prices Incentives Time to Sell
Increased Remained the same Decreased
Source: Credit Suisse estimates
Traffic
Home Prices
Incentives
September Market Trends
!!!
“There is too much product and not enough buyers in the middle market I serve.”
08 October 2009
Monthly Survey of Real Estate Agents 15
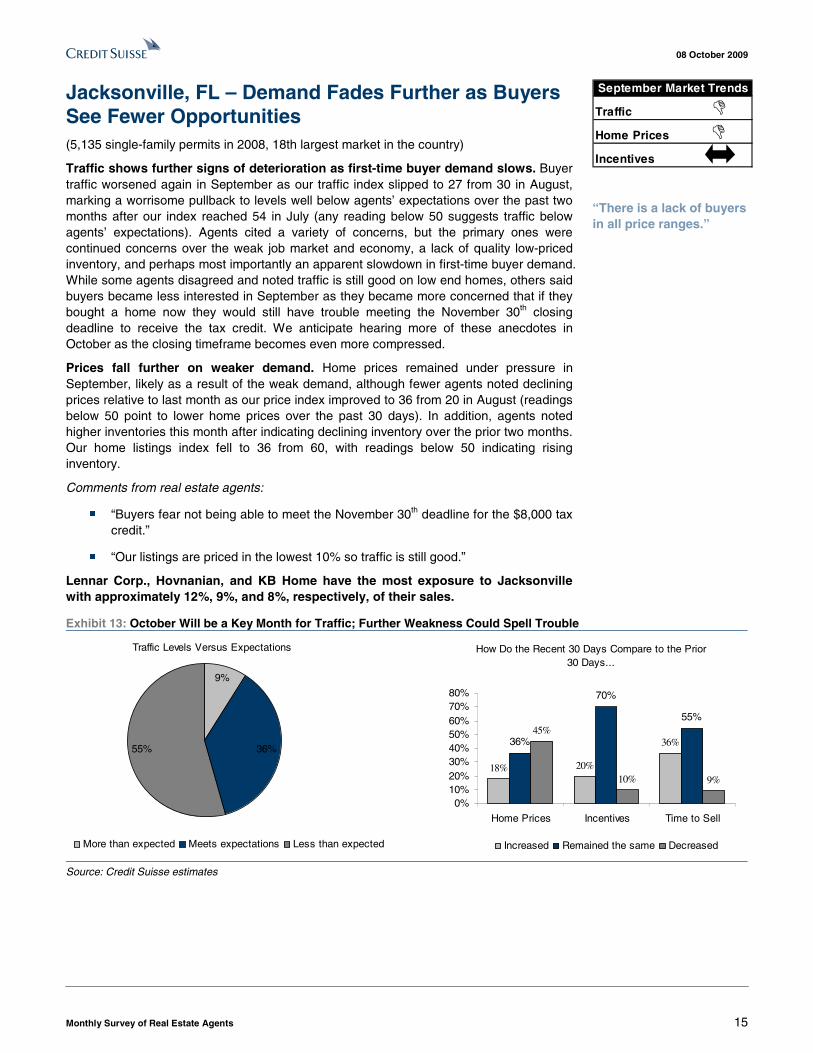
Jacksonville, FL – Demand Fades Further as Buyers See Fewer Opportunities (5,135 single-family permits in 2008, 18th largest market in the country)
Traffic shows further signs of deterioration as first-time buyer demand slows. Buyer traffic worsened again in September as our traffic index slipped to 27 from 30 in August, marking a worrisome pullback to levels well below agents’ expectations over the past two months after our index reached 54 in July (any reading below 50 suggests traffic below agents’ expectations). Agents cited a variety of concerns, but the primary ones were continued concerns over the weak job market and economy, a lack of quality low-priced inventory, and perhaps most importantly an apparent slowdown in first-time buyer demand. While some agents disagreed and noted traffic is still good on low end homes, others said buyers became less interested in September as they became more concerned that if they bought a home now they would still have trouble meeting the November 30th closing deadline to receive the tax credit. We anticipate hearing more of these anecdotes in October as the closing timeframe becomes even more compressed.
Prices fall further on weaker demand. Home prices remained under pressure in September, likely as a result of the weak demand, although fewer agents noted declining prices relative to last month as our price index improved to 36 from 20 in August (readings below 50 point to lower home prices over the past 30 days). In addition, agents noted higher inventories this month after indicating declining inventory over the prior two months. Our home listings index fell to 36 from 60, with readings below 50 indicating rising inventory.
Comments from real estate agents:
■ “Buyers fear not being able to meet the November 30th deadline for the $8,000 tax credit.”
■ “Our listings are priced in the lowest 10% so traffic is still good.”
Lennar Corp., Hovnanian, and KB Home have the most exposure to Jacksonville with approximately 12%, 9%, and 8%, respectively, of their sales.
Exhibit 13: October Will be a Key Month for Traffic; Further Weakness Could Spell Trouble
Traffic Levels Versus Expectations
36%
9%
55%
More than expected Meets expectations Less than expected
How Do the Recent 30 Days Compare to the Prior 30 Days...
18% 20%
36%36%
70%
55%45%
10% 9%
0%10%20%30%40%50%60%70%80%
Home Prices Incentives Time to Sell
Increased Remained the same Decreased
Source: Credit Suisse estimates
Traffic
Home Prices
Incentives
September Market Trends
!!
“There is a lack of buyers in all price ranges.”
08 October 2009
Monthly Survey of Real Estate Agents 16
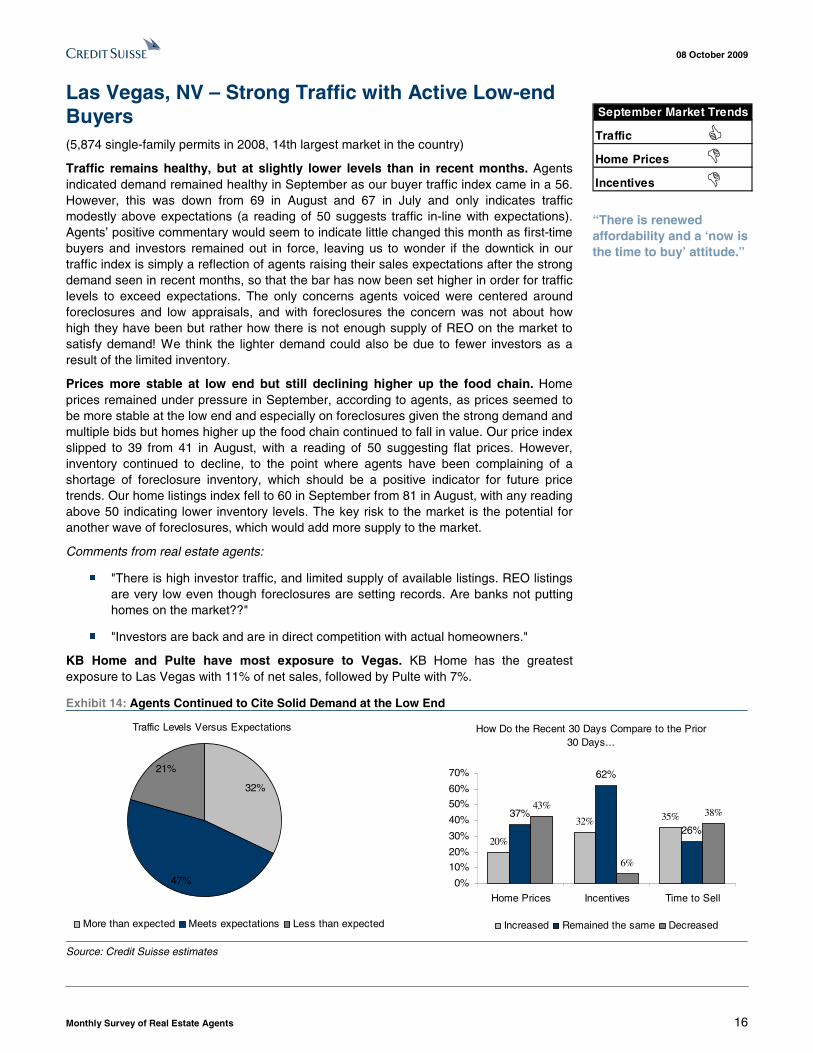
Las Vegas, NV – Strong Traffic with Active Low-end Buyers (5,874 single-family permits in 2008, 14th largest market in the country)
Traffic remains healthy, but at slightly lower levels than in recent months. Agents indicated demand remained healthy in September as our buyer traffic index came in a 56. However, this was down from 69 in August and 67 in July and only indicates traffic modestly above expectations (a reading of 50 suggests traffic in-line with expectations). Agents’ positive commentary would seem to indicate little changed this month as first-time buyers and investors remained out in force, leaving us to wonder if the downtick in our traffic index is simply a reflection of agents raising their sales expectations after the strong demand seen in recent months, so that the bar has now been set higher in order for traffic levels to exceed expectations. The only concerns agents voiced were centered around foreclosures and low appraisals, and with foreclosures the concern was not about how high they have been but rather how there is not enough supply of REO on the market to satisfy demand! We think the lighter demand could also be due to fewer investors as a result of the limited inventory.
Prices more stable at low end but still declining higher up the food chain. Home prices remained under pressure in September, according to agents, as prices seemed to be more stable at the low end and especially on foreclosures given the strong demand and multiple bids but homes higher up the food chain continued to fall in value. Our price index slipped to 39 from 41 in August, with a reading of 50 suggesting flat prices. However, inventory continued to decline, to the point where agents have been complaining of a shortage of foreclosure inventory, which should be a positive indicator for future price trends. Our home listings index fell to 60 in September from 81 in August, with any reading above 50 indicating lower inventory levels. The key risk to the market is the potential for another wave of foreclosures, which would add more supply to the market.
Comments from real estate agents:
■ "There is high investor traffic, and limited supply of available listings. REO listings are very low even though foreclosures are setting records. Are banks not putting homes on the market??"
■ "Investors are back and are in direct competition with actual homeowners."
KB Home and Pulte have most exposure to Vegas. KB Home has the greatest exposure to Las Vegas with 11% of net sales, followed by Pulte with 7%.
Exhibit 14: Agents Continued to Cite Solid Demand at the Low End
Traffic Levels Versus Expectations
47%
32%
21%
More than expected Meets expectations Less than expected
How Do the Recent 30 Days Compare to the Prior 30 Days...
20%
32% 35%37%
62%
26%
43%
6%
38%
0%
10%
20%
30%
40%
50%
60%
70%
Home Prices Incentives Time to Sell
Increased Remained the same Decreased
Source: Credit Suisse estimates
Traffic
Home Prices
Incentives
September Market Trends
!
!
“There is renewed affordability and a ‘now is the time to buy’ attitude.”
08 October 2009
Monthly Survey of Real Estate Agents 17
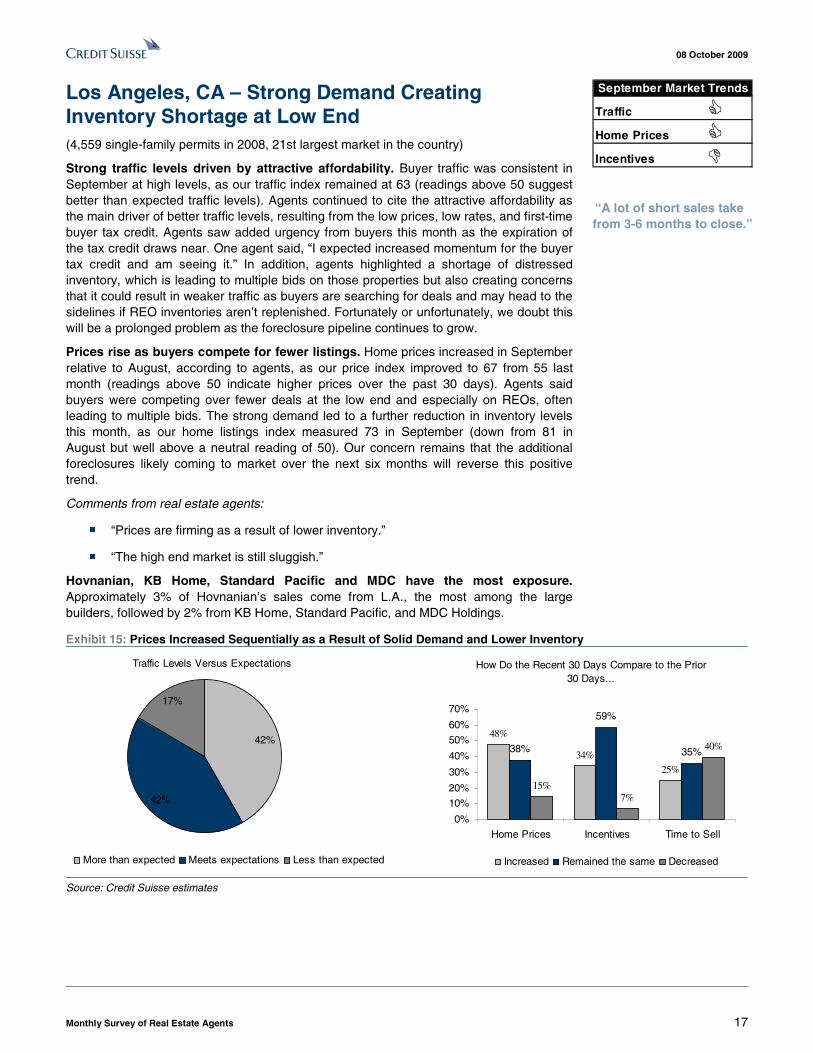
Los Angeles, CA – Strong Demand Creating Inventory Shortage at Low End (4,559 single-family permits in 2008, 21st largest market in the country)
Strong traffic levels driven by attractive affordability. Buyer traffic was consistent in September at high levels, as our traffic index remained at 63 (readings above 50 suggest better than expected traffic levels). Agents continued to cite the attractive affordability as the main driver of better traffic levels, resulting from the low prices, low rates, and first-time buyer tax credit. Agents saw added urgency from buyers this month as the expiration of the tax credit draws near. One agent said, “I expected increased momentum for the buyer tax credit and am seeing it.” In addition, agents highlighted a shortage of distressed inventory, which is leading to multiple bids on those properties but also creating concerns that it could result in weaker traffic as buyers are searching for deals and may head to the sidelines if REO inventories aren’t replenished. Fortunately or unfortunately, we doubt this will be a prolonged problem as the foreclosure pipeline continues to grow.
Prices rise as buyers compete for fewer listings. Home prices increased in September relative to August, according to agents, as our price index improved to 67 from 55 last month (readings above 50 indicate higher prices over the past 30 days). Agents said buyers were competing over fewer deals at the low end and especially on REOs, often leading to multiple bids. The strong demand led to a further reduction in inventory levels this month, as our home listings index measured 73 in September (down from 81 in August but well above a neutral reading of 50). Our concern remains that the additional foreclosures likely coming to market over the next six months will reverse this positive trend.
Comments from real estate agents:
■ “Prices are firming as a result of lower inventory.”
■ “The high end market is still sluggish.”
Hovnanian, KB Home, Standard Pacific and MDC have the most exposure. Approximately 3% of Hovnanian’s sales come from L.A., the most among the large builders, followed by 2% from KB Home, Standard Pacific, and MDC Holdings.
Exhibit 15: Prices Increased Sequentially as a Result of Solid Demand and Lower Inventory
Traffic Levels Versus Expectations
42%
17%
42%
More than expected Meets expectations Less than expected
How Do the Recent 30 Days Compare to the Prior 30 Days...
48%
34%
25%
38%
59%
35%
15%7%
40%
0%
10%
20%
30%
40%
50%
60%
70%
Home Prices Incentives Time to Sell
Increased Remained the same Decreased
Source: Credit Suisse estimates
Traffic
Home Prices
Incentives
September Market Trends
!
“A lot of short sales take from 3-6 months to close.”
08 October 2009
Monthly Survey of Real Estate Agents 18
Miami, FL – Solid Demand and Lower Inventory as Buyers Seek Bargains (3,358 single-family permits in 2008, 31st largest market in the country)
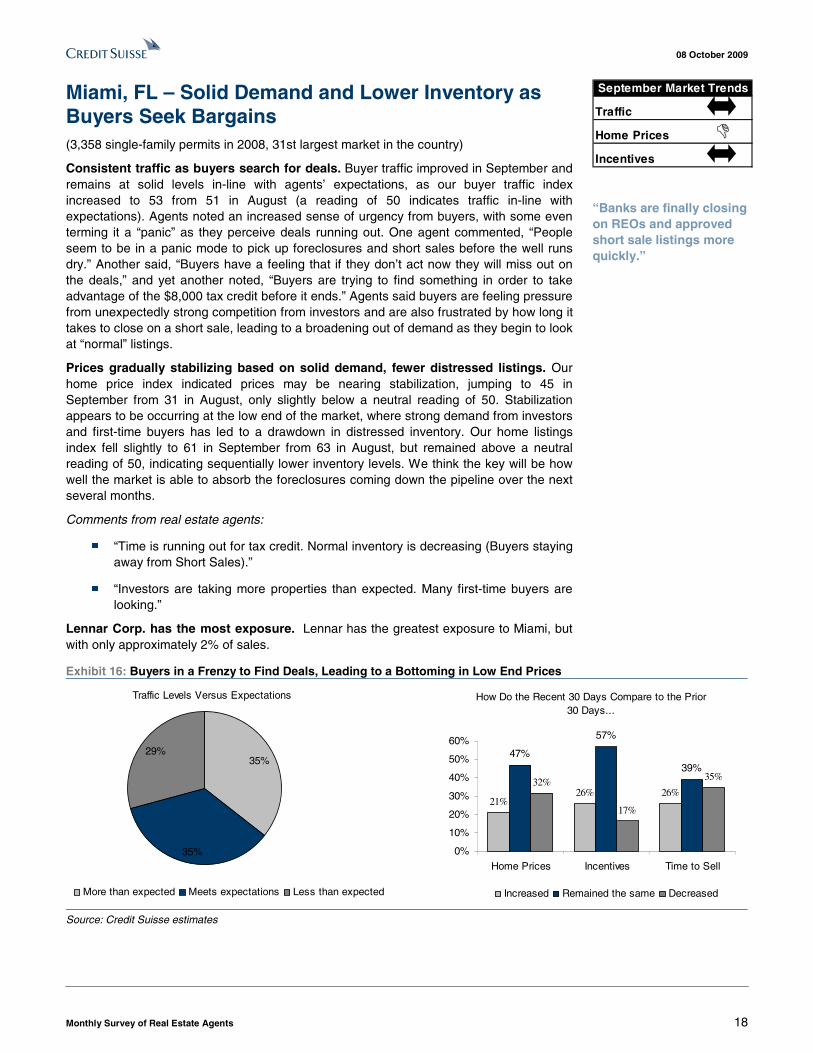
Consistent traffic as buyers search for deals. Buyer traffic improved in September and remains at solid levels in-line with agents’ expectations, as our buyer traffic index increased to 53 from 51 in August (a reading of 50 indicates traffic in-line with expectations). Agents noted an increased sense of urgency from buyers, with some even terming it a “panic” as they perceive deals running out. One agent commented, “People seem to be in a panic mode to pick up foreclosures and short sales before the well runs dry.” Another said, “Buyers have a feeling that if they don’t act now they will miss out on the deals,” and yet another noted, “Buyers are trying to find something in order to take advantage of the $8,000 tax credit before it ends.” Agents said buyers are feeling pressure from unexpectedly strong competition from investors and are also frustrated by how long it takes to close on a short sale, leading to a broadening out of demand as they begin to look at “normal” listings.
Prices gradually stabilizing based on solid demand, fewer distressed listings. Our home price index indicated prices may be nearing stabilization, jumping to 45 in September from 31 in August, only slightly below a neutral reading of 50. Stabilization appears to be occurring at the low end of the market, where strong demand from investors and first-time buyers has led to a drawdown in distressed inventory. Our home listings index fell slightly to 61 in September from 63 in August, but remained above a neutral reading of 50, indicating sequentially lower inventory levels. We think the key will be how well the market is able to absorb the foreclosures coming down the pipeline over the next several months.
Comments from real estate agents:
■ “Time is running out for tax credit. Normal inventory is decreasing (Buyers staying away from Short Sales).”
■ “Investors are taking more properties than expected. Many first-time buyers are looking.”
Lennar Corp. has the most exposure. Lennar has the greatest exposure to Miami, but with only approximately 2% of sales.
Exhibit 16: Buyers in a Frenzy to Find Deals, Leading to a Bottoming in Low End Prices
Traffic Levels Versus Expectations
35%
35%29%
More than expected Meets expectations Less than expected
How Do the Recent 30 Days Compare to the Prior 30 Days...
21%26% 26%
47%
57%
39%32%
17%
35%
0%
10%
20%
30%
40%
50%
60%
Home Prices Incentives Time to Sell
Increased Remained the same Decreased
Source: Credit Suisse estimates
Traffic
Home Prices
Incentives
September Market Trends
!
“Banks are finally closing on REOs and approved short sale listings more quickly.”
08 October 2009
Monthly Survey of Real Estate Agents 19
Minneapolis, MN – End of Tax Credit Driving Entry Level Demand (4,171 single-family permits in 2008, 23rd largest market in the country)
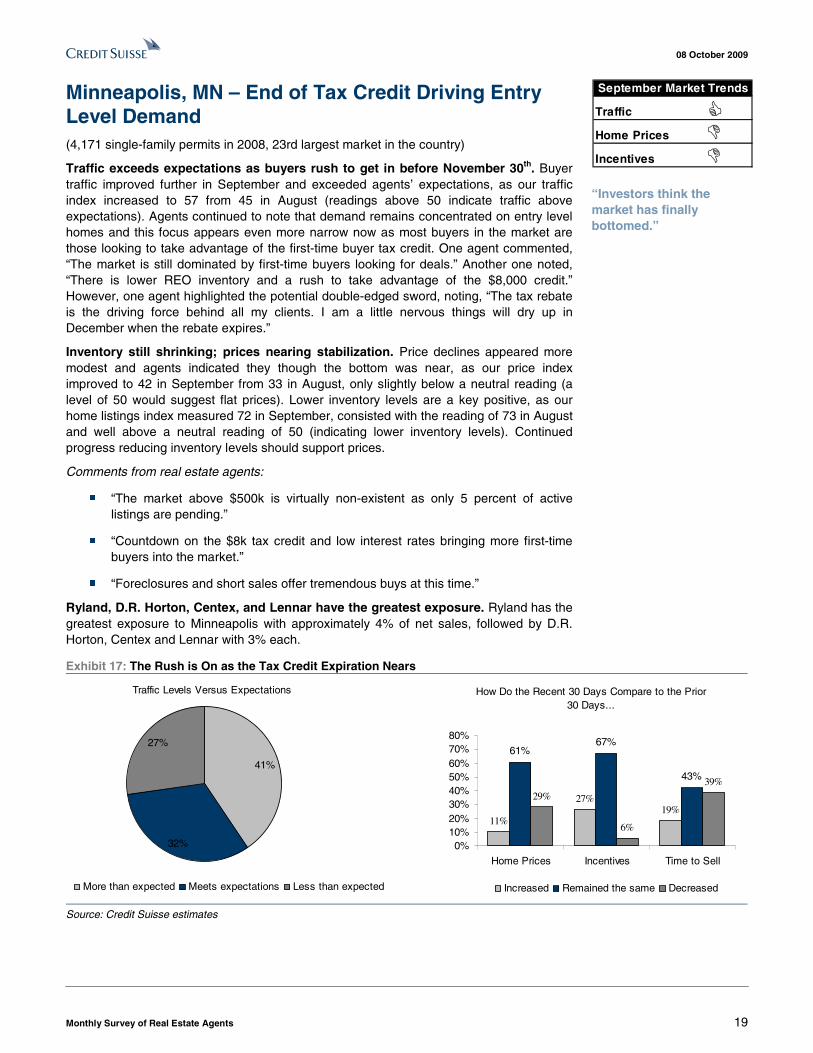
Traffic exceeds expectations as buyers rush to get in before November 30th. Buyer traffic improved further in September and exceeded agents’ expectations, as our traffic index increased to 57 from 45 in August (readings above 50 indicate traffic above expectations). Agents continued to note that demand remains concentrated on entry level homes and this focus appears even more narrow now as most buyers in the market are those looking to take advantage of the first-time buyer tax credit. One agent commented, “The market is still dominated by first-time buyers looking for deals.” Another one noted, “There is lower REO inventory and a rush to take advantage of the $8,000 credit.” However, one agent highlighted the potential double-edged sword, noting, “The tax rebate is the driving force behind all my clients. I am a little nervous things will dry up in December when the rebate expires.”
Inventory still shrinking; prices nearing stabilization. Price declines appeared more modest and agents indicated they though the bottom was near, as our price index improved to 42 in September from 33 in August, only slightly below a neutral reading (a level of 50 would suggest flat prices). Lower inventory levels are a key positive, as our home listings index measured 72 in September, consisted with the reading of 73 in August and well above a neutral reading of 50 (indicating lower inventory levels). Continued progress reducing inventory levels should support prices.
Comments from real estate agents:
■ “The market above $500k is virtually non-existent as only 5 percent of active listings are pending.”
■ “Countdown on the $8k tax credit and low interest rates bringing more first-time buyers into the market.”
■ “Foreclosures and short sales offer tremendous buys at this time.”
Ryland, D.R. Horton, Centex, and Lennar have the greatest exposure. Ryland has the greatest exposure to Minneapolis with approximately 4% of net sales, followed by D.R. Horton, Centex and Lennar with 3% each.
Exhibit 17: The Rush is On as the Tax Credit Expiration Nears
Traffic Levels Versus Expectations
32%
27%
41%
More than expected Meets expectations Less than expected
How Do the Recent 30 Days Compare to the Prior 30 Days...
11%
27%19%
61%67%
43%
29%
6%
39%
0%10%20%30%40%50%60%70%80%
Home Prices Incentives Time to Sell
Increased Remained the same Decreased
Source: Credit Suisse estimates
Traffic
Home Prices
Incentives
September Market Trends
!
!
“Investors think the market has finally bottomed.”
08 October 2009
Monthly Survey of Real Estate Agents 20
New York-Northern NJ – Buyers Realize There’s More than Just a Tax Credit to Consider (8,941 single-family permits in 2008, 6th largest market in the country)
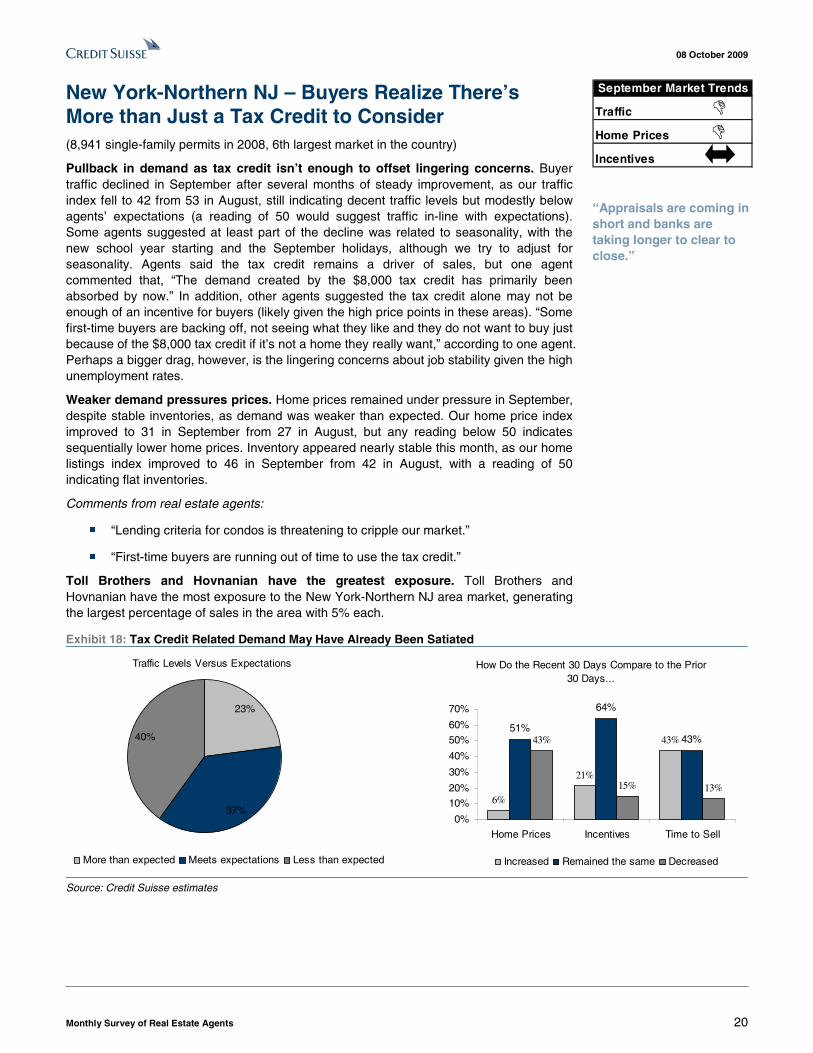
Pullback in demand as tax credit isn’t enough to offset lingering concerns. Buyer traffic declined in September after several months of steady improvement, as our traffic index fell to 42 from 53 in August, still indicating decent traffic levels but modestly below agents’ expectations (a reading of 50 would suggest traffic in-line with expectations). Some agents suggested at least part of the decline was related to seasonality, with the new school year starting and the September holidays, although we try to adjust for seasonality. Agents said the tax credit remains a driver of sales, but one agent commented that, “The demand created by the $8,000 tax credit has primarily been absorbed by now.” In addition, other agents suggested the tax credit alone may not be enough of an incentive for buyers (likely given the high price points in these areas). “Some first-time buyers are backing off, not seeing what they like and they do not want to buy just because of the $8,000 tax credit if it’s not a home they really want,” according to one agent. Perhaps a bigger drag, however, is the lingering concerns about job stability given the high unemployment rates.
Weaker demand pressures prices. Home prices remained under pressure in September, despite stable inventories, as demand was weaker than expected. Our home price index improved to 31 in September from 27 in August, but any reading below 50 indicates sequentially lower home prices. Inventory appeared nearly stable this month, as our home listings index improved to 46 in September from 42 in August, with a reading of 50 indicating flat inventories.
Comments from real estate agents:
■ “Lending criteria for condos is threatening to cripple our market.”
■ “First-time buyers are running out of time to use the tax credit.”
Toll Brothers and Hovnanian have the greatest exposure. Toll Brothers and Hovnanian have the most exposure to the New York-Northern NJ area market, generating the largest percentage of sales in the area with 5% each.
Exhibit 18: Tax Credit Related Demand May Have Already Been Satiated
Traffic Levels Versus Expectations
37%
23%
40%
More than expected Meets expectations Less than expected
How Do the Recent 30 Days Compare to the Prior 30 Days...
6%
21%
43%51%
64%
43%43%
15% 13%
0%
10%
20%
30%
40%
50%
60%
70%
Home Prices Incentives Time to Sell
Increased Remained the same Decreased
Source: Credit Suisse estimates
Traffic
Home Prices
Incentives
September Market Trends
!!
“Appraisals are coming in short and banks are taking longer to clear to close.”
08 October 2009
Monthly Survey of Real Estate Agents 21
Orlando, FL – Lower Prices and “Rush” for Tax Credit Lead to Lower Inventory (5,288 single-family permits in 2008, 17th largest market in the country)
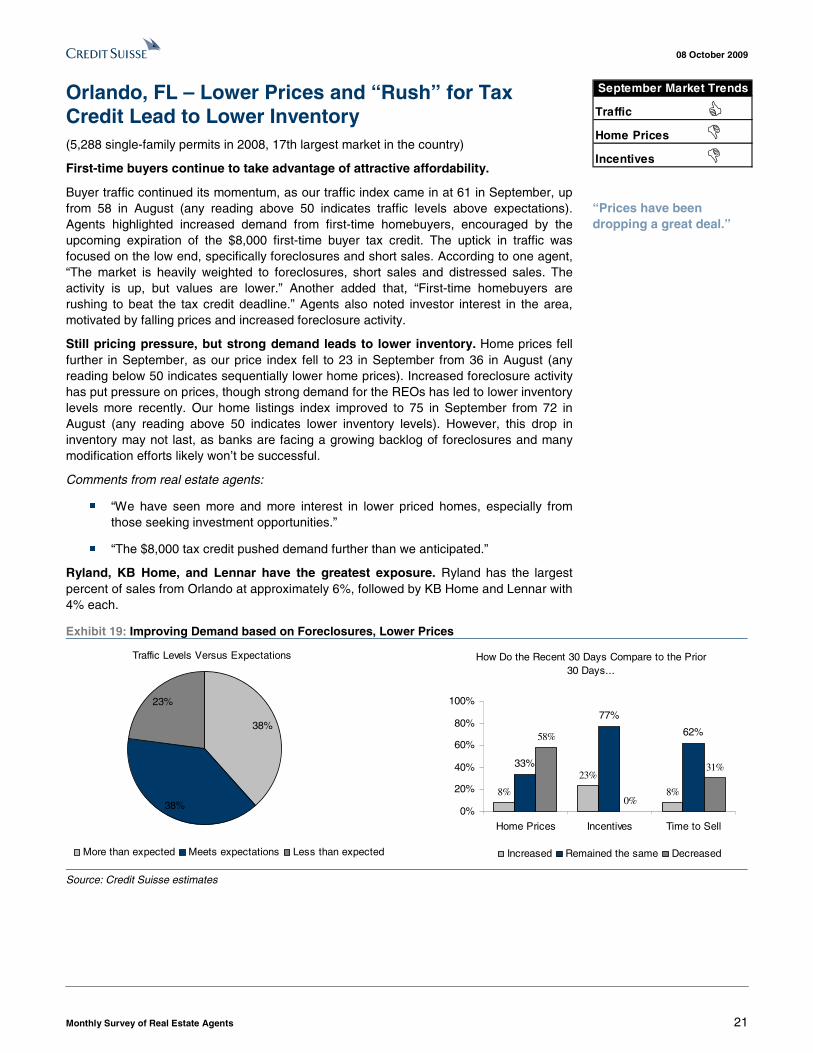
First-time buyers continue to take advantage of attractive affordability.
Buyer traffic continued its momentum, as our traffic index came in at 61 in September, up from 58 in August (any reading above 50 indicates traffic levels above expectations). Agents highlighted increased demand from first-time homebuyers, encouraged by the upcoming expiration of the $8,000 first-time buyer tax credit. The uptick in traffic was focused on the low end, specifically foreclosures and short sales. According to one agent, “The market is heavily weighted to foreclosures, short sales and distressed sales. The activity is up, but values are lower.” Another added that, “First-time homebuyers are rushing to beat the tax credit deadline.” Agents also noted investor interest in the area, motivated by falling prices and increased foreclosure activity.
Still pricing pressure, but strong demand leads to lower inventory. Home prices fell further in September, as our price index fell to 23 in September from 36 in August (any reading below 50 indicates sequentially lower home prices). Increased foreclosure activity has put pressure on prices, though strong demand for the REOs has led to lower inventory levels more recently. Our home listings index improved to 75 in September from 72 in August (any reading above 50 indicates lower inventory levels). However, this drop in inventory may not last, as banks are facing a growing backlog of foreclosures and many modification efforts likely won’t be successful.
Comments from real estate agents:
■ “We have seen more and more interest in lower priced homes, especially from those seeking investment opportunities.”
■ “The $8,000 tax credit pushed demand further than we anticipated.”
Ryland, KB Home, and Lennar have the greatest exposure. Ryland has the largest percent of sales from Orlando at approximately 6%, followed by KB Home and Lennar with 4% each.
Exhibit 19: Improving Demand based on Foreclosures, Lower Prices
Traffic Levels Versus Expectations
38%
38%
23%
More than expected Meets expectations Less than expected
How Do the Recent 30 Days Compare to the Prior 30 Days...
8%
23%
8%
33%
77%
62%58%
0%
31%
0%
20%
40%
60%
80%
100%
Home Prices Incentives Time to Sell
Increased Remained the same Decreased
Source: Credit Suisse estimates
Traffic
Home Prices
Incentives
September Market Trends
!
!
“Prices have been dropping a great deal.”
08 October 2009
Monthly Survey of Real Estate Agents 22
Phoenix, AZ – Falling Inventory Causes Bidding Wars (11,549 single-family permits in 2008, 4th largest market in the country)
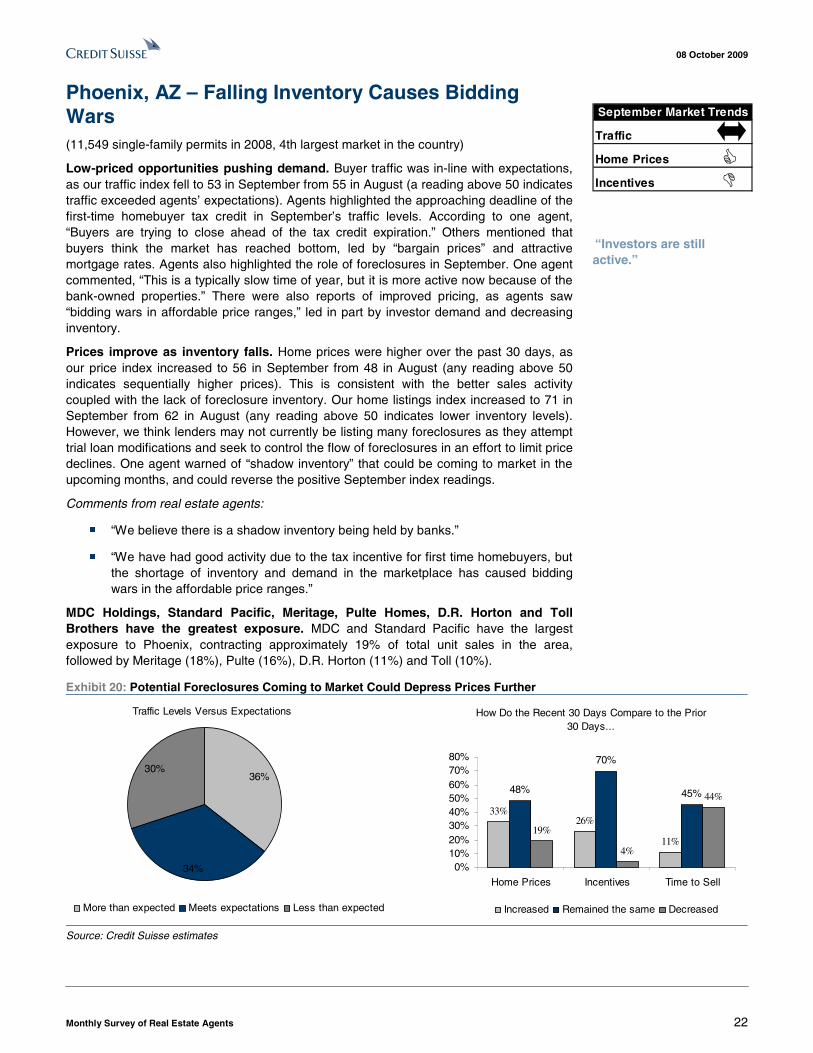
Low-priced opportunities pushing demand. Buyer traffic was in-line with expectations, as our traffic index fell to 53 in September from 55 in August (a reading above 50 indicates traffic exceeded agents’ expectations). Agents highlighted the approaching deadline of the first-time homebuyer tax credit in September’s traffic levels. According to one agent, “Buyers are trying to close ahead of the tax credit expiration.” Others mentioned that buyers think the market has reached bottom, led by “bargain prices” and attractive mortgage rates. Agents also highlighted the role of foreclosures in September. One agent commented, “This is a typically slow time of year, but it is more active now because of the bank-owned properties.” There were also reports of improved pricing, as agents saw “bidding wars in affordable price ranges,” led in part by investor demand and decreasing inventory.
Prices improve as inventory falls. Home prices were higher over the past 30 days, as our price index increased to 56 in September from 48 in August (any reading above 50 indicates sequentially higher prices). This is consistent with the better sales activity coupled with the lack of foreclosure inventory. Our home listings index increased to 71 in September from 62 in August (any reading above 50 indicates lower inventory levels). However, we think lenders may not currently be listing many foreclosures as they attempt trial loan modifications and seek to control the flow of foreclosures in an effort to limit price declines. One agent warned of “shadow inventory” that could be coming to market in the upcoming months, and could reverse the positive September index readings.
Comments from real estate agents:
■ “We believe there is a shadow inventory being held by banks.”
■ “We have had good activity due to the tax incentive for first time homebuyers, but the shortage of inventory and demand in the marketplace has caused bidding wars in the affordable price ranges.”
MDC Holdings, Standard Pacific, Meritage, Pulte Homes, D.R. Horton and Toll Brothers have the greatest exposure. MDC and Standard Pacific have the largest exposure to Phoenix, contracting approximately 19% of total unit sales in the area, followed by Meritage (18%), Pulte (16%), D.R. Horton (11%) and Toll (10%).
Exhibit 20: Potential Foreclosures Coming to Market Could Depress Prices Further
Traffic Levels Versus Expectations
34%
30%36%
More than expected Meets expectations Less than expected
How Do the Recent 30 Days Compare to the Prior 30 Days...
33%26%
11%
48%
70%
45%
19%
4%
44%
0%10%20%30%40%50%60%70%80%
Home Prices Incentives Time to Sell
Increased Remained the same Decreased
Source: Credit Suisse estimates
Traffic
Home Prices
Incentives
September Market Trends
!
“Investors are still active.”
08 October 2009
Monthly Survey of Real Estate Agents 23
Riverside-San Bernardino, CA (Inland Empire) – Tax Credit “Frenzy” Supports September Demand (5,825 single-family permits in 2008, 15th largest market in the country)
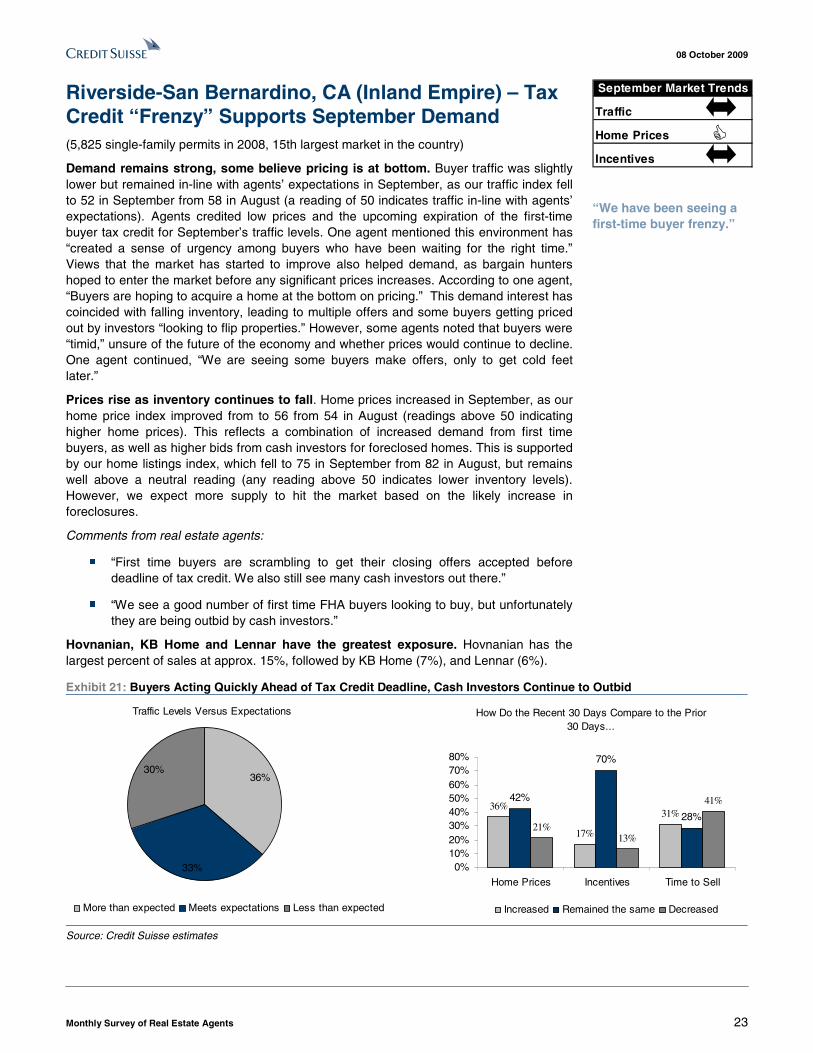
Demand remains strong, some believe pricing is at bottom. Buyer traffic was slightly lower but remained in-line with agents’ expectations in September, as our traffic index fell to 52 in September from 58 in August (a reading of 50 indicates traffic in-line with agents’ expectations). Agents credited low prices and the upcoming expiration of the first-time buyer tax credit for September’s traffic levels. One agent mentioned this environment has “created a sense of urgency among buyers who have been waiting for the right time.” Views that the market has started to improve also helped demand, as bargain hunters hoped to enter the market before any significant prices increases. According to one agent, “Buyers are hoping to acquire a home at the bottom on pricing.” This demand interest has coincided with falling inventory, leading to multiple offers and some buyers getting priced out by investors “looking to flip properties.” However, some agents noted that buyers were “timid,” unsure of the future of the economy and whether prices would continue to decline. One agent continued, “We are seeing some buyers make offers, only to get cold feet later.”
Prices rise as inventory continues to fall. Home prices increased in September, as our home price index improved from to 56 from 54 in August (readings above 50 indicating higher home prices). This reflects a combination of increased demand from first time buyers, as well as higher bids from cash investors for foreclosed homes. This is supported by our home listings index, which fell to 75 in September from 82 in August, but remains well above a neutral reading (any reading above 50 indicates lower inventory levels). However, we expect more supply to hit the market based on the likely increase in foreclosures.
Comments from real estate agents:
■ “First time buyers are scrambling to get their closing offers accepted before deadline of tax credit. We also still see many cash investors out there.”
■ “We see a good number of first time FHA buyers looking to buy, but unfortunately they are being outbid by cash investors.”
Hovnanian, KB Home and Lennar have the greatest exposure. Hovnanian has the largest percent of sales at approx. 15%, followed by KB Home (7%), and Lennar (6%).
Exhibit 21: Buyers Acting Quickly Ahead of Tax Credit Deadline, Cash Investors Continue to Outbid
Traffic Levels Versus Expectations
33%
36%30%
More than expected Meets expectations Less than expected
How Do the Recent 30 Days Compare to the Prior 30 Days...
36%
17%
31%
42%
70%
28%21%
13%
41%
0%10%20%30%40%50%60%70%80%
Home Prices Incentives Time to Sell
Increased Remained the same Decreased
Source: Credit Suisse estimates
Traffic
Home Prices
Incentives
September Market Trends
“We have been seeing a first-time buyer frenzy.”
08 October 2009
Monthly Survey of Real Estate Agents 24
Seattle, WA – Buyers Move toward Low End Market as Inventory Falls (6,529 single-family permits in 2008, 12th largest market in the country)
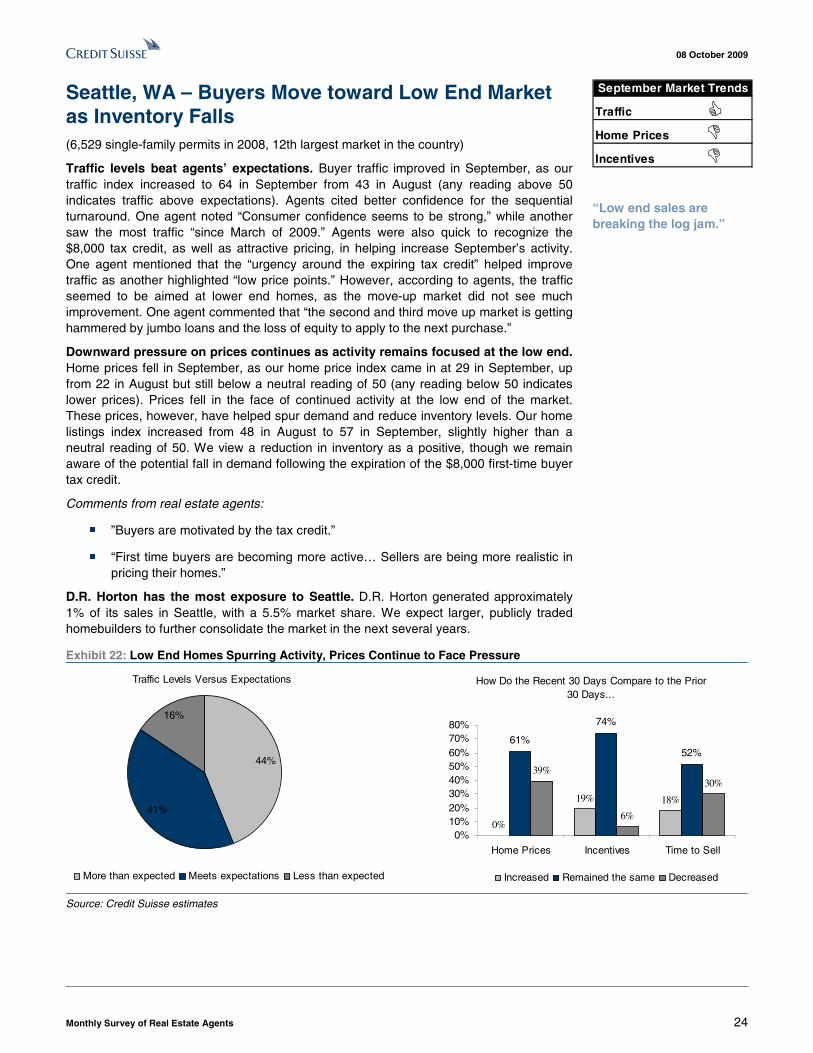
Traffic levels beat agents’ expectations. Buyer traffic improved in September, as our traffic index increased to 64 in September from 43 in August (any reading above 50 indicates traffic above expectations). Agents cited better confidence for the sequential turnaround. One agent noted “Consumer confidence seems to be strong,” while another saw the most traffic “since March of 2009.” Agents were also quick to recognize the $8,000 tax credit, as well as attractive pricing, in helping increase September’s activity. One agent mentioned that the “urgency around the expiring tax credit” helped improve traffic as another highlighted “low price points.” However, according to agents, the traffic seemed to be aimed at lower end homes, as the move-up market did not see much improvement. One agent commented that “the second and third move up market is getting hammered by jumbo loans and the loss of equity to apply to the next purchase.”
Downward pressure on prices continues as activity remains focused at the low end. Home prices fell in September, as our home price index came in at 29 in September, up from 22 in August but still below a neutral reading of 50 (any reading below 50 indicates lower prices). Prices fell in the face of continued activity at the low end of the market. These prices, however, have helped spur demand and reduce inventory levels. Our home listings index increased from 48 in August to 57 in September, slightly higher than a neutral reading of 50. We view a reduction in inventory as a positive, though we remain aware of the potential fall in demand following the expiration of the $8,000 first-time buyer tax credit.
Comments from real estate agents:
■ ”Buyers are motivated by the tax credit.”
■ “First time buyers are becoming more active… Sellers are being more realistic in pricing their homes.”
D.R. Horton has the most exposure to Seattle. D.R. Horton generated approximately 1% of its sales in Seattle, with a 5.5% market share. We expect larger, publicly traded homebuilders to further consolidate the market in the next several years.
Exhibit 22: Low End Homes Spurring Activity, Prices Continue to Face Pressure
Traffic Levels Versus Expectations
41%
44%
16%
More than expected Meets expectations Less than expected
How Do the Recent 30 Days Compare to the Prior 30 Days...
0%
19% 18%
61%
74%
52%
39%
6%
30%
0%10%20%30%40%50%60%70%80%
Home Prices Incentives Time to Sell
Increased Remained the same Decreased
Source: Credit Suisse estimates
Traffic
Home Prices
Incentives
September Market Trends
!
!
“Low end sales are breaking the log jam.”
08 October 2009
Monthly Survey of Real Estate Agents 25
Tampa, FL –Foreclosures and Short Sales Control Market Activity (5,082 single-family permits in 2008, 19th largest market in the country)
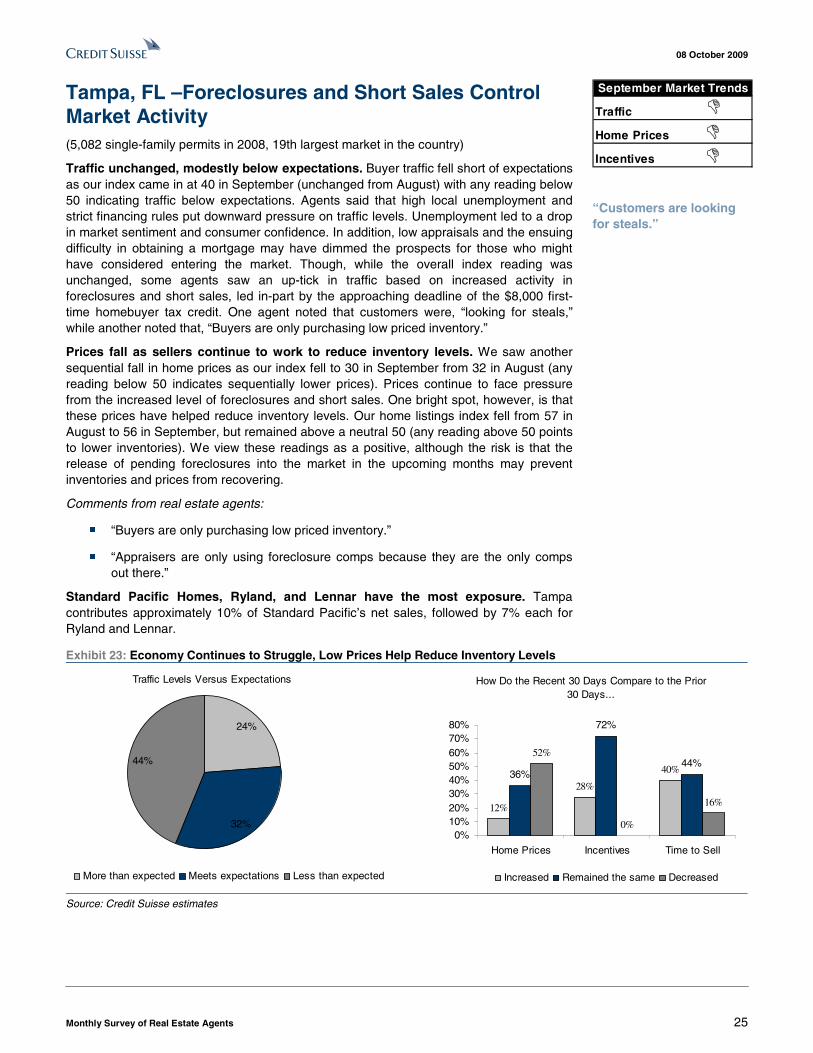
Traffic unchanged, modestly below expectations. Buyer traffic fell short of expectations as our index came in at 40 in September (unchanged from August) with any reading below 50 indicating traffic below expectations. Agents said that high local unemployment and strict financing rules put downward pressure on traffic levels. Unemployment led to a drop in market sentiment and consumer confidence. In addition, low appraisals and the ensuing difficulty in obtaining a mortgage may have dimmed the prospects for those who might have considered entering the market. Though, while the overall index reading was unchanged, some agents saw an up-tick in traffic based on increased activity in foreclosures and short sales, led in-part by the approaching deadline of the $8,000 first-time homebuyer tax credit. One agent noted that customers were, “looking for steals,” while another noted that, “Buyers are only purchasing low priced inventory.”
Prices fall as sellers continue to work to reduce inventory levels. We saw another sequential fall in home prices as our index fell to 30 in September from 32 in August (any reading below 50 indicates sequentially lower prices). Prices continue to face pressure from the increased level of foreclosures and short sales. One bright spot, however, is that these prices have helped reduce inventory levels. Our home listings index fell from 57 in August to 56 in September, but remained above a neutral 50 (any reading above 50 points to lower inventories). We view these readings as a positive, although the risk is that the release of pending foreclosures into the market in the upcoming months may prevent inventories and prices from recovering.
Comments from real estate agents:
■ “Buyers are only purchasing low priced inventory.”
■ “Appraisers are only using foreclosure comps because they are the only comps out there.”
Standard Pacific Homes, Ryland, and Lennar have the most exposure. Tampa contributes approximately 10% of Standard Pacific’s net sales, followed by 7% each for Ryland and Lennar.
Exhibit 23: Economy Continues to Struggle, Low Prices Help Reduce Inventory Levels
Traffic Levels Versus Expectations
32%
44%
24%
More than expected Meets expectations Less than expected
How Do the Recent 30 Days Compare to the Prior 30 Days...
12%
28%
40%36%
72%
44%52%
0%
16%
0%10%20%30%40%50%60%70%80%
Home Prices Incentives Time to Sell
Increased Remained the same Decreased
Source: Credit Suisse estimates
Traffic
Home Prices
Incentives
September Market Trends
!!!
“Customers are looking for steals.”
08 October 2009
Monthly Survey of Real Estate Agents 26
Washington, D.C. – Demand Increases as Buyers Gain Confidence (9,076 single-family permits in 2008, 5th largest market in the country)
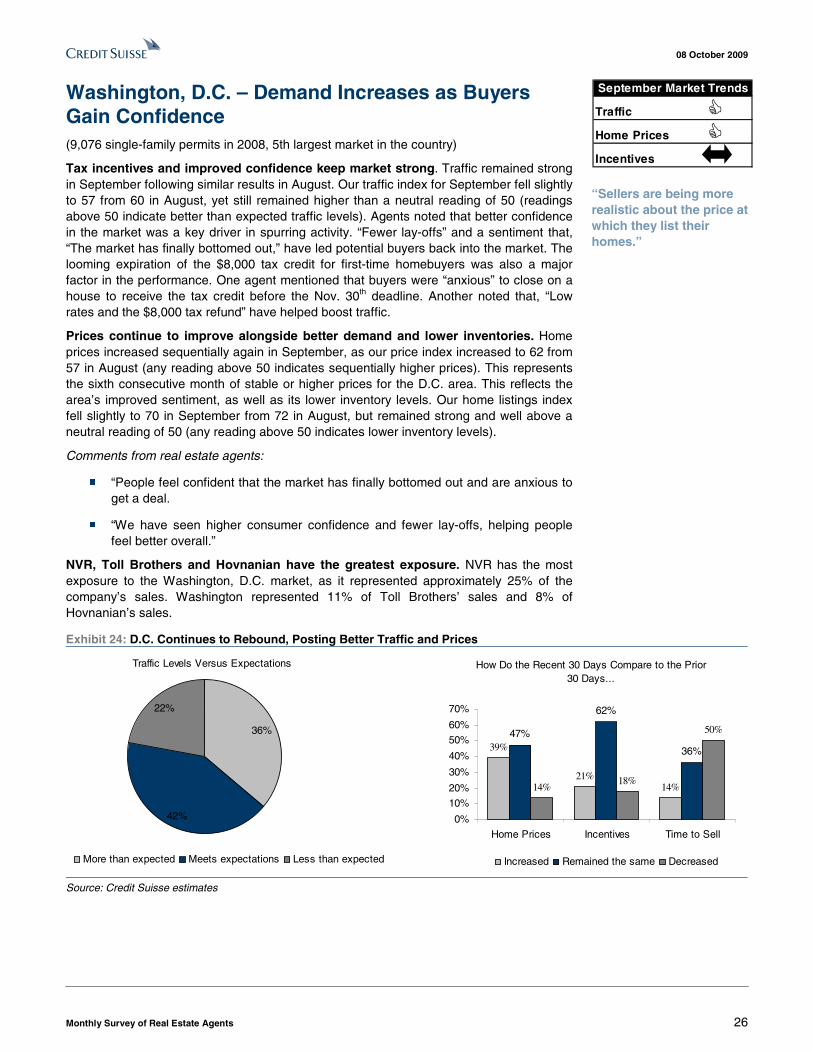
Tax incentives and improved confidence keep market strong. Traffic remained strong in September following similar results in August. Our traffic index for September fell slightly to 57 from 60 in August, yet still remained higher than a neutral reading of 50 (readings above 50 indicate better than expected traffic levels). Agents noted that better confidence in the market was a key driver in spurring activity. “Fewer lay-offs” and a sentiment that, “The market has finally bottomed out,” have led potential buyers back into the market. The looming expiration of the $8,000 tax credit for first-time homebuyers was also a major factor in the performance. One agent mentioned that buyers were “anxious” to close on a house to receive the tax credit before the Nov. 30th deadline. Another noted that, “Low rates and the $8,000 tax refund” have helped boost traffic.
Prices continue to improve alongside better demand and lower inventories. Home prices increased sequentially again in September, as our price index increased to 62 from 57 in August (any reading above 50 indicates sequentially higher prices). This represents the sixth consecutive month of stable or higher prices for the D.C. area. This reflects the area’s improved sentiment, as well as its lower inventory levels. Our home listings index fell slightly to 70 in September from 72 in August, but remained strong and well above a neutral reading of 50 (any reading above 50 indicates lower inventory levels).
Comments from real estate agents:
■ “People feel confident that the market has finally bottomed out and are anxious to get a deal.
■ “We have seen higher consumer confidence and fewer lay-offs, helping people feel better overall.”
NVR, Toll Brothers and Hovnanian have the greatest exposure. NVR has the most exposure to the Washington, D.C. market, as it represented approximately 25% of the company’s sales. Washington represented 11% of Toll Brothers’ sales and 8% of Hovnanian’s sales.
Exhibit 24: D.C. Continues to Rebound, Posting Better Traffic and Prices
Traffic Levels Versus Expectations
42%
36%
22%
More than expected Meets expectations Less than expected
How Do the Recent 30 Days Compare to the Prior 30 Days...
39%
21%14%
47%
62%
36%
14%18%
50%
0%
10%
20%
30%
40%
50%
60%
70%
Home Prices Incentives Time to Sell
Increased Remained the same Decreased
Source: Credit Suisse estimates
Traffic
Home Prices
Incentives
September Market Trends
“Sellers are being more realistic about the price at which they list their homes.”
08 October 2009
Monthly Survey of Real Estate Agents 27
Additional Key Housing Markets
08 October 2009
Monthly Survey of Real Estate Agents 28
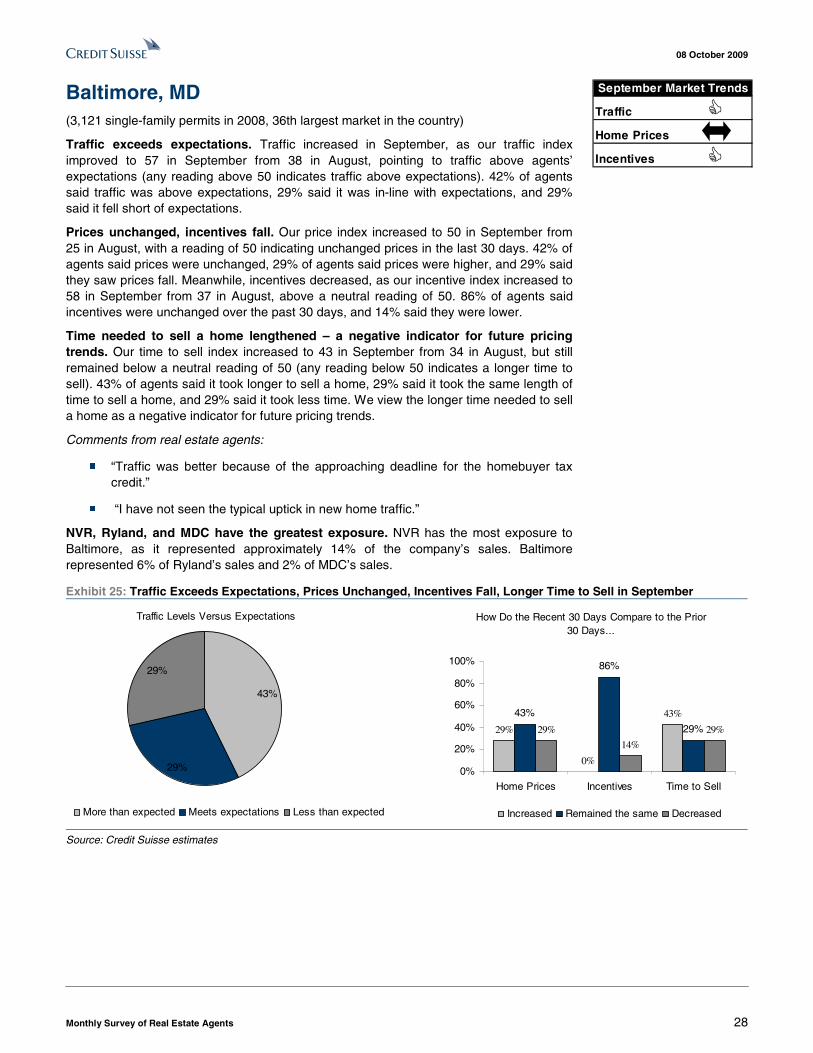
Baltimore, MD (3,121 single-family permits in 2008, 36th largest market in the country)
Traffic exceeds expectations. Traffic increased in September, as our traffic index improved to 57 in September from 38 in August, pointing to traffic above agents’ expectations (any reading above 50 indicates traffic above expectations). 42% of agents said traffic was above expectations, 29% said it was in-line with expectations, and 29% said it fell short of expectations.
Prices unchanged, incentives fall. Our price index increased to 50 in September from 25 in August, with a reading of 50 indicating unchanged prices in the last 30 days. 42% of agents said prices were unchanged, 29% of agents said prices were higher, and 29% said they saw prices fall. Meanwhile, incentives decreased, as our incentive index increased to 58 in September from 37 in August, above a neutral reading of 50. 86% of agents said incentives were unchanged over the past 30 days, and 14% said they were lower.
Time needed to sell a home lengthened – a negative indicator for future pricing trends. Our time to sell index increased to 43 in September from 34 in August, but still remained below a neutral reading of 50 (any reading below 50 indicates a longer time to sell). 43% of agents said it took longer to sell a home, 29% said it took the same length of time to sell a home, and 29% said it took less time. We view the longer time needed to sell a home as a negative indicator for future pricing trends.
Comments from real estate agents:
■ “Traffic was better because of the approaching deadline for the homebuyer tax credit.”
■ “I have not seen the typical uptick in new home traffic.”
NVR, Ryland, and MDC have the greatest exposure. NVR has the most exposure to Baltimore, as it represented approximately 14% of the company’s sales. Baltimore represented 6% of Ryland’s sales and 2% of MDC’s sales.
Exhibit 25: Traffic Exceeds Expectations, Prices Unchanged, Incentives Fall, Longer Time to Sell in September
Traffic Levels Versus Expectations
29%
29%
43%
More than expected Meets expectations Less than expected
How Do the Recent 30 Days Compare to the Prior 30 Days...
29%
0%
43%43%
86%
29%29%
14%
29%
0%
20%
40%
60%
80%
100%
Home Prices Incentives Time to Sell
Increased Remained the same Decreased
Source: Credit Suisse estimates
Traffic
Home Prices
Incentives
September Market Trends
08 October 2009
Monthly Survey of Real Estate Agents 29
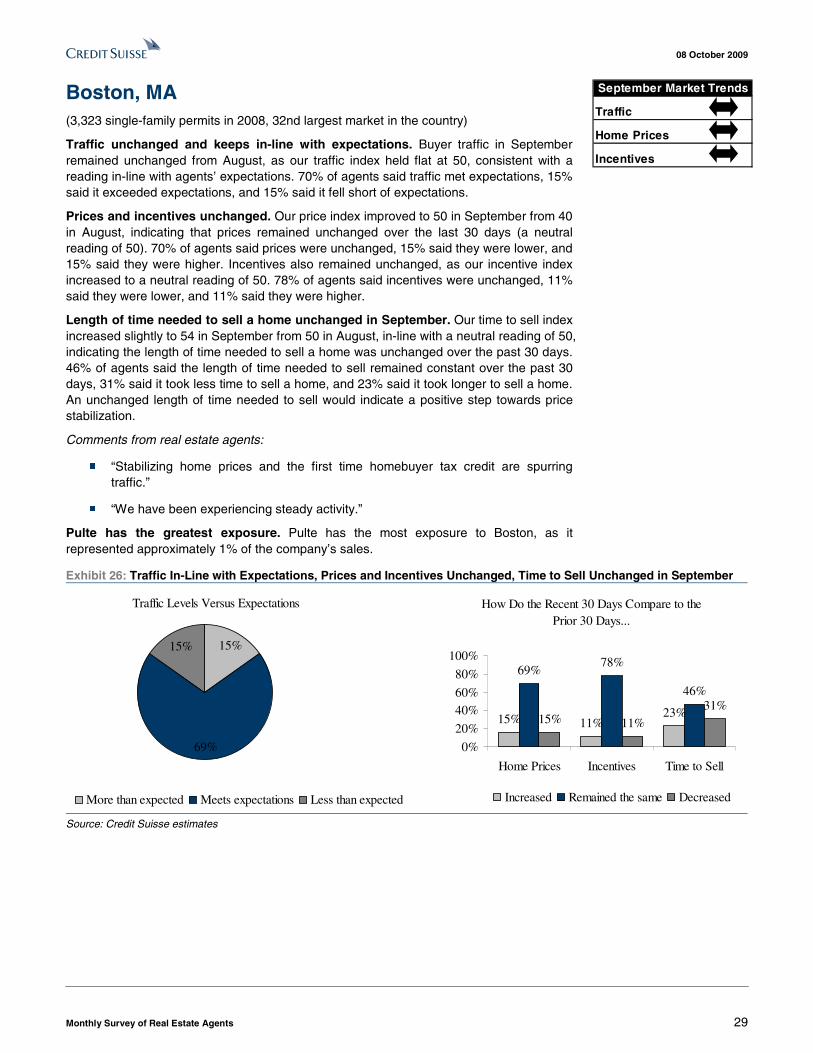
Boston, MA (3,323 single-family permits in 2008, 32nd largest market in the country)
Traffic unchanged and keeps in-line with expectations. Buyer traffic in September remained unchanged from August, as our traffic index held flat at 50, consistent with a reading in-line with agents’ expectations. 70% of agents said traffic met expectations, 15% said it exceeded expectations, and 15% said it fell short of expectations.
Prices and incentives unchanged. Our price index improved to 50 in September from 40 in August, indicating that prices remained unchanged over the last 30 days (a neutral reading of 50). 70% of agents said prices were unchanged, 15% said they were lower, and 15% said they were higher. Incentives also remained unchanged, as our incentive index increased to a neutral reading of 50. 78% of agents said incentives were unchanged, 11% said they were lower, and 11% said they were higher.
Length of time needed to sell a home unchanged in September. Our time to sell index increased slightly to 54 in September from 50 in August, in-line with a neutral reading of 50, indicating the length of time needed to sell a home was unchanged over the past 30 days. 46% of agents said the length of time needed to sell remained constant over the past 30 days, 31% said it took less time to sell a home, and 23% said it took longer to sell a home. An unchanged length of time needed to sell would indicate a positive step towards price stabilization.
Comments from real estate agents:
■ “Stabilizing home prices and the first time homebuyer tax credit are spurring traffic.”
■ “We have been experiencing steady activity.”
Pulte has the greatest exposure. Pulte has the most exposure to Boston, as it represented approximately 1% of the company’s sales.
Exhibit 26: Traffic In-Line with Expectations, Prices and Incentives Unchanged, Time to Sell Unchanged in September
Traffic Levels Versus Expectations
69%
15%15%
More than expected Meets expectations Less than expected
How Do the Recent 30 Days Compare to the Prior 30 Days...
15% 11%23%
69%78%
46%
15% 11%31%
0%
20%
40%60%
80%
100%
Home Prices Incentives Time to Sell
Increased Remained the same Decreased
Source: Credit Suisse estimates
Traffic
Home Prices
Incentives
September Market Trends
08 October 2009
Monthly Survey of Real Estate Agents 30
Charleston, SC (3,666 single-family permits in 2008, 29th largest market in the country)
Traffic below agents’ expectations. Our buyer traffic index increased to 40 in September from 31 in August, but still fell short of expectations (a reading below 50 indicates traffic below expectations). 40% of agents said traffic was less than expected, 40% said it was in-line with expectations, and 20% said it exceeded expectations.
Prices and incentives worsen. Home prices fell further in September, as our price index improved to 30 from 19 in August, but still fell short of a neutral reading of 50. 60% of agents said home prices were unchanged over the last 30 days, while 40% said they were lower. Incentives increased, as our incentive index increased to 40 from 31 in August, though any reading below 50 indicates higher incentives over the last 30 days. 80% of agents said incentives remained constant, and 20% said they were higher.
Length of time needed to sell a home increased – a negative indicator for future pricing trends. Our time to sell index fell to 30 in September from 31 in August, with any reading below 50 indicating a longer time needed to sell a home. 60% of agents said the time to sell was unchanged over the past 30 days, while 40% it took longer to sell a home. We view the longer time needed to sell a home as a negative indicator for future pricing trends.
Comments from real estate agents:
■ “The economy has negatively impacted our traffic.”
■ “We have seen a fall in consumer confidence.”
Ryland and Centex have the greatest exposure. Ryland has the most exposure to the Charleston market, at approximately 3% of the company’s sales. Charleston represented 2% of Centex’s sales.
Exhibit 27: Traffic Below Expectations, Prices and Incentives Worsen, Time To Sell Lengthens in September
Traffic Levels Versus Expectations
40%
40%
20%
More than expected Meets expectations Less than expected
How Do the Recent 30 Days Compare to the Prior 30 Days...
0%
20%
40%
60%
80%
60%
40%
0% 0%0%
20%
40%
60%
80%
100%
Home Prices Incentives Time to Sell
Increased Remained the same Decreased
Source: Credit Suisse estimates
Traffic
Home Prices
Incentives
September Market Trends
!!!
08 October 2009
Monthly Survey of Real Estate Agents 31
Cincinnati, OH (3,314 single-family permits in 2008, 33rd largest market in the country)
Traffic in-line with expectations. Our buyer traffic index increased to 45 in September from 38 in August, indicating traffic levels in-line with agents’ expectations (a reading of 50 suggests traffic met expectations). 40% of agents said traffic was in-line with expectations, 35% of agents said traffic was below expectations, and 25% said it exceeded expectations.
Prices fall, incentives increase. Home prices continued to fall in September, as our home price index increased to 43 from 14 in August, though a reading below 50 indicates lower prices over the past 30 days. 65% of agents said prices were unchanged, 25% said they were lower, and 10% said they were higher. Incentives also increased modestly, as our incentive index increased to 43 in September from 36 in August (below a neutral reading of 50). 73% of agents said incentives were unchanged, 20% said they increased, and 7% said they fell.
Time needed to sell a home lengthened – a negative indicator for future pricing trends. Our time to sell index increased to 30 in September from 14 in August, indicating a longer time needed to sell a home over the past 30 days (any reading below 50 suggests a longer time to sell). 50% of agents said the time to sell was unchanged, 45% said it took longer to sell a home, and 5% said it took less time to sell a home. We view the longer time needed to sell as a negative indicator of future pricing trends.
Comments from real estate agents:
■ “The economy seems more stable than in previous months. We have seen little or no additional job losses”
■ “The tax incentive seems to be reviving interest.”
NVR and Ryland have the greatest exposure. Ryland has the most exposure to the Cincinnati market, as it represented approximately 2% of the company’s sales.
Exhibit 28: Traffic In-Line with Expectations, Prices Fall, Incentives Increase, Time to Sell Lengthens in September
Traffic Levels Versus Expectations
40%
35%25%
More than expected Meets expectations Less than expected
How Do the Recent 30 Days Compare to the Prior 30 Days...
10%20%
45%
65%73%
50%
25%
7% 5%
0%10%20%30%40%50%60%70%80%
Home Prices Incentives Time to Sell
Increased Remained the same Decreased
Source: Credit Suisse estimates
Traffic
Home Prices
Incentives
September Market Trends
!!
08 October 2009
Monthly Survey of Real Estate Agents 32
Columbus, OH (2,666 single-family permits in 2008, 45th largest market in the country)
Traffic improves in September. Our buyer traffic index improved to 38 in September from 20 in August, indicating improved traffic over the past 30 days, but still falling short of agents’ expectations (readings below 50 indicate traffic below expectations). 50% of agents said traffic fell short of expectations, 25% said traffic exceeded expectations, and 25% said it was in-line with expectations.
Prices remain under pressure. Home prices fell again in September, as our price index improved to 25 in September from 20 in August (any reading below 50 indicates sequentially lower home prices). 50% of agents said prices were lower over the past 30 days, and 50% said they were unchanged. Incentives increased, as our incentive index fell to 12 in September from 30 in August, (readings below 50 indicate higher incentives). 75% of agents said incentives were higher in the last 30 days, while 25% said they were unchanged.
Length of time needed to sell a home increased – a negative indicator for future pricing trends. Our time to sell index increased to 38 in September from 30 in August, falling short of a neutral reading of 50, indicating a longer time needed to sell a home over the past 30 days (any reading below 50 suggests a longer time to sell). 50% of agents said it took longer to sell a home in September, 25% said the length of time needed to sell was unchanged, and 20% said it took less time to sell. We view a longer time to sell as a negative for future pricing trends.
Comments from real estate agents:
■ “There has not been any job growth.”
■ “Early September is generally slow, but this has been disappointingly slow.”
Centex has the most exposure to the Columbus market, as it represents approximately 2% of the company’s sales.
Exhibit 29: Traffic Below Expectations, Prices and Incentives Worsen, Time to Sell Lengthens in September
Traffic Levels Versus Expectations
25%
25%
50%
More than expected Meets expectations Less than expected
How Do the Recent 30 Days Compare to the Prior 30 Days...
0%
75%
50%50%
25% 25%
50%
0%
25%
0%10%20%30%40%50%60%70%80%
Home Prices Incentives Time to Sell
Increased Remained the same Decreased
Source: Credit Suisse estimates
Traffic
Home Prices
Incentives
September Market Trends
!!
08 October 2009
Monthly Survey of Real Estate Agents 33
Detroit, MI (1,950 single-family permits in 2008, 60th largest market in the country)
Traffic falls slightly and remains below expectations. Buyer traffic fell in September to 39 from 40 in August and remained modestly below agents’ expectations (any reading below 50 indicates traffic below agents’ expectations). 43% of agents said traffic was in-line with expectations, 40% said it fell short of expectations, and 17% said it exceeded expectations.
Prices fall, incentives increase. Home prices continued to decrease, as our price index fell to 15 in September from 28 in August; well below a neutral reading of 50 (any reading below 50 indicates sequentially lower home prices). 70% of agents said prices declined over the past 30 days, and 30% said they were unchanged. Incentives also increased modestly, as our incentive index slipped to 41 in September from 44 in August, slightly below a neutral reading of 50. 61% of agents said incentives were unchanged, 29% said they were higher and 10% said they were lower.
Time needed to sell a home unchanged – a positive step towards price stabilization. Our time to sell index improved to 50 from 33 in August, indicating an unchanged time needed to sell a home relative to last month (readings of 50 indicate an unchanged time to sell). 48% of agents said the length of time needed to sell a home was unchanged over the past 30 days, 26% said it took less time to sell a home, and 26% said it took longer to sell a home. We believe an unchanged time to sell would be a positive step towards price stabilization.
Comments from real estate agents:
■ “The poor local economy has had a drag on activity.”
■ “We have seen increased difficulty for people trying to obtain new home financing.”
Pulte, Toll Brothers, and Centex have the greatest exposure. Pulte has the most exposure to the Detroit market, as it represents approximately 5% of the company’s sales. Detroit represents approximately 5% of Toll Brother’s sales and 2% of Centex’s sales.
Exhibit 30: Traffic Below Expectations, Prices and Incentives Deteriorate, Time to Sell Unchanged in September
Traffic Levels Versus Expectations
43%
39%
17%
More than expected Meets expectations Less than expected
How Do the Recent 30 Days Compare to the Prior 30 Days...
0%
29% 26%30%
62%48%
70%
10%
26%
0%
20%
40%
60%
80%
Home Prices Incentives Time to Sell
Increased Remained the same Decreased
Source: Credit Suisse estimates
Traffic
Home Prices
Incentives
September Market Trends
!!!
08 October 2009
Monthly Survey of Real Estate Agents 34
Nashville, TN (5,621 single-family permits in 2008, 16th largest market in the country)
Traffic remains below expectations. Buyer traffic decreased, as our traffic index fell from to 23 in September from 32 in August and remained below agents’ expectations (any reading below 50 indicates traffic below agents’ expectations). 73% of agents said traffic fell short of expectations, 18% said it exceeded expectations, and 9% said traffic was in-line with expectations.
Prices fall, incentives stay constant. Home prices continued to fall, as our home price index improved to 32 in September from 29 in August, but remained below a neutral reading of 50 (any reading below 50 indicates sequentially lower prices). 64% of agents said prices were unchanged over the past 30 days, and 36% said they were lower. Incentives remained unchanged, as our incentive index improved to a neutral reading of 50 from a weak reading of 38 in August. 82% of agents said incentives were unchanged, 9% said they were higher, and 9% said they were lower.
Length of time needed to sell a home increased – a negative indicator for future pricing trends. Our time to sell index fell to 23 in September from 29 in August, indicating a longer time needed to sell a home (any reading below 50 suggests a longer time to sell). 55% of agents said it took longer to sell a home over the past 30 days and 45% said the time to sell was unchanged. We view the longer time to sell as a negative indicator for future pricing trends.
Comments from real estate agents:
■ “We usually see a slowdown at the start of the school year, but this year it is worse.”
■ “There have been issues surrounding consumer confidence, appraisals, and financing.”
Centex has the greatest exposure. Centex has the most exposure to the Nashville market, but only represents approximately 1% of the company’s sales.
Exhibit 31: Traffic Below Expectations, Prices Fall, Incentives Unchanged, Time to Sell Lengthens in September
Traffic Levels Versus Expectations
9%
73%
18%
More than expected Meets expectations Less than expected
How Do the Recent 30 Days Compare to the Prior 30 Days...
0%9%
55%64%
82%
45%36%
9%0%
0%
20%
40%60%
80%
100%
Home Prices Incentives Time to Sell
Increased Remained the same Decreased
Source: Credit Suisse estimates
Traffic
Home Prices
Incentives
September Market Trends
!!
08 October 2009
Monthly Survey of Real Estate Agents 35
Philadelphia, PA-Southern NJ (6,858 single-family permits in 2008, 10th largest market in the country)
Traffic worsens. Buyer traffic fell in September and was again below agents’ expectations, as our traffic index decreased to 29 in September from 41 in August (readings below 50 indicate traffic below agents’ expectations). 50% of agents said traffic was below expectations, 42% said it was in-line with expectations, and 8% said it exceeded expectations.
Home prices continue to fall. Home prices fell further in September, as our price index came in at 27, down from 33 in August and below a neutral reading of 50. 54% of agents said prices decreased over the past 30 days, 38% said they were unchanged, and 8% said they were higher. Sellers also increased incentives, as our incentive index increased to 41 in September from 36 in August (any reading below 50 indicates higher incentives). 54% of agents said incentives were unchanged, 32% said incentives increased and 14% said they were lower.
Length of time needed to sell a home increased – a negative indicator for future pricing trends. Our time to sell index fell to 38 in September from 48 in August, indicating a longer time needed to sell a home (any reading below 50 suggests a longer time to sell). 49% of agents said the time to sell was unchanged, 38% said it took longer to sell a home, and 13% said it took less time to sell. We view the longer time to sell as a negative indicator for future pricing trends.
Comments from real estate agents:
■ “The lasting job market instability has made people weary of purchasing homes.”
■ “We have seen a lot of buyers bidding well below asking prices.”
Toll Brothers, NVR, and Hovnanian have the greatest exposure. Toll Brothers has the most exposure to the Philadelphia-Southern NJ market, as it represented approximately 9% of the company’s sales, followed by NVR and Hovnanian at 6% and 3% of sales, respectively.
Exhibit 32: Traffic below Expectations, Prices and Incentives Worsen, Time to Sell Lengthens in September
Traffic Levels Versus Expectations
42%
8%
50%
More than expected Meets expectations Less than expected
How Do the Recent 30 Days Compare to the Prior 30 Days...
8%
32%38%38%
55%50%54%
14% 13%
0%
20%
40%
60%
Home Prices Incentives Time to Sell
Increased Remained the same Decreased
Source: Credit Suisse estimates
Traffic
Home Prices
Incentives
September Market Trends
!!!
08 October 2009
Monthly Survey of Real Estate Agents 36
Port St. Lucie, FL (854 single-family permits in 2008, 114th largest market in the country)
Traffic meets expectations. Buyer traffic fell in September, thought it met agents’ expectations, as our traffic index decreased from 61 in August to 50 in September (a reading of 50 points to traffic in-line with expectations). 43% of agents said traffic fell short of expectations, 43% said it exceeded expectations, and 14% said it was in-line with expectations.
Home price fall, incentives remain unchanged. Home prices remained under pressure in September, as our price index increased to 29 in September from 22 in August, with readings below 50 indicating sequentially lower prices. 57% of agents said prices remained unchanged over the past 30 days, and 43% said they were lower. Incentives remained constant, as our incentive index improved from 44 in August to a neutral reading of 50 in September. 42% of agents said incentives were unchanged, 29% said they were higher and 29% said they were lower.
Time needed to sell a home unchanged – a positive step towards price stabilization Our time to sell index fell to 50 in September from 61 in August, pointing to a unchanged time needed to sell a home (a neutral reading of 50 suggests a consistent time needed to sell a home). 43% of agents said it took less time to sell a home over the past 30 days, 43% said it took longer to sell a home, and 14% said the time to sell was unchanged. We believe a consistent time to sell would be a positive step towards price stabilization.
Comments from real estate agents:
■ “Prices have continued to fall, attracting buyers to the market.”
■ “The economy’s uncertain future has kept people away.”
Pulte and Standard Pacific have the greatest exposure. Pulte has the most exposure to the Port St. Lucie market, as it represents approximately 5% of the company’s sales. Port St. Lucie represents 3% of Standard Pacific’s sales.
Exhibit 33: Traffic In-Line with Expectations, Prices Fall, Incentives Unchanged, Time to Sell Unchanged in September
Traffic Levels Versus Expectations
14%
43%43%
More than expected Meets expectations Less than expected
How Do the Recent 30 Days Compare to the Prior 30 Days...
0%
29%
43%
57%
43%
14%
43%
29%
43%
0%
20%
40%
60%
Home Prices Incentives Time to Sell
Increased Remained the same Decreased
Source: Credit Suisse estimates
Traffic
Home Prices
Incentives
September Market Trends
!
08 October 2009
Monthly Survey of Real Estate Agents 37
Portland, OR (4,167 single-family permits in 2008, 24th largest market in the country)
Better traffic in September, but below agents’ expectations. Buyer traffic improved in September though it remained below agents’ expectations, as our traffic index increased to 45 in September from 29 in August, with any reading below 50 pointing to traffic levels below agents’ expectations. 39% of agents said traffic was lower than expected, 32% said it was in-line with expectations, and 29% of agents saw better than expected traffic.
Home prices and incentives worsen. Home prices continued to fall in September, as our price index came in at 29 (from 31 in August), with any reading below 50 indicating lower home prices over the past 30 days. 50% of agents said prices were unchanged, 46% of agents said prices were sequentially lower, and 4% said they were higher. Meanwhile, incentives increased as our incentive index increased to 44 in September from 41 in August, with readings below 50 indicating higher incentives. 81% of agents said incentives were unchanged, 15% said they were higher and 4% said they were lower.
Length of time needed to sell a home unchanged again in September. Our time to sell index remained at 50 in September, consistent with a neutral level indicating the length of time needed to sell a home was unchanged over the past 30 days. 50% of agents said the length of time needed to sell was unchanged, 25% said it took longer to sell a home, and 25% said it took less time to sell. We view an unchanged time to sell a home as a positive indicator of future pricing trends.
Comments from real estate agents:
■ “People are still nervous about what direction Congress is looking to take.”
■ “The unstable economy and poor employment outlook have kept people on the sidelines.”
D.R. Horton and Centex have the greatest exposure. Portland represented approximately 1% of sales for both D.R. Horton and Centex.
Exhibit 34: Traffic Below Expectations, Prices and Incentives Worsen, Time to Sell Unchanged in September
Traffic Levels Versus Expectations
32%
39%29%
More than expected Meets expectations Less than expected
How Do the Recent 30 Days Compare to the Prior 30 Days...
4%15%
25%
50%
81%
50%46%
4%
25%
0%
20%
40%60%
80%
100%
Home Prices Incentives Time to Sell
Increased Remained the same Decreased
Source: Credit Suisse estimates
Traffic
Home Prices
Incentives
September Market Trends
!!!
08 October 2009
Monthly Survey of Real Estate Agents 38
Raleigh, NC (6,559 single-family permits in 2008, 11th largest market in the country)
Traffic worsens in September; remains below expectations. Buyer traffic levels fell in September, and remained below agents’ expectations for this time of year, as our traffic index decreased from 42 in August to 27 in September, with a reading of 50 indicating traffic below expectations. 54% of agents said traffic fell short of expectations, 38% said it was in-line with expectations and 8% said it exceeded expectations.
Home prices continue to fall. Home prices fell further in September; as our price index fell to 31 from 39 in August, with any reading below 50 indicating lower prices over the past 30 days. 62% of agents said prices were unchanged, and 38% said they were lower. Incentives increased in September, as our index fell to 35 in September from 42 in August, with readings below 50 indicating higher incentives. 69% of agents said incentives were unchanged, and 31% said they were higher.
Length of time needed to sell a home increased – a negative indicator for future pricing trends. Our time to sell index fell to 46 in September from 47 in August, indicating a longer time to sell over the past 30 days. 46% of agents said the time to sell a home was unchanged, 31% said it took longer to sell a home, and 23% said it took less time. We view the longer time to sell as a negative indicator for future pricing trends.
Comments from real estate agents:
■ “Very strict mortgage lending guidelines have had a hampering affect.”
■ “Unemployment and market uncertainty have kept traffic below normal levels.”
Hovnanian, Standard Pacific, and KB Home have the greatest exposure. Hovnanian has the most exposure to the Raleigh market, as it represents approximately 4% of the company’s sales. Raleigh represents 3% and 2% of sales for Standard Pacific and KB Home, respectively.
Exhibit 35: Traffic Below Expectations, Prices and Incentives Deteriorate, Time to Sell Lengthens in September
Traffic Levels Versus Expectations
38%
8%
54%
More than expected Meets expectations Less than expected
How Do the Recent 30 Days Compare to the Prior 30 Days...
0%
31% 31%
62%69%
46%38%
0%
23%
0%
20%
40%
60%
80%
Home Prices Incentives Time to Sell
Increased Remained the same Decreased
Source: Credit Suisse estimates
Traffic
Home Prices
Incentives
September Market Trends
!!!
08 October 2009
Monthly Survey of Real Estate Agents 39
Richmond, VA (3,932 single-family permits in 2008, 26th largest market in the country)
Traffic below expectations in September. Buyer traffic fell in September as our traffic index decreased to 38 in September from 50 in August in September, indicating traffic below agents’ expectations (a reading below 50 suggests traffic below agents’ expectations). 50% of agents said traffic fell short of expectations, 25% said traffic met expectations, and 25% said it exceeded expectations.
Prices fall, incentives increase. Prices continued to fall in September, as our home price index fell to 0 from 18 in August, with any reading below 50 indicating lower prices over the past 30 days. 100% of agents said prices were sequentially lower. Incentives increased, as our incentive index fell to 0 in September from 25 in August, with readings below 50 indicating higher incentives. 100% of agents said incentives were higher.
Length of time needed to sell a home increased – a negative indicator for future pricing trends. Our time to sell index fell to 13 in September from 38 in August, indicating a longer time needed to sell a home over the past 30 days (any reading below 50 suggests a longer time to sell). 75% of agents said the time to sell a home increased over the past 30 days, 25% said the time to sell a home was unchanged.
Comments from real estate agents:
■ “People are still losing their jobs.”
■ “Appraisals are coming in too low.
NVR and Centex have the greatest exposure. NVR has the most exposure to the Richmond market, as it represented approximately 3% of the company’s sales. Richmond represented 1% of sales for Centex.
Exhibit 36: Traffic Below Expectations, Prices and Incentives Worsen, Longer Time to Sell in September
Traffic Levels Versus Expectations
0%67%
33%
More than expected Meets expectations Less than expected
How Do the Recent 30 Days Compare to the Prior 30 Days...
0%
100% 100%
0% 0% 0%
100%
0% 0%0%
50%
100%
150%
Home Prices Incentives Time to Sell
Increased Remained the same Decreased
Source: Credit Suisse estimates
Traffic
Home Prices
Incentives
September Market Trends
!!!
08 October 2009
Monthly Survey of Real Estate Agents 40
Sacramento, CA (3,924 single-family permits in 2008, 27th largest market in the country)
Traffic improves, exceeds expectations. Buyer traffic increased in September and exceeded agents’ expectations, as our traffic index improved to 56 in September from 47 in August, with a reading above 50 indicating better than expected traffic. 56% of agents said traffic was in-line with expectations, 28% said it was above expectations, and 16% said it fell short of expectations.
Prices fall, but incentives remain unchanged. Home prices again fell slightly in September, as our price index remained unchanged from our August reading of 42 (readings below 50 indicate sequentially lower prices). 61% of agents said prices were unchanged over the past 30 days, 28% said they were lower, and 11% said they were higher. However, incentives were unchanged, as our incentive index came in at 53, (as did our August reading) in-line with a neutral reading of 50. 68% of agents said incentives were unchanged over the past month, 19% said they were lower and 13% said they were higher.
Length of time needed to sell a home unchanged in September. Our time to sell index fell to 50 in September from 61 in August, indicating the time to sell a home was unchanged over the past 30 days (a reading of 50 suggests an unchanged time to sell). 66% of agents said the time to sell was unchanged, 17% said it took less time to sell and 17% said it took longer. We believe an unchanged time to sell would be a positive step towards price stabilization.
Comments from real estate agents:
■ “Low mortgage rates and low pricing had a greater affect on traffic than we thought.”
■ “With the buyer tax credit coming to a possible end, people are moving more quickly to buy before the credit expires.”
Meritage, Hovnanian, and Lennar have the greatest exposure. Meritage has the most exposure to the Sacramento market, as it represents approximately 7% of the company’s sales. Sacramento represents 6% of Hovnanian’s sales and 5% of Lennar’s sales.
Exhibit 37: Traffic Exceeds Expectations, Prices Fall, Incentives Unchanged, Time to Sell Unchanged in September
Traffic Levels Versus Expectations
56%
28%17%
More than expected Meets expectations Less than expected
How Do the Recent 30 Days Compare to the Prior 30 Days...
11% 13% 17%
61%69% 67%
28%19% 17%
0%
20%
40%
60%
80%
Home Prices Incentives Time to Sell
Increased Remained the same Decreased
Source: Credit Suisse estimates
Traffic
Home Prices
Incentives
September Market Trends
!
08 October 2009
Monthly Survey of Real Estate Agents 41
San Antonio, TX (5,990 single-family permits in 2008, 13th largest market in the country)
Traffic improves but falls below expectations. Buyer traffic improved in September but continued to disappoint agents, as our traffic index increased to 25 in September from 10 in August, with any reading below 50 indicating traffic below agents’ expectations. 60% of agents said traffic fell short of expectations, 30% said it was in-line with expectations, and 10% said it was better than expected.
Prices fall as incentives increase. Agents said prices decreased sequentially in September, as our price index fell to 40 in September from 45 in August (readings below 50 indicate sequentially lower prices). 40% of agents said prices were unchanged, 40% said they were lower, and 20% said they were higher. Meanwhile, incentives increased as our incentive index decreased to 40 in September from 50 in August (readings below 50 indicate increased incentives). 60% of agents said incentives were unchanged, 30% said they were higher and 10% said they were lower.
Length of time needed to sell a home increased – a negative indicator for future pricing trends. Our time to sell index improved to 35 in September from 25 in August, still indicating a longer time needed to sell a home (readings below 50 suggest a longer time to sell). 50% of agents said the time to sell a home was unchanged over the past 30 days, 40% said it took longer to sell a home, and 10% said it took less time to sell. We view the longer time needed to sell as a negative indicator for future pricing trends.
Comments from real estate agents:
■ “The uncertainty of the future has kept people away from the market.”
■ “The economy’s impact and negative seasonal trends have been greater this month than in the past.”
KB Home, D.R. Horton, and Ryland have the greatest exposure. KB Home has the most exposure to the San Antonio market, as it represents approximately 7% of the company’s sales. San Antonio represents 6% of D.R. Horton’s sales and 3% of Ryland’s sales.
Exhibit 38: Traffic Below Expectations, Prices Fall, Incentives Increase, Longer Time to Sell in September
Traffic Levels Versus Expectations
30%
10%
60%
More than expected Meets expectations Less than expected
How Do the Recent 30 Days Compare to the Prior 30 Days...
20%30%
40%40%
60%50%
40%
10% 10%
0%
20%
40%
60%
80%
Home Prices Incentives Time to Sell
Increased Remained the same Decreased
Source: Credit Suisse estimates
Traffic
Home Prices
Incentives
September Market Trends
!!!
08 October 2009
Monthly Survey of Real Estate Agents 42
San Diego, CA (2,160 single-family permits in 2008, 56th largest market in the country)
Weaker traffic in September; though still ahead of expectations. Buyer traffic fell in September but exceeded agents’ expectations, as our traffic index decreased to 60 in September from 69 in August, marking the fourth out of the past five months in which traffic has been better than expected (any reading above 50 indicates traffic above expectations). 52% of agents said traffic was in-line with expectations, 34% said it exceeded expectations, and 14% said it fell short of expectations.
Prices rise, though incentives increase. Agents again noted higher home prices in September after seeing prices increase in August. Our price index fell slightly to 66 in September from 67 in August, though any reading above 50 indicates higher prices. 49% of agents said prices were unchanged over the past 30 days, 41% said prices increased, and 10% said they were higher. Incentives increased, as our incentive index increased to 44 in September from 33 in August, below a neutral reading of 50. 67% of agents said incentives were unchanged, 22% said they were higher, and 11% said they were lower.
Less time needed to sell a home– a positive indicator for pricing trends. Our time to sell index remained unchanged from August at 57, but remained above a neutral reading of 50, with any reading above 50 suggesting less time needed to sell a home. 58% of agents said the time needed to sell a home was unchanged over the past 30 days, 28% said it took less time to sell a home, and 14% said it took longer to sell a home.
Comments from real estate agents:
■ “There is a positive sentiment in the market that buyers can get a good deal, which is spurring activity.
■ “The homebuyer tax credit, combined with low interest rates and low prices has had a big effect on traffic.”
Standard Pacific, D.R. Horton, and Lennar have the greatest exposure. Standard Pacific has the most exposure to the San Diego market, as it represents approximately 15% of the company’s sales. San Diego represents 5% of D.R. Horton’s sales and 3% of Lennar’s sales.
Exhibit 39: Traffic Above Expectations, Prices Increase, Higher Incentives, Less Time Needed to Sell in September
Traffic Levels Versus Expectations
52%
14%
34%
More than expected Meets expectations Less than expected
How Do the Recent 30 Days Compare to the Prior 30 Days...
41%
22%14%
48%
67%59%
10% 11%
28%
0%
20%
40%
60%
80%
Home Prices Incentives Time to Sell
Increased Remained the same Decreased
Source: Credit Suisse estimates
Traffic
Home Prices
Incentives
September Market Trends
!
08 October 2009
Monthly Survey of Real Estate Agents 43
San Francisco, CA (2,329 single-family permits in 2008, 52nd largest market in the country)
Traffic in-line with agents’ expectations. Buyer traffic weakened in September, though it remained in-line with agents’ expectations, as our traffic index fell to 55 in September from 62 in August, in-line with a neutral reading of 50 (readings above 50 indicate traffic above expectations). 46% of agents said traffic was in-line with expectations, 32% said it exceeded expectations, and 22% said it fell short of expectations.
Prices and incentives flat. Home prices showed a marginal increase, as our price index improved to 55 in September from 47 in August, marginally above a neutral reading of 50. 47% of agents said prices were unchanged over the past 30 days, 31% said they were higher and 22% said they were lower. Incentives remained flat, as our incentive index increased to 46 in September from 44 in August, in-line with a neutral reading of 50. 56% of agents said incentives were unchanged, 26% said they were higher, and 18% said they were lower.
Less time needed to sell a home in September. Our time to sell index fell to 58 September from 59 in August, but still remained above a neutral reading of 50 (readings above 50 suggest a shorter length of time to sell over the past 30 days). 39% of agents said it took less time to sell a home over the past 30 days, 37% said the time to sell was unchanged, and 24% said it took longer to sell a home. We view a shorter length of time as a positive step towards price stabilization.
Comments from real estate agents:
■ “Consumer confidence has been slowly returning.”
■ “We have seen a relationship between entry-level activity and lower prices.”
Toll Brothers, Standard Pacific, and Meritage have the greatest exposure. Toll Brothers has the most exposure to the San Francisco market, as it represented approximately 6% of the company’s sales. San Francisco represented 6% of Standard Pacific’s sales and 3% of Meritage’s sales.
Exhibit 40: Traffic Above Expectations, Prices and Incentives Flat, Shorter Time to Sell in September
Traffic Levels Versus Expectations
46%
32%22%
More than expected Meets expectations Less than expected
How Do the Recent 30 Days Compare to the Prior 30 Days...
31%26% 24%
47%56%
37%
22% 18%
39%
0%
20%
40%
60%
Home Prices Incentives Time to Sell
Increased Remained the same Decreased
Source: Credit Suisse estimates
Traffic
Home Prices
Incentives
September Market Trends
08 October 2009
Monthly Survey of Real Estate Agents 44
Sarasota, FL (1,468 single-family permits in 2008, 75th largest market in the country)
Traffic slips and falls short of expectations. Buyer traffic fell in September, failing to meet agents’ expectations, as our traffic index slipped to 36 in September from 50 in August, (readings below 50 indicate traffic below expectations). 57% of agents said traffic was below expectations, 29% said it exceeded expectations, and 14% said it was in-line with expectations.
Prices and incentives worsen. Home prices fell further in September, as our price index fell to 19 in September from 25 in August, (a reading below 50 indicates decreasing prices in the last 30 days). 74% of agents said prices were lower over the past 30 days, 13% said they were unchanged, and 13% said they were higher. Incentives also worsened (increased), as our incentive index fell to 30 in September from 39 in August, with any reading below 50 indicating higher incentives. 60% of agents said incentives were unchanged, and 40% said they increased.
Length of time needed to sell a home increased – a negative indicator for future pricing trends. We saw an increase in the required time to sell a home in September, as our time to sell index fell to 36 in September from 67 in August (readings below 50 indicate a longer time to sell). 57% of agents said the length of time needed to sell a home increased over the past 30 days, 29% said it took less time to sell a home, and 14% said the time was unchanged.
Comments from real estate agents:
■ “We feel that people are anticipating prices to fall further before entering the market.”
■ “The majority of customers are only in the market for foreclosures and short sales.”
WCI Communities, Standard Pacific, and Lennar have the greatest exposure. WCI has the most exposure to the Sarasota market, as it represented approximately 7% of the company’s sales. Sarasota represented 3% of Standard Pacific’s sales and 2% of Lennar’s sales.
Exhibit 41: Traffic Below Expectations, Prices and Incentives Deteriorate, Time to Sell Lengthens in September
Traffic Levels Versus Expectations
14%
29%
57%
More than expected Meets expectations Less than expected
How Do the Recent 30 Days Compare to the Prior 30 Days...
13%
40%
57%
13%
60%
14%
75%
0%
29%
0%
20%
40%
60%
80%
Home Prices Incentives Time to Sell
Increased Remained the same Decreased
Source: Credit Suisse estimates
Traffic
Home Prices
Incentives
September Market Trends
!!!
08 October 2009
Monthly Survey of Real Estate Agents 45
Tucson, AZ (2,793 single-family permits in 2008, 41st largest market in the country)
Traffic falls slightly below expectations. Buyer traffic was down slightly in September and fell below agents’ expectations, as our traffic index slipped to 44 in September from 46 in August (slightly below a neutral reading of 50). 43% of agents said traffic was in-line with expectations, 35% said it fell short of expectations, and 22% said it exceeded expectations.
Prices fall and incentives increase. Home prices fell modestly in September; as our price index fell to 29 in September from 44 in August coming in well below a neutral reading of 50. 52% of agents said prices fell over the past 30 days, 39% said they were unchanged and 9% said they were higher. Incentives increased, as our incentive index fell to 33 in September from 39 in August (any reading below 50 indicates higher incentives). 57% of agents said incentives were unchanged, 38% said they were higher and 5% said they were lower.
Length of time needed to sell a home unchanged in September. Our time to sell index increased slightly to 54 in September from 50 in August, indicating the length of time needed to sell a home was unchanged for the second consecutive month (a reading of 50 suggests an unchanged time to sell). 48% of agents said the length of time needed to sell a home was unchanged, 30% said it took less time to sell a home, and 22% of agents said it took longer to sell a home.
Comments from real estate agents:
■ “Traffic is down; everyone is still looking for the bottom of the market.”
■ ”Clients are still unable and/or unwilling to move due to the poor economy.”
Meritage, MDC, and KB Home have the greatest exposure. Meritage has the most exposure to the Tucson market, as it represents approximately 11% of the company’s sales. Tucson represents 6% of MDC’s sales and 5% of KB Home’s sales.
Exhibit 42: Traffic Below Expectations, Prices and Incentives Deteriorate, Time to Sell Unchanged in September
Traffic Levels Versus Expectations
43%
22%35%
More than expected Meets expectations Less than expected
How Do the Recent 30 Days Compare to the Prior 30 Days...
9%
38%
22%
39%
57%48%
52%
5%
30%
0%
10%
20%
30%
40%
50%
60%
Home Prices Incentives Time to Sell
Increased Remained the same Decreased
Source: Credit Suisse estimates
Traffic
Home Prices
Incentives
September Market Trends
!!!
08 October 2009
Monthly Survey of Real Estate Agents 46
Virginia Beach, VA (3,246 single-family permits in 2008, 34th largest market in the country)
Traffic remains below agents’ expectations. Buyer traffic increased in September but came in below agents’ expectations, as our traffic index increased to 40 from 39 in August (any reading below 50 indicates traffic below expectations). 50% of agents said traffic fell short of expectations, 30% said it exceeded expectations, and 20% said it was in-line with expectations.
Prices down, but incentives unchanged. Home prices continued to decline in August, as our price index fell to 23 in September from 25 in August, with any reading below 50 indicating sequentially lower prices. 52% of agents said prices were lower over the past 30 days, 39% of agents said they were unchanged, and 9% said they were higher. However, incentives were essentially unchanged, as our incentive index fell slightly to 46, with a neutral reading of 50 in September. 73% of agents said incentives were unchanged, 18% said that incentives increased, and 9% said that incentives decreased.
Longer time needed to sell a home in September. Our time to sell index fell to 36 in September from 39 in August, indicating a longer time needed to sell a home over the past 30 days (any reading below 50 points to a longer time to sell). 55% of agents said it took longer to sell a home, 27% of agents said It took less time to sell a home, and 18% of agents said the time needed to sell a home was unchanged.
Comments from real estate agents:
■ “The poor economy has deterred people from entering the market.”
■ “The sales rate remains very slow relative to recent years.”
Centex has the greatest exposure. Centex has the most exposure to the Virginia Beach market, as it represented approximately 1% of the company’s sales.
Exhibit 43: Traffic Below Expectations, Lower Prices, Flat Incentives, Longer Time to Sell in September
Traffic Levels Versus Expectations
20%
50%
30%
More than expected Meets expectations Less than expected
How Do the Recent 30 Days Compare to the Prior 30 Days...
0%
18%
55%45%
73%
18%
55%
9%
27%
0%
20%
40%
60%
80%
Home Prices Incentives Time to Sell
Increased Remained the same Decreased
Source: Credit Suisse estimates
Traffic
Home Prices
Incentives
September Market Trends
!!
08 October 2009
Monthly Survey of Real Estate Agents 47
Wilmington, NC (2,991 single-family permits in 2008, 38th largest market in the country)
Traffic below agents’ expectations. Buyer traffic declined in September, as our traffic index fell to 25 in September from 33 in August, indicating traffic levels below agents’ expectations (any reading below 50 indicates traffic below expectations). 66% of agents said traffic fell short of expectations, 17% said it was in-line with expectations, and 17% said it exceeded expectations.
Prices worsen, incentives stay flat. Home prices fell for the second consecutive month in September, as our price index slipped to 8 in September from 25 in August, with readings below 50 indicating sequentially lower prices. 83% of agents said prices were lower over the past 30 days, and 17% said they were unchanged. Our incentive index increased from 42 in August to a neutral reading of 50 in September. 100% of agents said incentives were unchanged.
Length of time needed to sell a home increased – a negative indicator for future pricing trends. Our time to sell index fell to 25 in September from 29 in August, with any reading below 50 indicating a longer time needed to sell a home. 66% of agents said the length of time needed to sell a home was longer over the past 30 days, while 17% said it less time to sell a home, and 17% said the time to sell a home was unchanged. We view the longer time needed to sell a home as a negative indicator of future pricing trends.
Comments from real estate agents:
■ “Buyers are worried about more price declines and are waiting for a better deal.”
■ “Economic apprehension has dragged on traffic and activity.”
The Wilmington market represented less than 1% of sales for all homebuilders in our coverage universe.
Exhibit 44: Traffic Below Expectations, Pricing Falls, and Incentives Flat, Time to Sell Lengthens in September
Traffic Levels Versus Expectations
17%
17%
67%
More than expected Meets expectations Less than expected
How Do the Recent 30 Days Compare to the Prior 30 Days...
0% 0%
67%
17%
100%
17%
83%
0%17%
0%
20%
40%
60%
80%
100%
120%
Home Prices Incentives Time to Sell
Increased Remained the same Decreased
Source: Credit Suisse estimates
Traffic
Home Prices
Incentives
September Market Trends
!!
08 October 2009
Monthly Survey of Real Estate Agents 48
Historical Trends Traffic unchanged in September as buyers look to take advantage of the expiring tax credit. Historical traffic trends:
Time needed to sell a home lengthened in September; shorter time to sell would be positive step towards price stabilization. Historical time to sell trends:
Exhibit 49: Length of time needed to sell a home [> 50.0: Time to sell decreased/ = 50.0: time to sell unchanged / <50.0:
Agent Recommendations Agents recommend Toll Brothers and Pulte. Toll Brothers and Pulte Homes received the highest percentage of recommendations by agents nationwide. 25% of agents (net of positive responses less negative responses) surveyed said they would recommend Toll Brothers, 24% said they would recommend Pulte (with 10% also recommending newly acquired Centex). We believe this is important since 35-40% of new home sales involve an agent. In addition, homebuilders will likely increasingly rely on agents as market conditions weaken. This is a positive for those companies, in addition to others below that received strong recommendations, but also represents an opportunity for companies such as KB Home.
Exhibit 50: Toll Brothers and Pulte Homes Most Highly Recommended by Agents
Rank Ticker Company Name Net Recommendation
1 TOL Toll Brothers 25.0%
2 PHM Pulte Homes 23.9%
3 DHI D.R. Horton 14.9%
4 SPF Standard Pacific Corp. 14.8%
5 MTH Meritage Homes 14.8%
6 LEN Lennar Corp. 10.1%
7 CTX Centex Corp. 9.9%
8 NVR NVR, Inc. 9.6%
9 RYL Ryland Group 7.4%
10 MDC MDC Holdings 6.2%
11 WCI WCI Communities 2.8%
12 HOV Hovnanian Enterprises 2.5%
13 KBH KB Home (12.6)% Source: Credit Suisse estimates
Agents discourage customers from buying a home from KB Home. KB Home received the highest percentage of negative recommendations by agents nationwide. 21% agents surveyed said they would discourage clients from buying a home from KB Home, although this represents an improvement over recent months, likely as the more affordable “Open Series” gains traction. We also note that KB Home pre-sells a majority of its homes, which may negatively influence agents’ responses.
Disclosure Appendix Important Global Disclosures I, Daniel Oppenheim, CFA, certify that (1) the views expressed in this report accurately reflect my personal views about all of the subject companies and securities and (2) no part of my compensation was, is or will be directly or indirectly related to the specific recommendations or views expressed in this report. The analyst(s) responsible for preparing this research report received compensation that is based upon various factors including Credit Suisse's total revenues, a portion of which are generated by Credit Suisse's investment banking activities. Analysts’ stock ratings are defined as follows: Outperform (O): The stock’s total return is expected to outperform the relevant benchmark* by at least 10-15% (or more, depending on perceived risk) over the next 12 months. Neutral (N): The stock’s total return is expected to be in line with the relevant benchmark* (range of ±10-15%) over the next 12 months. Underperform (U): The stock’s total return is expected to underperform the relevant benchmark* by 10-15% or more over the next 12 months. *Relevant benchmark by region: As of 29th May 2009, Australia, New Zealand, U.S. and Canadian ratings are based on (1) a stock’s absolute total return potential to its current share price and (2) the relative attractiveness of a stock’s total return potential within an analyst’s coverage universe**, with Outperforms representing the most attractive, Neutrals the less attractive, and Underperforms the least attractive investment opportunities. Some U.S. and Canadian ratings may fall outside the absolute total return ranges defined above, depending on market conditions and industry factors. For Latin American, Japanese, and non-Japan Asia stocks, ratings are based on a stock’s total return relative to the average total return of the relevant country or regional benchmark; for European stocks, ratings are based on a stock’s total return relative to the analyst's coverage universe**. For Australian and New Zealand stocks a 22% and a 12% threshold replace the 10-15% level in the Outperform and Underperform stock rating definitions, respectively, subject to analysts’ perceived risk. The 22% and 12% thresholds replace the +10-15% and -10-15% levels in the Neutral stock rating definition, respectively, subject to analysts’ perceived risk. **An analyst's coverage universe consists of all companies covered by the analyst within the relevant sector. Restricted (R): In certain circumstances, Credit Suisse policy and/or applicable law and regulations preclude certain types of communications, including an investment recommendation, during the course of Credit Suisse's engagement in an investment banking transaction and in certain other circumstances. Volatility Indicator [V]: A stock is defined as volatile if the stock price has moved up or down by 20% or more in a month in at least 8 of the past 24 months or the analyst expects significant volatility going forward.
Analysts’ coverage universe weightings are distinct from analysts’ stock ratings and are based on the expected performance of an analyst’s coverage universe* versus the relevant broad market benchmark**: Overweight: Industry expected to outperform the relevant broad market benchmark over the next 12 months. Market Weight: Industry expected to perform in-line with the relevant broad market benchmark over the next 12 months. Underweight: Industry expected to underperform the relevant broad market benchmark over the next 12 months. *An analyst’s coverage universe consists of all companies covered by the analyst within the relevant sector. **The broad market benchmark is based on the expected return of the local market index (e.g., the S&P 500 in the U.S.) over the next 12 months. Credit Suisse’s distribution of stock ratings (and banking clients) is:
Global Ratings Distribution Outperform/Buy* 39% (57% banking clients) Neutral/Hold* 42% (59% banking clients) Underperform/Sell* 17% (49% banking clients) Restricted 2%
*For purposes of the NYSE and NASD ratings distribution disclosure requirements, our stock ratings of Outperform, Neutral, and Underperform most closely correspond to Buy, Hold, and Sell, respectively; however, the meanings are not the same, as our stock ratings are determined on a relative basis. (Please refer to definitions above.) An investor's decision to buy or sell a security should be based on investment objectives, current holdings, and other individual factors.
08 October 2009
Monthly Survey of Real Estate Agents 58
Credit Suisse’s policy is to update research reports as it deems appropriate, based on developments with the subject company, the sector or the market that may have a material impact on the research views or opinions stated herein.
Credit Suisse's policy is only to publish investment research that is impartial, independent, clear, fair and not misleading. For more detail please refer to Credit Suisse's Policies for Managing Conflicts of Interest in connection with Investment Research: http://www.csfb.com/research-and-analytics/disclaimer/managing_conflicts_disclaimer.html
Credit Suisse does not provide any tax advice. Any statement herein regarding any US federal tax is not intended or written to be used, and cannot be used, by any taxpayer for the purposes of avoiding any penalties. Important Regional Disclosures Restrictions on certain Canadian securities are indicated by the following abbreviations: NVS--Non-Voting shares; RVS--Restricted Voting Shares; SVS--Subordinate Voting Shares. Individuals receiving this report from a Canadian investment dealer that is not affiliated with Credit Suisse should be advised that this report may not contain regulatory disclosures the non-affiliated Canadian investment dealer would be required to make if this were its own report. For Credit Suisse Securities (Canada), Inc.'s policies and procedures regarding the dissemination of equity research, please visit http://www.csfb.com/legal_terms/canada_research_policy.shtml.
As of the date of this report, Credit Suisse acts as a market maker or liquidity provider in the equities securities that are the subject of this report.
Principal is not guaranteed in the case of equities because equity prices are variable. Commission is the commission rate or the amount agreed with a customer when setting up an account or at anytime after that.
CS may have issued a Trade Alert regarding this security. Trade Alerts are short term trading opportunities identified by an analyst on the basis of market events and catalysts, while stock ratings reflect an analyst's investment recommendations based on expected total return over a 12-month period relative to the relevant coverage universe. Because Trade Alerts and stock ratings reflect different assumptions and analytical methods, Trade Alerts may differ directionally from the analyst's stock rating. The author(s) of this report maintains a CS Model Portfolio that he/she regularly adjusts. The security or securities discussed in this report may be a component of the CS Model Portfolio and subject to such adjustments (which, given the composition of the CS Model Portfolio as a whole, may differ from the recommendation in this report, as well as opportunities or strategies identified in Trading Alerts concerning the same security). The CS Model Portfolio and important disclosures about it are available at www.credit-suisse.com/ti.
To the extent this is a report authored in whole or in part by a non-U.S. analyst and is made available in the U.S., the following are important disclosures regarding any non-U.S. analyst contributors: The non-U.S. research analysts listed below (if any) are not registered/qualified as research analysts with FINRA. The non-U.S. research analysts listed below may not be associated persons of CSSU and therefore may not be subject to the NASD Rule 2711 and NYSE Rule 472 restrictions on communications with a subject company, public appearances and trading securities held by a research analyst account. For Credit Suisse disclosure information on other companies mentioned in this report, please visit the website at www.credit-suisse.com/researchdisclosures or call +1 (877) 291-2683. Disclaimers continue on next page.
08 October 2009Americas/United States
Equity Research
Industry_RealtorSurvey_10-8-2009.doc
This report is not directed to, or intended for distribution to or use by, any person or entity who is a citizen or resident of or located in any locality, state, country or other jurisdiction where such distribution, publication, availability or use would be contrary to law or regulation or which would subject Credit Suisse, the Swiss bank, or its subsidiaries or its affiliates (“CS”) to any registration or licensing requirement within such jurisdiction. All material presented in this report, unless specifically indicated otherwise, is under copyright to CS. None of the material, nor its content, nor any copy of it, may be altered in any way, transmitted to, copied or distributed to any other party, without the prior express written permission of CS. All trademarks, service marks and logos used in this report are trademarks or service marks or registered trademarks or service marks of CS or its affiliates. The information, tools and material presented in this report are provided to you for information purposes only and are not to be used or considered as an offer or the solicitation of an offer to sell or to buy or subscribe for securities or other financial instruments. CS may not have taken any steps to ensure that the securities referred to in this report are suitable for any particular investor. CS will not treat recipients as its customers by virtue of their receiving the report. The investments or services contained or referred to in this report may not be suitable for you and it is recommended that you consult an independent investment advisor if you are in doubt about such investments or investment services. Nothing in this report constitutes investment, legal, accounting or tax advice or a representation that any investment or strategy is suitable or appropriate to your individual circumstances or otherwise constitutes a personal recommendation to you. CS does not offer advice on the tax consequences of investment and you are advised to contact an independent tax adviser. Please note in particular that the bases and levels of taxation may change. CS believes the information and opinions in the Disclosure Appendix of this report are accurate and complete. Information and opinions presented in the other sections of the report were obtained or derived from sources CS believes are reliable, but CS makes no representations as to their accuracy or completeness. Additional information is available upon request. CS accepts no liability for loss arising from the use of the material presented in this report, except that this exclusion of liability does not apply to the extent that liability arises under specific statutes or regulations applicable to CS. This report is not to be relied upon in substitution for the exercise of independent judgment. CS may have issued, and may in the future issue, a trading call regarding this security. Trading calls are short term trading opportunities based on market events and catalysts, while stock ratings reflect investment recommendations based on expected total return over a 12-month period as defined in the disclosure section. Because trading calls and stock ratings reflect different assumptions and analytical methods, trading calls may differ directionally from the stock rating. In addition, CS may have issued, and may in the future issue, other reports that are inconsistent with, and reach different conclusions from, the information presented in this report. Those reports reflect the different assumptions, views and analytical methods of the analysts who prepared them and CS is under no obligation to ensure that such other reports are brought to the attention of any recipient of this report. CS is involved in many businesses that relate to companies mentioned in this report. These businesses include specialized trading, risk arbitrage, market making, and other proprietary trading. Past performance should not be taken as an indication or guarantee of future performance, and no representation or warranty, express or implied, is made regarding future performance. Information, opinions and estimates contained in this report reflect a judgement at its original date of publication by CS and are subject to change without notice. The price, value of and income from any of the securities or financial instruments mentioned in this report can fall as well as rise. The value of securities and financial instruments is subject to exchange rate fluctuation that may have a positive or adverse effect on the price or income of such securities or financial instruments. Investors in securities such as ADR’s, the values of which are influenced by currency volatility, effectively assume this risk. Structured securities are complex instruments, typically involve a high degree of risk and are intended for sale only to sophisticated investors who are capable of understanding and assuming the risks involved. The market value of any structured security may be affected by changes in economic, financial and political factors (including, but not limited to, spot and forward interest and exchange rates), time to maturity, market conditions and volatility, and the credit quality of any issuer or reference issuer. Any investor interested in purchasing a structured product should conduct their own investigation and analysis of the product and consult with their own professional advisers as to the risks involved in making such a purchase. Some investments discussed in this report have a high level of volatility. High volatility investments may experience sudden and large falls in their value causing losses when that investment is realised. Those losses may equal your original investment. Indeed, in the case of some investments the potential losses may exceed the amount of initial investment, in such circumstances you may be required to pay more money to support those losses. Income yields from investments may fluctuate and, in consequence, initial capital paid to make the investment may be used as part of that income yield. Some investments may not be readily realisable and it may be difficult to sell or realise those investments, similarly it may prove difficult for you to obtain reliable information about the value, or risks, to which such an investment is exposed. This report may provide the addresses of, or contain hyperlinks to, websites. Except to the extent to which the report refers to website material of CS, CS has not reviewed the linked site and takes no responsibility for the content contained therein. Such address or hyperlink (including addresses or hyperlinks to CS’s own website material) is provided solely for your convenience and information and the content of the linked site does not in any way form part of this document. Accessing such website or following such link through this report or CS’s website shall be at your own risk. This report is issued and distributed in Europe (except Switzerland) by Credit Suisse Securities (Europe) Limited, One Cabot Square, London E14 4QJ, England, which is regulated in the United Kingdom by The Financial Services Authority (“FSA”). This report is being distributed in Germany by Credit Suisse Securities (Europe) Limited Niederlassung Frankfurt am Main regulated by the Bundesanstalt fuer Finanzdienstleistungsaufsicht ("BaFin"). This report is being distributed in the United States by Credit Suisse Securities (USA) LLC ; in Switzerland by Credit Suisse; in Canada by Credit Suisse Securities (Canada), Inc..; in Brazil by Banco de Investimentos Credit Suisse (Brasil) S.A.; in Japan by Credit Suisse Securities (Japan) Limited, Financial Instrument Firm, Director-General of Kanto Local Finance Bureau (Kinsho) No. 66, a member of Japan Securities Dealers Association, The Financial Futures Association of Japan; elsewhere in Asia/Pacific by whichever of the following is the appropriately authorised entity in the relevant jurisdiction: Credit Suisse (Hong Kong) Limited, Credit Suisse Equities (Australia) Limited , Credit Suisse Securities (Thailand) Limited, Credit Suisse Securities (Malaysia) Sdn Bhd, Credit Suisse Singapore Branch, Credit Suisse Securities (India) Private Limited, Credit Suisse Securities (Europe) Limited, Seoul Branch, Credit Suisse Taipei Securities Branch, PT Credit Suisse Securities Indonesia, and elsewhere in the world by the relevant authorised affiliate of the above. Research on Taiwanese securities produced by Credit Suisse Taipei Securities Branch has been prepared by a registered Senior Business Person. Research provided to residents of Malaysia is authorised by the Head of Research for Credit Suisse Securities (Malaysia) Sdn. Bhd., to whom they should direct any queries on +603 2723 2020. In jurisdictions where CS is not already registered or licensed to trade in securities, transactions will only be effected in accordance with applicable securities legislation, which will vary from jurisdiction to jurisdiction and may require that the trade be made in accordance with applicable exemptions from registration or licensing requirements. Non-U.S. customers wishing to effect a transaction should contact a CS entity in their local jurisdiction unless governing law permits otherwise. U.S. customers wishing to effect a transaction should do so only by contacting a representative at Credit Suisse Securities (USA) LLC in the U.S. Please note that this report was originally prepared and issued by CS for distribution to their market professional and institutional investor customers. Recipients who are not market professional or institutional investor customers of CS should seek the advice of their independent financial advisor prior to taking any investment decision based on this report or for any necessary explanation of its contents. This research may relate to investments or services of a person outside of the UK or to other matters which are not regulated by the FSA or in respect of which the protections of the FSA for private customers and/or the UK compensation scheme may not be available, and further details as to where this may be the case are available upon request in respect of this report. Any Nielsen Media Research material contained in this report represents Nielsen Media Research's estimates and does not represent facts. NMR has neither reviewed nor approved this report and/or any of the statements made herein. If this report is being distributed by a financial institution other than Credit Suisse, or its affiliates, that financial institution is solely responsible for distribution. Clients of that institution should contact that institution to effect a transaction in the securities mentioned in this report or require further information. This report does not constitute investment advice by Credit Suisse to the clients of the distributing financial institution, and neither Credit Suisse, its affiliates, and their respective officers, directors and employees accept any liability whatsoever for any direct or consequential loss arising from their use of this report or its content. Copyright 2009 CREDIT SUISSE and/or its affiliates. All rights reserved.
CREDIT SUISSE SECURITIES (USA) LLC United States of America: +1 (212) 325-2000