Credit Supply and Corporate Innovation Mario Daniele Amore Cédric Schneider Alminas Žaldokas Bocconi University Copenhagen Business School HKUST January 25, 2013 We present evidence that banking development plays a key role in technological progress. We focus on firms’ innovative performance, measured by patent-based metrics, and employ exogenous variations in banking development arising from the staggered deregulation of banking activities across U.S. states during the 1980s and 1990s. We find that interstate banking deregulation had significant beneficial effects on the quantity and quality of innovation activities, especially for firms highly dependent on external capital and located closer to entering banks. Furthermore, we find that these results are strongly driven by a greater ability of deregulated banks to geographically diversify credit risk. JEL: G20, G30, O30 Keywords: financial development, banking deregulation, innovation, risk diversification _______________________ For insightful comments and suggestions we thank Tim Adam, Morten Bennedsen, Bo Becker, Shai Bernstein, Bruno Cassiman, Andrea Fosfuri, Denis Gromb, Jens Iversen, Paloma Lopez-Garcia, Andrea Mina, Gordon Phillips, Charlotte Østergaard, Jesper Rangvid, Avri Ravid, Thomas Rønde, Ben Sand, Amit Seru, Battista Severgnini, Merih Sevilir, Andrew Toole, Giovanni Valentini, an anonymous reviewer, and participants at the Zvi Griliches Research Workshop in Economics of Innovation (Barcelona), Druid Winter Conference (Cambridge), Nordic Finance Network Workshop (Oslo), 3 rd Entrepreneurial Finance and Innovation Conference (Boston), 5 th Conference on Innovation and Entrepreneurship (Chicago), EEA/ESEM Conference (Malaga), EARIE Conference (Rome), ZEW Conference on the Dynamics of Entrepreneurship (Mannheim), 23 rd Annual Financial Economics and Accounting Conference (USC), as well as INSEAD and Copenhagen Business School brownbag seminars. Contacts: [email protected] (Mario Daniele Amore), [email protected] (Cedric Schneider) and [email protected] (Alminas Zaldokas).
Transcript
Credit Supply and Corporate Innovation
Mario Daniele Amore Cédric Schneider Alminas Žaldokas
Bocconi University Copenhagen Business School HKUST
January 25, 2013
We present evidence that banking development plays a key role in technological progress. We focus
on firms’ innovative performance, measured by patent-based metrics, and employ exogenous
variations in banking development arising from the staggered deregulation of banking activities
across U.S. states during the 1980s and 1990s. We find that interstate banking deregulation had
significant beneficial effects on the quantity and quality of innovation activities, especially for firms
highly dependent on external capital and located closer to entering banks. Furthermore, we find that
these results are strongly driven by a greater ability of deregulated banks to geographically diversify
_______________________ For insightful comments and suggestions we thank Tim Adam, Morten Bennedsen, Bo Becker, Shai Bernstein, Bruno Cassiman, Andrea Fosfuri, Denis Gromb, Jens Iversen, Paloma Lopez-Garcia, Andrea Mina, Gordon Phillips, Charlotte Østergaard, Jesper Rangvid, Avri Ravid, Thomas Rønde, Ben Sand, Amit Seru, Battista Severgnini, Merih Sevilir, Andrew Toole, Giovanni Valentini, an anonymous reviewer, and participants at the Zvi Griliches Research Workshop in Economics of Innovation (Barcelona), Druid Winter Conference (Cambridge), Nordic Finance Network Workshop (Oslo), 3rd Entrepreneurial Finance and Innovation Conference (Boston), 5th Conference on Innovation and Entrepreneurship (Chicago), EEA/ESEM Conference (Malaga), EARIE Conference (Rome), ZEW Conference on the Dynamics of Entrepreneurship (Mannheim), 23rd Annual Financial Economics and Accounting Conference (USC), as well as INSEAD and Copenhagen Business School brownbag seminars. Contacts: [email protected] (Mario Daniele Amore), [email protected] (Cedric Schneider) and [email protected] (Alminas Zaldokas).
2
The banker[…] has either replaced private capitalists or become their agent; he has himself become the capitalist par excellence. He stands between those who wish to form new combinations and the possessors of productive means. He is essentially a phenomenon of development, though only when no central authority directs the social process.
Schumpeter (1911)
1. Introduction
It has long been argued that well-functioning financial systems are essential for promoting
economic and technological progress (see Shumpeter 1911, or a more recent discussion in
King and Levine 1993a). For instance, financial intermediaries channel savings to
investment (Bencivenga and Smith 1991) and increase the productivity of that investment by
allocating funds to the most qualified firms (Greenwood and Jovanovic 1990; King and
Levine 1993b). However, less is known about how this effect differs across financial
intermediaries. While previous literature has clearly shown that venture capital and private
equity firms foster innovation (e.g. Kortum and Lerner 2000; Lerner et al. 2011), the effect
of banks on technological progress remains a matter of debate, due to theoretically
ambiguous predictions as well as endogeneity concerns. Arguably, general economic
conditions, industry characteristics and unobserved factors may influence both firms’
innovation and credit availability, thus biasing the effect of finance on technological
progress. Alternatively, the effect may even be reversed if firms with higher value-added
projects create demand for more efficient financial institutions that then arise endogenously
(Laeven et al. 2012). In general, the literature is skeptical that innovative firms, especially
listed ones, may benefit from bank credit to finance their operations (Atanassov et al. 2007).
Contrary to this view, we find strong evidence that banking development influences
innovation by publicly traded manufacturing firms. In our empirical design, we employ the
staggered passage of interstate banking deregulation in the U.S. banking industry during the
1980s and 1990s as a source of exogenous variations in the geographic spread of U.S.
3
banking institutions. By allowing bank holding companies to expand across states, this state-
level deregulation increased the credit supply, led to better screening and monitoring
technologies, and facilitated banks’ geographic diversification of credit risk (Demyanyk et
al. 2007; Goetz et al. 2012). After controlling for a host of firm characteristics, firm fixed
effects and other confounding factors, we find that interstate banking deregulation caused a
12.6% rise in the number of patents granted to firms. Furthermore, we find a 10.1% increase
in the importance of patents, measured by citations received from future patent applications
by other firms, as well as an increase in patenting risk, and in the originality and generality
of innovations. Taken together, these findings suggest that firms exposed to deregulation
adopted a bolder innovation policy.
Focusing on the supply side, we claim that the main channel behind this change in
innovation policy relates to a greater willingness of deregulated banks to take risks once they
become better diversified geographically. Out-of-state banks may be willing to lend on more
favorable terms and all the more so if credit risk in the deregulating state is less correlated
with their existing exposure. We find that most of the increase in patenting activity occurred
in states whose economies exhibited least comovement with the overall U.S. economy.
Moreover, the effect on innovation was highest in the states least comoving with the entering
banks’ home states. Finally, the increase in patenting occurred in those states that after
deregulation experienced the largest change in the average geographic diversification of
banks. The effect was also larger for firms located closer to the entering out-of-state banks,
i.e. for firms subject to a larger credit expansion.
Although changes in credit supply can affect financing and investment decisions of a
wide array of firms (Lemmon and Roberts 2010), we found that the positive effect of
banking deregulation on corporate innovation was highly heterogeneous. In particular, we
find that the effect was larger for firms operating in industries that were highly dependent
upon external capital, and firms that tend to rely more on bank debt (e.g. Johnson 1997;
Hadlock and James 2002). Finally, the effect was larger for firms with a high level of R&D
4
expenditures in the post-deregulation period. Taken together, these results suggest that the
effect of deregulation on innovation was driven by relaxation of financial constraints for
bank-dependent firms.
The existing body of research does not suggest an unambiguous effect of banking on
innovation. On the one hand, a debt contract might be ill suited to finance an activity such as
innovation that has uncertain returns (Atanassov et al. 2007; Stiglitz 1985). On the other
hand, public firms may use private debt to fund innovation when they incur costs to raise
capital in public markets. Indeed, funding innovation with public capital may provide
sensitive information to competitors (Bhattacharya and Ritter 1983; Maksimovic and Pichler
2001), or it can be costly to the manager because of low tolerance for failure in the public
markets (Ferreira et al. 2011). Mixed empirical findings mirror these theoretical ambiguities.
For instance, Benfratello et al. (2008), Ayyagari et al. (2011), Smith (2011) and Nanda and
Nicholas (2011) find a positive effect, Cornaggia et al. (2012) show a negative effect, while
Atanassov et al. (2007) argue against the importance of bank finance for firms’ innovative
activity. Our evidence indicates that deregulation in the U.S. banking industry fostered
corporate innovation; yet, it does not necessarily imply that, following deregulation, firms
financed innovation projects with bank loans. For instance, by employing deregulated banks’
debt to finance traditional investment, firms may have diverted more internal resources to
innovation expenses. Also, deregulated banks may have fostered the development of non-
bank financial institutions, which in turn provided funding for innovative activities.1 Finally,
individuals may have increased borrowing capacity, and due to home bias, channeled their
portfolio investments to the nearby firms’ equity offerings.
Laeven et al. (2012) present a theoretical model in which technological innovation can
only happen with financial system improvement. Indeed, if there were no constraints to the
growth of financial systems, financial development would arise endogenously based on the
1 Indeed, in unreported analyses we find that the amount of new funds raised by venture capital and private equity firms was positively correlated with interstate banking deregulation.
5
expected technological progress. Thus, whether financial systems matter or not to innovation
must be empirically tested in a context in which the external constraints to financial
development are removed. Since our identification is based on the exogenous boost of
banking development following deregulation events, it can be seen as a direct test of Laeven
et al.’s (2012) theory. Thus, our causal evidence contributes to the earlier empirical findings
that banking development is associated with stronger economic growth (King and Levine
1993a; Demirguc-Kunt and Maksimovic 1998; Levine and Zervos 1998). As such, we also
contribute to the broad research on the relationship between financial development and
economic growth (King and Levine 1993b; Jayaratne and Strahan 1996; Guiso et al. 2004).2
Existing studies have investigated the effect of banking deregulation on entrepreneurship
and Schumpeterian creative destruction (Bertrand et al. 2007; Black and Strahan 2002;
Cetorelli and Strahan 2006; Kerr and Nanda 2009, 2010).3 Our findings add to this evidence
by showing that (1) interstate banking deregulation had strong effects on listed
manufacturing firms’ innovative activity; and (2) the channel that fostered innovation was a
higher willingness of banks to take risk due to geographic diversification.
Finally, our study complements recent literature that, motivated by the recent financial
crisis and dry-up of credit, investigates how variations in access to external finance affect
corporate policies (Campello et al. 2010; Duchin et al. 2010; Leary 2009; Lemmon and
Roberts 2010). Although we do not establish whether the increase in innovation stems
directly from bank lending, our results reinforce the notion that changes in the supply of
credit have strong effects on corporate policies.
Section 2 describes the policy changes that transpired in the U.S. banking industry.
our main finding that interstate banking deregulation increased the number of awarded 2 See Levine (2005) for a comprehensive review of this literature. 3 Furthermore, existing works has shown the effects of banking deregulation on income distribution (Beck et al. 2010), industry reallocation (Acharya et al. 2011; Bertrand et al. 2007) and trade flows (Michalski and Ors 2011; 2012). Recent work has also argued that deregulation had an impact on the volatility (Correa and Suarez 2009) and cash holdings (Francis et al. 2011) of U.S. publicly listed firms.
6
patents. In Section 6, we further analyze the effect of deregulation on patenting quality,
technological nature and risk. In Section 7, we show that the increase in firm patenting
relates to the improved ability of banks to diversify credit risk, and we also show how our
findings vary depending on firms’ location and their reliance on external finance. In Section
8, we discuss the association between innovation and industry growth. Section 9 concludes.
2. Deregulation in the U.S. banking industry
Our identification strategy exploits the staggered passage of interstate banking deregulation4,
which represented a positive shock to the geographic spread of U.S. banking institutions.
The geographic expansion of banking activities in the U.S. has been historically
restricted by laws such as the McFadden Act of 1927 and the Douglas Amendment to the
Bank Holding Company Act of 1956. However, during the period of 1970-90s U.S. states
largely terminated the restrictions on the expansion of banks across and within states. The
first state to pass an interstate banking deregulation was Maine in 1978, followed by Alaska
and New York in 1982. The wave of deregulation continued until the mid-1990s, when
piecemeal changes in legislation, outside events, and competition among regulators led states
to permit some type of interstate banking on a reciprocal or nonreciprocal basis (Johnson and
Rice 2008). Table 1, Panel A, illustrates the timeline of interstate banking deregulation by
state and year.
After interstate banking deregulation, out-of-state bank holding companies were allowed
to acquire banks chartered in the deregulating state. Banks took advantage of these
deregulation laws and indeed expanded across state borders. In the average state, the fraction
of assets held by out-of-state bank holding companies rose from 0% in mid-1970 to 23% in
4 The means of cross-state geographic expansion are: acquiring or establishing a charter in a state outside the main bank’s home state (interstate banking) as well as acquiring or establishing a branch office, an office which is not separately chartered or capitalized, in a state outside the main bank’s home state (interstate branching). Likewise, intrastate banking and branching refer to respective means of expansion within the main bank’s home state (Johnson and Rice 2008).
7
mid-1990. The total number of banks in the U.S. fell but this reduction was mostly driven by
a drop in the number of small local banks (Kerr and Nanda 2009) due to an intense M&A
activity that spurred banks’ efficiency (Jayaratne and Strahan 1998). The expansion of banks
across state lines also led to an increase in credit supply. Using state-level data on
commercial bank loans provided by the Federal Deposit Insurance Corporation (FDIC) for
the period of 1976-95, we find that, after controlling for year and state fixed effects,
interstate banking deregulation was associated with an 8% increase in total net loan supply.
Moreover, expanding out-of-state banks used more sophisticated monitoring and screening
technologies than local banks (Dick and Lehnert 2010). Finally, fewer restrictions on
banking across states improved the scope for geographic diversification (Goetz et al. 2012),
allowing banks to finance risky projects, such as innovation activities, more freely and
without increasing the banks’ overall risk.
The period of the 1970-90s was associated with other policy changes in the banking
industry which reduced the obstacles for existing banks to open new branches within and
between U.S. states. As shown in Table 1, Panel B, U.S. states lessened restrictions on
intrastate banking during the mid-1970s and 1980s. Furthermore, the Riegle-Neal Interstate
Banking and Branching Efficiency Act (IBBEA) enacted a nation-wide deregulation of the
banking sector. As of 1995, the IBBEA removed any remaining federal restrictions on
interstate banking. Moreover, the IBBEA permitted national or state banks to engage in
interstate branching, although it also allowed states considerable leeway in deciding the rules
governing entry by out-of-state branches (Rice and Strahan 2010; Johnson and Rice 2008).
In the empirical analysis, we control for these confounding policies.
One concern with our identification strategy is that deregulation may have been
correlated with pre-existing trends in financial and economic development in the legislating
states. In other words, what matters for our specification is that states deregulating at
different points in time did not have diverging pre-deregulation trends in innovation, though
they may have had different levels of financing conditions, as suggested by Kroszner and
8
Strahan (1999) who find that legislators were more in favor of interstate deregulation when
the fraction of small banks in their state was low. In the case of diverging innovation trends,
our empirical approach would reflect pre-deregulation trends rather than an increase in
innovation due to the exogenous changes in credit markets.
We rule out this concern in several ways. First, we draw on the political economy of
deregulation. Interstate banking deregulation was partly driven by the savings and loan crisis
in the early 1980s, after which federal legislators enacted the Garn-St. Germain Depository
Institutions Act. One provision of this act authorized federal banking agencies to arrange
interstate acquisitions for failed banks with total assets of over $500 million, even when such
acquisitions were not in accordance with state law. These changes paved the way for
bilateral and regional agreements between states to allow interstate banking and thus the
creation of larger and more diversified banks that were less susceptible to failure (Kerr and
Nanda 2009). Importantly, the process of deregulation across states was not characterized by
clear patterns (Amel 1993). For instance, Goetz et al. (2012) find no evidence that states
were more likely to sign agreements with neighbor states than with distant states. Overall, it
is unlikely that the formation of agreements, and eventually the sequence of deregulation
events, mirrored differences in innovation potential across states. Empirically, we show that
deregulation did not have a significant effect on innovation prior to the actual passage of the
deregulation laws (see Table 5, Panel A) and thus that our estimates do not merely reflect
pre-deregulation innovation trends. Moreover, we check that the average number of all pre-
deregulation patents in a given state does not significantly influence the timing of
deregulation (t = -0.99).
3. Data and summary statistics
We measure innovation by successful patent applications, a widely used approach to
quantify innovative performance (Griliches 1990). We start with the patent dataset
9
assembled at the National Bureau of Economic Research (NBER), which contains
information on all the patents awarded by the U.S. Patent and Trademark Office (USPTO) as
well as the citations made to these patents (Hall et al. 2001). We focus the analysis on
granted patents applied for in the period 1976-95, which covers all years when interstate
banking rules were deregulated but also includes a few years before the passage of the first
interstate banking deregulation rule, in 1978. We do not extend our sample after 1995 as this
was the year when the interstate banking provisions of the IBBEA went into effect. Ending
our sample in the mid-1990s also ensures that our findings are not contaminated by the
passage of state laws surrounding the IBBEA implementation that affected the evolution of
interstate branching deregulation from 1994 to 2005 (Johnson and Rice 2008; Rice and
Strahan 2010).5 Finally, following the literature on U.S. banking deregulation, we exclude
Delaware and South Dakota because these states were subject to special tax incentives for
credit card banks (Black and Strahan 2002; Dick and Lehnert 2010).
Conducting the analysis at the firm level, rather than state level, is particularly important
for two reasons. First, firm-level data allow controlling for unobserved time-invariant firm
effects and thus better mitigate the concern of omitted factor bias; second, they permit to
look into the heterogeneous response to deregulation within a given state. To this purpose,
we match the NBER patent dataset with Compustat data following the procedures developed
in Hall et al. (2001) and Bessen (2009). We exclude firms with negative or zero book value
of assets and sales, and firms headquartered outside the U.S.6 As documented in Scherer
5 Another advantage of ending the sample in 1995 is that our analysis is not affected by the dramatic increase in cash flow and equity financing of R&D activities experienced by young U.S. firms during the second half of the 1990s (Brown et al. 2009). 6 A concern arises from the fact that Compustat only reports the last state of operations, and we may be unable to observe changes of headquarters from one state to another that are potentially endogenous to the deregulation. However, using data on headquarter relocations from the Compact Disclosure database, Pirinsky and Wang (2006) argue that most of the headquarter changes are driven by mergers and acquisitions. After excluding these and other major restructuring events, they find 118 relocations from a sample of more than 4000 firms in the period 1992-1997. Our results are robust to excluding firm-year observations with asset or sales growth exceeding 100%, which are typically associated with mergers, restructuring and other major corporate events (Almeida et al. 2004). Furthermore, in a robustness check reported in Section 5.3, we alternatively consider the state of the first inventor as recorded in the NBER patent dataset.
10
(1983) and more recently in Balasubramanian and Sivadasan (2011), the bulk of patenting
activity occurs within the manufacturing sector. Thus, following e.g. Hall et al. (2005), we
only consider firms in the industries with SIC codes up to 4000 (mostly manufacturing
firms). In this way, we exclude industries such as financial services or utilities, which
typically operate under specific regulations, as well as the software industry. Since the latter
is primarily dependent upon non-debt finance such as equity and venture capital, we believe
that our identification strategy is less applicable for identifying the banking-innovation nexus
in the software industry.
Table 2 reports summary statistics for the sample obtained after dropping observations
with missing values in the explanatory variables described in the next section. As
documented in previous work on the Compustat-NBER patent dataset, citation statistics are
very skewed. In our sample, the average number of patents is approximately 10 but the
median is 1. The detailed construction of all control variables is described in the Appendix 1.
4. Methodology
We use a difference-in-differences model to explore the causal relationship between firm
innovation and interstate banking deregulation. The important advantage of this approach is
that we can control for omitted variables and absorb nation-wide shocks or common trends
that might affect the outcome of interest.
We conduct our analysis using firm-level patent data and exploiting the information on
the location of the firm’s headquarter. Our key variable of interest is Interstate deregulationjt
which is equal to one if a firm is headquartered in a state j that has passed an interstate
banking deregulation by time t, and zero otherwise.7 Hence, Interstate deregulationjt
captures the effect of interstate banking deregulation on patenting across states by comparing
7 As shown by e.g. Bharath et al. (2011) and Dass and Massa (2011), because information gathering and processing is easier with smaller physical distance between a lender and a borrower, even public firms have a strong propensity to borrow from local lenders. We assume that firms should be primarily affected by the banking deregulation in the state of their headquarters.
11
outcomes before and after each deregulation year vis-à-vis deregulation passed later. To deal
appropriately with the count nature of our innovation measures, we employ count data
models that are widely used in the econometric analysis of patents. Following Hausman et
al. (1984), we hypothesize that the expected number of patents is an exponential function of
the interstate deregulation treatment, Interstate deregulationjt, and other explanatory
variables. More specifically, we estimate Poisson models with conditional mean:
E�Y����Interstatederegulation��� = ex p�α+ βInterstatederegulation��� + η� + τ��(1) The model is estimated by the method of Quasi-Maximum-Likelihood (QMLE), which
provides consistent estimates as long as the conditional mean is correctly specified even if
the true underlying distribution is not Poisson (Wooldridge 1999). Since our deregulation
treatment is defined at the state level, we cluster standard errors by state. Given that U.S.
patenting activity increased substantially starting in the mid-1980s (see, e.g., Hall 2004), we
control for aggregate trends by including a full set of year dummies, denoted by !. We also
control for industry linear trends by estimating annual 3-digit SIC industry averages of the
dependent variables, computed excluding the firm in question.8 Furthermore, we include
firm fixed effects, denoted by ηi, and we augment equation (1) with a vector X���-% of time-
varying controls, all lagged by one year to reduce simultaneity concerns. Specifically, we
control for the logarithm of firm sales9 and capital-labor ratio, following the literature on the
production function of patents (see, e.g., Galasso and Simcoe 2011; Aghion et al. 2012). In
additional analyses, we include other one-year lagged controls such as firm age and asset
8 In additional analyses, we check that our results are robust to including regional linear trends, and quadratic terms of industry and regional linear trends. Moreover, our results are robust to computing industry trends by state (to take into account that e.g. the increase in semiconductor patents was heterogeneous across states). Finally, we check that our results are robust to the exclusion of the semiconductors industry (SIC 3674), which experienced a particularly high increase in patents over the period considered (Hall and Ziedonis 2001). 9 In unreported analyses, we control for firm size in alternative ways, such as replacing firm sales with the logarithm of total assets. Furthermore, our results are robust to scaling patent counts by firm sales, instead of adding firm sales as explanatory variable.
12
tangibility, to control for existing dependence and access to bank credit; the stock of R&D10
to establish the effect on firms’ innovative productivity; ROA and cash holdings to control
for the role of internal resources in financing innovation (Himmelberg and Petersen 1994);
and Herfindahl-Hirschman Index (HHI), based on the distribution of revenues of the firms in
a particular 3-digit SIC industry, to control for the impact of industry concentration on
innovation.
5. Innovation activity
5.1 Innovation outputs
Table 3, Column (1), shows that allowing out-of-state banks to enter the state increased the
expected number of patent counts by 13.8%. While in Column (1) we only control for firm
and year fixed effects, in Column (2) we also control for the logarithm of sales and capital-
to-labor ratio, and in Column (3) we further control for the stock of R&D. As expected, the
stock of R&D has a positive and significant effect on patenting; however, the deregulation
coefficient remains significant at 1%. In Column (4), we confirm our findings by including a
host of industry- and firm-level factors that may potentially affect innovation, such as HHI,
firm age, ROA, tangibility and cash holdings (coefficients are unreported to save space). As
shown, the deregulation coefficient remains both statistically and economically relevant,
indicating a 12.6% increase in patenting.
5.2 Dynamic effects
10 As stressed by Aghion et al. (2012), not controlling for the R&D stock implies that the coefficient of the variable of interest on the right-hand side will reflect both the increase in R&D expenditures and the productivity of R&D. By contrast, when the R&D stock is included in the specification, the effect of the variables of interest can be interpreted as an effect on the innovative productivity of firms. The R&D stock is computed following the conventional 15% depreciation rate used in the related literature (see, e.g., Hall et al. 2005). Also, we use linear interpolations to replace missing values of R&D; however, our results are robust to leaving those observations missing or treating them as zeros.
13
The real consequences of interstate banking deregulation on credit markets caused by the
actual entry of banks in the new states may manifest over several years after the deregulation
passage. Also, filing a patent is the outcome of a process that might take some years. We
thus validate our identification strategy by looking at how the patenting activity evolved
dynamically after the deregulation was enacted.
We test for dynamic effects by drawing on specifications similar to Kerr and Nanda
(2009). First, we construct a dynamic difference-in-differences model employing a set of
dummies that measure the distance in years from each deregulation passage, using as the
reference group the period of three years or earlier before deregulation. Results, reported in
Table 4, Panel A, show that the coefficient prior to deregulation is small and statistically
insignificant, thus indicating that our results are not driven by diverging pre-deregulation
trends. By contrast, the post-deregulation coefficients are all positive and significant at
conventional levels. Importantly, they become larger as we move forward from the reform
year, with the largest effect corresponding to six and seven years after interstate banking
deregulation.
Second, we allow the effect of deregulation on innovation to grow linearly over time,
using a variable equal to zero up to the deregulation year and then equal to the number of
years since a deregulation was passed, capping the treatment effect at 8 years. Results,
reported in Table 4, Panel B, confirm that interstate deregulation had a growing impact on
firms’ patenting activity.
5.3 Robustness
In Table 5, we present a number of robustness checks. To save space, regressions results are
reported in rows rather than columns. We start by excluding firms headquartered in
California and Massachusetts, which account for 24% of observations in our sample. Row
(1) shows that excluding these states does not materially affect our main result.
14
As Kerr and Nanda (2009) show, interstate banking deregulation fostered the creation
and closure of firms. Hence, one concern is that our results are driven by firm entry. We
assess this issue, first, by restricting the analysis to firms that are present in the sample from
1976 to the last year, 1995. As shown in Row (2), adding this restriction does not
significantly alter our estimates despite the large drop in sample size.
In our main analyses, we infer firms’ location based on the location of the headquarters
as reported in Compustat. However, R&D centers of publicly traded firms may be located
across multiple states. In Row (3), we infer these multiple locations from the states of the
first inventor in the NBER patent database and apply the deregulation treatment according to
inventors’ states. The effect of deregulation on innovation is equally strong.
In Row (4), we provide a more restrictive specification which controls for state-level
macroeconomic variables that are potentially correlated with both credit availability and
innovation activities. Specifically, in addition to the usual controls used in Table 3, Column
(4), we control for the GDP growth and logarithm of population, obtained from the U.S.
Bureau of Economic Analysis (BEA). Our results are only marginally affected by the
inclusion of these controls.
Next, we control for geographic trends. As shown in Row (5), our findings are
unchanged if we augment our specification with regional trends, computed as year averages
of the dependent variables by region excluding the firm in question.11
Furthermore, we show that our results are not affected by the time period considered. As
discussed in Section 2, the interstate banking and branching provisions of the IBBEA
enacted a nation-wide deregulation of banking activities. In our main analysis we consider
1995 as the last year of the sample, i.e. the year when the interstate banking provisions of the
11 Regions are defined according to the four-grouping classification provided by the U.S. Census: west, midwest, northeast and south (http://www.census.gov/geo/www/us_regdiv.pdf). Re-examining the findings in Black and Strahan (2002), Wall (2004) shows that the effect of deregulation on entrepreneurship was positive in some U.S. regions but significantly negative in others. If we estimate region-specific deregulation effects, we find that the interstate deregulation coefficients are all positive, though their statistical and economic significance is not homogeneous across U.S. regions.
15
IBBEA were implemented. Yet, in Rows (6) and (7) we show that our results do not change
if we end our sample in 1994 (one year before the nation-wide interstate banking
deregulation enacted by the IBBEA) or if we extend the sample up to 1997 (the year the
nation-wide interstate branching deregulation was enacted by the IBBEA). In Row (8), we
also check that our results hold if we start the analysis in 1978, the first interstate banking
deregulation year.
A concern with our identification is that, while our main treatment dummy is based on
the year when the state enacted its first agreement allowing out-of-state banks to establish
operations (most often through M&A), in almost all cases those first agreements were
effective on a regional reciprocal level.12 Our dummy variable is unable to capture this
greater variation across states and time. We accommodate this issue by using data from
Amel (1993). Specifically, we construct a finer variable equal to the logarithm of the number
of states from which the entry of banks has been permitted by the particular year. Thus we
are able to exploit not just whether a state deregulated of not, but also the “depth” of the
deregulation process. Row (9), in which we report the result obtained using this variable
instead of our main deregulation dummy, confirms our main insight that interstate
deregulation had a significant and positive impact on firm innovation. One might be further
concerned that states differed in terms of importance. We reconfirm this result in Row (10)
using the logarithm of the population from which the entry of banks has been permitted by
the particular year (similarly to Goetz et al. 2012).
12 For instance, in July 1, 1986, Minnesota enacted a law on reciprocal terms allowing out-of-state bank entry from Iowa, North Dakota, South Dakota and Wisconsin. In August 1, 1988, the region was expanded to include Colorado, Idaho, Illinois, Kansas, Missouri, Montana, Nevada, Washington and Wyoming. In 1990, the region was further expanded to include Indiana, while in 1992 to include Michigan and Ohio. In April 22, 1994, Minnesota allowed an entry from any state banks based on reciprocal terms while on September 25, 1995, the legislatures extended it to hold nationally on non-reciprocal terms. However, to identify the actual states from where entry was permitted we have to take into account reciprocity. For instance, none of the states from which Minnesota allowed entry in 1986 reciprocated immediately and in 1987 only Wisconsin did so. In 1988, South Dakota, Idaho, Washington and Wyoming reciprocated. This means that in 1987 Minnesota allowed entry from one state, while in 1988 - 5 states. Further analysis shows that the number of states was extended to 8 in 1990 - 8, 11 in 1991, 13 in 1992, 14 in 1993, 41 in 1994 and all US states in 1995.
16
Next, we deal with other policies potentially affecting innovation that were adopted
around the same period as the interstate banking deregulation. As discussed in Table 1, Panel
B, U.S. states also deregulated intrastate branching activities during the period considered in
our analysis. A concern for our analysis is that U.S. states might have deregulated intrastate
branching and interstate banking at the same time, or within a few years, and this overlap of
different deregulation events could bias our identification. In Row (11), we show that our
results are unchanged if we augment our specification with an indicator controlling for the
effect of intrastate branching deregulation on patents.
As discussed in Section 2, although IBEEA permitted interstate branching, states were
granted the right to erect some barriers for the branches of out-of-state banks (Johnson and
Rice 2008; Rice and Strahan 2010). In Row (12), we extend our sample to 2006 and include
the state-level interstate branching restriction index developed by Rice and Strahan (2010) as
a further control. As shown, our coefficient of interest remains economically relevant and its
statistical significance is confirmed at the 10% level.
In the late 1980s, thirty U.S. states passed a set of business combination (BC) laws that
reduced the threat of hostile takeovers, thus weakening the governance role of the market for
corporate control (Giroud and Mueller 2010; Bertrand and Mullainathan 2003). These laws
might have influenced our results if corporate governance affected the managerial incentives
to innovate13, and that effect would not be captured by our specification since BC laws
affected firms at their state of incorporation. To mitigate this concern, in the specification we
include a dummy equal to one if firms were incorporated in the states that passed a BC law,
from the year of the passage onwards, and zero otherwise (Row 13). Furthermore, in
untabulated regressions we interact BC laws dummy with an interstate banking deregulation
dummy, to allow for heterogeneous effects of deregulation on innovation depending on
13 The effect of corporate governance on innovation is ambiguous. Atanassov (2012) finds that worse governance reduces the incentives to innovate. Chemmanur and Tian (2011) argue that by isolating CEOs from short-term pressures, managerial entrenchment can be beneficial for innovation. Sapra et al. (2011) show that the effect of corporate governance on innovation is U-shaped.
17
whether the firm was subject to BC laws. Our estimates indicate that the positive effect of
banking deregulation on firm innovation is not affected by the changes in corporate
governance brought about by BC laws.
Another potential confounding event took place in 1982, when the U.S. Congress created
the Court of Appeals for the Federal Circuit (CAFC) that became the sole U.S. appeals court
in patent cases. As described in Henry and Turner (2006), CAFC unified the patent law and
effectively ended forum shopping between geographical circuit courts of appeal. By making
patent invalidity defenses less viable CAFC has earned a reputation as a pro-patent court.
However, as claimed by a recent empirical analysis by Henry and Turner (2006), even if
CAFS provisions affected patent scope, “it is not clear whether they have, on balance,
favored patentees”. In any event, the creation of CAFC should have led to a secular increase
in patenting by US firms and we control for it with time fixed effects and average annual
patenting in the industry. Also, our results hold by excluding the “Semiconductors and
Related Devices” industry (Row 14), which Hall and Ziedonis (2001) claim to have been
most affected by CAFC creation. Finally, in Section 7 we provide evidence that impact of
deregulation on innovation is higher when the credit supply shock was higher, which should
not be the case if our results are merely driven by trends.
In Rows (15) and (16), we check that our results are not driven by influential patent
filers. Excluding 1% or 2.5% of observations on the right tail of the firm-patent distribution
does not change the economic and statistical magnitude of the result. In Row (17), we check
that our results hold even after including the squared HHI to capture potential non-linear
effects of competition on innovation (Aghion et al. 2005), as well as firm size squared.
Further, we try to separate out our effect from other channels such as equity-like funding by
controlling for the new funds raised by venture capital and private equity firms (hereafter,
VC funding) in the state. Data come from SDC VentureXpert database. In Row (18), we use
as additional control of our baseline regression the amount of VC capital in a given state and
year. As shown, our main finding is robust to the inclusion of this control.
18
Finally, in Appendix 2 we provide evidence from an opposite experiment, i.e. a negative
banking shock, which adds to the external validity of our findings.
6. Nature of innovation
So far our results indicate that firms subject to interstate banking deregulation patented
more. In this section, we test not only whether the number of patents has increased but
whether their average quality has risen as well, i.e., whether the effect did not come purely
from a larger credit supply and thus less rationing of projects being financed. We posit that
the average increase in the quality of innovation stems from a rise in the risk of innovative
projects being financed and greater willingness of banks to take credit risk. We then test
whether the increase in patents corresponded to a more ambitious and risky innovation
policy.
6.1 Innovation quality
A possible interpretation of the increase in patents may relate to the fact that, by substituting
local banks for large out-of-state institutions, deregulation weakened relationship-based
lending practices. Thus, firms might have used patents as hard evidence when seeking credit
from deregulated banks.14 We explore this interpretation by testing whether the mere number
of patents increased, or whether their economic relevance changed as well.
Existing research has demonstrated that patents differ greatly in “value” and that simple
patent counts (i.e. the measure adopted in the previous sections) do not necessarily capture
the relative importance of the underlying inventions (Harhoff et al. 1999; Hall et al. 2005).
In this section, we measure innovation quality by weighting each patent using the number of
future citations received from subsequent patents (Trajtenberg 1990). Forward citations
14 Intangible assets are typically thought to represent poor collateral, due to uncertainty and information asymmetry. However, recent contributions suggest that collateralization of intangibles has increased in the recent decade (Loumioti 2012).
19
reflect the technological importance of patents as perceived by the inventors themselves
(Jaffe et al. 2000) and knowledgeable peers in the technological field (Albert et al. 1991).
Furthermore, citations reflect the economic importance of patents, as documented by Hall et
al. (2005). Because forward citations suffer from truncation problems, we weight patent
counts by truncation-adjusted cite counts from the NBER dataset (see, e.g., Hall et al. 2001;
Hall et al. 2005).15
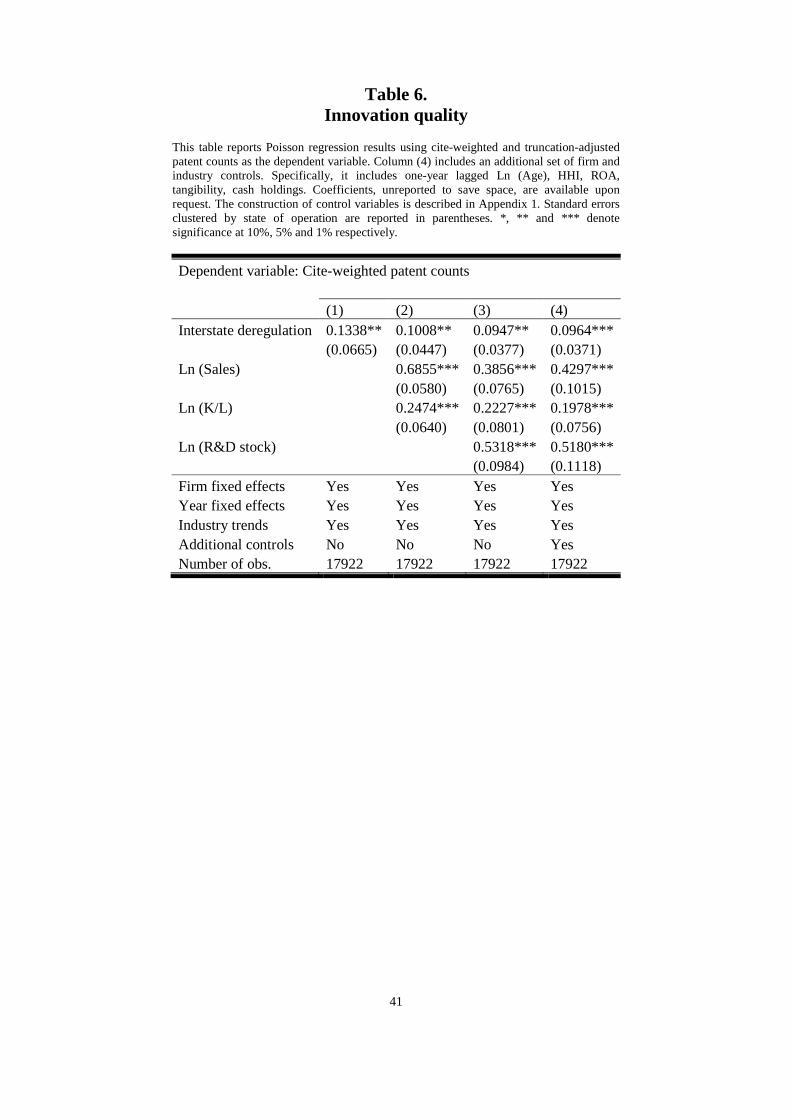
Results reported in Table 6 indicate that interstate banking deregulation led to a 10.1%
increase in the expected number of patent. Results remain statistically and economically
relevant irrespective of whether no control variables apart for firm- and time-fixed effects
are used (Column 1); whether the logarithm of sales and capital-to-labor ratio are included as
the controls (Column 2); whether, additionally, R&D stock is included as the control
(Column 3); and whether other confounding industry- and firm-level variables, such as HHI,
firm age, ROA, tangibility and cash holdings are also controlled for (Column 4). The
deregulation coefficient remains both statistically and economically relevant, indicating a
10.1% increase in expected forward citation counts. Given that this effect may be partly
driven by the increase in patent counts documented in Section 5, we include patent counts as
control variable; our result confirms that firms subject to deregulation increased citations as
compared to firms not subject to deregulation but having the same number of patents. Notice
that the increase in patent citations remains significant if we use the deregulation “depth”
measure introduced in Table 5, Rows (9)-(10) instead of our deregulation dummy.
6.2 Technological fields
Previous results have indicated that innovation quality rose following deregulation. We now
investigate the technological nature of firms’ patenting activity. First, we combine citations
15 The truncation problem arises since “citations to a given patent typically keep coming over long periods of time, but we only observe them until the last date of the available data” (Hall et al. 2005). Besides the use of truncation-adjusted citation counts, the problem is mitigated by the inclusion of year fixed effect. In fact, our results are robust to the adoption of unadjusted citation counts.
20
with information on patents’ technological fields. Second, we check if there is a
simultaneous increase in both high-quality and low-quality patents. Finally, we analyze the
volatility of successful patenting.
Primary technological fields contained in the NBER patent dataset consist of about 400
main (3-digit) patent classes, as defined by the USPTO. We use the generality and
originality indexes, developed by Trajtenberg et al. (1997) and computed by Hall et al.
(2001), to capture the fundamental nature of the research being patented. The generality
index is equal to 1 − ∑ ()*+,-* , where ()*+ denotes the percentage of citations received by a
patent i that belong to the patent technology class j out of ni patent classes. The index will
take high values (high generality) if a patent receives citations from subsequent patents that
belong to many different technological fields. The originality index is constructed in a
similar way, but its computation relies on the citations made rather than citations received;
hence, it will take a high value if a patent cites other patents that belong to many different
fields (high originality).
We use these two indices as the dependent variable in separate specifications similar to
the ones used in Table 4. As reported in Table 7, interstate banking deregulation had a
positive and significant effect on the generality of patents: firms subject to deregulation
exhibited a higher propensity to patent within broader technological fields (Columns 1 and
2). Moreover, firms increased the originality of patents (Columns 3 and 4). Taken together
with our previous finding on citations, these results reinforce the notion that deregulation
induced a change in the type of firms’ innovative activities. More general and original
patents require a bolder innovation policy. The results also further suggest that firms did not
simply patent existing innovation to provide hard information to out-of-state banks. As for
patent citations, the results of this section are largely robust to the use of the alternative
deregulation measures used in Table 5, Rows (9)-(10).
21
6.3 Patenting risk
A more ambitious innovation policy may entail more potential failures. In this section, we
show that firms’ successful patenting indeed became riskier. First, we analyze patenting risk
by testing how deregulation affected the volatility of patent citations. Specifically, we adopt
as the dependent variable the standard deviation of the logarithm of cite-weighted patent
counts computed in the pre- and post-interstate deregulation periods, restricting the analysis
to firms that are present at least two years in each period. We estimate a regression including
the interstate deregulation dummy, the usual controls averaged over the pre- and post-
deregulation periods, and the firm fixed effects. Results reported in Table 8 indicate that
interstate banking deregulation increased the dispersion of patent citations.
Second, as the dependent variable we use the number of patents that receive zero
citations, i.e. low quality patents. Consistent with the notion of increased innovation failures
following deregulation, Columns (1) and (2) in Table 9 show that the number of patents that
eventually received zero citations increased. This result also holds after controlling for the
overall change in patenting activity (Columns 3 and 4). The result that firms experienced an
increase in low quality patents is not in contrast with our previous argument that, on average,
the patenting quality rose following deregulation; rather, it suggests that the increase in high
quality patents was large enough to offset the increase in low quality patents.
Our results here thus compliment the findings in Goetz et al. (2012) that the fraction of
non-performing loans increased after banks expanded across borders.
7. Channels
7.1 Banks’ geographic diversification
One of the ways to explain higher and riskier corporate patenting after the entrance of new
banks is that out-of-state banks were better able to finance riskier projects due to lower
exposure to the background risks of the state's economy. At the same time, credit in this state
22
provides out-of-state banks an opportunity to diversify their loan portfolio, for instance, due
to a different industry composition of the state. In fact, better geographic diversification was
often mentioned as a potential consequence of interstate banking deregulation.16 We use
three empirical tests that provide empirical support to this argument.
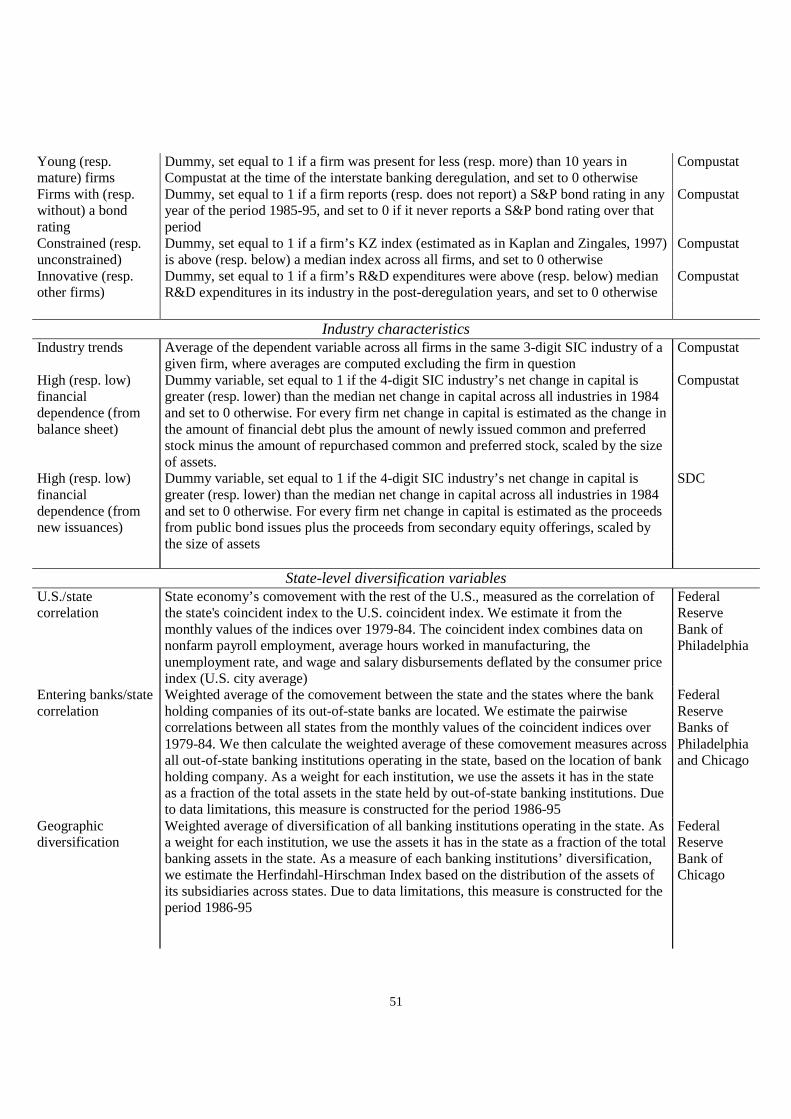
In our first test, we separate the states according to how their economic activity comoves
with the rest of the U.S. economy. Here we expect that states that are least correlated with
the activity of other states would provide the highest diversification benefits for entering
banks and thus would experience the highest increase in the number of patents. In particular,
we extract a coincident index that summarizes state-level economic indicators from the
Federal Reserve Bank of Philadelphia. The coincident index combines data on nonfarm
payroll employment, average hours worked in manufacturing, unemployment rate, and wage
and salary disbursements deflated by the consumer price index (U.S. city average). The trend
for each state’s index is set to the trend of its gross domestic product (GDP) so that long-
term growth in the state’s index matches long-term growth in its GDP (Crone and Clayton-
Matthews 2005). We estimate the correlation between a state's economy and the rest of the
U.S. using monthly values of the coincident indices over 1979-84, i.e. before interstate
banking deregulation started to come into effect. We call this variable U.S./state correlation.
In Table 10, Columns (1) and (2), we show that the increase in patenting primarily rose in
the states with a recent history of least covariation with the rest of the U.S.17
Our second test relies on the location of banking institutions that enter a given state. We
investigate whether the effect on innovation was highest in those states where new out-of-
state banks were entering from the states least comoving with the state in question. In
16 For instance, Federal Reserve Board Governor Martha Seger noted in her address before the California League of Savings Institutions in San Diego in April, 1986, that "interstate expansion allows for the diversification of sources and uses of funds. Dependence on economic conditions in a very limited number of local markets can be reduced by a wider range of operations" and that "if lenders had been able to spread their loan portfolios over larger geographic areas, fewer institutions would have had such high concentrations of agricultural and energy loans." 17 Due to the type of non-linear models used in the analysis, we are not able to evaluate how the coefficients across our sample splits compare in the statistical sense. However, we do observe clear differences in terms of economic magnitude.
23
particular, for each pair of states we estimate the correlation of their monthly values of
coincident indices over 1979-84. We then calculate the weighted average of these
comovement measures across all out-of-state banking institutions operating in the state,
based on the location of their bank holding companies. As a weight for each institution, we
use the assets it has in the state as a fraction of the total assets in the state held by out-of-
state banking institutions. We estimate such a measure, decreasing in the actual
diversification, for each state and year. We call this variable Entering banks/state
correlation. Our data on the banking institutions come from the Reports of Condition and
Income (Call Reports) that provide information on the financial activities and ownership
structures of each banking institution. All banking institutions regulated by the FDIC, the
Federal Reserve, or the Office of the Comptroller of the Currency are required to file Call
Reports. Since this data is only available to us starting from 1986, we conduct the analysis
on a subsample between 1986 and 1995. In Table 10, Columns (3) and (4), we report that the
increase in patenting was higher in the states that experienced the entry of the banks from the
states with the least comoving economic indicators.
Our third test explores the differences in the diversification of banks in each state. If our
argument is correct, those states that experienced the largest change in the average
diversification of banks operating in their state should have experienced higher credit risk-
taking by banks and thus a subsequent larger increase in innovative activities. We use the
data from the Call Reports to estimate the diversification of each bank. Our procedure
follows three steps. First, for each bank we identify whether it is a subsidiary to some other
financial institution, i.e., whether it is controlled by a bank holding company. Second, for
each bank holding company we estimate the distribution of total assets across states, based
on where its subsidiaries are located. In particular, we estimate Herfindahl-Hirschman Index
(HHI) as our diversification measure (Goetz et al. 2012). Third, for each state we calculate
the weighted average of these diversification measures across all banking institutions
operating in the state. As a weight for each institution, we use the assets it has in the state as
24
a fraction of the total banking assets in the state of all institutions. In summary, our measure,
decreasing in the actual diversification, Geographic diversification, is estimated as:
./0)*0* .10)*0) 2+34
* 564
)
where 0)* denotes the total assets of all subsidiaries of bank i in state j; 0) denotes the total
assets of all subsidiaries of bank i across all 7) states it operates; 0* denotes the total assets
of all banks in state j. A large increase in diversification might mean that new out-of-state
banks were well diversified and also that in-state banks better diversified across other states.
In Table 10, Columns (5) and (6), we show that patenting mainly increased in the states with
the largest diversification of banking activities.
7.2 Geographic proximity
We have shown that the deregulation effect on firms’ innovation was highest in the states
where out-of-state banks could achieve best geographic diversification. However, even
within the state, the exposure to deregulation differed across the firms based on their
location; some firms experienced more new banks entering their area than others. We thus
expect the increase in patenting following deregulation to be stronger for the firms located in
areas where the presence of out-of-state banks was particularly high after the interstate
deregulation.
Based on firms’ zip codes, we estimate the spherical distance between each firm’s
headquarters18 and all banking institutions that filed the Call Reports in 1995. For each firm,
we then identify the number of all banks within a 10-mile radius, the number of banks
owned by out-of-state bank holding companies within a 10-mile radius as well as the closest
bank owned by an out-of-state bank holding company. We find that the median firm had
18 Since not all firms report their zip codes in Compustat, our sample used to generate results in this section is smaller and the power to get the statistical significance is weaker.
25
seven banks within a 10-mile radius, out of which, on average, zero were owned by out-of-
state institutions. The median distance from the firm to an out-of-state bank was 11 miles.
Within 50 miles, the median firm had access to three out-of-state banks in 1995.
Table 11, Columns (1) and (2) show that firms that had any out-of-state banks within 10
miles experienced a larger increase in patenting; however, our main results do not hold for
firms without proximate out-of-state banks. Moreover, Columns (3) and (4) report that if we
further split the subsample of firms with proximate out-of-state banks into those that had
above and below the median number of banks in general within 10 miles, we find that the
result holds in the subsample that had lower concentration of local banks, i.e., where out-of-
state banks might have had a bigger impact. In our alternative specification, we instead
perform a robustness check by replicating the same result using a 50-mile radius.
Taken together, these results indicate that the increase in corporate innovation during the
post-deregulation period was strongly influenced by how deregulation affected the
geography of credit markets.
7.3 Financial dependence and innovation inputs
If easier access to credit was a channel through which banking deregulation affected
corporate innovation, we expect the effect to be more prevalent among firms that operate in
industries requiring high external finance. We shed light on this notion by testing how our
main finding varies depending on the industry-level reliance on external capital. To this end,
we classify firms based on whether the industry in which they operate was above or below
the across-industry median of external financial capital raised at the time of the interstate
banking deregulation. Our measure is thus similar to Rajan and Zingales’s (1998) proxy for
an industry’s financial constraints. We estimate it in two ways. First, we use balance sheet
measures. In particular, we take the average across the industry of the combined net change
in equity and debt normalized by the book value of assets. Second, we use the data in the
26
SDC New Issues database and estimate financial dependence as the total proceeds from
issuance of securities over the year divided by the book value of assets.
Results reported in Table 12 indicate that the positive effect of interstate banking
deregulation on firm innovation is more pronounced for firms operating in industries that are
highly dependent upon external finance.
Turning our attention to firm-level characteristics, we further posit that our finding
should be stronger for firms that were more dependent upon bank credit prior to
deregulation. We investigate this notion by first considering firm age. Because old and well-
established firms can typically access the public debt market or easily raise equity, they
should not be influenced by changes in bank credit supply. By contrast, young firms, which
are typically more financially constrained due to asymmetric information problems, are
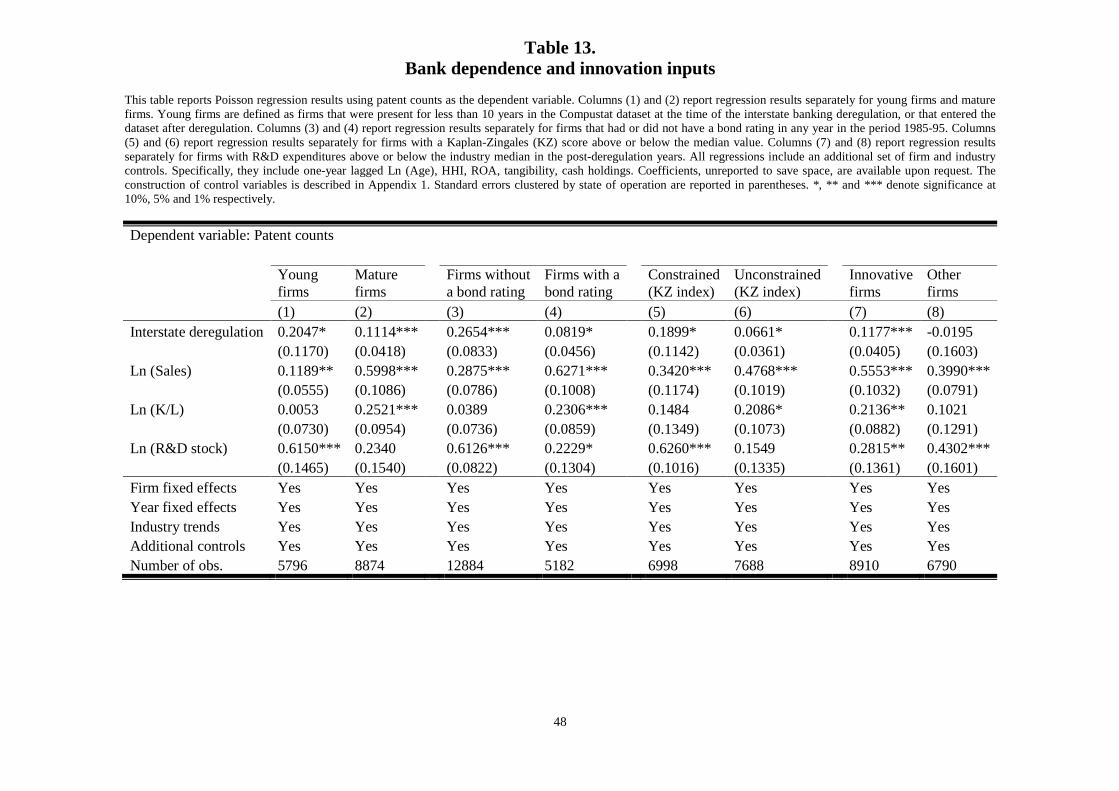
expected to respond to changes in bank credit. We focus on the subsample of firms that are
present for fewer than 10 years in Compustat (Rajan and Zingales 1998; Cetorelli and
Strahan 2006) at the time of the interstate banking deregulation, and firms that entered the
sample after the deregulation. As shown in Table 13, Columns (1) and (2), the effect of
deregulation on firm patents was positive and statistically significant both for young and
mature firms. However, the economic magnitude is much larger among young firms: while
young firms subject to interstate banking deregulation experienced a 22.7% increase in
patents, the effect is 11.7% for mature firms.
Next, we sort firms according to whether they were assigned a long-term bond rating by
Standard&Poors. By allowing firms to access public debt markets, a bond rating is related to
lower credit constraints (Kashyap et al. 1994; Almeida et al. 2004; Faulkender and Petersen
2006; Denis and Sibilkov 2010) and, consequently, lower responsiveness to changes in bank
finance (Leary 2009). We construct two subsamples depending on whether a firm reports a
bond rating or not in any year of the period 1985-95.19 Columns (3) and (4) show that the
effect of deregulation on innovation is significantly larger for firms experiencing tougher 19 1985 is the first year when the coverage of S&P ratings in Compustat started.
27
access to the public bond market. In fact, using the actual public bond issuance data from
SDC New Issuances we confirm this result. Firms that do not have public bonds outstanding
over 1985-95 experienced an increase in innovative activities after the interstate banking
deregulation while there was no statistically significant effect for firms that were active in
the public bond market.
Overall, these results suggest that the effect of interstate banking deregulation on
corporate innovation was shaped by bank dependence: the effect was economically larger
among firms that were younger and that had worse access to other segments of the credit
market. This evidence is consistent with previous findings that bank credit is most relevant
for less-established and informationally opaque firms (Hadlock and James 2002).
We further study the importance of financial constraints by constructing the Kaplan and
Zingales (KZ) index and estimating our model separately for constrained (above-median KZ
index) and unconstrained (below-median KZ index) firms. To compute the KZ index, we
follow Lamont et al. (2001) who use the original coefficient estimates of Kaplan and
Zingales (1997). Results, reported in Columns (5) and (6), show that the effect of interstate
banking deregulation was economically more relevant among constrained firms, though the
statistical significance is present in both subsamples.
Finally, if firms innovated more due to the relaxation of financial constraints following
deregulation, we should expect our results to be increasing in post-deregulation innovation
expenditures. We explore this aspect by classifying firms depending on whether in the post-
deregulation period they invested more than their industry peers in R&D expenditures.
Results are reported in Columns (7) and (8). As expected, the positive effect of deregulation
on firm patents is only present among firms that invested heavily in innovation in the post-
deregulation period.
28
7.4 Financing vs. spillovers
Our results so far indicate that, on average, listed manufacturing firms in the U.S. increased
their innovation activities following deregulation. Results in the previous section document
that this increase is particularly large for firms that are more dependent on bank credit.
Therefore, our results are consistent with the notion that deregulation relaxed financial
constraints of bank-dependent firms.
However, our evidence so far may also be consistent with the interpretation that the
increase in innovation following deregulation was driven by knowledge spillovers from
entrepreneurial firms. Since deregulation encouraged entrepreneurial activity as well as firm
exit (Kerr and Nanda 2009), it is possible that our results are driven by churning in the
entrepreneurial sector and that innovation in public firms rose only because of spillovers
rather than relaxed financial constraints. In this section, we present evidence that attempts to
disentangle the financing from the spillovers explanations. First, we analyze the effect of
deregulation on the innovation of software firms. Since firms in this industry use primarily
equity to finance their operations, the effect of deregulation via less binding financial
constraints should be negligible. If instead there were spillovers effect at play, then software
firms may have experienced an increase in innovation that is, however, not related to
financial constraints. Estimating our specification on the software industry only (SIC 73), we
find that the deregulation effect was negative and statistically insignificant (p-value=0.21).
Hence, this result does not provide support to the spillover interpretation.20
Second, we look at whether the innovation of firms located close to the state borders was
affected by banking deregulation in the neighboring states. Presumably, spillover effects
prevail across state borders and thus, if our previous finding of increased innovation by
public firms came only from spillovers, there should also be a positive effect when the
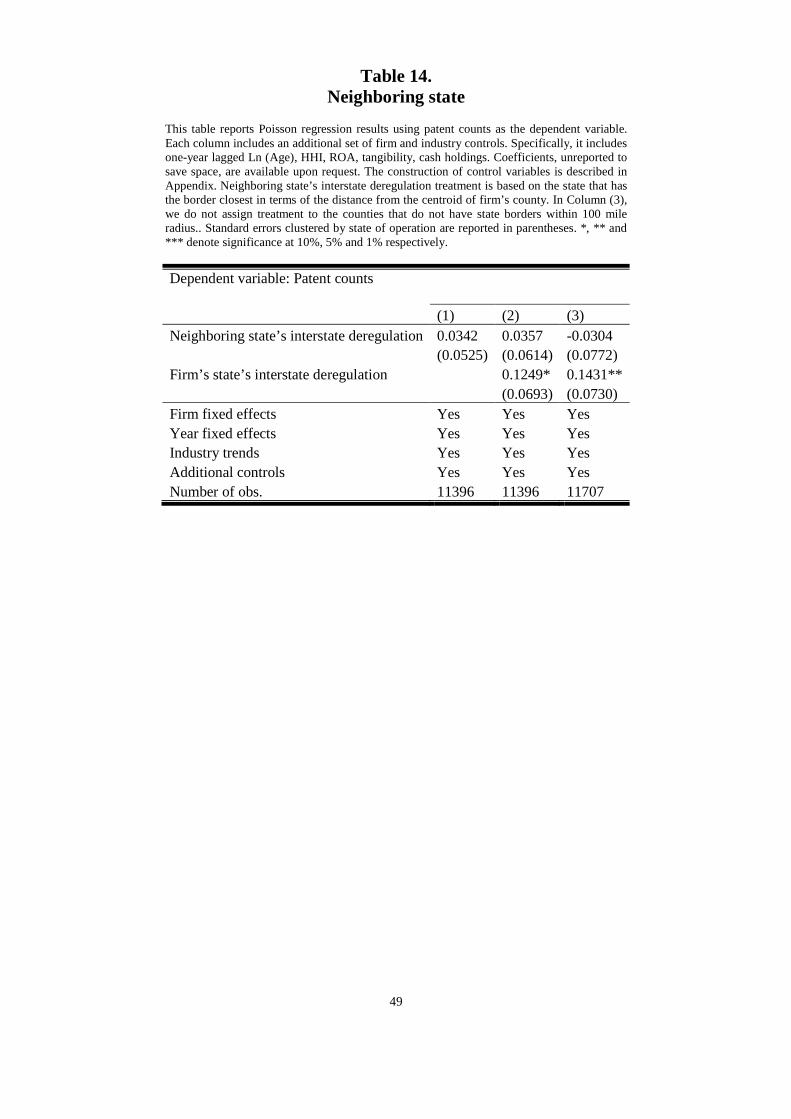
neighboring state deregulates. However, in Table 14, we do not find support for this
20 Existing works have also provided some indication that firms changed their financial policies following deregulation. For instance, Francis et al. (2011) report that firms exposed to deregulation hold less cash.
29
argument. In particular, we limit our sample to the firms that have their counties reported in
Compustat and match county information to the geographical border data used in Holmes
(1998). For each firm we pick the state that has the border closest in terms of the distance
from the centroid of firm’s county. We find that only the deregulation of a firm’s state of
headquarter is relevant for innovation but not that of the closest other state. The result is
even stronger if we do not assign treatment to the counties that do not have state borders
within a 100 miles radius.
Third, in unreported analyses we control for linear patenting trends by technological
class and state. Since knowledge externalities tend to be localized (Jaffe et al., 1993) this
regression allows us to control for spillovers in given geographical and technological areas.
Specifically, we take the most represented technological class in terms of patent citations by
state and year, and then we include the number of citations of this class as explanatory
variable in our main specification. Estimating a model as in Table 3, Column (4), we find
that the increase in the expected number of patents remains economically relevant and
statistically significant at the 1% level. Similar results are obtained if we control for patent
trends computed by state and 3-digit SIC industry.
8. Discussion
While the relationship between economic prosperity and banking development has been
widely debated, establishing the direction of causality remains a challenging task. We focus
on manufacturing firms’ innovative performance and exploit the passage of interstate
banking deregulation during the 1980s and 1990s in the U.S. to generate exogenous
variations in the geographic spread of U.S. banking institutions. Interstate banking
deregulation allowed banks to expand geographically, increased the availability and quality
of credit, and was associated with the adoption of new screening and monitoring
technologies.
30
Our main result indicates that interstate banking deregulation spurred firms’ innovation
activities, as measured by patent-based metrics. Furthermore, we find that the effect was not
imminent, but was driven mainly by firms that were located closer to the entering banks, as
well as firms that operated in industries requiring high external capital. Finally, we provide
evidence that the increase in firms’ innovation activities is associated with a better ability of
out-of-state banks to diversify credit risk geographically and thereby lend to riskier
borrowers.
Since innovation is a key driver of economic progress, the importance of our results goes
beyond the effect on corporate patenting. To shed light on the aggregate economic
implications of our findings, we estimate separate regressions as in Table 3, specification
(1). for each SIC 2-digit industry and then rank the industries by how much the patenting
activity in a specific industry was affected by interstate banking deregulation (i.e., by the
size of the deregulation coefficient).21 Comparing these industry-level effects with future
industry growth (measured as growth in the value of shipments over 1995-2000), we find a
positive and 7% significant association. Industries where deregulation had a higher impact
on patenting experienced a subsequent increase in output growth. For instance, the five
industries with largest deregulation estimates grew, on average, by 4.9% annually over 1995-
2000. By contrast, the five industries with the smallest deregulation estimates grew, on
average, by 0.2%.
In summary, our research suggests that bank geographic diversification is an important
determinant of banks’ willingness to take risk and thus contributes to technological progress
and growth.
21 The effect of deregulation laws on firm patenting was largest in primary metal (SIC 33), furniture and fixtures (SIC 25), and petroleum refining and related industries (SIC 29). We find no difference in growth rates between these groups of industries prior to deregulation (in 1980-85).
31
References
Acharya V.L., Imbs J. and Sturgess J. (2011) “Finance and Efficiency: Do Bank Branching Regulations Matter?”, Review of Finance 15, 135-172.
Aghion P., Bloom N., Blundell R., Griffith R. and Van Reenen J. (2005) “Competition and Innovation: An Inverted-U Relationship”, Quarterly Journal of Economics 120, 701-728.
Aghion P., Van Reenen J. and Zingales L. (2012) “Innovation and Institutional Ownership”, American Economic Review, forthcoming.
Ashcraft, A.B. (2005) "Are Banks Really Special? New Evidence from the FDIC-Induced Failure of Healthy Banks", American Economic Review 95, 1712-1730.
Ayyagari M., Demirguc-Kunt A. and Maksimovic V. (2011) “Firm Innovation in Emerging Markets: The Role of Finance, Governance and Competition”, Journal of Financial and Quantitative Analysis 46, 1545-1580.
Albert M.B., Avery D., Narin F. and McAllister P. (1991) “Direct Validation of Citation Counts as Indicators of Industrially Important Patents”, Research Policy 20, 251-259.
Almeida H., Campello E. and Weisbach M.S. (2004) “The Cash Flow Sensitivity of Cash”, Journal of Finance 59, 1777-1804.
Amel D. (1993) “State Laws Affecting the Geographic Expansion of Commercial Banks”, Board of Governors of the Federal Reserve System, Working Paper.
Atanassov J., Nanda V. and Seru A. (2007) “Finance and Innovation: The Case of Publicly Listed Firms”, Working Paper.
Atanassov J. (2012) “Do Hostile Takeovers Stifle Innovation? Evidence from Anti-Takeover Legislation and Corporate Patenting”, Journal of Finance, forthcoming.
Balasubramanian N. and Sivadasan J. (2011) “What Happens when Firms Patent: New Evidence from US Economic Census Data”, Review of Economics and Statistics, forthcoming.
Beck T., Levine R. and Levkov A. (2010) “Big Bad Banks? The Winners and Losers from Bank Deregulation in the United States”, Journal of Finance 65, 1637-1667.
Bencivenga V. and Smith B. (1991) "Financial Intermediation and Endogenous Growth," Review of Economic Studies 58, 195-209.
Benfratello L., Schiantarelli F. and Sembenelli A. (2008) “Banks and Innovation: Microeconometric Evidence from Italy”, Journal of Financial Economics 90, 197- 217.
Bernstein S. (2012) “Does Going Public Affect Innovation?”, Working Paper. Bertrand M., Schoar A. and Thesmar D. (2007) “Banking Deregulation and Industry
Structure: Evidence from the French Banking Reforms of 1985”, Journal of Finance 62, 597-628.
Bertrand M. and Mullainathan S. (2003) “Enjoying the Quiet Life? Corporate Governance and Managerial Preferences”, Journal of Political Economy 111, 1043-1075.
Bessen J. (2009) “NBER PDP Project User Documentation: Matching Patent Data to Compustat Firms”, available at: http://www.nber.org/~jbessen/matchdoc.pdf
Bharath S., Dahiya S., Saunders A. and Srinivasan A. (2011) “Lending Relationships and Loan Contract Terms”, ”, Review of Financial Studies 24, 1141-1203.
32
Bhattacharya S. and Ritter J. R. (1983) “Innovation and Communication: Signaling with Partial Disclosure”, Review of Economic Studies 50, 331-346.
Black S. and Strahan P.E. (2002) “Entrepreneurship and Bank Credit Availability”, Journal of Finance 57, 2807-2833.
Brown J.R., Fazzari S.M. and Petersen B.C. (2009) “Financing Innovation and Growth: Cash Flow, External Equity and the 1990s R&D Boom”, Journal of Finance 64, 151-185.
Campello M., Graham J.R. and Harvey C.R. (2010) “The Real Effects of Financial Constraints: Evidence from a Financial Crisis”, Journal of Financial Economics 97, 470-487.
Carow K.A. and Heron R.A. (1998) “The Interstate Banking and Branching Efficiency Act of 1994: A Wealth Event for Acquisition Targets”, Journal of Banking and Finance 22, 175-196.
Cetorelli N. and Strahan P. (2006) “Finance as Barrier to Entry: Bank Competition and Industry Structure in the Local U.S. Markets”, Journal of Finance 61, 437-461.
Chemmanur T.J. and Tian X. (2011) “Do Anti-Takeover Provisions Spur Corporate Innovation?”, Working Paper.
Cornaggia J., Tian X., and Wolfe B. (2011) “Does Banking Competition Affect Corporate Innovation?”, Working Paper.
Correa R. and Suarez G.A. (2009) “Firm Volatility and Banks: Evidence from U.S. Banking Deregulation”, Finance and Economics Discussion Series 46, Federal Reserve Board Washington.
Crone T.M. and Clayton-Matthews A. (2005) “Consistent Economic Indexes for the 50 States”, Review of Economics and Statistics 87, 593-603.
Dass N. and Massa M. (2011) “The Impact of a Strong Bank-Firm Relationship on the Borrowing Firm”, Review of Financial Studies 24, 1204-1260.
Demirguc-Kunt A., Maksimovic V. (1998) “Law, Finance, and Firm Growth”, Journal of Finance 53, 2107-2137.
Demyanyk Y., Ostergaard C. and Sørensen B.E. (2007) “U.S. Banking Deregulation, Small Businesses, and Interstate Insurance of Personal Income”, Journal of Finance 62, 2763-2801.
Denis D.J. and Sibilkov V. (2010) “Financial Constraints, Investment, and the Value of Cash Holdings”, Review of Financial Studies 23, 247-269.
Dick A. and Lehnert A. (2010) “Personal Bankruptcy and Credit Market Competition”, Journal of Finance 65, 655-686.
Duchin R., Ozbas O. and Sensoy B.A. (2010) “Costly External Finance, Corporate Investment, and the Subprime Mortgage Credit Crisis”, Journal of Financial Economics 97, 418-435.
Faulkender M. and Petersen M. (2006) “Does the Source of Capital Affect Capital Structure?”, Review of Financial Studies 19, 45-79.
Ferreira D., Manso G. and Silva A.C. (2011) “Incentives to Innovate and the Decision to Go Public or Private”, Review of Financial Studies, forthcoming..
Francis B., Hasan I. and Wang H. (2011) “Banking Deregulation, Consolidation, and Corporate Cash Holdings: U.S. Evidence”, Working Paper.
33
Galasso A. and Simcoe T. (2011) “CEO Overconfidence and Innovation”, Management Science, forthcoming.
Giroud X. and Mueller H. (2010) “Does Corporate Governance Matter in Competitive Industries?”, Journal of Financial Economics 95, 312-331.
Goetz M., Laeven L. and Levine R. (2012) “The Valuation Effect of Geographic Diversification: Evidence from U.S. Banks”, Working Paper.
Greenwood J. and Jovanovic B. (1990) “Financial Development, Growth, and the Distribution of Income”, Journal of Political Economy 98, 1076–1107.
Griliches Z. (1990) “Patent Statistics as Economic Indicators: A Survey," Journal of Economic Literature 28, 1661-1707.
Guiso L., Sapienza P. and Zingales L. (2004) “Does Local Financial Development Matter?”, Quarterly Journal of Economics 119, 929-969.
Hadlock C.J. and James C.M. (2002) “Do Banks Provide Financial Slack?”, Journal of Finance 57, 1383-1419.
Hall B.H. (2004) “Exploring the Patent Explosion”, Journal of Technology Transfer 30, 35-48.
Hall B.H., Jaffe A.B. and Trajtenberg M. (2001) “The NBER Patent Citation Data File: Lessons, Insights and Methodological Tools”, Working Paper No. 8498, National Bureau of Economic Research.
Hall B.H., Jaffe A.B. and Trajtenberg M. (2005) “Market Value and Patent Citations”, RAND Journal of Economics 36, 16-38.
Hall B.H. and Ziedonis R.H. (2001) “The Patent Paradox Revisited: An Empirical Study of Patenting in the U.S. Semiconductor Industry, 1979-1995”, RAND Journal of Economics 32, 101-128.
Harhoff D., Narin F., Scherer F.M. and Vopel K. (1999) “Citation Frequency and the Value of Patented Inventions”, Review of Economics and Statistics 81, 511-515.
Hausman J., Hall B.H. and Griliches Z. (1984) “Econometric Models for Count Data and an Application to the Patents-R&D Relationship”, Econometrica 52, 909-938.
Henry M.D. and Turner J.L (2006) “The Court of Appeals for the Federal Circuit’s Impact on Patent Litigation”, Journal of Legal Studies 35, 85-117.
Himmelberg C.P. and Petersen B.C. (1994) “R&D and Internal Finance: A Panel Study of Small Firms in High-Tech Industries”, Review of Economics and Statistics 76, 38-51.
Holmes T.J. (1998) “The Effects of State Policies on the Location of Industry: Evidence from State Borders”, Journal of Political Economy 106, 667-705.
Jaffe A.B., Fogarty M.S. and Trajtenberg M. (2000) “Knowledge Spillovers and Patent Citations: Evidence from a Survey of Inventors”, American Economic Review 90, 215-218.
Jaffe A.B., Trajtenberg M. and Henderson R. (1993) “Geographic Localization of Knowledge Spillovers as Evidenced by Patent Citations”, Quarterly Journal of Economics 108, 577-958.
Jayaratne J. and Strahan P. (1996) “The Finance-Growth Nexus: Evidence from Bank Branch Deregulation”, Quarterly Journal of Economics 111, 639-670.
Jayaratne J. and Strahan P. (1998) “Entry Restrictions, Industry Evolution, and Dynamic Efficiency: Evidence from Commercial Banking”, Journal of Law and Economics 41, 239-274.
34
Johnson S. (1997) “An Empirical Investigation of Corporate Debt Ownership Structure”, Journal of Financial and Quantitative Analysis 32, 47-69.
Johnson C. and Rice T. (2008) “Assessing a Decade of Interstate Bank Branching”, The Washington and Lee Law Review 65, 73-127.
Kaplan S. N. and Zingales L. (1997) “Do Financial Constraints Explain why Investment is Correlated with Cash Flow?”, Quarterly Journal of Economics 112, 169-216.
Kashyap A.K., Lamont O.A. and Stein J.C. (1994) “Credit Conditions and the Cyclical Behavior of Inventories”, Quarterly Journal of Economics 109, 565-592.
Kerr W.R. and Nanda R. (2009) “Democratizing Entry: Banking Deregulation, Financing Constraints, and Entrepreneurship”, Journal of Financial Economics 94, 124-149.
Kerr W.R. and Nanda R. (2010) “Banking Deregulations, Financing Constraints, and Firm Entry Size”, Journal of the European Economic Association 8, 582-593.
King R. and Levine R. (1993a) “Finance and Growth: Schumpeter Might Be Right”, Quarterly Journal of Economics 108, 717-737.
King R. and Levine R. (1993b) “Finance, Entrepreneurship and Growth: Theory and Evidence”, Journal of Monetary Economics 32, 513-542.
Kortum S. and Lerner J. (2000) “Assessing the Contribution of Venture Capital to Innovation”, RAND Journal of Economics 31, 674-692.
Kroszner R.S. and Strahan P. (1999) “What Drives Deregulation? Economics and Politics of the Relaxation of Bank Branching Restrictions”, Quarterly Journal of Economics 114, 1437-67.
Leary M.T. (2009) “Bank Loan Supply, Lender Choice, and Corporate Capital Structure”, Journal of Finance 64, 1143-1185.
Laeven L., Levine R. and Michalopoulos S. (2012) “Financial Innovation and Endogenous Growth”, Working Paper.
Lamont O., Polk C. and Saa-Requejo J. (2001) “Financial Constraints and Stock Returns”, Review of Financial Studies 14, 529-554.
Lemmon M. and Roberts M.R. (2010) “The Response of Corporate Financing and Investment to Changes in the Supply of Credit”, Journal of Financial and Quantitative Analysis 45, 555-587.
Lerner J., Sorensen M. and Strömberg P. (2011) “Private Equity and Long-Run Investment: The Case of Innovation”, Journal of Finance 66, 445-477.
Levine R. and Zervos S. (1998) “Stock Markets, Banks, and Economic Growth”, American Economic Review 88, 537-558.
Levine R. (2005) “Finance and Growth: Theory and Evidence”, in Handbook of Economic Growth, edited by Aghion P. and Durlauf S.N., Elsevier.
Loumioti M. (2012) “The Use of Intangible Assets as Loan Collateral”, Working Paper. Maksimovic V. and Pichler P. (2001) “Technological Innovation and Initial Public
Offerings”, Review of Financial Studies 14, 459-494. Michalski T. and Ors E. (2011) “U.S. Banking Integration and State-Level Exports”,
Working Paper. Michalski T. and Ors E. (2012) “(Inter-state) Banking and (Inter-state) Trade: Does Real
Integration Follow Financial Integration?”, Journal of Financial Economics 104, 89-117.
35
Nanda R. and Nicholas T. (2011) “Does Bank Distress Stifle Innovation during the Great Depression?”, Working Paper.
Pirinski C. and Wang Q. (2006) “Does Corporate Headquarters Location Matter for Stock Returns?”, Journal of Finance 61, 1991-2005.
Rajan R. and Zingales L. (1998) “Financial Dependence and Growth”, American Economic Review 88, 559-586.
Rice T. and Strahan P. (2010) “Does Credit Competition Affect Small Firm Finance?”, Journal of Finance 65, 861-889.
Sapra H., Subramanian A. and Subramanian K. (2011) “Corporate Governance and Innovation: Theory and Evidence”, Working Paper.
Scherer F.M. (1983) “The Propensity to Patent”, International Journal of Industrial Organization 1, 226-237.
Schumpeter J.A. (1911) “The Theory of Economic Development”, Harvard University Press, Cambridge.
Smith S.W. (2011) “Beg, Borrow and Deal? Entrepreneurs’ Choice of Financing and New Firm Innovation”, Working Paper.
Stiglitz J.E. (1985) “Credit Markets and Capital Control”, Journal of Money, Credit and Banking 17, 133-152.
Trajtenberg M. (1990) “A Penny for Your Quotes: Patent Citations and the Value of Innovations”, RAND Journal of Economics 21, 172-187.
Trajtenberg M., Jaffe A.B. and Henderson R. (1997) “University versus Corporate Patents: A Window on the Basicness of Invention”, Economics of Innovation and New Technology 5 19-50.
Wall H.J. (2004) “Entrepreneurship and the Deregulation of Banking”, Economics Letters 82, 333-339.
Wooldridge J.M. (1999) “Distribution-Free Estimation of Some Nonlinear Panel Data Models”, Journal of Econometrics 90, 77-97.
36
Table 1. Major deregulation in the U.S. banking industry
Panel A. Interstate banking deregulation Year State 1978 Maine 1982 New York, Alaska 1983 Connecticut, Massachusetts 1984 Rhode Island, Utah, Kentucky 1985 North Carolina, Ohio, Virginia, District of Columbia, Nevada, Maryland, Idaho, Georgia, Tennessee, Florida 1986 Arizona, New Jersey, South Carolina, Pennsylvania, Oregon, Michigan, Illinois, Indiana, Missouri, Minnesota 1987 California, Alabama, Washington, New Hampshire, Texas, Oklahoma, Louisiana, Wyoming, Wisconsin 1988 Delaware, Vermont, South Dakota, Mississippi, West Virginia, Colorado 1989 New Mexico, Arkansas 1990 Nebraska 1991 North Dakota, Iowa 1992 Kansas 1993 Montana After 1993 Hawaii
Panel B. Intrastate branching deregulation Year State Before 1981
Maine, Alaska, Rhode Island, North Carolina, Virginia, District of Columbia, Nevada, Maryland, Idaho, Arizona, South Carolina, Delaware, California, Vermont, South Dakota, New York, New Jersey, Ohio, Connecticut
Between 1981 and 1985 Utah, Alabama, Pennsylvania, Georgia, Massachusetts, Tennessee, Oregon, Washington, Nebraska Between 1986 and 1990
Mississippi, Hawaii, Michigan, New Hampshire, West Virginia, North Dakota, Kansas, Florida, Illinois, Texas, Oklahoma, Louisiana, Wyoming, Indiana, Kentucky, Missouri, Wisconsin, Montana
After 1990 Colorado, New Mexico, Minnesota, Arkansas, Iowa
Panel C. Interstate Branching and Banking Efficiency Act (IBBEA) Provision Implementation Interstate banking Took effect in September 1995; permitted the Board of Governors of the Federal Reserve System to approve interstate bank
acquisitions, regardless of whether such acquisitions would have been permitted under "the law of any State." States were not permitted to opt out of the interstate banking rules.
Interstate branching Took effect in June 1997; permitted national or state bank to engage in interstate branching. States could opt out of interstate branching or impose restrictions such as the minimum age of the target institution to be acquired or statewide deposit cap.
37
Table 2. Firm characteristics
This table illustrates summary statistics. Ln (Patents) is the logarithm of a firm’s number of patents. Patent counts represent a firm’s number of patents. Cite-weighted patent counts represent a firm’s patents weighted by the number of future citations and adjusted for truncation. R&D to total investment is the ratio of R&D expenditures to the sum of R&D and capital expenditures. Ln (Sales) is the logarithm of a firm’s sales. Ln (K/L) is the logarithm of capital to labor ratio. Ln (Age) is the logarithm of 1 plus the number of years a firm has been in Compustat. ROA is return on assets, measured as the ratio of earnings before interest and depreciation (EBITDA) divided by the book value of assets at the beginning of the year. See Appendix 1 for a full description of each variable.
This table reports Poisson regression using the NBER-Compustat matched dataset. Column (4) includes an additional set of firm and industry controls. Specifically, they include one-year lagged Ln (Age), HHI, ROA, tangibility, cash holdings. Coefficients, unreported to save space, are available upon request. The construction of control variables is described in Appendix 1. Standard errors clustered by state of operation are reported in parentheses. *, ** and *** denote significance at 10%, 5% and 1% respectively.
This table reports Poisson results using a dynamic specification. We use patent counts as dependent variable. In Panel A, the response to interstate deregulation is modeled by leads and lags consolidated into two-year increments extending from two years before to eight years or more after the deregulation. Coefficients for leads are relative to the period three years or earlier before deregulation. In Panel B, years since interstate deregulation is a variable equal to the number of years after the deregulation passages, with a long-term effect at eight years, and equal to zero before the deregulation. Standard errors clustered by state of operation are reported in parentheses. *, ** and *** denote significance at 10%, 5% and 1% respectively.
(1) (2) (1) (2) Years 1-2 before deregulation 0.0358 0.0424 Years since deregulation 0.0324* 0.0328* (0.0322) (0.0263) (0.0189) (0.0179) Years 2-3 after deregulation 0.1710*** 0.1759*** Ln (Sales) 0.4970*** 0.5357*** (0.0567) (0.0430) (0.0797) (0.0905) Years 4-5 after deregulation 0.1969** 0.2181*** Ln (K/L) 0.2269*** 0.1889** (0.0924) (0.0816) (0.0679) (0.0745) Years 6-7 after deregulation 0.2453** 0.2705*** Ln (R&D stock) 0.3690*** 0.3328*** (0.1110) (0.1033) (0.1232) (0.1232) Years 8+ after deregulation 0.3904*** 0.4129*** Firm fixed effects Yes Yes (0.1335) (0.1285) Year fixed effects Yes Yes Ln (Sales) 0.4121*** 0.4355*** Industry trends Yes Yes (0.1123) (0.1084) Additional controls No Yes Ln (K/L) 0.4942*** 0.5321*** Number of obs. 18066 18066
(0.0790) (0.0898) Ln (R&D stock) 0.2445*** 0.1988*** (0.0762) (0.0770) Firm fixed effects Yes Yes Year fixed effects Yes Yes Industry trends Yes Yes Additional controls No Yes Number of obs. 18066 18066
40
Table 5. Robustness checks
This table reports Poisson regression results using patent counts as the dependent variable and the binary interstate banking deregulation treatment as main explanatory variable, unless differently specified. Each regression includes firm and time fixed effects, industry trends as well as an additional set of firm and industry controls. Specifically, it includes one-year lagged Ln (Age), HHI, ROA, tangibility, cash holdings. Coefficients, unreported to save space, are available upon request. The construction of control variables is described in Appendix 1. Row (1) excludes firms headquartered in California and Massachusetts. Row (2) restricts the analysis to firms that remain in the sample from 1976, i.e. the first year of our analysis until 1995, i.e. the last year of our sample. Row (4) includes state-level macroeconomic controls, such as the GDP growth and logarithm of population, both obtained from the U.S. Bureau of Economic Analysis. Row (5) includes regional trends, computed as annual average of the dependent variable by U.S. region (as defined by the U.S. Census), excluding the firm in question. Row (6) adopts a sample extended up to 1997, whereas Row (7) restricts the sample up to 1994. In Row (8) sample starts in 1978. Row (9) replaces our main deregulation dummy with a continuous treatment equal to the logarithm of the number of states from which the entry of banks has been permitted by the particular year. To avoid dropping zero values, we add 0.1 to the number of stats before taking the logarithm. Row (10) replaces our main deregulation dummy with a continuous treatment equal to the logarithm of the number of states from which the entry of banks has been permitted by the particular year. To avoid dropping zero values, we add 0.1 to the number of states before taking the logarithm. Row (11) performs a continuous treatment equal to the logarithm of the population of states from which the entry of banks has been permitted by the particular year. To avoid dropping zero values, we add 0.1 to the population of states before taking the logarithm. Row (12) extends our sample up to 2006 and further controls for the Rice and Strahan (RS) index of restrictions to interstate branching. Row (13) controls for anti-takeover legislations by including a dummy for the passage of BC laws. Standard errors clustered by state of operation are reported in parentheses. Row (14) excludes “Semiconductors and Related Devices” technological field (SIC 3674). Row (15) excludes 1% of outliers, whereas Row (16) excludes 2.5% of outliers. Row (17) additionally controls for the square of firm sales and the squared HHI. Row (18) additionally controls for the logarithm of amount of venture capital and private equity funding in a given state and year. *, ** and *** denote significance at 10%, 5% and 1% respectively.
Dependent variable: Patent counts
Interstate deregulation coefficient
Standard error
Number of obs.
(1) Excluding California and Massachusetts 0.1044*** (0.0347) 13894 (2) Constant sample 0.1144*** (0.0418) 12333 (3) State as in inventor’s location 0.0847** (0.0347) 13235 (4) Including state-level controls 0.1239*** (0.0414) 18063 (5) Including regional trends 0.1315*** (0.0366) 18066 (6) Time window up to 1997 0.1339* (0.0702) 20571 (7) Time window up to 1994 0.1051*** (0.0365) 16969 (8) Time window starting in 1978 0.1155*** (0.0372) 15801 (9) Continuous deregulation treatment 0.0260* (0.0137) 18066 (10) Population-weighted continuous deregulation treatment 0.0064*** (0.0024) 18066 (11) Controlling for intrastate deregulation 0.1386*** (0.0395) 18066 (12) Controlling for RS index, time window up to 2006 0.1634* (0.0886) 31994 (13) Controlling for BC laws 0.1130*** (0.0433) 16070 (14) Excluding “Semiconductors and Related Devices” 0.0945*** (0.0335) 17445 (15) Excluding 1% observations on the right tail 0.1111*** (0.0416) 17837 (16) Excluding 2.5% observations on the right tail 0.1096*** (0.0394) 17477 (17) Controlling for firm size squared and HHI squared 0.1068*** (0.0359) 18066 (18) Controlling for VC funding 0.1169*** (0.0385) 18066
41
Table 6. Innovation quality
This table reports Poisson regression results using cite-weighted and truncation-adjusted patent counts as the dependent variable. Column (4) includes an additional set of firm and industry controls. Specifically, it includes one-year lagged Ln (Age), HHI, ROA, tangibility, cash holdings. Coefficients, unreported to save space, are available upon request. The construction of control variables is described in Appendix 1. Standard errors clustered by state of operation are reported in parentheses. *, ** and *** denote significance at 10%, 5% and 1% respectively.
This table reports Poisson results using as dependent variable the originality index (Columns 1-2) and generality index (Columns 3-4). The construction of these indexes and control variables is described in Appendix 1. Columns (2) and (4) include an additional set of firm and industry controls. Specifically, it includes one-year lagged Ln (Age), HHI, ROA, tangibility, cash holdings. Coefficients, unreported to save space, are available upon request. Standard errors clustered by state of operation are reported in parentheses. *, ** and *** denote significance at 10%, 5% and 1% respectively.
This table reports OLS regressions using the standard deviation of Ln(Cite-weighted patent counts) in the pre- and post-interstate banking deregulation periods as the dependent variable. Controls are constructed estimating the average measures in the pre- and post-deregulation periods. Column (2) includes an additional set of firm and industry controls. Specifically, it includes one-year lagged Ln (Age), HHI, ROA, tangibility, cash holdings. Coefficients, unreported to save space, are available upon request. Robust standard errors are reported in parentheses. *, ** and *** denote significance at 10%, 5% and 1% respectively.
This table reports Poisson regression results using zero-citation patent counts as the dependent variable. Columns (2) and (4) include an additional set of firm and industry controls. Specifically, they include one-year lagged Ln (Age), HHI, ROA, tangibility, cash holdings. Coefficients, unreported to save space, are available upon request. Furthermore, Columns (3) and (4) control for cite-weighted patent counts. The construction of control variables is described in Appendix 1. Standard errors clustered by state of operation are reported in parentheses. *, ** and *** denote significance at 10%, 5% and 1% respectively.
This table reports Poisson regression results using number of patents as the dependent variable. U.S./state correlation refers to state economy’s comovement with the rest of the U.S., measured as the correlation of state's coincident index to the U.S. coincident index. We estimate it from the monthly values of the indices over 1979-84. The coincident index combines data on nonfarm payroll employment, average hours worked in manufacturing, the unemployment rate, and wage and salary disbursements deflated by the consumer price index (U.S. city average). Entering banks/state correlation refers to the weighted average of the comovements between the state and the states where the bank holding companies of its out-of-state banks are located. We estimate the pairwise correlations between all states from the monthly values of the coincident indices over 1979-84. We then calculate the weighted average of these comovement measures across all out-of-state banking institutions operating in the state, based on the location of the bank holding company. As a weight for each institution, we use the assets it has in the state as a fraction of the total assets in the state held by out-of-state banking institutions. Geographic diversification refers to the weighted average of diversification of all banking institutions operating in the state. As a weight for each institution, we use the assets it has in the state as a fraction of the total banking assets in the state. As a measure of each banking institutions’ diversification, we estimate the Herfindahl-Hirschman Index based on the distribution of the assets of its subsidiaries across states. Due to data limitations, Entering banks/state correlation and Geographic diversification are only available for a subsample in the period 1986-95, and that explains the smaller sample size in Columns (3)-(6). The construction of the control variables is described in Appendix 1. Standard errors clustered by state of operation are reported in parentheses. *, ** and *** denote significance at 10%, 5% and 1% respectively.
This table reports Poisson regression results using patent counts as the dependent variable. Columns (1) and (2) report regression results separately for firms with and without proximate out-of-state banking institutions in 1995. Proximity is defined as the spherical distance of less than 10 miles from the firm’s headquarters. Columns (3) and (4) report regression results for firms with proximate out-of-state banking institutions in 1995, separately for firms with many and few proximate banking institutions overall. The split is based on the subsample median of 14 banking institutions. Proximity is defined as the spherical distance of less than 10 miles from the firm’s headquarters. Columns (5) and (6) report regression results separately for firms with and without proximate out-of-state banking institutions in 1995. Proximity is defined as the spherical distance of less than 50 miles from the firm’s headquarters. Coefficients, unreported to save space, are available upon request. The construction of control variables is described in Appendix 1. Standard errors clustered by state of operation are reported in parentheses. *, ** and *** denote significance at 10%, 5% and 1% respectively.
Dependent variable: Patent counts
Out-of-state banks within 10 miles
No out-of-state banks within 10 miles
Out-of-state banks within 10 miles and <14 total banks
Out-of-state banks within 10 miles and ≥14 total banks
This table reports Poisson regression results using number of patents as the dependent variable. In Columns (1) and (2) financial dependence is estimated based on the balance sheet measures. We take the average across industry of the combined net change in equity and debt normalized by the firm’s book value of assets. We then sort industries into high and low financial dependence based on the median financial dependence. In Columns (3) and (4), financial dependence is estimated based on the data in the SDC New Issues database. In particular, we take the average across industry of the total proceeds from issuance of securities divided by the book value of assets. We then sort industries into high and low financial dependence based on the median financial dependence. All regressions include an additional set of firm and industry controls. Specifically, they include one-year lagged Ln (Age), HHI, ROA, tangibility, cash holdings. Coefficients, unreported to save space, are available upon request. The construction of control variables is described in Appendix 1. Standard errors clustered by state of operation are reported in parentheses. *, ** and *** denote significance at 10%, 5% and 1% respectively.
This table reports Poisson regression results using patent counts as the dependent variable. Columns (1) and (2) report regression results separately for young firms and mature firms. Young firms are defined as firms that were present for less than 10 years in the Compustat dataset at the time of the interstate banking deregulation, or that entered the dataset after deregulation. Columns (3) and (4) report regression results separately for firms that had or did not have a bond rating in any year in the period 1985-95. Columns (5) and (6) report regression results separately for firms with a Kaplan-Zingales (KZ) score above or below the median value. Columns (7) and (8) report regression results separately for firms with R&D expenditures above or below the industry median in the post-deregulation years. All regressions include an additional set of firm and industry controls. Specifically, they include one-year lagged Ln (Age), HHI, ROA, tangibility, cash holdings. Coefficients, unreported to save space, are available upon request. The construction of control variables is described in Appendix 1. Standard errors clustered by state of operation are reported in parentheses. *, ** and *** denote significance at 10%, 5% and 1% respectively.
This table reports Poisson regression results using patent counts as the dependent variable. Each column includes an additional set of firm and industry controls. Specifically, it includes one-year lagged Ln (Age), HHI, ROA, tangibility, cash holdings. Coefficients, unreported to save space, are available upon request. The construction of control variables is described in Appendix. Neighboring state’s interstate deregulation treatment is based on the state that has the border closest in terms of the distance from the centroid of firm’s county. In Column (3), we do not assign treatment to the counties that do not have state borders within 100 mile radius.. Standard errors clustered by state of operation are reported in parentheses. *, ** and *** denote significance at 10%, 5% and 1% respectively.
Dummy, set equal to 1 from the year of interstate banking deregulation year onwards, and set to 0 for the years prior to deregulation
Innovation variables
Patent counts Count of a firm’s number of patents NBER Ln (Patents) Logarithm of a firm’s number of patents NBER Cite-weighted patent counts
Count of a firm’s number of patents weighted by future citations received and adjusted for truncation (as described in Hall et al. 2001; Hall et al. 2005)
NBER
Zero citation patent counts
Count of a firm’s number of patents with zero forward citations NBER
σ (Ln(Cite-weighted patent counts))
Standard deviation of the logarithm of a firm’s count of number of patents for the period 1976-95 weighted by future citations received and adjusted for truncation. Standard deviations are computed in the pre-and post-deregulation period, keeping in the computation firms that remain in each period at least two years
NBER
Originality index Equal to 1 − ∑ ()*+,-* , where ()*+ denotes the percentage of citations made by a patent i
that belong to the patent technology class j out of ni patent classes. Technology classes are defined by the USPTO and consist of about 400 main patent classes (3-digit level). The index will take high values (high originality) if a patent cites other patents that belong to many different technological fields
NBER
Generality index Equal to 1 − ∑ s)*+,-* , where s)*+ denotes the percentage of citations received by a patent
i that belong to the patent technology class j out of ni patent classes. The index will take high values (high generality) if a patent receives citations from subsequent patents that belong to many different technological fields
NBER
Ln (R&D Stock) Logarithm of (1 + cumulative R&D expenditures), computed assuming a 15% annual depreciation rate and using linear interpolation to replace missing values of R&D
Compustat
Firm characteristics Ln (Sales) Logarithm of a firm’s sales Compustat Ln (K/L) Logarithm of capital to labor ratio, where capital is represented by property, plants and
equipment (PPE), and labor is the number of employees Compustat
Ln (Age) Logarithm of (1+age), where age is the number of years that the firm has been in Compustat
Compustat
ROA EBITDA to total assets, dropping 1% of observations at each tail of the distribution to mitigate the effect of outliers
Compustat
Cash holdings Cash and marketable securities to total assets Compustat Tangibility 1- (intangible assets to total assets) Compustat HHI Herfindahl-Hirschman Index, computed as the sum of squared market shares of all
firms, based on sales, in a given 3-digit SIC industry in each year. We drop 2.5% of observations at the right tail of the distribution to mitigate potential misclassifications (Giroud and Mueller 2010)
Compustat
51
Young (resp. mature) firms
Dummy, set equal to 1 if a firm was present for less (resp. more) than 10 years in Compustat at the time of the interstate banking deregulation, and set to 0 otherwise
Compustat
Firms with (resp. without) a bond rating
Dummy, set equal to 1 if a firm reports (resp. does not report) a S&P bond rating in any year of the period 1985-95, and set to 0 if it never reports a S&P bond rating over that period
Compustat
Constrained (resp. unconstrained)
Dummy, set equal to 1 if a firm’s KZ index (estimated as in Kaplan and Zingales, 1997) is above (resp. below) a median index across all firms, and set to 0 otherwise
Compustat
Innovative (resp. other firms)
Dummy, set equal to 1 if a firm’s R&D expenditures were above (resp. below) median R&D expenditures in its industry in the post-deregulation years, and set to 0 otherwise
Compustat
Industry characteristics Industry trends Average of the dependent variable across all firms in the same 3-digit SIC industry of a
given firm, where averages are computed excluding the firm in question Compustat
High (resp. low) financial dependence (from balance sheet)
Dummy variable, set equal to 1 if the 4-digit SIC industry’s net change in capital is greater (resp. lower) than the median net change in capital across all industries in 1984 and set to 0 otherwise. For every firm net change in capital is estimated as the change in the amount of financial debt plus the amount of newly issued common and preferred stock minus the amount of repurchased common and preferred stock, scaled by the size of assets.
Compustat
High (resp. low) financial dependence (from new issuances)
Dummy variable, set equal to 1 if the 4-digit SIC industry’s net change in capital is greater (resp. lower) than the median net change in capital across all industries in 1984 and set to 0 otherwise. For every firm net change in capital is estimated as the proceeds from public bond issues plus the proceeds from secondary equity offerings, scaled by the size of assets
SDC
State-level diversification variables
U.S./state correlation
State economy’s comovement with the rest of the U.S., measured as the correlation of the state's coincident index to the U.S. coincident index. We estimate it from the monthly values of the indices over 1979-84. The coincident index combines data on nonfarm payroll employment, average hours worked in manufacturing, the unemployment rate, and wage and salary disbursements deflated by the consumer price index (U.S. city average)
Federal Reserve Bank of Philadelphia
Entering banks/state correlation
Weighted average of the comovement between the state and the states where the bank holding companies of its out-of-state banks are located. We estimate the pairwise correlations between all states from the monthly values of the coincident indices over 1979-84. We then calculate the weighted average of these comovement measures across all out-of-state banking institutions operating in the state, based on the location of bank holding company. As a weight for each institution, we use the assets it has in the state as a fraction of the total assets in the state held by out-of-state banking institutions. Due to data limitations, this measure is constructed for the period 1986-95
Federal Reserve Banks of Philadelphia and Chicago
Geographic diversification
Weighted average of diversification of all banking institutions operating in the state. As a weight for each institution, we use the assets it has in the state as a fraction of the total banking assets in the state. As a measure of each banking institutions’ diversification, we estimate the Herfindahl-Hirschman Index based on the distribution of the assets of its subsidiaries across states. Due to data limitations, this measure is constructed for the period 1986-95
Federal Reserve Bank of Chicago
52
Firm-level bank proximity variables Out-of-state banks within 10 (resp. 50) miles
Number of banking institutions in 1995 that operate in the firm’s state, are located within 10 (resp. 50) miles from the firm’s headquarters and are owned by an out-of-state bank holding company
Compustat, Federal Reserve Bank of Chicago
All banks within 10 miles
Number of banking institutions in 1995 that operate in the firm’s state and are located within 10 miles from the firm’s headquarters
Compustat, Federal Reserve Bank of Chicago
Most proximate out-of-state bank
Miles between the firm and the most proximate banking institutions in 1995 that operate in the firm’s state and are owned by an out-of-state bank holding company
Compustat, Federal Reserve Bank of Chicago
53
Appendix 2. Evidence from an opposite experiment
We provide support to the external validity of our findings by looking at the opposite
experiment, i.e. whether an exogenous dry-up of bank credit reduces corporate innovation.
Following Ashcraft (2005), we look into the case of the FDIC-induced failure of 18 healthy
subsidiaries of First City Bancorporation in 1992. As described in Ashcraft (2005), the cross-
guarantee provision of Financial Institutions Reform, Recovery, and Enforcement Act of
1989 permitted FDIC to charge off any expected losses related to the failure of one
subsidiary bank of a bank holding company to the capital of the other subsidiary bank. In
October 1992, the FDIC exercised this authority when the Dallas and Houston banks of First
City Bancorporation were declared insolvent and, as the result of FDIC action, 18 other
subsidiaries also failed. Importantly, these bank failures occurred for reasons that had little to
do with local area economic activity of 18 subsidiary banks as losses came from the loans
made to Iraqi banks before the Gulf War, as well as the weakness in the Dallas and Houston
commercial real estate markets. As argued in Ashcraft (2005), the only mechanism through
which these failures could have plausibly affected real economic activity is the destruction of
credit relationships with local borrowers.
We test whether the closure of these banks affected the patenting of firms headquartered
in those counties. We limit our analysis to Texas-headquartered and thus only consider 116
firms. Our continuous treatment takes the value of zero before 1992 and the value equal to
the ratio of failed healthy bank deposits to county income on and after 1992. The larger were
the failed healthy subsidiaries of the First City Bancorporation, the larger we expect it to be
the reduction in innovation. We find that innovation has decreased more for the firms that
were located in the counties with the failed healthy banks. This result is consistent with our
main result; yet, it should be interpreted with caution given the very small sample size.