Crime Analysis Crime Analysis for Problem Solvers for Problem Solvers Problem Oriented Policing Problem Oriented Policing Conference Conference Charlotte, NC Charlotte, NC October 2004 October 2004
Transcript
Crime Analysis Crime Analysis for Problem Solversfor Problem Solvers
Problem Oriented Policing ConferenceProblem Oriented Policing Conference
Charlotte, NCCharlotte, NC
October 2004October 2004
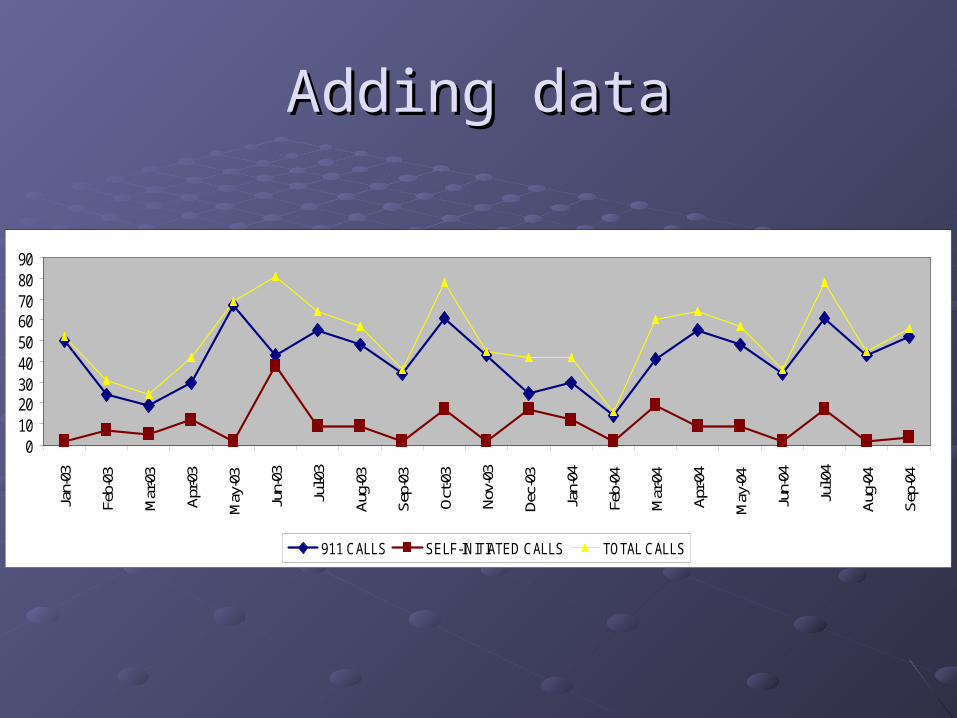
#1 How should crime #1 How should crime data be used?data be used?
Crime is relativeCrime is relative
0
500
1000
1500
2000
2500
3000
3500
4000
4500
Homicide Rape Robbery Agg. Assault Burglary Non MVLarceny
MVTheft/Larceny
2003 Data
Auto Theft Vehicle Burglary
0
9
2
9
8
3
5
0
1
2
3
4
5
6
7
8
9
SUN MON TUE WED THU FRI SAT
Target 4Walmart
0.00%
2.00%
4.00%
6.00%
8.00%
10.00%
12.00%
14.00%
0:00
1:00
2:00
3:00
4:00
5:00
6:00
7:00
8:00
9:00
10:0
0
11:0
0
12:0
0
13:0
0
14:0
0
15:0
0
16:0
0
17:0
0
18:0
0
19:0
0
20:0
0
21:0
0
22:0
0
23:0
0
24:0
0:00
Auto Theft Time of Day
Auto Theft Day of Week
Total Vehicles Stolen: 30% Recovered: 50%Avg. Time at Lot: 109 min.Avg. Vehicle Year: 1988
Walmart had 18 incidents predominantly between 12:00 – 20:00. The top makes include Fords and Hondas.
Most Common Lot Addresses within Target Area #4Walmart – 75 N. BroadwayBest Buy – 59 N. Broadway
Top Makes/ModelsToyotas & Nissans
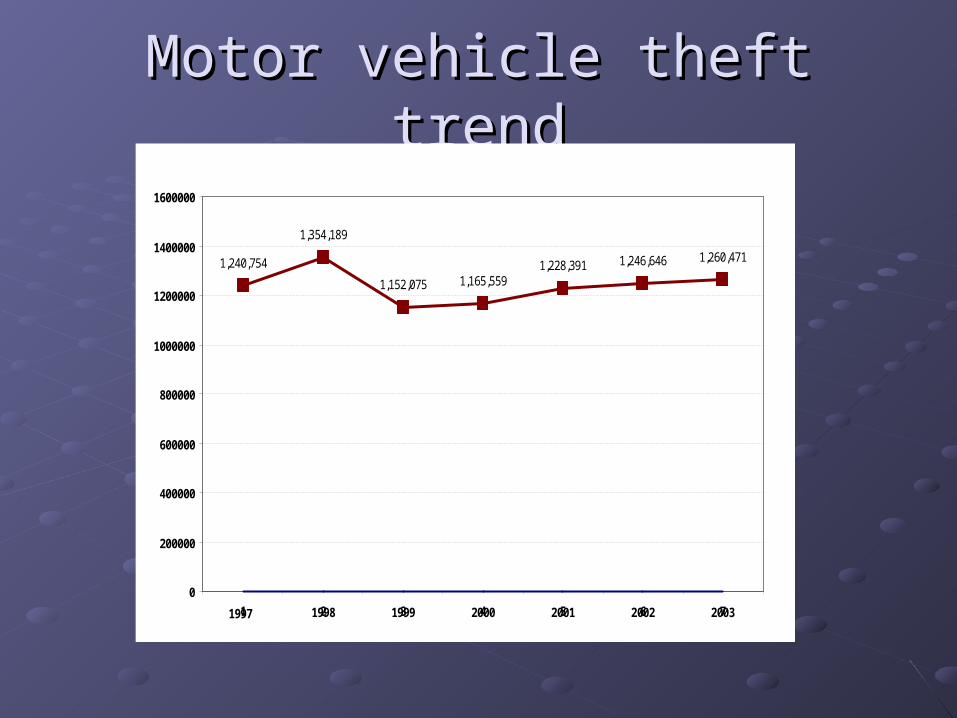
Motor vehicle theft trendMotor vehicle theft trend
1998 2003
1,240,754
1,354,189
1,152,075 1,165,5591,228,391 1,246,646 1,260,471
1997 2000 20011999 2002
0
200000
400000
600000
800000
1000000
1200000
1400000
1600000
1 2 3 4 5 6 7
Source: Federal Bureau of Investigation (www.fbi.gov)
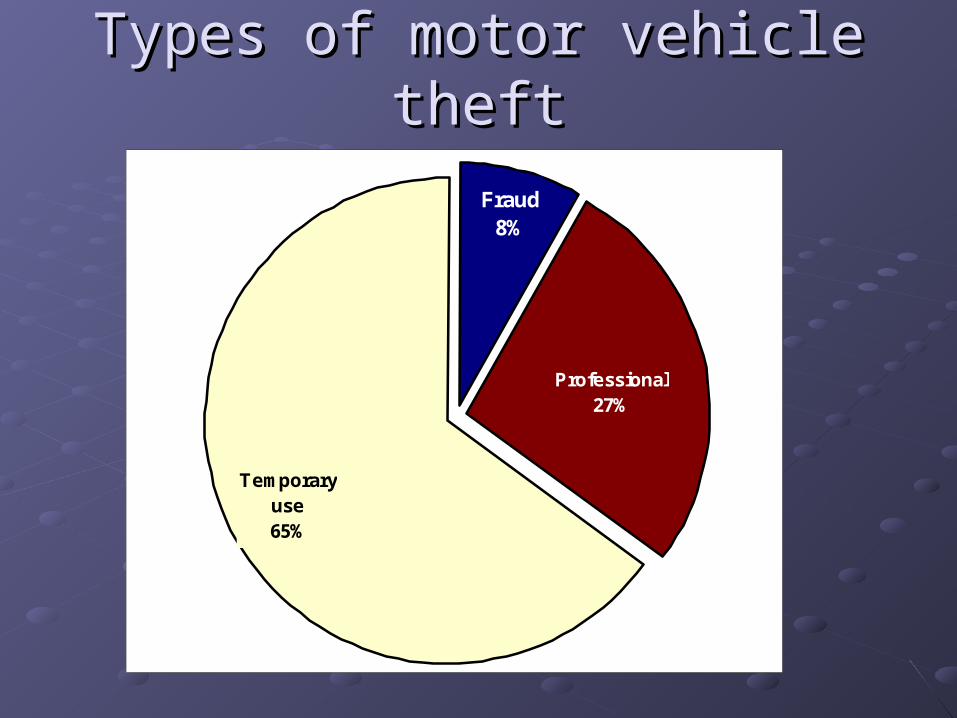
Types of motor vehicle theftTypes of motor vehicle theft
Professional27%
Fraud8%
Temporary use65%
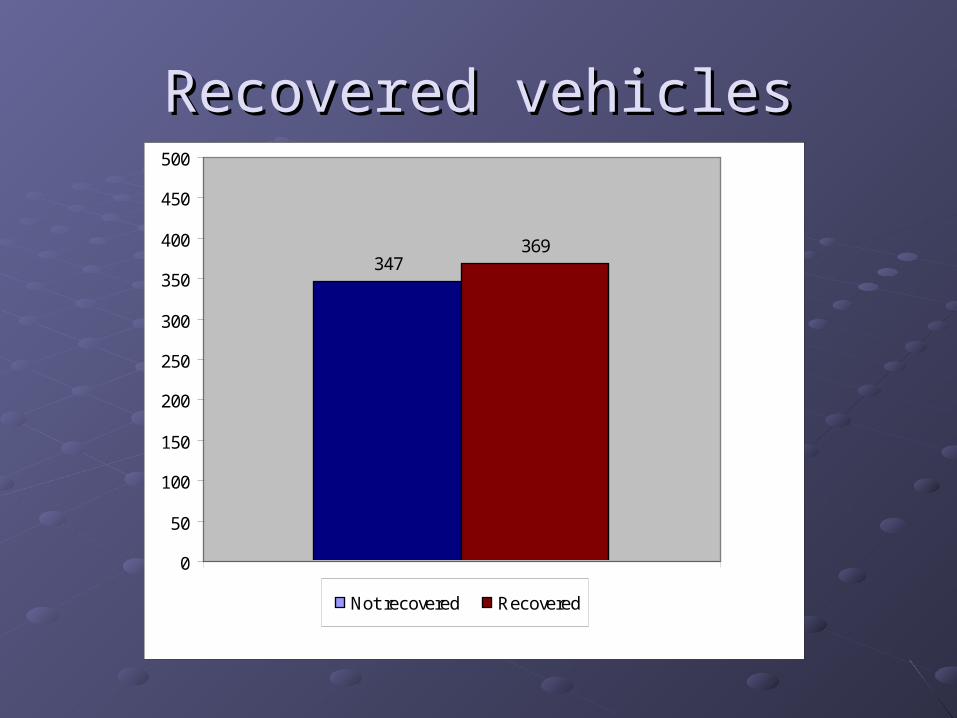
Recovered vehiclesRecovered vehicles
347369
0
50
100
150
200
250
300
350
400
450
500
1Not recovered Recovered
Recovery by vehicle typeRecovery by vehicle type
61
32 27
127
78
2217 11 6
162
78
25
0
20
40
60
80
100
120
140
160
180
Not recovered Recovered
#2 Make better use of #2 Make better use of Calls-for-Service dataCalls-for-Service data
Top 10 Calls for ServiceTop 10 Calls for ServiceChula Vista 2003Chula Vista 2003
1. False Burglary Alarm 8,882 12%2. Disturbance by Person 3,977 5%3. Domestic Violence 3,692 5%4. Traffic Collision 3,680 5%5. Noise Disturbance 2,759 4%6. 911 Hang Up 2,397 3%7. Vehicle Theft 2,327 3%8. Petty Theft 2,091 3%9. Vandalism 1,983 3%10. Suspicious Person 1,806 2% Total 33,594 44%
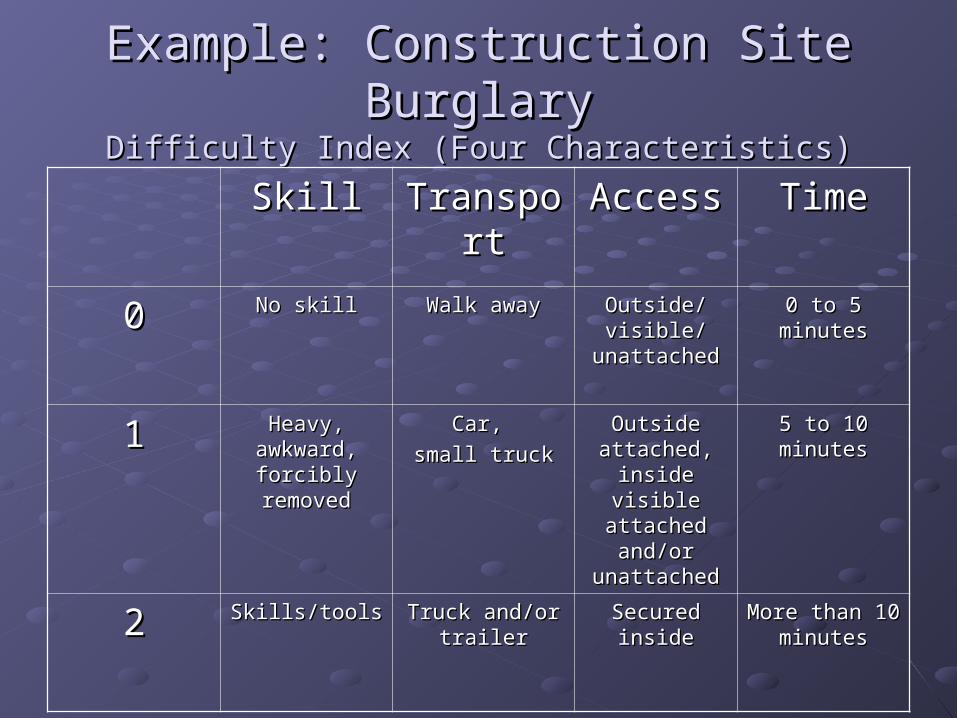
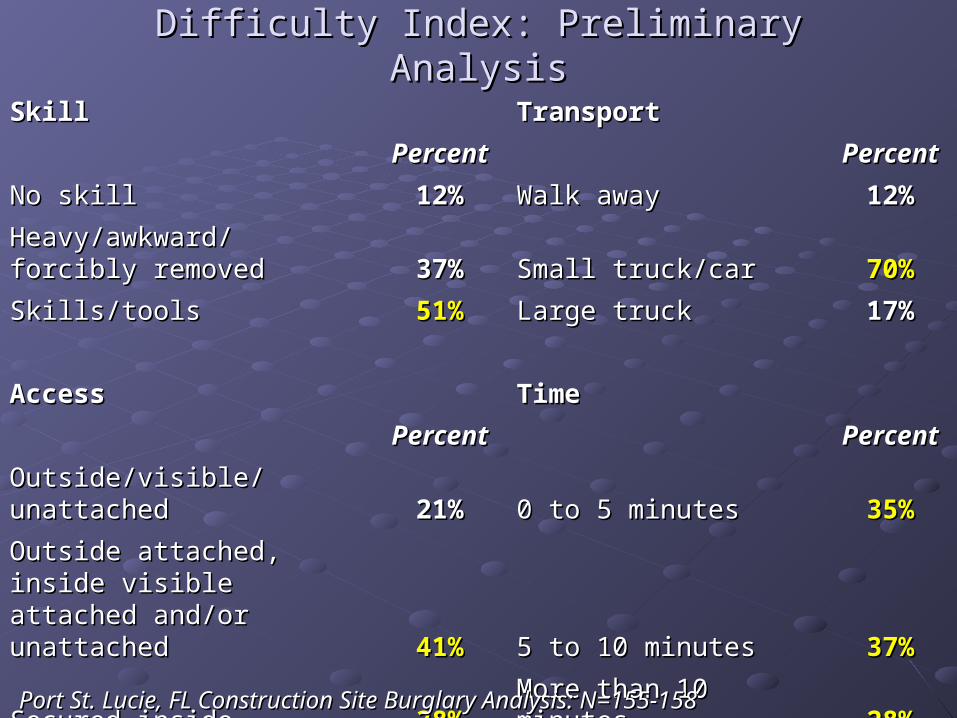
Secured insideSecured inside 38%38% More than 10 minutes More than 10 minutes 28%28%
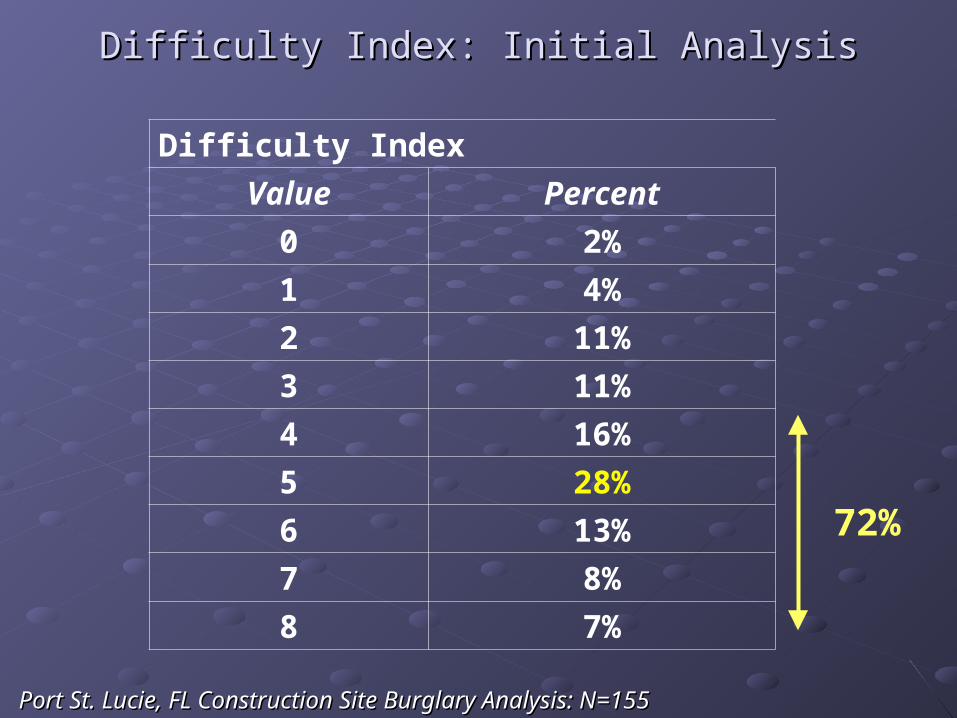
Port St. Lucie, FL Construction Site Burglary Analysis: N=155-158Port St. Lucie, FL Construction Site Burglary Analysis: N=155-158
#6 When In-House Data #6 When In-House Data Isn’t Enough Isn’t Enough
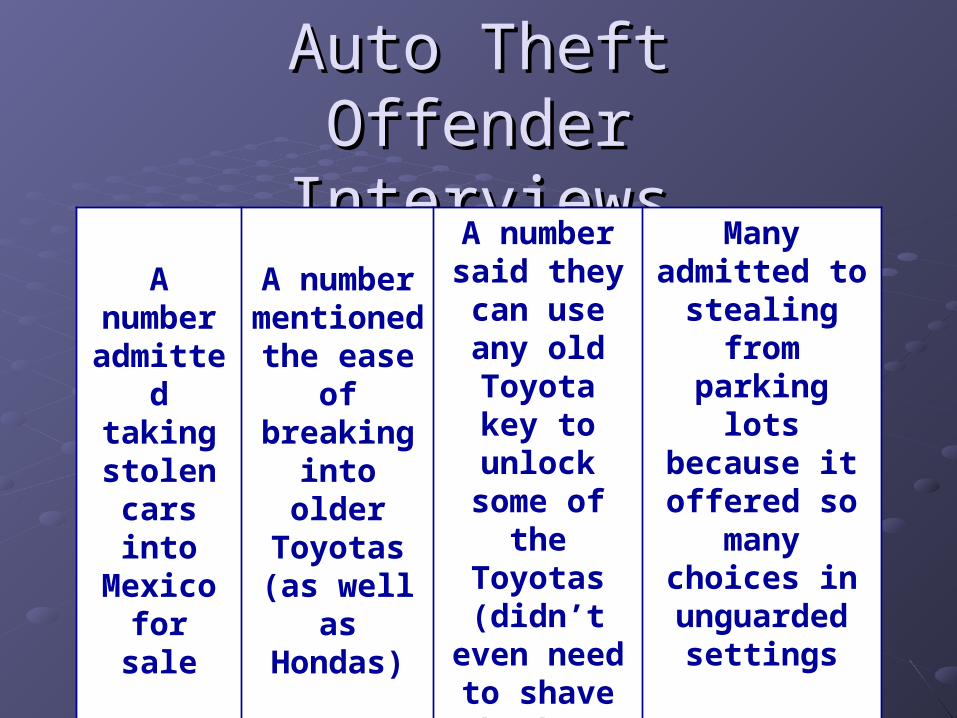
Auto Theft Offender Auto Theft Offender InterviewsInterviews
A number admitted
taking stolen
cars into Mexico for sale
A number mentioned the ease of breaking into older Toyotas
(as well as Hondas)
A number said they
can use any old Toyota
key to unlock
some of the Toyotas
(didn’t even need to
shave the key)
Many admitted to
stealing from parking lots because it offered so
many choices in unguarded
settings
0
20
40
60
80
2002
Chula Vista MallHorton Plaza (electronic arms)Las Americas (electronic arms)
Las Americas Safer than CV Mall in Other Ways:
• -69% burglary
• -60% fights/disturb.
• -38% grand theft
• -84% petty theft
• zero robberies (16 at Chula Vista Mall)
Number of Auto Thefts
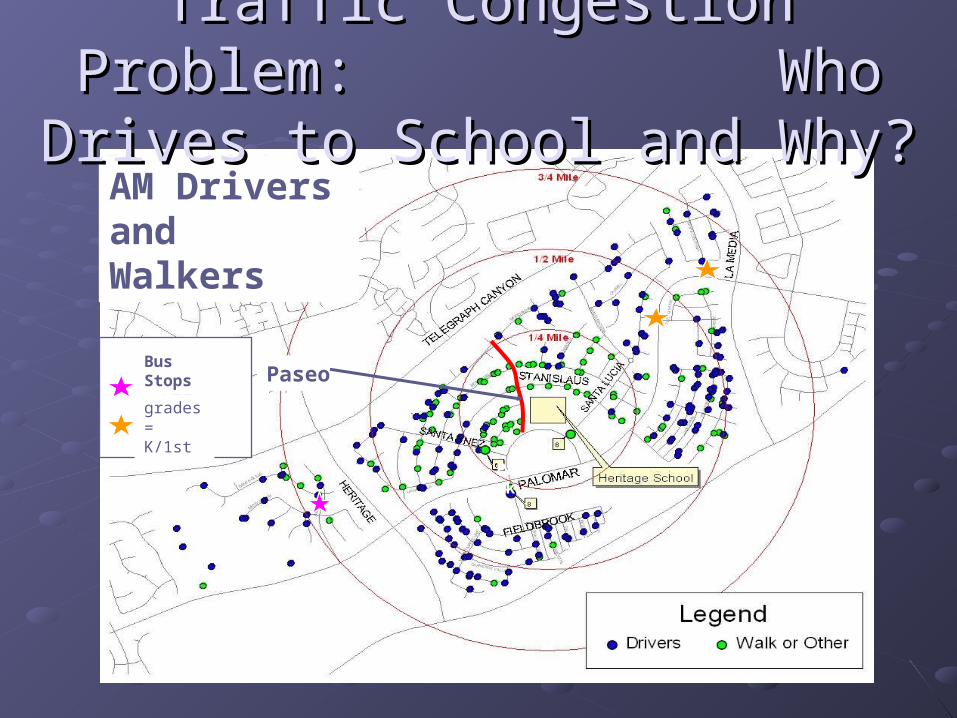
Access Control: A Critical Access Control: A Critical Parking Lot FeatureParking Lot Feature
Paseo
Park
= K/1st
= All grades
Bus Stops
AM Drivers and Walkers
Traffic Congestion Problem: Traffic Congestion Problem: Who Drives to School and Why?Who Drives to School and Why?
Observations of Drop-Off/Pick-up Observations of Drop-Off/Pick-up Times Explain Afternoon CrunchTimes Explain Afternoon Crunch
0%
20%
40%
60%
Before 7:45 7:45-8:00 8:01-8:15 8:16-8:30
0%
20%
40%
Before2:40
2:40-2:50 2:51-3:00 3:01-3:10 3:11-3:20
School start time:
8:30
School end time:
3:00
#7 What Analysis is #7 What Analysis is Most Useful to Police Most Useful to Police
Managers?Managers?
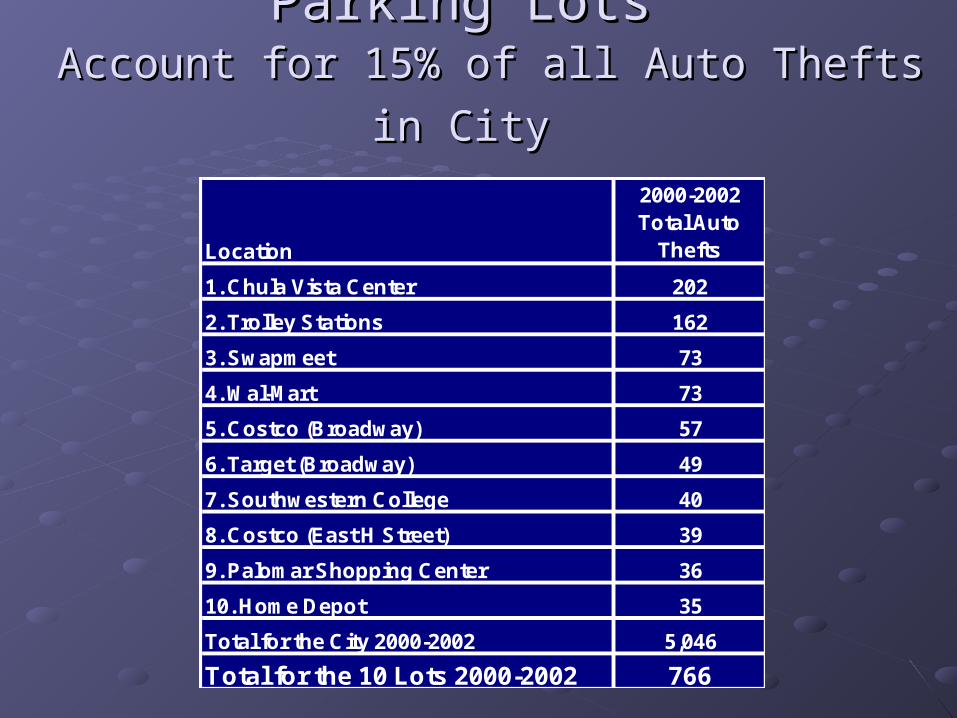
Volume Outliers: 10 Worst Parking Lots Volume Outliers: 10 Worst Parking Lots Account for 15% of all Auto Thefts in CityAccount for 15% of all Auto Thefts in City
Location
2000-2002 Total Auto
Thefts
1. Chula Vista Center 202
2. Trolley Stations 162
3. Swapmeet 73
4. Wal-Mart 73
5. Costco (Broadway) 57
6. Target (Broadway) 49
7. Southwestern College 40
8. Costco (East H Street) 39
9. Palomar Shopping Center 36
10. Home Depot 35
Total for the City 2000-2002 5,046
Total for the 10 Lots 2000-2002 766
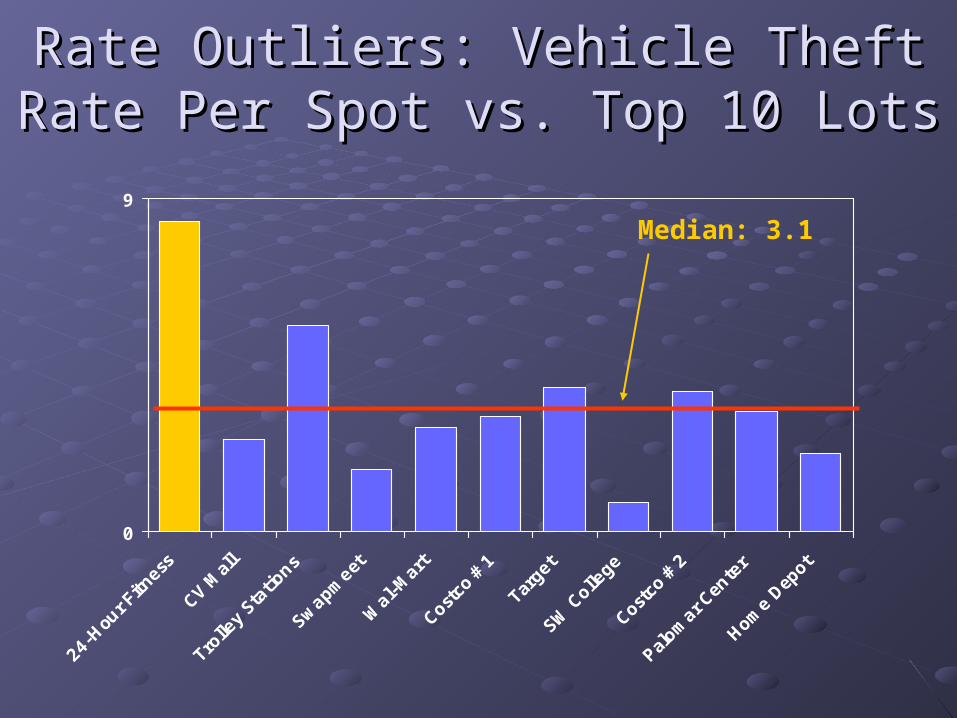
Rate Outliers: Vehicle Theft Rate Per Rate Outliers: Vehicle Theft Rate Per Spot vs. Top 10 LotsSpot vs. Top 10 Lots
0
9
24-H
our F
itnes
s
CV M
all
Trolley St
ations
Swap
mee
t
Wal-M
art
Costco
#1
Targ
et
SW College
Costco
#2
Palomar
Cen
ter
Home Dep
ot
Median: 3.1
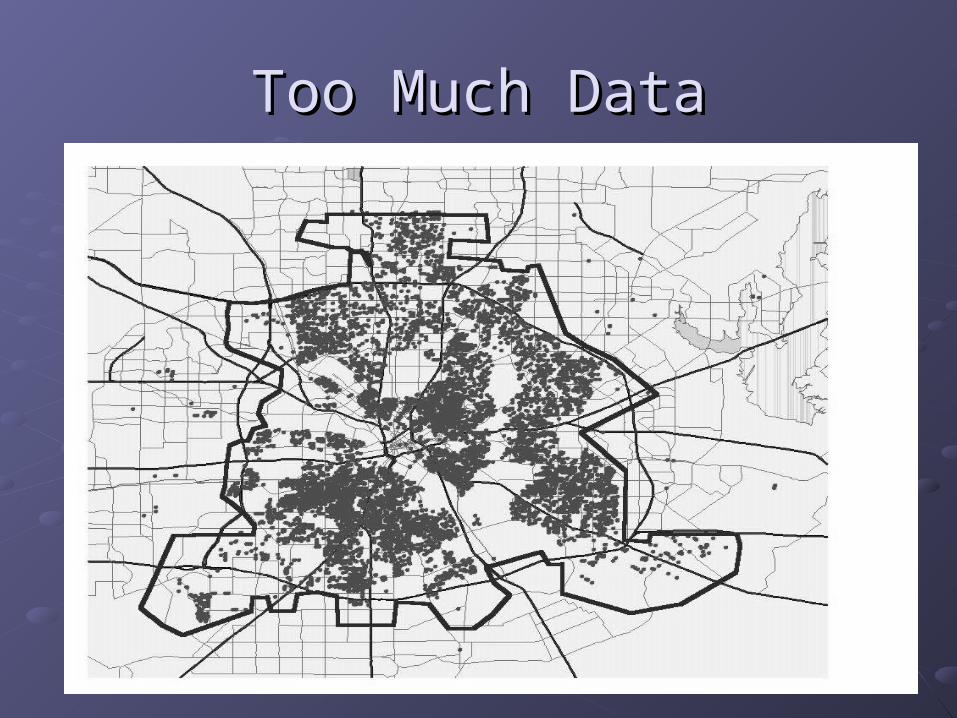
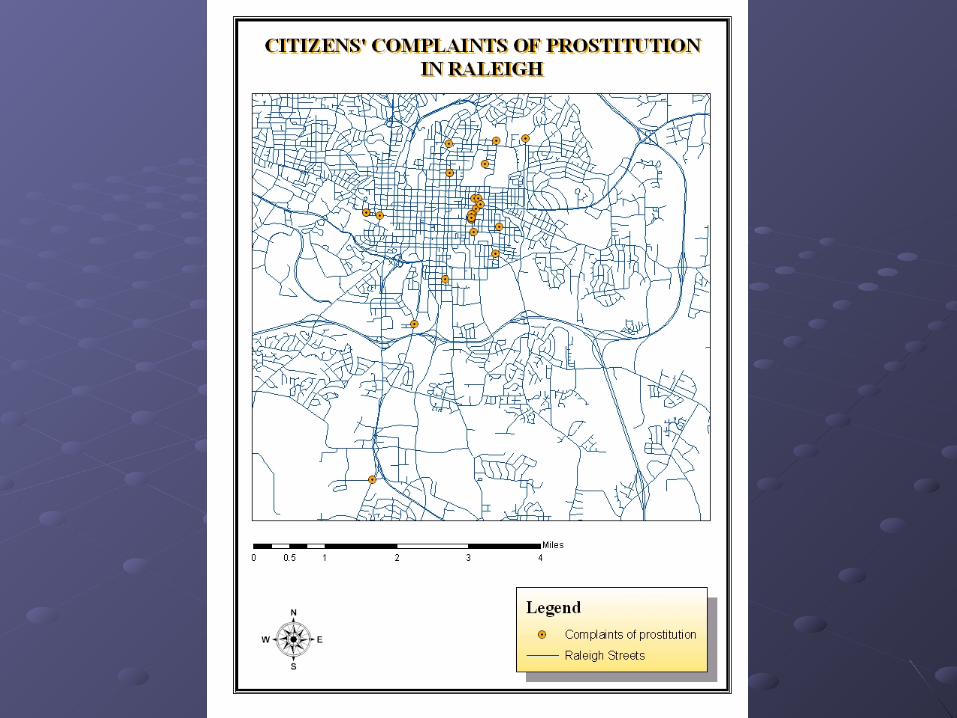
#8 How can I use mapping #8 How can I use mapping to understand a problem?to understand a problem?
MappingMapping
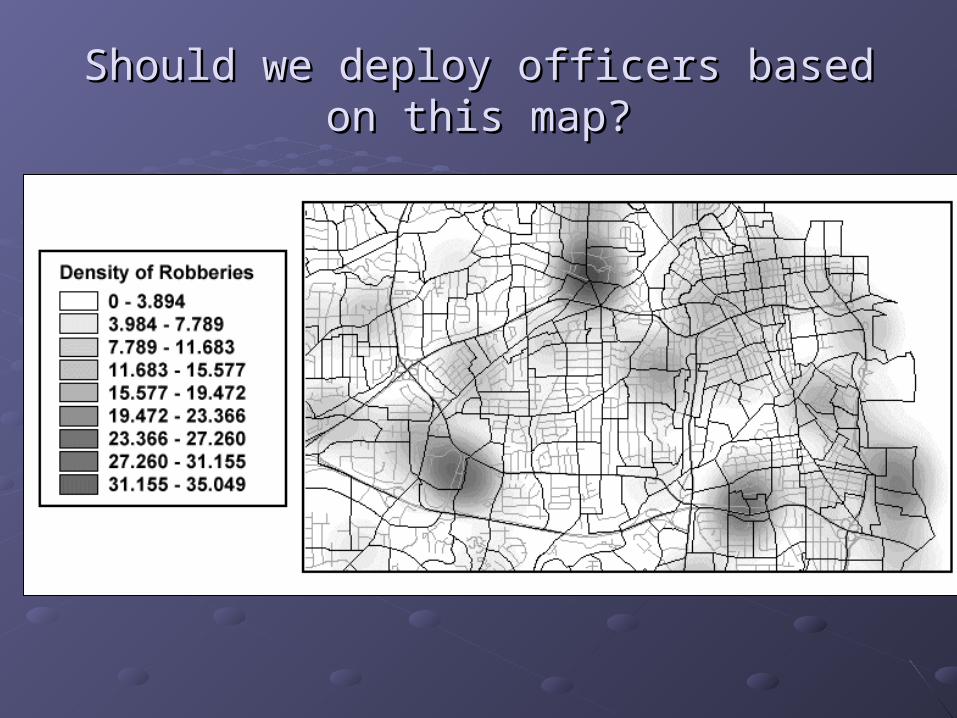
Use mapping sparinglyUse mapping sparingly
Should not be the central method used to Should not be the central method used to direct police effortsdirect police efforts
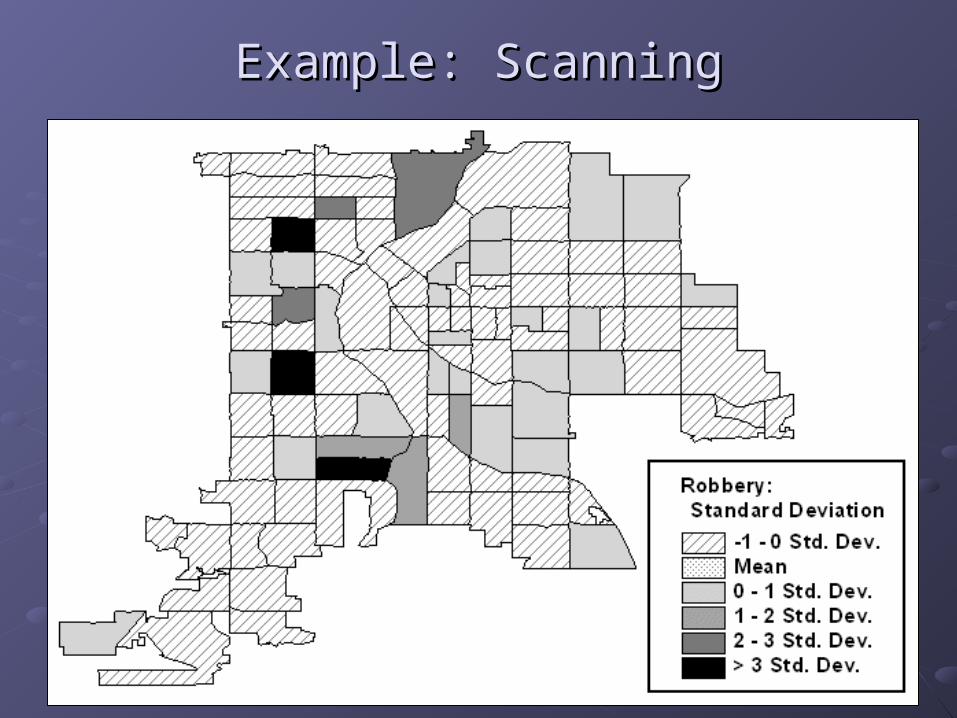
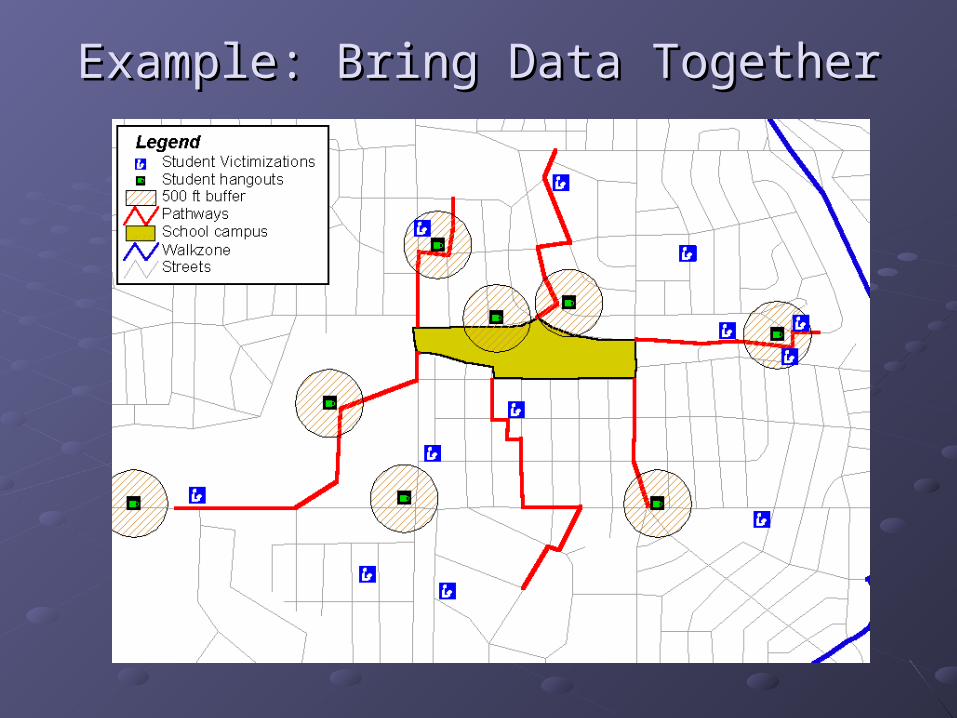
Mapping most useful for bringing data Mapping most useful for bringing data together, scanning, and presenting together, scanning, and presenting analysis results. analysis results.
Should we deploy officers based on this Should we deploy officers based on this map?map?
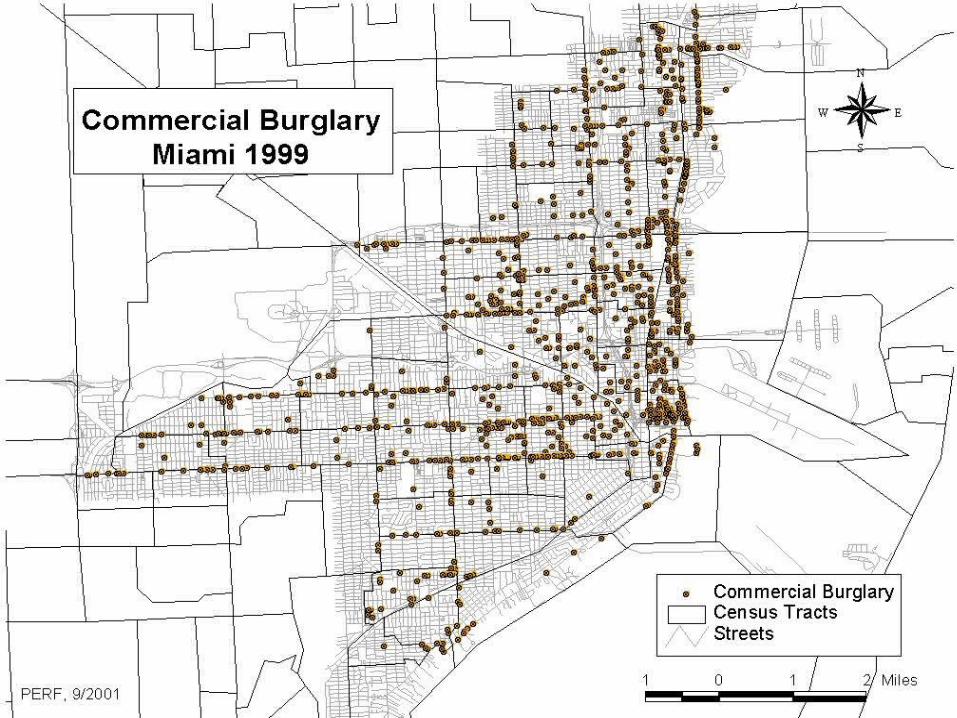
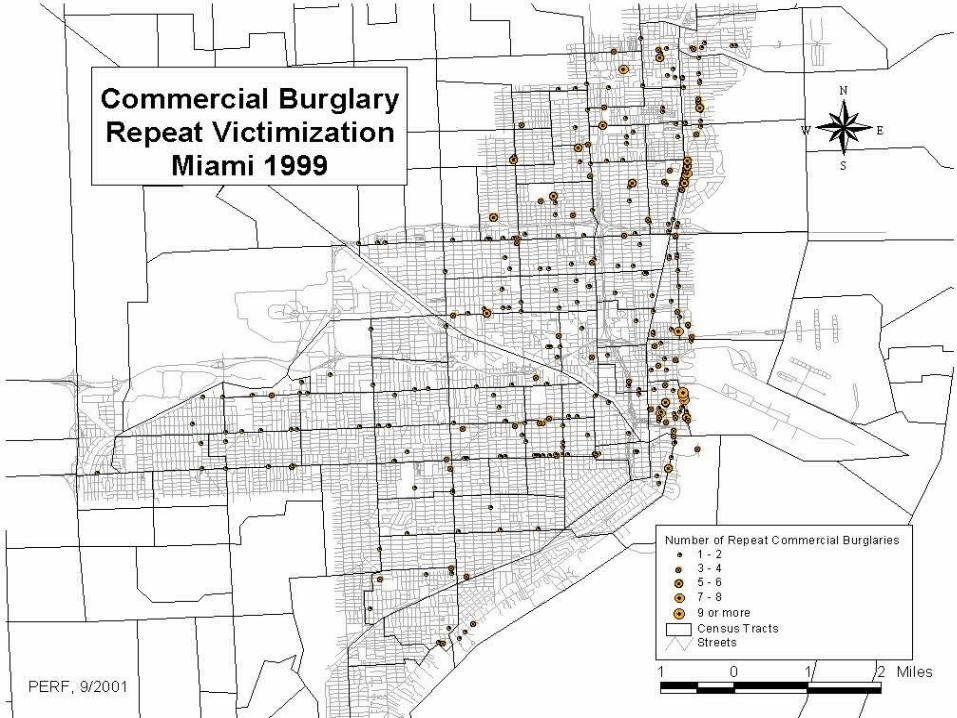
Example: ScanningExample: Scanning
Example: Bring Data TogetherExample: Bring Data Together
Example: Presentation of ResultsExample: Presentation of ResultsSan Diego County Recovery RatesSan Diego County Recovery Rates
MOVED BUS MOVED BUS STANDSTAND
CAB STANDCAB STAND
PP
PP
PP
PP
P=parking lotP=parking lot
=no admission=no admission
PP
HIGHWAYHIGHWAY
closed sectionclosed section
TTØNSBERG ØNSBERG BRIDGEBRIDGE
P
NEW CAB NEW CAB STANDSTAND
Moved Moved barristersbarristers
Example: Example: Presentation of Presentation of
ResultsResults
Tønsberg Tønsberg downtowdowntown arean area
From: Gypsy Cabs in Tønsberg – a Case for From: Gypsy Cabs in Tønsberg – a Case for Problem-Oriented PolicingProblem-Oriented PolicingJohannes Knutsson, National Police Academy and Johannes Knutsson, National Police Academy and Knut-Erik Søvik, Vestfold Police DistrictKnut-Erik Søvik, Vestfold Police District
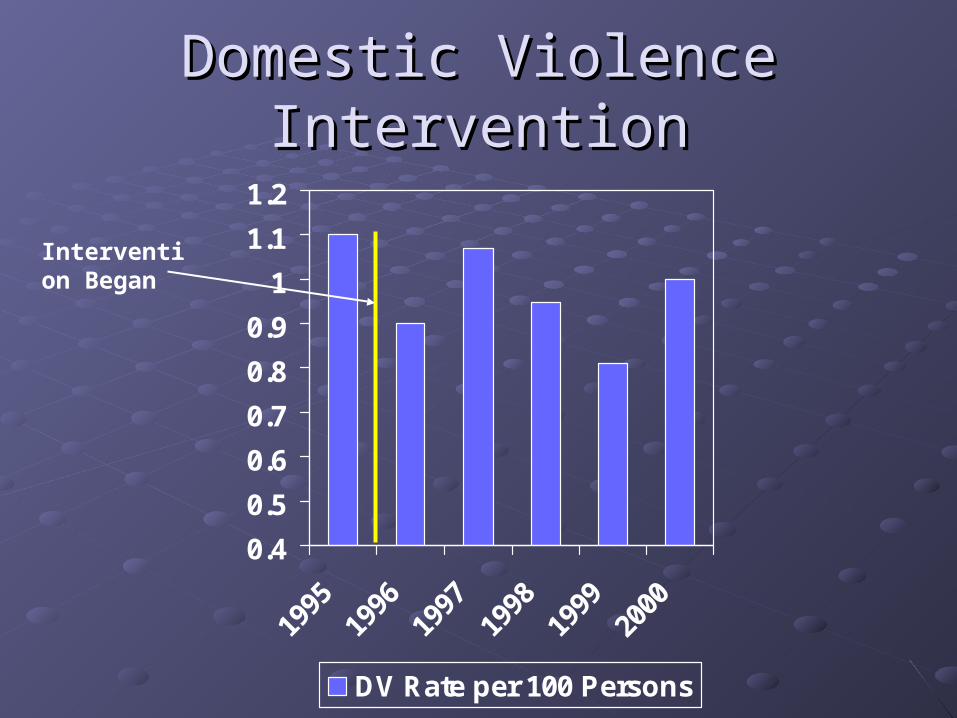
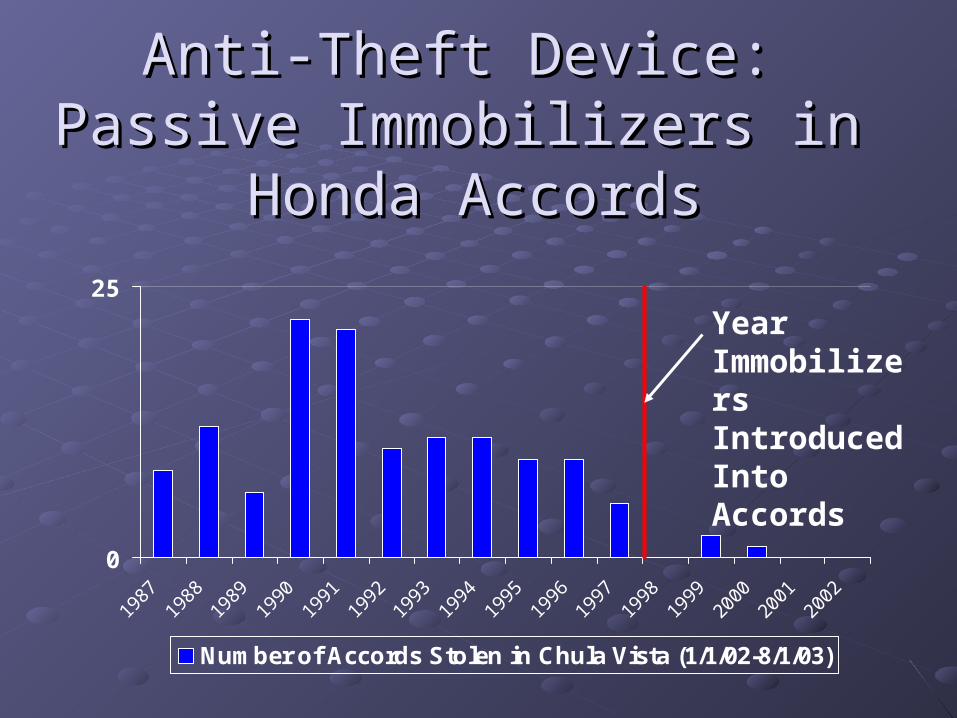
#9 How do I know #9 How do I know there’s a difference?there’s a difference?
Test RelationshipsTest Relationships
Ad hoc reasoningAd hoc reasoning
Use of statisticsUse of statistics
Statistical vs. practical significanceStatistical vs. practical significance
Date Span in Days: CSBT
0
50
100
150
0 1 2 3 4 5 6 7 10 11 12 13 15 18 25 30
Time span in days
Nu
mb
er o
f ca
ses
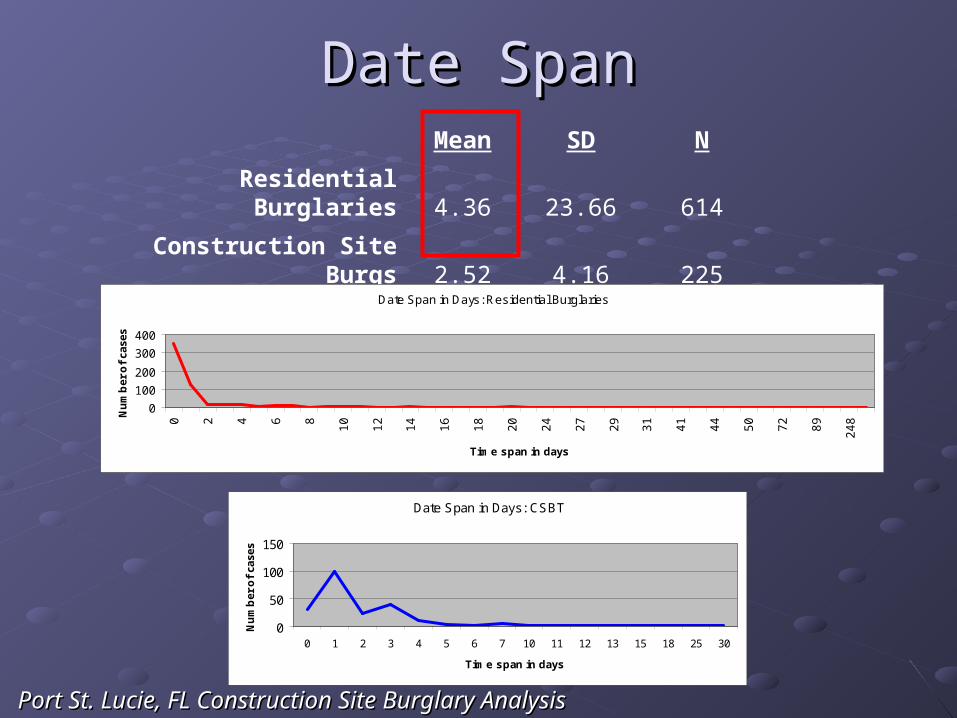
Mean SD N
Residential Burglaries 4.36 23.66 614
Construction Site Burgs 2.52 4.16 225
Date SpanDate Span
Date Span in Days: Residential Burglaries
0
100
200
300
400
0 2 4 6 8
10
12
14
16
18
20
24
27
29
31
41
44
50
72
89
24
8
Time span in days
Nu
mb
er o
f ca
ses
Port St. Lucie, FL Construction Site Burglary AnalysisPort St. Lucie, FL Construction Site Burglary Analysis
*Statistically significant at the .01 level **58% of the CSBTs has a date span of 0 or 1*Statistically significant at the .01 level **58% of the CSBTs has a date span of 0 or 1
Time Span in Hours: Residential Burglaries
0
50
100
150
0 2 4 6 8 10 12 14 16 18 20 22 24 27 29 34
Time span in hours
Nu
mb
er o
f ca
ses
Port St. Lucie, FL Construction Site Burglary Analysis: N=155-158Port St. Lucie, FL Construction Site Burglary Analysis: N=155-158
#10 Did it work?#10 Did it work?
Effort to Reduce Traffic Collisions Effort to Reduce Traffic Collisions Through CitationsThrough Citations
0
200
400
600
800
1000
1200
Q1 19
98
Q3 19
98
Q1 19
99
Q3 19
99
Q1 20
00
Q3 20
00
Q1 20
01
Q3 20
01
Q1 20
02
Q3 20
02
Q1 20
03
Q3 20
03
Cites per 1 million DVMT
Collisions per 1 millionDVMT
Results:
-Very weak correlation between cites and collisions


![2013 Problem Solvers Catalog[1]](https://static.documents.pub/doc/80x56/577cc2ce1a28aba711948755/2013-problem-solvers-catalog1.jpg)


