34
Local Crime Areas, Queensland 2002-03 Crime and Social Profiles Office of Economic and Statistical Research
Local Crime Areas, Queensland
2002-03
Crime and Social Profiles
Office of Economic and Statistical Research

i
1 Introduction........................................................................................................... 1 2 Crime Statistics..................................................................................................... 2 2.1 Overview .................................................................................................................................................... 2 2.2 Demographic Breakdowns........................................................................................................................ 3
2.2.1 Median age ............................................................................................................................................ 3 2.2.2 Index of Relative Socio-economic Disadvantage (IRSED)................................................................... 5 2.2.3 Accessibility/Remoteness Index of Australia (ARIA)........................................................................... 7 2.2.4 Proportion Indigenous ......................................................................................................................... 10
2.3 Statistical Division ................................................................................................................................... 13
2.3.1 Offences against the person................................................................................................................. 13 2.3.2 Offences against property.................................................................................................................... 15 2.3.3 Other offences ..................................................................................................................................... 17
2.4 Small Crime Area.................................................................................................................................... 19
2.4.1 Offences against the person................................................................................................................. 19 2.4.2 Offences against property.................................................................................................................... 20 2.4.3 Other offences ..................................................................................................................................... 21
APPENDIX A Methodology....................................................................................... 22 A.1 Offence Categories .................................................................................................................................... 22 A.2 Converting Police Division Data to LGA Data ......................................................................................... 22 A.3 Aggregation of LGAs................................................................................................................................ 23 A.4 Populations ................................................................................................................................................ 23 A.5 Rates .......................................................................................................................................................... 23 A.6 Median Age ............................................................................................................................................... 23 A.7 Male to Female Ratio ................................................................................................................................ 23 APPENDIX B Small Crime Area Summary Table.................................................... 24 APPENDIX C LGA and Small Crime Area Pairs...................................................... 26 APPENDIX D Maps of Queensland Local Government Areas............................... 30 APPENDIX E Map of Statistical Divisions of Queensland ..................................... 32

1
1 Introduction This report has been prepared to provide an easy to use reference for relative crime rates at small geographical levels. It is an update of the Crime and Social Profiles Local Crime Areas, Queensland 2001-02 report that was prepared in 2003 and is available on the Office of Economic and Statistical Research’s website (www.oesr.qld.gov.au). This report contains analysis of adult and juvenile offence statistics for the period 1 July 2000 to 30 June 2003 at a regional level based on Local Government Areas (LGAs). The regions used in this report are referred to as ‘Local Crime Areas’ and are either Local Government Areas or, where populations are small, aggregations of neighbouring Local Government Areas (see Appendices A and C for further details).
2
2 Crime Statistics
2.1 Overview
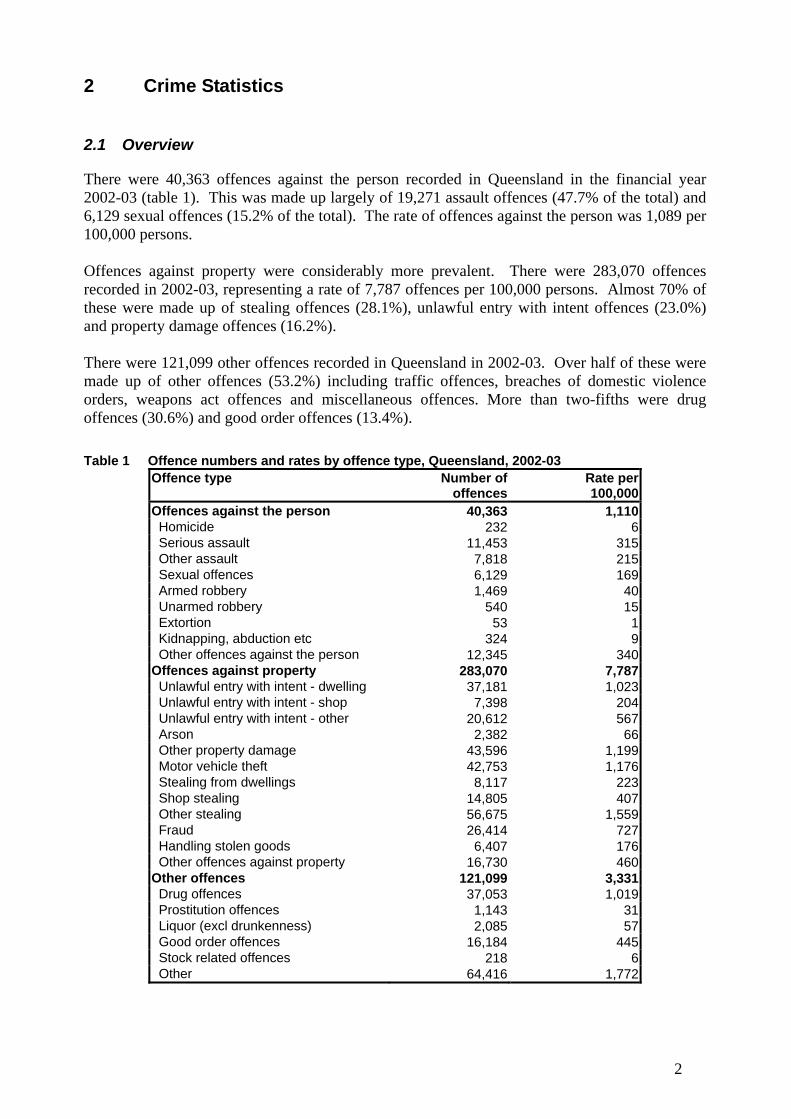
There were 40,363 offences against the person recorded in Queensland in the financial year 2002-03 (table 1). This was made up largely of 19,271 assault offences (47.7% of the total) and 6,129 sexual offences (15.2% of the total). The rate of offences against the person was 1,089 per 100,000 persons. Offences against property were considerably more prevalent. There were 283,070 offences recorded in 2002-03, representing a rate of 7,787 offences per 100,000 persons. Almost 70% of these were made up of stealing offences (28.1%), unlawful entry with intent offences (23.0%) and property damage offences (16.2%). There were 121,099 other offences recorded in Queensland in 2002-03. Over half of these were made up of other offences (53.2%) including traffic offences, breaches of domestic violence orders, weapons act offences and miscellaneous offences. More than two-fifths were drug offences (30.6%) and good order offences (13.4%). Table 1 Offence numbers and rates by offence type, Queensland, 2002-03
Offence type Number of offences
Rate per 100,000
Offences against the person 40,363 1,110 Homicide 232 6 Serious assault 11,453 315 Other assault 7,818 215 Sexual offences 6,129 169 Armed robbery 1,469 40 Unarmed robbery 540 15 Extortion 53 1 Kidnapping, abduction etc 324 9 Other offences against the person 12,345 340 Offences against property 283,070 7,787 Unlawful entry with intent - dwelling 37,181 1,023 Unlawful entry with intent - shop 7,398 204 Unlawful entry with intent - other 20,612 567 Arson 2,382 66 Other property damage 43,596 1,199 Motor vehicle theft 42,753 1,176 Stealing from dwellings 8,117 223 Shop stealing 14,805 407 Other stealing 56,675 1,559 Fraud 26,414 727 Handling stolen goods 6,407 176 Other offences against property 16,730 460 Other offences 121,099 3,331 Drug offences 37,053 1,019 Prostitution offences 1,143 31 Liquor (excl drunkenness) 2,085 57 Good order offences 16,184 445 Stock related offences 218 6 Other 64,416 1,772
3
2.2 Demographic Breakdowns
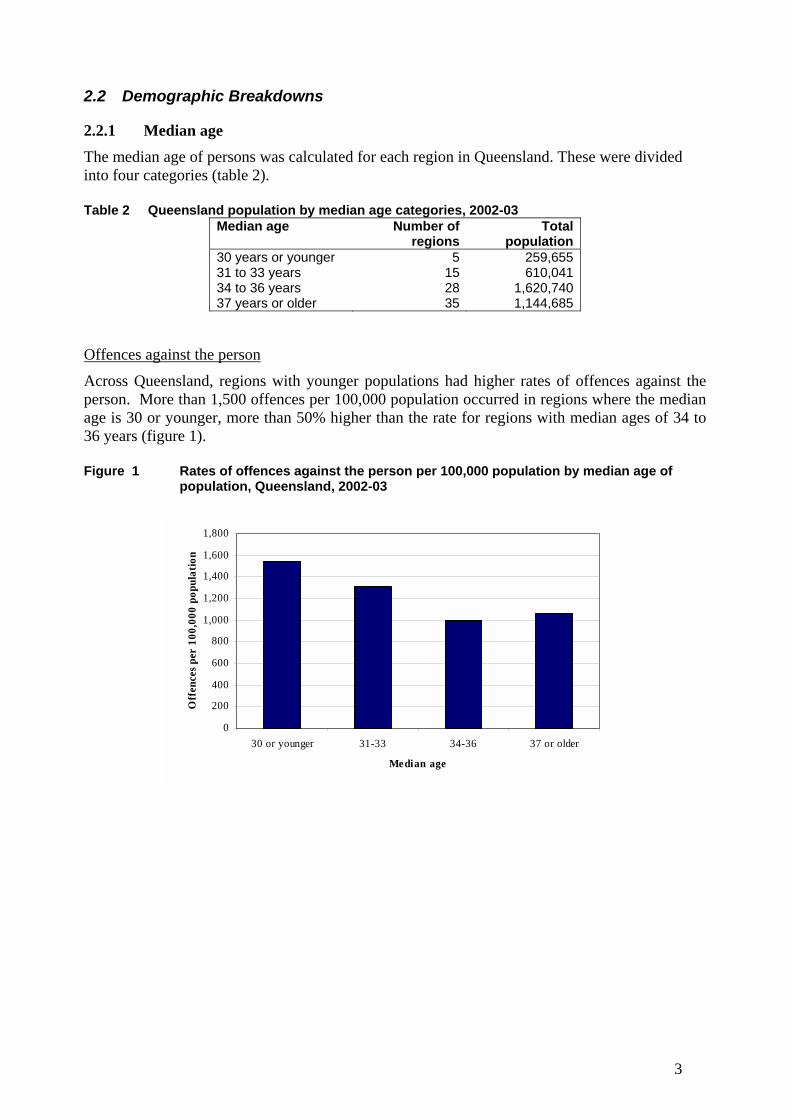
2.2.1 Median age The median age of persons was calculated for each region in Queensland. These were divided into four categories (table 2). Table 2 Queensland population by median age categories, 2002-03
Median age Number of regions
Total population
30 years or younger 5 259,655 31 to 33 years 15 610,041 34 to 36 years 28 1,620,740 37 years or older 35 1,144,685
Offences against the person
Across Queensland, regions with younger populations had higher rates of offences against the person. More than 1,500 offences per 100,000 population occurred in regions where the median age is 30 or younger, more than 50% higher than the rate for regions with median ages of 34 to 36 years (figure 1). Figure 1 Rates of offences against the person per 100,000 population by median age of
population, Queensland, 2002-03
0
200
400
600
800
1,000
1,200
1,400
1,600
1,800
30 or younger 31-33 34-36 37 or older
Median age
Off
ence
s per
100
,000
pop
ulat
ion

4
Offences against property
For offences against property, there was little difference between the four median age groups and the relative rates as was evident for offences against the person. However, the regions with the lowest median age had a higher rate (figure 2). Figure 2 Rates of offences against property per 100,000 population by median age of
population, Queensland, 2002-03
0
2,000
4,000
6,000
8,000
10,000
12,000
30 or younger 31-33 34-36 37 or older
Median age
Off
ence
s per
100
,000
pop
ulat
ion
Other offences
Rates for other offences were relatively low compared with property offences for all regions, and there was little difference between the rates for each median age group. The 34 to 36 median age group had slightly lower rates (figure 3). Figure 3 Rates of other offences per 100,000 population by median age of population,
Queensland, 2002-03
0
500
1,000
1,500
2,000
2,500
3,000
3,500
4,000
30 or younger 31-33 34-36 37 or older
Median age
Off
ence
s per
100
,000
pop
ulat
ion

5
2.2.2 Index of Relative Socio-Economic Disadvantage (IRSED) The IRSED was created by the Australian Bureau of Statistics using data sourced from the 2001 Census of Population and Housing as part of its Socio-Economic Indexes for Areas (SEIFA). It provides a composite index of the relative socio-economic disadvantage of areas based on variables relating to employment status, income, educational qualifications, housing tenure, Indigenous population and various other related variables. Values for these variables from the 2001 census have been combined to produce an index that allocates a score indicating the relative level of socio-economic disadvantage in an LGA. Included in this report are graphs of the population distribution in each region with respect to IRSED quintiles. These quintiles represent a division of scores such that one-fifth of Queensland’s population falls into each category. Thus, an average region would have one-fifth of its population in each quintile. The base IRSED score is 1,000. That is, the average Australian area will have a score of 1,000, with more disadvantaged areas scoring lower and less disadvantaged areas higher. The average IRSED score for Queensland is 989. For further information regarding SEIFA indexes including a detailed discussion of the methodology used to create them, see Australian Bureau of Statistics, Information Paper: 1996 Census of Population and Housing – Socio-Economic Indexes for Areas, Cat. No. 2039.0. Regions were divided into four categories of IRSED score: less than 900 (31,536 people), 900 to less than 950 (452,246 people), 950 to less than 1,000 (1,870,865 people) and 1,000 or higher (1,280,474 people). Offences against the person
Regions with IRSED scores in the lowest category (i.e. greater disadvantage) had rates of offences against the person around five times higher than regions in all other categories. There was less difference between categories once the IRSED score was over 900 (figure 4). Figure 4 Rates of offences against the person per 100,000 population by SEIFA IRSED
score, Queensland, 2002-03
0
1,000
2,000
3,000
4,000
5,000
6,000
<900 900-<950 950-<1,000 1,000+
SEIFA IRSD score
Off
ence
s per
100
,000
pop
ulat
ion

6
Offences against property
Regions with IRSED scores in the lowest category had rates of offences against property lower than the other categories, which all had similar rates (figure 5). Figure 5 Rates of offences against property per 100,000 population by SEIFA IRSED score,
Queensland, 2002-03
0
1,000
2,000
3,000
4,000
5,000
6,000
7,000
8,000
9,000
<900 900-<950 950-<1,000 1,000+
SEIFA IRSD score
Off
ence
s per
100
,000
pop
ulat
ion
Other offences
Rates for other offences showed a similar pattern to those for offences against the person. Regions with IRSED scores in the lowest category (i.e. greater disadvantage) had rates of other offences around 3-4 times higher than all other categories. There was little difference between the two middle categories, while the highest category had the lowest rate (figure 6). Figure 6 Rates of other offences per 100,000 population by SEIFA IRSED Score,
Queensland, 2002-03
0
2,000
4,000
6,000
8,000
10,000
12,000
<900 900-<950 950-<1,000 1,000+
SEIFA IRSD score
Off
ence
s per
100
,000
pop
ulat
ion

7
2.2.3 Accessibility/Remoteness Index of Australia (ARIA) The ARIA is an index developed by the Commonwealth Department of Health and Aged Care to measure accessibility to services and the relative remoteness of places in Australia. The level of remoteness of a location is calculated in terms of road travel times to population centres of various sizes, known as service centres. The travel time from the centre of each LGA to the nearest service centre of four sizes: more than 250,000 people, 48,000 to 249,999 people, 18,000 to 47,999 people and 5,000 to 17,999 people, was used to derive an overall accessibility score. Further information is available in the Commonwealth ARIA paper: Accessibility/Remoteness Index of Australia (ARIA), Department of Health and Aged Care, Canberra, 1999 (Occasional Papers Series No. 14). This paper is available online at: http://www.health.gov.au/pubs/hfsocc/ocpanew14a.htm Regions were broken into six ARIA categories: highly accessible (1) (2,463,580 people), highly accessible (2) (157,674 people), accessible (507,027 people), moderately accessible (354,856 people), remote (95,262 people) and very remote (56,722 people) (figure 7).

8
Figure 7 LGA by ARIA classification, Queensland
ARIA Classification
Highly Accessible (1) Highly Accessible (2) AccessibleModerately Accessible RemoteVery R4mote

9
Offences against the person
Regions that were more remote had generally higher rates of offences against the person. In particular, regions that were classified as very remote in the ARIA classification had rates around 2-4 times higher than other categories. This seems to relate to the proportion of Indigenous people in a region, as Aboriginal communities are often located in regions classified as very remote (figure 8). Figure 8 Rates of offences against the person per 100,000 population by ARIA
classification, Queensland, 2002-03
0
500
1,000
1,500
2,000
2,500
3,000
3,500
4,000
Highlyaccessible (1)
Highlyaccessible (2)
Accessible Moderatelyaccessible
Remote Very remote
ARIA classification
Off
ence
s per
100
,000
pop
ulat
ion
Offences against property
Property offence rates showed a different pattern to offences against the person, with the highest rate occurring in the most accessible regions. This may be related to the availability of opportunities for crimes against property in larger population centres. This also may be related to the proportion of juveniles in a region (figure 9). Figure 9 Rates of offences against property per 100,000 population by ARIA classification,
Queensland, 2002-03
0
1,000
2,000
3,000
4,000
5,000
6,000
7,000
8,000
9,000
Highlyaccessible (1)
Highlyaccessible (2)
Accessible Moderatelyaccessible
Remote Very remote
ARIA classification
Off
ence
s per
100
,000
pop
ulat
ion

10
Other offences
Regions that were more remote had higher rates of other offences. The rate of other offences in very remote regions was nearly three times higher than that for highly accessible (1) regions. Again, this is possibly related to the proportion of Indigenous people in a region (figure 10). Figure 10 Rates of other offences per 100,000 population by ARIA classification, Queensland,
2002-03
0
1,000
2,000
3,000
4,000
5,000
6,000
7,000
8,000
9,000
Highlyaccessible (1)
Highlyaccessible (2)
Accessible Moderatelyaccessible
Remote Very remote
ARIA classification
Off
ence
s per
100
,000
pop
ulat
ion
2.2.4 Proportion Indigenous The proportion of each region’s population that was Indigenous was taken from the place of usual residence data from the 2001 Census of Population and Housing. Indigenous includes both Aboriginal and Torres Strait Islander people. Regions were split into four groups based on the proportion of the population that was Indigenous: less than 5% (3,164,596 people), 5% to less than 10% (340,958 people), 10% to less than 20% (103,357 people) and 20% or more (26,210 people).

11
Offences against the person
The rate of offences against the person shows a clear pattern, rising as the proportion of Indigenous people in the population rises. Regions that had a population that was at least 20% Indigenous had a rate of offences against the person more than six times higher than that for regions with populations which were less than 5% Indigenous (figure 11). Figure 11 Rates of offences against the person per 100,000 population by proportion of
population that was Indigenous, Queensland, 2002-03
0
1,000
2,000
3,000
4,000
5,000
6,000
7,000
<5% 5 - <10% 10 - <20% 20+%
% Indigenous
Off
ence
s per
100
,000
pop
ulat
ion
Offences against property
The highest rate for offences against property occurred in regions with a low proportion of Indigenous population. Regions where the indigenous population was 10% or greater, had similar rates of offences against property (figure 12). Figure 12 Rates of offences against property per 100,000 population by proportion of
population that was Indigenous, Queensland, 2002-03
0
1,000
2,000
3,000
4,000
5,000
6,000
7,000
8,000
9,000
<5% 5 - <10% 10 - <20% 20+%
% Indigenous
Off
ence
s per
100
,000
pop
ulat
ion

12
Other offences
Other offences followed a similar pattern to offences against the person, with high rates in regions with populations with a higher proportion of Indigenous population. Regions with 20% or more had a significantly higher rate and regions with less than 5% had a far lower rate (figure 13). Figure 13 Rates of other offences per 100,000 population by proportion of population that
was Indigenous, Queensland, 2002-03
0
2,000
4,000
6,000
8,000
10,000
12,000
<5% 5 - <10% 10 - <20% 20+%
% Indigenous
Off
ence
s per
100
,000
pop
ulat
ion
13
2.3 Statistical Division
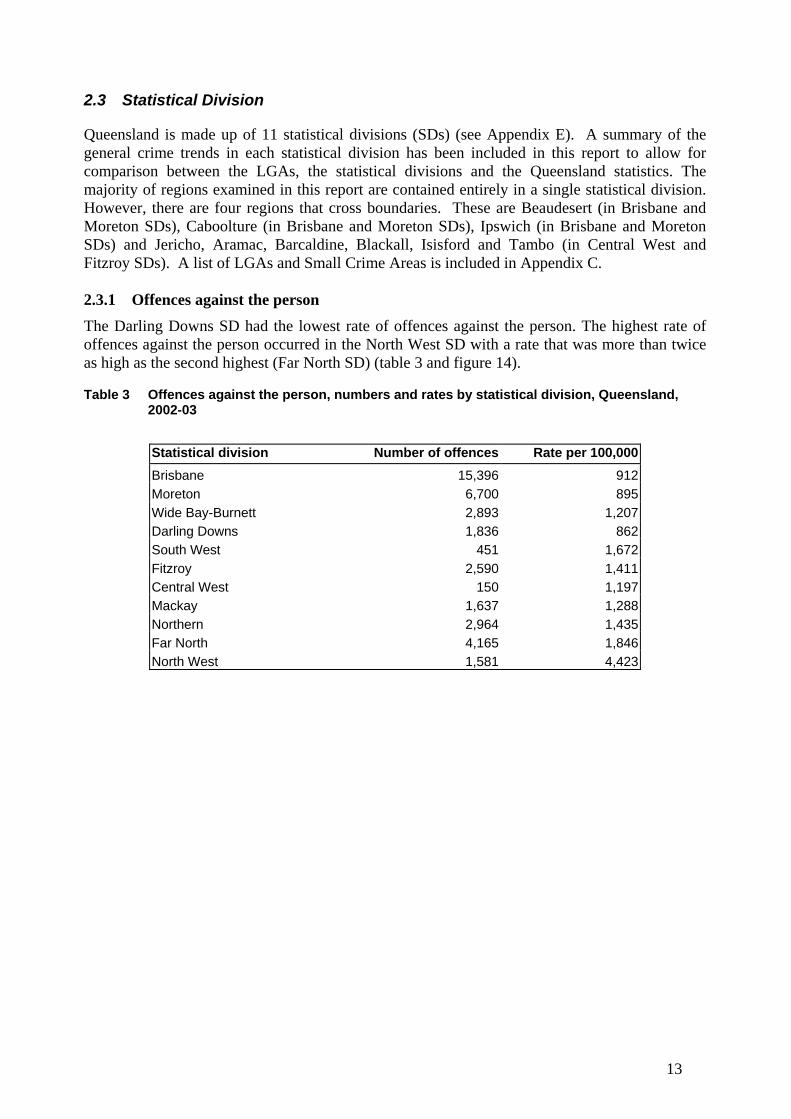
Queensland is made up of 11 statistical divisions (SDs) (see Appendix E). A summary of the general crime trends in each statistical division has been included in this report to allow for comparison between the LGAs, the statistical divisions and the Queensland statistics. The majority of regions examined in this report are contained entirely in a single statistical division. However, there are four regions that cross boundaries. These are Beaudesert (in Brisbane and Moreton SDs), Caboolture (in Brisbane and Moreton SDs), Ipswich (in Brisbane and Moreton SDs) and Jericho, Aramac, Barcaldine, Blackall, Isisford and Tambo (in Central West and Fitzroy SDs). A list of LGAs and Small Crime Areas is included in Appendix C. 2.3.1 Offences against the person The Darling Downs SD had the lowest rate of offences against the person. The highest rate of offences against the person occurred in the North West SD with a rate that was more than twice as high as the second highest (Far North SD) (table 3 and figure 14). Table 3 Offences against the person, numbers and rates by statistical division, Queensland,
2002-03
Statistical division Number of offences Rate per 100,000 Brisbane 15,396 912 Moreton 6,700 895 Wide Bay-Burnett 2,893 1,207 Darling Downs 1,836 862 South West 451 1,672 Fitzroy 2,590 1,411 Central West 150 1,197 Mackay 1,637 1,288 Northern 2,964 1,435 Far North 4,165 1,846 North West 1,581 4,423

14
Figure 14 Offences against the person, rates per 100,000 population by statistical division, Queensland, 2002-03
2,000 +
1,500 to
1,999
1,000 to 1,499
0 to 999
Rates per 100,000 population
Offences against the person

15
2.3.2 Offences against property The Central West SD had the lowest rate of offences against property, while the North West SD had the highest rate. Brisbane, Moreton and Northern SDs also had high rates of offences against property (table 4 and figure 15). Table 4 Offences against property, numbers and rates by statistical division, Queensland,
2002-03
Statistical division Number of offences Rate per 100,000
Brisbane 141,147 8,362 Moreton 61,511 8,218 Wide Bay-Burnett 12,963 5,407 Darling Downs 12,053 5,660 South West 1,798 6,664 Fitzroy 11,143 6,072 Central West 468 3,732 Mackay 7,436 5,849 Northern 15,326 7,422 Far North 16,209 7,184 North West 3,013 8,432

16
Figure 15 Offences against property, rates per 100,000 population by statistical division, Queensland, 2002-03
8,000 +6,000
to 7,999
4,000
to 5,999
0 to 3,999
Property offences
Rates per 100,000 population

17
2.3.3 Other offences Darling Downs SD had the lowest rate of other offences, while the North West SD had the highest. Far North, Central West and South West SDs also had high rates of other offences (table 5 and figure 16). Table 5 Other offences, numbers and rates by statistical division, Queensland, 2002-03
Statistical division Number of offences Rate per 100,000 Brisbane 44,880 2,659 Moreton 21,508 2,873 Wide Bay-Burnett 9,420 3,929 Darling Downs 5,620 2,639 South West 1,221 4,525 Fitzroy 7,037 3,835 Central West 589 4,696 Mackay 4,823 3,794 Northern 8,620 4,175 Far North 13,996 6,203 North West 3,258 9,119

18
Figure 16 Other offences, rates per 100,000 population by statistical division, Queensland, 2002-03
Rates per 100,000 population
7,000 +5,000 to 6,999 3,000 to 4,999
0 to 2,999
Other offences

19
2.4 Small Crime Area
Detailed results for Crime Regions are available in the individual summary sheets on the Office of Economic and Statistical Research website: www.oesr.qld.gov.au Figures 17 to 19 show broad offence rates by small crime area. 2.4.1 Offences against the person Figure 17 Offences against the person, rates per 100,000 population by Crime Region,
Queensland, 2002-03
Rates per 100,000 population
2,500 + 1,500
to
2,499
750
to
1,499
0 to 749
Offences against the person

20
2.4.2 Offences against property Figure 18 Offences against property, rates per 100,000 population by Crime Region,
Queensland, 2002-03
7,500 +5,000 to 7,499
3,000 to 4,999
0 to 2,999
Property offences
Rates per 100,000 population

21
2.4.3 Other offences Figure 19 Other offences, rates per 100,000 population by Crime Region, Queensland,
2002-03
6,000 +4,000 to 5,999 2,000 to 3,999
0 to 1,999
Other offences
Rates per 100,000 population

22
Appendix A Methodology All statistics presented in this report are based on data obtained from the Queensland Police Service (QPS) at the Police Division level. These data are made up of offences committed in Queensland from 1999-2000 to 2002-03 by both adults and juveniles. The data have been mapped to LGAs by the Office of Economic and Statistical Research (see section A.2) and then aggregated where appropriate (see Overview and section A.2). Thus, these statistics are not official QPS statistics and should be treated as estimates only.
A.1 Offence Categories Throughout this report, offences have been divided into three broad groups: offences against the person, offences against property and other offences.
Offences against the person include homicide, serious assault, other assault, sexual offences, armed robbery, unarmed robbery, extortion, kidnapping/abduction etc and other offences against the person.
Offences against property include unlawful entry with intent (dwelling), unlawful entry with intent (shop), unlawful entry with intent (other), arson, other property damage, motor vehicle theft, stealing from dwelling, shop stealing, other stealing, fraud, handling stolen goods and miscellaneous property offences.
Other offences include good order offences, drug offences, prostitution offences, liquor (excluding drunkenness) offences, stock related offences and miscellaneous offences.
A.2 Converting Police Division Data to LGA Data The LGA boundaries used to create the regions in this report are those based on the 2001 Australian Standard Geographical Classification (ASGC) (ABS, Cat. no. 1216.0). In this classification, (C) means City, (S) means Shire and (T) is Town. In some areas, Police Division and LGA boundaries were the same and therefore a one to one concordance was achievable. However, many Police Divisions cross boundaries of LGAs. Where this discordance occurred, the number of offences attributed to each LGA has been estimated according to the population share of that part of the Police District in part of an LGA. This concordance was developed previously for the 1997-98 report based on counts from the 1996 Census of Population and Housing. This methodology does not consider other factors such as socio-economic influences when allocating numbers of offences to LGAs and should therefore be treated as estimates and used with due caution. The results of concordance between Police Divisions and Local Government Areas are provided as Appendix B. Over the three years, QPS allocated 681 offences (201 in 2000-01, 232 in 2001-02 and 248 in 2002-03) to the Police Division, Drug Enforcement Region (DER). These offences were detected during covert operations and were not geographically classified in order to maintain strict confidentiality. These offences were excluded from analysis in this report.

23
A.3 Aggregation of LGAs Summaries of offence numbers and rates have been prepared in relation to regions based on Local Government Areas. In some cases, the populations of these areas are so small as to make the production of rates for less common offences misleading. For example, if one arson offence were committed in the Isisford LGA, the rate of arson would be 332 per 100,000 persons, more than seven times the Queensland rate. Thus, LGAs with small populations have been aggregated with other geographically appropriate LGAs. A list of LGAs and the aggregated regions they form, along with maps representing these aggregations, is provided in Appendixes C and D.
A.4 Populations Rates were calculated for all years using the Estimated Residential Populations (ERPs) in Population by Age and Sex, Queensland, ABS Cat. no. 3253.3, for the end of each year. For example, the population used to calculate rates for 1999-2000 is the ERP for 30 June 2000.
A.5 Rates Included throughout the report are rates for the regions of interest and Queensland. These rates are all expressed as the number of offences per 100,000 persons living in the region. Thus, the calculation of the rate for a particular offence is: no. of offences in region * 100,000 population of region
A.6 Median Age The median age for each region was taken from the 2001 Census of Population and Housing, but the data for this field are only available for place of enumeration. Where LGAs were combined, it was necessary to use a weighted average of the medians for each LGA to estimate a median age for the combined region. It should be noted that offences for both juvenile and adult offenders are included here.
A.7 Male to Female Ratio The data used to calculate the ratio of males to females in each region were taken from the place of usual residence data from the 2001 Census of Population and Housing.

24
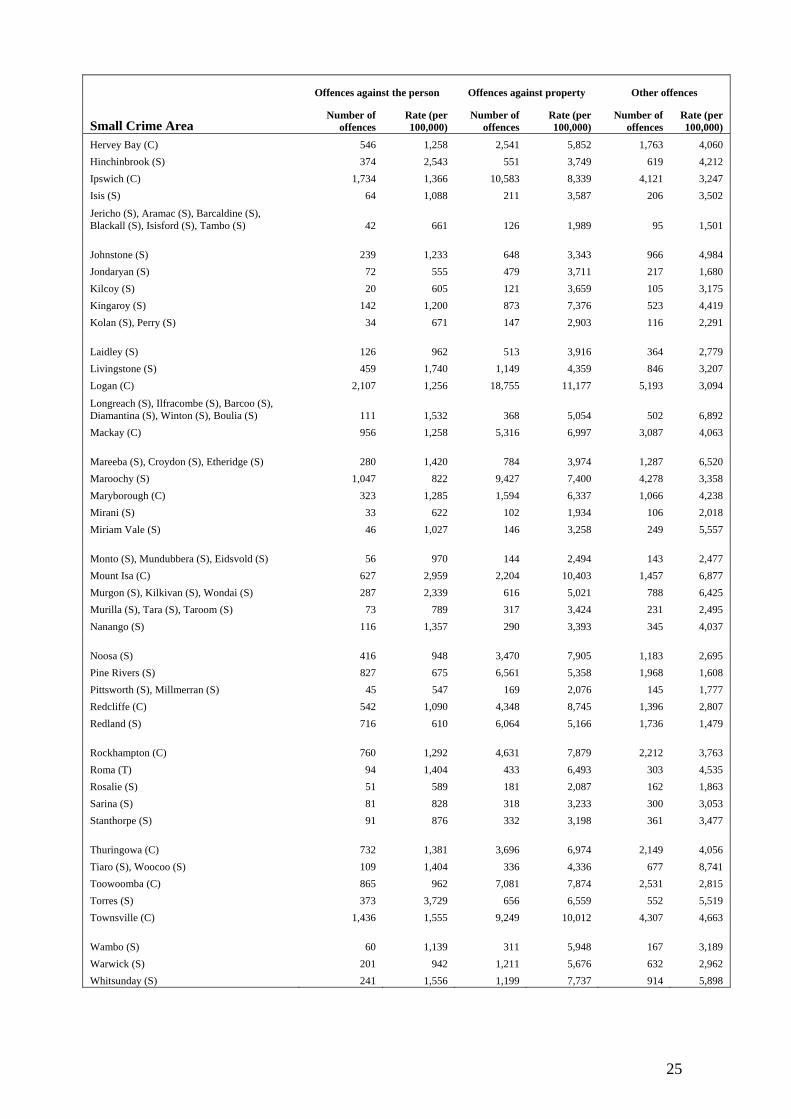
Appendix B Small Crime Area Summary Table Table 6 Offence number and rate by Small Crime Area and broad offence category, Queensland,
2002-03 Offences against the person Offences against property Other offences
Small Crime Area Number of
offences Rate (per 100,000)
Number of offences
Rate (per 100,000)
Number of offences
Rate (per 100,000)
Atherton (S) 96 905 471 4,439 516 4,863 Aurukun (S), Cook (S) 444 4,643 517 5,406 923 9,652 Balonne (S) 108 1,941 438 7,872 258 4,637 Banana (S) 333 2,315 507 3,530 430 2,990 Beaudesert (S) 289 533 1,607 2,962 742 1,368 Belyando (S), Nebo (S) 299 2,483 382 3,168 291 2,419
Bendemere (S), Booringa (S), Bungil (S), Waroo (S) 45 769 233 3,952 150 2,554 Boonah (S) 63 746 207 2,450 163 1,929 Bowen (S) 168 1,352 525 4,226 672 5,409 Brisbane (C) 7,897 879 82,531 9,186 26,596 2,960 Broadsound (S) 27 406 120 1,837 125 1,911 Bulloo (S), Paroo (S), Quilpie (S), Murweh (S) 204 2,321 694 7,889 510 5,796 Bundaberg (C) 566 1,267 3,356 7,512 1,533 3,431 Burdekin (S) 110 596 655 3,548 495 2,680 Burnett (S) 170 710 1,012 4,226 522 2,181 Caboolture (S) 1,199 1,047 8,161 7,129 2,632 2,299 Cairns (C) 2,232 1,854 11,690 9,706 7,513 6,238 Calliope (S) 114 756 565 3,741 334 2,212 Caloundra (C) 600 786 4,993 6,542 2,229 2,920 Cambooya (S), Clifton (S) 33 436 140 1,852 77 1,018 Cardwell (S) 143 1,327 473 4,390 758 7,035 Carpentaria (S), Burke (S), Mornington (S) 807 12,144 527 7,931 1,391 20,933 Charters Towers (C), Dalrymple (S) 144 1,177 650 5,307 378 3,083 Chinchilla (S) 39 640 195 3,216 142 2,340
Cloncurry (S), Flinders (S), McKinlay (S), Richmond (S) 147 1,805 282 3,476 410 5,056 Cooloola (S) 407 1,209 1,526 4,533 1,398 4,152 Crows Nest (S) 61 595 471 4,586 183 1,782 Dalby (T) 128 1,264 705 6,958 347 3,421 Douglas (S) 193 1,801 678 6,344 913 8,540 Duaringa (S) 173 2,263 420 5,481 430 5,619 Eacham (S) 51 803 143 2,251 176 2,770 Emerald (S), Bauhinia (S), Peak Downs (S) 168 912 669 3,633 723 3,926 Esk (S) 159 1,075 643 4,347 369 2,497 Fitzroy (S), Mount Morgan (S) 184 1,423 861 6,670 511 3,959 Gatton (S) 135 866 504 3,234 374 2,400 Gayndah (S), Biggenden (S) 27 608 172 3,889 92 2,083 Gladstone (C) 397 1,476 2,316 8,616 1,545 5,748 Gold Coast (C) 4,218 991 44,170 10,383 12,938 3,041
Goondiwindi (T), Waggamba (S), Inglewood (S) 118 1,129 461 4,412 426 4,077 Herberton (S) 114 2,140 149 2,798 393 7,379
25
Offences against the person Offences against property Other offences
Small Crime Area Number of
offences Rate (per 100,000)
Number of offences
Rate (per 100,000)
Number of offences
Rate (per 100,000)
Hervey Bay (C) 546 1,258 2,541 5,852 1,763 4,060 Hinchinbrook (S) 374 2,543 551 3,749 619 4,212 Ipswich (C) 1,734 1,366 10,583 8,339 4,121 3,247 Isis (S) 64 1,088 211 3,587 206 3,502
Jericho (S), Aramac (S), Barcaldine (S), Blackall (S), Isisford (S), Tambo (S) 42 661 126 1,989 95 1,501 Johnstone (S) 239 1,233 648 3,343 966 4,984 Jondaryan (S) 72 555 479 3,711 217 1,680 Kilcoy (S) 20 605 121 3,659 105 3,175 Kingaroy (S) 142 1,200 873 7,376 523 4,419 Kolan (S), Perry (S) 34 671 147 2,903 116 2,291 Laidley (S) 126 962 513 3,916 364 2,779 Livingstone (S) 459 1,740 1,149 4,359 846 3,207 Logan (C) 2,107 1,256 18,755 11,177 5,193 3,094
Longreach (S), Ilfracombe (S), Barcoo (S), Diamantina (S), Winton (S), Boulia (S) 111 1,532 368 5,054 502 6,892 Mackay (C) 956 1,258 5,316 6,997 3,087 4,063 Mareeba (S), Croydon (S), Etheridge (S) 280 1,420 784 3,974 1,287 6,520 Maroochy (S) 1,047 822 9,427 7,400 4,278 3,358 Maryborough (C) 323 1,285 1,594 6,337 1,066 4,238 Mirani (S) 33 622 102 1,934 106 2,018 Miriam Vale (S) 46 1,027 146 3,258 249 5,557 Monto (S), Mundubbera (S), Eidsvold (S) 56 970 144 2,494 143 2,477 Mount Isa (C) 627 2,959 2,204 10,403 1,457 6,877 Murgon (S), Kilkivan (S), Wondai (S) 287 2,339 616 5,021 788 6,425 Murilla (S), Tara (S), Taroom (S) 73 789 317 3,424 231 2,495 Nanango (S) 116 1,357 290 3,393 345 4,037 Noosa (S) 416 948 3,470 7,905 1,183 2,695 Pine Rivers (S) 827 675 6,561 5,358 1,968 1,608 Pittsworth (S), Millmerran (S) 45 547 169 2,076 145 1,777 Redcliffe (C) 542 1,090 4,348 8,745 1,396 2,807 Redland (S) 716 610 6,064 5,166 1,736 1,479 Rockhampton (C) 760 1,292 4,631 7,879 2,212 3,763 Roma (T) 94 1,404 433 6,493 303 4,535 Rosalie (S) 51 589 181 2,087 162 1,863 Sarina (S) 81 828 318 3,233 300 3,053 Stanthorpe (S) 91 876 332 3,198 361 3,477 Thuringowa (C) 732 1,381 3,696 6,974 2,149 4,056 Tiaro (S), Woocoo (S) 109 1,404 336 4,336 677 8,741 Toowoomba (C) 865 962 7,081 7,874 2,531 2,815 Torres (S) 373 3,729 656 6,559 552 5,519 Townsville (C) 1,436 1,555 9,249 10,012 4,307 4,663 Wambo (S) 60 1,139 311 5,948 167 3,189 Warwick (S) 201 942 1,211 5,676 632 2,962 Whitsunday (S) 241 1,556 1,199 7,737 914 5,898

26
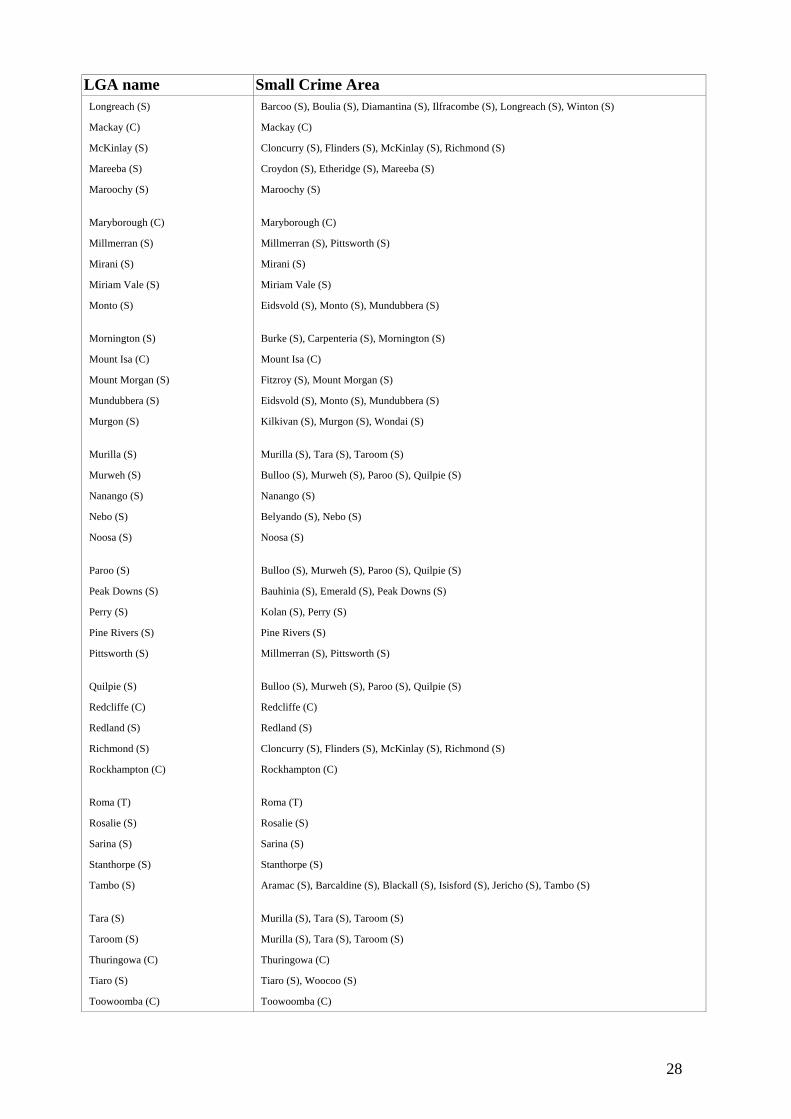
Appendix C LGA and Small Crime Area Pairs Below is a list of Local Government Areas and the Small Crime Area in which they are included for the purpose of this report. Table 7 LGA and crime region areas LGA name Small Crime Area Aramac (S) Aramac (S), Barcaldine (S), Blackall (S), Isisford (S), Jericho (S), Tambo (S)
Atherton (S) Atherton (S)
Aurukun (S) Aurukun (S), Cook (S)
Balonne (S) Balonne (S)
Banana (S) Banana (S) Barcaldine (S) Aramac (S), Barcaldine (S), Blackall (S), Isisford (S), Jericho (S), Tambo (S)
Barcoo (S) Barcoo (S), Boulia (S), Diamantina (S), Ilfracombe (S), Longreach (S), Winton (S)
Bauhinia (S) Bauhinia (S), Emerald (S), Peak Downs (S)
Beaudesert (S) Beaudesert (S)
Belyando (S) Belyando (S), Nebo (S) Bendemere (S) Bendemere (S), Booringa (S), Bungil (S), Waroo (S)
Biggenden (S) Gayndah (S), Biggenden (S)
Blackall (S) Aramac (S), Barcaldine (S), Blackall (S), Isisford (S), Jericho (S), Tambo (S)
Boonah (S) Boonah (S)
Booringa (S) Bendemere (S), Booringa (S), Bungil (S), Waroo (S) Boulia (S) Barcoo (S), Boulia (S), Diamantina (S), Ilfracombe (S), Longreach (S), Winton (S)
Bowen (S) Bowen (S)
Brisbane (C) Brisbane (C)
Broadsound (S) Broadsound (S)
Bulloo (S) Bulloo (S), Murweh (S), Paroo (S), Quilpie (S) Bundaberg (C) Bundaberg (C)
Bungil (S) Bendemere (S), Booringa (S), Bungil (S), Waroo (S)
Burdekin (S) Burdekin (S)
Burke (S) Burke (S), Carpenteria (S), Mornington (S)
Burnett (S) Burnett (S) Caboolture (S) Caboolture (S)
Cairns (C) Cairns (C)
Calliope (S) Calliope (S)
Caloundra (C) Caloundra (C)
Cambooya (S) Cambooya (S), Clifton (S) Cardwell (S) Cardwell (S)
Carpentaria (S) Burke (S), Carpenteria (S), Mornington (S)
Charters Towers (C) Charters Towers (C), Dalrymple (S)
Chinchilla (S) Chinchilla (S)
Clifton (S) Cambooya (S), Clifton (S)

27
LGA name Small Crime Area Cloncurry (S) Cloncurry (S), Flinders (S), McKinlay (S), Richmond (S)
Cook (S) Aurukun (S), Cook (S)
Cooloola (S) Cooloola (S)
Crows Nest (S) Crows Nest (S)
Croydon (S) Croydon (S), Mareeba (S), Etheridge (S) Dalby (T) Dalby (T)
Dalrymple (S) Charters Towers (C), Dalrymple (S)
Diamantina (S) Barcoo (S), Boulia (S), Diamantina (S), Ilfracombe (S), Longreach (S), Winton (S)
Douglas (S) Douglas (S)
Duaringa (S) Duaringa (S) Eacham (S) Eacham (S)
Eidsvold (S) Eidsvold (S), Monto (S), Mundubbera (S)
Emerald (S) Bauhinia (S), Emerald (S), Peak Downs (S)
Esk (S) Esk (S)
Etheridge (S) Croydon (S), Etheridge (S), Mareeba (S) Fitzroy (S) Fitzroy (S), Mount Morgan (S)
Flinders (S) Cloncurry (S), Flinders (S), McKinlay (S), Richmond (S)
Gatton (S) Gatton (S)
Gayndah (S) Biggenden (S), Gayndah (S)
Gladstone (C) Gladstone (C) Gold Coast (C) Gold Coast (C)
Goondiwindi (T) Goondiwindi (T), Inglewood (S), Waggamba (S)
Herberton (S) Herberton (S)
Hervey Bay (C) Hervey Bay (C)
Hinchinbrook (S) Hinchinbrook (S) Ilfracombe (S) Barcoo (S), Boulia (S), Diamantina (S), Ilfracombe (S), Longreach (S), Winton (S)
Inglewood (S) Goondiwindi (T), Inglewood (S), Waggamba (S)
Ipswich (C) Ipswich (C)
Isis (S) Isis (S)
Isisford (S) Aramac (S), Barcaldine (S), Blackall (S), Isisford (S), Jericho (S), Tambo (S) Jericho (S) Aramac (S), Barcaldine (S), Blackall (S), Isisford (S), Jericho (S), Tambo (S)
Johnstone (S) Johnstone (S)
Jondaryan (S) Jondaryan (S)
Kilcoy (S) Kilcoy (S)
Kilkivan (S) Kilkivan (S), Murgon (S), Wondai (S) Kingaroy (S) Kingaroy (S)
Kolan (S) Kolan (S), Perry (S)
Laidley (S) Laidley (S)
Livingstone (S) Livingstone (S)
Logan (C) Logan (C)
28
LGA name Small Crime Area Longreach (S) Barcoo (S), Boulia (S), Diamantina (S), Ilfracombe (S), Longreach (S), Winton (S)
Mackay (C) Mackay (C)
McKinlay (S) Cloncurry (S), Flinders (S), McKinlay (S), Richmond (S)
Mareeba (S) Croydon (S), Etheridge (S), Mareeba (S)
Maroochy (S) Maroochy (S) Maryborough (C) Maryborough (C)
Millmerran (S) Millmerran (S), Pittsworth (S)
Mirani (S) Mirani (S)
Miriam Vale (S) Miriam Vale (S)
Monto (S) Eidsvold (S), Monto (S), Mundubbera (S) Mornington (S) Burke (S), Carpenteria (S), Mornington (S)
Mount Isa (C) Mount Isa (C)
Mount Morgan (S) Fitzroy (S), Mount Morgan (S)
Mundubbera (S) Eidsvold (S), Monto (S), Mundubbera (S)
Murgon (S) Kilkivan (S), Murgon (S), Wondai (S) Murilla (S) Murilla (S), Tara (S), Taroom (S)
Murweh (S) Bulloo (S), Murweh (S), Paroo (S), Quilpie (S)
Nanango (S) Nanango (S)
Nebo (S) Belyando (S), Nebo (S)
Noosa (S) Noosa (S) Paroo (S) Bulloo (S), Murweh (S), Paroo (S), Quilpie (S)
Peak Downs (S) Bauhinia (S), Emerald (S), Peak Downs (S)
Perry (S) Kolan (S), Perry (S)
Pine Rivers (S) Pine Rivers (S)
Pittsworth (S) Millmerran (S), Pittsworth (S) Quilpie (S) Bulloo (S), Murweh (S), Paroo (S), Quilpie (S)
Redcliffe (C) Redcliffe (C)
Redland (S) Redland (S)
Richmond (S) Cloncurry (S), Flinders (S), McKinlay (S), Richmond (S)
Rockhampton (C) Rockhampton (C) Roma (T) Roma (T)
Rosalie (S) Rosalie (S)
Sarina (S) Sarina (S)
Stanthorpe (S) Stanthorpe (S)
Tambo (S) Aramac (S), Barcaldine (S), Blackall (S), Isisford (S), Jericho (S), Tambo (S) Tara (S) Murilla (S), Tara (S), Taroom (S)
Taroom (S) Murilla (S), Tara (S), Taroom (S)
Thuringowa (C) Thuringowa (C)
Tiaro (S) Tiaro (S), Woocoo (S)
Toowoomba (C) Toowoomba (C)

29
LGA name Small Crime Area Torres (S) Torres (S)
Townsville (C) Townsville (C)
Waggamba (S) Goondiwindi (T), Inglewood (S), Waggamba (S)
Wambo (S) Wambo (S)
Warroo (S) Bendemere (S), Booringa (S), Bungil (S), Waroo (S) Warwick (S) Warwick (S)
Whitsunday (S) Whitsunday (S)
Winton (S) Barcoo (S), Boulia (S), Diamantina (S), Ilfracombe (S), Longreach (S), Winton (S)
Wondai (S) Kilkivan (S), Murgon (S), Wondai (S)
Woocoo (S) Tiaro (S), Woocoo (S)

30
Appendix D Maps of Queensland Local Government Areas
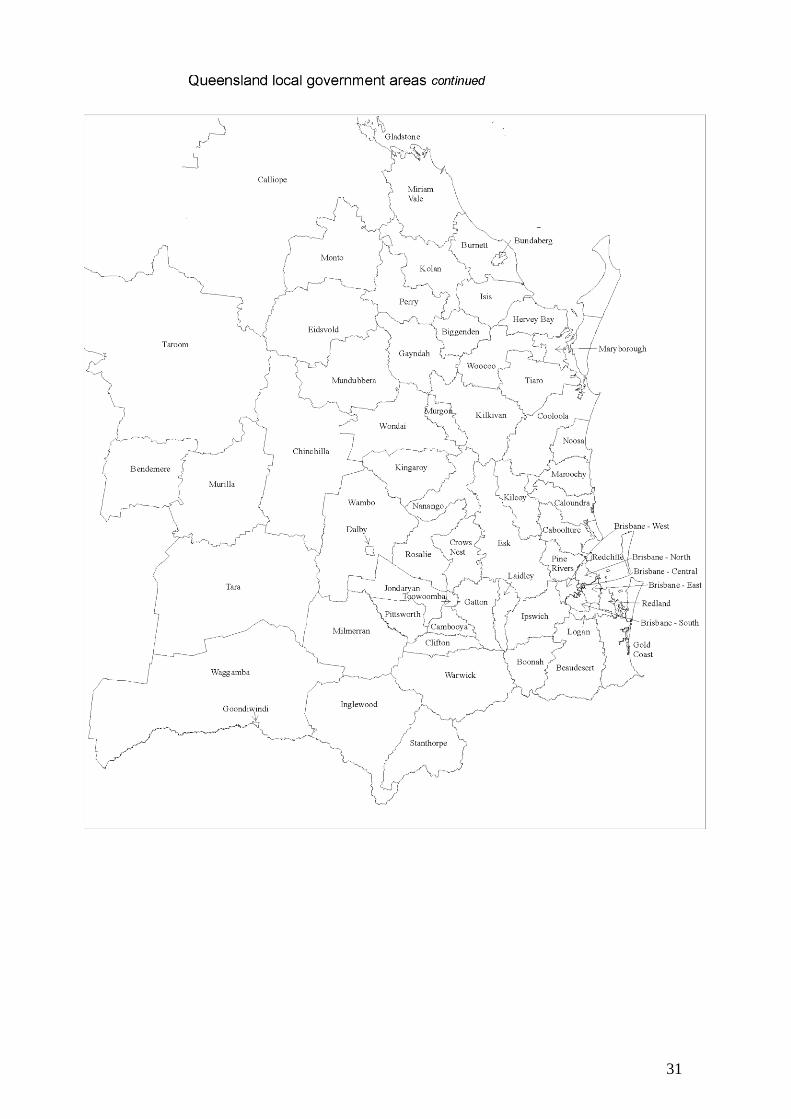
31

32
Appendix E Map of Statistical Divisions of Queensland
Moreton
Brisbane
Wide Bay-Burnett
Darling DownsSouth West
FitzroyCentral West
Mackay
Northern
Far North
North West


