27
Crisis and Recovery: Role of the Exchange Rate Regime in Emerging Market Countries Charalambos Tsangarides WP/10/242
Crisis and Recovery: Role of the Exchange Rate Regime in
Emerging Market Countries
Charalambos Tsangarides
WP/10/242
© 2010 International Monetary Fund WP/10/242
IMF Working Paper
Research Department
Crisis and Recovery: Role of the Exchange Rate Regime in Emerging Market Economies†
Prepared by Charalambos Tsangarides
Authorized for distribution by Atish R. Ghosh
October 2010
Abstract
This Working Paper should not be reported as representing the views of the IMF. The views expressed in this Working Paper are those of the author(s) and do not necessarily represent those of the IMF or IMF policy. Working Papers describe research in progress by the author(s) and are published to elicit comments and to further debate.
This paper examines the role of the exchange rate regime in explaining how emerging market economies fared in the recent global financial crisis, particularly in terms of output losses and growth resilience. After controlling for regime switches during the crisis, using alternative definitions for pegs, and taking account of other likely determinants, we find that the growth performance for pegs was not different from that of floats during the crisis. For the recovery period 2010–11, pegs appear to be faring worse, with growth recovering more slowly than floats. These results suggest an asymmetric effect of the regime during and recovering from the crisis. We also find that proxies of the trade and financial channels are important determinants of growth performance during the crisis, while only the trade channel appears important for the recovery thus far.
JEL Classification Numbers: F30, F31, F43, O57 Keywords: Global financial crisis, fixed exchange rate, growth, emerging market economiesAuthor’s E-Mail Address: [email protected]
† I would like to thank Olivier Blanchard, Rex Ghosh, Mahvash Qureshi, and colleagues at the IMF’s Research Department for helpful comments and suggestions. This paper builds on and extends the approach of Box 1.1 in the April 2010 World Economic Outlook. Research assistance with data collection was provided by Angela Espiritu. The usual disclaimer applies.

Contents Page I. Introduction .....................................................................................................................3
II. Data ..................................................................................................................................4
III. The Crisis Period ..............................................................................................................4
A. Story in simple averages .........................................................................................4
B. Growth determinants in the crisis period ................................................................6
IV. Post-Crisis Recovery .......................................................................................................9
A. First signs of recovery .............................................................................................9 B. Role of perceptions ................................................................................................10
V. Conclusion ......................................................................................................................13
References ...............................................................................................................................14
Appendix A: Data and Summary Statistics .............................................................................15
Appendix B: Tables and Robustness Checks ...........................................................................19
3
I. INTRODUCTION
The global financial crisis spread from the United States to the rest of the world quickly. As the crisis intensified, there was talk about whether emerging market economies (EMEs) would follow the advanced economies into a recession—as business cycles have become more synchronized through trade and finance—or whether decoupling would help lessen the impact of the recession. Pessimists argued that decoupling was not possible in an era of globalization. Optimists pointed to increases in trade among emerging and developing economies, and increases in productivity growth and domestic incomes as signs that emerging and developing markets were “learning to spread their wings”. Although EMEs were not at the epicenter of the recent global financial crisis, the experience of the last three years may nevertheless hold important lessons for them. One such lesson concerns the choice of exchange rate regime—an obvious question being whether the exchange rate regime can help explain how emerging market economies fared in this crisis, particularly in terms of output losses and growth resilience. Theory suggests that exchange rate flexibility, by easing adjustment, should be associated with smaller output losses in the face of external shocks. This was also the popular perception in the recent crisis—that it has been better weathered by countries with more flexible exchange rate regimes. We investigate these issues using a sample of 50 EMEs. In particular, we examine the growth episodes covering the crisis and recovery periods to assess how the EMEs’ choice of exchange rate regime can help explain how they fared in, and are recovering from, the recent crisis. In addition to examining in detail the role of the exchange rate regime, we complement earlier studies by identifying other factors in that influenced performance during the crisis and the current recovery.1 Our main findings suggest the following. First, during the crisis, after controlling for regime switches, using alternative definitions to classify pegs, and taking account of other likely determinants, growth performance for pegs was not different from that of floats. In addition, trade exposure—captured by partner growth and terms of trade shocks—and financial channel variables—captured by reserves and short term debt—were important factors contributing to the growth performance during the crisis. Second, for the recovery in 2010–11, we find evidence that pegs are experiencing slower growth than floats. In addition to the rebound effect from the crisis, trading partner growth is the only contributor to recovery, as adjustment tools like fiscal policy may have not had enough time to take effect. Taken together, these results suggest an asymmetric effect of the exchange rate regime on growth performance during the crisis compared to the recovery from the crisis, and a symmetric effect of the trade channel. Finally, to the extent that “biases” in perceptions about growth recovery under pegs exist, these could account for the finding of slower expected growth recovery for 2010–11 under pegs.
1 Several studies that attempt to explain the differences in the crisis impact across emerging markets include Blanchard, Faruquee and Das (2010), IMF (2010), Ghosh and others (SPN 2010/04), Berkmen and others (2009), Rose and Spiegel (2009), and Taylor (2009).
4
The rest of the paper is organized as follows. Section II discusses the data. Section III presents empirical evidence on exchange rate regime and growth during the crisis period using descriptive statistics and growth regressions. Section IV examines the recovery period. Section IV examines the role of perceptions. Section V concludes.
II. DATA
All macroeconomic variables are constructed from the IMF’s WEO database. The exchange rate regime classification is from the IMF’s revised classification published in the 2009 Annual Report on Exchange Rate Arrangements and Exchange Restrictions. Using the IMF’s de facto exchange rate regime classification at the end of each period of the analysis, we classify countries’ exchange rate regimes into fixed and non-fixed using two definitions. In the first definition, we categorize all hard pegs (with no separate legal tender or a currency board), conventional pegged arrangements, pegs within horizontal bands, and crawling pegs as pegs. In the second definition, we also construct a narrower peg category that includes hard pegs and conventional pegged arrangements. We measure growth performance using alternative growth episodes, covering both the absolute and the relative growth performance. For the crisis period, the first three (absolute) measures calculate real GDP growth rates between 2007–08, 2007–09, and 2008–09, and the fourth (relative measure) compares growth in 2008–09 with growth in 2003–07. For the recovery period, growth is defined as growth 2010–11, with alternative definitions (2009–10 and 2010–2012) used as robustness measures. Tables A1 and A2 in Appendix A provide details on the sample, the data construction, and summary statistics.
III. THE CRISIS PERIOD
A. Story in simple averages
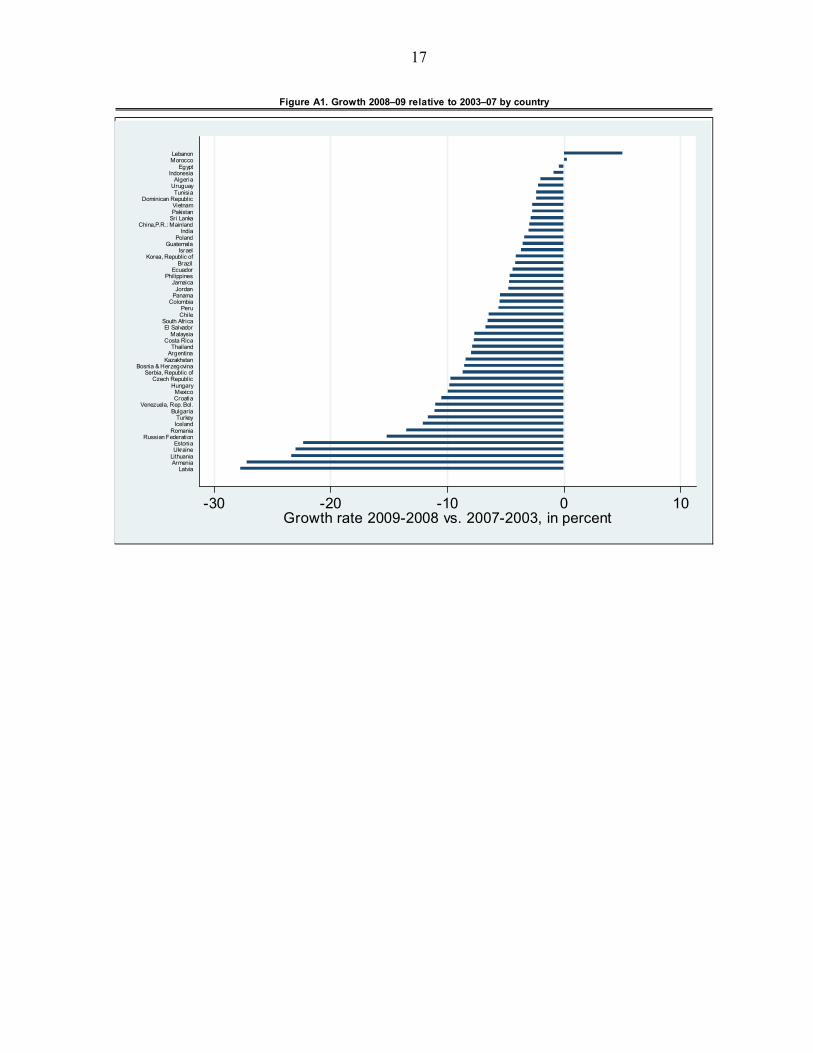
A first look at the raw data on growth performance during the crisis yields the surprising result that both in absolute terms and in relation to the country’s previous performance, pegs—broadly construed to include the range from free floating to crawl-like arrangements—averaged smaller output declines than floats. Figure 1a suggests that at the beginning of the crisis, average growth was more than half a percentage point higher for countries with pegged exchange rate regimes compared with those with floating regimes. As the crisis intensified, average growth declines for countries with pegs were smaller than those with floats, with output decline for pegs—as measured in relation to the country’s previous growth performance (Figure 1a, fourth column)—about half a percentage point less than that of floats. What accounts for this finding? In part, perceptions that countries with pegs fared worse may simply be mistaken, driven by a few exceptional cases (such as the output declines in the Baltic states) rather than based on a representative sample.2 Further, this performance may be partly driven by defining the peg category “too broadly”, in effect including intermediate
2 See Appendix Figure A1 for the growth performance by country in our sample over the crisis period.

5
exchange rate regimes which are found to be associated with the highest average growth performance.3 Indeed, eliminating intermediate regimes from the peg category—thus restricting pegs to only hard and conventional pegs—changes the picture in Figure 1a. With this stricter peg classification, pegs do worse than floats, both in absolute terms and in relation to the previous growth performance (Figure 1b).
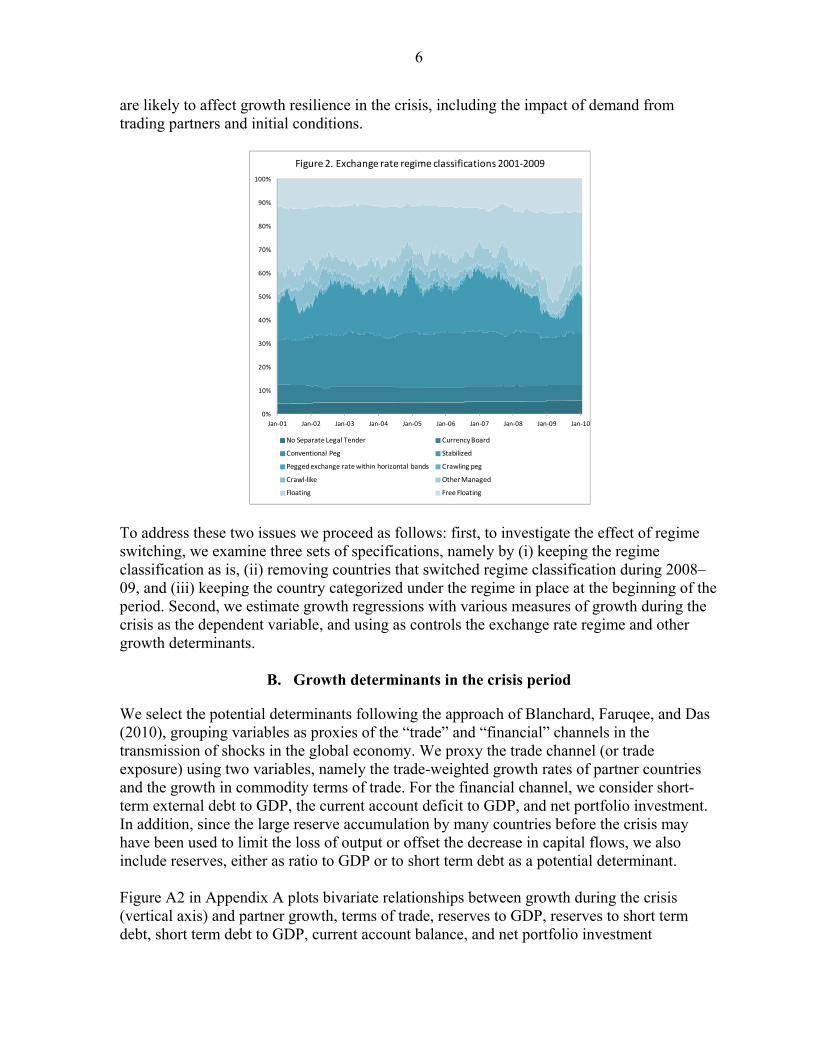
But the misperception may also, in part, be an artifact of classification, because some countries with pegs responded to the crisis by moving to a more flexible regime, thus using the exchange rate as an adjustment tool. Indeed, there was a distinct dip in the number of countries with pegs—particularly soft pegs and/or intermediate regimes—following the onset of the crisis through spring 2009. The distribution of exchange rate arrangements in Figure 2 (with lighter shades representing more flexible arrangements) suggests a move towards more flexibility, with almost a 20 percent reduction in the number of less flexible exchange rate arrangements during the crisis. This pattern was mostly reversed by the beginning of 2010.4 Although it may remain true that countries that maintained their less flexible regimes may have fared better, it may be misleading to include countries that switched in the category of their new regime if the reason they switched related to their ability to respond to the crisis under their original regime. For example, if pegs are associated with asset bubbles that turn to busts, triggering both the economic downturn and the exit from the pegged regime, then it would be unfair to attribute the poor growth performance to the subsequent float. In addition to regime switching and classification issues, another important potential effect that casts doubt on the results of Figure 1a is that simple averages do not control for other factors that
3A recent IMF study found that intermediate (neither rigidly fixed nor freely floating) exchange rate regimes are associated with the highest average growth performance by capturing some of the benefits of pegs (low nominal and real exchange rate volatility, trade integration) while avoiding the main drawbacks (exchange rate overvaluation). The study also found, however, that countries with pegged and intermediate regimes are more likely to experience currency and financial crises, although not growth crises (see Ghosh, Ostry, and Tsangarides, 2010). 4 A similar, temporary shift toward de facto flexibility was observed after the Asian crisis.
‐10.0
-8.0
-6.0
-4.0
-2.0
0.0
2.0
4.0
6.0
8.0
2008-07 2009-07 2009-08 2009-08 vs. 2007-03
2011-10 2011-10 vs. 2009-08
Figure 1a. Average growth, crisis and recovery(Various periods)1
Pegs
Floats
1 Regime=1 for "no separate legal tender" to "crawling peg" , and 0 otherwise.
-15.0
-10.0
-5.0
0.0
5.0
10.0
2008-07 2009-07 2009-08 2009-08 vs. 2007-03
2011-10 2011-10 vs. 2009-08
Figure 1b. Average growth, crisis and recovery(Narrower peg definition, various periods)1
Pegs
Floats
1 Regime=1 for "no separate legal tender" to "conventional peg" , and 0 otherwise.
6
are likely to affect growth resilience in the crisis, including the impact of demand from trading partners and initial conditions.
To address these two issues we proceed as follows: first, to investigate the effect of regime switching, we examine three sets of specifications, namely by (i) keeping the regime classification as is, (ii) removing countries that switched regime classification during 2008–09, and (iii) keeping the country categorized under the regime in place at the beginning of the period. Second, we estimate growth regressions with various measures of growth during the crisis as the dependent variable, and using as controls the exchange rate regime and other growth determinants.
B. Growth determinants in the crisis period
We select the potential determinants following the approach of Blanchard, Faruqee, and Das (2010), grouping variables as proxies of the “trade” and “financial” channels in the transmission of shocks in the global economy. We proxy the trade channel (or trade exposure) using two variables, namely the trade-weighted growth rates of partner countries and the growth in commodity terms of trade. For the financial channel, we consider short-term external debt to GDP, the current account deficit to GDP, and net portfolio investment. In addition, since the large reserve accumulation by many countries before the crisis may have been used to limit the loss of output or offset the decrease in capital flows, we also include reserves, either as ratio to GDP or to short term debt as a potential determinant. Figure A2 in Appendix A plots bivariate relationships between growth during the crisis (vertical axis) and partner growth, terms of trade, reserves to GDP, reserves to short term debt, short term debt to GDP, current account balance, and net portfolio investment
0%
10%
20%
30%
40%
50%
60%
70%
80%
90%
100%
Jan-01 Jan-02 Jan-03 Jan-04 Jan-05 Jan-06 Jan-07 Jan-08 Jan-09 Jan-10
Figure 2. Exchange rate regime classifications 2001-2009
No Separate Legal Tender Currency Board
Conventional Peg Stabilized
Pegged exchange rate within horizontal bands Crawling peg
Crawl-like Other Managed
Floating Free Floating
7
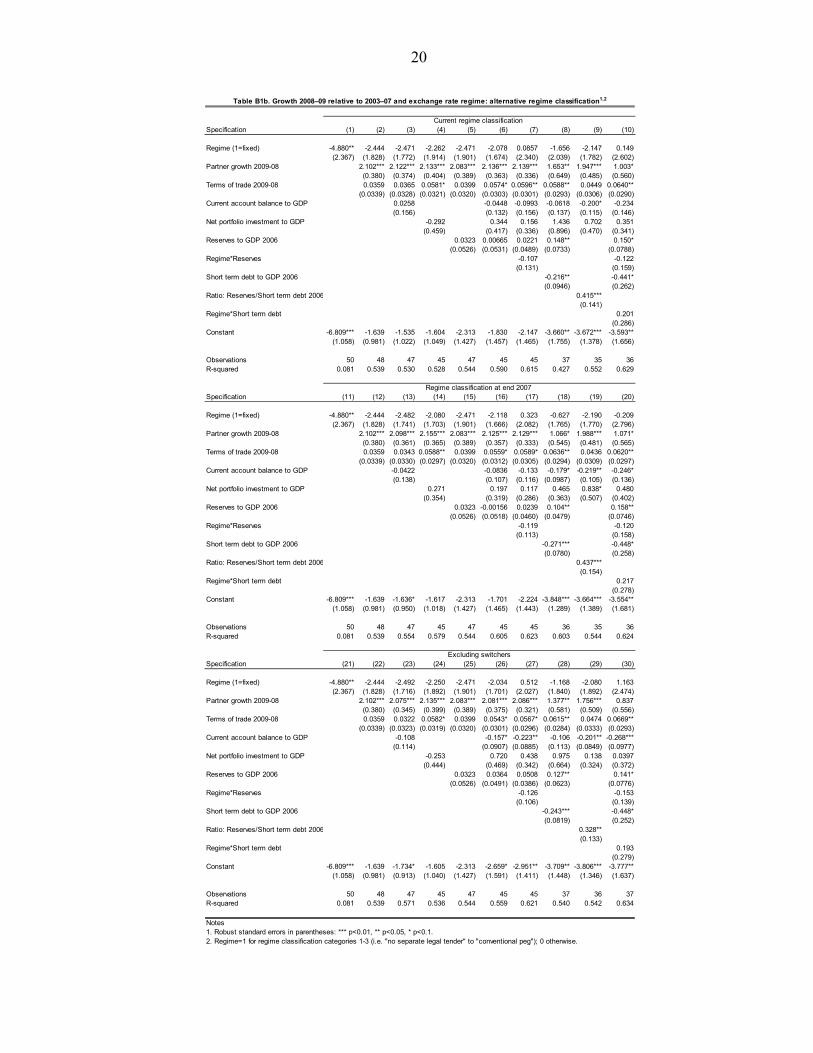
(horizontal axis). The strongest associations are those of growth during the crisis and trading partner growth, and growth during the crisis and short term debt to GDP. Our growth regressions begin by examining the “unconditional” effect of the exchange rate regime and then add sequentially variables that capture the trade and financial channels. Table B1a presents the results of several model specifications, namely, (i) based on the current regime (columns 1-10), (ii) classifying countries throughout the period by the regime prevailing in December 2007 (columns 11-20), and (iii) eliminating all countries that switched regimes during the period of analysis (columns 21-30). In the specifications of Table B1a, growth during the crisis is defined as growth during 2008–09 relative to growth during 2003–07, and pegs include hard pegs up to crawling pegs. In Table B1b we define pegs using our narrower definition, namely only hard and conventional pegs, and repeat the analysis.
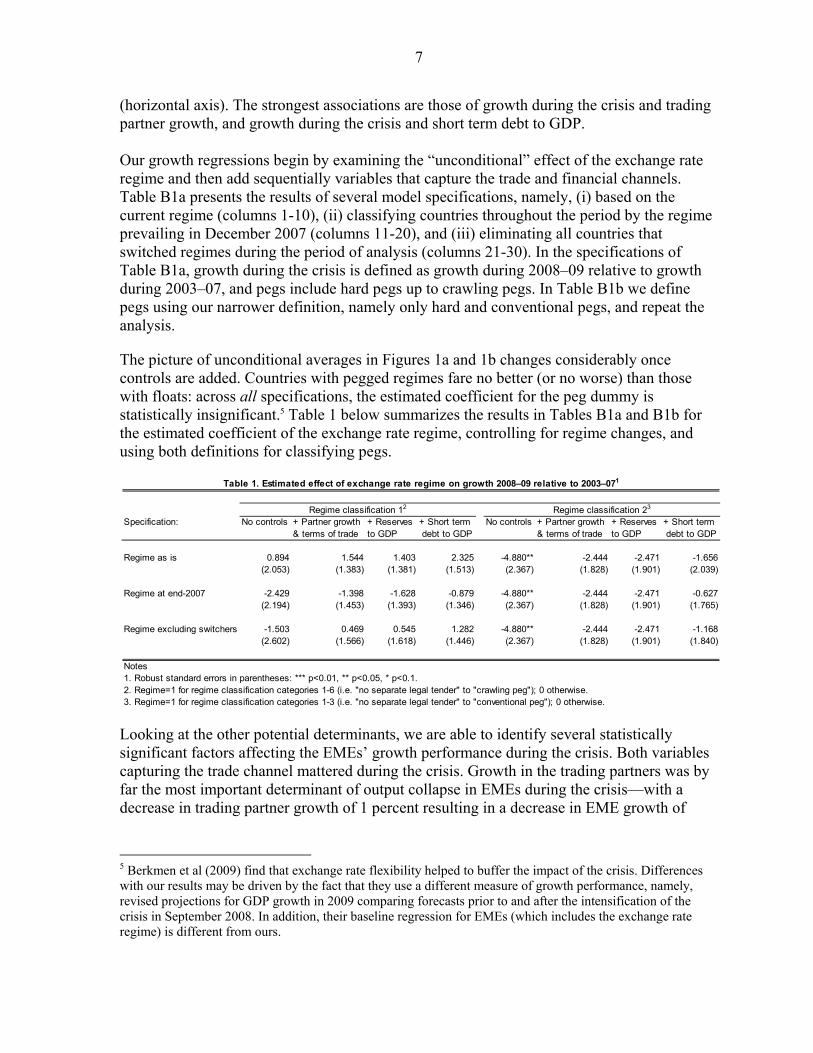
The picture of unconditional averages in Figures 1a and 1b changes considerably once controls are added. Countries with pegged regimes fare no better (or no worse) than those with floats: across all specifications, the estimated coefficient for the peg dummy is statistically insignificant.5 Table 1 below summarizes the results in Tables B1a and B1b for the estimated coefficient of the exchange rate regime, controlling for regime changes, and using both definitions for classifying pegs.
Looking at the other potential determinants, we are able to identify several statistically significant factors affecting the EMEs’ growth performance during the crisis. Both variables capturing the trade channel mattered during the crisis. Growth in the trading partners was by far the most important determinant of output collapse in EMEs during the crisis—with a decrease in trading partner growth of 1 percent resulting in a decrease in EME growth of
5 Berkmen et al (2009) find that exchange rate flexibility helped to buffer the impact of the crisis. Differences with our results may be driven by the fact that they use a different measure of growth performance, namely, revised projections for GDP growth in 2009 comparing forecasts prior to and after the intensification of the crisis in September 2008. In addition, their baseline regression for EMEs (which includes the exchange rate regime) is different from ours.
Specification: No controls + Partner growth + Reserves + Short term No controls + Partner growth + Reserves + Short term& terms of trade to GDP debt to GDP & terms of trade to GDP debt to GDP
Regime as is 0.894 1.544 1.403 2.325 -4.880** -2.444 -2.471 -1.656(2.053) (1.383) (1.381) (1.513) (2.367) (1.828) (1.901) (2.039)
Regime at end-2007 -2.429 -1.398 -1.628 -0.879 -4.880** -2.444 -2.471 -0.627(2.194) (1.453) (1.393) (1.346) (2.367) (1.828) (1.901) (1.765)
Regime excluding switchers -1.503 0.469 0.545 1.282 -4.880** -2.444 -2.471 -1.168(2.602) (1.566) (1.618) (1.446) (2.367) (1.828) (1.901) (1.840)
Notes1. Robust standard errors in parentheses: *** p<0.01, ** p<0.05, * p<0.1.2. Regime=1 for regime classification categories 1-6 (i.e. "no separate legal tender" to "crawling peg"); 0 otherwise.3. Regime=1 for regime classification categories 1-3 (i.e. "no separate legal tender" to "conventional peg"); 0 otherwise.
Table 1. Estimated effect of exchange rate regime on growth 2008–09 relative to 2003–071
Regime classification 12 Regime classification 23
8
about 2 percent across specifications in both Tables B1a and B1b—while the terms of trade shock had a lesser (albeit statistically significant) effect.
In terms of the financial channel, short term debt as a ratio to GDP is statistically significant: a 1 percent decrease in short term debt to GDP is associated with about 0.3 percent increase in growth during the crisis. In addition, reserves and short term debt are statistically significant both when they enter separately as ratios to GDP (specifications 8, 18, and 28), as well as when they enter together, as a ratio of reserves to short term debt (specifications 9, 19, and 29).6 This suggests that a lower short term debt to GDP, a higher ratio of reserves to GDP, and a higher ratio of reserves to short term debt—the latter driven by both the numerator and the denominator— have helped mitigate the output collapse during the crisis. Finally, the other two financial variables—current account balance to GDP and net portfolio investment—are mostly insignificant, yet correctly signed.7
The results presented in Tables B1a and B1b remain unchanged after an extensive set of robustness checks. These include using alternative specifications which include non-linear effects for reserves, a fiscal policy proxy, an oil producer dummy, a dummy for countries with inflation targeting, and a dummy for Latin American countries (Tables B2a and B2b). In addition to preserving the results of Tables B1a and B1b, the alternative specifications of Tables B2a and B2b suggest that there are no statistically significant effects of the added variables—non-linear effects for reserves, a fiscal policy proxy, a dummy for oil producers dummy, a dummy for inflation targeting regimes, and a dummy for Latin American countries. In particular, the results on the non-linear effects of reserves suggest that there are no diminishing returns associated with holding reserves in terms of their moderating impact on output collapse.
In summary, the regression analysis controlling for regime switching, alternative peg definitions, and other potential factors affecting performance, suggests that countries with pegged regimes fare no better than those with floats, and there is no residual difference in growth performance between pegs and floats. By the same token, however, pegs fare no worse than floats. In addition, we find that two variables capturing trade exposure (partner growth and terms of trade shock), and two financial channel variables (reserves and short term debt) are important factors contributing to the growth performance during the crisis. 8
6 Net portfolio investment (a proxy for capital inflows) may be correlated with short term-debt and/or the current account, as the higher short-term debt or the current account deficit, the larger the required capital inflows or change in reserves. We use them both interchangeably and together in the regressions as, in fact, the correlations between net portfolio investment with short term-debt and current account balance are low. 7 In specifications where the current account balance and/or net portfolio investment were excluded, the estimated coefficient of short-term debt increases (but always remains lower in magnitude compared to the coefficient for partner growth). 8 Overall, our findings are in line with those of Blanchard, Faruqee and Das (2010), except the one relating to the role of reserves. Blanchard, Faruqee and Das find a significant role for reserves in explaining output collapse once they control for short-term debt. Differences with our results are driven by the data coverage in Blanchard, Faruqee and Das (2010) —quarterly data on fewer emerging markets—and the different measure of output collapse. Indeed, when we constrain our sample to include the countries of Blanchard, Faruqee and Das, the effect of reserves almost disappears.
9
IV. POST-CRISIS RECOVERY
A. First signs of recovery
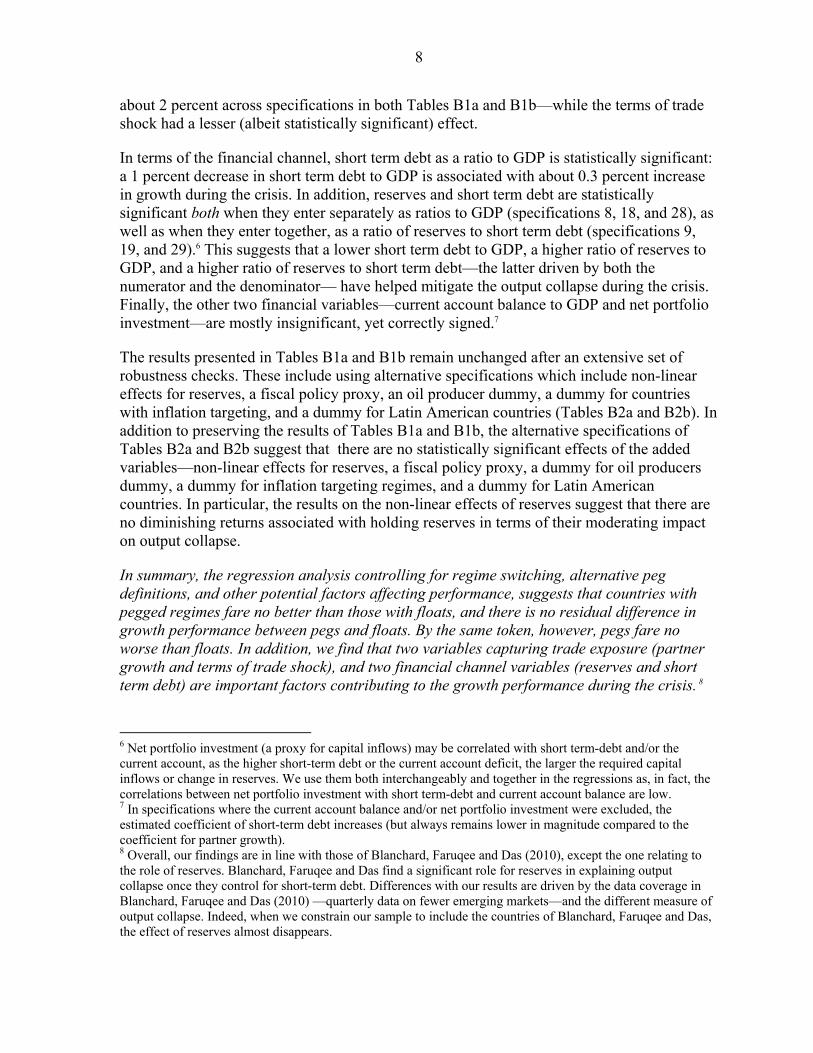
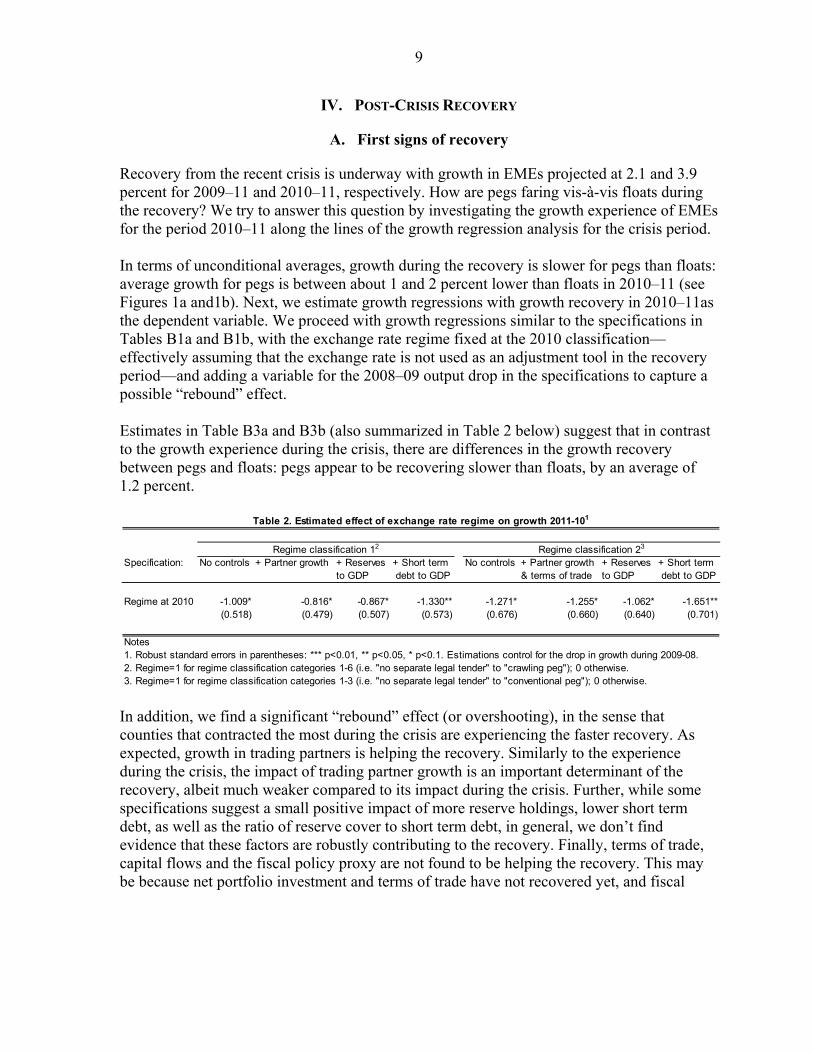
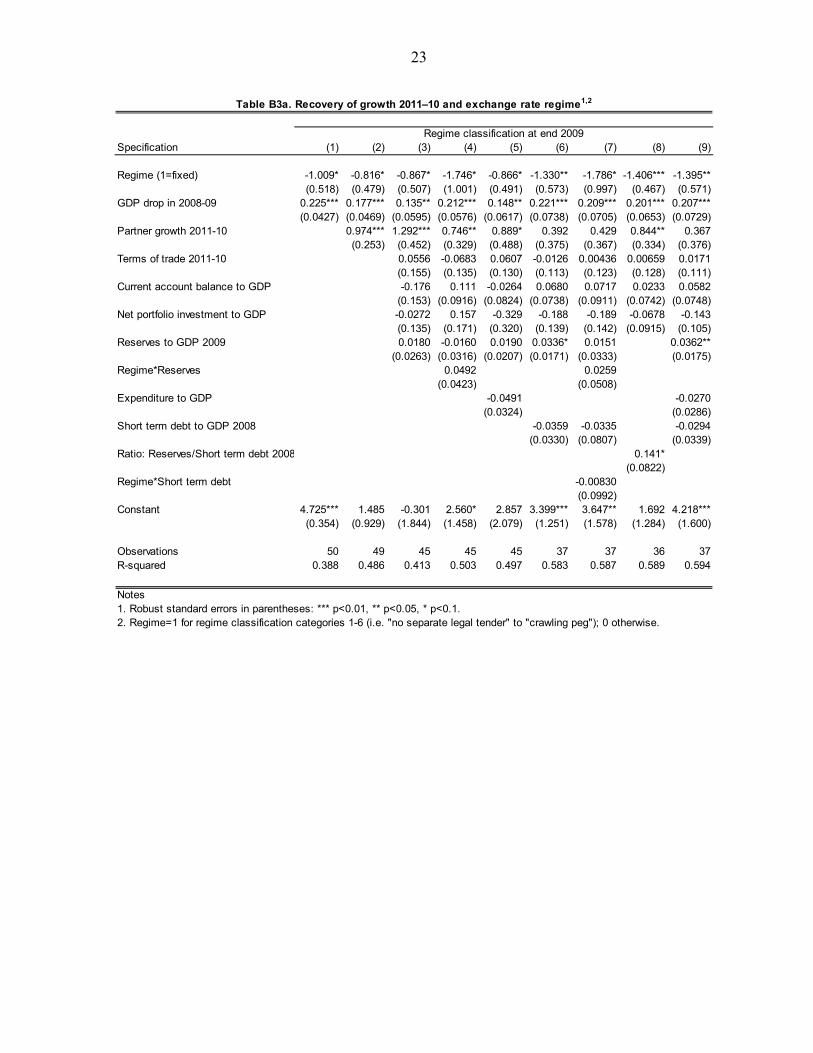
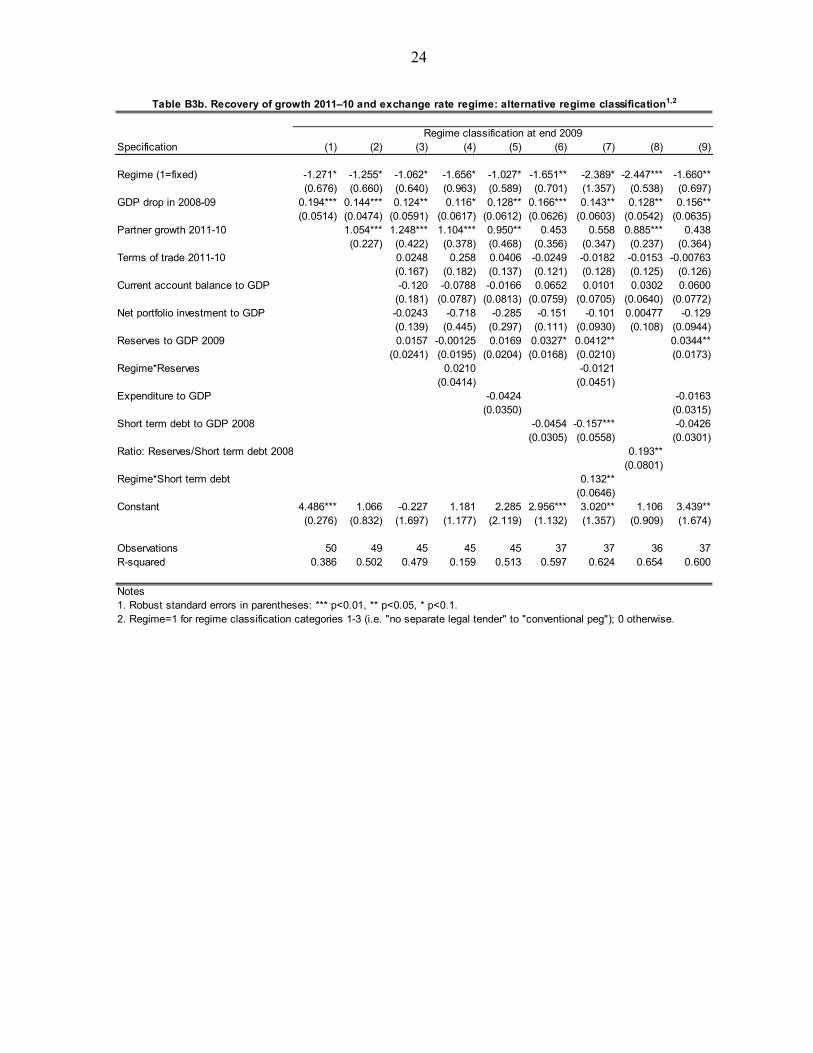
Recovery from the recent crisis is underway with growth in EMEs projected at 2.1 and 3.9 percent for 2009–11 and 2010–11, respectively. How are pegs faring vis-à-vis floats during the recovery? We try to answer this question by investigating the growth experience of EMEs for the period 2010–11 along the lines of the growth regression analysis for the crisis period. In terms of unconditional averages, growth during the recovery is slower for pegs than floats: average growth for pegs is between about 1 and 2 percent lower than floats in 2010–11 (see Figures 1a and1b). Next, we estimate growth regressions with growth recovery in 2010–11as the dependent variable. We proceed with growth regressions similar to the specifications in Tables B1a and B1b, with the exchange rate regime fixed at the 2010 classification— effectively assuming that the exchange rate is not used as an adjustment tool in the recovery period—and adding a variable for the 2008–09 output drop in the specifications to capture a possible “rebound” effect. Estimates in Table B3a and B3b (also summarized in Table 2 below) suggest that in contrast to the growth experience during the crisis, there are differences in the growth recovery between pegs and floats: pegs appear to be recovering slower than floats, by an average of 1.2 percent.
In addition, we find a significant “rebound” effect (or overshooting), in the sense that counties that contracted the most during the crisis are experiencing the faster recovery. As expected, growth in trading partners is helping the recovery. Similarly to the experience during the crisis, the impact of trading partner growth is an important determinant of the recovery, albeit much weaker compared to its impact during the crisis. Further, while some specifications suggest a small positive impact of more reserve holdings, lower short term debt, as well as the ratio of reserve cover to short term debt, in general, we don’t find evidence that these factors are robustly contributing to the recovery. Finally, terms of trade, capital flows and the fiscal policy proxy are not found to be helping the recovery. This may be because net portfolio investment and terms of trade have not recovered yet, and fiscal
Specification: No controls + Partner growth + Reserves + Short term No controls + Partner growth + Reserves + Short termto GDP debt to GDP & terms of trade to GDP debt to GDP
Regime at 2010 -1.009* -0.816* -0.867* -1.330** -1.271* -1.255* -1.062* -1.651**(0.518) (0.479) (0.507) (0.573) (0.676) (0.660) (0.640) (0.701)
Notes1. Robust standard errors in parentheses: *** p<0.01, ** p<0.05, * p<0.1. Estimations control for the drop in growth during 2009-08.2. Regime=1 for regime classification categories 1-6 (i.e. "no separate legal tender" to "crawling peg"); 0 otherwise.3. Regime=1 for regime classification categories 1-3 (i.e. "no separate legal tender" to "conventional peg"); 0 otherwise.
Table 2. Estimated effect of exchange rate regime on growth 2011-101
Regime classification 12 Regime classification 23
10
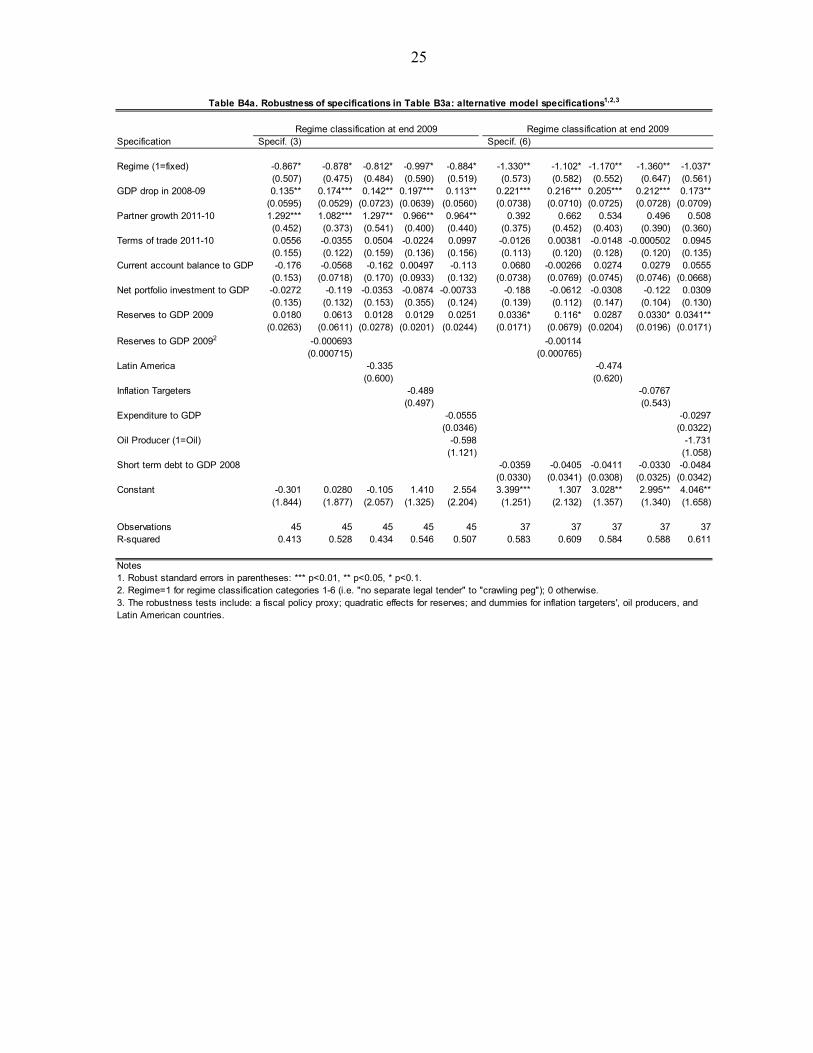
policy may not have been effective yet due to lags in transmission.9 The results presented in Tables B3a and B3b remain unchanged with several robustness checks (including using alternative specifications—see Appendix B Tables B4a and B4b). In summary, in the period of recovery 2011–2010, countries with pegged regimes are estimated be faring worse than those with floats. In addition to a significant rebound effect, we also find that trading partner growth is an important factor contributing to the growth recovery. Finally, adjustment tools (e.g. fiscal policy) have not had enough time to take effect, leaving the exchange rate regime alone to carry the load of the recovery.
B. Role of perceptions
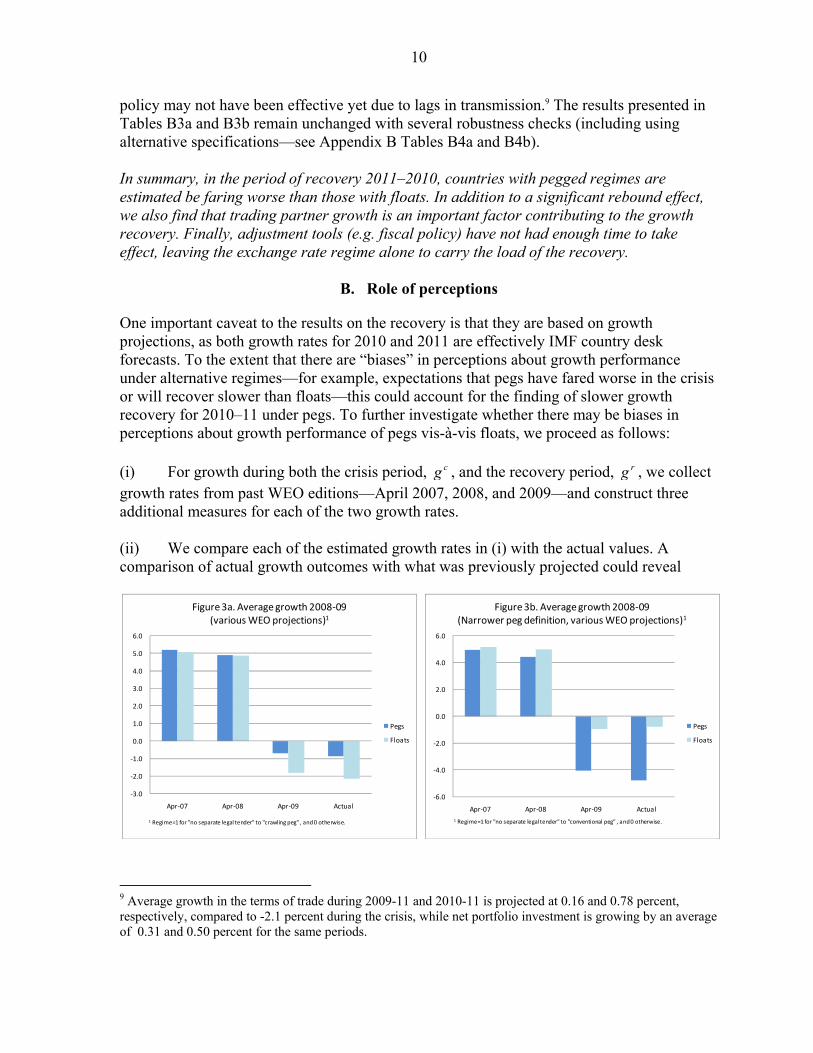
One important caveat to the results on the recovery is that they are based on growth projections, as both growth rates for 2010 and 2011 are effectively IMF country desk forecasts. To the extent that there are “biases” in perceptions about growth performance under alternative regimes—for example, expectations that pegs have fared worse in the crisis or will recover slower than floats—this could account for the finding of slower growth recovery for 2010–11 under pegs. To further investigate whether there may be biases in perceptions about growth performance of pegs vis-à-vis floats, we proceed as follows: (i) For growth during both the crisis period, cg , and the recovery period, rg , we collect growth rates from past WEO editions—April 2007, 2008, and 2009—and construct three additional measures for each of the two growth rates. (ii) We compare each of the estimated growth rates in (i) with the actual values. A comparison of actual growth outcomes with what was previously projected could reveal
9 Average growth in the terms of trade during 2009-11 and 2010-11 is projected at 0.16 and 0.78 percent, respectively, compared to -2.1 percent during the crisis, while net portfolio investment is growing by an average of 0.31 and 0.50 percent for the same periods.
-3.0
-2.0
-1.0
0.0
1.0
2.0
3.0
4.0
5.0
6.0
Apr-07 Apr-08 Apr-09 Actual
Figure 3a. Average growth 2008-09(various WEO projections)1
Pegs
Floats
1 Regime=1 for "no separate legal tender" to "crawling peg" , and 0 otherwise.
-6.0
-4.0
-2.0
0.0
2.0
4.0
6.0
Apr-07 Apr-08 Apr-09 Actual
Figure 3b. Average growth 2008-09(Narrower peg definition, various WEO projections)1
Pegs
Floats
1 Regime=1 for "no separate legal tender" to "conventional peg" , and 0 otherwise.

11
whether there is a tendency to err on one side—say projecting lower growth for pegs—perhaps suggesting a “perception bias”. For the crisis period, Figures 3a and 3b present the unconditional average growth rates for the periods 2008–2009 using the April 2007, April 2008 and April 2009 WEO editions (for both peg classifications). The last column of each figure, which the same as the last column of Figures 1a and 1b, shows the actual estimate. WEO forecasts before the crisis suggest that growth for pegs in 2008–09 was broadly projected to be the same as that of floats. As the crisis intensified, the projected growth differential between pegs and floats increased, and in the end, the actual growth rate differential (Figures B3a and B3b column 4) was about the same as in the one projected in the April 2009 WEO. This suggests that there does not appear to be any “bias” in the growth projections for the crisis period.
Similarly, for the recovery period 2009–10, Figures 4a and 4b show the projected and actual growth rates.10 Again, in WEO estimates before the crisis, the 2009–10 growth rates for pegs and floats were projected to be the same. However, unlike the case of the crisis period, actual growth rates (for both pegs and floats) were underestimated by the April 2009 WEO forecast. In other words, growth in the recovery period for both pegs and floats was better than expected (more for pegs than floats in one classification). We test more formally whether the 2008–09 and 2009–10 estimates are biased using the frequently used Mincer-Zarnowitz (1969) regression. We also modify the specification to include the regime dummy in order to examine possible over/under estimation due to the regime, as follows:
(1) where tA and , 1t tF are the actual and predicted values for time t , with the forecast conditional
on the information available at time 1t . Testing for unbiasedness requires testing the joint
10 For the recovery period in Figures 4a and 4b we do not plot the period 2010–11 as 2011 is still a projection. Instead, 2009–10 was chosen for the recovery in order to have an estimate for the actual.
0.0
1.0
2.0
3.0
4.0
5.0
6.0
Apr-07 Apr-08 Apr-09 Actual
Figure 4a. Average growth 2010-09(Various WEO projections)1
Pegs
Floats
1 Regime=1 for "no separate legal tender" to "crawling peg" , and 0 otherwise.
-2.0
-1.0
0.0
1.0
2.0
3.0
4.0
5.0
6.0
Apr-07 Apr-08 Apr-09 Actual
Figure 4b. Average growth 2010-09(Narrower peg definition, various WEO projections)1
Pegs
Floats
1 Regime=1 for "no separate legal tender" to "conventional peg" , and 0 otherwise.
0 1 , 1 2t t t t tA F Regime
12
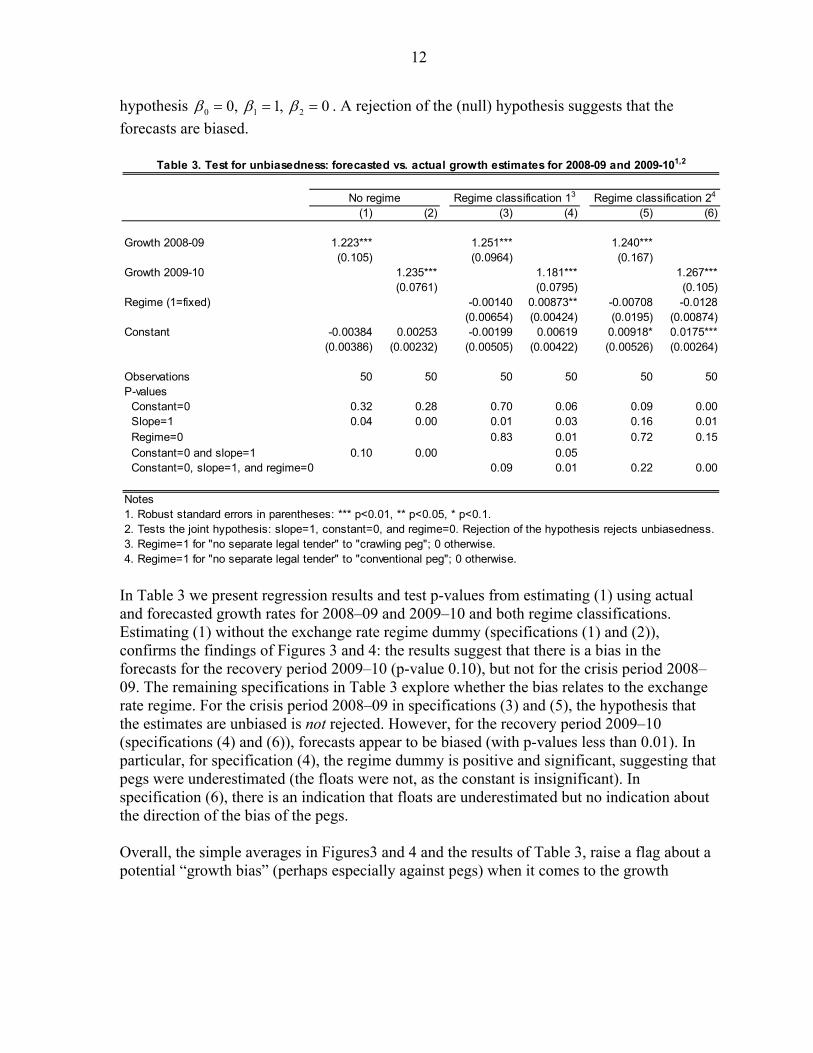
hypothesis 0 1 20, 1, 0 . A rejection of the (null) hypothesis suggests that the
forecasts are biased.
In Table 3 we present regression results and test p-values from estimating (1) using actual and forecasted growth rates for 2008–09 and 2009–10 and both regime classifications. Estimating (1) without the exchange rate regime dummy (specifications (1) and (2)), confirms the findings of Figures 3 and 4: the results suggest that there is a bias in the forecasts for the recovery period 2009–10 (p-value 0.10), but not for the crisis period 2008–09. The remaining specifications in Table 3 explore whether the bias relates to the exchange rate regime. For the crisis period 2008–09 in specifications (3) and (5), the hypothesis that the estimates are unbiased is not rejected. However, for the recovery period 2009–10 (specifications (4) and (6)), forecasts appear to be biased (with p-values less than 0.01). In particular, for specification (4), the regime dummy is positive and significant, suggesting that pegs were underestimated (the floats were not, as the constant is insignificant). In specification (6), there is an indication that floats are underestimated but no indication about the direction of the bias of the pegs. Overall, the simple averages in Figures3 and 4 and the results of Table 3, raise a flag about a potential “growth bias” (perhaps especially against pegs) when it comes to the growth
(1) (2) (3) (4) (5) (6)
Growth 2008-09 1.223*** 1.251*** 1.240***(0.105) (0.0964) (0.167)
Growth 2009-10 1.235*** 1.181*** 1.267***(0.0761) (0.0795) (0.105)
Regime (1=fixed) -0.00140 0.00873** -0.00708 -0.0128(0.00654) (0.00424) (0.0195) (0.00874)
Constant -0.00384 0.00253 -0.00199 0.00619 0.00918* 0.0175***(0.00386) (0.00232) (0.00505) (0.00422) (0.00526) (0.00264)
Observations 50 50 50 50 50 50P-values Constant=0 0.32 0.28 0.70 0.06 0.09 0.00 Slope=1 0.04 0.00 0.01 0.03 0.16 0.01 Regime=0 0.83 0.01 0.72 0.15 Constant=0 and slope=1 0.10 0.00 0.05 Constant=0, slope=1, and regime=0 0.09 0.01 0.22 0.00
Notes1. Robust standard errors in parentheses: *** p<0.01, ** p<0.05, * p<0.1.2. Tests the joint hypothesis: slope=1, constant=0, and regime=0. Rejection of the hypothesis rejects unbiasedness.3. Regime=1 for "no separate legal tender" to "crawling peg"; 0 otherwise.4. Regime=1 for "no separate legal tender" to "conventional peg"; 0 otherwise.
Table 3. Test for unbiasedness: forecasted vs. actual growth estimates for 2008-09 and 2009-101,2
Regime classification 13 Regime classification 24No regime

13
recovery. If this is indeed true, the finding that pegs are recovering slower than floats could be an artifact of the economic projections which predict lower recovery for pegs.11
V. CONCLUSION
This paper assesses the role of the exchange rate regime in explaining how emerging market economies fared in, and are recovering from, the recent global financial crisis. Despite the limitations inherent in using a dataset with a small cross section, using a variety of robustness checks and multiple specifications to control for potential determinants, the paper presents some evicence about the growth experience of pegs for both the crisis and recovery periods. First, during the crisis period, controlling for regime switching, alternative definition to clsssify pegs, and other potential factors affecting growth performance, we find that countries with pegged regimes fare no worse than those with floats. In addition, variables capturing trade exposure—partner growth and the terms of trade shock—and variables proxying the financial channel—reserves and short term debt—are important factors contributing to the growth performance during the crisis. Second, in contrast to the crisis period, during the recovery period 2010–2011, countries with pegged regimes appear to be faring worse than those with floats. In addition to a significant rebound effect from the crisis, the only important factor contributing to the growth recovery is trading partner growth, as adjustment tools like fiscal policy may have not had enough time to take effect. Third, trade and financial linkages amplified the growth collapse during the crisis and trade linkages are currently helping the recovery from the crisis. Finally, given that the results on growth recovery are based on projections, we raise a flag about suggestive evidence of “biases” in perceptions about pegs’ growth performance, which could account for the finding of slower growth recovery for 2010–11 under pegs. The asymmetric effect of the exchange rate regime during the crisis compared to the recovery from the crisis could be explained as follows. During the crisis, some countries moved towards more flexible arrangements—essentially adding the exchange rate in their policy adjustment tools when this instrument was previously forgone. Other good performers in the crisis let their real exchange rates move in the “right” direction—that is, in the direction of reducing initial misalignments—and had better initial conditions in terms of reserve coverage of short-term debt. But, getting out of the crisis appears to be a different story, particularly in light of the fact that—at least so far—external demand has not picked up and has had a much smaller impact compared to during the crisis. In addition, adjustment tools such as fiscal expenditure have had no time to take effect, leaving the exchange rate regime alone to carry the load for the recovery.
11 We are investigating the role of perceptions in a broader research project. It would also be interesting to repeat the exercise once projections of the recovery period are finalized.
14
References Berkmen, P., G. Gelos, R. Rennhack, and J. Walsh (2009) “The Global Financial Crisis:
Explaining Cross-Country Differences in the Output Impact,” IMF Working Paper No.09/280.
Blanchard, O., H. Faruqee, and M. Das (2010) “The Initial Impact of the Crisis on Emerging
Market Countries,” Brookings Papers on Economic Activity. Ghosh, A., M. Chamon, C. Crowe, J. Kim, and J. Ostry (2010) “Coping with the Crisis:
Policy Options for Emerging Market Countries,” IMF Staff Position Note No. 2010/04. Ghosh, A., J. Ostry, and C. Tsangarides (2010) “Exchange Rate Regimes and the Stability of
the International Monetary System,” IMF Occasional Paper No. 270. Habermeier, K., A. Kokenyne, R. Veyrune, and H. Anderson (2009) “Revised System for the
Classification of Exchange Rate Arrangements,” IMF Working Paper No.09/211. International Monetary Fund (2010) “How Did Emerging Markets Cope in the Crisis,” IMF
Policy Paper, June 2010. Mincer, J., and V. Zarnowitz (1969) “The Evaluation of Economic Forecasts,” in: J. Mincer,
ed., Economic Forecasts and Expectations, National Bureau of Economic Research (New York).
Rose, A., and M. Spiegel (2009) “Cross-Country Causes and Consequences of the 2008
Crisis: Early Warning,” NBER Working Paper No. 15357. Taylor, J. (2009) “The Financial Crisis and the Policy Responses: An Empirical Analysis of
What Went Wrong,” NBER Working Paper Series No. 14631.

15
Apppendix A: Data and Summary Statistics
Algeria, Argentina, Armenia, Bosnia & Herzegovina, Brazil, Bulgaria, Chile, China, Colombia, Costa Rica, Croatia, Czech Republic, Dominican Republic, Ecuador, Guatemala, Hungary, Egypt, El Salvador, Estonia, Iceland, India, Indonesia, Israel, Jamaica, Jordan,Kazakhstan, Korea, Latvia, Lebanon, Lithuania, Malaysia, Mexico, Morocco, Pakistan, Panama, Peru, Philippines, Poland, Romania, Russian Federation, Serbia, South Africa, Sri Lanka, Thailand, Tunisia, Turkey, Ukraine, Uruguay, Venezuela, Vietnam.
Category Description Classification 1 Classification 21 Exchange arrangement with no separate legal tender Peg Peg2 Currency board arrangement Peg Peg3 Conventional pegged arrangement Peg Peg4 Stabilized Peg Float5 Pegged exchange rate within horizontal bands Peg Float6 Crawling peg Peg Float7 Crawl like Float Float8 Other managed Float Float9 Floating Float Float10 Free floating Float Float
Variable Description Source
gr_0908 Real growth rate in 2009 IMF, World Economic Outlookgr_0908_0703 Real growth rate in 2011 IMF, World Economic Outlookgr_1110 Real growth rate in 2011 IMF, World Economic Outlookdf_fixed Peg=1 if fixed and =0 if floating IMF, MCM Classificationdf_fixed2 Peg=1 if df<=6 & 0 if df>=7 IMF, MCM Classificationdf_fixed3 Peg=1 if df<=5 & 0 if df>=6 IMF, MCM Classificationdf_fixed4 Peg=1 if df<=3 & 0 if df>=4 IMF, MCM Classificationlrgdp_t_0908 Change in (log of) trade weighted partner real GDP from 2009 to 2008 IMF, World Economic Outlooklrgdp_t_1110 Change in (log of) trade weighted partner real GDP from 2011 to 2010 IMF, World Economic Outlooktt_0908 Change in terms of trade from 2008 to 2009 IMF, World Economic Outlooktt_1110 Change in terms of trade from 2011 to 2010 IMF, World Economic Outlookres_for_gdp Foreign exchange reserves as ratio to GDP IMF, World Economic Outlookbca_gdp Balance on current account as ratio to GDP IMF, World Economic Outlookbfp_gdp Net portfolio investment as ratio to GDP IMF, World Economic Outlookexp_gdp Fiscal expense as ratio to GDP IMF, World Economic Outlookstd_gdp Short-term external debt as ratio to GDP IMF, World Economic Outlooklac Dummy=1 for Latin American country IMF, World Economic Outlookoil Dummy=1 for oil exporter IMF, World Economic Outlookitar Dummy=1 for inflation targeting regime IMF, World Economic Outlook
Countries in the sample
Exchange Rate Regime Classification based on the revised IMF de facto classification system 2009-)1
Table A1. Dataset: Variables, definitions, and classifications
Variable Definitions and Sources

16
Variable Mean Std. Deviation
gr_0908_0703 -7.78 6.91gr_1110 3.92 2.26lrgdp_t_0908 -2.49 2.00lrgdp_t_1110 3.20 0.78tt_0908 -2.05 18.60tt_1110 -0.62 2.15res_for_gdp_2006 21.15 13.47res_for_gdp_2009 24.17 18.75bca_gdp -1.00 5.63bfp_gdp 0.04 3.01exp_gdp 33.30 9.67L2.std_gdp 9.01 10.05L2.res_std 7.32 22.95
Table A2. Summary Statistics
Full VEE Sample
17
Figure A1. Growth 2008–09 relative to 2003–07 by country
-30 -20 -10 0 10Growth rate 2009-2008 vs. 2007-2003, in percent
LatviaArmeniaLithuaniaUkraineEstonia
Russian FederationRomania
IcelandTurkey
BulgariaVenezuela, Rep. Bol.
CroatiaMexico
HungaryCzech Republic
Serbia, Republic ofBosnia & Herzegovina
KazakhstanArgentinaThailand
Costa RicaMalaysia
El SalvadorSouth Africa
ChilePeru
ColombiaPanamaJordan
JamaicaPhilippines
EcuadorBrazil
Korea, Republic ofIsrael
GuatemalaPoland
IndiaChina,P.R.: Mainland
Sri LankaPakistanVietnam
Dominican RepublicTunisia
UruguayAlgeria
IndonesiaEgypt
MoroccoLebanon

18
Figure A2. Bivariate relationships: growth during the crisis and potential determinants
-.08
-.06
-.04
-.02
0.0
2G
row
th r
ate
2009
-200
8 vs
. 200
7-20
03
-.3 -.2 -.1 0 .1Partner growth 2009-08
Bivariate regress ion R- squared=0.493
020
4060
80G
row
th r
ate
2009
-200
8 vs
. 200
7-20
03
-.3 -.2 -.1 0 .1Reserves to GDP 2006
Bivariate regress ion R- squared=0.016
020
4060
Gro
wth
rat
e 20
09-2
008
vs. 2
007-
2003
-.3 -.2 -.1 0 .1Short term debt to GDP 2006
Bivariate regress ion R- squared=0.274
-10
-50
510
Gro
wth
rat
e 20
09-2
008
vs. 2
007-
2003
-.3 -.2 -.1 0 .1Net portfolio investment to GDP
Bivariate regress ion R-squared=0.009
-100
-50
050
Gro
wth
rat
e 00
9-20
08 v
s. 2
007-
2003
-.3 -.2 -.1 0 .1Terms of trade 2009-08
Bivariate regress ion R- squared=0.044
-20
-10
010
20G
row
th r
ate
2009
-200
8 vs
. 200
7-20
03
-.3 -.2 -.1 0 .1Current account balance to GDP
Bivariate regress ion R-squared=0.015
020
040
060
080
010
00G
row
th r
ate
2009
-200
8 vs
. 200
7-20
03
-.3 -.2 -.1 0 .1Ratio of reserves to short term debt 2006
Bivariate regression R-squared=0.054
010
0020
0030
0040
00G
row
th r
ate
2009
-200
8 vs
. 200
7-20
03
-.3 -.2 -.1 0 .1Reserves to GDP 2006 squared
Quadratic fit R-squared=0.045

19
Appendix B: Tables and Robustness Checks
Specification (1) (2) (3) (4) (5) (6) (7) (8) (9) (10)
Regime (1=fixed) 0.894 1.544 1.883 1.058 1.403 1.511 -0.437 2.325 1.708 -0.205(2.053) (1.383) (1.484) (1.398) (1.381) (1.448) (2.463) (1.513) (1.471) (2.245)
Partner growth 2009-08 2.286*** 2.359*** 2.286*** 2.266*** 2.326*** 2.283*** 1.535** 2.095*** 0.685(0.476) (0.508) (0.451) (0.482) (0.473) (0.488) (0.687) (0.635) (0.569)
Terms of trade 2009-08 0.0429 0.0487 0.0649*** 0.0455 0.0669*** 0.0640*** 0.0684*** 0.0555** 0.0673***(0.0325) (0.0307) (0.0246) (0.0304) (0.0229) (0.0223) (0.0228) (0.0227) (0.0226)
Current account balance to GDP 0.168 0.0573 0.0584 0.0430 -0.0883 -0.116(0.223) (0.174) (0.217) (0.177) (0.156) (0.116)
Net portfolio investment to GDP -0.0108 0.606 0.704 1.432 0.811 0.427(0.394) (0.507) (0.557) (1.037) (0.576) (0.426)
Reserves to GDP 2006 0.0217 0.00618 -0.0484 0.145* 0.0821(0.0533) (0.0582) (0.0971) (0.0757) (0.132)
Regime*Reserves 0.0993 0.0639(0.126) (0.149)
Short term debt to GDP 2006 -0.274*** -0.518(0.0961) (0.380)
Ratio: Reserves/Short term debt 2006 0.391***(0.140)
Regime*Short term debt 0.186(0.372)
Constant -8.178*** -2.392** -2.246* -2.225* -2.809* -2.455 -1.570 -4.665*** -4.389*** -3.561**(1.139) (1.146) (1.266) (1.172) (1.526) (1.705) (2.176) (1.792) (1.628) (1.705)
Observations 50 48 47 45 47 45 45 37 35 37R-squared 0.004 0.531 0.461 0.560 0.533 0.523 0.512 0.421 0.532 0.653
Specification (11) (12) (13) (14) (15) (16) (17) (18) (19) (20)
Regime (1=fixed) -2.429 -1.398 -1.541 -0.907 -1.628 -1.214 -3.517 -0.879 -1.691 -3.565(2.194) (1.453) (1.391) (1.441) (1.393) (1.361) (2.315) (1.346) (1.595) (2.387)
Partner growth 2009-08 2.166*** 2.155*** 2.225*** 2.130*** 2.173*** 2.144*** 0.877* 1.894*** 0.942*(0.417) (0.385) (0.400) (0.396) (0.374) (0.381) (0.530) (0.516) (0.491)
Terms of trade 2009-08 0.0393 0.0371 0.0627*** 0.0442* 0.0591** 0.0615** 0.0657*** 0.0471* 0.0650***(0.0302) (0.0286) (0.0240) (0.0252) (0.0255) (0.0262) (0.0251) (0.0257) (0.0242)
Current account balance to GDP -0.0547 -0.0855 -0.0590 -0.153 -0.205* -0.153(0.143) (0.118) (0.139) (0.129) (0.106) (0.113)
Net portfolio investment to GDP 0.355 0.221 0.234 0.122 0.423 0.423(0.374) (0.341) (0.342) (0.376) (0.313) (0.321)
Reserves to GDP 2006 0.0419 0.00880 -0.0622 0.0937** 0.0583(0.0524) (0.0563) (0.0719) (0.0468) (0.0712)
Regime*Reserves 0.118 0.0999(0.106) (0.102)
Short term debt to GDP 2006 -0.288*** -0.338*(0.0674) (0.193)
Ratio: Reserves/Short term debt 2006 0.370**(0.144)
Regime*Short term debt 0.0580(0.207)
Constant -6.813*** -1.402 -1.370 -1.500 -2.219* -1.719 -0.531 -3.606*** -3.401** -2.472(0.938) (1.060) (1.016) (1.112) (1.313) (1.497) (1.724) (1.157) (1.325) (1.637)
Observations 50 48 47 45 47 45 45 36 35 36R-squared 0.030 0.528 0.548 0.564 0.536 0.596 0.599 0.609 0.554 0.622
Specification (21) (22) (23) (24) (25) (26) (27) (28) (29) (30)
Regime (1=fixed) -1.503 0.469 0.309 0.339 0.545 -0.0357 -1.575 1.282 0.934 -2.718(2.602) (1.566) (1.586) (1.622) (1.618) (1.609) (2.827) (1.446) (1.792) (2.698)
Partner growth 2009-08 2.278*** 2.241*** 2.299*** 2.300*** 2.131*** 2.081*** 1.089* 1.798*** 0.519(0.440) (0.415) (0.439) (0.468) (0.443) (0.455) (0.633) (0.655) (0.675)
Terms of trade 2009-08 0.0596** 0.0553** 0.0601** 0.0596** 0.0555** 0.0521** 0.0642** 0.0499* 0.0661**(0.0261) (0.0278) (0.0263) (0.0280) (0.0263) (0.0260) (0.0268) (0.0296) (0.0270)
Current account balance to GDP -0.0896 -0.127 -0.134 -0.137 -0.0861 -0.0617(0.132) (0.120) (0.157) (0.102) (0.134) (0.133)
Net portfolio investment to GDP -0.0293 0.848* 0.865* 0.581 -0.0818 0.312(0.384) (0.484) (0.499) (0.492) (0.442) (0.310)
Reserves to GDP 2006 -0.0134 0.0582 0.0218 0.119** 0.0558(0.0548) (0.0574) (0.0809) (0.0599) (0.138)
Regime*Reserves 0.0694 0.136(0.116) (0.163)
Short term debt to GDP 2006 -0.279*** -0.536(0.0795) (0.413)
Ratio: Reserves/Short term debt 2006 0.437*(0.256)
Regime*Short term debt 0.200(0.395)
Constant -7.473*** -2.391** -2.430** -2.197* -2.071 -3.884** -3.326 -5.144*** -5.083*** -3.290**(0.908) (1.070) (1.046) (1.142) (1.497) (1.974) (2.135) (1.503) (1.907) (1.615)
Observations 41 40 39 38 39 38 38 31 30 31R-squared 0.012 0.572 0.590 0.572 0.571 0.544 0.544 0.631 0.500 0.662
Notes1. Robust standard errors in parentheses: *** p<0.01, ** p<0.05, * p<0.1.2. Regime=1 for regime classification categories 1-6 (i.e. "no separate legal tender" to "crawling peg"); 0 otherwise.
Current regime classification
Regime classification at end 2007
Excluding switchers
Table B1a. Growth 2008–09 relative to 2003–07 and exchange rate regime1,2
20
Specification (1) (2) (3) (4) (5) (6) (7) (8) (9) (10)
Regime (1=fixed) -4.880** -2.444 -2.471 -2.262 -2.471 -2.078 0.0857 -1.656 -2.147 0.149(2.367) (1.828) (1.772) (1.914) (1.901) (1.674) (2.340) (2.039) (1.782) (2.602)
Partner growth 2009-08 2.102*** 2.122*** 2.133*** 2.083*** 2.136*** 2.139*** 1.653** 1.947*** 1.003*(0.380) (0.374) (0.404) (0.389) (0.363) (0.336) (0.649) (0.485) (0.560)
Terms of trade 2009-08 0.0359 0.0365 0.0581* 0.0399 0.0574* 0.0596** 0.0588** 0.0449 0.0640**(0.0339) (0.0328) (0.0321) (0.0320) (0.0303) (0.0301) (0.0293) (0.0306) (0.0290)
Current account balance to GDP 0.0258 -0.0448 -0.0993 -0.0618 -0.200* -0.234(0.156) (0.132) (0.156) (0.137) (0.115) (0.146)
Net portfolio investment to GDP -0.292 0.344 0.156 1.436 0.702 0.351(0.459) (0.417) (0.336) (0.896) (0.470) (0.341)
Reserves to GDP 2006 0.0323 0.00665 0.0221 0.148** 0.150*(0.0526) (0.0531) (0.0489) (0.0733) (0.0788)
Regime*Reserves -0.107 -0.122(0.131) (0.159)
Short term debt to GDP 2006 -0.216** -0.441*(0.0946) (0.262)
Ratio: Reserves/Short term debt 2006 0.415***(0.141)
Regime*Short term debt 0.201(0.286)
Constant -6.809*** -1.639 -1.535 -1.604 -2.313 -1.830 -2.147 -3.660** -3.672*** -3.593**(1.058) (0.981) (1.022) (1.049) (1.427) (1.457) (1.465) (1.755) (1.378) (1.656)
Observations 50 48 47 45 47 45 45 37 35 36R-squared 0.081 0.539 0.530 0.528 0.544 0.590 0.615 0.427 0.552 0.629
Specification (11) (12) (13) (14) (15) (16) (17) (18) (19) (20)
Regime (1=fixed) -4.880** -2.444 -2.482 -2.080 -2.471 -2.118 0.323 -0.627 -2.190 -0.209(2.367) (1.828) (1.741) (1.703) (1.901) (1.666) (2.082) (1.765) (1.770) (2.796)
Partner growth 2009-08 2.102*** 2.098*** 2.155*** 2.083*** 2.125*** 2.129*** 1.066* 1.988*** 1.071*(0.380) (0.361) (0.365) (0.389) (0.357) (0.333) (0.545) (0.481) (0.565)
Terms of trade 2009-08 0.0359 0.0343 0.0588** 0.0399 0.0559* 0.0589* 0.0636** 0.0436 0.0620**(0.0339) (0.0330) (0.0297) (0.0320) (0.0312) (0.0305) (0.0294) (0.0309) (0.0297)
Current account balance to GDP -0.0422 -0.0836 -0.133 -0.179* -0.219** -0.246*(0.138) (0.107) (0.116) (0.0987) (0.105) (0.136)
Net portfolio investment to GDP 0.271 0.197 0.117 0.465 0.838* 0.480(0.354) (0.319) (0.286) (0.363) (0.507) (0.402)
Reserves to GDP 2006 0.0323 -0.00156 0.0239 0.104** 0.158**(0.0526) (0.0518) (0.0460) (0.0479) (0.0746)
Regime*Reserves -0.119 -0.120(0.113) (0.158)
Short term debt to GDP 2006 -0.271*** -0.448*(0.0780) (0.258)
Ratio: Reserves/Short term debt 2006 0.437***(0.154)
Regime*Short term debt 0.217(0.278)
Constant -6.809*** -1.639 -1.636* -1.617 -2.313 -1.701 -2.224 -3.848*** -3.664*** -3.554**(1.058) (0.981) (0.950) (1.018) (1.427) (1.465) (1.443) (1.289) (1.389) (1.681)
Observations 50 48 47 45 47 45 45 36 35 36R-squared 0.081 0.539 0.554 0.579 0.544 0.605 0.623 0.603 0.544 0.624
Specification (21) (22) (23) (24) (25) (26) (27) (28) (29) (30)
Regime (1=fixed) -4.880** -2.444 -2.492 -2.250 -2.471 -2.034 0.512 -1.168 -2.080 1.163(2.367) (1.828) (1.716) (1.892) (1.901) (1.701) (2.027) (1.840) (1.892) (2.474)
Partner growth 2009-08 2.102*** 2.075*** 2.135*** 2.083*** 2.081*** 2.086*** 1.377** 1.756*** 0.837(0.380) (0.345) (0.399) (0.389) (0.375) (0.321) (0.581) (0.509) (0.556)
Terms of trade 2009-08 0.0359 0.0322 0.0582* 0.0399 0.0543* 0.0567* 0.0615** 0.0474 0.0669**(0.0339) (0.0323) (0.0319) (0.0320) (0.0301) (0.0296) (0.0284) (0.0333) (0.0293)
Current account balance to GDP -0.108 -0.157* -0.223** -0.106 -0.201** -0.268***(0.114) (0.0907) (0.0885) (0.113) (0.0849) (0.0977)
Net portfolio investment to GDP -0.253 0.720 0.438 0.975 0.138 0.0397(0.444) (0.469) (0.342) (0.664) (0.324) (0.372)
Reserves to GDP 2006 0.0323 0.0364 0.0508 0.127** 0.141*(0.0526) (0.0491) (0.0386) (0.0623) (0.0776)
Regime*Reserves -0.126 -0.153(0.106) (0.139)
Short term debt to GDP 2006 -0.243*** -0.448*(0.0819) (0.252)
Ratio: Reserves/Short term debt 2006 0.328**(0.133)
Regime*Short term debt 0.193(0.279)
Constant -6.809*** -1.639 -1.734* -1.605 -2.313 -2.659* -2.951** -3.709** -3.806*** -3.777**(1.058) (0.981) (0.913) (1.040) (1.427) (1.591) (1.411) (1.448) (1.346) (1.637)
Observations 50 48 47 45 47 45 45 37 36 37R-squared 0.081 0.539 0.571 0.536 0.544 0.559 0.621 0.540 0.542 0.634
Notes1. Robust standard errors in parentheses: *** p<0.01, ** p<0.05, * p<0.1.2. Regime=1 for regime classification categories 1-3 (i.e. "no separate legal tender" to "conventional peg"); 0 otherwise.
Table B1b. Growth 2008–09 relative to 2003–07 and exchange rate regime: alternative regime classification1,2
Current regime classification
Regime classification at end 2007
Excluding switchers

21
Specification Specif. (6) Specif. (8)
Regime (1=fixed) 1.511 1.363 1.025 1.180 1.335 2.008 2.325 2.693** 2.357 2.362 1.861 3.076(1.448) (1.461) (1.439) (1.513) (1.541) (1.674) (1.513) (1.121) (1.566) (1.571) (2.473) (1.964)
Partner growth 2009-08 2.326*** 2.279*** 2.165*** 2.192*** 2.263*** 2.296*** 1.535** 0.400 1.413** 1.148* 2.034*** 2.058**(0.473) (0.514) (0.568) (0.573) (0.518) (0.473) (0.687) (0.620) (0.677) (0.670) (0.764) (0.857)
Terms of trade 2009-08 0.0669*** 0.0656*** 0.0603*** 0.0505* 0.0704*** 0.0659*** 0.0684*** 0.0670*** 0.0686** 0.0297 0.0733** 0.0656***(0.0229) (0.0235) (0.0233) (0.0297) (0.0263) (0.0210) (0.0228) (0.0203) (0.0275) (0.0303) (0.0368) (0.0252)
Current account balance to GDP 0.0573 0.0443 -0.0346 -0.0247 0.0336 0.0407 0.0430 -0.108 0.00485 -0.124 0.147 0.141(0.174) (0.175) (0.170) (0.174) (0.176) (0.183) (0.177) (0.120) (0.186) (0.123) (0.249) (0.248)
Net portfolio investment to GDP 0.606 0.458 0.431 0.386 0.673 0.636 1.432 0.0517 1.215 1.110 2.419** 2.429**(0.507) (0.392) (0.298) (0.278) (0.528) (0.465) (1.037) (0.333) (0.897) (1.004) (1.209) (1.188)
Reserves to GDP 2006 0.00618 -0.0579 0.00948 0.00266 0.0258 0.0199 0.145* -0.179 0.134** 0.143** 0.215* 0.218**(0.0582) (0.197) (0.0563) (0.0576) (0.0805) (0.0579) (0.0757) (0.178) (0.0639) (0.0703) (0.113) (0.0854)
Reserves to GDP 20092 0.00100 0.00469(0.00351) (0.00324)
Expenditure to GDP -0.0407 -0.0389 0.00334 -0.0567(0.106) (0.107) (0.149) (0.143)
Oil Producer (1=Oil) -1.243 -3.621(1.735) (2.420)
Latin America 0.626 1.051(1.972) (3.648)
Inflation Targeters 1.062 2.319(1.899) (2.103)
Short term debt to GDP 2006 -0.274*** -0.351*** -0.284*** -0.295*** -0.229* -0.233*(0.0961) (0.0667) (0.0939) (0.0889) (0.134) (0.136)
Constant -2.455 -1.762 -1.388 -1.212 -3.101 -3.402 -4.665*** -2.931* -4.779 -3.349 -5.475* -6.423***(1.705) (2.190) (2.744) (2.648) (2.686) (2.274) (1.792) (1.642) (4.170) (3.908) (3.041) (2.316)
Observations 45 45 45 45 45 45 37 36 37 37 37 37R-squared 0.523 0.547 0.577 0.580 0.521 0.527 0.421 0.664 0.492 0.569 -0.032 -0.019
Specification Specif. (13) Specif. (15)
Regime (1=fixed) -1.214 -1.334 -1.539 -1.532 -1.367 -1.213 -0.879 -0.700 -1.482 -1.055 -1.185 -0.795(1.361) (1.423) (1.413) (1.494) (1.368) (1.425) (1.346) (1.382) (1.530) (1.681) (1.433) (1.297)
Partner growth 2009-08 2.173*** 2.066*** 1.876*** 1.867*** 2.060*** 2.172*** 0.877* 0.0514 0.450 0.334 0.800 0.902*(0.374) (0.421) (0.492) (0.490) (0.412) (0.375) (0.530) (0.861) (0.457) (0.452) (0.534) (0.513)
Terms of trade 2009-08 0.0591** 0.0570** 0.0491** 0.0468 0.0675** 0.0591** 0.0657*** 0.0637** 0.0430* 0.0335 0.0752** 0.0656***(0.0255) (0.0253) (0.0227) (0.0316) (0.0280) (0.0254) (0.0251) (0.0271) (0.0250) (0.0301) (0.0294) (0.0250)
Current account balance to GDP -0.0855 -0.0923 -0.126 -0.133 -0.0935 -0.0867 -0.153 -0.154 -0.251** -0.260** -0.158 -0.151(0.118) (0.121) (0.110) (0.108) (0.118) (0.122) (0.129) (0.147) (0.110) (0.118) (0.130) (0.129)
Net portfolio investment to GDP 0.221 0.229 0.233 0.245 0.279 0.216 0.122 -0.465 -0.0196 -0.168 0.225 0.174(0.341) (0.336) (0.268) (0.255) (0.344) (0.343) (0.376) (0.666) (0.299) (0.387) (0.362) (0.370)
Reserves to GDP 2006 0.00880 -0.116 0.0335 0.0347 0.0430 0.00868 0.0937** -0.330 0.126** 0.116* 0.138** 0.0999*(0.0563) (0.177) (0.0589) (0.0581) (0.0752) (0.0584) (0.0468) (0.257) (0.0567) (0.0670) (0.0692) (0.0540)
Reserves to GDP 20092 0.00229 0.00720(0.00311) (0.00440)
Expenditure to GDP -0.0917 -0.0948 -0.183 -0.183(0.0960) (0.0967) (0.137) (0.146)
Oil Producer (1=Oil) -0.228 -1.423(2.205) (2.412)
Latin America 1.354 1.721(1.680) (1.857)
Inflation Targeters 0.0107 0.358(1.415) (1.463)
Short term debt to GDP 2006 -0.288*** -0.341*** -0.268*** -0.286*** -0.285*** -0.285***(0.0674) (0.0873) (0.0570) (0.0588) (0.0665) (0.0663)
Constant -1.719 -0.677 0.223 0.287 -2.971 -1.722 -3.606*** -0.550 0.486 0.616 -5.141** -3.852***(1.497) (1.940) (2.340) (2.285) (2.389) (1.839) (1.157) (2.150) (3.226) (3.367) (2.200) (1.486)
Observations 45 45 45 45 45 45 36 36 36 37 36 36R-squared 0.596 0.602 0.623 0.625 0.601 0.597 0.609 0.591 0.667 0.662 0.622 0.611
Specification Specif. (20) Specif. (22)
Regime (1=fixed) -0.0357 -0.264 1.550 1.628 -1.367 -1.213 1.282 1.701 0.307 1.066 -1.185 -0.795(1.609) (1.701) (2.035) (2.151) (1.368) (1.425) (1.446) (1.350) (1.692) (1.921) (1.433) (1.297)
Partner growth 2009-08 2.131*** 2.019*** 2.785*** 2.798*** 2.060*** 2.172*** 1.089* 0.422 0.492 0.451 0.800 0.902*(0.443) (0.511) (0.804) (0.809) (0.412) (0.375) (0.633) (0.815) (0.641) (0.620) (0.534) (0.513)
Terms of trade 2009-08 0.0555** 0.0547** 0.0801*** 0.0771** 0.0675** 0.0591** 0.0642** 0.0668*** 0.0436 0.0266 0.0752** 0.0656***(0.0263) (0.0267) (0.0292) (0.0358) (0.0280) (0.0254) (0.0268) (0.0246) (0.0316) (0.0339) (0.0294) (0.0250)
Current account balance to GDP -0.127 -0.130 0.253 0.253 -0.0935 -0.0867 -0.137 -0.165 -0.275* -0.253 -0.158 -0.151(0.120) (0.123) (0.244) (0.243) (0.118) (0.122) (0.102) (0.117) (0.149) (0.160) (0.130) (0.129)
Net portfolio investment to GDP 0.848* 0.893* 0.453 0.427 0.279 0.216 0.581 0.0701 0.426 0.371 0.225 0.174(0.484) (0.521) (0.389) (0.387) (0.344) (0.343) (0.492) (0.424) (0.408) (0.411) (0.362) (0.370)
Reserves to GDP 2006 0.0582 -0.0586 -0.0239 -0.0275 0.0430 0.00868 0.119** -0.174 0.155** 0.143* 0.138** 0.0999*(0.0574) (0.206) (0.0789) (0.0790) (0.0752) (0.0584) (0.0599) (0.230) (0.0779) (0.0858) (0.0692) (0.0540)
Reserves to GDP 20092 0.00218 0.00482(0.00344) (0.00389)
Expenditure to GDP 0.121 0.121 -0.202 -0.189(0.152) (0.151) (0.201) (0.212)
Oil Producer (1=Oil) -0.343 -2.351(1.759) (2.609)
Latin America 1.354 1.721(1.680) (1.857)
Inflation Targeters 0.0107 0.358(1.415) (1.463)
Short term debt to GDP 2006 -0.279*** -0.334*** -0.270*** -0.292*** -0.285*** -0.285***(0.0795) (0.0842) (0.0677) (0.0666) (0.0665) (0.0663)
Constant -3.884** -2.942 -5.063 -4.971 -2.971 -1.722 -5.144*** -2.951 -0.562 -0.582 -5.141** -3.852***(1.974) (2.455) (3.894) (3.822) (2.389) (1.839) (1.503) (2.051) (4.486) (4.521) (2.200) (1.486)
Observations 38 38 38 38 45 45 31 31 31 31 36 36R-squared 0.544 0.537 0.482 0.483 0.601 0.597 0.631 0.652 0.670 0.679 0.622 0.611
Notes1. Robust standard errors in parentheses: *** p<0.01, ** p<0.05, * p<0.1.2. Regime=1 for regime classification categories 1-6 (i.e. "no separate legal tender" to "crawling peg"); 0 otherwise.3. The robustness tests include: a fiscal policy proxy; quadratic effects for reserves; and dummies for inflation targeters', oil producers, and Latin American countries
Table B2a. Robustness of specifications in Table B1a: alternative model specifications1,2,3
Current regime classification
Regime classification at end 2007
Excluding switchers

22
Specification Specif. (6) Specif. (8)
Regime (1=fixed) -2.078 -2.297 -2.329 -2.307 -2.585 -2.180 -1.656 -1.218 -1.638 -1.507 -2.495 -1.478(1.674) (1.772) (1.590) (1.595) (1.741) (1.847) (2.039) (1.879) (1.792) (1.864) (2.047) (2.129)
Partner growth 2009-08 2.136*** 2.009*** 1.860*** 1.871*** 1.946*** 2.137*** 1.653** 1.234* 1.318** 1.177* 1.519** 1.621***(0.363) (0.415) (0.460) (0.459) (0.400) (0.361) (0.649) (0.670) (0.661) (0.700) (0.617) (0.622)
Terms of trade 2009-08 0.0574* 0.0547* 0.0481* 0.0467 0.0694** 0.0566* 0.0588** 0.0598** 0.0476* 0.0232 0.0719** 0.0591**(0.0303) (0.0307) (0.0281) (0.0359) (0.0312) (0.0307) (0.0293) (0.0286) (0.0289) (0.0380) (0.0331) (0.0289)
Current account balance to GDP -0.0448 -0.0503 -0.0834 -0.0787 -0.0575 -0.0587 -0.0618 -0.112 -0.141 -0.249*** -0.0862 -0.0754(0.132) (0.138) (0.126) (0.129) (0.133) (0.141) (0.137) (0.129) (0.139) (0.0905) (0.137) (0.132)
Net portfolio investment to GDP 0.344 0.313 0.367 0.340 0.476 0.241 1.436 0.950 1.192 1.200 1.542* 1.395(0.417) (0.371) (0.281) (0.258) (0.440) (0.363) (0.896) (0.742) (0.753) (0.975) (0.854) (0.850)
Reserves to GDP 2006 0.00665 -0.142 0.0277 0.0249 0.0607 -0.00200 0.148** 0.0224 0.155** 0.167** 0.209*** 0.151**(0.0531) (0.196) (0.0516) (0.0509) (0.0691) (0.0538) (0.0733) (0.240) (0.0640) (0.0717) (0.0778) (0.0723)
Reserves to GDP 20092 0.00267 0.00190(0.00324) (0.00382)
Expenditure to GDP -0.0856 -0.0839 -0.0999 -0.144(0.0949) (0.0956) (0.129) (0.124)
Oil Producer (1=Oil) -0.201 -2.077(2.312) (3.217)
Latin America 2.085 2.653(1.748) (2.160)
Inflation Targeters -0.191 0.395(1.716) (1.911)
Short term debt to GDP 2006 -0.216** -0.250*** -0.215** -0.218** -0.205** -0.219**(0.0946) (0.0875) (0.0860) (0.0863) (0.0963) (0.0936)
Constant -1.830 -0.555 -0.0536 -0.0157 -3.824 -1.573 -3.660** -2.927 -1.510 -0.607 -5.976** -3.946**(1.457) (2.062) (2.281) (2.201) (2.405) (1.988) (1.755) (2.311) (3.094) (2.924) (2.450) (1.993)
Observations 45 45 45 45 45 45 37 37 37 37 37 37R-squared 0.590 0.598 0.613 0.614 0.592 0.598 0.427 0.549 0.524 0.544 0.424 0.442
Specification Specif. (13) Specif. (15)
Regime (1=fixed) -2.118 -2.342 -2.404 -2.394 -2.602 -2.150 -0.627 -1.201 -0.908 -0.509 -1.289 -0.393(1.666) (1.750) (1.558) (1.548) (1.701) (1.819) (1.765) (1.884) (1.537) (1.517) (1.760) (1.941)
Partner growth 2009-08 2.125*** 1.990*** 1.817*** 1.816*** 1.948*** 2.128*** 1.066* 1.221* 0.787 0.661 0.956* 1.079**(0.357) (0.399) (0.420) (0.409) (0.393) (0.359) (0.545) (0.655) (0.539) (0.497) (0.536) (0.510)
Terms of trade 2009-08 0.0559* 0.0529* 0.0455 0.0445 0.0669** 0.0560* 0.0636** 0.0599** 0.0470* 0.0326 0.0740** 0.0637**(0.0312) (0.0313) (0.0284) (0.0368) (0.0324) (0.0312) (0.0294) (0.0286) (0.0277) (0.0321) (0.0327) (0.0289)
Current account balance to GDP -0.0836 -0.0955 -0.121 -0.122 -0.0989 -0.0784 -0.179* -0.111 -0.226** -0.236** -0.202** -0.184*(0.107) (0.108) (0.0962) (0.0912) (0.104) (0.109) (0.0987) (0.129) (0.0978) (0.0961) (0.0998) (0.102)
Net portfolio investment to GDP 0.197 0.195 0.205 0.207 0.276 0.211 0.465 0.934 0.442 0.332 0.549 0.512(0.319) (0.308) (0.245) (0.241) (0.317) (0.321) (0.363) (0.729) (0.312) (0.267) (0.361) (0.355)
Reserves to GDP 2006 -0.00156 -0.154 0.0207 0.0209 0.0462 -0.00190 0.104** 0.0189 0.129*** 0.126** 0.154** 0.117**(0.0518) (0.181) (0.0500) (0.0491) (0.0636) (0.0558) (0.0479) (0.237) (0.0499) (0.0506) (0.0605) (0.0564)
Reserves to GDP 20092 0.00277 0.00195(0.00297) (0.00379)
Expenditure to GDP -0.0966 -0.0975 -0.143 -0.150(0.0848) (0.0850) (0.120) (0.121)
Oil Producer (1=Oil) -0.115 -1.902(2.275) (2.326)
Latin America 1.948 2.125(1.633) (1.824)
Inflation Targeters -0.0874 0.778(1.480) (1.723)
Short term debt to GDP 2006 -0.271*** -0.251*** -0.252*** -0.270*** -0.262*** -0.269***(0.0780) (0.0869) (0.0714) (0.0653) (0.0778) (0.0744)
Constant -1.701 -0.437 0.344 0.373 -3.506 -1.648 -3.848*** -2.903 -0.664 -0.365 -5.723** -4.383**(1.465) (1.967) (2.079) (2.035) (2.287) (1.943) (1.289) (2.282) (2.718) (2.654) (2.281) (1.831)
Observations 45 45 45 45 45 45 36 37 36 36 36 36R-squared 0.605 0.613 0.632 0.632 0.616 0.603 0.603 0.552 0.646 0.660 0.614 0.604
Specification Specif. (20) Specif. (22)
Regime (1=fixed) -2.034 -2.242 -2.313 -2.301 -2.602 -2.150 -1.168 -1.086 -0.983 -0.693 -1.289 -0.393(1.701) (1.743) (1.612) (1.612) (1.701) (1.819) (1.840) (1.848) (1.378) (1.414) (1.760) (1.941)
Partner growth 2009-08 2.081*** 1.962*** 1.888*** 1.860*** 1.948*** 2.128*** 1.377** 1.131* 0.688 0.621 0.956* 1.079**(0.375) (0.426) (0.466) (0.467) (0.393) (0.359) (0.581) (0.687) (0.487) (0.473) (0.536) (0.510)
Terms of trade 2009-08 0.0543* 0.0516* 0.0501* 0.0466 0.0669** 0.0560* 0.0615** 0.0606** 0.0421 0.0262 0.0740** 0.0637**(0.0301) (0.0303) (0.0285) (0.0370) (0.0324) (0.0312) (0.0284) (0.0282) (0.0272) (0.0328) (0.0327) (0.0289)
Current account balance to GDP -0.157* -0.162* -0.0259 -0.0376 -0.0989 -0.0784 -0.106 -0.112 -0.270*** -0.270*** -0.202** -0.184*(0.0907) (0.0939) (0.133) (0.132) (0.104) (0.109) (0.113) (0.128) (0.0768) (0.0773) (0.0998) (0.102)
Net portfolio investment to GDP 0.720 0.682 0.345 0.386 0.276 0.211 0.975 0.822 0.388 0.388 0.549 0.512(0.469) (0.460) (0.281) (0.275) (0.317) (0.321) (0.664) (0.745) (0.401) (0.396) (0.361) (0.355)
Reserves to GDP 2006 0.0364 -0.104 0.0235 0.0280 0.0462 -0.00190 0.127** -0.00598 0.134** 0.136** 0.154** 0.117**(0.0491) (0.189) (0.0547) (0.0533) (0.0636) (0.0558) (0.0623) (0.238) (0.0565) (0.0566) (0.0605) (0.0564)
Reserves to GDP 20092 0.00251 0.00230(0.00304) (0.00382)
Expenditure to GDP -0.0842 -0.0928 -0.178 -0.188*(0.0829) (0.0844) (0.113) (0.113)
Oil Producer (1=Oil) -0.302 -1.966(2.384) (2.487)
Latin America 1.948 2.125(1.633) (1.824)
Inflation Targeters -0.0874 0.778(1.480) (1.723)
Short term debt to GDP 2006 -0.243*** -0.259*** -0.249*** -0.261*** -0.262*** -0.269***(0.0819) (0.0864) (0.0655) (0.0631) (0.0778) (0.0744)
Constant -2.659* -1.450 0.0833 0.223 -3.506 -1.648 -3.709** -2.742 0.0820 0.465 -5.723** -4.383**(1.591) (2.025) (2.078) (2.042) (2.287) (1.943) (1.448) (2.208) (2.578) (2.492) (2.281) (1.831)
Observations 45 45 45 45 45 45 37 37 37 37 36 36R-squared 0.559 0.572 0.598 0.599 0.616 0.603 0.540 0.570 0.659 0.666 0.614 0.604
Notes1. Robust standard errors in parentheses: *** p<0.01, ** p<0.05, * p<0.1.2. Regime=1 for regime classification categories 1-3 (i.e. "no separate legal tender" to "conventional peg"); 0 otherwise.3. The robustness tests include: a fiscal policy proxy; quadratic effects for reserves; and dummies for inflation targeters', oil producers, and Latin American countries
Table B2b. Robustness of specifications in Table B1b: alternative model specifications1,2,3
Excluding switchers
Current regime classification
Regime classification at end 2007
23
Specification (1) (2) (3) (4) (5) (6) (7) (8) (9)
Regime (1=fixed) -1.009* -0.816* -0.867* -1.746* -0.866* -1.330** -1.786* -1.406*** -1.395**(0.518) (0.479) (0.507) (1.001) (0.491) (0.573) (0.997) (0.467) (0.571)
GDP drop in 2008-09 0.225*** 0.177*** 0.135** 0.212*** 0.148** 0.221*** 0.209*** 0.201*** 0.207***(0.0427) (0.0469) (0.0595) (0.0576) (0.0617) (0.0738) (0.0705) (0.0653) (0.0729)
Partner growth 2011-10 0.974*** 1.292*** 0.746** 0.889* 0.392 0.429 0.844** 0.367(0.253) (0.452) (0.329) (0.488) (0.375) (0.367) (0.334) (0.376)
Terms of trade 2011-10 0.0556 -0.0683 0.0607 -0.0126 0.00436 0.00659 0.0171(0.155) (0.135) (0.130) (0.113) (0.123) (0.128) (0.111)
Current account balance to GDP -0.176 0.111 -0.0264 0.0680 0.0717 0.0233 0.0582(0.153) (0.0916) (0.0824) (0.0738) (0.0911) (0.0742) (0.0748)
Net portfolio investment to GDP -0.0272 0.157 -0.329 -0.188 -0.189 -0.0678 -0.143(0.135) (0.171) (0.320) (0.139) (0.142) (0.0915) (0.105)
Reserves to GDP 2009 0.0180 -0.0160 0.0190 0.0336* 0.0151 0.0362**(0.0263) (0.0316) (0.0207) (0.0171) (0.0333) (0.0175)
Regime*Reserves 0.0492 0.0259(0.0423) (0.0508)
Expenditure to GDP -0.0491 -0.0270(0.0324) (0.0286)
Short term debt to GDP 2008 -0.0359 -0.0335 -0.0294(0.0330) (0.0807) (0.0339)
Ratio: Reserves/Short term debt 2008 0.141*(0.0822)
Regime*Short term debt -0.00830(0.0992)
Constant 4.725*** 1.485 -0.301 2.560* 2.857 3.399*** 3.647** 1.692 4.218***(0.354) (0.929) (1.844) (1.458) (2.079) (1.251) (1.578) (1.284) (1.600)
Observations 50 49 45 45 45 37 37 36 37R-squared 0.388 0.486 0.413 0.503 0.497 0.583 0.587 0.589 0.594
Notes1. Robust standard errors in parentheses: *** p<0.01, ** p<0.05, * p<0.1.2. Regime=1 for regime classification categories 1-6 (i.e. "no separate legal tender" to "crawling peg"); 0 otherwise.
Table B3a. Recovery of growth 2011–10 and exchange rate regime1,2
Regime classification at end 2009
24
Specification (1) (2) (3) (4) (5) (6) (7) (8) (9)
Regime (1=fixed) -1.271* -1.255* -1.062* -1.656* -1.027* -1.651** -2.389* -2.447*** -1.660**(0.676) (0.660) (0.640) (0.963) (0.589) (0.701) (1.357) (0.538) (0.697)
GDP drop in 2008-09 0.194*** 0.144*** 0.124** 0.116* 0.128** 0.166*** 0.143** 0.128** 0.156**(0.0514) (0.0474) (0.0591) (0.0617) (0.0612) (0.0626) (0.0603) (0.0542) (0.0635)
Partner growth 2011-10 1.054*** 1.248*** 1.104*** 0.950** 0.453 0.558 0.885*** 0.438(0.227) (0.422) (0.378) (0.468) (0.356) (0.347) (0.237) (0.364)
Terms of trade 2011-10 0.0248 0.258 0.0406 -0.0249 -0.0182 -0.0153 -0.00763(0.167) (0.182) (0.137) (0.121) (0.128) (0.125) (0.126)
Current account balance to GDP -0.120 -0.0788 -0.0166 0.0652 0.0101 0.0302 0.0600(0.181) (0.0787) (0.0813) (0.0759) (0.0705) (0.0640) (0.0772)
Net portfolio investment to GDP -0.0243 -0.718 -0.285 -0.151 -0.101 0.00477 -0.129(0.139) (0.445) (0.297) (0.111) (0.0930) (0.108) (0.0944)
Reserves to GDP 2009 0.0157 -0.00125 0.0169 0.0327* 0.0412** 0.0344**(0.0241) (0.0195) (0.0204) (0.0168) (0.0210) (0.0173)
Regime*Reserves 0.0210 -0.0121(0.0414) (0.0451)
Expenditure to GDP -0.0424 -0.0163(0.0350) (0.0315)
Short term debt to GDP 2008 -0.0454 -0.157*** -0.0426(0.0305) (0.0558) (0.0301)
Ratio: Reserves/Short term debt 2008 0.193**(0.0801)
Regime*Short term debt 0.132**(0.0646)
Constant 4.486*** 1.066 -0.227 1.181 2.285 2.956*** 3.020** 1.106 3.439**(0.276) (0.832) (1.697) (1.177) (2.119) (1.132) (1.357) (0.909) (1.674)
Observations 50 49 45 45 45 37 37 36 37R-squared 0.386 0.502 0.479 0.159 0.513 0.597 0.624 0.654 0.600
Notes1. Robust standard errors in parentheses: *** p<0.01, ** p<0.05, * p<0.1.2. Regime=1 for regime classification categories 1-3 (i.e. "no separate legal tender" to "conventional peg"); 0 otherwise.
Table B3b. Recovery of growth 2011–10 and exchange rate regime: alternative regime classification1,2
Regime classification at end 2009
25
Specification Specif. (3) Specif. (6)
Regime (1=fixed) -0.867* -0.878* -0.812* -0.997* -0.884* -1.330** -1.102* -1.170** -1.360** -1.037*(0.507) (0.475) (0.484) (0.590) (0.519) (0.573) (0.582) (0.552) (0.647) (0.561)
GDP drop in 2008-09 0.135** 0.174*** 0.142** 0.197*** 0.113** 0.221*** 0.216*** 0.205*** 0.212*** 0.173**(0.0595) (0.0529) (0.0723) (0.0639) (0.0560) (0.0738) (0.0710) (0.0725) (0.0728) (0.0709)
Partner growth 2011-10 1.292*** 1.082*** 1.297** 0.966** 0.964** 0.392 0.662 0.534 0.496 0.508(0.452) (0.373) (0.541) (0.400) (0.440) (0.375) (0.452) (0.403) (0.390) (0.360)
Terms of trade 2011-10 0.0556 -0.0355 0.0504 -0.0224 0.0997 -0.0126 0.00381 -0.0148 -0.000502 0.0945(0.155) (0.122) (0.159) (0.136) (0.156) (0.113) (0.120) (0.128) (0.120) (0.135)
Current account balance to GDP -0.176 -0.0568 -0.162 0.00497 -0.113 0.0680 -0.00266 0.0274 0.0279 0.0555(0.153) (0.0718) (0.170) (0.0933) (0.132) (0.0738) (0.0769) (0.0745) (0.0746) (0.0668)
Net portfolio investment to GDP -0.0272 -0.119 -0.0353 -0.0874 -0.00733 -0.188 -0.0612 -0.0308 -0.122 0.0309(0.135) (0.132) (0.153) (0.355) (0.124) (0.139) (0.112) (0.147) (0.104) (0.130)
Reserves to GDP 2009 0.0180 0.0613 0.0128 0.0129 0.0251 0.0336* 0.116* 0.0287 0.0330* 0.0341**(0.0263) (0.0611) (0.0278) (0.0201) (0.0244) (0.0171) (0.0679) (0.0204) (0.0196) (0.0171)
Reserves to GDP 20092 -0.000693 -0.00114(0.000715) (0.000765)
Latin America -0.335 -0.474(0.600) (0.620)
Inflation Targeters -0.489 -0.0767(0.497) (0.543)
Expenditure to GDP -0.0555 -0.0297(0.0346) (0.0322)
Oil Producer (1=Oil) -0.598 -1.731(1.121) (1.058)
Short term debt to GDP 2008 -0.0359 -0.0405 -0.0411 -0.0330 -0.0484(0.0330) (0.0341) (0.0308) (0.0325) (0.0342)
Constant -0.301 0.0280 -0.105 1.410 2.554 3.399*** 1.307 3.028** 2.995** 4.046**(1.844) (1.877) (2.057) (1.325) (2.204) (1.251) (2.132) (1.357) (1.340) (1.658)
Observations 45 45 45 45 45 37 37 37 37 37R-squared 0.413 0.528 0.434 0.546 0.507 0.583 0.609 0.584 0.588 0.611
Notes1. Robust standard errors in parentheses: *** p<0.01, ** p<0.05, * p<0.1. 2. Regime=1 for regime classification categories 1-6 (i.e. "no separate legal tender" to "crawling peg"); 0 otherwise.3. The robustness tests include: a fiscal policy proxy; quadratic effects for reserves; and dummies for inflation targeters', oil producers, andLatin American countries.
Table B4a. Robustness of specifications in Table B3a: alternative model specifications1,2,3
Regime classification at end 2009Regime classification at end 2009

26
Specification Specif. (3) Specif. (6)
Regime (1=fixed) -1.062* -1.088* -1.016* -1.141* -1.117* -1.651** -1.604** -1.599** -1.640** -1.362*(0.640) (0.615) (0.564) (0.690) (0.573) (0.701) (0.700) (0.691) (0.753) (0.769)
GDP drop in 2008-09 0.124** 0.167*** 0.185*** 0.144** 0.133** 0.166*** 0.175*** 0.161** 0.162** 0.144**(0.0591) (0.0600) (0.0574) (0.0625) (0.0632) (0.0626) (0.0607) (0.0630) (0.0634) (0.0631)
Partner growth 2011-10 1.248*** 1.076*** 0.989*** 1.131*** 0.747** 0.453 0.724* 0.566 0.539 0.474(0.422) (0.364) (0.328) (0.419) (0.370) (0.356) (0.392) (0.365) (0.359) (0.375)
Terms of trade 2011-10 0.0248 0.0214 0.0289 -0.00568 -0.0546 -0.0249 -0.00529 -0.0308 -0.0206 0.00552(0.167) (0.121) (0.126) (0.156) (0.130) (0.121) (0.125) (0.132) (0.122) (0.163)
Current account balance to GDP -0.120 0.0313 0.0628 -0.0568 0.0912 0.0652 -0.00562 0.0291 0.0313 0.0723(0.181) (0.0679) (0.0622) (0.156) (0.0904) (0.0759) (0.0728) (0.0746) (0.0741) (0.0750)
Net portfolio investment to GDP -0.0243 -0.00335 -0.0244 -0.0232 -0.161 -0.151 0.00371 0.0379 -0.0292 0.259(0.139) (0.0962) (0.102) (0.138) (0.100) (0.111) (0.116) (0.163) (0.102) (0.327)
Reserves to GDP 2009 0.0157 0.0470 0.000923 0.0141 0.00971 0.0327* 0.130** 0.0299 0.0333* 0.0362*(0.0241) (0.0521) (0.0175) (0.0208) (0.0166) (0.0168) (0.0531) (0.0212) (0.0188) (0.0189)
Reserves to GDP 20092 -0.000493 -0.00135**(0.000578) (0.000614)
Latin America -0.500 -0.293(0.549) (0.576)
Inflation Targeters -0.209 0.107(0.449) (0.486)
Expenditure to GDP -0.0168 -0.0192(0.0321) (0.0386)
Oil Producer (1=Oil) -1.509 -1.574(1.229) (0.971)
Short term debt to GDP 2008 -0.0454 -0.0444 -0.0444 -0.0409 -0.0549(0.0305) (0.0304) (0.0278) (0.0298) (0.0349)
Constant -0.227 0.383 1.543 0.379 2.268 2.956*** 0.745 2.595** 2.494** 3.473**(1.697) (1.624) (1.062) (1.601) (1.791) (1.132) (1.690) (1.132) (1.153) (1.754)
Observations 45 45 45 45 44 37 37 37 37 36R-squared 0.479 0.546 0.534 0.529 0.526 0.597 0.630 0.584 0.595 0.528
Notes1. Robust standard errors in parentheses: *** p<0.01, ** p<0.05, * p<0.1.2. Regime=1 for regime classification categories 1-3 (i.e. "no separate legal tender" to "conventional peg"); 0 otherwise.3. The robustness tests include: a fiscal policy proxy; quadratic effects for reserves; and dummies for inflation targeters', oil producers, andLatin American countries.
Table B4b. Robustness of specifications in Table B3b: alternative model specifications1,2,3
Regime classification at end 2009Regime classification at end 2009


