Page 1
1
Review Draft
Criteria for Evaluating the Sustainability and Social
Responsibility of Property Investments
By Gary Pivo, MRP, PhD
Professor of Planning
Professor of Natural Resources
Senior Fellow, Office of Economic Development
The University of Arizona
Author Contact Information:
Harvill Hall, Room 341D, University of Arizona
Tucson, AZ 85721-0076
Phone: 1+ 520.621.9597, FAX: 1+ 520.621.9820
Email: [email protected]
March 10, 2007
In review for publication in
Building Research and Information
Word Count: 6,449
Page 2
2
Criteria for Evaluating the Sustainability and Social
Responsibility of Property Investments
Abstract
This paper helps define Sustainable and Responsible Property Investing
(SRPI) by using the Delphi method to prioritize criteria for the triple bottom line
evaluation of property investments. An international panel from the real estate and
social investing sectors evaluated 66 criteria in terms of materiality to investors and
importance to the public interest. A moderate to strong level of consensus was
achieved. Top ranked criteria based on materiality, the public interest, and both were
energy efficiency and conservation, high level of public transport services, transit
oriented development, daylight and natural ventilation, and contribution to higher
density, mixed-use walkable places. There were few to no significant differences
among the panelists by industry, gender or nationality. Factor analysis uncovered 10
dimensions underlying the criteria. Based on this analysis, the panel would
emphasize the creation of less auto-dependent and more energy efficient cities
where worker well-being and urban revitalization are priorities. LEED® green building
rating tools were compared to the results and found to be much stronger on
environmental criteria than social concerns. The results can guide SRPI portfolio
audits, database development, third party assessments of property companies,
strategic consulting, development of corporate reporting standards, SRPI certification
procedures, updated green building assessment tools, and cost-benefit studies to
help guide asset managers.
Page 3
3
Introduction
The goal of this paper is to help clarify and define Sustainable and
Responsible Property Investing (SRPI). In particular, it presents the results of
an effort to prioritize the criteria that should be used in the triple bottom line
evaluation of property investments.
The term “triple-bottom line” is attributed to John Elkington, co-founder
of the business consultancy SustainAbility (Brown, et al. 2006). It refers to
the social, environmental, and financial results of business practices.
According to KPMG (2005), 68 percent of the top 250 companies of the
Fortune 500 produce sustainability reports on their social, environmental and
economic performance.
Interest has been growing in the application of triple bottom line
methods to property investing. Recently, the Principles for Responsible
Investment (PRI) were developed by the UN Global Compact and the UN
Environment Programme Finance Initiative (2006). They provide investors
with a framework for considering social, environmental, and corporate
governance issues. To help with their development, Pivo and McNamara
(2005) prepared a brief on how the Principles could apply to property
investments. The idea that social responsibility could apply to property
investing was not entirely new. It had been raised before by Mansley 2000,
McNamara 2000, Robinson 2001, and Newell and Acheampong 2002, and
has been examined since by Lutzkendorf and Lorenz (2005) and Pivo (2005).
However, Pivo and McNamara’s brief raised its salience among PRI
Page 4
4
signatories and sparked the creation of the United Nations Environment
Programme Finance Initiative (UNEPFI) Property Working Group in 2006.
Meanwhile, in the USA, the socially responsible investment (SRI)
industry had also become interested in property as an asset class. The topic
was the focus of break-out sessions at the 2005 and 2006 SRI industry
annual conferences, as well as articles on leading SRI web sites (Baue
2005a, Baue 2005b). This brought about the Responsible Property
Investment Project (RPIP), a cooperative effort of the Institute for Responsible
Investment at Boston College and the University of Arizona. Somewhat
similar to the UNEPFI initiative, the RPIP includes a working group composed
of leading North American real estate investors, asset managers, and SRI
companies.
A key recommendation that emerged from the first convening of the
RPIP was that metrics are needed to help investors define and identify
responsible property investments (Wood and Pivo, 2006). The group also felt
the criteria should be ranked both in terms of their materiality to investors and
their importance to the public interest. A similar call has been heard in the UK
over the past few years, caused by the complexity of surveys being received
by property companies requesting information on their SRPI activities
(Barrett, 2003, Ritblat 2003, Estates Gazette 2006).
Materiality and the public interest are two distinct dimensions which
can be used to rate the importance of SRPI criteria. Materiality refers to facts
about an investment that are important to investors when making investment
Page 5
5
decisions (Hall 2004). The energy efficiency of a property portfolio, for
instance, is material since energy prices or regulations can affect financial
performance. Public interest, on the other hand, pertains to ethical issues and
externalities relevant to the general welfare. The energy efficiency of property
is of public interest because it affects air pollution and global warming, which
raise broader ethical, social, and environmental issues important to members
of society. Thus, for separate reasons, criteria for SRPI can be evaluated for
their importance to both materiality and the public interest.
This paper is a direct response to these recent calls for better SRPI
metrics. It reports the findings of a systematic effort to prioritize social and
environmental criteria, considering both materiality and the public interest. It
employs the Delphi Method – a structured group interaction that proceeds
through "rounds" of opinion collection and feedback. The most recognized
book on the subject was edited by Linstone and Turoff (2002). Other useful
reviews include Fischer (1978), Schmidt (1997), Okoli and Pawloski (2004),
and Keeney et al. (2006). The method has been used since the early 1950's
when it was developed at the RAND Corporation as a way to avoid some the
biases that can come from face-to-face discussions, such as the influence of
dominant individuals. Each round is composed of a written survey followed
by feedback to the respondents of the statistical scores for each survey
question. After each round, the respondents are surveyed again to determine
whether their opinions have shifted after seeing the statistical results from the
prior round(s). As a result of the process, there is typically a convergence of
Page 6
6
opinion. Usually, after 3 or 4 rounds, the convergence ends and a stabilized
group opinion emerges. This group opinion may reflect agreement,
disagreement or some of each.
Methods
Survey Process
The survey was conducted in 3 rounds. In the first round, 92
individuals were invited to participate and 51 (55%) accepted the invitation.
Those who participated in the first and second rounds were asked to
participate in the next round. Forty-nine agreed to go on to the second round
and 43 agreed to go on to the third round.
For the first round, prospective panelists were contacted by email and
sent an invitation to participate, an explanation of the study process and a
hyperlink to the survey instrument, which could be completed on-line.
Reminders were sent to those who did not respond approximately 1 and 2
weeks after the initial invitation. Invitations to the second round were sent by
email one month after the start of Round 1. The panel’s median responses
and frequency tables from Round 1 were included. Reminders to participate
were sent at 2 and 3 week intervals. Invitations to the third round were
emailed about two months into the study along with median responses and
frequency tables from Round 2. Reminders followed 2 and 4 weeks later.
Page 7
7
Panel Composition
Invitations to participate in Round 1 went to individuals with a prior
professional interest in SRPI, in particular those who had either attended a
session on Responsible Property Investing at the 2005 SRI in the Rockies
Conference, attended a two-day conference on the topic co-hosted in 2006 by
the University of Arizona and Boston College, or enrolled in the Responsible
Property Investing ListServ hosted by the University of Arizona.
As noted above, 51 individuals participated in at least one round of the
process. The panelists had a variety of different professional backgrounds.
They included real estate, socially responsible investing, government,
banking, law, foundations, universities, or organized labor. Most (88%) were
US residents but some came from Canada, the UK, Germany, and Australia.
The group was highly accomplished. Seventy-five percent held masters,
professional or doctoral degrees, they averaged 22 years of professional
experience, and most held senior positions in their organizations with titles
such as President, Vice-President, Chairman, Director, Chief Operating
Officer, Chief Financial Officer, and Professor. The group was gender
balanced, though less racially diverse than the general population.
Survey Instrument
The survey asked each panelist to rate a list of criteria, separately in
terms of their importance to materiality and the public interest. Each rating
was done on a scale of 1 to 5, with 1 being least and 5 being most important.
The criteria touched on a variety of topics related to the sustainability
Page 8
8
and responsibility of property investing including property location (e.g.,
central location), performance (e.g., energy efficiency), physical attributes
(e.g., accommodations for the disabled) or management (e.g., use of fair
labor practices). The criteria were largely drawn from existing sources
including Sayce and Ellison (2003a), Sayce and Ellison (2003b), Ellison and
Smith (2004), Kimmet and Boyd (2004), Sayce, Upstream (2004), Boyd
(2005), Boyd and Kimmet (2005), Pivo and McNamara (2005), Sustainable
Property Appraisal Project (2005), and Hermes Real Estate (2006).
In Round 1, the panel was asked to rate 54 criteria. They also were
invited to offer additional criteria for subsequent rounds. This resulted in a
total of 66 criteria for Rounds 2 and 3.
As described above, for Rounds 2 and 3 the panelists were given the
median results and a frequency distribution for responses from the prior
round. They were asked to keep these scores in mind, since the goal was to
work toward consensus, and to give the median group score if they wished to
agree with the group as a whole. They were also invited to disagree if they so
desired.
Results
Level of Consensus Achieved
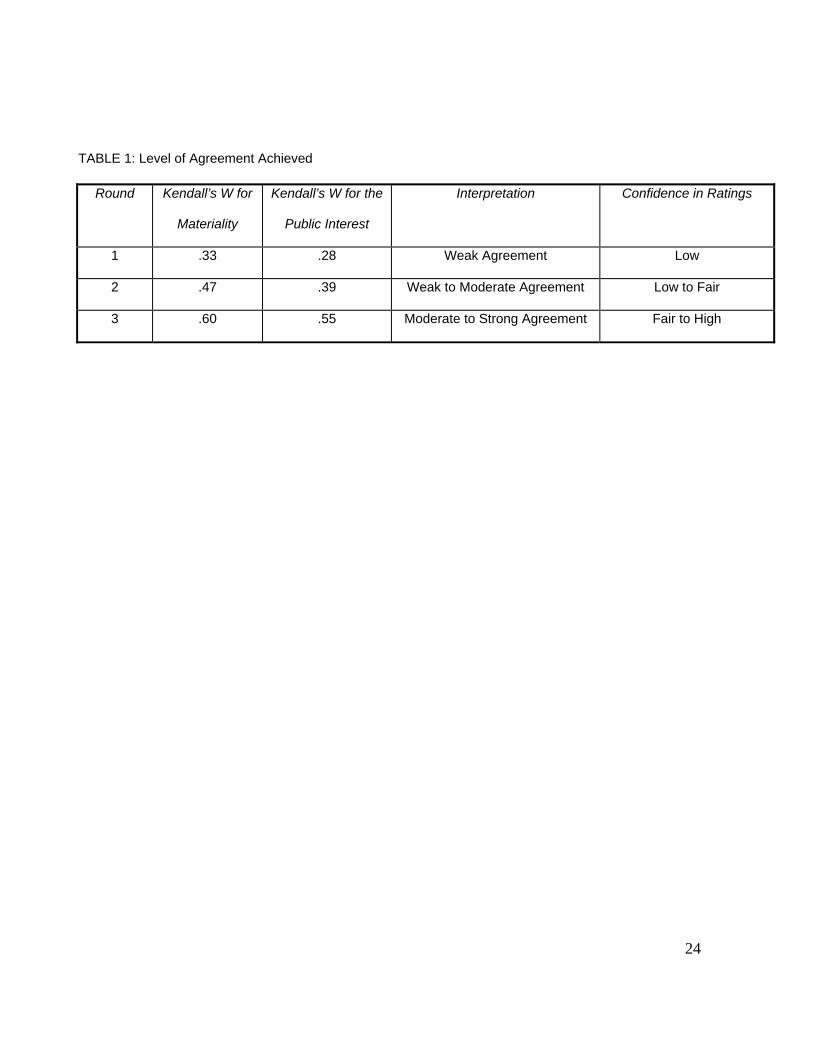
Table 1 gives the level of consensus achieved as measured by
Kendall’s Coefficient of Concordance (Kendall’s W) and the related
interpretation of the scores as suggested by Schmidt (1997). A low level of
Page 9
9
agreement was found in Round 1 with higher levels of agreement achieved in
each of the subsequent rounds. By the final round, a moderate to strong level
of agreement was achieved. In each round, there was greater agreement on
the materiality of the criteria than on their importance for the public interest,
though the difference fell to 9% by the final round.
Because the increment for improvement in Kendall’s W was as high or
higher for Rounds 2 and 3 as for Rounds 1 and 2, it is likely that a stronger
consensus would have been achieved with more rounds. However, the
process was ended after Round 3 because of attrition from the panel between
Rounds 2 and 3 (15%), the time burden on the panelists, and the expectation
that more rounds would not significantly alter the rankings.
Ratings Given
The results achieved after Round 3 are summarized in Table 2. Each
criterion is given in Column 5, just as it was presented to the panelists in the
survey. The mean ratings given by the panel for the materiality and public
interest of each criterion are given in Columns 6 and 7. The mean of these
two scores is given in Column 9. Since both dimensions are viewed as
relevant to the overall importance of each criterion, the criteria are ranked in
Column 1 according to this mean of materiality and public interest (Column 9).
Quartile scores are given in Column 2, also based on the mean of materiality
and public interest. Rankings based on materiality and public interest alone
are given in Columns 3 and 4, respectively. Column 8 gives the difference
between these rankings, which is discussed below. Column 10 gives the
Page 10
10
increment between each item in Column 9 and the next higher score, which
also is discussed below. Grand means for each column appear in the last row
of the table.
According to the panel, the five most important criteria for judging
SRPI, considering both their importance for materiality and the public interest,
are energy efficiency and conservation, high level of public transport services,
central location, transit oriented development, and water conservation and
recycling.
There are a total of 16 criteria in the top quartile. Five of these are
primarily environmental issues (energy and water conservation, alternative
energy, flexibility, and recycling), 3 of these are primarily social issues (worker
productivity, absenteeism/illness, and aesthetics) and 8 of these are related to
both considerations (transport services, central location, transit oriented
development, daylight and ventilation, contributions to walkable places,
regulatory compliance, urban revitalization, open space and plazas).
Fifty-five of the criteria received a combined score (the average of
mean materiality and public interest ratings) of 3.0 or greater. This suggests
that a large number of criteria were considered relatively important by the
panel. An analysis of the increments in Column 9 also suggests certain break
points in the rankings. Overall, the average increment was 0.04. Increments
considerably larger than this occurred after the 1st, 4th, 5th, 15th, 45th, and
48th criteria. This suggests a top tier group composed of a single criterion –
energy efficiency and conservation, a second tier composed of public
Page 11
11
transportation and centrality, and perhaps additional groups broken at these
larger increments.
Analysis of variance was used to determine whether there were
significant differences in the mean ratings given by those in different sectors
(SRI, real estate, consulting, or academic), by gender, or by whether the
respondent was in the US or another country. At a .01 significance level, only
2 differences were found by sector and none by gender, both out of a total of
132 separate ratings (66 criteria on materiality and 66 on the public interest),
or in only 1.2% of all cases. More differences were found when US panelists
were compared to non-US panelists. For 18 of the 132 ratings (13.6%), the
US panelists gave higher scores than the panelists from other countries.
Relationships between Dimensions
The average materiality rating for all the criteria was 2.9 while the
average public interest rating was 3.9. This indicates the panel viewed the
criteria as more important to the public interest than materiality. The average
difference was 0.93 or nearly 20% on a 5-point scale.
Rankings for criteria with a large difference between their materiality
and public interest ratings can change significantly if determined on the basis
of materiality or public interest alone. Columns 3 and 4 give these rankings.
Using materiality alone, the five criteria that improved in ranking the
most were gyms and showers (+22), low risk of natural hazards (+21),
insurance for property visitors (+16), low risk of injury to workers and visitors
(+16), and property and visitor security (+13). Those that got substantially
Page 12
12
demoted included low contributions to global warming (-15), and use of ozone
depleting chemicals (-11). This illustrates how the safety criteria were seen as
more financial issues than public interest ones, while the reverse, perhaps
surprisingly, can be said of global environmental concerns.
When only the public interest was used to rank the criteria, the five that
improved in ranking the most were use of ozone depleting chemicals (+22),
not on prime farmland (+22), environmental restoration projects (+22),
carpooling services (+22), and reduced runoff and nutrient/pesticide
discharge (+22). Those that got substantially lower rankings included central
location (-15), aesthetics, contextual fit, visual blending, and quality public
realm (-12), property and visitor security (-12), and occupant worker
productivity (-10). Here again, we see that certain environmental criteria were
viewed more as public interest issues than material ones while various other
concerns were viewed as less important to the public interest than materiality.
In general, the decision whether to rank in terms of materiality, the
public interest or a combination of the two affected final rankings.
Nevertheless, there were 5 criteria that ranked in the top 10 regardless of
which ranking system was used: energy efficiency and conservation, high
level of public transport services, transit oriented development, daylight and
natural ventilation, and contributes to higher density, mixed-use walkable
places.
Page 13
13
Factor Analysis
Factor analysis was used to summarize the large number of criteria
with a smaller number of factors. It does so by sorting the criteria into groups
which appear to be correlated with a more general common factor or
dimension (Wildt et al., 1978). Ten dimensions were uncovered in the
process, which explained 72.5% of the total variance in the data. In other
words, the 66 criteria could be reduced to 10 general dimensions without a
substantial loss of statistical information.
The results are given in Table 3. The dimensions are ranked in order of
importance using the grand mean for the criteria within them, computed with
their mean materiality and public interest scores. In general, for the panel,
SRPI would first and foremost emphasize the creation of less auto-dependent
and more energy efficient cities and regions in which worker well-being and
urban revitalization are priorities.
Relationship to LEED®
In order to determine how well existing property rating tools might
address these criteria and dimensions, the findings were compared to the
Leadership in Energy and Environmental Design (LEED®) New Construction,
Existing Buildings, and Neighborhood Development rating tools, published by
the U.S. Green Building Council. In general, 45 percent of the criteria in this
study are reasonably well covered by all three tools. Those that are not
directly or indirectly covered by at least one of the tools are listed in Table 4.
Page 14
14
As shown by Table 4, all but one of the component criteria for the top
two dimensions (Less Auto Dependent and Energy Conservation) are
covered by the three LEED® tools examined. Coverage is less complete for
the other eight dimensions. Looked at another way, only 2 of the 15 criteria
(13%) listed in Table 3 as fourth (or top) quartile criteria (building flexibility
and aesthetics) are not in the LEED® tools. However, 7 of the 16 (44%)
criteria in the third (or second highest) quartile are not in LEED®. Overall,
while many of the most highly rated criteria and dimensions are covered by
the LEED® New Construction, Existing Building, and Neighborhood
Development tools, some dimensions and several criteria, particularly those
related to social issues, are not part of the system.
Discussion
Implications
Given the complexity of this topic, it is encouraging that a moderate to
strong degree of consensus was achieved by such a diverse set of panelists.
The scarcity of differences found by sector, gender, and nationality further
support the view that a broad, even global, agreement on SRPI criteria may
be achievable.
When it comes to the ratings themselves, it is unsurprising that, in light
of the recent attention it has received, energy conservation is the most highly
rated issue. In fact several of the criteria in the top quartile have implications
for energy conservation.
Page 15
15
Perhaps the items near the bottom of the list are more surprising,
particularly those related to health and safety. However, it’s important to
understand that a low rating does not imply unimportance. Ratings were
conducted using a relative scale of least to most important, the lowest
average of materiality and public interest was 2.41, and the lowest average
score on public interest alone was just below 3.00. Moreover, nothing
prevents organizations that might be more concerned with worker safety,
such as labor union real estate funds, from putting greater weight on selected
issues. Nonetheless, the question of why some criteria were rated lower or
higher than others remains. Unfortunately, the study was not designed to
answer this question. Perhaps the panel viewed health and safety problems
as events that potentially affect fewer people compared to global warming,
traffic congestion, and urban decline.
The finding that, on average, public interest ratings exceeded
materiality ratings highlights the fact that many issues may be more important
to the public interest than to the financial bottom line. Consequently, as long
as fiduciaries emphasize financial returns, it will probably be necessary to use
regulations and subsidies to fully achieve all public interest priorities.
The factor analysis points to the less complicated common ground
underlying the many different criteria that might be preferred by various
individuals. Even when presented with several dozen potential criteria, the
panel appeared to be fundamentally motivated by 10 underlying dimensions.
While each one can and probably should be measured using a variety of
Page 16
16
criteria, we may be able to simplify the discussion and achieve greater
consensus on the major issues by focusing on these 10 SRPI dimensions.
Finally, it is noteworthy that as far as these findings are concerned,
green building rating tools, at least those that are similar to LEED®, do not
fully overlap with the criteria studied here. Green building tools are weighted
toward the environmental bottom line and not well suited to being the only
metrics used for triple bottom line accounting.
Practical Significance
There are several practical uses for these findings. First, property
investors, fund managers and asset managers can use them to guide their
efforts to further develop the SRPI field. They can be used to plan new funds,
audit current investments, improve corporate sustainability and social
responsibility reports, and plan future acquisitions and refurbishments.
Second, the findings can guide new data development needed to help
investors and managers account for the triple bottom line performance of their
portfolios. For example, two of the world’s leading for-profit property data
organizations, the Investment Property Databank and The CoStar Group, are
exploring ways to add sustainability information to their data products. Third,
existing SRI research organizations, such as Innovest, Sustainable Asset
Management, KLD, and others can use the findings to design their next
generation property sector evaluation criteria which they use to rate property
companies. Similarly, strategic management consultancies that work in the
property field, like Upstream, SustainAbility, and Mercer Investment
Page 17
17
Consulting can use the findings to help property firms become more
sustainable and responsible, particularly those firms associated with or
investing for institutions that are signatories to the Principles for Responsible
Investing or the UN Environment Programme Finance Initiative. Fourth, the
findings can contribute to a global consensus on the elements of a
sustainability report for property companies. This is the objective of a new
project being pursued by the Global Reporting Initiative and that project
should consider these findings as it proceeds. Fifth, it may be possible to use
the findings to inform the creation of a RPI certification process for property
funds and fund managers, similar to the SRI Certification Program offered by
Australia Ethical Investment Association. Sixth, existing green building rating
systems might assess their criteria in light of these findings with an eye
toward addressing social concerns. And finally, there is a need to build an
academic research agenda on SRPI, particularly studies on the financial
costs and benefits associated with making investments that promote energy
conservation, transit oriented development, urban regeneration, childcare and
other SRPI criteria.
Limitations
The most important caveat about these findings is that the Delphi
method does not produce a scientifically valid snapshot of expert opinion on
this matter nor is it designed to do so. Such criticisms of Delphi are nothing
new (Fischer, 1978), but they should be remembered. The panel is not a
random sample of experts and statistics are not used to estimate the reliability
Page 18
18
of their findings. There is no evidence that the opinions of these experts
would be the same as another panel, non-experts, or even themselves at
some future time. Thus, these findings should not be taken as the final word
on the subject. Rather, following Fischer, they should be viewed as data for
the formulation of organizational goals and perhaps as a device for identifying
priorities that could be subject to more scientifically or democratically reliable
methods (e.g., scientific surveys, economic analysis, industry-wide voting,
etc.).
Another limitation is that this study did not cover governance issues.
The Principles for Responsible Investment encourage the consideration of
environmental, social, and governance issues. But following the triple bottom
line approach, which focuses on economic, social and environmental issues,
this study explored new social and environmental criteria only. Nevertheless,
studies of board composition (e.g., Ghosh and Sirmans, 2003) and
executive’s compensation (e.g., Scott et al, 2005) in the property sector
suggest that governance is material to investments and should not be ignored
by analysts as SRPI criteria.
Finally, in order to use the criteria, analysts will need more information
on related measurements, standards, and benchmarks and the economic
costs and benefits of achieving them. With better research along these lines,
it should be possible to determine how far private real estate investors should
be expected to go, with and without government subsidies or regulations,
Page 19
19
toward the creation of more sustainable and responsible property
investments.
Acknowledgements
The author would like to thank the Delphi panelists for their invaluable
contributions to this project.
References
Barrett, C. (2003) The ethics inspectors: Has the need to tick boxes overtaken
the property industry's attempts to become more socially
responsible? Property Week 68(29), July 25, 2003.
Baue, W. (2005a) Wanted: Socially responsible real estate investments.
Social Funds.Com, March 18, 2005.
Baue, W. (2005b) Socially responsible property investing still on the drafting
table. Social Funds.Com, December 29, 2005.
Boyd, T (2005) Assessing the triple bottom line impact of commercial
buildings. In Sidwell, A.C. (ed.), The Queensland University of Technology
Research Week International Conference Proceedings, 4-5 July 2005,
Brisbane, Australia.
Page 20
20
Boyd, T. and Kimmet, P (2005) The triple bottom line approach to property
performance evaluation. Proceedings from the Pacific Rim Real Estate
Society (PRRES) Conference, January 2005, Melbourne University, Australia.
Brown, D, Dillard, J. and Marshall, R., (2006) Triple bottom line: A business
metaphor for a social construct. Document de Treball númber 06/2,
Departament d'Economia de l'Empresa, Universitat Autònoma de Barcelona.
Estates Gazette (2006) RPI: An index for measuring sustainability. Estates
Gazette (Feb 18, 2006): 27.
Fischer, R. (1978) The delphi method: A description, review and criticism. The
Journal of Academic Librarianship 4(2), 64-70.
Ghosh, C and Sirmans, C. F. (2003), Board independence, ownership
structure and performance: Evidence from real estate investment trusts.
Journal of Real Estate Finance and Economics, 26(2-3), 287-318.
Global Compact and UNEP Finance Initiative (2006) Principles for
Responsible Investment. United Nations, New York.
Hall, P (2004) The Plight of the Private Securities Litigation Reform
Act in the Post-Enron Era: The Ninth Circuit’s interpretation of materiality in
Employer-Teamster v. America West. Brigham Young University Law Review,
2004(2), 863-892.
Page 21
21
Hermes Real Estate (2006) Responsible Property Investment: Defining the
Challenge. Hermes Real Estate, London.
Keeney, S., Hasson, F and McKenna, H. (2006) Consulting the oracle: 10
lessons from using the delphi technique in nursing research. Journal of
Advanced Nursing 53(2), 205-212.
Kimmet, P. and Boyd, T (2004) An institutional understanding of triple bottom
line evaluations and the use of social and environmental metrics. Proceedings
from the Pacific Rim Real Estate Society (PRRES) Conference, January
2004, Bangkok, Thailand.
KPMG (2005) KPMG International Survey of Corporate Responsibility
Reporting 2005, KPMG Global Sustainability Services, Amsterdam.
Lutzkendorf, T. and Lorenz, D. (2005) Sustainable property investment:
Valuing sustainable buildings through property performance assessment.
Building Research and Information, 33(3), 212-234.
Linstone, H. and Turoff, M (1975) The delphi method: Techniques and
application. Addison-Welsey, Reading, MA.
Mansley, M (2000) Into the ethics of things. Estates Gazette 47 (Nov. 25,
2000), 170-71.
McNamara (2000) The ethical management of indirect control - an internal
perspective of SRI. Estates Gazette 47(Nov 25, 2000),170-171.
Page 22
22
Newell, G. and Acheampong, P. (2002) The role of property in ethical
managed funds. The Pacific Rim Real Estate Society (PRRES) Conference,
2002, Christchurch, New Zealand.
Okoli, C. and Pawloski, S (2004) The delphi method as a research tool: An
example, design considerations and applications. Information and
Management 42(2004), 15-29.
Pivo, G. (2005) Is there a future for socially responsible property
investments? Real Estate Issues, 2005 (Fall), 16-26.
Ritblat, John (2003) Chairman’s Statement, 2003 Annual Report. The British
Land Company, London.
Sayce, S. and Ellison, L. (2003a) Integrating sustainability into the appraisal
of property worth: identifying appropriate indicators of sustainability. The
American Real Estate and Urban Economics Association Conference, Skye,
Scotland.
Sayce, S and Ellison L. (2003b). Towards sustainability indicators for
commercial property occupiers and investors. The American Real Estate and
Urban Economics Association Conference, Skye, Scotland.
Sayce, S, Ellison, L, and Smith (2004) Incorporating sustainability in
commercial property appraisal: Evidence from the UK. The 11th European
Real Estate Society Conference, June 2004, Milan, Italy.
Page 23
23
Schmidt, R.C. (1997) Managing delphi surveys using nonparametric statistical
techniques. Decision Sciences, 28(3), 763-774.
Scott, J, Anderson, R., and Webb, J (2005), The labor-leisure choice in
executive compensation plans: does too much pay reduce REIT
performance? Journal of Economics and Business, 57(2005), 151-163.
Sustainable Property Appraisal Project (2005) The Sustainability Factors.
Website: http://www.sustainableproperty.ac.uk/sustainability-factors.htm (1 of
7) 5/19/2005 2:27:06 PM
Upstream (2004) Sustainability and the built environment: An agenda for
action. Upstream, London.
Wildt, A.R., Mueller, C.W., and Kim, J. (1978) Introduction to factor analysis:
What it is and how to do it. Sage Publications Inc., Newbury Park.
Wood, D. and Pivo, G. (2006) Real estate and socially responsible
investment: New products, new investment, new value. Conference Report.
Available online at
http://www.bcccc.net/index.cfm?fuseaction=document.showDocumentByID&n
odeID=3&DocumentID=1031.
Page 24
TABLE 1: Level of Agreement Achieved
Round Kendall’s W for
Materiality
Kendall’s W for the
Public Interest
Interpretation Confidence in Ratings
1 .33 .28 Weak Agreement Low
2 .47 .39 Weak to Moderate Agreement Low to Fair
3 .60 .55 Moderate to Strong Agreement Fair to High
24
Page 25
25
TABLE 2: Results, Round 3
(1)
Rank
per (9)
(2)
Quartile
per (9)
(3)
Rank
per
(6)
(4)
Rank
per (7)
(5)
Criteria
Ratings
Analyses
(6)
Materi
ality
(7)
Public
Interest
(8)
Differe
nce
(9)
Mean
(10)
Increm
ent
1 4 2 1 Energy efficiency and conservation 4.56 5.00 -0.44 4.78
2 4 3 2 High level of public transport services 4.14 4.93 -0.79 4.53 0.25
3 4 1 18 Central location 4.91 4.09 0.82 4.50 0.03
4 4 4 5 Transit oriented development 4.09 4.84 -0.75 4.47 0.03
5 4 12 4 Water conservation and recycling 3.67 4.86 -1.19 4.27 0.20
6 4 7 10 Daylight and natural ventilation 3.95 4.35 -0.4 4.15 0.12
7 4 9 9 Contributes to higher density, mixed-
use walkable places 3.86 4.37 -0.51 4.12 0.03
8 4 5 16 Regulatory compliance 4.07 4.12 -0.05 4.09 0.03
9 4 10 11 Benefits urban revitalization 3.84 4.28 -0.44 4.06 0.03
10 4 6 19 Flexibility to adapt to changing uses
over time 4.00 4.07 -0.07 4.03 0.03
11 4 8 21 Occupant worker productivity 3.88 4.02 -0.14 3.95 0.08
12 4 12 18 Minimizes building related absenteeism
and illness 3.67 4.09 -0.42 3.88 0.07
13 4 10 25 Aesthetics, contextual fit, visual
blending, and quality public realm 3.84 3.91 -0.07 3.87 0.01
14 4 22 6 Alternative energy sources used 2.91 4.79 -1.88 3.85 0.02
15 4 13 13 Open space, parks or plazas nearby 3.28 4.19 -0.91 3.73 0.12
Page 26
26
(1)
Rank
per (9)
(2)
Quartile
per (9)
(3)
Rank
per
(6)
(4)
Rank
per (7)
(5)
Criteria
Ratings
Analyses
(6)
Materi
ality
(7)
Public
Interest
(8)
Differe
nce
(9)
Mean
(10)
Increm
ent
16 4 16 10 Recycling, waste reduction, recycled
materials 3.09 4.35 -1.26 3.72 0.01
17 3 13 17 US Environmental Protection Agency
Partnerships: Energy Star, Best
Workplaces for Commuters, Waste
Wise or Combined Heat and Power
programs 3.28 4.10 -0.82 3.69 0.03
17 3 32 3 Low contributions to global warming 2.50 4.88 -2.38 3.69 0.03
18 3 14 18 Catalyzes positive suburban and
peripheral development or
redevelopment 3.16 4.09 -0.93 3.63 0.06
19 3 15 21 Green building certification (LEED®,
BREEAM, etc) 3.12 4.02 -0.9 3.57 0.06
19 3 21 12 Sustainability of building materials 2.93 4.21 -1.28 3.57 0.06
20 3 17 21 Sense of community, sense of place
throughout the building 3.07 4.02 -0.95 3.55 0.02
21 3 17 22 Childcare onsite or close by 3.07 4.00 -0.93 3.53 0.02
21 3 19 18 Accommodations for the disabled 2.98 4.09 -1.11 3.53 0.02
22 3 30 8 Protects or provides wildlife habitat 2.63 4.42 -1.79 3.52 0.01
Page 27
27
(1)
Rank
per (9)
(2)
Quartile
per (9)
(3)
Rank
per
(6)
(4)
Rank
per (7)
(5)
Criteria
Ratings
Analyses
(6)
Materi
ality
(7)
Public
Interest
(8)
Differe
nce
(9)
Mean
(10)
Increm
ent
23 3 15 25 Amenities close by for working parents
(access to food/prepared meals,
laundry, errands, etc.) 3.12 3.91 -0.79 3.51 0.01
23 3 21 18 Brownfield and infill development 2.93 4.09 -1.16 3.51 0.01
24 3 11 36 Property and visitor security 3.79 3.19 0.6 3.49 0.02
24 3 18 23 Engaged in community relations and
development 3.00 3.98 -0.98 3.49 0.02
25 3 23 16 Disclosure and reporting of social and
environmental performance 2.84 4.12 -1.28 3.48 0.01
26 3 21 24 Stakeholder and community
engagement 2.93 3.95 -1.02 3.44 0.04
27 3 21 25 Solicits community input during all
stages of development 2.93 3.91 -0.98 3.42 0.02
27 3 23 22 Affordable housing considerations (for
housing) or access for low-income
owners or minority-owned businesses
for commercial property 2.83 4.00 -1.17 3.42 0.02
28 2 23 24 Tree planting and protection 2.84 3.95 -1.11 3.40 0.02
29 2 26 20 Buffering for wetlands and riparian
areas 2.72 4.05 -1.33 3.38 0.02
30 2 24 27 Engagement on issues with suppliers 2.81 3.86 -1.05 3.34 0.04
Page 28
28
(1)
Rank
per (9)
(2)
Quartile
per (9)
(3)
Rank
per
(6)
(4)
Rank
per (7)
(5)
Criteria
Ratings
Analyses
(6)
Materi
ality
(7)
Public
Interest
(8)
Differe
nce
(9)
Mean
(10)
Increm
ent
30 2 26 24 Fair labor practices for construction and
service workers 2.72 3.95 -1.23 3.34 0.04
30 2 40 7 Use of ozone depleting chemicals
avoided 2.00 4.67 -2.67 3.34 0.04
31 2 25 28 Minimum negative impacts on local
traffic, schools, and other
infrastructure/services 2.79 3.84 -1.05 3.31 0.03
32 2 27 28 No involuntary displacement of homes
and business 2.70 3.84 -1.14 3.27 0.04
33 2 28 28 Considerate construction practices 2.67 3.84 -1.17 3.26 0.01
33 2 30 26 Historic and landmark preservation 2.63 3.88 -1.25 3.26 0.01
34 2 30 26 Native landscaping 2.63 3.88 -1.25 3.25 0.01
35 2 25 31 Use of union construction and service
workers 2.77 3.65 -0.88 3.21 0.04
36 2 34 14 Reduced runoff and nutrient/pesticide
discharge from buildings and
landscaping 2.19 4.16 -1.97 3.17 0.04
37 2 29 32 Protects ridge lines, view sheds 2.65 3.63 -0.98 3.14 0.03
38 2 36 15 Environmental restoration projects 2.09 4.14 -2.05 3.12 0.02
39 2 22 35 Low risk of injuries to workers and
visitors 2.91 3.26 -0.35 3.08 0.04
Page 29
29
(1)
Rank
per (9)
(2)
Quartile
per (9)
(3)
Rank
per
(6)
(4)
Rank
per (7)
(5)
Criteria
Ratings
Analyses
(6)
Materi
ality
(7)
Public
Interest
(8)
Differe
nce
(9)
Mean
(10)
Increm
ent
40 2 18 37 Low risk from natural hazards 3.00 3.14 -0.14 3.07 0.01
41 1 35 24 Use of locally sourced materials 2.16 3.95 -1.79 3.06 0.01
42 1 40 19 Not built on prime farmland 2.00 4.07 -2.07 3.03 0.03
43 1 20 38 Gyms and showers 2.95 3.09 -0.14 3.02 0.01
44 1 34 28 Local and low income hiring and
training 2.19 3.84 -1.65 3.01 0.01
44 1 40 21 Carpooling services 2.00 4.02 -2.02 3.01 0.01
45 1 34 29 Managed to promote multi-racial
respect and participation 2.19 3.81 -1.62 3.00 0.01
46 1 37 30 Bicycle trails and facilities 2.07 3.79 -1.72 2.93 0.07
47 1 33 33 No undue influence by owners in local
planning and zoning 2.26 3.37 -1.11 2.81 0.12
48 1 31 42 Insurance for property visitors 2.60 2.91 -0.31 2.76 0.05
49 1 38 34 Respect for indigenous people's rights,
beliefs and traditions 2.05 3.35 -1.3 2.70 0.06
50 1 38 39 No 'pariah' tenants (e.g., tobacco or
firearms makers) 2.05 3.00 -0.95 2.52 0.18
51 1 38 42 Public art 2.05 2.91 -0.86 2.48 0.04
52 1 41 40 Evacuation and first aid training 1.95 2.98 -1.03 2.47 0.01
53 1 39 43 Access to first aid equipment 2.02 2.88 -0.86 2.45 0.02
54 1 40 43 Health and safety signage 2.00 2.88 -0.88 2.44 0.01
Page 30
30
(1)
Rank
per (9)
(2)
Quartile
per (9)
(3)
Rank
per
(6)
(4)
Rank
per (7)
(5)
Criteria
Ratings
Analyses
(6)
Materi
ality
(7)
Public
Interest
(8)
Differe
nce
(9)
Mean
(10)
Increm
ent
55 1 42 41 Philanthropic endeavors and
volunteering by owners and employees 1.88 2.95 -1.07 2.42 0.02
56 1 41 44 Social Responsibility credentials of the
property mortgagee 1.95 2.86 -0.91 2.41 0.01
GRAND MEANS 2.90 3.90 -0.93 3.40 0.04
Page 31
31
TABLE 3: SRPI Factor Analysis Dimensions and Criteria
Dimension Criteria Sorted by Panel Rating (ratings based on importance to both investment returns and the public interest,
with 5 equal to most and 1 equal to least important)
Grand Mean
4th Quartile (>3.70 out of 5)
3rd Quartile (3.42-3.70 out of 5)
2nd Quartile (3.07-3.41 out of 5)
1st Quartile (2.41-3.06 out of 5)
Less Auto Dependent
Transit Oriented Development, Transit Level of Service, Central Location, Dense Mixed Use & Walkable
Carpooling, Bike Trails & Facilities
4.30
Energy Conservation
Energy Efficiency, Daylight & Ventilation, Renewable Energy
Locally Sourced Materials
4.00
Worker Well-Being
Open Space, Parks & Plazas Nearby
Sense of Community & Place, Childcare, Accommodations for Disabled, Amenities for Working Parents
3.64
Urban Revitalization
Benefits Urban Revitalization, Flexibility to Adapt to Changing Uses
Catalyzes Positive Suburban or Peripheral Development, Brownfield & Infill
Not on Prime Farmland
3.63
Corporate Citizenship
Regulatory Compliance Disclosure & Reporting Engagement w/ Suppliers
3.48
Environmental Protection
Water Conservation, Recycling, Low Contributions to Global Warming
Use of Sustainable Bldg. Materials, Wildlife Habitat
Trees, Wetlands, Ozone, Historic/Cultural, Native Plants, Runoff, Ridges & Views, Eco-Restoration
Public Art 3.38
Local Citizenship
Aesthetics, Fit, Visual Blending & Quality Public Realm
Minimum Local Impacts, No Involuntary Displacement, Considerate Construction, No Undue Influence w/ Local Govt.
3.29
Social Equity and Community Development
Community Relations & Development, Stakeholder Engagement, Solicits Community Input During Development, Affordability
Fair Labor Practices, Union Construction & Service Workers
Local Low-Income Hiring & Training, Promotes Multi-racial Respect, Respect for Indigenous People, Philanthropy & Volunteering
3.28
Credentialing EPA (Govt.) Partner, Green Certified Bldg.
No SRI Pariah Tenants, SRI Mortgagee
3.05
Health and Safety
Property & Visitor Security
Low Risk of Injury, Low Risk from Natural Hazards
Gyms/Showers, Evac. & Aid Training, First Aid Equipment, H&S Signage, Visitor Insurance
2.89
note: grand mean = average of the mean materiality and public interest ratings for the criteria listed within each dimension
Page 32
32
TABLE 4: Criteria Not Well Covered by LEED®
Factor Criteria Not Fully Covered By At Least One of the Following LEED® Tools:
New Construction 2.2, Neighborhood Development Pilot Version, or Existing Buildings 2.0
Auto Dependence
Energy Conservation Locally Sourced Materials
Worker Well-Being Sense of Community and Place, Childcare, Handicapped Accessible, Amenities for Working
Parents
Urban Revitalization Flexibility to Adapt to Changing Uses, Catalyzes Positive Suburban or Peripheral
Development
Corporate Citizenship Disclosure & Reporting
Environmental Protection Historic/Cultural, Ridges and Views, Public Art
Local Citizenship Aesthetics, Displacement, Considerate Construction, Undue Influence
Social Equity and
Community Development
Community Relations & Development, Stakeholder Engagement, Solicits Community Input,
Affordability, Fair Labor Practices, Union, Local Low-Income Training, Promotes Diversity,
Indigenous People, Philanthropy & Volunteering
Credentialing EPA Partner, SRI Pariah Tenants, SRI Mortgagee
Health and Safety Security, Low Risk from Natural Hazards, Gyms/Showers, Risk of Injury, Evac/Aid Training,
First Aid Equipment, H&S Signage, Visitor Insurance