Critical Decisions in the Emergency Department University of Pennsylvania: Brendan G. Carr, MD MS Sage Myers, MD MS Scott Lorch, MD MS Patrick Reilly, MD Dylan Small, PhD Charles C. Branas, PhD Agency for Healthcare Research & Quality Ryan Mutter, PhD
Transcript
Critical Decisions in the Emergency Department
University of Pennsylvania:
Brendan G. Carr, MD MS
Sage Myers, MD MS
Scott Lorch, MD MS
Patrick Reilly, MD
Dylan Small, PhD
Charles C. Branas, PhD
Agency for Healthcare Research & Quality
Ryan Mutter, PhD
How do we design and measure the emergency care system?
(Trauma as a case study)
University of Pennsylvania:
Brendan G. Carr, MD MS
Sage Myers, MD MS
Scott Lorch, MD MS
Patrick Reilly, MD
Dylan Small, PhD
Charles C. Branas, PhD
Agency for Healthcare Research & Quality
Ryan Mutter, PhD
Disclosures
• Federal research funding AHRQ, NICHD, CDC, NINDS www.traumamaps.org www.strokemaps.org
• AHA research funding NRCPR/GWTG
• National Quality Forum RECS Steering Committee
• HHS/ASPR Senior Policy Advisor I am not appearing in this role today
• Ambulatory Care Sensitive Conditions Conditions for which good outpatient care can
potentially prevent the need for hospitalization, or for which early intervention can prevent complications or more severe disease.
• Emergency Care Sensitive Conditions Conditions for which rapid diagnosis and early
intervention in acute illness or acutely decompensated chronic illness improves patient outcomes
Background:The Volume-Outcome relationship
• 12 surgical proceduresCABG, AAA, TURP, etc.
• 1500 hospitals
Procedures Mortality=
0
0.2
0.4
0.6
0.8
1
1.2
Low Medium High
Cath Volume
Adj
uste
d O
R D
eath
Adjusted Oddsof Death
Sta
nd
ardi
zed
Mo
rtal
ity
70%
65%
60%
55%
50%
20 40 60 80 100 120
45%
Cardiac Arrest Patients Admitted to ICU/year
Hospitals that treated over 50 pts/year had
lower mortality
Cardiac Arrest Mortality
Background: The time-outcome relationship
Sepsis
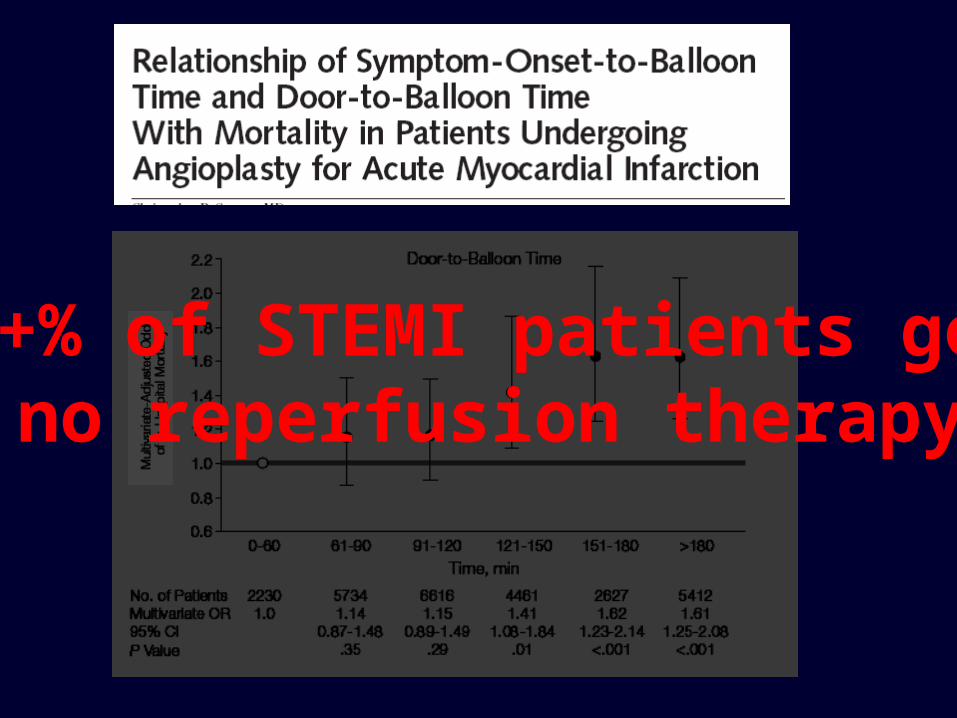
STEMI
STEMI
30+% of STEMI patients get no reperfusion therapy
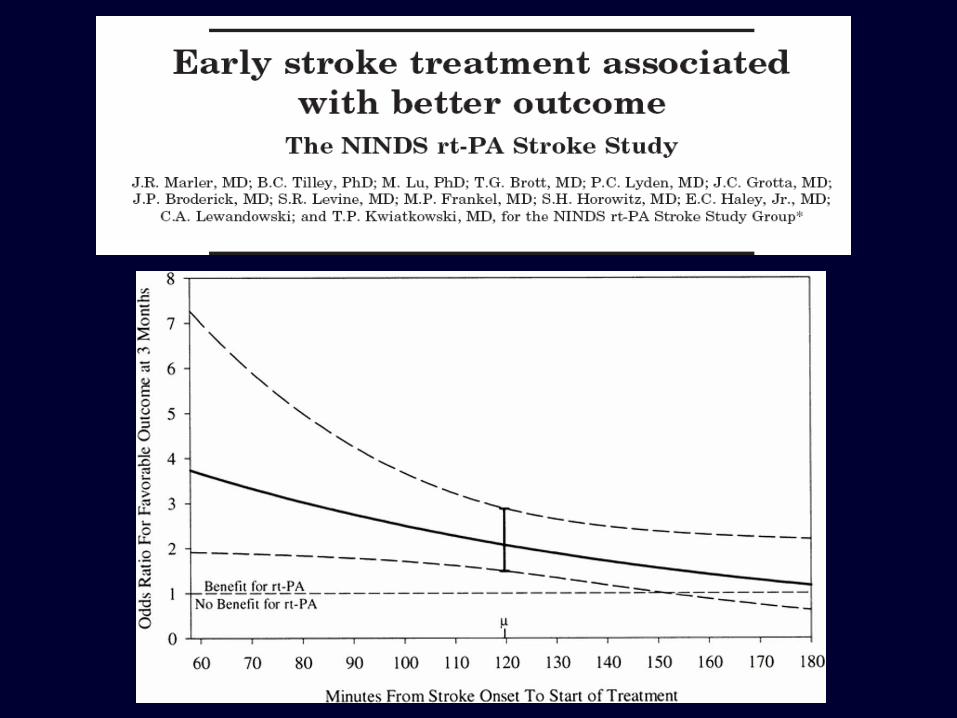
3% of ischemic strokes treated at TJC certified centers
3-8.5% receive rt-PA
Sepsis
Sepsis
5-7% of EDs perform EGDT
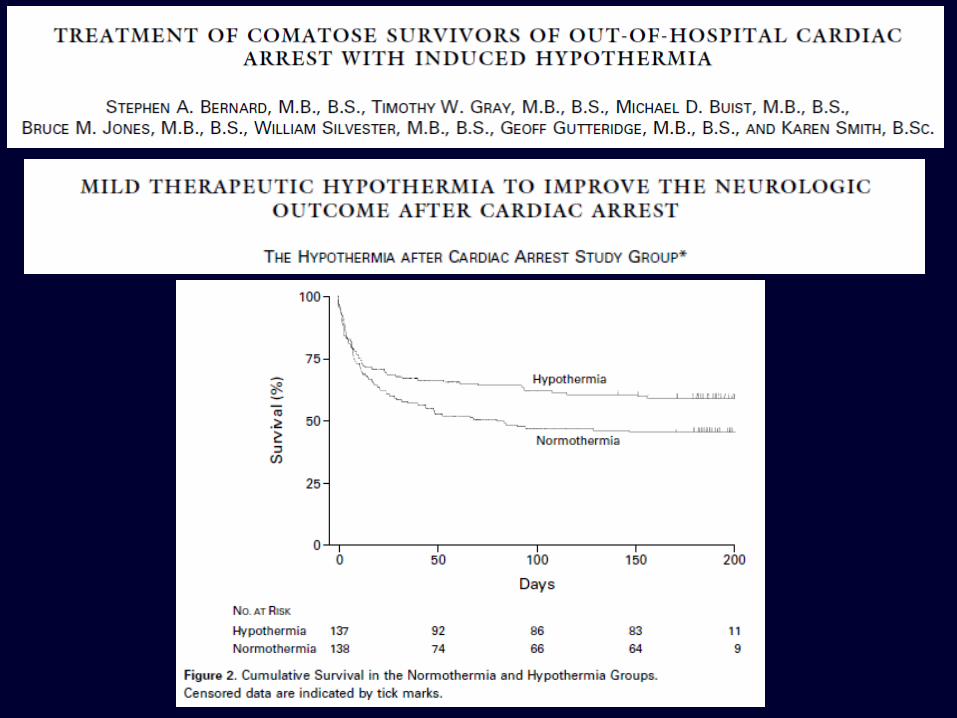
26% of physicians have used hypothermia (ever)
Volume
Time
• the organization of a system for the delivery of health care within a region to avoid costly duplication of services and to ensure availability of essential services.
– Mosby’s medical dictionary
What is regionalization?
Regionalized Trauma Care
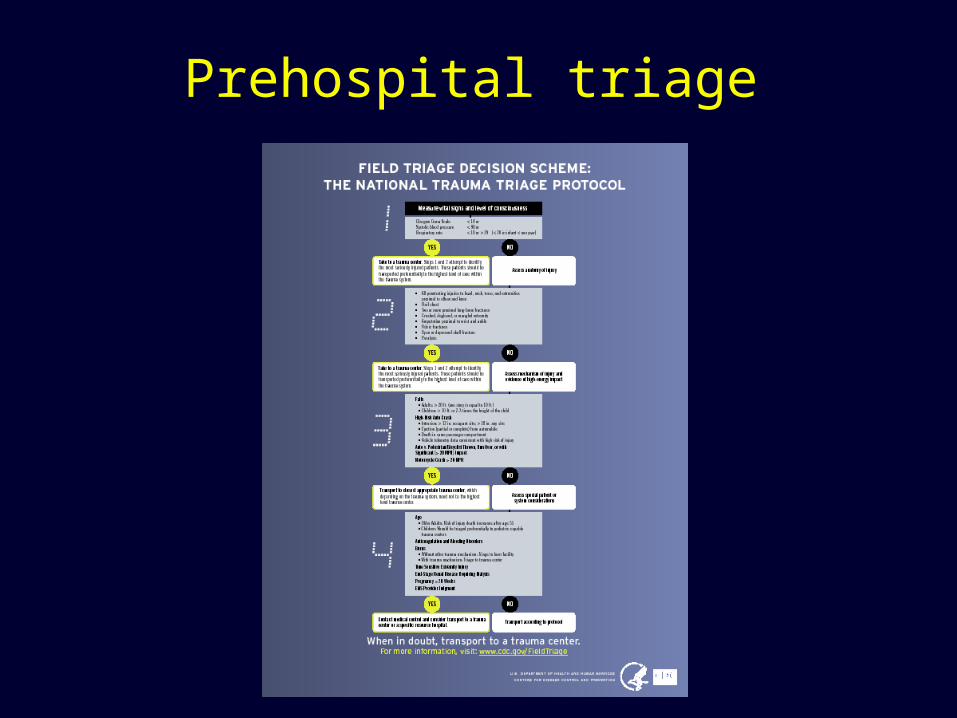
Prehospital triage
The Trauma Model – Inventory
Access to trauma care
Trauma care outcomes
Trauma Model. All success?• 27,130,283 injuries treated in US hospitals in 2006
32% in trauma centers 68% in non-trauma centers
• Severely injured patients (ISS>15) - More likely to be treated in trauma centers (51.3% TC vs. 48.7% nTC, p<0.001)
• Critically injured patients (ISS>25) - More likely to be treated in non-trauma centers (41.6% TC vs. 58.4% nTC, p<0.001)
Research questions with policy implications
• Have we improved population outcomes for injury? 1. In a nationally representative analysis
– Do trauma centers save lives? 2. What is the relationship between
access to trauma care and injury outcomes? (supply and demand)
Research questions with policy implications
• (What can understanding population outcomes for trauma teach us about examining other systems created to focus on unplanned critical illness?)
StrokeSTEMICardiac arrest…
Q1. In a nationally representative analysis – Do trauma centers save lives?
• Population: All injured patients treated at trauma centers and non-
trauma centers in the US • Data:
Nationwide Emergency Department Sample (HCUP) Trauma Center Level (American Trauma Society)
For-profit -.00005 -0.15Teaching .00129** 4.20Medium hospital (small size reference) .00361 1.83Large hospital .00106** 4.64Northeast region (West region reference) .00043* 1.99Midwest region .00008 0.37South region .00054* 2.49Trauma center -.00194** -3.07
* With IV
Question 2. Population outcomes for trauma
• Data Sources (trauma system - supply)US Census Data
– Location of residence at the level of the block group and county
CDC, American Trauma Society, Penn Cartographic Modeling Lab– Trauma center access
• Data sources (injury death - demand)National Center for Vital Statistics
– Multiple Cause of Death (MCOD) Data
Question 2. Population outcomes for trauma
• Methods Supply Side – Access to trauma care
Access to level 1/2 trauma center within an hour Demand Side – Injury Deaths
ICD codes to identify injury death location Population data to calculate injury death rate
• Analysis Examine relation between injury death rates and
access to trauma care using poisson distribution
Question 2. Population outcomes for trauma
• Results Supply
60 minute access to trauma care–84.7% of US residents–46.4% of US counties
Mean time to care = 43 minutes +/- 22 Demand
152,766 injury deaths in 2005 27,964 in counties without access within 60 min 124,802 in counties with access to care within 60 min
Counties without access to trauma care within 60 minutes had higher rates of injury death when compared to counties
with access to trauma care within 60 minutes (OR 1.24, 95% CI 1.18-1.30)
The relative risk of death increased at a rate of 3.4% for each 10 minute increase in time to trauma care
(95% CI 2.4% - 4.4%).
Q1. Next steps & remaining questions
• We have a dichotomous outcome variable but are using linear regression…
• Hard to estimate the strength of the instrument given survey design of NEDS Is differential distance unrelated to outcome?
• It would be nice to generate point estimates• The direction of effect flips – do you believe it?
Q2. Next steps & remaining questions
• What is the right geographic unit to sum outcomes to? (we used counties)
• Should we be targeting counts or rates of death?• Should we adjust for injury severity and case mix?
(is there systematic variability in severity by geography?)