Report EUR 25950 EN 2012 Bogdan Vamanu, Marcelo Masera CEIPSec. A GIS-Centric Web-Based Application for results communication and visual assessment of the impact of failures on the European electrical power transport system. Critical Energy Infrastructure Protection Assessment Results Communication
Transcript
Report EUR 25950 EN
2 0 1 2
Bogdan Vamanu, Marcelo Masera
CEIPSec. A GIS-Centric Web-Based Application for results communication and visual assessment of the impact of failures on the European electrical power transport system.
Critical Energy Infrastructure Protection Assessment Results Communication
European Commission Joint Research Centre Institute for the Protection and Security of the Citizen Contact information Marcelo Masera Address: Joint Research Centre, P.O. Box 2, PTT P309 02/209, 1755 ZG Petten, the Netherlands E-mail: [email protected] Tel.: +31 (0)2 24565403 Fax: +31 (0)2 26405641 http://ipsc.jrc.ec.europa.eu/ http://www.jrc.ec.europa.eu/ This publication is a Reference Report by the Joint Research Centre of the European Commission. Legal Notice Neither the European Commission nor any person acting on behalf of the Commission is responsible for the use which might be made of this publication. Europe Direct is a service to help you find answers to your questions about the European Union Freephone number (*): 00 800 6 7 8 9 10 11 (*) Certain mobile telephone operators do not allow access to 00 800 numbers or these calls may be billed.
FIGURE 1. ASSESSMENT FRAMEWORK FOR CRITICAL ENERGY INFRASTRUCTURE PROTECTION 6 FIGURE 2. GENERIC APPLICATION WINDOW WITH TWO ROWS AND ONE LINE. 9 FIGURE 3. CEIPSEC SITE MAP 9 FIGURE 4. CONNECTING TO CEIPSEC 10 FIGURE 5. THE LOG-IN FORM 11 FIGURE 6. CEIPSEC [HOME] 11 FIGURE 7. [SCA] INITIAL VIEW 12 FIGURE 8. [SCA] AVAILABLE CASES POP-UP. 13 FIGURE 9. [SCA] CASE LOADED. 13 FIGURE 10. [SCA] MAP PANEL. 14 FIGURE 11. [SCA] TABLES PANEL. 15 FIGURE 12. [SCA] THE CHARTS PANEL. 16 FIGURE 13. [SCA] SETTINGS PANEL 17 FIGURE 14. [SCA] USE CASE 18 FIGURE 15. [CCA] INITIAL VIEW 20 FIGURE 16. [CCA] AVAILABLE CASES POP-UP. 20 FIGURE 17. [CCA] CASE LOADED. 21 FIGURE 18. [CCA] THE MAP PANEL 21 FIGURE 19. [CCA] THE CASCADE CASE NAVIGATOR 22 FIGURE 20 THE CASCADE CASE CHART 22 FIGURE 21. THE CASCADE CASE REPORT PANEL 23 FIGURE 22. [CCA] TOOL SNAPSHOTS. 24 FIGURE 23. [CCA] USE CASE 1 SUPPORTIVE SNAPSHOTS. 25 FIGURE 24. [CCA] USE CASE 2 SUPPORTIVE SNAPSHOTS 26 FIGURE 25. [MSCA] ADD CASE 28 FIGURE 26. [MSCA] EDIT AND DELETE RECORD. 29 FIGURE 27. [MCCA] MAIN INTERFACE 30 FIGURE 28. [MCCA] THE LAYERS WINDOW. 31 FIGURE 29. [MCCA] ADD CASE 31 FIGURE A.1. CEIPSEC MAIN COMPONENTS. 34 FIGURE A.2. CEIPSEC DIRECTORIES. EXAMPLE 34 FIGURE A.2. SCA. NEW CASE WORKFLOW 35 FIGURE A.3. CCA. WORKING CASE 37
5 | P a g e
1. Introduction
1.1. What is CEIPSec
CEIPSec is a web based GIS1 centric application developed for results communication and visual assessment of
the impact of failures on the European electrical power transport system. It was developed within the context of
the Administrative Arrangement Critical Energy Infrastructure Protection between DG ENERGY and the JRC
(2008-2010).
CEIPSec is designed as backend of NEPLAN®2
electrical transmission module. The application offers various
visualization ways of the results of NEPLAN® simulations, crafted from an impact assessment oriented
perspective. The results are provided in both quantitative and qualitative fashion through a user interface that
follows (at a high level) the generic guidelines in visual analytics realm: intuitive and interactive interfaces for
facilitating the visual reasoning3 techniques [ref].
1.2. Justification
Computer simulation of real systems is most of the time a complex task, both in terms of the analytical models
describing the process and the usage of the tools that implement the models themselves. The simulation tools
addressing different processes (e.g. NEPLAN® for power systems, AERMOD for atmospheric dispersion
modelling, etc.) are consequently extremely powerful sector-specific applications, yet oriented towards
professionals.
Naturally, the results of such tools are also mainly professional oriented. Depending on the addressee and the
goal of the assessment, communicating the results in an „out-of-the-business‟ manner is sometimes required.
Likewise, from the perspective brought in by visual analytics and visual reasoning fields, the analyst should be
provided with various ways of representing and visualizing the results (data), accompanied by intuitive and
interactive user-interfaces.
Some of the simulation platforms offer (up to some extent) the capabilities mentioned before. Relying only on
them leads however to at least a couple of drawbacks in the specific case when the results target several
addressees: first, if interactivity is required, all the addressees must have access to the simulation platform and
also must have knowledge about the usage of the specific software. Second, if the results are required to be
consumed (accessible) by virtually anybody, most probably they are in the form of a report (usually in pdf file),
i.e. a static manner.
Another aspect of complex systems simulation is the effective simulation time. This depends on the complexity
of the models describing the process on the one hand, and the complexity of the system under consideration on
the other. There are cases in which a trial (simulation run) may take several hours. In these circumstances
designing an assessment platform that accommodates scenario-building, simulation running and results
assessment in a contiguous workflow is not feasible. Splitting up and addressing separately the assessment
phases is a more convenient way to deal with this issue.
1 Geographical Information System - GIS
2 NEPLAN. Planning and information system software for electrical transmission, distribution and industrial networks.
http://www.neplan.ch/html/e/e_home.htm 3 Visual analytics - the science of analytical reasoning facilitated by visual interactive interfaces (acc. to James J. Thomas
and Kristin A. Cook (Ed.) (2005). Illuminating the Path: The R&D Agenda for Visual Analytics National Visualization and Analytics Center.)
Figure 1. Assessment framework for Critical Energy Infrastructure Protection
A last topic regarding CEIPSec is the issue of common visualization platform for representation and assessment
of the results. As it is developed now, CEIPSec only deals with the impact of failures in the electrical transport
networks. However, the power grid is not the one-and-only networked critical infrastructure in Europe. As its
immediate „relative‟ is the gas network. Despite the intrinsic differences between the two systems (in respect
with operational aspects – immediate consumption vs. storage and consumption, or with internal, physical
processes describing the systems) from the security of European energy supply viewpoint both systems share a
set of common characteristics. The differences are reflected in the different simulators used for physical process
assessment. The common characteristics are reflected in the overall system behaviour. Thus, one or more nodes
failure propagates throughout the system; the initial failure may have trans-border characteristics; the network
flows are affected, etc. A common visualization and assessment platform ensures in this case the delivery to the
stakeholder the assessment results of different systems in a common fashion. After all, how many countries are
affected by a failure can be communicated the same way regardless whether initial failure is on a power
substation or a gas processing plant.
1.3. The Framework
CEIPSec was developed as part of an assessment framework that takes into account the considerations in the
previous section. The framework is depicted in Figure 1. The assessment is seen as a complex process involving
the joint efforts of different actors, each of them with different responsibilities: the Policy makers, Sector-
specific professionals and CEIPSec administrators.
The policy maker is the start and endpoint of the whole enterprise. On the one hand he/she is the one making
requests to the sector-specific professionals. On the other hand he/she is the user of the visualization
application. Different visualization options are the means for supporting scenario results analysis which may
lead to drawing conclusions or make additional requests to sector-specific professionals.
Sector-specific professionals are in charge of operating the sector-specific simulators and provide the results of
the assessment to the CEIPSec Administrators.
In turn, CEIPSec Administrators are in charge of the management of the visualization application resources. By
visual application resources we understand the data consumed by the visualization application. Management of
the resources is two-folded: on the one hand it implies ensuring (either thorough automatic tools or manually)
the „translation‟ of the simulation-specific output into the format understood by the visualization application;
and on the other hand, tracking any changes that occur in the application resources (e.g. add/edit/update cases,
cleaning-up obsolete services, etc.). A good understanding of the visualization application functionality and data
architecture is required.
7 | P a g e
The rest of this document presents the CEIPSec application. The document targets both the users and the
administrators of the system. Focus is mainly given to the application operation. Architectural, design and more
technical details will also be provided, mainly for application administrators.
2. CEIPSec. The Application
CEIPSec is a visual analysis application developed for supporting policy making in the realm of European
Critical Energy Infrastructure Protection. As in the version developed within the aforementioned Administrative
Arrangement, CEIPSec only accommodates the European Power Transmission System facet of the more
comprehensive Energy Protection field. Therefore, CEIPSec should be seen as (and is) a proof of concept
intended to test the feasibility of such an approach for a common visualization and security assessment platform.
CEIPSec targets both policy-makers and sector-specific professionals. This is reflected in communicating the
results in various forms and at different levels of detail. The information is provided in numerical, graphical
(i.e. as charts) and geographical (i.e. on maps) form. The information given is either bare data (the actual
values in the simulation output, e.g. PLoss) or aggregated (statistics based on simulation results).
From a visual analytics viewpoint it was the developer‟s intention to provide CEIPSec the capability of
communicating the information by addressing different cognitive and perception levels of the analyst. Thus, one
may get relevant information in a direct form (e.g. a number), on a stimulus-based basis (e.g. „red‟ is bad) or
based on his own previous experience (expert judgment, e.g. „I‟ve seen this before‟).
2.1. Challenges and Design Considerations
CEIPSec is designed for having basic DSS characteristics, i.e. to provide relevant information for decision
(policy) making and answer to (simple, in this case) questions. However, CEIPSec is primarily a Data and GIS-
centric application. Consequently, the main guideline when designing the application was „the user is not a
specialist‟ in either databases or GIS. Hence, from the user-perspective, the following design consideration
where followed:
The application must be intuitive to use; and
The application should be accessible in terms of the software required to use / access the application.
From the operational perspective CEIPSec is built on the attitude „what would the user want to know‟. From the
technical viewpoint, the application is constructed on the „drain-out as much (relevant) information given the
available data‟ philosophy.
The application is designed considering both the users and the administrators. This is reflected in specialized
administrator-oriented modules intended for helping with the application resources management.
Flexibility is another CEIPSec design characteristic. Flexibility here refers to (i) the capability of
accommodating new simulation cases; and (ii) the flexibility (to some extent) in the structure of the initial data
sources.
Summing up, the following lists some of CEIPSec design consideration and implementation specifications4,
seen from the user-oriented and technical viewpoints.
User-oriented
o Accessibility – user requirements: WEB Browser with Internet access
4 The development and deployment (production) server configurations are different. The application was tested on
development server configuration. CEIPSec is available on production server, having however some known non-critical functionality issues. When the case, this will be mentioned in the document.
8 | P a g e
o Security – access by credentials
o Interactive interface
o Intuitive interface
o User-action synchronization: this refers to synchronizing the active information entities5 so that
a user interaction6 on one of them to be reflected in the others. This may also be seen as a „get
all information with one user action‟ approach.
o Scalable interface.
Technical
o Modular architecture – to ensure scalability in terms of additional assessment modules
The following technologies and products have been in the development:
ArcGIS 9.3 SP17 – has been used as the core GIS solution;
WEB ADF for ASP.NET – has been used for developing the GIS-web application engine (server-side);
WEB ADF Javascript – used for client-side GIS interaction and manipulation;
SQL Server 2008 Express – used for additional database engine;
ASP.NET Web Application (Visual Basic);
JavaScript for client-side interface features;
AJAX Toolkit 1.18
2.2. CEIPSec Security
CEIPSec is foreseen to consume highly sensitive data. Securing the application by allowing access to only a
restrained number of users is in this case a natural requirement. Security is provided on two levels: network and
application.
Security at the network level is guaranteed by placing the production server on a semi-closed network (i.e.
access from Internet forbidden). In this particular case, CEIPSec production server is only accessible from the
European Commission Scientific Network (NET1).
ASP.NET Forms Authentication9 system has been adopted for securing the CEIPSec at application level. In
short, the Forms Authentication provides the framework for restricting the content of different parts of an
application based on a set of access rules defined for a number of users belonging to different user roles.
There are two roles defined for CEIPSec: Users and PowerUsers. The members in Users have access granted to
the visualization modules of the application. The User group is created for accommodating Policy makers and,
in some cases, Sector-specific professionals. In addition, members of PowerUsers have access to the application
resource management modules.
2.3. The User Interface
CEIPSec user interface has been designed following the guidelines:
To be intuitive;
To be interactive;
5 Any information representation user may interact with (e.g. chart bar or the row of a data table)
6 E.g. mouse click or mouse hovering.
7 Production server: ArcGIS 10
8 The AJAX version is given by the ArcGIS version. ArcGIS 10 uses AJAX 3.5
The user should be able to focus on part of the information, according to its needs.
The solution adopted
was to implement a set
of Javascript functions
to provide a sizable,
panel-based interface
(Fig. 2). CEIPSec
interface dimensions as
to cover the browser
active window. The
information is held in
resizable panels.
The interface window
is split in three sections
(Fig. 2). The Header
contains the Title of
the current tool and the
Toolbar. The Footer
holds the copyright
note and useful links. The Active area is the area occupied by the panels. A panel has two states: minimized and
maximized.
The active area is evenly split in a number of rows and columns. Each cell of the grid thus formed corresponds
to a panel in minimized form. When a panel is maximized it occupies the whole Active area.
Resizable panels approach offers the user the capability of focusing on the information held by each of the
panels. For instance, suppose the map is the focus
point. The user may then maximize the map panel,
read information, navigate, etc. Moreover,
depending on the user actions synchronization
settings, interacting with the map is reflected on
other panels so that the user may get all the related
information to particular information on map.
More on this will be cover in the Use Cases
section.
2.4. The site-map
The gateway of CEIPSec is Critical Energy
Infrastructure Protection [Home] (Figure 3).
[Home] is the only part of CEIPSec accessible to
anybody (within the NET1 network). [Home]‟s
role in the application is double. On the one hand,
it plays the role of the log in page. On the other
hand, once the user is authenticated, and in
accordance with the user role, [Home] is the starting point towards any of the available applications (tools).
Thus, belonging to Users grants access only to the visual analysis tools (Single Case Assessor [SCA] and
Cascade Case Assessor [CCA]). Belonging to PowerUsers implies access granted to all the application tools
(i.e. in addition to [SCA] and [CCA] the user may also access the management tools – Management. Single
Case Assessor [MSCA] and Management. Cascade Case Assessor [MCCA]).
Figure 2. Generic application window with two rows and one line.
Figure 3. CEIPSec site map
Header
Footer
Active area
Panel redimension button
Users
PowerUsers
Single Case
Assessor
Users
Home
Cascade Case
Assessor
Management.
Cascade Case
Assessor.
e Case Assessor Management.
Single Case
Assessor.
Error Page
10 | P a g e
Navigation through different tools can only be done through [Home].
The ErrorPage is used for displaying different error messages that may appear during the usage of the
application.
Figure 4. Connecting to CEIPSec
3. CEIPSec. Usage Guidance
This section covers the usage aspects of the CEIPSec application. For each tool information on the typical
workflow, data and results reading, and available capabilities is provided, all supported by application snapshots
and use cases.
The first three sections target the Users. The following two are mainly oriented towards PowerUsers.
3.1. Accessing CEIPSec
The requirements for accessing CEIPSec are:
The client computer being in the EC Scientific Network (NET1);
Provide
Credentials
Access
[Home]
user
Authenticated
user is
PowerUser
Populate [Home]
with PowerUser
options
Populate [Home]
with User options
Start using the
Application
no
yes
yes
no
User Workflow Application Logic
11 | P a g e
Internet browser10
on the client computer.
Figure 5. The Log-in formm
Currently CEIPSec can be found
Directly at http://esu.jrc.nl/ceipsec10; or
Through the IES Electricity Portal at http://esu.jrc.nl/
Once the user is connected the CEIPSec [Home] window is displayed (Fig.5). Figure 4 depicts the user
workflow together with the application logic. Figure [6(a)(b)(c)] shows [Home] in the log-in, user and
poweruser modes respectively.
(a) logged-in as [user] (b) logged-in as [poweruser]
Figure 6. CEIPSec [Home]
The User and PowerUser mode in Figure 6 are in Blue and Red themes of CEIPSec. Moreover, the majority of
CEIPSec snapshots will be with the application in Red Theme, due to printing considerations.
Once the user is authenticated he may proceed to any of the available tools.
10
Virtually any Internet browser may be used for accessing the application. However, CEIPSec is designed to work with Internet Explorer (later than 7). The use of other browsers is not thoroughly tested and may result in abnormal behavior of the application.
Role: Electricity Model. Single Case Assessor Tool (SCA) is a tool for visual assessment of the impact on the
European electricity transport network of the failure of one or several infrastructure components (substations
and/or lines).
Input Data: maps and numerical datasets pre-processed form NEPLAN® results file
11. Pre-processing the
NEPLAN® file is done by using CEIPSec Management. Single Case Assessor tool and is a PowerUser
responsibility.
Information communication means: geographical (by situational maps), numerical (by numerical tables) and
graphical (by charts).
Assessment type: quantitative and qualitative
Communicated results: given in table below:
Result
Geo
gra
ph
ica
l
Nu
meri
cal
Gra
ph
ical
Qu
an
tita
tiv
e
Qu
ali
tati
ve
The impact of failure at the European level x x x x x
The affected countries x x x x x
The PLoss transfer between the countries x x
The failure impact on each country x x x x x
Loss propagation (country-to-country) x x
Most affected countries x x x x x
Impact at country level x x x x x
Some of the results in the previous table may be got in different ways. Further details on „how to get the results‟
will be given in the Tool usage section.
The Interface
The initial view of SCA is given in Figure 7.
The SCA toolbar holds:
Open case button (first from left)
Exit tool button (i.e. Go [Home]) (middle)
Application theme button (last)
There are four panels available in SCA:
The Map panel – used for visualizing and
controlling the situational map.
The Charts panel – holds the bar chart
representation of the results.
11
The format of the NEPLAN® results file must be Microsoft Excel Sheet (xls).
Figure 7. [SCA] initial view
13 | P a g e
The Tables panel – holds the numerical representation of the results.
The Settings panel – used for user action synchronization settings.
The Workflow
[SCA] works with cases. A case is a snapshot of the power
system after a failure of one or more components. The
impact of the failure is given in a case by the power load
loss (between different countries and at country level).
There is no open case when [SCA] is initially accessed.
Consistent with the simplicity objective, the typical
workflow for [SCA] is:
Step1: Navigate to [SCA]
Step2: Open case
2.1. Click Open Case button in [SCA] toolbar. Available cases window (Fig 8) pops up.
2.2. Select one of the cases that have OK12 in the MapService column.
2.3. Click Load button in the Available cases window. The [SCA] panels will populate
with the case related information (Figure 9).
Step3: Start the assessment by analyzing [SCA] panels.
Figure 9. [SCA] Case loaded.
12
Trying to load a case with [result unprocessed] in the MapService column would result in an error. Although an unprocessed result cannot be opened, it is listed in order to inform the analyst that there are cases pending for being processed.
Figure 8. [SCA] Available cases pop-up.
14 | P a g e
Tool Usage
The Map Panel
The Map panel allows a qualitative and partially
quantitative assessment of the failure. This panel
holds the situational map. The situational map renders
the impact of the failure at European level, described
by the PLoss transfer between countries. The map panel
provides basic GIS interactivity; the following actions
are available through the Map Toolbar:
Zoom In / Out (click map and zoom or click
and drag map to zoom to area)
Pan (click and drag to move map around)
Full Extent (zoom the map to accommodate
the entire map)
Map Back / Forward Extent (navigate through
different map extents)
Country Selection Tool (click a country to
select it)
Country Selection Tool is a custom tool that allows
selecting a country on map. Depending on the User
Action Synchronization settings the country selection
is reflected in other panels, thus providing the analyst
additional information on the selected country.
Reading the map
By looking at the situational map one gets the
following information:
The PLoss transfer between countries;
The countries affected by the failure.
The PLoss between countries is given by the arrows on
the map. The loss magnitude is given by the size of the
arrows. The direction of the loss (from country to
country) is given by the direction of the arrows. The
partially quantitative characteristic of the information
is given by the fact that the size of the arrows is given
by the membership of the correspondent PLoss value to
one of the pre-defined five intervals. To get the
intervals one has to open the Layers panel (click on
Layers in Map panel) and expand the Country
Transfers node.
On the country layer, the countries that are affected by
the failure are rendered in pale green, while the
unaffected countries in dark green.
(a)
(b)
(c)
Figure 10. [SCA] Map Panel.
15 | P a g e
Q & A.
In a question – answer format, the Map panel may be
used for:
Q1. Which are the affected countries?
A1. The ones in light-green.
Q2. Which is the impact of the failure at European
level?
A2. Given by the „spread‟ of the light-green countries.
Q3. Which is the PLoss transfer between countries?
A3. Given by the arrows.
Q4. Which is the impact at country level?
A4. Given by the size and number of the incoming
arrows.
Q1. How a given country affects its neighbors?
A1. Given by the size and number of the outgoing
arrows of the given country.
Q1. How does the failure „travels‟?
A1. Given by the orientation of the arrows.
The Tables Panel
The Tables panel (Fig. 11) holds the failure impact
quantification values13
in a tabular format. The
information is country specific. The main role of the
Tables panel is to provide a quantitative assessment
tool.
The table only contains the countries that are affected
in the current case. This is per se a way of
communicating the failure impact level in terms of
number of affected countries. From the user-oriented
perspective the Tables panel provides:
Record selection – by clicking a row. When used in
Q2. Which is country X‟s ranking in terms of [value]
loss?
A2. Sort by [value] and check the position of country
X.
Q3. Which is the impact at European level (in terms of
number of affected countries)?
A3. Check the number of records (or sort by ID and get
the ID value of the last row).
Q4. Which is the impact on each country?
A4. Check the figures.
The Chart Panel
The Charts panel (Fig. 12) contains the bar chart
representation of the data in the Tables panel. At a
given moment, only one impact quantification value is
rendered as a chart. The information is country-specific.
The Charts panel may be used in both quantitative and
qualitative assessment. The qualitative aspect is
intrinsic, being given by the actual image of the chart.
The quantitative aspect is conferred by the built-in
capability of providing the underlining numerical value
when hovering the mouse over a chart bar.
Same as the Table Panel‟s table, the chart only contains
the records corresponding to the affected countries.
The Charts panel provides the following display
options:
Sort. Sorts the chart. There are two sorting
possibilities:
o Sort by Country – sorts the records of
the chart in alphabetical order;
o Sort by Value – sorts the records by
value in descending order.
Chart Selection. Select the impact quantifier to
display the chart for.
Each of the chart bars is „selectable by click‟.
Depending on the synchronization settings, selecting a
chart bar might be reflected in the other panels.
14
When using the ‘sorting’ capabilities one should pay attention to the sign of the value. If the values are both positive and negative, sorting may be seen as more as reordering the data. Thus, in this case, one should check the absolute values of the first and last rows of the table.
(a)
(b)
(c)
Figure 12. [SCA] The Charts panel.
17 | P a g e
Q & A
Examples of what the Charts Panel may be used for are:
Q1. Which is the most affected15
country in terms of [value]?
A1. Use Chart Selection to display the chart for [value].
Use Sort by value.
Q2. Which is country X ranking in terms of [value] loss?
A2. Sort by [value] and check the position of country X.
Q3. Which is the impact at European level (in terms of number of affected countries)?
A3. Count the number of bars.
Q4. Which is the impact on each country?
A4. Hover the mouse over the bar correspondent to the desired country.
Q5. How iscountry X affectedcompared with country Y?
A5. Check the relationship between the bar lengths of the corresponding countries.
The Settings Panel
The Settings Panel (Fig. 13) holds the user actions synchronization settings. The synchronization is set by
pairing up the available panels. To synchronize the Panel A with Panel B click the arrow A->B. The arrows
have two states: On / Off. An On arrow between A and B means that A and B panels are synchronized.
For a synchronization setting as in Figure 13 one gets:
Selecting a country on map (using Country
selection tool) results in the selection of the row
in the Table panel corresponding to the selected
country.
Selecting a bar in the chart (by mouse click)
results in:
o The selection of the correspondent
country on map. An automatic pan and
zoom is also performed on the map to
bring the selected country in the middle
of the map.
o The country correspondent row is selected in the Tables.
Selecting a row in the Tables panel results in:
o The selection of the correspondent chart bar (due to the Tables->Chart direct link);
o The selection of the country on map (cascade selection due to the Charts->Map setting).
Synchronization of actions permits the application to behave accordingly to the user preferences. One
possible benefit of user actions synchronization may be found in the sequel.
Use Case Example
The following is an example of how Single Case Assessor may come into supporting the assessment of a failure
in the Power Transmission System. The results are purely fictions.
15
The sign of the value should also be taken into account
Figure 13. [SCA] Settings panel
18 | P a g e
(a) (b)
(c) (d)
Figure 14. [SCA] Use case
(e)
Suppose the analyst focus is on the situational map. From the map his attention is drawn by the number of
arrows of „significant‟ size coming and going from Germany. Which are the actual values of the impact
quantification values in case of Germany? Where Germany ranks among the affected countries? To answer to
this the analyst may follow the steps:
Step 1: set user action synchronization as in Fig. 14(b).
Step 2: activate Country Selection Tool in the Map Panel.
Step 3: click Germany on map.
Step 4: select Sort Chart by Value in the Charts Panel.After Step 3 the user would have selected
Germany on map, the correspondent row in table and the correspondent bar in chart. The numerical values are
given in the selected row. The Germany rank is obtained from looking at the chart (after Step 4).
19 | P a g e
3.3. Electricity Model. Cascade Case Assessor.
Target: Users and PowerUsers
Role: Electricity Model. Cascade Case Assessor (CCA) is a tool for supporting the visual assessment of cascade
effect scenarios (an initial failure of one or several infrastructure components, i.e. substations and/or lines has
onto the European Power Transport System). The assessment is done on a step-by-step basis.
Input Data: CCA consumes cascade-effects maps16
provided through ArcGIS Map Services. The cascade-effects
maps are ArcGIS map documents having a pre-defined structure of the data; the cascade-effects maps are
understood and processed by the CCA.
A cascade-effect map is basically a map having a set of base layers (e.g. country borders) and a set of active
layers corresponding to each step of the cascade effect. Creating the cascade-effect maps and map services is a
separate process from CEIPSec and should be done manually, according to given specifications. The
management of the cascade effects cases (i.e. connecting the previously created map services to CEIPSec) is
done by using CEIPSec Management. Cascade Effects Assessor tool and is a PowerUser responsibility.
Information communication means: geographical (by Maps), numerical and graphical (by charts).
Assessment type: quantitative and qualitative
Communicated results: given in table below.
Result
Geo
gra
ph
ica
l N
um
eri
cal
Gra
ph
ical
Qu
an
tita
tive
Qu
ali
tati
ve
The impact of failure at the European level x x x x x
The system components (lines and power substations) affected in the
current step
x x x x x
The system components already disabled (already affected in
previous steps)
x x x x
The failure ‘spreading’ throughout the system x x x x
The share of substations affected in the current and previous steps x x
The share of transmission lines in the current and previous steps x x x x x
The share of each class17
of substations affected in the current step x x x x x
The share of each class18
of transmission lines affected in the current
step
x x x x x
The ‘worst’ step (in terms of number of components affected) x x x x x
The Interface
The initial view of CCA is given in Figure 15.
The CCA toolbar holds:
Open case button (first from left)
Exit tool button (i.e. Go [Home]) (middle)
Application theme button (last)
16
The cascade-effect ArcGIS maps have been developed by IES-ESU. 17
There are three classes of substations taken into account: 400kV, 225kV and 150kV. 18
There are three classes of transmission lines considered: 380kV - 499kV, 220kV-299kV and Other.
20 | P a g e
There are two panels available in CCA:
The Map panel – used for visualizing and
controlling the situational map. The Map panel
also holds the Case Navigator Control and the
Cascade Case Chart control.
The Case report panel – holds the cascade case
report.
The Workflow
[CCA] works with cases. There is no open case when
[SCA] is initially accessed. The typical workflow for
[CCA] is:
Step1: Navigate to [CCA]
Step2: Open case
2.1. Click Open Case button in [CCA] toolbar. Available cases window (Fig 16) pops up.
2.2. Select one of the cases.
2.3. Click Load button in the Available cases window. The [CCA] panels will populate
with the case related information (Figure 17).
Step3: Start the cascade-effects assessment.
Tool Usage
Once a case is loaded the user has access to:
The situational map – renders the case information
on map;
The Cascade Case Navigator – allows the
navigation between the cascade effect steps;
The Cascade Case Chart – renders the current case
and step information in graphical form;
The Cascade Case Report – a report compiled on
the fly from the information provided by the map
server.
The Map Panel
The Map panel allows a qualitative assessment of the failure at each step of the cascade effect. This panel holds
the situational map (i.e. cascade-effect map), the Case Navigator and the Cascade Case Chart.
Basic GIS interactivity is provided; the following actions are available through the Map Toolbar:
Zoom In / Out (click map and zoom or click and drag map to zoom to area)
Pan (click and drag to move map around)
Full Extent (zoom the map to accommodate the entire map)
Map Back / Forward Extent (navigate through different map extents)
Figure 15. [CCA] initial view
Figure 16. [CCA] Available cases pop-up.
21 | P a g e
Figure 17. [CCA] Case loaded.
Figure 18. [CCA] The Map Panel
22 | P a g e
Reading the Map
A typical cascade case map is given in Fig. 18; the map has as base layers the country borders and as active
layers the substations and the power lines layers.
Each of the system components may be in three states: unaffected, affected in the current step and affected in
previous steps. The color coding the component states is green, red and black respectively. Different shades of
red and black (grey) may be encountered to differentiate between the components sub-classes.
The cascade Case Navigator
The navigation through the cascade effect steps can be done in two ways: by using the Cascade Case Navigator
(Fig. 19) or through the Case Report (explained later).
Using the Navigator is self-explanatory. The user may go step-by-
step by using the <prev><next> buttons, get to the initial or last step
by using the <first><last> buttons or going to a particular step by
dragging the slider and checking the information given by Current
step.
The Cascade Case Chart
The Cascade Case Chart is a qualitative assessment helper that provides information on the share of the
affected components at the current and previous steps. When used in conjunction with the Cascade Case Report
the Cascade Case Chart also qualifies as a quantitative information locator.
The chart contains two sub-charts characterizing the impact at the substation and lines respectively. Each of the
sub-charts is composed of the main chart (thicker chart) and details chart (thin chart). Since the interpretation of
the charts is identical in the substations and lines cases, we describe the use of the charts taking as example the
Substations impact.
Let denote (Fig. 20):
- the total number of substations defining the system;
- the number of substations affected at step t;
- the number of substations already affected in the previous
steps
- the number of unaffected substations
The black, red and green segments length corresponds to the
values, given the total length of the main chart
corresponding to .
The details chart renders the shares of each of the component classes
in the total number of the system components affected in the current
step. The details chart should be read as: „from the substations
affected in step t the most numerous are the 225kV, followed by
400kV and 150kV‟. The relationship between the numbers of
substations in each class is given by the length of each of the
segments. The actual number of the substations may be found in the Case Report (details in Action
Synchronization section).
The Cascade Case Report Panel
Figure 19. [CCA] The Cascade Case Navigator
Figure 20 The Cascade Case Chart
23 | P a g e
A report characterizing the scenario is generated on the fly by CEIPSec while opening a case. The report
contains a basic description of the system and statistics on each of the cascade effects case. The statistics of each
step are presented in a step cartouche. The report is accommodated in the Cascade Case Report Panel (Fig. 21).
The report is presented in a narrative form, thus facilitating readability.
Figure 21. The Cascade Case Report Panel
The Case details section offers system related information (the number of substations and transmission lines of
the system). A step cartouche has the format:
Step 1 out of 3
A total number of X substations and Y lines have been affected.
Of which:
X1 400kV substations
X2 225kV substations.
X3 150kV substations.
and
Y1 380kV - 499kV lines.
Y2 220kV - 299kV lines.
Y3 other.
The Cascade Case Report is interactive. The user may interact with the report by:
Placing the mouse over a step cartouche, case in which the paragraph gets highlighted (Fig.22(b))
Clicking on a step cartouche which leads to setting the current step the one addressed by the cartouche.
The last point indicates that navigation through the cascade case steps may be performed (in addition to using
the Navigation Control) by using the Case Report.
24 | P a g e
The cartouche corresponding to the current step is
in a selected state (i.e. has a particular background
colour, depending on the application theme). This
facilitates finding the current step information when
scrolling the report in the case of scenarios with a
large number of steps.
Action Synchronization
The information in Map and Case Report panels is
synchronized. The following user actions are
available:
User selects a step in the Report Panel.
This results in a correspondent map and
charts refresh in the Map panel.
User selects a step using Case Navigator.
This results in selecting the correspondent
step cartouche in the Case Report Panel.
User hovers (places the mouse) the current
step segment (red) of Substations or Lines
charts. This results in highlighting the
current step cartouche in the Case Report.
User hovers the details chart segments.
This results in highlighting the
correspondent numerical information in the
Case Report (Fig. 22(c)).
Q & A
The following are some of the answers the analyst
may get by using the Cascade Case Assessor tool:
Q1. Which are the system‟s components
affected in a given step?
A1. Look at the red components on the map; or
Read the step cartouche in the case report.
Q2. Which are the system‟s components already
affected?
A2. Look at the black components on the map;
or
Check the step cartouches preceding the
selected one in the case report.
Q3. Which is the failure „spread‟?
A3. Look at the „non-green‟ spatial distribution
on map; or
Q4. Which is the overall impact?
A4. Look at the relationship between the „non-
green‟ and „green‟ system components on map; or
(a)
(b)
(c)
Figure 22. [CCA] Tool snapshots.
25 | P a g e
Compare the combined length (black and red) of the affected components segment with the one of the
unaffected (green) segment or with the total length of the chart.
Q5. Which is the „worst step‟ in terms of
number of simultaneously affected components?
A5. Shuffle through the steps. Focus on the
case charts and go step by step using the Case
Navigator. A „jump‟ in the size of the red segment
indicates a „bad‟ case; correlate the case with the
numerical information in the Case Report; or
Check the numerical information (number of
affected substations or number of affected lines) in
the Case Report.
Use Case Examples
The following are two examples of how Cascade
Case Assessor may come into supporting the
assessment of cascading failures in the Power
Transmission System.
Use Case 1
The analyst observes from the Case Report that the
biggest number of affected substations is in Step 3.
How does the situational map look like in this
case? Which are the affected substations? To get
this information the analyst may follow the steps:
Step 1: Click the Step 3 cartouche in the
Case Report (Fig. 23(a)).
Step 2: Minimize Case Report Panel.
Step 3: Maximize the Map Panel for better
view of the map (Fig. 23(b)).
The map corresponds to the situational map in Step
3. The system‟s components (substations and lines)
affected in the current step are the ones in red.
From here, the analyst may want to get an image of
„how much‟ is the overall system affected in step 3.
And, in addition, how many 400kV, 250kV and
150kV are affected?
The answer to the first question is obtained from
the Substations chart, by looking at the red
segment. The number of substations by class is
given:
In a qualitative manner by looking at the
Substations Details Chart; and
In a quantitative manner by hovering each
of the Substations Details Chart and
looking for the highlighted information in
the Case Report. (Fig.23(c)).
(a)
(b)
(c)
Figure 23. [CCA] Use case 1 supportive snapshots.
26 | P a g e
(a) (b)
(c) (d)
(e) (f)
(g) (h)
Figure 24. [CCA] Use case 2 supportive snapshots
27 | P a g e
Use Case 2. Failure spreading pattern
In the following case the analyst is focused on the spreading pattern of the failure (i.e. how the system becomes
unavailable).
In this particular case the relevant information on map is only the previously and currently affected
components.The failure evolution is obtained by going step-by-step using the Navigation Control and observing
the growth of the failure on maps.
An example is given is Figure 24 for a simple, four steps case.
The following steps should be followed:
Step 1: Maximize the Map Panel (Fig. 24(a)).
Step 2: Display only the relevant (active) layers, by:
(i) click Layers
(ii) turn off the base layers (all the layers that are not ending with numbers);
the map looks like in Fig. 24(c)
Step 3: Go step-by-step using the Navigation Control and observe the map.
3.4. Management. Single Case Assessor.
Target: PowerUsers
Role: Management. Single Case Assessor (MSCA) is the tool for the management of Single Case Assessor
working cases. The following is a description of the tool and its capabilities. It is assumed that the reader has
prior knowledge of the application architecture and functionality.
Using MSCA
The following operations are facilitated through MSCA:
Add new case, which entails
o Uploading NEPLAN® results files (xls format);
o Process uploaded NEPLAN® files;
Edit existing case
Delete case.
Details are given in the sequel.
Add new SCA working case
Adding a new case is a two steps procedure. First, a source NEPLAN® result file should be uploaded to the
CEIPSec server. Second, the uploaded NEPLAN® file should be processed (the procedure is automatically done
by CEIPSec, based on minimum user inputs). The new case is then ready for being used in SCA. In short,
processing the source file implies building the situational map, the additional data sets and the ArcGIS Map
Service, followed by updating the SCA cases database.
To upload a new case, follow the procedure:
Step1: Click the <Upload new NEPLAN file> button ( ). MSCA will look like
Fig.25(a)
Step2: Click <Browse> and select the NEPLAN® source file. CEIPSec will perform a
conformity check19 of the file to be uploaded.
19
Only the format of the file will be checked (MS EXCEL xls format).
28 | P a g e
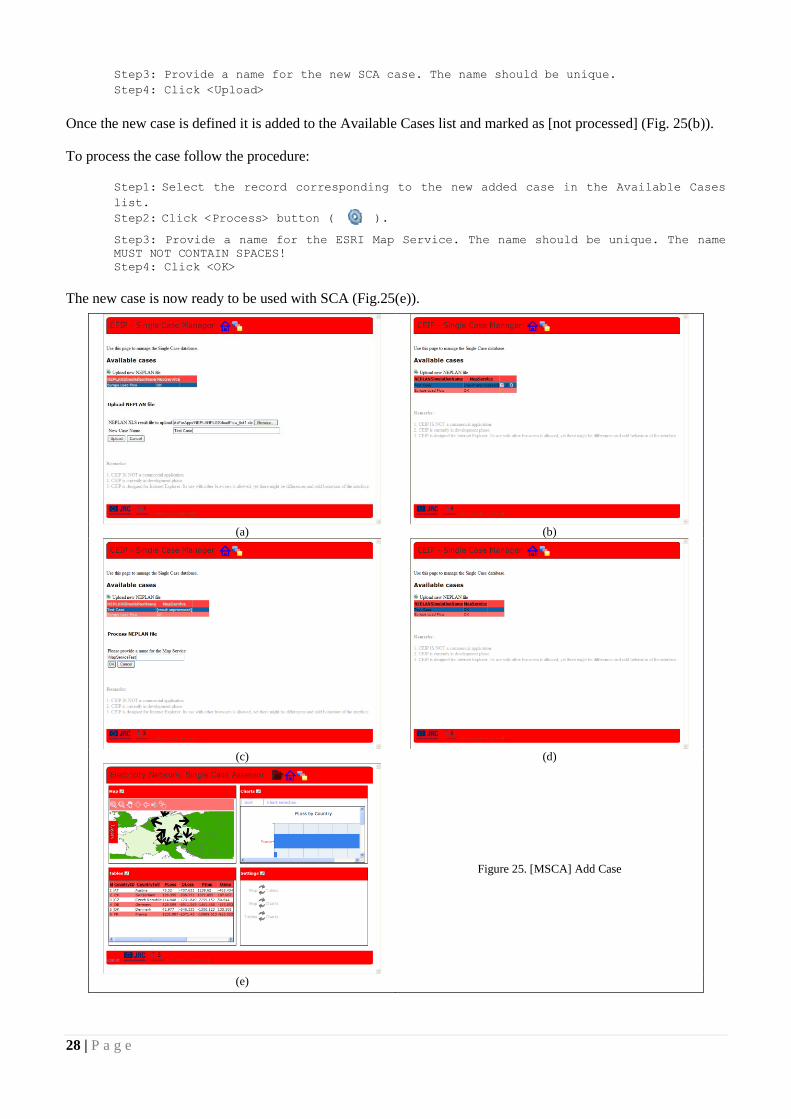
Step3: Provide a name for the new SCA case. The name should be unique.
Step4: Click <Upload>
Once the new case is defined it is added to the Available Cases list and marked as [not processed] (Fig. 25(b)).
To process the case follow the procedure:
Step1: Select the record corresponding to the new added case in the Available Cases
list.
Step2: Click <Process> button ( ).
Step3: Provide a name for the ESRI Map Service. The name should be unique. The name
MUST NOT CONTAIN SPACES!
Step4: Click <OK>
The new case is now ready to be used with SCA (Fig.25(e)).
(a) (b)
(c) (d)
Figure 25. [MSCA] Add Case
(e)
29 | P a g e
Edit case
Editing a case allows modifying the case Simulation name and / or Map service. Note that changing the map
service does not create a new map service on the GIS server. This option should be used for updating the SCA
map service in the case of modification of the map service name / location on the GIS server.
To enter the Edit mode:
Step1: Select the SCA case in the Available Cases list.
Step2: Click <Edit> ( )
MSCA interface in Edit mode is given in Fig. 26(a).
Delete case
Used for removing a SCA case. The following options are available:
Delete map service – removes the SCA case map service from the GIS server.
Delete map project – removes the SCA map project (mxd and shape files) from CEIPServer.
Delete NEPLAN source – removes the SCA case NEPLAN® source file.
Delete case files – removes the SCA case additional data sets.
To delete a SCA case:
Step1: Select the SCA case in the Available Cases list.
Step2: Click <Remove case> ( )
MSCA interface in Delete mode is given in Fig.26(b).
(a) (b)
Figure 26. [MSCA] Edit and Delete record.
3.5. Management. Cascade Case Assessor.
Target: PowerUsers
Role: Management. Cascade Case Assessor (MCCA) is the tool for the management of Cascade Case Assessor
working cases. The following is a description of the tool and its capabilities. Same as in the previous section
case, prior knowledge of the application architecture and functionality is required.
Using MCCA
The following operations are facilitated through MCCA:
30 | P a g e
Add new case
Edit existing case
Delete case.
Each will be detailed in the sequel.
Add new CCA working case
MCCA provides the interface for facilitating the construction of the Cascade Effects Case setting file (Fig.
[X](a)). The following information should be provided:
The CCA ArcGIS Map Service Name;
The CCA case name;
Layer group name – the information is
obsolete and is kept for compatibility
with previous versions of CEIPSec.
Base Substations Layer – the name of
the map layer holding the system
substations. The substations
information in the Cascade Case
Report is compiled from this layer.
The Substations Layer may be of any
kind (i.e. not necessarily an active
layer). However, the Substation Layer
must contain the substations
information required by the
application (i.e. CATEGORY);
Base Lines Layer – the name of the map layer holding the system transmission lines. The same remarks
are valid for the lines layer.
Active Layers – the list of layers holding the step-by-step simulation results. The name of the layers
should be given as the root (common part) of the active layers;
Line info active layer – the active layer used for statistics on the transmission lines;
Info field name – the name of the data field of the active layers holding the step information;
Number of cascading effect steps.
Several features have been developed to ease the construction of a new CCA case. Thus, the Map Service
combo is automatically populated with the map services found on the CEIPSec ArcGIS Server (Fig.29(b)). For
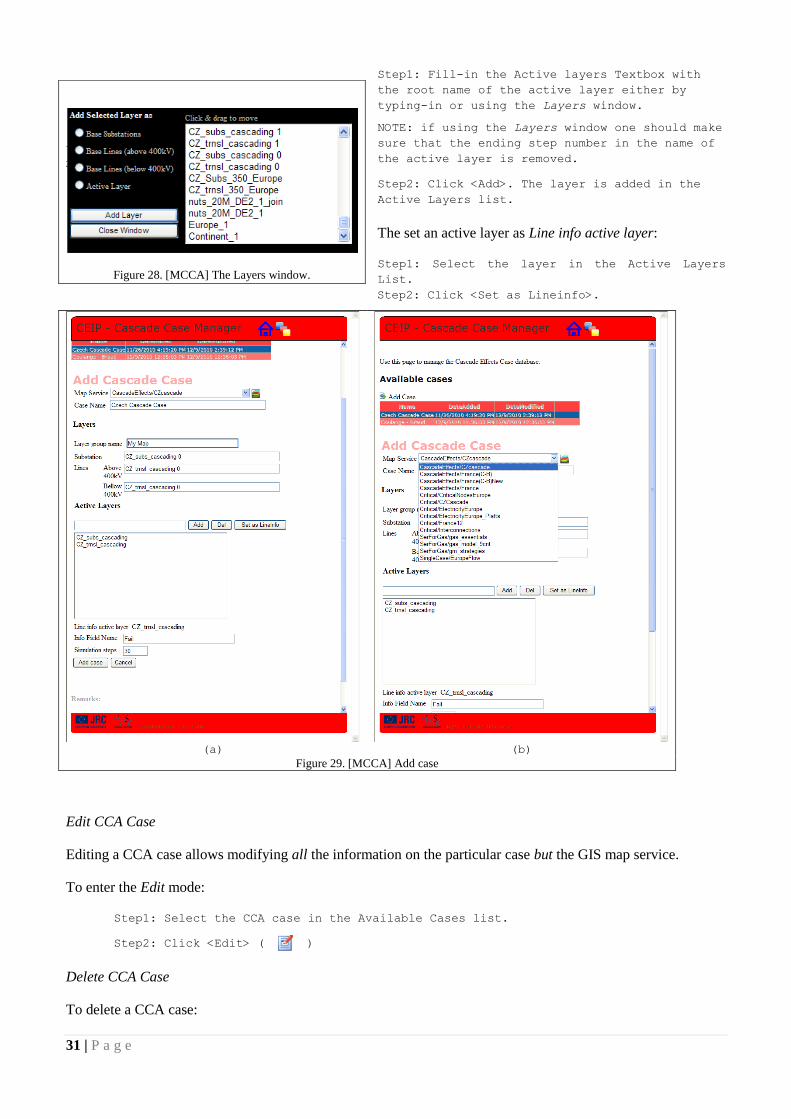
setting-up the different layers one may use the Layers window. The Layers window (Fig. 28) lists all the layers
of a given map service and also provides a way of automatically fill-in the layer names in the desired
destination.
To display the Layers window click the <Layers> button ( ).
Setting the base layers can be done either by directly typing-in the name of the layers or by using the Layers
window.
To add an active layer one should follow the procedure:
Figure 27. [MCCA] main interface
31 | P a g e
Step1: Fill-in the Active layers Textbox with
the root name of the active layer either by
typing-in or using the Layers window.
NOTE: if using the Layers window one should make
sure that the ending step number in the name of
the active layer is removed.
Step2: Click <Add>. The layer is added in the
Active Layers list.
The set an active layer as Line info active layer:
Step1: Select the layer in the Active Layers
List.
Step2: Click <Set as Lineinfo>.
(a) (b)
Figure 29. [MCCA] Add case
Edit CCA Case
Editing a CCA case allows modifying all the information on the particular case but the GIS map service.
To enter the Edit mode:
Step1: Select the CCA case in the Available Cases list.
Step2: Click <Edit> ( )
Delete CCA Case
To delete a CCA case:
Figure 28. [MCCA] The Layers window.
32 | P a g e
Step1: Select the CCA case in the Available Cases list.
Step2: Click <Remove case> ( )
Deleting a CCA case results only in removing the Cascade Case definition file from the CEIPSec server and the
case record in the cases database. The map service remains on the server.
4. Concluding Remarks and Future Developments
This document may be used as guidance for working with CEIPSec. It is mostly oriented towards users, details
on internal architecture and implementation details of CEIPSec being intentionally left outside its scope. More
technical information would be provided in a subsequent document.
CEIPSec is a research-grade, proof of concept product. The application has not been subject to systematic
debugging / testing procedures. Therefore, there are some „known issues‟ („strange‟ behaviour) coming either
from browser(s) characteristics or from the difference between development and production systems. A list of
some of the known issues is given in the sequel.
Odd appearance of the panels
Location: all the modules.
Occurrence: not systematic. This occurs with higher frequency when the application is first accessed.
Potential source: browser-related.
Workaround: re-dimensioning the browser window (maximize then restore) solves the panel layout problem.
Resource initialization failure
Location: Cascade Effects Assessor.
Occurrence: when first loading a Cascade Effects Case.
Potential source: differences between the ArcGIS versions (9.3 vs. 10) between development and production
servers.
Workaround: the failure is reported in the CEIPSec error page. When this occurs, the user should:
Go Back to the CCA by using the Back button in the error page (and NOT the browser‟s Back button);
Open the same Cascade Case again.
As a final, general rule, whenever the application goes in an error state (i.e. CEIPSec Error Page is displayed)
ALWAYS use the Back button in the error page.
CEIPSec is a proof of concept. Possible improvements / future developments address several facets of the
assessment framework, as listed below:
A. Augmenting the simulation models set (i.e. addressing other infrastructures that can be molded onto the
CEIPSec‟s assessment framework). This mainly entails (i) the development of translation modules, with
the role of generating CEIPSec specific data from the results of the sector-specific simulators and (ii)
plugging-in the new modules into the existing CEIPSec application.
Possible candidates are:
a. The European Gas System – the most at hand, since impact studies on the gas system have also
been subject of this Administrative Arrangement, being addressed by ESU Petten;
33 | P a g e
b. The transportation system (road / rail);
c. The ICT system – a more problematic business due to the lack or scarcity of data and ICT
security and impact assessment methodology and tools.
B. On the Application
a. A thoroughly testing / debugging in order to provide a more stable, mature application.
b. Better security in terms of information transmission over the network, mainly entailing the
encryption of data between client and server (in the current version the data is passed in „clear-
format‟ which makes CEIPSec vulnerable for e.g. „man-in-the-middle‟ attacks).
c. Implementation of comparative assessment capabilities. As in the current format CEIPSec only
delivers one scenario for assessment. The capability of having several scenarios opened
simultaneously and also compared with each other should definitely be taken into account.
d. Enhancing the framework with „scenarios building‟ capabilities. In the current form, CEIPSec
only acts as results visualization platform. Scenario building would provide to the stakeholders
an integrated and intuitive way of generating simulation-request.
C. On the assessment framework - Automating the simulation phase in a „fire-and-forget‟ manner.
As mentioned in the introductory section of this document, simulating complex networks might be (and
in most cases is) an intricate, time consuming process. Developing an application that would encompass
the assessment workflow (i.e. define, run, assess scenarios) in a sequential manner is not a good
approach since long simulation times is synonym with long dead-time for the user / analyst. This is even
more valid for web-based applications since pretending the user to stare at a frozen browser window for
even 2 minutes would be preposterous.
The contemplated solution is to treat the request, simulation and assessment phases separately. In this
approach, the user would generate / build the new scenario(s) and send it / them to a simulation queue.
While simulation occurs the user is free to use the application for e.g. assessing previously run
scenarios, or even leave the application completely. Once simulation is performed the user is informed
and can access the results.
Naturally the success of such approach also depends on external factors, mainly on the third party
sector-specific simulator software. The feasibility of this approach will be further investigated.
34 | P a g e
ANNEXES
Annex 1. CEIPSec Architecture
The main components of CEIPSec are given in
Figure A.1.
CEIPSec Application is the ASP.NET project of the
application. It is published through Microsoft
Internet Information Server (IIS).
The ArcGIS provides the mapping capabilities for
CEIPSec. In other words, CEIPSec consumes the
geographical information from the ArcGIS server.
Scenarios Database is the database containing the
definition information for the SCA and CCA
working cases (case name, correspondent map
service name, date created, etc.)
CEIPSec Directories are the folders on server used
by the application for different tasks. It is
recommended for the CEIPSec Directories to be all
located under a common parent folder. There are no
restrictions in terms of naming the folders. In order to be used by CEIPSec the CEIPSec Directories must be
defined in the „web.config‟ file of the CEIPSec Application. Figure A.2 depicts a possible CEIPSec Directories
structure:
CascadeEffectsSet – holds the CCA working cases non-
geographical data;
SingleCasesSet – holds the SCA working cases geographical and
non-geographical data;
NEPLANFiles – is the repository for the uploaded NEPLAN® files;
TEMPLATES – holds the full MXD project used as template for the
SCA maps.
For the given CEIPSecDirectories the „web.config‟ should contain under the
The next annexes describe what happens „under the hood‟ when Single Case Assessor and Cascade Case
Assessor working cases are generated.
Figure A.1. CEIPSec main components.
Figure A.2. CEIPSec Directories.
Example
C:\
+ CascadeEffectsSet
+ SingleCasesSet
+ NEPLANFiles
+ TEMPLATES
- CEIPSec DATA
35 | P a g e
Annex 2. Single Case Assessor Working Case.
A Single Case Assessor [SCA] working case is defined by:
An ArcGIS map service referencing an ArcGIS project file (mxd) containing a set of ESRI shapefiles.
The map service is consumed in the Map Panel of the [SCA] application.
A dataset file containing the impact data at country level. This data is consumed by the charts and
numerical panels of the [SCA] application.
Construction of a new case.
A [SCA] case is created in two steps: (i) upload the NEPLAN® excel file to the CEIPSec server; (ii) and process
the uploaded file.
In the sequel the CEIPSec folders name are considered the ones given in Annex 1.
Figure A.2. SCA. New case workflow.
The NEPLAN® excel files are saved into the CEIPSec‟s [NEPLANFiles] folder. Let it be reminded that in the
Process Case phase (Section Management. Single Case Assessor) the user is required to provide a Simulation
Name and a Map Service Name. Once this information is provided the following occurs (Fig. A.2.).
1. Create the [SCA] case data sources based on the NEPLAN® file.
[SCA] data sources for a given case are the situational map and the additional data (source for charts and
numerical panel). The data sources are generated by parsing the NEPLAN® file.
36 | P a g e
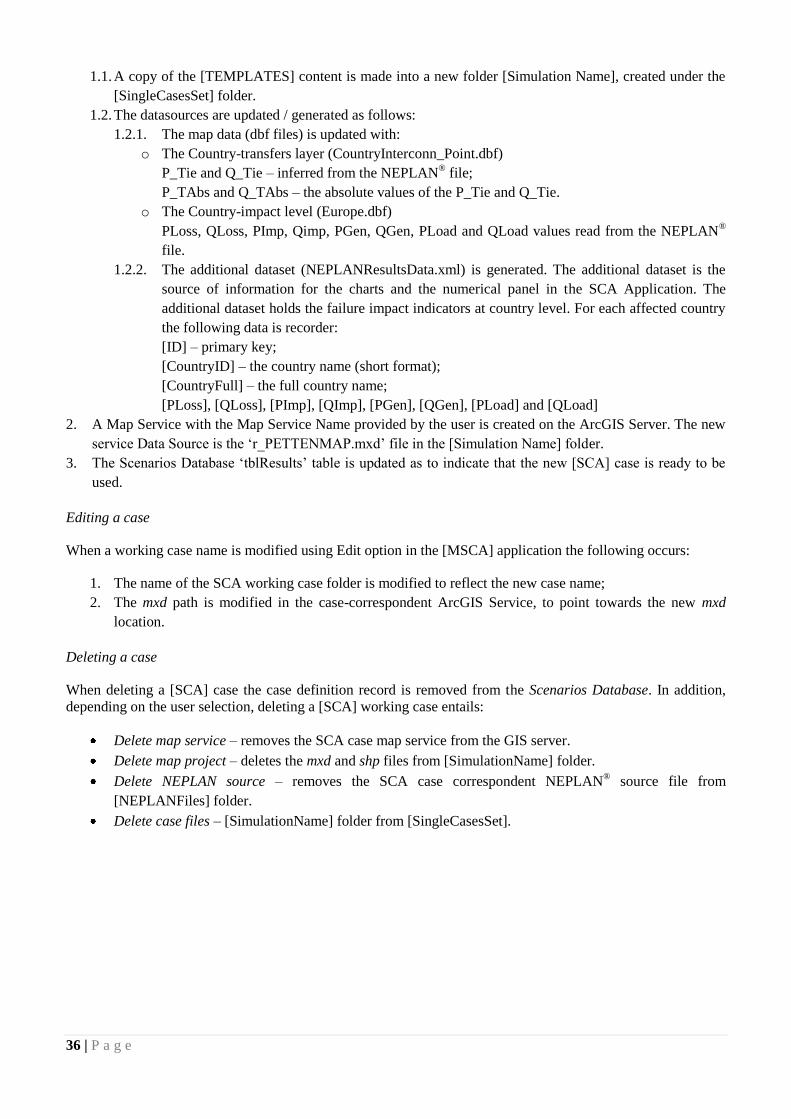
1.1. A copy of the [TEMPLATES] content is made into a new folder [Simulation Name], created under the
[SingleCasesSet] folder.
1.2. The datasources are updated / generated as follows:
1.2.1. The map data (dbf files) is updated with:
o The Country-transfers layer (CountryInterconn_Point.dbf)
P_Tie and Q_Tie – inferred from the NEPLAN® file;
P_TAbs and Q_TAbs – the absolute values of the P_Tie and Q_Tie.
o The Country-impact level (Europe.dbf)
PLoss, QLoss, PImp, Qimp, PGen, QGen, PLoad and QLoad values read from the NEPLAN®
file.
1.2.2. The additional dataset (NEPLANResultsData.xml) is generated. The additional dataset is the
source of information for the charts and the numerical panel in the SCA Application. The
additional dataset holds the failure impact indicators at country level. For each affected country
the following data is recorder:
[ID] – primary key;
[CountryID] – the country name (short format);
[CountryFull] – the full country name;
[PLoss], [QLoss], [PImp], [QImp], [PGen], [QGen], [PLoad] and [QLoad]
2. A Map Service with the Map Service Name provided by the user is created on the ArcGIS Server. The new
service Data Source is the „r_PETTENMAP.mxd‟ file in the [Simulation Name] folder.
3. The Scenarios Database „tblResults‟ table is updated as to indicate that the new [SCA] case is ready to be
used.
Editing a case
When a working case name is modified using Edit option in the [MSCA] application the following occurs:
1. The name of the SCA working case folder is modified to reflect the new case name;
2. The mxd path is modified in the case-correspondent ArcGIS Service, to point towards the new mxd
location.
Deleting a case
When deleting a [SCA] case the case definition record is removed from the Scenarios Database. In addition,
depending on the user selection, deleting a [SCA] working case entails:
Delete map service – removes the SCA case map service from the GIS server.
Delete map project – deletes the mxd and shp files from [SimulationName] folder.
Delete NEPLAN source – removes the SCA case correspondent NEPLAN® source file from
[NEPLANFiles] folder.
Delete case files – [SimulationName] folder from [SingleCasesSet].
37 | P a g e
Annex 3. Cascade Case Assessor Working Case
A Cascade Case Assessor [CCA] working case is composed of:
An ArcGIS map service referencing an ArcGIS project file (mxd or msd) built after a predefined scheme
(described in the sequel).
A Cascade Effects Scenario Definition File holding the definition of the current case and the
information about case report generation data sources, as described below.
Figure A.3. CCA. Working case.
38 | P a g e
For each Cascade Case the information about the constituent parts are held into the [tblCascadeCases] table of
the CEIPSec‟s Scenarios Database. Each cascade effects case record holds:
[Name] – the name of the scenario;
[DataSourcePath] – the map project name (without the mxd / msd) extension;
[MapServiceName] – the name of the ArcGIS Map Service pointing at the [DataSourcePath] project;
[DateAdded] – the date the new case has been created;
[DateModified] – the date when the case has been last modified;
[LayerGroupName] – obsolete information kept for compatibility with previous versions of CEIPSec.
The Cascade Effects Scenario Definition File ([CESD]) is automatically created when a new Cascade Effects
Case is added to CEIPSec by using [MCCA] Application. [CESD] holds information that characterizes the
working case in terms of:
Number of steps of the Cascade Effects scenario;
Name of the Substations Base Layer
Name of the Lines Base Layer
List of the case Active Layers (the ones turned on/off when navigating between steps)
Name of the data field holding the cascade effect step.
When a working case is opened in [CCA] a Case Report is generated on-the-fly from the data provided by the
Case Map Service. The case report is compiled from information in different data sources (see Fig.A.4.); the
data sources are indicated in the [CESD] file. The link between the case report and the [CESD] items is given in
table below.
Requirements for Cascade Effects Cases
Creating a Cascade Effects Case implies:
i. Build the case map data sources (layers) representing
a. the system under consideration (power stations, power lines, etc.)
b. the set of layers rendering the system snapshot in each of the cascade effect step (the Active
Layers)
The format for the map data sources is ESRI Shape File.
ii. Create an ArcGIS project (mxd or msd) having as data sources the shape files in step (i);
iii. Publish / create to the ArcGIS Map Server a new Map Service referencing the ArcGIS project created in
step (ii)
iv. Create the CEIPSec [CCA] case by using the [MCCA] module and referencing the Map Service created
at step (iii).
There are several requirements that should be met in steps (i)-(iv), that are presented in the sequel.
Requirements for building the Case Map
The layers created in step (i) are the ones foreseen to play different roles in the CEIPSec CCA case. In order to
provide full compatibility with CEIPSec CCA module the following requirements should / must be met:
The Foreseen Substations Base Layer
Req.1. should contain as features all the substations composing the system.
Req.2. must have a data field (numerical) playing the role of the Info Field <InfoField>.
39 | P a g e
For each feature the value of the <InfoField> is the cascade effect step in which the substation
corresponding to the feature is reached by the failure. For setting a feature as the starting point of the
failure one should set <InfoField> value to 100.
Report Information Data Source Method
Case-related Number of Substations (total)
Substations Base Layer Count number of records
Number of Lines (total)
Lines Base Layer Count number of records
Number of Lines (per category)
The First Line Layer Query and count by:
CATEGORY = '380kV - 499kV'
CATEGORY = '220kV - 299kV'
Step-related Number of Substations (per step)
Base Substations Layer Count the results of filtering by [InfoFieldName]
Number of Substations (per step, per category)
Base Substations Layer Filter Number of Substations (per step) by: Subs400
[VOLTAGE] = 400 OR [VOLTAGE] = 380
Subs225
[VOLTAGE] = 220 OR [VOLTAGE] = 225
Subs150
[VOLTAGE] = 110 OR [VOLTAGE] = 150
SubsOther as number of all the other
records.
Number of Lines (per step)
The Step 0 correspondent of the Line Info Layer
Count the results of filtering by [InfoFieldName]
Number of Lines (per step, per category)
The Step 0 correspondent of the Line Info Layer
Filter Number of Lines (per step) by: LinesOver380
[CATEGORY] = ‘380kV – 499kV’ OR
[CATEGORY] = NULL
LinesBelow380
[CATEGORY] = ‘220kV – 299kV’
Req.3. must have a data field named [VOLTAGE].
Missing [VOLTAGE] field leads to error when opening the CCA case.
The values for [VOLTAGE] should be {110, 150, 220, 225, 380, 400}. Any other value entails the
correspondent substations being considered as other when creating the Case Report.
The Foreseen Lines-Base-Layer
Req.4. should contain as features all the transmission lines composing the system.
The Step 0 Correspondent of the Line Info Layer
Req.5. must have a data field (numerical) playing the role of the Info Field <InfoField>.
40 | P a g e
For each feature the value of the <InfoField> is the cascade effect step in which the line corresponding
to the feature is reached by the failure. For setting a feature as the starting point of the failure one should
set <InfoField> value to 100.
Req.6. must have a data field named [CATEGORY].
Missing [CATEGORY] field leads to error when opening the CCA case.
The values for [CATEGORY] should be {‘220kV – 299kV’, ‘380kV – 499kV’}. Any other value
entails the correspondent substations not being counted when creating the Case Report.
General Requirements
Req.7. the <InfoField> name must be the same in both the Substations Base Layer and Step 0 Correspondent
of the Line Info Layer.
Requirements for building the ArcGIS Project
Req. 8. The project (mxd or msd file) must be saved in CEIPSec’s <CascadeCaseXMLDescriptionPath> folder.
Req. 9. The Active Layers must be named in a {NAME ROOT} + {blank} + {step} manner
Examples:
{NAME ROOT} = ‘Cascade Effect Scenario X’
Step 0 Layer Name: ‘Cascade Effect Scenario 0’
Step 1 Layer Name: ‘Cascade Effect Scenario 1’
Step 2 Layer Name: ‘Cascade Effect Scenario 2’
Step 3 Layer Name: ‘Cascade Effect Scenario 3’
Requirements for Publishing the ArcGIS Map Service
When creating the new Map Service the path to the Map Document must be given as absolute path (e.g.
“e:\CascadeEffectsSet\myProject.mxd”).
If using ArcGIS Server Manager publish the service by using Add New Service option, under the Services tab.
DO NOT use the Browse button for providing the Map Document path. COPY the mxd file absolute path (taken
from e.g. Windows Explorer) and PASTE it to the Manager.
European Commission EUR 25950 – Joint Research Centre – Institute for the Protection and Security of the Citizen
Title: Critical Energy Infrastructure Protection: Assessment Results Communication Authors: Bogdan Vamanu, Marcelo Masera Luxembourg: Publications Office of the European Union 2012 – 42 pp. – 21.0 x 29.7 cm EUR – Scientific and Technical Research series – ISSN 1831-9424 (online) ISBN 978-92-79-29713-7 (pdf) doi:10.2788/89161 Abstract Computer simulation of real systems is most of the time a complex task, both in terms of the analytical models describing the process and the usage of the tools that implement the models themselves. The results of such tools are also mainly professional oriented. However, depending on the addressee and the goal of the assessment, communicating the results in an „out-of-the-business‟ manner is sometimes required. This document introduces CEIPSec, a web based GIS centric application developed by IPSC SCNI for results communication and visual assessment of the impact of failures on the European electrical power transport system. CEIPSec was developed within the context of the Administrative Arrangement Critical Energy Infrastructure Protection between DG ENERGY and the JRC.
z
As the Commission’s in-house science service, the Joint Research Centre’s mission is to provide EU policies with independent, evidence-based scientific and technical support throughout the whole policy cycle. Working in close cooperation with policy Directorates-General, the JRC addresses key societal challenges while stimulating innovation through developing new standards, methods and tools, and sharing and transferring its know-how to the Member States and international community. Key policy areas include: environment and climate change; energy and transport; agriculture and food security; health and consumer protection; information society and digital agenda; safety and security including nuclear; all supported through a cross-cutting and multi-disciplinary approach.