PLEASE SCROLL DOWN FOR ARTICLE This article was downloaded by: [University of Texas Austin] On: 9 November 2010 Access details: Access Details: [subscription number 907743824] Publisher Taylor & Francis Informa Ltd Registered in England and Wales Registered Number: 1072954 Registered office: Mortimer House, 37- 41 Mortimer Street, London W1T 3JH, UK Critical Reviews in Plant Sciences Publication details, including instructions for authors and subscription information: http://www.informaworld.com/smpp/title~content=t713400911 The Visible, Sustainable Farm: A Comprehensive Energy Analysis of a Midwestern Farm Aaron W. Baum ab ; Tadeusz Patzek ac ; Martin Bender b ; Steve Renich b ; Wes Jackson b a Civil and Environmental Engineering Department, University of California, Berkeley b The Land Institute, Salina, KS c Petroleum & Geosystems Engineering Department, University of Texas, Austin To cite this Article Baum, Aaron W. , Patzek, Tadeusz , Bender, Martin , Renich, Steve and Jackson, Wes(2009) 'The Visible, Sustainable Farm: A Comprehensive Energy Analysis of a Midwestern Farm', Critical Reviews in Plant Sciences, 28: 4, 218 — 239 To link to this Article: DOI: 10.1080/07352680902963915 URL: http://dx.doi.org/10.1080/07352680902963915 Full terms and conditions of use: http://www.informaworld.com/terms-and-conditions-of-access.pdf This article may be used for research, teaching and private study purposes. Any substantial or systematic reproduction, re-distribution, re-selling, loan or sub-licensing, systematic supply or distribution in any form to anyone is expressly forbidden. The publisher does not give any warranty express or implied or make any representation that the contents will be complete or accurate or up to date. The accuracy of any instructions, formulae and drug doses should be independently verified with primary sources. The publisher shall not be liable for any loss, actions, claims, proceedings, demand or costs or damages whatsoever or howsoever caused arising directly or indirectly in connection with or arising out of the use of this material.
Transcript
PLEASE SCROLL DOWN FOR ARTICLE
This article was downloaded by: [University of Texas Austin]On: 9 November 2010Access details: Access Details: [subscription number 907743824]Publisher Taylor & FrancisInforma Ltd Registered in England and Wales Registered Number: 1072954 Registered office: Mortimer House, 37-41 Mortimer Street, London W1T 3JH, UK
Critical Reviews in Plant SciencesPublication details, including instructions for authors and subscription information:http://www.informaworld.com/smpp/title~content=t713400911
The Visible, Sustainable Farm: A Comprehensive Energy Analysis of aMidwestern FarmAaron W. Baumab; Tadeusz Patzekac; Martin Benderb; Steve Renichb; Wes Jacksonb
a Civil and Environmental Engineering Department, University of California, Berkeley b The LandInstitute, Salina, KS c Petroleum & Geosystems Engineering Department, University of Texas, Austin
To cite this Article Baum, Aaron W. , Patzek, Tadeusz , Bender, Martin , Renich, Steve and Jackson, Wes(2009) 'TheVisible, Sustainable Farm: A Comprehensive Energy Analysis of a Midwestern Farm', Critical Reviews in Plant Sciences,28: 4, 218 — 239To link to this Article: DOI: 10.1080/07352680902963915URL: http://dx.doi.org/10.1080/07352680902963915
Full terms and conditions of use: http://www.informaworld.com/terms-and-conditions-of-access.pdf
This article may be used for research, teaching and private study purposes. Any substantial orsystematic reproduction, re-distribution, re-selling, loan or sub-licensing, systematic supply ordistribution in any form to anyone is expressly forbidden.
The publisher does not give any warranty express or implied or make any representation that the contentswill be complete or accurate or up to date. The accuracy of any instructions, formulae and drug dosesshould be independently verified with primary sources. The publisher shall not be liable for any loss,actions, claims, proceedings, demand or costs or damages whatsoever or howsoever caused arising directlyor indirectly in connection with or arising out of the use of this material.
The Visible, Sustainable Farm: A Comprehensive EnergyAnalysis of a Midwestern Farm
Aaron W. Baum,1,3 Tadeusz Patzek,1,2 Martin Bender,3 Steve Renich,3and Wes Jackson3
1Civil and Environmental Engineering Department, University of California, Berkeley2Petroleum & Geosystems Engineering Department, University of Texas, Austin3The Land Institute, 2440 E. Water Well Road, Salina, KS 67401
6. ANALYSIS OF THE SUNSHINE FARM DATA ................................................................................................ 2286.1. Previous Studies of the Sunshine Farm Data ................................................................................................... 2286.2. Forms of Energy Accounting Used ................................................................................................................ 2286.3. Sunshine Farm Accounting Versus Previous Farm Energy Accounting Methods ................................................ 2286.4. Input-Output Matrix ..................................................................................................................................... 2286.5. Breakdown of Inputs to Exports by Type ........................................................................................................ 230
7. LABOR USAGE ON THE SUNSHINE FARM .................................................................................................. 231
8. HORSES VERSUS TRACTORS ....................................................................................................................... 232
9. COMPARISON TO PREVIOUS STUDIES OF AGRICULTURAL ENERGY EFFICIENCY ............................ 2339.1. Animal Production Energy Efficiency ............................................................................................................ 234
10. LABOR AND COMMUTING ENERGY ........................................................................................................... 23510.1.Commuting Energy ...................................................................................................................................... 235
11. NUTRITIONAL QUALITY OF FOOD PRODUCED BY THE SUNSHINE FARM ........................................... 237
Address correspondence to Tadeusz Patzek, Department of Petroleum and Geosystems Engineering, University of Texas, Austin, TX 78712-0300. E-mail: [email protected]
218
Downloaded By: [University of Texas Austin] At: 19:04 9 November 2010
ENERGY ANALYSIS OF A MIDWESTERN FARM 219
The Sunshine Farm, in central Kansas, offers a unique data setdetailing all the inputs and outputs of a farming project intendedto be based, as much as possible, on solar energy. Such a com-plete and detailed data set, encompassing more than 1.25 M datapoints for an 85-ha, 7-year project, has never before been compiledfor any farm. The data show that important energy inputs thathave thus far been left out of existing farm energy efficiency esti-mates, with implications for biofuels and other biomass for energytechnologies. The SSF achieved energy efficiencies superior to con-ventional agriculture while maintaining soil health and deliveringmore nutritious, organic products. A first-ever analysis of the en-ergy efficiency of horse traction shows that horses are significantlyless energy efficient and much less labor efficient than tractors,although the horses in the study were clearly underutilized. Ananalysis of the farm removing all inputs and outputs relevant tothe horses shows that without horses the Sunshine Farm wouldhave been competitive with conventional energy efficiencies eventaking into account the farm’s higher labor inputs and small size.
1. INTRODUCTIONHow many people can be fed in a sustainable manner?
Current chemical-based agriculture methods, while highlyproductive compared with traditional methods, require largefossil-fuel inputs and cause serious environmental impacts, suchas topsoil erosion (Reganold et al., 1987; Green et al., 2005),organic matter loss (Khan et al., 2007), elimination of microbialbiodiversity (Oehl et al., 2004), and pollution of air and water(Nations and Hallberg, 1992). As agriculture plays a major rolein human-driven climate change, the depletion of fossil fuels andenvironmental degradation, the need for low-energy, sustainablefarming techniques is clear. The merely marginal improvementsachieved by “best practices” within the conventional chemical-based system point to the need for a fundamental transformation(Dinnes et al., 2002; Randall et al., 1997). However, the energyand labor tradeoffs involved in switching to such methods havenot been fully characterized, in part due to a lack of detaileddata. Here we present the results from an unprecedentedlycomprehensive accounting of the workings of a low-input,multi-output organic farm and compare its performance withexisting studies of chemical-based and organic agriculture.
These results have implications beyond the feeding of peopleand animals. Although energy production from agriculture—i.e., biofuels and biomass—is currently being touted as a solu-tion to fossil fuel depletion, the total energy inputs to agricultureare still poorly known. Such potentially large components of en-ergy use as embodied energy of materials, buildings, labor, andcommuting energy—have not yet been studied in sufficient de-tail to answer such basic questions as whether agriculture is a netenergy source or sink. Previous studies investigating energy usein agriculture have been based on questionnaires and aggregatestatistics from surveys, rather than on continuous, on-location
monitoring and measurement (Sheehan et al., 1998a; Hill et al.,2006; Pimentel, 1980). Thus they have been limited to countingeasy-to-quantify components such as direct electricity and fossilfuel use, energy embodied in fertilizer and agricultural chemi-cals, and in some case energy embodied in farming machinery(Farrell et al., 2006; Pimentel and Patzek, 2005; Patzek, 2004).Even these studies have cast significant doubt on the net energycontent of many popular biofuels, but while the energy valueof the output fuels (and to a lesser extent, the co-products) maybe well known, many inputs have been poorly characterized.A complete picture of farming’s energy requirements, includ-ing the embodied energy of the complex array of supplies andphysical infrastructure used in agriculture, detailed fuel use inday-to-day operations, and the commuting costs of farm laborhas not been possible due to a lack of data.
Beyond energy usage, agriculture’s largest impact is thedegradation of natural resources in and around the farm, suchas erosion, depletion, and contamination of topsoil, pollution ofwater through runoff, loss of soil biodiversity, damage to wildlifeand ecosystems, and pollution of the atmosphere. Some of theseimpacts affect the farm in the long term through reduced yields.All have a negative impact on the society in which the farmis embedded. These influences are not taken into account inconventional economic analyses, where they are termed “ex-ternalities.” Including, and measuring the impacts of agriculturebeyond the short-term economics of “fertilizer and fuel in, cropsout” is essential to understanding the role of farming in a so-ciety, especially as global energy supplies tighten, populationsrise, and the long-term impacts of damaging agricultural prac-tices become plain. By examining the complete energy require-ments for sustainable, productive farming, it becomes possibleto see how farming can best integrate into a sustainable, well-nourished society of the future.
Here we present results from a multi-year, multi-output re-search farm (the “Sunshine Farm”), on which every operationinvolving energy or materials was recorded in detail. The designand operation of the farm were intended to illustrate how a sus-tainable farm might work in a future energy-limited economy;no artificial fertilizers, insecticides, fungicides, or herbicideswere used, many synergies between animals and crops wereemployed, and the farm was managed to minimize topsoil loss.A broad spectrum of physical and chemical measurements wasapplied to the farm’s soil throughout the project to monitor thesystem’s impact. Analysis of this unique data set not only pro-vides a picture of the energy footprint of almost-sustainablefarming, but also gives an example of the importance of suchdetailed data in obtaining an accurate estimate of an agriculturalsystem’s energy input:output ratio. Results from the farm alsoshow that more-sustainable farming can be energy efficient, in-deed more so than current industrial farming techniques. This isespecially relevant as biomass and biofuels from agriculture areincreasingly being posed as future energy sources for industrial-ized economies, generally without reference to the sustainabilityof production methods.
Downloaded By: [University of Texas Austin] At: 19:04 9 November 2010
220 A. W. BAUM ET AL.
As a public service, the full data from this study, as well asthe MATLAB code used to generate the results, will be madegenerally available with the publishing of this study for furtheranalysis and verification of these results.
2. SUSTAINABILITYThe energy balance of an agricultural system is only truly
meaningful when weighed against the sustainability of the sys-tem in question. Modern chemical-based agriculture relies heav-ily on subsidies from a wide range of non-renewable resources.Energy subsidies of industrial agriculture include the fossil fu-els used to make chemical fertilizer, other agricultural chemi-cals (insecticides, fungicides, herbicides, etc.), direct fuel useby machinery, and energy used for irrigation. Less visible sub-sidies include the exploitation and disturbance of natural re-sources such as drainage systems, topsoil, aquifers, and stableclimates.
Some traditional agricultural systems have fed millions ofpeople over thousands of years King (1911), more or less prov-ing their sustainability; however the populations supported bythese systems were much smaller than at present. Since neithercurrent nor historical agricultural systems are useful models ofeffective and sustainable agriculture, new systems must be de-vised and implemented (including distribution and consumptionpatterns) if all of humanity is to be fed in the future.
A sustainable agricultural system must use only renewablesources of energy, and must utilize natural resources no fasterthan they are replaced. As renewable energy sources are gen-erally more expensive than fossil fuels are currently, it can beassumed that energy will be limited in a sustainable, long-termeconomy; as such, a detailed energy budget is necessary, and toreflect the farm’s overall impact on the economy it serves, itsenergy budget must include indirect energy use as well as directuse, such as “embodied” energy—the energy required to man-ufacture and distribute goods and services. Labor commuting
energy and food transport energy must also be taken into con-sideration to obtain a complete picture of a farming system’senergy footprint.
3. SUNSHINE FARMThe Sunshine Farm, or “SSF” (Fig. 1), was run from 1992–
2001 in central Kansas. It included 20 ha of cropland, and 40 haof pasture, which increased to 65 ha of pasture in the final twoyears of the project. The primary crops were a 5-year rotation ofgrain sorghum (Sorghum vulgare), soybeans (Glycine max), oats(Avena sativa), sunflowers (Helicanthus annuus), and soybeancover employed as a green manure. These crops were planted innarrow strips (4 rows with 40-inch spacing) with different entrypoints in the rotation, so that a diversity of crops was main-tained at all times. Occasional substitutions of other crops weremade as well, such as winter wheat (Triticum aestivum) for oats,pearl millet (Pennisetum glaucum) for sunflowers, and cowpeas(Vigna sinensis) or short-rotation alfalfa (Medicago sativa) forthe soybean cover. Alfalfa and sweet sorghum (Sorghum sac-charum) were grown in separate fields for animal feed. Otherfeed crops included grain sorghum, oats, pearl millet, and cow-peas, the last two being directly grazed on the crop strips bycattle. A summary of the acreage planted on the farm over theproject is shown in Figure 2. A summary of the uses of the cropacreage on the farm is shown in Figure 3. No irrigation wasemployed on the farm.
This study is based almost entirely on the data from years1992–1998, during which the farm was worked by a com-bination of tractors and horses. In the years 1999–2001, therows were widened to 20 meters to evaluate the efficiencyand effectiveness of a reduced-tillage approach using largerequipment. The crop rotation was continued through thistransition.
Animals on the farm included flocks of approximately 50egg-laying hens and 75 broilers, as well as two draft horses
FIG. 1. The Sunshine Farm near Salina, Kansas.
Downloaded By: [University of Texas Austin] At: 19:04 9 November 2010
ENERGY ANALYSIS OF A MIDWESTERN FARM 221
FIG. 2. SSF crop areas, averaged over 6 years.
and several cow-calf pairs (Texas Longhorns) on the pasture.The farm started with nine cow-calf pairs and expanded throughon-farm births to 28 by the end of the project. The layers weremainly Barred Rock hens, with a small number of Rhode IslandRed and White Leghorn during some years. The broilers wereCornish Cross.
All transactions on the farm involving energy or materialswere individually measured and recorded, with the exceptionof regularly repeated tasks, which were recorded weekly. Eachrecord included the date, object (i.e., purpose of task), task type,transaction type, power source and instruments used, managerialand other labor hours, materials and animals involved, durableitem lifetime, and the acreage affected.
FIG. 3. The Sunshine Farm crops by overall area, averaged over 6 years. Totalcrop area was 20 ha.
biodiesel
electricity
seeds
diesel
feed
animals
galvanizedsteel
gasoline
electronicssteel
rubberplastic
lumber
capital
oilmedicineconcrete
other
lead
copperpaint
photovoltaic cells
FIG. 4. All inputs to the Sunshine Farm by total embodied energy, excludinglabor. Total is 1602 GJ over 6 years.
A breakdown of the total energy inputs to the farm over thestudy period is shown in Figure 4, including the depreciation ofcapital equipment. A summary of the fuels and materials usedon the farm is shown in Tables 1 and 2, as well as the embodiedenergy factors assigned to each. The embodied energy factorsfor metal products were increased 25 percent to include energyused in fabrication (Smil, 1991; Ayres, 1994). A summary ofcapital equipment on the farm, including buildings, vehicles, andmachinery, is shown in Table 3. The depreciation of these goodsrepresented 7.7% of the farm’s total energy inputs, excludinglabor.
3.1. Farm InputsInputs to the Sunshine Farm are summarized in Figures 4
and 5.The farm took in a wide variety of feeds, seeds, fuels, and
plastic
lumber
photovoltaic cells
rubber
oil
steel
medicineconcrete
copper
electronics
paint
lead
minerals
aluminumkerosene
diesel
other
irontwine
propane
sand and gravel
oxygen
galvanized steel
asphaltacetylene
organic chemicals
FIG. 5. Miscellaneous materials used on the Sunshine Farm by total embodiedenergy. Excludes capital equipment, fuel, feed, and seeds.
Downloaded By: [University of Texas Austin] At: 19:04 9 November 2010
222 A. W. BAUM ET AL.
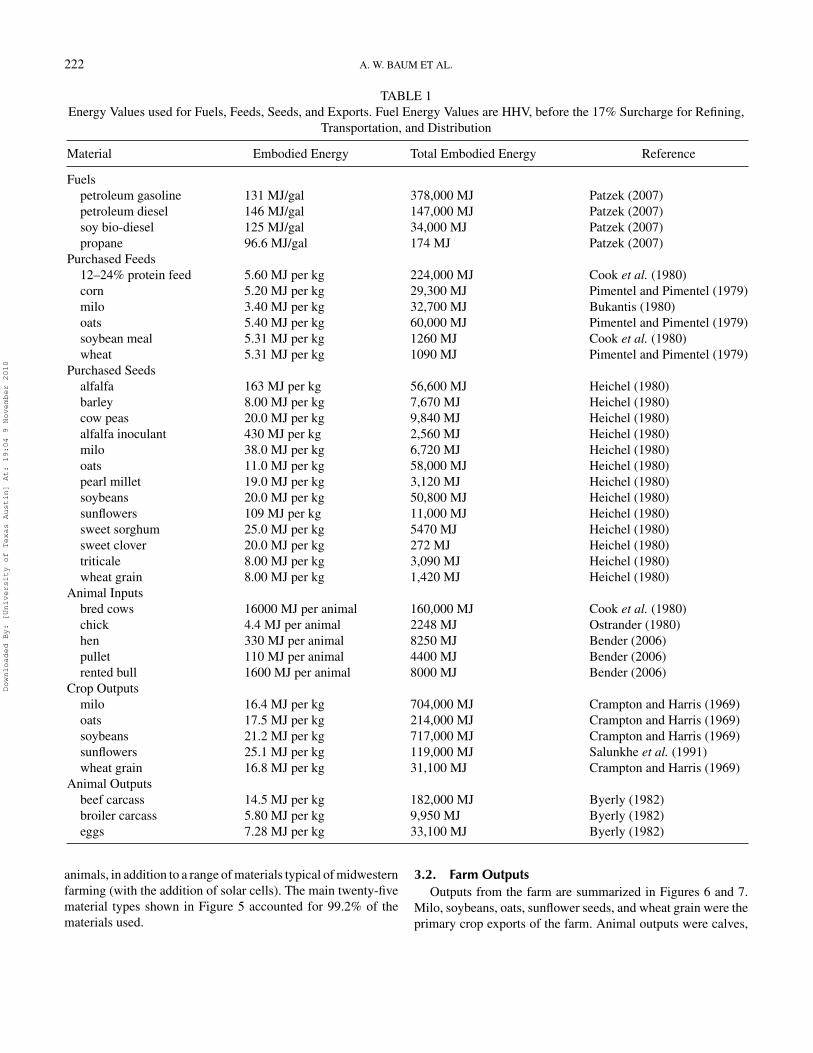
TABLE 1Energy Values used for Fuels, Feeds, Seeds, and Exports. Fuel Energy Values are HHV, before the 17% Surcharge for Refining,
Transportation, and Distribution
Material Embodied Energy Total Embodied Energy Reference
Purchased Feeds12–24% protein feed 5.60 MJ per kg 224,000 MJ Cook et al. (1980)corn 5.20 MJ per kg 29,300 MJ Pimentel and Pimentel (1979)milo 3.40 MJ per kg 32,700 MJ Bukantis (1980)oats 5.40 MJ per kg 60,000 MJ Pimentel and Pimentel (1979)soybean meal 5.31 MJ per kg 1260 MJ Cook et al. (1980)wheat 5.31 MJ per kg 1090 MJ Pimentel and Pimentel (1979)
Purchased Seedsalfalfa 163 MJ per kg 56,600 MJ Heichel (1980)barley 8.00 MJ per kg 7,670 MJ Heichel (1980)cow peas 20.0 MJ per kg 9,840 MJ Heichel (1980)alfalfa inoculant 430 MJ per kg 2,560 MJ Heichel (1980)milo 38.0 MJ per kg 6,720 MJ Heichel (1980)oats 11.0 MJ per kg 58,000 MJ Heichel (1980)pearl millet 19.0 MJ per kg 3,120 MJ Heichel (1980)soybeans 20.0 MJ per kg 50,800 MJ Heichel (1980)sunflowers 109 MJ per kg 11,000 MJ Heichel (1980)sweet sorghum 25.0 MJ per kg 5470 MJ Heichel (1980)sweet clover 20.0 MJ per kg 272 MJ Heichel (1980)triticale 8.00 MJ per kg 3,090 MJ Heichel (1980)wheat grain 8.00 MJ per kg 1,420 MJ Heichel (1980)
Animal Inputsbred cows 16000 MJ per animal 160,000 MJ Cook et al. (1980)chick 4.4 MJ per animal 2248 MJ Ostrander (1980)hen 330 MJ per animal 8250 MJ Bender (2006)pullet 110 MJ per animal 4400 MJ Bender (2006)rented bull 1600 MJ per animal 8000 MJ Bender (2006)
Crop Outputsmilo 16.4 MJ per kg 704,000 MJ Crampton and Harris (1969)oats 17.5 MJ per kg 214,000 MJ Crampton and Harris (1969)soybeans 21.2 MJ per kg 717,000 MJ Crampton and Harris (1969)sunflowers 25.1 MJ per kg 119,000 MJ Salunkhe et al. (1991)wheat grain 16.8 MJ per kg 31,100 MJ Crampton and Harris (1969)
Animal Outputsbeef carcass 14.5 MJ per kg 182,000 MJ Byerly (1982)broiler carcass 5.80 MJ per kg 9,950 MJ Byerly (1982)eggs 7.28 MJ per kg 33,100 MJ Byerly (1982)
animals, in addition to a range of materials typical of midwesternfarming (with the addition of solar cells). The main twenty-fivematerial types shown in Figure 5 accounted for 99.2% of thematerials used.
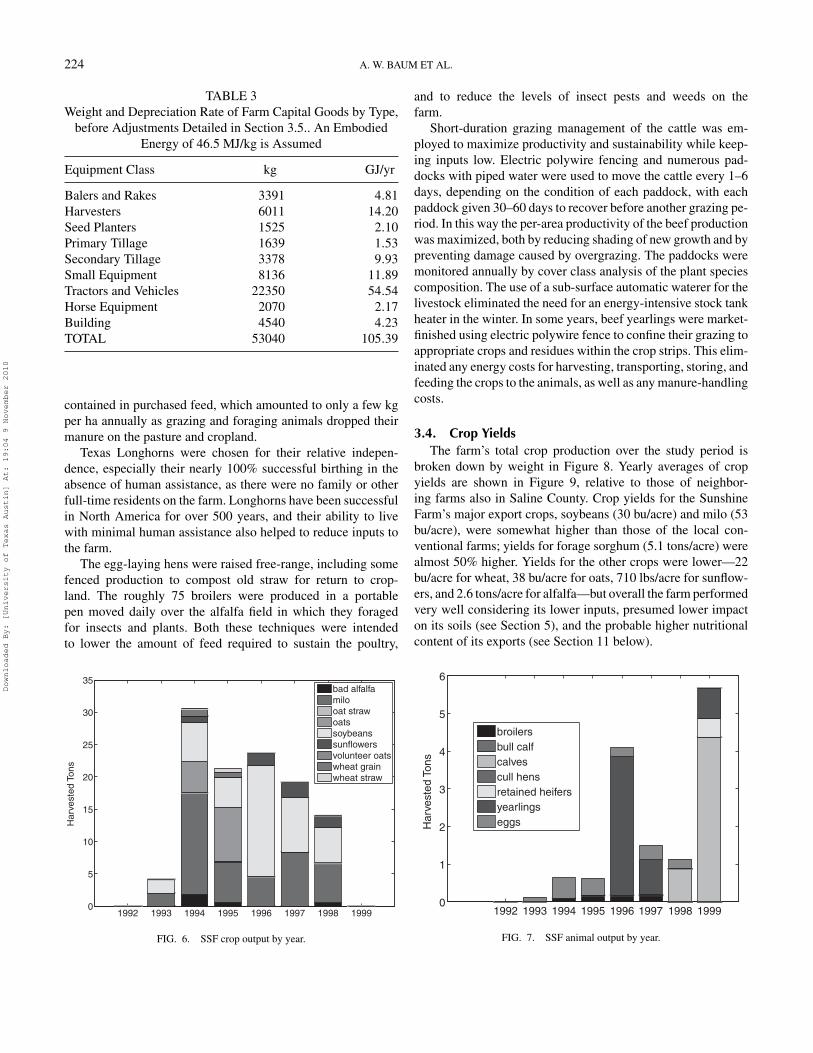
3.2. Farm OutputsOutputs from the farm are summarized in Figures 6 and 7.
Milo, soybeans, oats, sunflower seeds, and wheat grain were theprimary crop exports of the farm. Animal outputs were calves,
Downloaded By: [University of Texas Austin] At: 19:04 9 November 2010
ENERGY ANALYSIS OF A MIDWESTERN FARM 223
TABLE 2List of Materials used on the SSF
Material Embodied Energy Total Embodied Energy Reference
galvanized steel 63 MJ per kg 61,257 MJ Boustead and Hancock (1979)electronics 24 MJ per $ 51,666 MJ Casler and Hannon (1989)steel 31 MJ per kg 48,145 MJ Boustead and Hancock (1979)rubber 239 MJ per kg 38,145 MJ Stout (1984)plastic 100 MJ per kg 34,059 MJ Boustead and Hancock (1979)lumber 6 MJ per kg 27,911 MJ Boustead and Hancock (1979)photovoltaic cells 117 MJ per kg 27,217 MJ Knapp et al. (2000)lubricating oil 52 MJ per kg 24,919 MJ Boustead and Hancock (1979)medicine 9 MJ per $ 21,192 MJ Fluck et al. (1992)concrete 2330 MJ per m3 19,580 MJ Boustead and Hancock (1979)copper 163 MJ per kg 16,174 MJ Boustead and Hancock (1979)paint 200 MJ per kg 12,623 MJ Slesser (1978)lead 38 MJ per kg 11,325 MJ Boustead and Hancock (1979)minerals and salt 4 MJ per kg 9,886 MJ Craumer (1977)aluminum 325 MJ per lb 9,376 MJ Boustead and Hancock (1979)kerosene 47 MJ per kg 6,985 MJ Boustead and Hancock (1979)sand and gravel 0.1 MJ per kg 5,640 MJ Boustead and Hancock (1979)organic chemicals 46 MJ per kg 5,040 MJ McDuffie et al. (1980)diesel 46 MJ per kg 4,468 MJ Boustead and Hancock (1979)twine 12 MJ per kg 4,453 MJ Craumer (1977)propane 50 MJ per kg 3,872 MJ Boustead and Hancock (1979)iron 23 MJ per kg 3,678 MJ Boustead and Hancock (1979)acetylene 237 MJ per kg 3,614 MJ Boustead and Hancock (1979)asphalt 25 MJ per kg 3,295 MJ Leary and Mack (1980)cloth 116 MJ per kg 790 MJ Bethel (1976)fiberglass 23 MJ per kg 775 MJ Hall et al. (1979)sulfuric acid 2.6 MJ per kg 425 MJ Boustead and Hancock (1979)brass 200 MJ per kg 269 MJ Batty and Keller (1980)firewood 0.5 MJ per kg 247 MJ Tillman (1978)stainless steel 100 MJ per kg 224 MJ Boustead and Hancock (1979)oxygen 1.8 MJ per kg 206 MJ Nakamura (1974)cement 5 MJ per kg 195 MJ Chandler (1985)adhesive 78 MJ per kg 149 MJ Boustead and Hancock (1979)tin 250 MJ per kg 99 MJ Chapman and Roberts (1983)other 175 MJ
yearlings, one mature heifer, eggs, broilers, and culled hens.Alfalfa affected by mold was exported as a soil amendment butwas not counted as part of the exports from the farm.
3.3. Input-Lowering Aspects of the Sunshine FarmingSystem
The employment of multiple species of animals and plantson the farm created many opportunities to reduce the need forinputs. Animals which were sources of meat (cattle) and power(horses) were fed alfalfa, oats, rolled milo, soybean meal, sun-flower seeds, and sweet sorghum, and were allowed to forage on
barley, buckwheat, canola, cowpeas, pearl millet, triticale, andwinter peas which were grown on the crop strips. Their manure,dropped on the cropland while foraging and working, depositedfixed nitrogen and minerals from their feed and pastures, im-proving yields and reducing the need for other fertilizers. Oatand wheat straw grown on the farm were used to provide beddingfor the animals.
To eliminate the need for energy-intensive chemical fertiliz-ers, approximately 40 percent of the crops grown were nitrogen-fixing legumes, of which one-fourth were green manure andthree-fourths were forage and soybeans. The only elementalfertilizer inputs to the farm were phosphorus and potassium
Downloaded By: [University of Texas Austin] At: 19:04 9 November 2010
224 A. W. BAUM ET AL.
TABLE 3Weight and Depreciation Rate of Farm Capital Goods by Type,
before Adjustments Detailed in Section 3.5.. An EmbodiedEnergy of 46.5 MJ/kg is Assumed
contained in purchased feed, which amounted to only a few kgper ha annually as grazing and foraging animals dropped theirmanure on the pasture and cropland.
Texas Longhorns were chosen for their relative indepen-dence, especially their nearly 100% successful birthing in theabsence of human assistance, as there were no family or otherfull-time residents on the farm. Longhorns have been successfulin North America for over 500 years, and their ability to livewith minimal human assistance also helped to reduce inputs tothe farm.
The egg-laying hens were raised free-range, including somefenced production to compost old straw for return to crop-land. The roughly 75 broilers were produced in a portablepen moved daily over the alfalfa field in which they foragedfor insects and plants. Both these techniques were intendedto lower the amount of feed required to sustain the poultry,
1992 1993 1994 1995 1996 1997 1998 19990
5
10
15
20
25
30
35
Har
vest
ed T
ons
bad alfalfamilooat strawoatssoybeanssunflowersvolunteer oatswheat grainwheat straw
FIG. 6. SSF crop output by year.
and to reduce the levels of insect pests and weeds on thefarm.
Short-duration grazing management of the cattle was em-ployed to maximize productivity and sustainability while keep-ing inputs low. Electric polywire fencing and numerous pad-docks with piped water were used to move the cattle every 1–6days, depending on the condition of each paddock, with eachpaddock given 30–60 days to recover before another grazing pe-riod. In this way the per-area productivity of the beef productionwas maximized, both by reducing shading of new growth and bypreventing damage caused by overgrazing. The paddocks weremonitored annually by cover class analysis of the plant speciescomposition. The use of a sub-surface automatic waterer for thelivestock eliminated the need for an energy-intensive stock tankheater in the winter. In some years, beef yearlings were market-finished using electric polywire fence to confine their grazing toappropriate crops and residues within the crop strips. This elim-inated any energy costs for harvesting, transporting, storing, andfeeding the crops to the animals, as well as any manure-handlingcosts.
3.4. Crop YieldsThe farm’s total crop production over the study period is
broken down by weight in Figure 8. Yearly averages of cropyields are shown in Figure 9, relative to those of neighbor-ing farms also in Saline County. Crop yields for the SunshineFarm’s major export crops, soybeans (30 bu/acre) and milo (53bu/acre), were somewhat higher than those of the local con-ventional farms; yields for forage sorghum (5.1 tons/acre) werealmost 50% higher. Yields for the other crops were lower—22bu/acre for wheat, 38 bu/acre for oats, 710 lbs/acre for sunflow-ers, and 2.6 tons/acre for alfalfa—but overall the farm performedvery well considering its lower inputs, presumed lower impacton its soils (see Section 5), and the probable higher nutritionalcontent of its exports (see Section 11 below).
Downloaded By: [University of Texas Austin] At: 19:04 9 November 2010
ENERGY ANALYSIS OF A MIDWESTERN FARM 225
sweet sorghum
milo
alfalfa
soybeans
oats
sunflowers
oat strawvolunteer oats
volunteer oat strawvolunteer oat hay
wheat grainother
FIG. 8. SSF total crop yields.
3.5. Sunshine Farm Capital EquipmentA summary of the capital goods used on the Sunshine Farm is
shown in Table 3. Despite being almost 15 times smaller than theaverage Kansas farm (20 ha versus 294 ha), the Sunshine Farmhad a generous assortment of equipment, especially tractors.In fact, according to interviews with local farmers, the capitalgoods of the Sunshine Farm could have comfortably served afarm of 60 ha (Renich, 2008). In the specific case of traction,the Sunshine Farm had, in addition to the horses, three tractorsweighing 8037 kg, 2880 kg, and 1692 kg, when just two of the2880 kg (diesel) tractors would have provided more than suf-ficient traction for a 60 ha farm (Renich, 2008). Applying thisestimate to the SSF capital data set—i.e., by replacing the weightof the three tractors by the weight of two 2880 kg tractors, then
dividing the whole capital energy budget by three—presents amore accurate picture of the capital needs of the farming sys-tem, if it were implemented efficiently for a farm of at least60 ha size. With this adjustment, capital equipment represented7.7% of the total non-labor inputs. The maintenance costs of theentire equipment suite are not changed, as if these costs wouldscale linearly with the size of the farm, a conservative assump-tion. These assumptions result in a capital equipment charge 1.5× that of other studies (Hill et al., 2006). The unitary natureof many of the farming implements also suggests that farmsbelow approximately 60 ha are likely to underemploy capitalequipment, resulting in significantly lower energy efficiency.This effect would be in addition to the significant fuel savingassociated with using larger, multi-row equipment, discussedbelow.
4. FARM SOLAR ARRAYThe farm incorporated a 4.5-kW photovoltaic array of stan-
dard polycrystalline silicon wafers for the study of farm-scaleenergy generation, see Figure 10. The array contributed energybeyond that required to run the farm’s water pumps, grain auger,and single outbuilding to the local utility grid. In fact, the arraygenerated more than 5 times the total on-farm usage, so thisexport was the array’s primary function.
In our analysis, the solar array is treated as a separate entity,rather than as an integral part of the farm. This separation isprecise, and does not affect the analysis of the remainder of thefarm, due to the detailed metering and the lack of synergisticinteractions between the array and the other element of thefarm. The separation of the solar array is in contrast to the cropsand the animals of the farm, which contributed to each others’
0 0.5 1 1.5
Grain Sorghum
Soybeans
Wheat Grain
Oats
Sunflowers
Alfalfa
Forage Sorghum
Ratio of Average SSF Yield to Average Local Conventional Yield
FIG. 9. SSF crop yields compared to local conventional farms.
Downloaded By: [University of Texas Austin] At: 19:04 9 November 2010
226 A. W. BAUM ET AL.
performance in ways that are difficult to quantify (i.e., manuring,foraging, etc.).
The solar array generated 116 GJ of electricity during itssix years of operation; using this performance as an average,the array would be projected to produce 385 GJ over a 20-yearlifetime (not counting the slight degradation that such arraysexperience, or the likelihood of a significantly longer servicelife). This electricity is equivalent to 116/0.35 = 330 GJ and1100 GJ, respectively, of thermal primary energy, based on the35% electrical generation efficiency typical of coal-fired powerplants. This electricity production compares favorably to the90.7 GJ embodied in the panels themselves. However, the totalembodied energy of the materials used to construct the array andthe lead-acid battery storage system totals 344 GJ, in additionto the 13.5 GJ of fuel used to transport the components to thefarm. This includes 30.3 GJ of copper, 28.8 GJ of lead, 12.6 GJof plastic, 6.8 GJ of lumber, 13.1 GJ of steel, and 132 GJ forelectronics. Much of the copper, and a significant fraction of thefuel expended in the construction, went into tying the system tothe local power grid.
The authors believe this last figure (for battery charger and in-verter systems) to be greatly overstated, as the energy intensityof electronics (24 MJ/$) has almost certainly decreased sincethe most recent estimation of this statistic (1989) (Casler andHannon, 1989) due to miniaturization, single-chip implementa-tions, and the maturity of the industry. Furthermore, manufac-turing of such electronics has expanded greatly both since 1989and since the Sunshine Farm project, leading to economies ofscale that would reduce the embodied energy of such systems.(The only other significant use of electronics on the farm was35.6 GJ for cattle production.) Finally, the use of PV panels in anexclusively utility-grid-tied system would not only eliminate thebattery embodied energy but also the battery charger electron-ics. Large-scale application of intermittent sources such as solar
does, however, require the presence on the grid of load-balancingenergy sources—e.g., hydroelectricity or gas-fired power plants.
The solar array accounted for 277 hours of labor on the farm;223 were for construction, 51 for transport. If these are budgetedat 75 MJ/hr (see Section 10.), the labor hours amount to 20.6GJ. Adding this to the other solar array inputs results in anoutput of 1.02 GJ/ GJ input for the whole system, assuming a20-year lifetime; however this is probably an overestimate dueto the batteries having a service lifetime shorter than 20 years.Though on absolute terms this is a low yield, generating the sameamount of electricity using fossil-fuel based power plants wouldhave required fuel with almost three times the energy content aswas invested in its manufacture, installation, and operation.
Because of the relatively small size of the array, and the ad-hoc nature of its design and implementation, this result shouldnot be considered a comment on solar power in general, butperhaps it should be considered a note of caution regarding theenergy balance of “one-off” small-scale installations, especiallythose employing both battery storage and a long grid tie connec-tion. Other studies (Fthenakis et al., 2008; Knapp et al., 2000)suggest that it is possible to construct effective PV solar systemswith highly favorable energy ratios.
5. SUNSHINE FARM SOILThe Sunshine Farm soil is an alluvial silt loam soil with 2.3%
organic content typical of central Kansas, classified as an usticmollisol. This relatively low organic content is typical of long-term conventional farming in midwestern soil (Glover, 2008).It is dark-colored and organic-rich down to several feet depthand is dry many months of the year, but contains some moisturein summer (USDA-SCS, 1992). The cropland of the farm wasfarmed conventionally in wheat, soybeans, and grain sorghum(milo) for many years, but was farmed in winter wheat without
FIG. 10. The Sunshine Farm solar array, with battery-storage and electronics shed.
Downloaded By: [University of Texas Austin] At: 19:04 9 November 2010
ENERGY ANALYSIS OF A MIDWESTERN FARM 227
1993 1994 1995 1996 19970
0.5
1
1.5
ratio
to fi
rst m
easu
rem
ent
pHBray P (ppm)K (ppm)OM %CEC meq/100g)Total P (ppm)Total N (ppm)
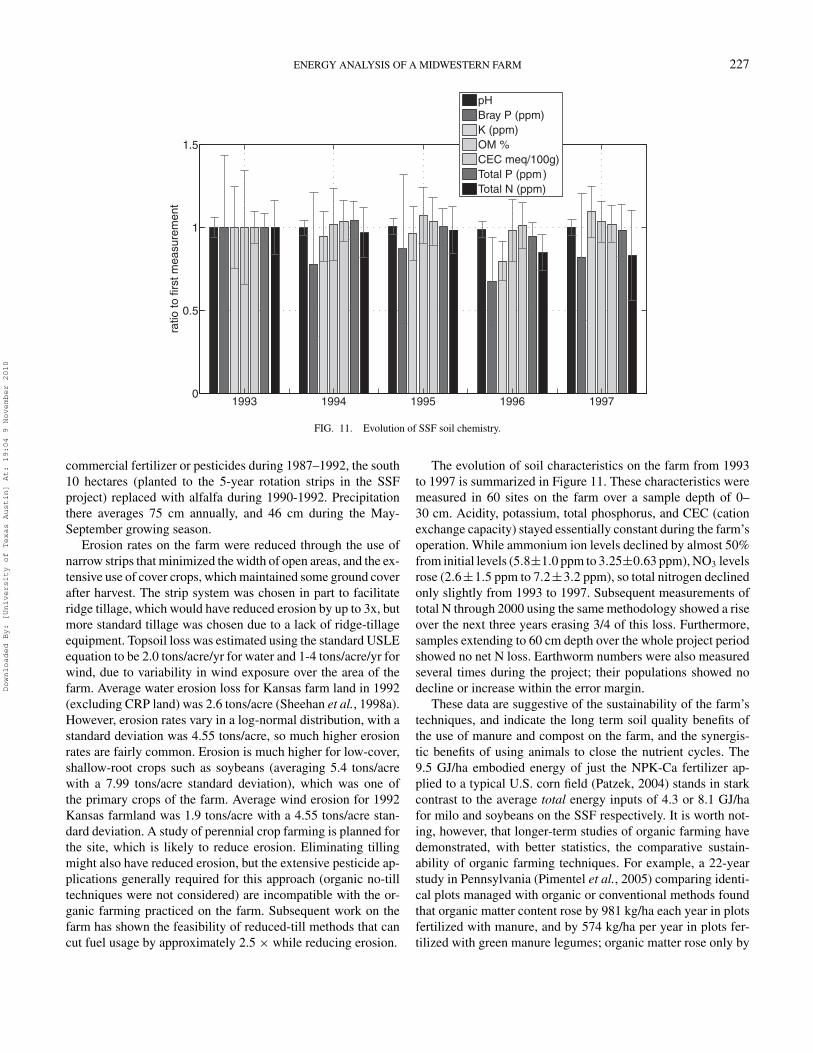
FIG. 11. Evolution of SSF soil chemistry.
commercial fertilizer or pesticides during 1987–1992, the south10 hectares (planted to the 5-year rotation strips in the SSFproject) replaced with alfalfa during 1990-1992. Precipitationthere averages 75 cm annually, and 46 cm during the May-September growing season.
Erosion rates on the farm were reduced through the use ofnarrow strips that minimized the width of open areas, and the ex-tensive use of cover crops, which maintained some ground coverafter harvest. The strip system was chosen in part to facilitateridge tillage, which would have reduced erosion by up to 3x, butmore standard tillage was chosen due to a lack of ridge-tillageequipment. Topsoil loss was estimated using the standard USLEequation to be 2.0 tons/acre/yr for water and 1-4 tons/acre/yr forwind, due to variability in wind exposure over the area of thefarm. Average water erosion loss for Kansas farm land in 1992(excluding CRP land) was 2.6 tons/acre (Sheehan et al., 1998a).However, erosion rates vary in a log-normal distribution, with astandard deviation was 4.55 tons/acre, so much higher erosionrates are fairly common. Erosion is much higher for low-cover,shallow-root crops such as soybeans (averaging 5.4 tons/acrewith a 7.99 tons/acre standard deviation), which was one ofthe primary crops of the farm. Average wind erosion for 1992Kansas farmland was 1.9 tons/acre with a 4.55 tons/acre stan-dard deviation. A study of perennial crop farming is planned forthe site, which is likely to reduce erosion. Eliminating tillingmight also have reduced erosion, but the extensive pesticide ap-plications generally required for this approach (organic no-tilltechniques were not considered) are incompatible with the or-ganic farming practiced on the farm. Subsequent work on thefarm has shown the feasibility of reduced-till methods that cancut fuel usage by approximately 2.5 × while reducing erosion.
The evolution of soil characteristics on the farm from 1993to 1997 is summarized in Figure 11. These characteristics weremeasured in 60 sites on the farm over a sample depth of 0–30 cm. Acidity, potassium, total phosphorus, and CEC (cationexchange capacity) stayed essentially constant during the farm’soperation. While ammonium ion levels declined by almost 50%from initial levels (5.8±1.0 ppm to 3.25±0.63 ppm), NO3 levelsrose (2.6±1.5 ppm to 7.2±3.2 ppm), so total nitrogen declinedonly slightly from 1993 to 1997. Subsequent measurements oftotal N through 2000 using the same methodology showed a riseover the next three years erasing 3/4 of this loss. Furthermore,samples extending to 60 cm depth over the whole project periodshowed no net N loss. Earthworm numbers were also measuredseveral times during the project; their populations showed nodecline or increase within the error margin.
These data are suggestive of the sustainability of the farm’stechniques, and indicate the long term soil quality benefits ofthe use of manure and compost on the farm, and the synergis-tic benefits of using animals to close the nutrient cycles. The9.5 GJ/ha embodied energy of just the NPK-Ca fertilizer ap-plied to a typical U.S. corn field (Patzek, 2004) stands in starkcontrast to the average total energy inputs of 4.3 or 8.1 GJ/hafor milo and soybeans on the SSF respectively. It is worth not-ing, however, that longer-term studies of organic farming havedemonstrated, with better statistics, the comparative sustain-ability of organic farming techniques. For example, a 22-yearstudy in Pennsylvania (Pimentel et al., 2005) comparing identi-cal plots managed with organic or conventional methods foundthat organic matter content rose by 981 kg/ha each year in plotsfertilized with manure, and by 574 kg/ha per year in plots fer-tilized with green manure legumes; organic matter rose only by
Downloaded By: [University of Texas Austin] At: 19:04 9 November 2010
228 A. W. BAUM ET AL.
293 kg/ha in the conventionally cultivated plots. A 51-year studyof heavily-fertilized plots in the American Midwest with simi-lar organic carbon levels showed consistent loss of soil organicmatter, amounting to 9–18% over 51 years—even when cropresidue is returned to the soil—possibly due to fertilizer-drivenacceleration of microbial activity (Khan et al., 2007). Such ratesof SOM loss would have not have been detected in this studydue to its relatively short length and larger error margins.
6. ANALYSIS OF THE SUNSHINE FARM DATA
6.1. Previous Studies of the Sunshine Farm DataThe Sunshine Farm data were analyzed previously by Bender
(2003, 2006). The present study represents an entirely freshanalysis of these data, with new tools (implemented in MAT-LAB) and a considerably different approach. Bender’s analy-sis focused on the ability of the farm to function as a self-sufficient entity, and only secondarily on the farm as an energyproducer/consumer in a larger economy.
This study does not attempt to evaluate the farm’s perfor-mance as an independent entity but as a part of an overall energyeconomy. As such, this study focuses on the energy and laborefficiencies of the exports of the farm, rather than on meansby which the farm could satisfy its own energy needs (e.g.,biofuels). The solar array is treated as a stand-alone entity (c.f.Section 4.). This approach makes possible direct comparisons toprevious studies of the particular exports of the farm, presentinga more complete evaluation of the successes and failures of theproject. This study also looks more deeply into the efficiency ofparticular elements of the farm, e.g., the horses.
6.2. Forms of Energy Accounting UsedInputs and outputs from the farm are reported here in three
different ways, reflecting their societal energy impact. Foreasily-exchanged energy resources such as fuels, caloric con-tent, expressed as high-heating value, or actual meter readingsfor electricity, reflect their value and exchangeability with sim-ilar resources such as biofuels, natural gas, and electricity (al-though relative efficiency of conversion to shaft work must betake into account, i.e., gasoline vs. diesel, internal combustionvs. electrical motors, and the efficiency of electrical genera-tion). Energy for refining, transportation, and distribution wereadded to all fossil fuels and biofuels as a 17% energy sur-charge based on estimates of this cost for petroleum-based liquidfuels (Patzek, 2004). The petroleum-based charge was used forbiodiesel bought for the farm (in effect, treating the biodieselas ordinary diesel on energy-equivalent basis) due to the highlyvariable energy costs of biofuel production, and their currentlylimited availability. No biofuels were made on the farm. Theenergy content of materials and capital goods is expressed asembodied energy, or the total energy expended in acquiringand processing the basic materials, manufacturing, assembling,transporting and distributing the finished goods to dealers, in
accordance with the standard practices of the field of EnergyAnalysis (Costanza, 1981a). Transportation from dealers to thefarm is included explicitly in the farm’s energy accounting.Thirdly, the energy embodied in labor can be accounted for in anumber of different ways; this issue is dealt with in Section 10.All results, except where specified, are calculated from the totalinputs and outputs of the farm over the study period, 1992–1998.
6.3. Sunshine Farm Accounting Versus Previous FarmEnergy Accounting Methods
To the authors’ knowledge, the Sunshine Farm database rep-resents the first truly comprehensive energy accounting of afunctioning farm. The profound differences between the ex-haustively thorough accounting of the Sunshine Farm and theestimates employed in previous studies mean that the SSF studyrepresents a new standard for farm energy accounting, and aresource for identifying uses of energy in farming that have notbeen taken into account previously. Having a completely dis-aggregated energy picture of the farm also makes it possibleto separate out all the components of the farm in spite of theirproximity, and to assess the possible energy impacts of modifica-tions to the farming system (for example, what the farm’s energyand labor efficiencies would have been without the horses; seeSection 8).
6.4. Input-Output MatrixTo deal with the complexities of the inter-relationships be-
tween the many parts of the farm—and thus obtain the energyand labor efficiencies necessary for direct comparisons with pre-vious studies—the matrix methods of economic input-outputanalysis (Treolar, 1997) were adapted for this study. For thispurpose, the farm was expressed as consisting of 70 compo-nents called objects—each capturing a portion of the farm’sactivity, including animals (horses, cattle, broilers, and layers),crop species, power sources, vehicles, and tools. Each entryinto the farm’s database included a specification of the object towhich the activity was devoted, e.g., feeding the broilers, fixinga tractor, sowing seeds for a crop, etc. To calculate the ultimateassignment of energy inputs to exports from the farm, inputs toobjects—consisting of combinations of direct fuel and electri-cal energy, material embodied energy, and labor hours—wereassigned to other objects and exports as shown in Table 4. Forexample, energy expended on care of the horses was distributedto the crops which were worked by horse labor on the basis ofacres worked.
This system of distribution of inputs among objects and ex-ports reflects the internal workings of the farm as detailed in the1.25 million record database. These relationships were used tobuild a matrix distributing input energies for individual entries toother objects and exports. This matrix was applied repeatedly, asin many cases objects contributed to each other; through theserepeated operations the inputs moved through the farm’s net-work of energetic relationships, until all the input energy was
Downloaded By: [University of Texas Austin] At: 19:04 9 November 2010
ENERGY ANALYSIS OF A MIDWESTERN FARM 229
TABLE 4How Energy and Labor Inputs to Farm Elements (objects)
Were Assigned to Exports and Other Farm Elements (objects)to Build the Input-Output Matrix
Type of ObjectMethod for Assigning to
Exports and Other Objects
Animal export To corresponding animal exportAnimal-related tools Split among animals by entry
fuel useFeed and export crop To animals and crop export by
weights fed and exportedElectrical export To electrical exportFeed To animals by weight fedField power source or
field toolTo crops by acreage treated
Non-field power source To objects based on fuel usageForage To animals by average animal
mass during seasonGreen manure To crops grown next season in
same stripsCompost and general
field prepSplit among all crops by planted
acreageInfrastructure Uniform surcharge to all inputsFarm management and
planningUniform surcharge to all inputs
Outside services To object, pro-rate maintenanceand materials
assigned to exports in a way that reflected the interrelationshipsof the components of the farm. For example, energy assigned tothe maintenance of a plow might be assigned to a green manurecrop for which it had prepared the soil, which would in turnbe applied to the following crop on that acreage, which in turnwould feed horses and other animals (with possible export ofthese animals and partial export of the crop); the horses wouldthen work on other crops, contributing to their exports and feedfor other animals, including the horses themselves. As energyassigned to exports was removed from these cycles of distribu-tions, by repeated application of these distribution rules (whoseparameters were precisely set to conserve energy), eventually all
FIG. 12. Illustration of the use of the input-output matrix to assign farm inputsto farm exports.
FIG. 13. All exports from the Sunshine Farm by their total embodied energy.Total: 2127 GJ.
inputs could be assigned to outputs. This process is illustratedin Figure 12. The final results are shown in Figure 20.
To illustrate how these calculations were carried out, take forexample an extremely simplified version of the farm, consistingof four objects: (1) an export and feed crop, (2) a green manurecrop, (3) a tractor, and (4) an animal production system. Thisfarm would have two exports: the export crop (5) and the animalproduction (6). Each object has one unit of energy going into it,represented by the following vector:
( 1 1 1 1 );
this represents direct inputs to each object, such as seeds for thetwo crops, oil for the tractor, and bought feed for the animals. Todistribute these inputs to other objects and to exports the matrixis constructed, based on relationships between the objects. In the
cattle
oatsmilo
sunflowers
soybeans
layers
broilerswheat grain
FIG. 14. SSF input energy going to each export, excluding labor.
Downloaded By: [University of Texas Austin] At: 19:04 9 November 2010
230 A. W. BAUM ET AL.
case of the Sunshine Farm, these relationships are determinedby reference to the farm database. They are represented by therows that show the fractions of an object’s inputs to assign toobjects and exports, in the order specified above. To accuratelyaccount for all the input energy, the vector’s coefficients mustadd up to 1.0 to conserve total energy.
For example, say that the farm’s database shows that half ofthe feed and export crop harvest went to feed, and the other halfto export, so its row reads
( 0 0 0 .5 .5 0 ).
The green manure crop provides fertility to the feed and exportcrop, and does not contribute to the other objects or exports, itscorresponding row of the matrix is
( 1 0 0 0 0 0 ).
The tractor works the two crops equally, so its row reads
( .5 .5 0 0 0 0 ).
The animal production contributes only to its own export, so itsrow is
( 0 0 0 0 0 1 ),
resulting in the following matrix:
0 0 0 .5 .5 01 0 0 0 0 0.5 .5 0 0 0 00 0 0 0 0 1
To distribute the inputs to the objects and exports, multiplythe input vector by the matrix, to obtain a vector of energy goinginto objects and exports:
( 1 1 1 1 )
0 0 0 .5 .5 01 0 0 0 0 0.5 .5 0 0 0 00 0 0 0 0 1
= ( 1.5 .5 0 .5 .5 1 )
Note that the sum of the elements of the result equals the sumof the inputs, satisfying energy conservation. The last two ele-ments of the resulting 6-element vector represent energy passinginto exports; the first four represent energy passing into objects.As the goal is to distribute the input energy to exports, we setaside the last two elements and distribute the first four elements
again:
( 1.5 .5 0 .5 )
0 0 0 .5 .5 01 0 0 0 0 0.5 .5 0 0 0 00 0 0 0 0 1
= ( .5 0 0 .75 .75 .5 )
The last two elements are added to the previous iteration’sexport elements to obtain 1.25 for the crop and 1.5 for the ani-mal export; the remaining energy in the first four elements nowtotals 1.25, substantially down from the 4.0 originally fed intothe system. These inputs can then be cycled in this way until theenergy being redistributed back into objects is small enough tobe neglected. In this simple case, two more cycles suffice to dis-tribute all the inputs to exports, resulting in a final result of 1.5units of input to the crop export, and 2.5 units of input to the an-imal export. All energy exports from SSF and the energy inputsthat contributed to these exports are shown in Figures 13 and 14.
6.5. Breakdown of Inputs to Exports by TypeA breakdown of the proportions of the inputs into the farm
exports by type—fuel (including electricity), feed, seed, animal,capital, and supply (all other materials, as described below) isshown in Figure 15. The proportions of these types for the majorcrops of the farm—milo, soybeans, oats, and wheat grain—are roughly similar, with oats and soy showing higher seedinput energy due to higher per area seed application rates. The“supply” category of miscellaneous materials, unaccounted forin previous studies, is substantial, 15% and higher, for everyexport. Capital equipment inputs for the crops is relatively smallbut significant, amounting to 11–13% for the major crops. Forthe animal exports, feed is a major input, although it is smallerfor the cattle, due to their ability to feed themselves by grazingon the farm’s pastureland.
Remark 1 The fraction of the “Supplies” portion of the SSFenergy inputs, representing energy inputs relating to other ma-terial inputs, can be seen in the diagram, and demonstrates asignificant flaw in all previous farming energy studies. This cat-egory represents all of the materials—from galvanized steel torubber and lumber—that were used on the farm, and which arenot accounted for in previous studies.
Although there are no data on the subject, it is obvious thatsuch materials are also used on other farms, in spite of thefact that such use is not tracked, and in spite of the differencesbetween the production techniques of the Sunshine Farm andconventional farms there is no particular reason to believe thatratios between supplies and other forms of energy consumptionwould be radically different.
Remark 2 If these ratios were similar in different farms, theywould have profound implications for policy decisions regard-ing biomass and biofuels, as the energy ratios of these productswould become significantly worse, limiting their usefulness in
Downloaded By: [University of Texas Austin] At: 19:04 9 November 2010
ENERGY ANALYSIS OF A MIDWESTERN FARM 231
0 0.2 0.4 0.6 0.8 1 1.2 1.4
broilers
cattle
layers
milo
oat straw
oats
soybeans
sunflowers
wheat grain
wheat straw
Fraction of Export Inputs
fuelsupplyfeedseedanimalcapital
FIG. 15. Energy use fractions by type for major exports.
the overall economy. In the case of corn ethanol, taking accountof these materials could eliminate the energy surplus calcu-lated in the most recent studies (Farrell et al., 2006; Shapouriet al., 2003; Shapouri and McAloon, 2004; Graboski, 2002),even without taking into account the adverse environmental im-pacts of conventional corn farming.
7. LABOR USAGE ON THE SUNSHINE FARMLabor efficiency—GJ of exported goods per labor hour—is
shown for each major export in Figure 16. These ratios are cal-culated using the same methods used to allocate energy inputsto exports, so that all recorded labor on the farm is allocated toone or more exports through the input-output matrix discussedin the section above. This means that in addition to the obviouslabor costs such as animal feeding, plowing, seeding, water-ing, harvesting, etc. accounted for in previous studies, indirectlabor costs such as management, equipment repair and mainte-
0 0.2 0.4 0.6 0.8 1 1.2 1.4
broilers
cattle
layers
milo
oat straw
oats
soybeans
sunflowers
wheat grain
wheat straw
GJ output per labor hour
FIG. 16. Labor efficiency of SSF major exports.
nance, trips to local merchants, construction, etc. can be takeninto account and properly allocated using the details of theirdatabase entries. Furthermore, labor on crops used in part asfeed can be accurately allocated to animals fed by these crops,with any exported portion receiving its own portion of the la-bor. As in the energy case, the result is a picture of on-farmlabor usage far more detailed and accurate than ever beforeavailable.
Labor hours per gigajoule of exported product follows similartrends to the energy ratios. Animal products are far less efficientthan the crops, owing to the large amounts of daily labor involvedin feeding and caring for animals as well as growing the cropsthey ate. Beef production is more labor-efficient than either thelayers or broilers, as the cattle required less feeding and othercare in proportion to their output. Oats are particularly efficientdue in part to a single crop of volunteer (not intentionally seededor plowed) oats which required very little labor to produce.
milo oats soybeans wheat grain0
5
10
15
20
25
30
35
Hou
rs/H
ecta
re
SSF Direct Labor HoursConventional Farming Labor Hours
FIG. 17. Labor per hectare for exported crops.
Downloaded By: [University of Texas Austin] At: 19:04 9 November 2010
232 A. W. BAUM ET AL.
Figure 17 compares labor hours per hectare of cropland onthe SSF to labor hours in conventional agriculture. This figureshows labor directly attributable to the crops—only work doneexplicitly for the purpose of growing crops. This is for directcomparison to the previous studies.
Per-hectare labor rates are much higher than in conventionalagriculture, at 2.7 × for milo, 2.7 × for soybeans, 5.2 × for oats,and 5.2 × for wheat. The Sunshine Farm labor statistics includeboth field operations and transport of the harvested crops tolocal buyers. It is not known if the other labor estimates includethis transportation charge; however, it amounts to only 3–5%percent of labor hours for the important crops of the farm. Thesmall size of the tractors (and the horse-drawn implements) usedon the farm contributed to higher labor hours, as did the smallsize of the farm and the use of several different crop types,leading to inefficiencies due to setup times for a larger numberof separate tasks on the farm. Horses require 1.6 × and 2.3 ×more direct field labor per treated hectare than the two maintractors of the farm; however, this requirement has little impactas the horse only treated 6.4% of the total area worked on thefarm. Horse care and management entailed 13.7% of all laboron the farm. The complete energy impact of the horses on thefarm is addressed in the next section.
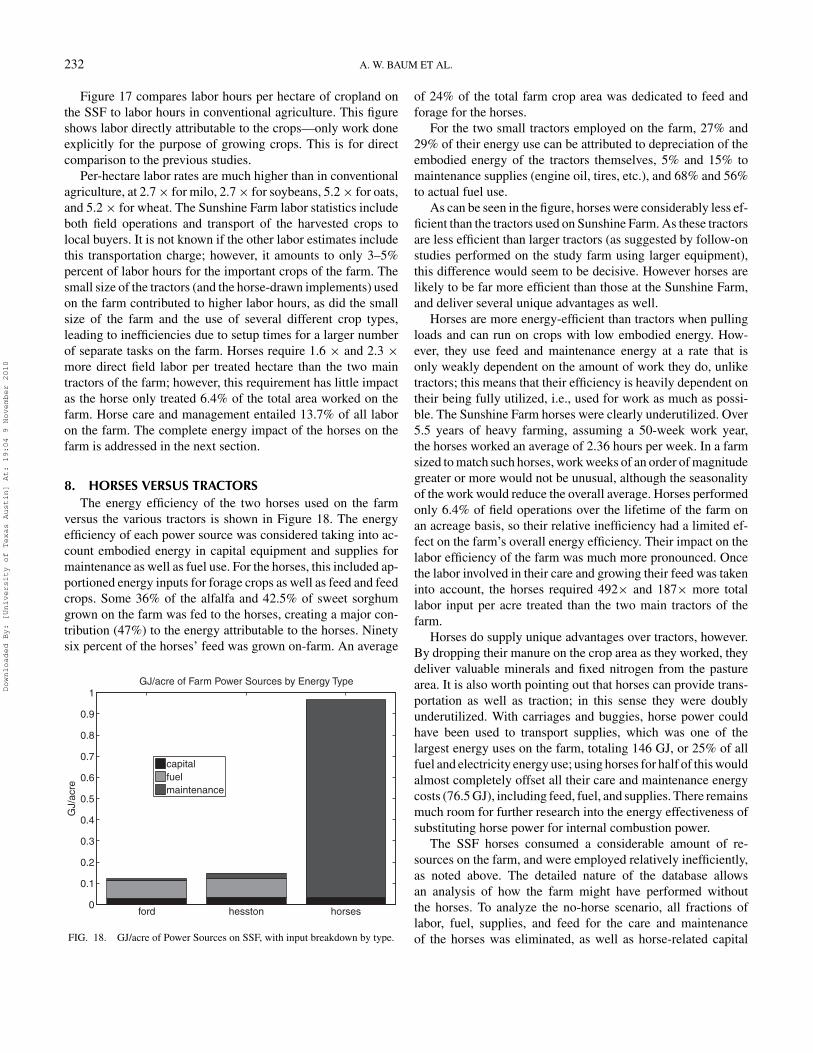
8. HORSES VERSUS TRACTORSThe energy efficiency of the two horses used on the farm
versus the various tractors is shown in Figure 18. The energyefficiency of each power source was considered taking into ac-count embodied energy in capital equipment and supplies formaintenance as well as fuel use. For the horses, this included ap-portioned energy inputs for forage crops as well as feed and feedcrops. Some 36% of the alfalfa and 42.5% of sweet sorghumgrown on the farm was fed to the horses, creating a major con-tribution (47%) to the energy attributable to the horses. Ninetysix percent of the horses’ feed was grown on-farm. An average
ford hesston horses0
0.1
0.2
0.3
0.4
0.5
0.6
0.7
0.8
0.9
1
GJ/
acre
GJ/acre of Farm Power Sources by Energy Type
capitalfuelmaintenance
FIG. 18. GJ/acre of Power Sources on SSF, with input breakdown by type.
of 24% of the total farm crop area was dedicated to feed andforage for the horses.
For the two small tractors employed on the farm, 27% and29% of their energy use can be attributed to depreciation of theembodied energy of the tractors themselves, 5% and 15% tomaintenance supplies (engine oil, tires, etc.), and 68% and 56%to actual fuel use.
As can be seen in the figure, horses were considerably less ef-ficient than the tractors used on Sunshine Farm. As these tractorsare less efficient than larger tractors (as suggested by follow-onstudies performed on the study farm using larger equipment),this difference would seem to be decisive. However horses arelikely to be far more efficient than those at the Sunshine Farm,and deliver several unique advantages as well.
Horses are more energy-efficient than tractors when pullingloads and can run on crops with low embodied energy. How-ever, they use feed and maintenance energy at a rate that isonly weakly dependent on the amount of work they do, unliketractors; this means that their efficiency is heavily dependent ontheir being fully utilized, i.e., used for work as much as possi-ble. The Sunshine Farm horses were clearly underutilized. Over5.5 years of heavy farming, assuming a 50-week work year,the horses worked an average of 2.36 hours per week. In a farmsized to match such horses, work weeks of an order of magnitudegreater or more would not be unusual, although the seasonalityof the work would reduce the overall average. Horses performedonly 6.4% of field operations over the lifetime of the farm onan acreage basis, so their relative inefficiency had a limited ef-fect on the farm’s overall energy efficiency. Their impact on thelabor efficiency of the farm was much more pronounced. Oncethe labor involved in their care and growing their feed was takeninto account, the horses required 492× and 187× more totallabor input per acre treated than the two main tractors of thefarm.
Horses do supply unique advantages over tractors, however.By dropping their manure on the crop area as they worked, theydeliver valuable minerals and fixed nitrogen from the pasturearea. It is also worth pointing out that horses can provide trans-portation as well as traction; in this sense they were doublyunderutilized. With carriages and buggies, horse power couldhave been used to transport supplies, which was one of thelargest energy uses on the farm, totaling 146 GJ, or 25% of allfuel and electricity energy use; using horses for half of this wouldalmost completely offset all their care and maintenance energycosts (76.5 GJ), including feed, fuel, and supplies. There remainsmuch room for further research into the energy effectiveness ofsubstituting horse power for internal combustion power.
The SSF horses consumed a considerable amount of re-sources on the farm, and were employed relatively inefficiently,as noted above. The detailed nature of the database allowsan analysis of how the farm might have performed withoutthe horses. To analyze the no-horse scenario, all fractions oflabor, fuel, supplies, and feed for the care and maintenanceof the horses was eliminated, as well as horse-related capital
Downloaded By: [University of Texas Austin] At: 19:04 9 November 2010
ENERGY ANALYSIS OF A MIDWESTERN FARM 233
0 0.5 1 1.5
broilers
cattle
layers
milo
oat straw
oats
soybeans
sunflowers
wheat grain
GJ out/Labor Hour
w/horsesw/o horses
FIG. 19. Comparison of labor hours per GJ for exports, for horse and no-horsecases.
equipment. Acres worked using horse power were assumed tohave been worked by the other field traction sources on thefarm, proportionally to the acreage which they worked over thelifetime of the SSF. Fuel and materials usage per acre workedwas calculated for each non-horse field power source, and theseassumed fuel and maintenance costs were assigned to the cropsworked by the horses. Crops grown to feed the horses, includinga an animal mass-weighted fraction of the forage crops, wereassumed to have never been planted.
Even without taking labor into account, the energy efficiencyof the no-horse farm scenario is significantly better overall,particularly for three of the four major crops of the farm.The no-horse energy efficiency improves on the with-horseefficiency by 1.42 × for milo, 1.31 × for soy, and 1.48 × forwheat. Oats is mostly unchanged, as it was largely unworked bythe horses. Figure 19 shows the even larger labor savings. Thelabor efficiency (GJ of output per labor hour) of the major cropsimproves in the no-horse case by 1.94 × for milo, 2.0 × for soy,2.0 × for wheat, and 1.24 × for oats. Animal labor efficienciesare mostly unchanged. Furthermore, a high proportion of thelabor saved in the no-horse case is higher-skilled, “manager” la-bor; although manager labor is charged at the same rate as otherlabor types in the above analysis, this type of labor is econom-ically more valuable. Because of possible unaccounted-for sidebenefits of having the horses on the farm (discussed above), thisassessment may overestimate the savings of a horse-free farm.
9. COMPARISON TO PREVIOUS STUDIES OFAGRICULTURAL ENERGY EFFICIENCY
The exhaustive and extremely detailed accounting employedat the Sunshine Farm stands in distinct contrast to the estimationsemployed by previous workers in the field, which are generallybased on unverified voluntary reporting of a small number ofeasily-measured farm parameters. The near-microscopic gran-
ularity of the SSF data (including every labor hour, nut andbolt, etc. as described above) reveals many aspects of energyuse in farming not apparent in previous studies. Because thehigher level of detail, many energy inputs were identified thatwere missed in previous studies. Some of these can be clearlyaccounted for, such as the “supplies” category of miscellaneousmaterials; these amount to a significant fraction of the inputsand point to a higher energy use in farming generally than haspreviously been assumed. Others are almost certain to exist(as discussed below) but cannot be easily separated. As such,directly comparing the energy ratios of the Sunshine Farm toprevious studies is not entirely fair. In spite of this, the SunshineFarm performed well in terms of energy efficiency.
A comparison with previously-reported crop energy efficien-cies is shown in Figure 20. Because previous studies have nottaken into account all energy inputs into farming, the energyinputs of the SSF were broken into categories for direct com-parison. Even so, it is likely that due to more extensive account-ing the SSF data are more accurate, and take into account moreuses of fuel and capital equipment than previous studies. Theseratios take into account all fuel inputs to the crops, includingindirect fuel inputs for items such as trips to local vendors,outside service vehicles, compost and green manure, fuel andcapital inputs to draft animals, tools, and other capital objectssuch as buildings. The two Sunshine Farm (SSF) cases are forthe actual farm and the projection of the farm’s performancewithout horses, detailed below.
To ensure that differences in energy ratios are based on re-ported resource use and not on the different embodied energyfactors used by various researchers, energy inputs for each of thestudies were recalculated based in the quantities of substancesreported by the author(s), multiplied by uniform embodied en-ergy factors (Hill et al., 2006; Sheehan et al., 1998b; Pimentel,2006, 1980). For materials used in this study, the values fromTables 1 and 2 were used; for agricultural chemicals, embodiedenergy factors were taken from Pimentel (1980). Fertilizer andchemical inputs for the Sunshine Farm are counted as zero; allenergy expenditures related to crop fertility are included in theallocated fuel, capital, and supply figures for the crops. Theseinputs—for fixed nitrogen, phosphorus, potassium, herbicides,pesticides, and lime—constitute a large part of the energy bal-ance for industrial agricultural systems, ranging from 24–47%of total estimated inputs. None of the previous studies took intoaccount the full range of inputs to farming; only fuel, fertilizer,chemicals, seeds, and in some cases capital equipment were in-cluded. This difference is shown in the “Supplies” portion ofthe energy inputs shown in the figure, and amounts to a sub-stantial fraction of the inputs, 15–27%. The studies by Pimentel(2006, 1980) do not take farm buildings into account. One majorstudy (Sheehan et al., 1998b) neglects capital equipment inputsentirely; these amount to 7.7% of non-labor inputs to the SSF.
As can be seen, the energy efficiency of the Sunshine Farmwas competitive with conventional agriculture. Discounting the“Supplies” category to make the comparison fair, the non-horse
Downloaded By: [University of Texas Austin] At: 19:04 9 November 2010
FIG. 20. Energy efficiency of SSF compared to previous studies of conventional agriculture.
SSF attained a superior energy ratio to conventional farming in 4of 6 cases, coming within 15% of the conventional energy ratiosin the other two cases. In all cases except milo, the SSF fuel use ismarkedly higher, likely due to both the more complete account-ing and the relative inefficiency of the SSF tractors (sized forhorse-compatible rows). Use of larger equipment with the SSF’ssustainable techniques would result in efficiency markedly su-perior to conventional techniques in all cases. Use of electrictractors in place of internal combustion tractors would reducetraction energy use by a factor of approximately 4×, althoughfor full accounting the source of the electricity would have tobe taken into account. Tractors may be run on a farm-scale gridto eliminate the need for large, expensive batteries.
These estimates do not take into account the energy costs ofcleaning up the environmental degradation caused by currentindustrial agriculture production. These costs are difficult toquantify, but are likely to be much larger than the whole directenergy cost (Patzek, 2004), which would overwhelm the smallenergy differences calculated here.
0 5 10 15
broilers
cattle
layers
MJ in/MJ out
fuelsupplyfeedseedanimalcapital
FIG. 21. Energy efficiency of SSF animal production.
9.1. Animal Production Energy EfficiencyFigure 21 shows the energy efficiency of animal production
on the farm. Animal export calories required 14–34× moreenergy input than export crop calories. Beef production on thefarm was markedly more efficient than broiler or egg production,largely due to the fact that the cattle fed themselves mainlyon forage, consuming significant amounts of feed only duringDecember, January, and February. As with the crop production,the “supplies” category, unaccounted for in previous studies, issignificant, ranging from 34% for beef production to 16% forthe broilers.
Heitschmidt (1996) reported energy ratios for a range ofgrass-fed and feedlot scenarios. The closest match to the pro-duction practices of the Sunshine Farm was an interpolation be-tween Heitschmidt’s calf and yearling scenarios with 84 feedlotdays. Weighting by the proportions of calves and yearlings ex-ported by the SSF, and pro-rating for the calf loss experiencedon the SSF (4%) results in an expected energy ratio of 3.17:1,almost half of the SSF’s ratio of 5.95:1. This difference maybe due to Heitschmidt’s much larger herds (250+ head for pas-ture, 1000+ for feedlot production), and to the more completeSunshine Farm accounting.
Comparison with Pimentel’s ratios of input energy to proteinenergy output ratios (based on national USDA data) (Pimentel,2006) yields a distinctly different result (see Table 5). (Hereprotein energy means the energy embodied in the protein of aproduct.) The farm’s beef protein production efficiency is al-most twice that of feedlot beef, and essentially equal to that forgrass-fed beef. Egg production is almost twice the efficiency ofconventional production. Chicken meat (“broiler”) production is4.7× less efficient than the spectacularly efficient conventional
Downloaded By: [University of Texas Austin] At: 19:04 9 November 2010
ENERGY ANALYSIS OF A MIDWESTERN FARM 235
TABLE 5Total Energy Input Versus Protein Energy Output for SSF
versus conventional production. Conventional beef ProductionNumbers are for Feedlot and grass-fed Production Respectively
caged production. However broiler production was only a verysmall part of the farm’s activities, representing less than 0.5%of exports. Broiler chickens were fed bought feed almost ex-clusively (very little farm-grown), which contributed to theirrelatively high energy inputs, as bought feed had higher embod-ied energy and transportation costs.
In summary, the Sunshine Farm achieved a high level ofenergy efficiency even while producing organically and main-taining the fertility of the soil (see Sections 11. and 5.. Thisis remarkable in view of the relatively small size of SSF (theaverage size of a farm in Kansas from 1993–1998 was 294 ha,versus the SSF’s 20 ha cropland and 40–65 ha pasture), the useof horses for traction (see Section 8.), and the relative noveltyof the rotation and multi-species production methods employed.Labor usage on the farm is treated in a separate section below.
10. LABOR AND COMMUTING ENERGYThe Sunshine Farm used less energy of combined fuel, ma-
terials, feed, seed, and capital equipment than conventionalindustrial agriculture, but used more labor. To obtain a fullpicture of how an agricultural system impacts a society’s en-ergy economy, it is necessary to assign some energy cost tothe labor. How much to assign is a matter of some controversyin the energy analysis literature (Sollner, 1997). A minimumcharge, applicable to subsistence agriculture, would be for theadditional food calories needed to sustain the physical workon the farm; for the purposes of this analysis this would befar to small a charge (approximately 0.36 MJ/hr) to consider,and differences between labor usage in conventional agricul-ture and the SSF system would not impact the energy savingsof the SSF methods. Humans in an industrial society use farmore energy than needed to sustain their metabolism, however,and many authors have attempted to include some fraction ofworkers’ total energy usage into the scope of energy inputsconsidered.
In the approach of Costanza and Herendeen (1984), laboris treated as an internal part of an economy (one of a num-ber of sectors represented by an input-output matrix), con-suming internal flows of embodied energy originating fromexternal energy inputs. This approach to labor contrasts tra-ditional economic theory treating labor, land, and capital as
external inputs, as if human labor was not dependent on en-ergy in the form of goods and services (Costanza, 1981a,b).Following this approach, Fluck (1992) disaggregated the USgross national product into 50-some economic sectors, applieddollar-based energy intensities to each sector (from Bullard(1976)) to get energy consumption for each sector, and thensubjectively assigned a portion of each sector’s energy con-sumption to labor. The sum of the assigned energy portions forlabor represented 22 percent of US energy consumption. Fluckthen applied two factors relating the expenditures and earningsof rural workers to urban workers. This procedure yielded avalue of 594 MJ/day, or 75 MJ/hour, for average US rural la-bor. This value is comparable to other studies (Williams et al.,1975; USDA, 1974; De Wit and Van Heemst, 1976) using othermethods.
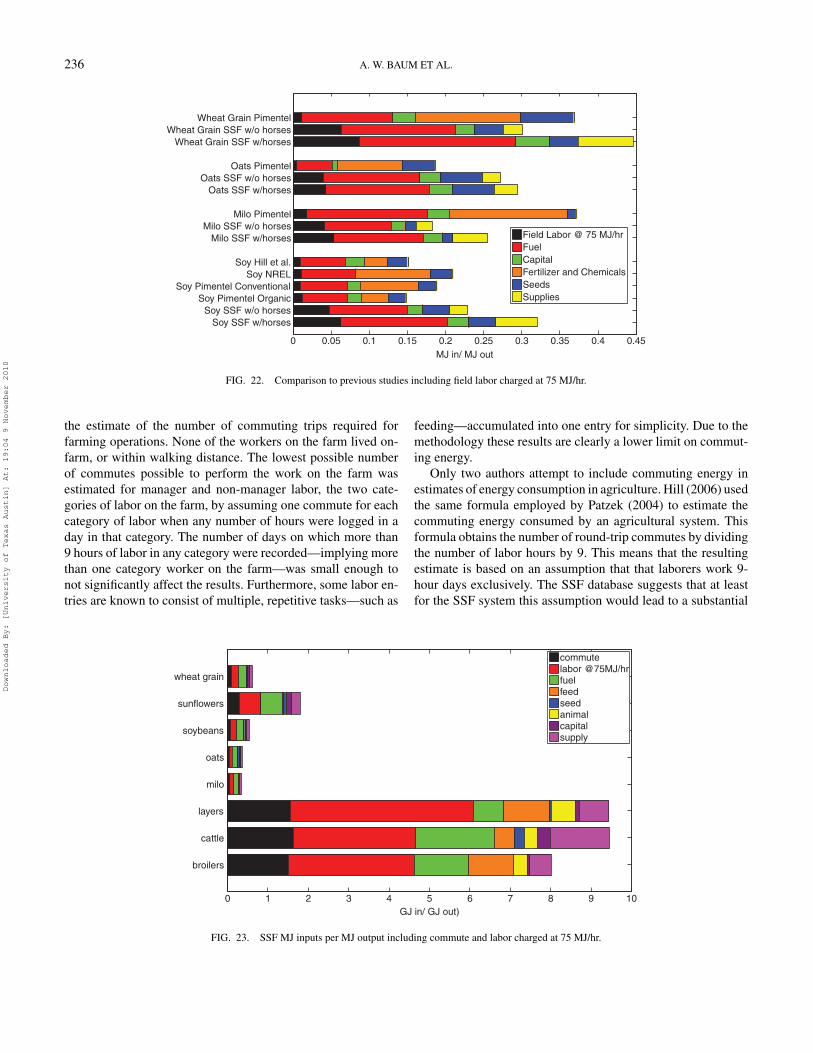
Figure 22 shows the results of charging labor energy at therate of 75 MJ/hour. It should be noted that for comparison, thelabor charged to the Sunshine Farm exports in this figure consistsonly of field operations, including field preparation, hauling, andother direct crop-related labor costs (this includes labor to growgreen manure crops). A full accounting of the labor for eachexport, including horse husbandry, transportation, repair andmaintenance of equipment, farm management and planning, andother miscellaneous jobs is shown in Figure 16; these costs werepresumably not included in the compared studies. Although theincreased labor use on the SSF has a significant impact on theenergy ratio of the farm, the farm remains competitive withconventional agriculture with labor charged at the rate of 75MJ/hour. It is worth noting that a large fraction of the farm’slabor was performed by relatively inexperienced volunteers;with experienced hands the hours might have been significantlyreduced.
Conscious decisions about farm design can affect the labor’senergy usage, e.g., energy-efficient on-farm housing. Also, sometypes of farm labor now widely employed (e.g., migrant labor)clearly use less energy than typical industrial workers. While itis important for whole societies to evaluate the impacts of netper-person energy use, it is not clear that labor-saving on a farmsaves energy in the economy as a whole. Pivotal to the ques-tion of the energy cost of labor is how the total population ina society (and its per-person energy usage) might vary with theamount of labor employed in agriculture, and how much energythe actual agricultural workers use in their day-to-day existence.These important questions have not been significantly addressedbeyond the work outlined above, so there is much room for fur-ther research. It is also worth noting that the average Americanuses approximately 105 times the energy of an average human(Patzek, 2007); in less-energy-intensive societies the benefits ofsuch energy-for-labor tradeoffs would be even better.
10.1. Commuting EnergyOne of the unique aspects of the SSF data was the availability
of an hour-by-hour picture of activities on the farm, allowing
Downloaded By: [University of Texas Austin] At: 19:04 9 November 2010
Field Labor @ 75 MJ/hrFuelCapitalFertilizer and ChemicalsSeedsSupplies
FIG. 22. Comparison to previous studies including field labor charged at 75 MJ/hr.
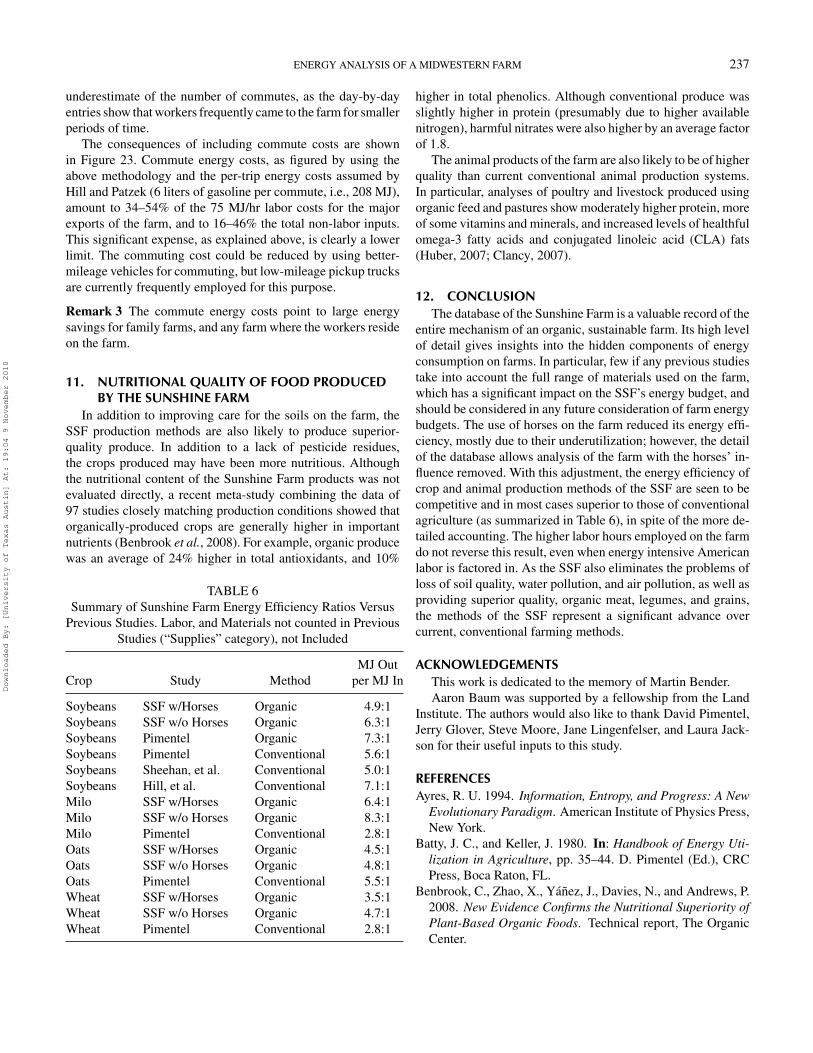
the estimate of the number of commuting trips required forfarming operations. None of the workers on the farm lived on-farm, or within walking distance. The lowest possible numberof commutes possible to perform the work on the farm wasestimated for manager and non-manager labor, the two cate-gories of labor on the farm, by assuming one commute for eachcategory of labor when any number of hours were logged in aday in that category. The number of days on which more than9 hours of labor in any category were recorded—implying morethan one category worker on the farm—was small enough tonot significantly affect the results. Furthermore, some labor en-tries are known to consist of multiple, repetitive tasks—such as
feeding—accumulated into one entry for simplicity. Due to themethodology these results are clearly a lower limit on commut-ing energy.
Only two authors attempt to include commuting energy inestimates of energy consumption in agriculture. Hill (2006) usedthe same formula employed by Patzek (2004) to estimate thecommuting energy consumed by an agricultural system. Thisformula obtains the number of round-trip commutes by dividingthe number of labor hours by 9. This means that the resultingestimate is based on an assumption that that laborers work 9-hour days exclusively. The SSF database suggests that at leastfor the SSF system this assumption would lead to a substantial
FIG. 23. SSF MJ inputs per MJ output including commute and labor charged at 75 MJ/hr.
Downloaded By: [University of Texas Austin] At: 19:04 9 November 2010
ENERGY ANALYSIS OF A MIDWESTERN FARM 237
underestimate of the number of commutes, as the day-by-dayentries show that workers frequently came to the farm for smallerperiods of time.
The consequences of including commute costs are shownin Figure 23. Commute energy costs, as figured by using theabove methodology and the per-trip energy costs assumed byHill and Patzek (6 liters of gasoline per commute, i.e., 208 MJ),amount to 34–54% of the 75 MJ/hr labor costs for the majorexports of the farm, and to 16–46% the total non-labor inputs.This significant expense, as explained above, is clearly a lowerlimit. The commuting cost could be reduced by using better-mileage vehicles for commuting, but low-mileage pickup trucksare currently frequently employed for this purpose.
Remark 3 The commute energy costs point to large energysavings for family farms, and any farm where the workers resideon the farm.
11. NUTRITIONAL QUALITY OF FOOD PRODUCEDBY THE SUNSHINE FARM
In addition to improving care for the soils on the farm, theSSF production methods are also likely to produce superior-quality produce. In addition to a lack of pesticide residues,the crops produced may have been more nutritious. Althoughthe nutritional content of the Sunshine Farm products was notevaluated directly, a recent meta-study combining the data of97 studies closely matching production conditions showed thatorganically-produced crops are generally higher in importantnutrients (Benbrook et al., 2008). For example, organic producewas an average of 24% higher in total antioxidants, and 10%
TABLE 6Summary of Sunshine Farm Energy Efficiency Ratios Versus
Previous Studies. Labor, and Materials not counted in PreviousStudies (“Supplies” category), not Included
higher in total phenolics. Although conventional produce wasslightly higher in protein (presumably due to higher availablenitrogen), harmful nitrates were also higher by an average factorof 1.8.
The animal products of the farm are also likely to be of higherquality than current conventional animal production systems.In particular, analyses of poultry and livestock produced usingorganic feed and pastures show moderately higher protein, moreof some vitamins and minerals, and increased levels of healthfulomega-3 fatty acids and conjugated linoleic acid (CLA) fats(Huber, 2007; Clancy, 2007).
12. CONCLUSIONThe database of the Sunshine Farm is a valuable record of the
entire mechanism of an organic, sustainable farm. Its high levelof detail gives insights into the hidden components of energyconsumption on farms. In particular, few if any previous studiestake into account the full range of materials used on the farm,which has a significant impact on the SSF’s energy budget, andshould be considered in any future consideration of farm energybudgets. The use of horses on the farm reduced its energy effi-ciency, mostly due to their underutilization; however, the detailof the database allows analysis of the farm with the horses’ in-fluence removed. With this adjustment, the energy efficiency ofcrop and animal production methods of the SSF are seen to becompetitive and in most cases superior to those of conventionalagriculture (as summarized in Table 6), in spite of the more de-tailed accounting. The higher labor hours employed on the farmdo not reverse this result, even when energy intensive Americanlabor is factored in. As the SSF also eliminates the problems ofloss of soil quality, water pollution, and air pollution, as well asproviding superior quality, organic meat, legumes, and grains,the methods of the SSF represent a significant advance overcurrent, conventional farming methods.
ACKNOWLEDGEMENTSThis work is dedicated to the memory of Martin Bender.Aaron Baum was supported by a fellowship from the Land
Institute. The authors would also like to thank David Pimentel,Jerry Glover, Steve Moore, Jane Lingenfelser, and Laura Jack-son for their useful inputs to this study.
REFERENCESAyres, R. U. 1994. Information, Entropy, and Progress: A New
Evolutionary Paradigm. American Institute of Physics Press,New York.
Batty, J. C., and Keller, J. 1980. In: Handbook of Energy Uti-lization in Agriculture, pp. 35–44. D. Pimentel (Ed.), CRCPress, Boca Raton, FL.
Benbrook, C., Zhao, X., Yanez, J., Davies, N., and Andrews, P.2008. New Evidence Confirms the Nutritional Superiority ofPlant-Based Organic Foods. Technical report, The OrganicCenter.
Downloaded By: [University of Texas Austin] At: 19:04 9 November 2010
238 A. W. BAUM ET AL.
Bender, M. H. 2003. Energy budget of an energy-integratedorganic farm. In: Changing Sciences for a Changing World:Building a Broader Vision. 2003 ASA-CSSA-SSSA AnnualMeetings.
Bender, M. H. 2006. The Sunshine Farm Book. The LandInstitute, Salina, Kansas.
Bethel, J. 1976. Renewable Resources for Industrial Material:Reference Materials Systems: A Source for Renewable Ma-terials Assessment. National Academy Press, WashingtonD.C.
Boustead, I., and Hancock, G. F. 1979. Handbook of IndustrialEnergy Analysis. John Wiley & Sons, Inc.
Bukantis, R. 1980. In: Handbook of Energy Utilization in Agri-culture, pp. 103–108, D. Pimentel (Ed.), CRC Press, BocaRaton, FL.
Bullard, C. W., Penner, P. S., and Pilati, D. A. 1976. EnergyAnalysis Handbook. CAC Document No. 214. Center forAdvanced Computation, University of Illinois, Urbana.
Byerly, T. C. 1982. In: CRC Handbook of Agricultural Produc-tivity, Vol. II, Animal Productivity, pp. 265–304, CRC Press,Boca Raton, FL.
Casler, S., and Hannon, B. 1989. Readjusted potentials in in-dustrial energy efficiency and structure. Journal of Environ-mental Economics and Management 17: 93–108.
Chandler, W. U. 1985. Energy Productivity: Key to Environmen-tal Protection and Economic Progress. Worldwatch Paper No.63. Technical report, Worldwatch Institute, Washington, DC.
Chapman, P. F., and Roberts, F. 1983. Metal Resources andEnergy. Butterworths, London.
Clancy, K. 2007. Greener Pastures: How Grass-fed Beef andMilk Contributes to Healthy Eating. Technical report, Unionof Concerned Scientists, Washington, D.C.
Cook, C., Combs, J., and Ward, G. 1980. In: Handbook ofEnergy Utilization in Agriculture. pp. 405–418. CRC Press,Boca Raton, FL.
Costanza, R. 1981a. In: Energy, Economics, and the Environ-ment: Conflicting Views of an Essential Interrelationship, pp.119–145, H. E. Daly and A. F. Umana (Eds.), Westview Press,Boulder, CO.
Costanza, R. 1981b. In: Energy, Economics, and the Environ-ment: Conflicting Views of an Essential Interrelationship, pp.187–192, H. Daly and A. Umana (Eds.), Westview Press,Boulder, CO.
Costanza, R., and Herendeen, R. 1984. Embodied energy andeconomic value in the united states economy: 1963, 1967 and1972., Resources and Energy 6: 129–163.
Crampton, E. W., and Harris, L. E. 1969. Applied Animal Nu-trition: The Use of Feedstuffs in the Formulation of LivestockRations. 2nd edition, W. H. Freeman and Co., San Francisco.
Craumer, P. R. 1977. Master’s thesis, University of Wisconsin,Madison.
De Wit, C. T., and Van Heemst, H. D. J. 1976. In: Chemical En-gineering in a Changing World, pp. 125–145, W. T. Koetsier(Ed.), Elsevier, Amsterdam.
Dinnes, D., Karlen, D., Jaynes, D., Kaspar, T., Hatfield,J., Colvin, T., and Cambardella, C. 2002. Nitrogenmanagement strategies to reduce nitrate leaching in tile-drained midwestern soils. Agronomy Journal 94: 153–171.
Farrell, A. E., Plevin, R. J., Turner, B. T., Jones, A. D., O’Hare,M., and Kammen, D. 2006. Ethanol can contribute to energyand environmental goals. Science 311(5760): 506–508.
Fluck, R. C. (Ed.) 1992. Energy in Farm Production, ElsevierPublishers, Amsterdam.
Fluck, R. C., S., P. B., and Baird, C. D. 1992. Florida Agricul-tural Energy Consumption Model. Final Report., Technicalreport, Florida Energy Extension Service, Gainesville, FL.
Fthenakis, V. M., Kim, H. C., and Alsema, E. 2008. Emis-sions from photovoltaic life cycles. Environmental Science& Technology 42(6): 2168–2174.
Glover, J. 2008. Private communication.Graboski, M. S. 2002. Fossil Energy Use in the Manufacture
of Corn Ethanol. Report prepared for the National CornGrowers Association, Colorado School of Mines.
Green, V. S., Cavigelli, M. A., Dao, T. H., and Flanagan, D.2005. Soil physical properties and aggregate associated c,n, and p distributions in organic and conventional croppingsystems. Soil Sci. 170: 822–831.
Hall, C. A. S., Kaufman, E., Walker, S., and Yen, D. 1979.Efficiency of energy delivery systems: Ii. estimating energycosts of capital equipment. Environmental Management 3:505–510.
Heichel, G. H. 1980. In: Handbook of Energy Utilization inAgriculture. pp. 27–33, D. Pimentel (Ed.), CRC Press, BocaRaton, FL.
Heitschmidt, R. K., Short, R. E., and Grings, E. E. 1996. Ecosys-tems, sustainability, and animal agriculture. J. Anim. Sci. 74:1395–1405.
Hill, J., Nelson, E., Tilman, D., Polasky, S., and Tiffany,D. 2006. Environmental, economic, and energetic costsand benefits of biodiesel and ethanol biofuels and bene-fits of biodiesel and ethanol biofuels. PNAS 103: 11206–11210.
Huber, M. (Ed.) 2007. Organic, more healthy?—A search forbiomarkers of potential health effects induced by organicproducts, investigated in a chicken model. Louis Bolk Insti-tute and FQH (Organic Food Quality and Health).
Khan, S. A., Mulvaney, R. L., Ellsworth, T. R., and Boast,C. W. 2007. The myth of nitrogen fertilization for soil carbonsequestration. J. Environ. Qual. 36: 1821–1832.
King, F. H. 1911. Farmers of Forty Centuries or Perma-nent Agriculture in China, Korea and Japan. Mrs. F. H.King, Published on the web, courtesy of Steve Solomonwww.soilandhealth.org.
Knapp, K. E., Jester, T. L., and Mihalik, G. B. 2000. Energy bal-ances for photovoltaic modules: status and prospects, in Pho-tovoltaic Specialists Conference, 2000. Conference Record ofthe Twenty-Eighth IEEE, pp. 1450–1455.
Downloaded By: [University of Texas Austin] At: 19:04 9 November 2010
ENERGY ANALYSIS OF A MIDWESTERN FARM 239
Leary, R., and Mack, R. S. 1980. In: Industrial Energy UseData Book, Chapt. 9, R. Mack, H. Leff, S. Bell, S. Nestor,and H. McDuffie (Eds.), Oak Ridge Associated Universities,Oak Ridge, TN.
McDuffie, H. F., Warren, K., and Leff, H. S. 1980. In: IndustrialEnergy Use Data Book, Chapt. 8, R. Mack, H. Leff, S. Bell,S. Nestor, and H. McDuffie (Eds.), Oak Ridge AssociatedUniversities, Oak Ridge, TN.
Nakamura, L. 1974. In: Energy Consumption in Manu-facturing, pp. 205–217, Ballinger Publishers, Cambridge,MA.
Nations, B. K., and Hallberg, G. 1992. Pesticides in iowa pre-cipitation, J. of Environ. Qua. 21: 486–492.
Oehl, F., Sieverding, E., Mader, P., Dubois, D., Ineichen,K., Boller, T., and Wiemken, A. 2004. Impact of long-term conventional and organic farming on the diversityof arbuscular mycorrhizal fungi. Oecologia 138(4): 574–583.
Ostrander, C. E. 1980. In: Handbook of Energy Utilizationin Agriculture, pp. 379–392, D. Pimentel (Ed.), CRC Press,Boca Raton, FL.
Patzek, T. W. 2004. Thermodynamics of the corn-ethanol bio-fuel cycle. Crit. Rev. in Plant Sci. 23(6): 519–567.
Patzek, T. W. 2007. Energy, Earth, and Humans: CE 170 CourseReader, University of California.
Pimentel, D. 1980. Handbook of Energy Utilization in Agricul-ture, CRC Press, Inc., Boca Raton, FL.
Pimentel, D. 2006. Impacts of Organic Farming on the Effi-ciency of Energy Use in Agriculture. Technical report, TheOrganic Center.
Pimentel, D., Hepperly, P., Hanson, J., Douds, D., and Seidel, R.2005. Environmental, energetic, and economic comparisonsof organic and conventional environmental, energetic, andeconomic comparisons of organic and conventional farmingsystems. BioScience 55(7): 573–582.
Pimentel, D., and Patzek, T. W. 2005. Ethanol production us-ing corn, switchgrass, and wood; biodiesel production usingsoybean and sunflower. Natural Resources Research 14(1):65–76.
Pimentel, D., and Pimentel, M. 1979. Energy, Food and Society.John Wiley and Sons, New York.
Randall, G., Huggins, D., Russell, M., Fuchs, D., Nelson,W., and Anderson, J. 1997, Nitrate losses through sub-surface tile drainage in conservation reserve program, al-falfa, and row crop systems. J. of Environ. Qual. 26: 1240–1247.
Reganold, J., Elliot, L., and Unger, Y. 1987. Long-term effectsof organic and conventional farming on soil erosion. Nature330: 370–372.
Renich, X. Y. 2008. Private communication with local farmersGlenn Laubhaun, Charles Melander, and Steve Renich.
Salunkhe, D. K., Chavan, J. K., Adsule, R. N., and Kadam, S. S.1991. World Oilseeds: Chemistry, Technology, and Utiliza-tion. Van Nostrand Reinhold, New York.
Shapouri, H., Duffield, J. A., and Wang, M. 2003. The energybalance of corn ethanol revisited, Trans. ASAE 46(4): 959–968.
Shapouri, H., and McAloon, A. 2004. The 2001 Net EnergyBalance of Corn Ethanol, Report, USDA, Washington, D.C.,Also presented as a conference paper by H. Shapouri,A. McAloon, and M. Wang, Corn Utilization and Tech-nology Conference, June 7–9, 2004, Indianapolis, IN,www.usda.gov/oce/reports/energy/index.htm.
Sheehan, J., Camobreco, V., Duffield, J., Graboski, M., andShapouri, H. 1998a. Life Cycle Inventory of Biodiesel andPetroleum Diesel for Use in an Urban Bus. Final ReportNREL/SR-580-24089, National Renewable Energy Labora-tory, Golden, Colorado 80401, www.nrel.gov/docs/legosti/fy98/24089.pdf.
Sheehan, J., Camobreco, V., Duffield, J., Graboski, M., andShapouri, H. 1998b, Life Cycle Inventory of Biodiesel andPetroleum Diesel for Use in an Urban Bus. Technical report,National Renewable Energy Laboratory.
Slesser, M. 1978. Energy in the Economy. St. Martin’s Press,New York.
Smil, V. 1991. General Energetics: Energy in the Biosphere andCivilization. John Wiley and Sons, New York.
Sollner, F. 1997. A reexamination of the role of thermodynam-ics for environmental economics. Ecological Economics 22:175–201.
Stout, B. A. 1984. Energy Use and Management in Agriculture.Breton Publishers, North Scituate, MA.
Tillman, D. A. 1978. Wood as an Energy Resource, AcademicPress, New York.
Treolar, G. 1997. Extracting embodied energy paths from input-output tables: Towards an input-output-based hybrid energyanalysis method. Economic Systems Research 9(4): 375–391.
USDA. 1974. The US Food and Fiber Sector: Energy Use andOutlook. Technical report, Economic Research Service. U.S.Department of Agriculture, Washington, DC.
USDA-SCS. 1992. Soil Survey of Saline County, Kansas, Tech-nical report, Soil Conservation Service, U.S. Department ofAgriculture, Washington, DC.
Williams, K. F., McCarty, T. R., Gunkle, W. W., Price, D. R., andJewell, W. J. 1975. In: Agriculture and Waste Management,pp. 29–47, W. Jewell (Ed.), Ann Arbor Science Publishers,Ann Arbor, MI.
Downloaded By: [University of Texas Austin] At: 19:04 9 November 2010