Critical Syslog Tricks (That No One Seems to Know About) Jonathan Margulies | Security Expert/ Splunk Professional Svcs Consultant, Rational Cyber George Barrett | Security Expert/ Splunk Professional Svcs Consultant, Rational Cyber September 2017 | Washington, DC
Transcript
Critical Syslog Tricks(That No One Seems to Know About)
Jonathan Margulies | Security Expert/ Splunk Professional Svcs Consultant, Rational CyberGeorge Barrett | Security Expert/ Splunk Professional Svcs Consultant, Rational Cyber
September 2017 | Washington, DC
During the course of this presentation, we may make forward-looking statements regarding future events or the expected performance of the company. We caution you that such statements reflect our current expectations and estimates based on factors currently known to us and that actual events or results could differ materially. For important factors that may cause actual results to differ from those contained in our forward-looking statements, please review our filings with the SEC.
The forward-looking statements made in this presentation are being made as of the time and date of its live presentation. If reviewed after its live presentation, this presentation may not contain current or accurate information. We do not assume any obligation to update any forward looking statements we may make. In addition, any information about our roadmap outlines our general product direction and is subject to change at any time without notice. It is for informational purposes only and shall not be incorporated into any contract or other commitment. Splunk undertakes no obligation either to develop the features or functionality described or to include any such feature or functionality in a future release.
Forward-Looking StatementsTHIS SLIDE IS REQUIRED FOR ALL 3 PARTY PRESENTATIONS.
Do You Have A Syslog Collection Problem?
▶ Your syslog data arrives in Splunk more than a few seconds after the event time▶ Syslog data that comes in while Splunk is restarting gets dropped▶ You notice gaps or missing events in your syslog data feeds▶ You need a new listening port every time you get a new syslog data source▶ Your indexers or heavy forwarders have to look in raw events to figure out what
index, sourcetype, or host to assign to those events▶ Multiple hosts’ syslog data are being aggregated under the same host because
they came through the same syslog server▶ Your IT people use grep instead of Splunk to troubleshoot live issues
You Might Have A Syslog Collection Problem If…
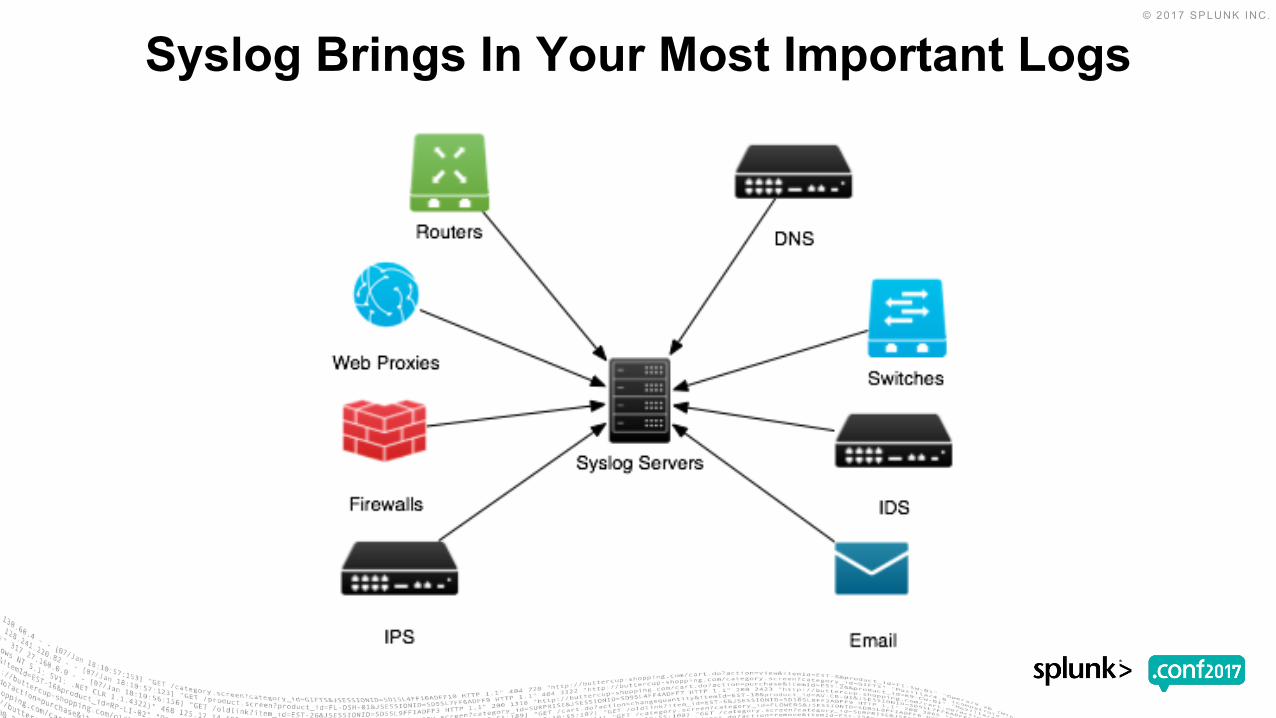
Syslog Brings In Your Most Important Logs
▶ How to configure syslog-ng to collect all your syslog data for Splunk▶ How to architect your syslog collection infrastructure▶ How to configure Splunk to collect all the data from syslog-ng and index it in
about 3 seconds▶ How to find and troubleshoot syslog collection problems quickly
What You’ll Learn From This Presentation
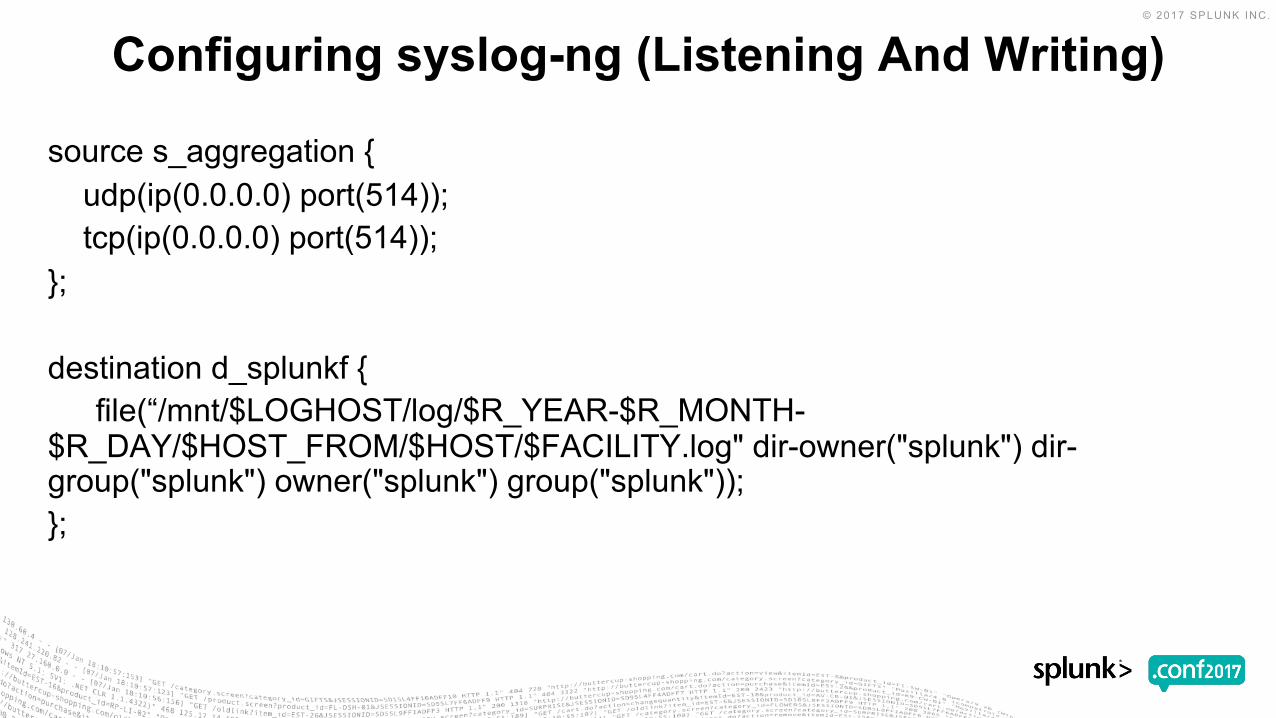
syslog-ng
▶ It’s free. There’s a paid version, but this presentation assumes you didn’t buy it.▶ We recommend version 3.5 or higher, as that supports multithreading and some
other useful features▶ You can do everything we’re recommending using rsyslog instead, but we don’t
recommend it• syslog-ng handles poorly formatted syslog events more gracefully
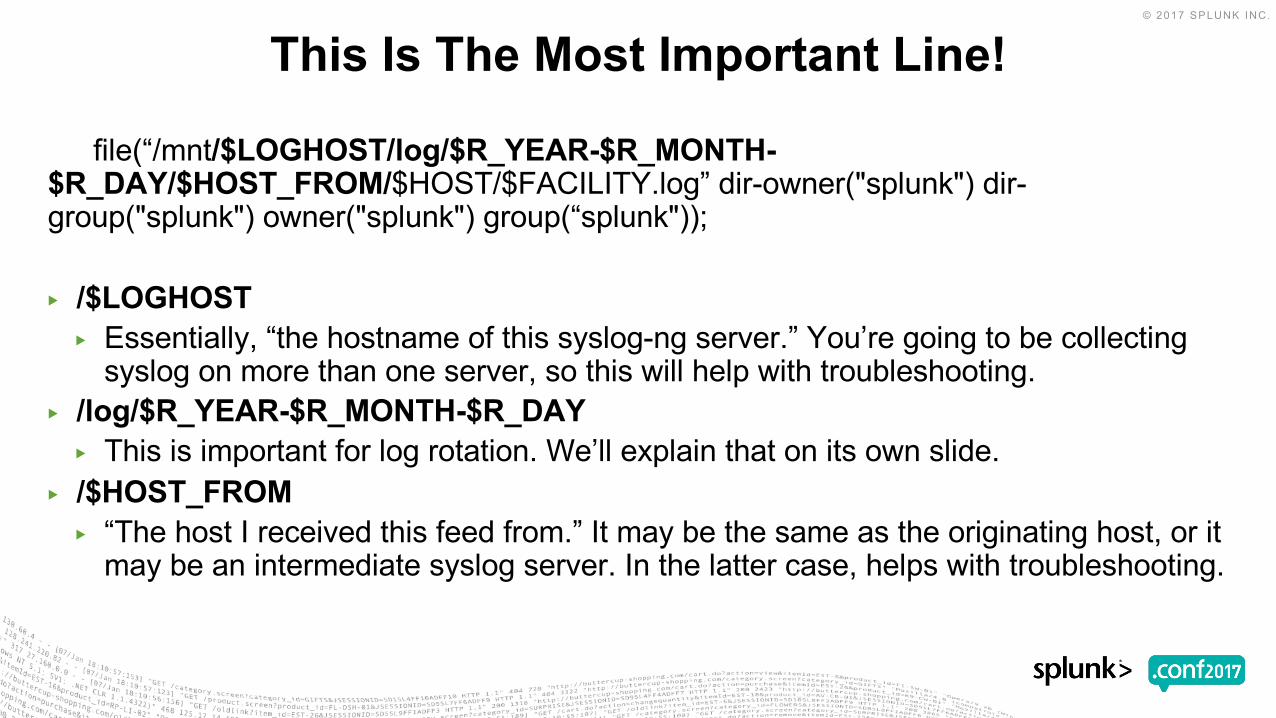
▶ /$LOGHOST▶ Essentially, “the hostname of this syslog-ng server.” You’re going to be collecting
syslog on more than one server, so this will help with troubleshooting.▶ /log/$R_YEAR-$R_MONTH-$R_DAY▶ This is important for log rotation. We’ll explain that on its own slide.
▶ /$HOST_FROM▶ “The host I received this feed from.” It may be the same as the originating host, or it
may be an intermediate syslog server. In the latter case, helps with troubleshooting.
▶ /$HOST▶ “The hostname from the syslog header.” This may be an actual hostname, FQDN, or IP
address, but it’s always the most reliable source of the logs’ originating host.▶ /$FACILITY.log▶ “The syslog facility setting.” This generally isn’t useful by itself, but it can almost always be
used in combination with $HOST to separate different sourcetypes from the same host.▶ dir-owner("splunk") dir-group("splunk") owner("splunk") group(“splunk”))▶ Splunk should never be running as root! Make sure the splunk user can read and rotate
all the log files.
The Rest Of That Line
▶ Do not use logrotate on a syslog server• It will restart syslog-ng and you’ll lose a couple of seconds of logs• https://www.balabit.com/documents/syslog-ng-ose-latest-guides/en/syslog-ng-ose-guide-
admin/html/example-logrotate.html▶ Use these cron jobs instead (adjust the times as needed):
#cron job 1: at 5am, find yesterday's logs, and move them to old_logs0 5 * * * /usr/bin/find /mnt/*/log/????-??-?? -maxdepth 0 -type d ! -mmin -300 -exec bash -c 'dir={}; old=${dir/\/log\//\/old_logs\/}; mv ${dir} ${old}' \;
#cron job 2: find any files older than 5 days, 23 hours, and delete them0 4 * * * /usr/bin/find /mnt/*/old_logs/????-??-?? -maxdepth 0 -type d ! -mmin -8580 -exec rm -rf {} \;
Rotating Logs
Architecting Syslog Infrastructure For Splunk
Network Architecture
Heavy Forwarder Advantages Universal Forwarder Advantages▶ Can handle timezone conversions
• Keep your props and inputs together
▶ Takes load off your indexers▶ PII masking
▶ Need a lot less bandwidth to the indexing tier
• Less metadata▶ Less processor/memory load on the
▶ Most of Splunk’s pipeline queues default to a maximum size of 512KB. That's fine for a normal universal forwarder, but not for a syslog server
▶ Is your output queue too small?• index=_internal host=<syslog_server> source=*metrics.log group=queue name=tcpout* | eval output_queue_pct=current_size/max_size*100 | timechart perc95(output_queue_pct) by host | eval Bad=80
▶ A 64MB output queue works well for many enterprise syslog servers, but you may need more (if your 64MB queue is filling up) or less (if your RAM is filling up)
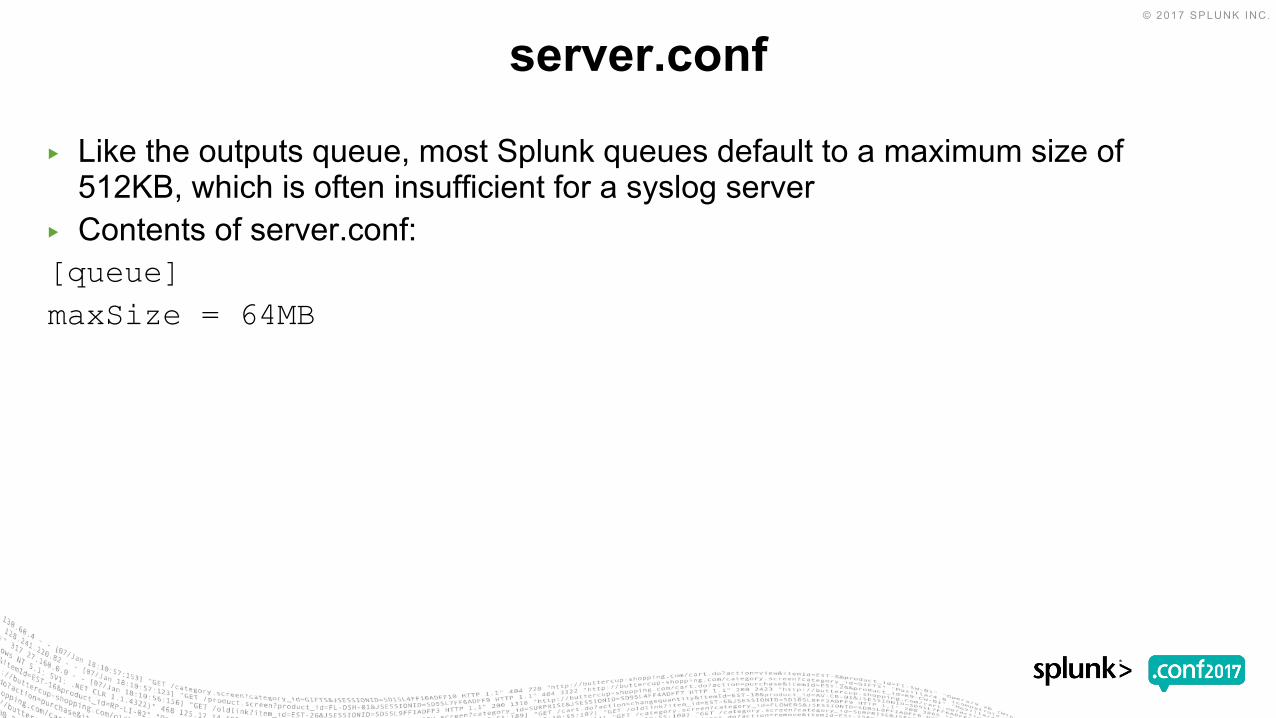
▶ Like the outputs queue, most Splunk queues default to a maximum size of 512KB, which is often insufficient for a syslog server
▶ Contents of server.conf:[queue]maxSize = 64MB
server.conf
▶ For better load balancing, have the forwarders change indexers often and mid-stream:▶ outputs.conf:[tcpout]autoLBFrequency = 5forceTimebasedAutoLB = true
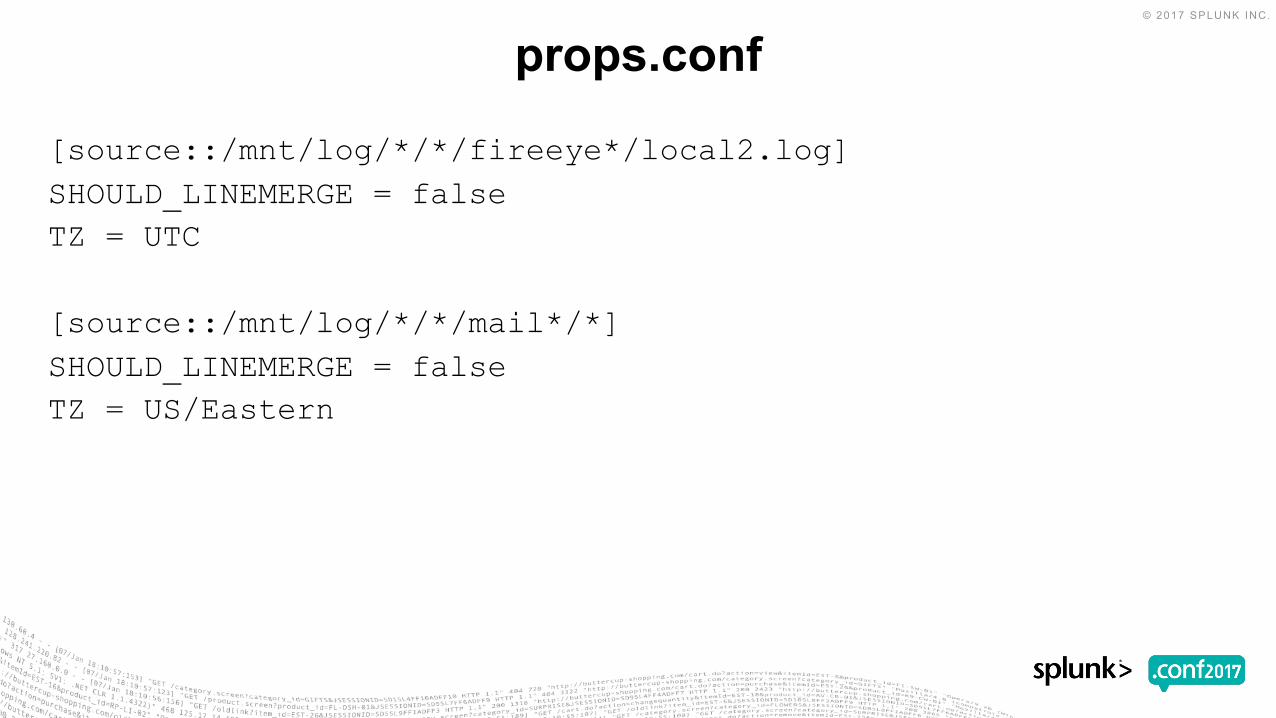
▶ On UFs running 6.5+, do not use forceTimebasedAutoLB. Add this to props.conf for each data source (or in [default]) instead:
▶ Parallel ingestion pipelines allow Splunk to use more resources so it can ingest multiple streams of data at once
▶ Since these syslog servers are dedicated to Splunk data collection, they’re excellent candidates for this feature
▶ The number of pipelines you set will depend on your hardware capacity and data rates. See notes on side effects of this setting at https://docs.splunk.com/Documentation/Splunk/latest/Admin/Serverconf
▶ Enabling parallel ingestion pipelines in server.conf:[general]parallelIngestionPipelines = 2
Parallel Ingestion Pipelines
Automation
▶ In a large enterprise, do not build syslog inputs and props manually!• With thousands of syslog feeds, they become impossible to manage• Small typos can cause massive failures
▶ We manage all of our syslog inputs in a CSV file and edit in Excel
▶ Find our script to auto-generate inputs.conf and props.conf for syslog servers at:• https://gitlab.com/rationalcyber/
Syslog at Scale
▶ Sometimes upstream syslog sources start sending data you weren’t expecting▶ You want this data in Splunk, but you don’t know what index or sourcetype to