1 October 26, 2021. Attention: Dr Hoesung Lee, Chair of the IPCC, c/o WMO, 7bis Ave de la Paix, CP2800, CH-1211 Geneva 2, Switzerland. Critique of the AR6 WG1 Summary for Policymakers (SPM): Dear Dr Lee, We have now carried out an interim review of the AR6 WG1 Summary for Policymakers (SPM) and believe that it misrepresents the latest objective climate science in six key areas: 1. It is not “unequivocal” that human influence alone has warmed the planet; the observed modest warming of ~1°C since 1850-1900 has occurred through some as yet unresolved combination of anthropogenic and natural influences. 2. The new “hockey-stick” graph (Fig SPM.1), when analysed in detail, is a concoction of disparate indicators from various time periods over the last 2,000 years, which together fail to recognise the intervening well-established temperature variability, for example of the Roman and Medieval Warming periods and of the Little Ice Age. 3. The incidence of so-called “extreme weather” events is erroneously misrepresented in the SPM compared to the more accurate depictions in the draft main report, which latter identify no statistically-significant trends in many categories over time. 4. Developments in the cryosphere are also misrepresented in the SPM, particularly noting that there is virtually no trend in Arctic sea ice in the last 15 years. 5. Likewise, developments in the ocean are erroneously misrepresented in the SPM; in particular, the likely modest GMSL rise to 2100 does not point to any “climate crisis”. 6. The CMIP6 climate models are even more sensitive than the already overly-sensitive CMIP5 models of AR5, and ignore peer-reviewed scientific evidence of low climate sensitivity. The models lead to invalid conclusions on ECS and “carbon budgets”; the likely global temperature increase to 2100 does not indicate a “climate crisis”. These concerns are summarised in the table overleaf and are then analyzed in more detail in the pages that follow. Our more detailed analysis will follow in due course. We regrettably conclude that the SPM is erroneously pointing to a “climate crisis” that does not exist in reality. The SPM is inappropriately being used to justify drastic social, economic and human changes through severe mitigation, while prudent adaptation to whatever modest climate change occurs in the decades ahead would be much more appropriate. Given the magnitude of proposed policy implications, the SPM has to be of the highest scientific standards and demonstrate impeccable scientific integrity within the IPCC. You may recall that, in 2010, the InterAcademy Council carried out an independent review of the IPCC procedures at the request of the then UN Secretary-General and IPCC Chairman. Among its recommendations were that reviewers’ comments be adequately considered by the authors and that genuine controversies be adequately reflected in IPCC reports. The AR6 SPM inspires little confidence that these recommendations have been put into effect. We conclude that the AR6 WG1 SPM regrettably does not offer an objective scientific basis on which to base policy discussions at COP26. It also fails to highlight the positive impacts of slightly increased CO2 levels and warming on agriculture, forestry and human life on earth. Yours sincerely, Guus Berkhout, President of CLINTEL (https://clintel.org ), Jim O’Brien, Chair of the ICSF (www.ICSF.ie ).
Transcript
1
October 26, 2021.
Attention: Dr Hoesung Lee, Chair of the IPCC, c/o WMO, 7bis Ave de la Paix, CP2800, CH-1211 Geneva 2, Switzerland. Critique of the AR6 WG1 Summary for Policymakers (SPM): Dear Dr Lee, We have now carried out an interim review of the AR6 WG1 Summary for Policymakers (SPM) and believe that it misrepresents the latest objective climate science in six key areas:
1. It is not “unequivocal” that human influence alone has warmed the planet; the observed modest warming of ~1°C since 1850-1900 has occurred through some as yet unresolved combination of anthropogenic and natural influences.
2. The new “hockey-stick” graph (Fig SPM.1), when analysed in detail, is a concoction
of disparate indicators from various time periods over the last 2,000 years, which together fail to recognise the intervening well-established temperature variability, for example of the Roman and Medieval Warming periods and of the Little Ice Age.
3. The incidence of so-called “extreme weather” events is erroneously misrepresented
in the SPM compared to the more accurate depictions in the draft main report, which latter identify no statistically-significant trends in many categories over time.
4. Developments in the cryosphere are also misrepresented in the SPM, particularly
noting that there is virtually no trend in Arctic sea ice in the last 15 years.
5. Likewise, developments in the ocean are erroneously misrepresented in the SPM; in particular, the likely modest GMSL rise to 2100 does not point to any “climate crisis”.
6. The CMIP6 climate models are even more sensitive than the already overly-sensitive
CMIP5 models of AR5, and ignore peer-reviewed scientific evidence of low climate sensitivity. The models lead to invalid conclusions on ECS and “carbon budgets”; the likely global temperature increase to 2100 does not indicate a “climate crisis”.
These concerns are summarised in the table overleaf and are then analyzed in more detail in the pages that follow. Our more detailed analysis will follow in due course. We regrettably conclude that the SPM is erroneously pointing to a “climate crisis” that does not exist in reality. The SPM is inappropriately being used to justify drastic social, economic and human changes through severe mitigation, while prudent adaptation to whatever modest climate change occurs in the decades ahead would be much more appropriate. Given the magnitude of proposed policy implications, the SPM has to be of the highest scientific standards and demonstrate impeccable scientific integrity within the IPCC. You may recall that, in 2010, the InterAcademy Council carried out an independent review of the IPCC procedures at the request of the then UN Secretary-General and IPCC Chairman. Among its recommendations were that reviewers’ comments be adequately considered by the authors and that genuine controversies be adequately reflected in IPCC reports. The AR6 SPM inspires little confidence that these recommendations have been put into effect. We conclude that the AR6 WG1 SPM regrettably does not offer an objective scientific basis on which to base policy discussions at COP26. It also fails to highlight the positive impacts of slightly increased CO2 levels and warming on agriculture, forestry and human life on earth. Yours sincerely, Guus Berkhout, President of CLINTEL (https://clintel.org), Jim O’Brien, Chair of the ICSF (www.ICSF.ie).
2
Summary Critique of IPCC AR6 WG1 SPM: Para SPM Claims ICSF/CLINTEL Comments Item A.1 It is unequivocal that human influence
has warmed the atmosphere, ocean and land
It is not unequivocal that human influence is the sole or main cause; it is a combination of anthropogenic/natural influences
1
A.1 Figure SPM.1 – the “hockey-stick” This is a misrepresentation of temperature variability in the last 2,000 years
2
A.2 Scale of recent changes and present state of the climate system are unprecedented over many centuries to thousands of years
Not proven, see adjacent comments; there is evidence of sudden climate changes in past centuries and millennia
2
A.2.1 Atmospheric CO2 in 2019 higher than in the last 2m years
Irrelevant comment, as in the paleoclimate, CO2 levels were 10-15 times higher than now
2
A.2.2 Temperatures in 2010-2019 were warmer than in the last 6,500 years
False, as the Minoan, Roman and Medieval Warming Periods have been ignored/“deleted” by IPCC
2
A.1.4 Extreme weather claims on increased precipitation, ocean salinity and storm tracks
Claims on weather extremes are misrepresented in the SPM compared to detailed chapters
3
A.3 Human-induced climate change is already affecting many weather and climate extremes in every region across the globe, with stronger attribution to human influence
Generalised overstatement; attribution is not rigorous. Claims on weather extremes are misrepresented in the SPM compared to detailed chapters
3
A.1.5 Cryosphere: Human influence is very likely the cause of retreat of glaciers, decrease in Arctic sea ice, but no significant trend in the Antarctic; decrease in Spring snow cover and melting of Greenland Ice Sheet.
Changes in the cryosphere are not unprecedented, even in a Holocene perspective. Especially the Arctic region was likely warmer during the Holocene Thermal Optimum.
4
A.2.3 Arctic sea ice lowest since at least 1850; late summer Arctic ice smaller than in the past 1,000 years. Glacier retreat is unprecedented in last 2k years
Changes in the cryosphere are not unprecedented. Especially the Arctic region was likely warmer during the Holocene Optimum.
4
A.1.6 Oceans: human influence is main driver of upper ocean warming/acidification
Warming of the oceans is modest and shows regional variability.
5
A.1.7 Oceans: human influence is very likely the main driver of acceleration in sea level rise since 1971
False, the rate of sea level rise is cyclically variable and was as high in 1930-40s
5
A.2.4 Sea level has risen since 1900 at a faster rate than in last 3,000 years
No valid evidence is presented 5
A.4 Improved knowledge...puts the best estimate of ECS at 3°C
Important evidence for lower ECS was not taken into account
6
A.4.4 The very likely range of ECS is between 2°C and 5°C.
Important evidence for lower ECS was not taken into account
6
B.1 Global warming of 1.5°C and 2°C will be exceeded in the 21st century without deep reductions in GHG
This claim is based on overly sensitive models and overly pessimistic scenarios.
6
D.1 Each 1,000GtCO2 is likely to cause 0.45°C rise in global surface temp
Claim is based on overly sensitive models.
6
D.2 Mitigation will not lead to any difference in global temperatures discernable from natural variability in next 20 years
Indeed, adaptation to whatever modest climate change occurs in coming decades is key.
6
3
1. Not unequivocal that human influence alone has warmed the climate Section SPM Claims ICSF/CLINTEL Comments Item A.1 It is unequivocal that human
influence has warmed the atmosphere, ocean and land
It is not unequivocal that human influence is the sole or main cause; it is due to a still unknown combination of anthropogenic and natural influences
1
The fact that UNFCCC mandate is to address “dangerous anthropogenic interference with the climate system” has regrettably biased its climate research away from any natural causes, and prevents any objective circumspect analysis. It is regrettable that there is no detailed analysis of the impacts of solar variability and of natural events such as ENSO, El Niño, La Niña, AMO, PDO, etc, and even how these might be related to cosmic rays, solar geomagnetic storms, earthquakes, tsunamis, volcanic eruptions. A seminal paper has recently been published entitled How much has the Sun influenced Northern Hemisphere temperature trends? An ongoing debate by Ronan Connolly, Willie Soon, et al/ (https://doi.org/10.1088/1674-4527/21/6/131). It concludes that is not unequivocal that human influence has alone caused recent warming; it is unequivocal that it is caused by some as yet unresolved combination of human influence and natural variability. The paper abstract: In order to evaluate how much Total Solar Irradiance (TSI) has influenced Northern Hemisphere surface air temperature trends, it is important to have reliable estimates of both quantities. Sixteen different estimates of the changes in TSI since at least the 19th century were compiled from the literature. Half of these estimates are “low variability” and half are “high variability”. Meanwhile, five largely-independent methods for estimating Northern Hemisphere temperature trends were evaluated using: 1) only rural weather stations; 2) all available stations whether urban or rural (the standard approach); 3) only sea surface temperatures; 4) tree-ring widths as temperature proxies; 5) glacier length records as temperature proxies. The standard estimates which use urban as well as rural stations were somewhat anomalous as they implied a much greater warming in recent decades than the other estimates, suggesting that urbanization bias is still a problem in current global temperature datasets – despite the conclusions of some earlier studies. Nonetheless, all five estimates confirm that it is currently warmer than the late 19th century, i.e., there has been some “global warming” since the 19th century. For each of the five estimates of Northern Hemisphere temperatures, the contribution from direct solar forcing for all sixteen estimates of TSI was evaluated using simple linear least-squares fitting. The role of human activity on recent warming was then calculated by fitting the residuals to the UN IPCC’s recommended “anthropogenic forcings” time series. For all five Northern Hemisphere temperature series, different TSI estimates suggest everything from no role for the Sun in recent decades (implying that recent global warming is mostly human-caused) to most of the recent global warming being due to changes in solar activity (that is, that recent global warming is mostly natural). It appears that previous studies (including the most recent IPCC reports) which had prematurely concluded the former, had done so because they failed to adequately consider all the relevant estimates of TSI and/or to satisfactorily address the uncertainties still associated with Northern Hemisphere temperature trend estimates. Therefore, several recommendations on how the scientific community can more satisfactorily resolve these issues are proposed. The paper demonstrated that the iconic “attribution statement” of AR5 (which claimed that most of the observed warming since the mid-20th century was human-caused) was flawed for at least two major reasons:
4
1. The estimates of solar activity trends considered by the computer models used for their
attribution analysis only represented a subsample of the estimates available at the time. This subsample excluded multiple estimates which implied a large solar contribution to global temperature trends. As a result, their analysis prematurely dismissed the possibility that much of the warming since the mid-20th century might have been solar in origin.
2. The estimates of global temperature trends they used had failed to adequately account for urbanization bias.
There were also three papers that had been published since AR5 that dispute the IPCC claim: 1. Soon et al., 2015 (https://doi.org/10.1016/j.earscirev.2015.08.010), “Re-evaluating the
role of solar variability on Northern Hemisphere temperature trends since the 19th century”. The overlooking of this paper is particularly ironic given that, Panmao Zhai, one of the two co-chairs of AR6 WG1 has cited the study’s findings on urbanization bias in one of his own papers, Chen & Zhai, 2017 (https://doi.org/10.1088/1748-9326/aa822b) with the following description: “Among these thermodynamic contributions, the urbanization caused warming rate should be particularly noted, since most urban stations are coincidently distributed over susceptible regions identified in figure 2(f) (Soon et al 2015).” (Chen & Zhai, 2017, p8)
2. Zhang et al., 2021, p1937, “Urbanization Effects on Estimates of Global Trends in Mean and Extreme Air Temperature” (https://doi.org/10.1175/JCLI-D-20-0389.1) “The urbanization effects in global land, East Asia, and North America as a whole are statistically significant, with the corresponding urbanization contributions for the period of 1951-2018 are 12.7%, 15% and 9.1% respectively” - Zhang et al., 2021, p1937
3. Scafetta, 2021 (https://doi.org/10.1007/s00382-021-05626-x), “Detection of non‐climatic biases in land surface temperature records by comparing climatic data and their model simulations” (published 17 January 2021, and thereby well within the IPCC deadline): “The 0.6°C warming observed in global temperature datasets from 1940-1960 to 2000–2020 can be partially due to urban heat island (UHI) and other non-climatic biases in the underlying data, although several previous studies have argued to the contrary. The 25–45% of the 1°C land warming from 1940–1960 to 2000–2020 could be due to non-climatic biases.”
Further Evidence Indeed, there is the wider key issue of whether CO2 is cause or effect of warming, discussed in detail in the US Centre for Study of CO2 and Global Change in its March 2020 Petition to the EPA seeking the Repeal of its 2009 Endangerment Finding, see broad commentaries in http://www.co2science.org/articles/V23/mar/EPAPetitionCO2ScienceMarch2020.pdf. This extensively documents that (a) in the last 3 glacial terminations, CO2 increases were 400 to 2,800 years after warming started, (b) CO2 decreases were several thousands of years after cooling at the beginning of the Ice Ages, both aspects in particular evidenced in the most recent glacial termination, (c) the same pattern is observed for 7,000 of the 10,000 years of the Holocene, where temperatures were falling while the CO2 level was rising and (d) as was more recently repeated in the cooling period from 1945-1978. This current-day behaviour is also demonstrated by Humlum in www.climate4you.com and in the associated monthly bulletins, for example: http://www.climate4you.com/Text/Climate4you_September_2021.pdf, page 44, that changes in global atmospheric CO2 lag changes in surface air temperature (by 9.5 to 10 months) which again lag changes in global ocean surface temperatures (by 11-12 months). The non-impact of the 2020 reduction in global CO2 emissions due to the COVID-19 crisis also proves that point in practice, see the Spencer comment on http://co2coalition.org/2020/05/15/why-the-current-economic-slowdown-wont-show-up-in-the-atmospheric-co2-record/.
5
Statistical Error in Attribution The IPCC upgrading of attribution to “unequivocal”, citing in the associated press release of “major advances in the science of attribution”, is hotly debated by Ross McKitrick. As background, Allen and Tett (1999, herein AT99) introduced a Generalized Least Squares (GLS) regression methodology for decomposing patterns of climate change for attribution purposes and proposed the “Residual Consistency Test” (RCT) to check the GLS specification. Their methodology has been widely used and highly influential ever since, in part because subsequent authors have relied upon their claim that their GLS model satisfies the conditions of the Gauss-Markov (GM) Theorem, thereby yielding unbiased and efficient estimators. But, as McKitrick points out, AT99 stated the GM Theorem incorrectly, omitting a critical condition altogether, their GLS method cannot satisfy the GM conditions, and their variance estimator is inconsistent by construction. Additionally, they did not formally state the null hypothesis of the RCT nor identify which of the GM conditions it tests, nor did they prove its distribution and critical values, rendering it uninformative as a specification test. McKitrick insists that, for the past 20 years, the climatology profession has been oblivious to the errors in AT99, and untroubled by the complete absence of specification testing in the subsequent fingerprinting literature. These problems mean there is no basis for treating past attribution results based on the AT99 method as robust or valid. The conclusions might by chance have been correct, or totally inaccurate; but without correcting the methodology and applying standard tests for failures of the GM conditions, it is mere conjecture to say more than that. Thus the opening attribution statement in the SPM “It is unequivocal that human influence has warmed the atmosphere, ocean and land” is not scientifically robust. Additionally, the omission of any serious attempt to investigate any other explanations of climate change reflects a lack of IPCC open thinking and objectivity.
6
2. The “hockey-stick” misrepresents climate over the last 2,000 years Section SPM Claims ICSF/CLINTEL Comment Item A.1 Figure SPM.1 – the “hockey-stick” This is a misrepresentation of
temperature variability in the last 2,000 years
2
A.2 Scale of recent changes and present state of the climate system are unprecedented over many centuries to thousands of years
Not proven, see adjacent comments; there is evidence of sudden climate changes in past centuries and millennia
2
A.2.1 Atmospheric CO2 in 2019 higher than in the last 2m years
Irrelevant comment, as in the paleoclimate, CO2 levels were 10-15 times higher than now
2
A.2.2 Temperatures in 2010-2019 were warmer than in the last 6,500 years
False, as the Minoan, Roman and Medieval Warming Periods have been ignored/“deleted” by IPCC
2
The “hockey-stick” graph (SPM.1, below) fails to depict the actual temperature variations of the last 2000 years, which curiously is not supported in the draft WG1 report. As an immediate corollary, many of the actual climate observations are not unprecedented.
Figure SPM.1: History of global 2000-year temperature change and causes of recent warming Comments by statistician Steve McIntyre are devastating. He has traced that the assertions that temperatures have been stable up to the industrial revolution came from a set of studies by an international paleoclimatology group based in Bern, Switzerland, known as PAGES 2k (PAst Global ChangES with 2k referring to the past 2000 years). The most devastating criticism is the deliberate omission of high-resolution, well-established proxy studies of alkenone deposits (produced by marine algae). These deposits include those in limestone beds, and date back millions of years. The primary purpose of “2000 year” proxy reconstructions of temperature is to compare modern temperature to estimates of medieval and first millennium temperatures. There are 41 proxies in the 0-30N network, but only three proxies with values before AD1200 and only one proxy with values prior to AD925.
7
The single long proxy with values through the first millennium is a temperature reconstruction from Mg/Ca values from an ocean core offshore northern Africa. Its values decline erratically through the past two millennia, with very minor recovery in 20th century. The only proxy dating prior to AD925 shows a rough decline since about the year AD200. McIntyre goes on to criticise the assertions reached by PAGES2k and by the new hockey-stick and concluded:
o “A major reason for looking at the underlying data in proxy reconstructions, aside from being sound statistical practice in general, is that, (1) by definition, a temperature proxy is supposed to be linearly related to temperature; and therefore (2) proxies in a network of actual temperature proxies, according to the definition, should (a) have a reasonably consistent appearance; and (b) look like the reconstruction. This obviously doesn’t occur in the PAGES2019 0-30N network.
o Secondly, proxies covering the medieval period and earlier are disturbingly sparse in the PAGES2019 0-30N network. Although such series have become much more widely available in the past 15 years or so, PAGES 2019 0-30N contains only one proxy with values prior to AD925. Indeed, it actually reduced the representation of longer (ocean core, speleothem, lake sediment) proxies from Mann et al 2008 and PAGES2017, while dramatically increasing the proportional representation of very short coral proxies.
o Finally, the network is wildly inhomogeneous over time. In the past two centuries, it is dominated by trending coral proxies, with only a few nondescript or declining long proxies. Any form of regression (or like multivariate method) of trending temperatures against a large network in the instrumental period will yield an almost perfectly fitting reconstruction in the calibration period if the network is large enough. When the network is limited to the few long proxies (and especially the singleton proxy extending to the first century), the fit of the regression (or multivariate method) is be very poor and the predictive value of any reconstruction is negligible.”
McIntyre adds that:
o “The 30-60N latitude band gets lots of attention in paleoclimate collections – probably more proxies than the rest of the world combined. The 30-60S latitude band is exactly the same size, but it is little studied.
o Most of all, given that the 60-30S latband is almost entirely (~96%) ocean, it seems bizarre that PAGES 2019 did not use any ocean core proxies, especially since there are physical formulas for estimating SST from alkenone or Mg/Ca measurements. Any conversion of tree ring widths to temperature in deg C is the result of ad hoc statistical fitting, not a universal formula. Alkenone values have been measured all over the modern ocean and nicely fit known ocean temperatures. In addition, alkenone values for ocean cores going back to deeper time (even to the Miocene give a consistent and reproducible narrative. So, there’s a lot to like about them as a candidate for a “good” proxy”.
It is concluded that the “hockey-stick” presented in the SPM has no rigorous scientific basis and misrepresents climate variability over the last two millennia. As a corollary, it cannot be asserted that recent climate variations are “unprecedented”.
8
3. Misrepresentation of “extreme weather events” Section SPM Claims CLINTEL Summary Comment Item A.1.4 This section makes claims on
increased precipitation, ocean salinity and storm tracks
Claims on weather extremes are misrepresented in the SPM compared to detailed chapters
3
A.3 Human-induced climate change is already affecting many weather and climate extremes in every region across the globe, with stronger attribution to human influence
Generalised overstatement; attribution is not rigorous. Claims on weather extremes are misrepresented in the SPM compared to detailed chapters
3
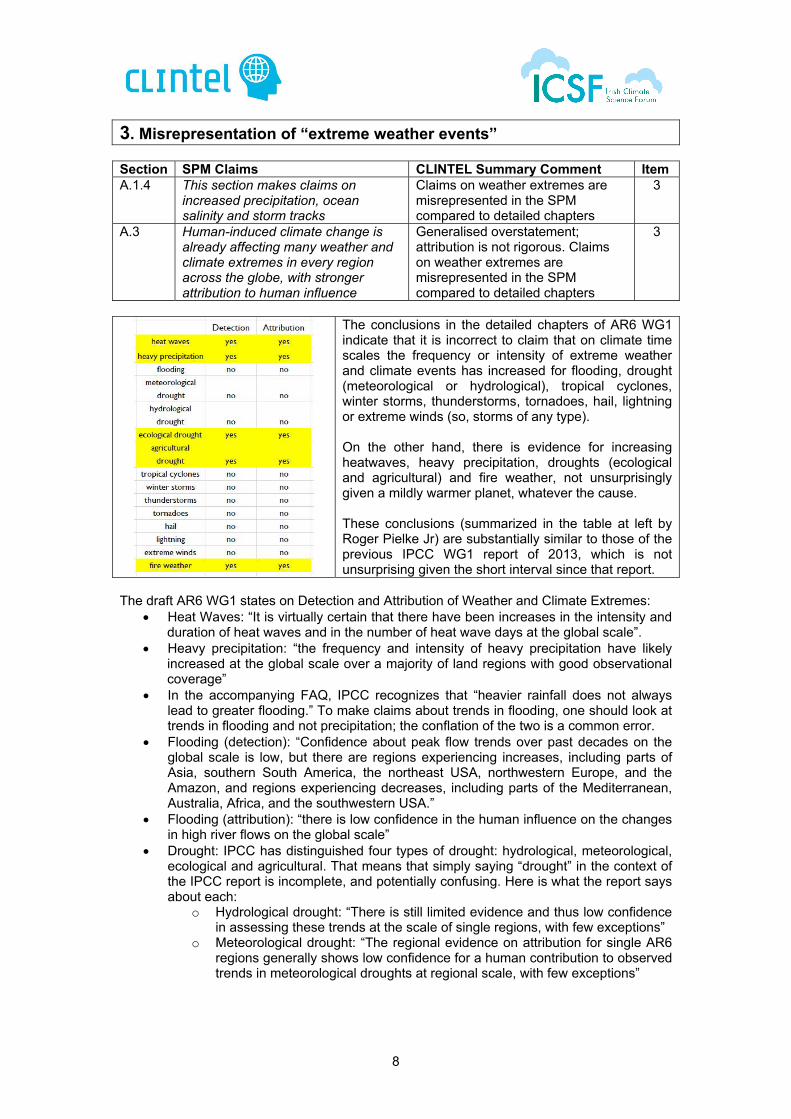
The conclusions in the detailed chapters of AR6 WG1 indicate that it is incorrect to claim that on climate time scales the frequency or intensity of extreme weather and climate events has increased for flooding, drought (meteorological or hydrological), tropical cyclones, winter storms, thunderstorms, tornadoes, hail, lightning or extreme winds (so, storms of any type). On the other hand, there is evidence for increasing heatwaves, heavy precipitation, droughts (ecological and agricultural) and fire weather, not unsurprisingly given a mildly warmer planet, whatever the cause. These conclusions (summarized in the table at left by Roger Pielke Jr) are substantially similar to those of the previous IPCC WG1 report of 2013, which is not unsurprising given the short interval since that report.
The draft AR6 WG1 states on Detection and Attribution of Weather and Climate Extremes:
• Heat Waves: “It is virtually certain that there have been increases in the intensity and duration of heat waves and in the number of heat wave days at the global scale”.
• Heavy precipitation: “the frequency and intensity of heavy precipitation have likely increased at the global scale over a majority of land regions with good observational coverage”
• In the accompanying FAQ, IPCC recognizes that “heavier rainfall does not always lead to greater flooding.” To make claims about trends in flooding, one should look at trends in flooding and not precipitation; the conflation of the two is a common error.
• Flooding (detection): “Confidence about peak flow trends over past decades on the global scale is low, but there are regions experiencing increases, including parts of Asia, southern South America, the northeast USA, northwestern Europe, and the Amazon, and regions experiencing decreases, including parts of the Mediterranean, Australia, Africa, and the southwestern USA.”
• Flooding (attribution): “there is low confidence in the human influence on the changes in high river flows on the global scale”
• Drought: IPCC has distinguished four types of drought: hydrological, meteorological, ecological and agricultural. That means that simply saying “drought” in the context of the IPCC report is incomplete, and potentially confusing. Here is what the report says about each:
o Hydrological drought: “There is still limited evidence and thus low confidence in assessing these trends at the scale of single regions, with few exceptions”
o Meteorological drought: “The regional evidence on attribution for single AR6 regions generally shows low confidence for a human contribution to observed trends in meteorological droughts at regional scale, with few exceptions”
9
o Ecological and agricultural drought: “There is medium confidence that human
influence has contributed to changes in agricultural and ecological droughts and has led to an increase in the overall affected land area”
• Tropical cyclones: “There is low confidence in most reported long-term (multidecadal to centennial) trends in tropical cyclone frequency- or intensity-based metrics”
• Winter storms: “There is low confidence in observed recent changes in the total number of extratropical cyclones over both hemispheres. There is also low confidence in past-century trends in the number and intensity of the strongest extratropical cyclones over the Northern Hemisphere…”
• Thunderstorms, tornadoes, hail, lightning: “observational trends in tornadoes, hail, and lightning associated with severe convective storms are not robustly detected due to insufficient coverage of the long-term observations”
• Extreme winds (between 60S and 60N): “the observed intensity of extreme winds is becoming less severe in the lower to mid-latitudes, while becoming more severe in higher latitudes poleward of 60 degrees (low confidence)”
• Fire weather: “There is medium confidence that weather conditions that promote wildfires (fire weather) have become more probable in southern Europe, northern Eurasia, the US, and Australia over the last century”.
Evidence on Flooding: As a key example, other important evidence on flooding trends has been downplayed in the detailed chapters, such as in the 2017 paper of G.A. Hodgkins and others, which concluded that: “Overall, the number of significant trends in major-flood occurrence across North America and Europe was approximately the number expected due to chance alone. Changes over time in the occurrence of major floods were dominated by multidecadal variability rather than by long-term trends” Another paper of Hodgkins et al (2019), dealing only with the U.S. has similarly been downplayed in the detailed chapters as: “River floods: There is limited evidence and low agreement on observed climate change influences for river floods in North America. Trends in streamflow indices are mixed and difficult to separate from river engineering influences, with large changes but little spatial coherence across the US, making it difficult to identify trends with confidence”. Neither paper has been correctly summarised in the SPM. References
o Hodgkins, G.A., R.W. Dudley, S.A. Archfield, and B. Renard (2019). Effects of climate, regulation, and urbanization on historical flood trends in the United States. Journal of Hydrology, 573, 697–709, doi:10.1016/j.jhydrol.2019.03.102.
o Hodgkins, G. A., Whitfield, P. H., Burn, D. H., Hannaford, J., Renard, B., Stahl, K., Anne K. Fleig, Henrik Madsen, Luis Mediero, Johanna Korhonen, Conor Murphy and Donna Wilson (2017). Climate-driven variability in the occurrence of major floods across North America and Europe. J. Hydrol. 552, 704–717. doi:10.1016/j.jhydrol.2017.07.027
Overall comment: Perhaps the best overview of weather events since the last Ice Age is given in HH Lamb’s classic “Climate, History and the Modern World”, first published in 1982, reprinted many times since then. It also documented extreme weather events in the global cooling period of the 1960s and 1970s. This book alone leaves little doubt that modern-day so-called “extreme weather” events are not at all unprecedented. As a conclusion, the SPM misrepresents the detailed findings on extreme events.
10
4. Misrepresentation of developments in the Cryosphere Section SPM Claims ICSF/CLINTEL Comments Item A.1.5 Cryosphere: Human influence is very
likely the cause of retreat of glaciers, decrease in Arctic sea ice, but no significant trend in the Antarctic; decrease in Spring snow cover and melting of Greenland Ice Sheet.
Changes in the cryosphere are not unprecedented, even in a Holocene perspective. Especially the Arctic region was likely warmer during the Holocene Thermal Optimum.
4
A.2.3 Arctic sea ice lowest since at least 1850; late summer Arctic ice smaller than in the past 1,000 years. Glacier retreat is unprecedented, at least in the last 2,000 years
Changes in the cryosphere are not unprecedented, even in a Holocene perspective. Especially the Arctic region was likely warmer during the Holocene Thermal Optimum.
4
State of the Cryosphere – The Arctic
Observations show that, while Arctic sea ice has been declining since satellite records began in 1979, the September minimum sea ice extent has been broadly stable since 2007, see http://ocean.dmi.dk/arctic/icecover_30y.uk.php. The March maximum sea ice extent has also been broadly stable since 2005. The graph shows that the September mean northern hemisphere sea ice extent in millions of km2, 1979-2021 has been stable since 2007
Recent studies (eg Connolly, Connolly and Soon, Hydrol Science Journal, Vol 62, pp1317-1340) and https://globalwarmingsolved.com/2013/11/is-the-arctic-melting/ have interpolated a similar warmer Arctic temperature anomaly in the 1930-1940s (likely related to the AMO, also a period of strong El Niños), followed by cooler anomalies from 1945 to 1978, during which two episodes Arctic sea ice is inferred to have grown and shrunk respectively. Elevated Arctic temperatures in the 1930-40s is also evidenced in Humlum’s http://climate4you.com/ and in his “State of the Climate 2019” at https://www.thegwpf.org/content/uploads/2020/05/State-of-the-climate-2019.pdf. Other historical reconstructions by Tamo, Fortin and Gajewski found that Arctic temperatures were 1-2°C warmer during most of the first millennium and in particular during the Medieval Warming Period, see: https://www.tandfonline.com/doi/pdf/10.1080/15230430.2019.1640527. Similar results showing that the Arctic was up to 6°C warmer 9,000 years ago were reported by Mangerud and Svendsen, see: https://journals.sagepub.com/doi/full/10.1177/0959683617715701, a result also replicated by Willem van der Bilt et al, see: https://ui.adsabs.harvard.edu/abs/2019GeoRL..4614732V/abstract. In conclusion, the claim that current Arctic ice loss is unprecedented over the last 1000 years does not stand up. There is significant evidence to the contrary. It may not be unprecedented even in the last 100 years. Incidentally, polar bears are thriving, See https://www.thegwpf.com/?s=crockford and https://www.thegwpf.org/content/uploads/2015/06/Arctic-Fallacy2.pdf.
11
State of the Cryosphere – The Antarctic A 2000-year reconstruction of Antarctic temperatures shows a warm period from 300-1000 AD, and a cool period from 1200-1900 AD. Recent research by Lüning, Galka and Vahrenholt also confirms a cooling trend in the Antarctic since 600 AD, the recent slight warming being insignificant in the millennial context, see: https://ui.adsabs.harvard.edu/abs/2019PPP...532j9251L/abstract. Overall, there is no significant trend in the Antarctic ice mass over the last 2,000 years. According to data kept by the British Antarctic Survey, the 2021 winter's harsh temperatures were the lowest in more than 60 years. State of the Cryosphere – Greenland Observed fluctuations in Greenland’s temperatures since 1851, based on re-analysis by KNMI, show current temperatures to be similar to those as far back as the 1880s. Not unsurprisingly, Greenland shows a similar historical temperature trend as the Arctic, with a previous warmer period in the warm 1930-1940s, the previous time the AMO was in warm phase, as it presently is, see https://www.the-cryosphere.net/12/39/2018/tc-12-39-2018-supplement.pdf. Recent analysis by Axford et al reveal that the Greenland ice sheet was smaller than today for most of the last 10,000 years, reaching its peak about 1850, see: https://www.sciencedirect.com/science/article/abs/pii/S0277379119302021. Another analysis by Schweinsberg et al found that the most pronounced glacier expansion in West Greenland occurred within the last 2,000 years, see: http://www.glyfac.buffalo.edu/Faculty/briner/buf/pubs/Schweinsberg_et_al_2019.pdf, also that a reconstruction of ice sheet temperatures shows that current temperatures are not unusual in the last 10,000 years, and were probably 2.9°C higher in the Early Holocene about 8,000 years ago. More anecdotally, it is worth recalling that Greenland is so called because the Vikings inhabited a then-green Greenland from about 985 to 1385, until they had to abandon it at the onset of the Little Ice Age. Recently, abandoned WWII planes were found intact under 100m of snow and ice. Contrary to the IPCC claim, there is nothing unprecedented in the ice sheet status of Greenland, not alone in recent centuries, but over the last 10,000 years. This year’s summer melt has been one of the shortest on record, beginning a month late. Indeed last year’s summer melt was also truncated, Greenland is still losing ice, but at a much lower rate in recent years than a decade ago, mainly due to its glaciers becoming more stable. According to NASA observations, the Jakobshavn Glacier in Western Greenland, after being in retreat for decades, is advancing since 2016/17. State of the Cryosphere – Glaciers Glaciers need to be seen in their historical context. A retreating glacier at the Lendbreen Pass in central Norway’s recently yielded artefacts from the Roman and Medieval Warming Periods. A retreating glacier in Breioamerkursandur in southeast Iceland has revealed stumps of 3,000 year-old trees. Similar finds have been made in Alaska, Patagonia and Switzerland. It appears therefore that glaciers started to grow some time before the onset of the Little Ice Age, reaching a maximum around 1850. Despite 170 years of retreat, many glaciers still exist as an historical anomaly. As mentioned above, glaciers in Greenland are growing. The facts show that there is nothing unprecedented about glacier melt, it is determined by natural causes. In conclusion, the claimed changes in the cryosphere are not borne out by observations.
12
5. Misrepresentation of developments in the Oceans Section SPM Claims ICSF/CLINTEL Comments ItemA.1.6 Oceans: human influence is main
driver of upper ocean warming and acidification
Warming of the oceans is very modest and shows great regional variability.
5
A.1.7 Oceans: human influence is very likely the main driver of acceleration in sea level rise since 1971
False, the rate of sea level rise is cyclically variable and was as high in 1930-40s
5
A.2.4 Sea level has risen since 1900 at a faster rate than in last 3,000 years
No valid evidence is presented 5
Global mean sea level rise Global mean sea level (GMSL) has been rising since the end of the last ice age, having risen by about 130m between 20,000 and 7,000 years ago (Figure 1). Subsequently, the rate of rise became slower, with intermissions during cold periods such as the Little Ice Age (approx. 1350-1850). The current period of GMSL rise began around 1850, as the Little Ice Age came to an end and the melting of alpine glaciers became evident (Figure 2).
Fig. 1.Estimated global sea level changes since the Last Glacial Maximum (~21,000 years ago), reproduced from Fig. 3.1 of Curry (2018). This figure was prepared by Robert A. Rohde from published data, and is incorporated into the Global Warming Art project. https://commons.wikimedia.org/w/index.php?curid=479979.
Fig. 2. Global mean sea level anomalies (mm; blue) and carbon emitted (millions of tonnes; red) since the early 19th century. Reproduced from Fig. 4.1 of Curry (2018). [Sea level from Jevrejeva et al. (2014), carbon from Carbon Dioxide Information Analysis Center (CDIAC, 2014)].
It is clear from Figure 2 that the GMSL was rising long before 1950, when fossil fuel emissions began to be appreciable. The rate of rise since 1850 is not constant, but shows substantial multi-decadal variability. Douglas (1992) has argued that acceleration in observed GMSL rise needs at least 50 years of observations to be significant; otherwise, it is merely short-term variation. The sea level reconstruction of Jevrejeva et al. (2014) shown in Fig. 2 indicates a linear trend of 1.9 ± 0.3 mm/yr during the 20th century. References:
o Douglas, B.C. (1992). Global sea level acceleration. J. Geophys. Res., 97(C8), 12,699-12,706.
o Jevrejeva, S., JC Moore, A Grinsted, A.Matthews, G Spada (2014) Trends and acceleration in global and regional sea levels since 1807. Global and Planetary Change, 113. 11-22. https://doi.org/10.1016/j.gloplacha.2013.12.004
13
Recently, a NASA-led study has resulted in a state-of-the-art framework that brings together advances in sea level models and satellite observations to improve understanding of sea level rise for the past 120 years (Frederikse et al. 2020). The GMSL rise over the period 1900-2018 obtained in this study are shown in Figure 3. This figure again shows multi-decadal variability. An analysis of the data shows that, relative to the values given above, the average rate of GMSL rise during the 20th century needs to be revised downward to 1.4 mm/yr. The rate of GMSL rise shown by the study’s reconstructed tide gauge data in the period 1993-2018 is seen to be in good agreement with the satellite altimetry data available during the same period, both rates of rise being about 3.3 mm/yr.
Fig. 3. Global sea level rise, 1900-2018, as measured by tide gauge after correcting for the imprint of Glacial Isostatic Adjustment, the effects of Gravity, Rotation and Deformation, and the effects of Vertical Land Movement. Source: Frederikse et al. (2020) “The causes of sea-level rise since 1900, see https://doi.org/10.1038/s41586-020-2591-3.
The Frederikse et al. data also shows that the rate of GMSL rise in the 20-year period 1934-1953 was 3.3 mm/yr, about the same as in the period 1993-2018. According to Frederikse et al., the above-average rate of GMSL rise in that period is attributable to above-average contributions from glaciers and the Greenland Ice Sheet, with the Greenland contribution around 1935 being slightly greater than in 2018.
The AR6 SPM states that global mean sea level increased by 0.2m between 1901 and 2018. The average rate of rise was 1.3mm/y between 1901 and 1971, increasing to 1.9mm/y between 1971 and 2006, further increasing to 3.7mm/y between 2006 and 2018. It can be seen that the rate of rise is variable, being almost as high in the warm 1930s.
Land-based observations (going back 100 years) confirm that GMSL continues at 1-2mm/y without any acceleration. Satellite figures going back only to 1993 point to a reasonably linear ~3mm/y trend. It is cherry-picking by IPCC to use the 3.7mm/y figure. Even if GMSL is now rising at an upper-range average of ~3.3mm/y figure, that means a sea-level rise of the order of 0.25m by 2100, which merits a long-term adaptation strategy, but does not point to any “climate crisis” in this century. There is no basis for the SPM claim that global mean sea level is now rising at a faster rate than in the last 3,000 years. It could be surmised that sea level rose slightly during the Roman and Medieval Warming Periods at rates similar to now, but probably declined during the Little Ice Age (as depicted in Figure 2). As shown in Figure 1, the changes in global mean sea level have very likely been less than 1m in the last 3,000 years. Maldives & Pacific-Indian Ocean islands Media frequently cite claims of catastrophic sea level rise engulfing island coasts as a consequence of global warming, which claims are unfounded.
14
A 2019 global-scale analysis of 709 islands in the Pacific and Indian Oceans revealed 89% were either stable or growing in size, and that no island larger than 10 ha (and only 1.2% of islands larger than 5 ha) had decreased in size since the 1980s (Duvat, 2019). A new analysis of post-2000 trends also indicates global-scale stable to expanding shorelines for hundreds of Pacific and Indian Ocean islands, with over half of the net growth (39 km² of 62 km²) occurring from 2013 to 2017.
Ocean Warming and Acidification The SPM claims that recent ocean heating is unprecedented and implies that current earth system warming is a matter of concern. However, there is a lack of historic data from the paleoclimate and the more recent Roman and Medieval Warming Periods. There is regular ongoing data on ocean temperatures by Humlum in www.climate4you.com, the latest being at http://www.climate4you.com/Text/Climate4you_September_2021.pdf, pages 18 and 23, where he concludes that the temperature of the global oceans down to 1900 m depth has been increasing since 2011 by only about 0.05°C. It is also seen that this increase since 2013 dominantly is due to oceanic changes occurring near the Equator, between 30°N and 30°S. In contrast, for the circum-Arctic oceans north of 55°N, depth-integrated ocean temperatures have been decreasing since 2011. Near the Antarctic, south of 55°S, temperatures have essentially been stable. This is further elaborated in Humlum’s “State of the Climate 2019”, seen at https://www.thegwpf.org/content/uploads/2020/05/State-of-the-climate-2019.pdf. Observations seriously question the SPM conclusion on ocean heating, and do not indicate that there is anything unprecedented about warming of the ocean. Ocean “acidity” or pH continues to vary naturally between 7.5 to 8.5. The geological record of ocean acidification, Science 535, p1058, 2012, records that marine life with shells thrived over the past 300m years with ocean surface pH ranging from 7.5 to 8.1. Thus ocean “acidification” appears a non-issue. Coral bleaching is often attributed to climate change and associated changes in the ocean temperature and pH. A recent study “Reconstruction of 4 Centuries of Temperature-induced Coral Bleaching in the Great Barrier Reef” by Kamenos and Hennige, Frontiers in Marine Science, Aug 2018, Vol 5 Art 283, doi:10.3389/fmars.2018.00283, found that bleaching was significantly higher in the 1750s and 1890s, confirming that coral bleaching is a natural phenomenon, which may have little to do with global warming. In conclusion, claims concerning rising sea levels, warming and acidity are misrepresented.
15
6. Oversensitivity of Climate Models Section SPM Claims ICSF/CLINTEL Comments Item A.4 Improved knowledge...puts the best
estimate of ECS at 3°C Important evidence for lower ECS was not taken into account
6
A.4.4 The very likely range of ECS is between 2°C and 5°C.
Important evidence for lower ECS was not taken into account
6
B.1 Global warming of 1.5°C and 2°C will be exceeded in the 21st century without deep reductions in GHG
This claim is based on overly sensitive models and overly pessimistic scenarios.
6
D.1 Each 1,000GtCO2 is likely to cause 0.45°C rise in global surface temp
Claim is based on overly sensitive models.
6
D.2 Mitigation will not lead to any difference in global temperatures discernable from natural variability in next 20 years
Indeed, adaptation to whatever modest climate change occurs in coming decades is key.
6
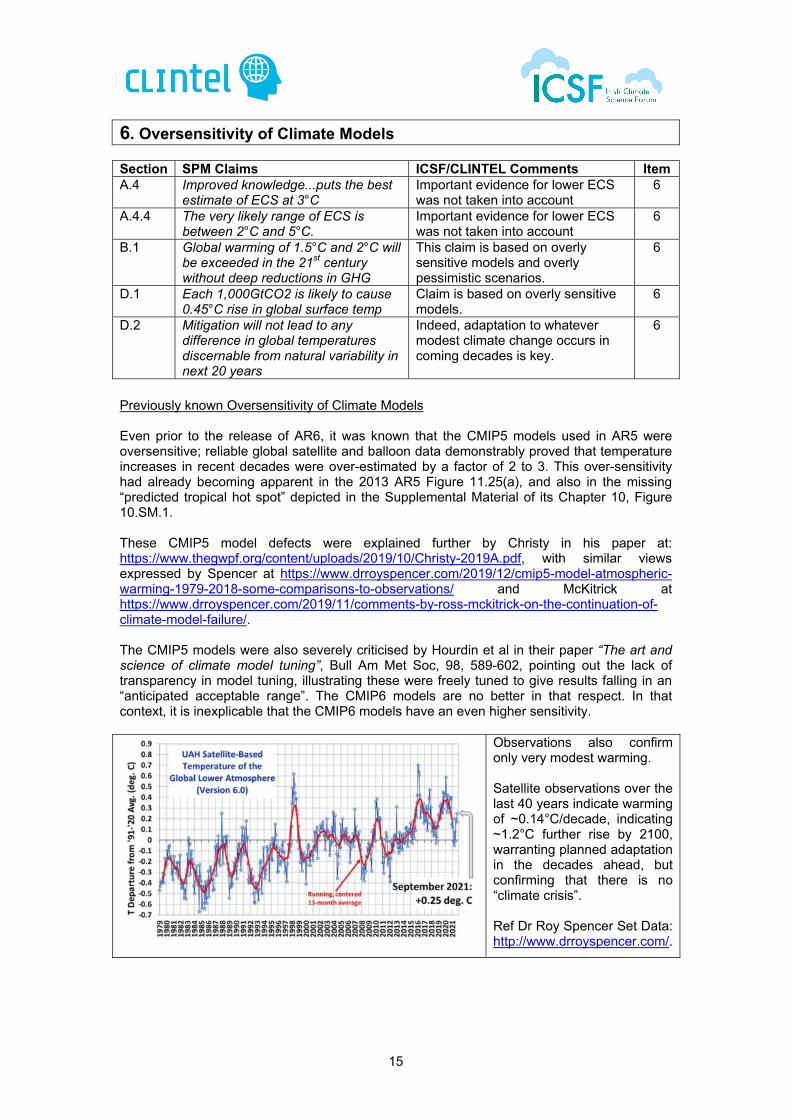
Previously known Oversensitivity of Climate Models Even prior to the release of AR6, it was known that the CMIP5 models used in AR5 were oversensitive; reliable global satellite and balloon data demonstrably proved that temperature increases in recent decades were over-estimated by a factor of 2 to 3. This over-sensitivity had already becoming apparent in the 2013 AR5 Figure 11.25(a), and also in the missing “predicted tropical hot spot” depicted in the Supplemental Material of its Chapter 10, Figure 10.SM.1. These CMIP5 model defects were explained further by Christy in his paper at: https://www.thegwpf.org/content/uploads/2019/10/Christy-2019A.pdf, with similar views expressed by Spencer at https://www.drroyspencer.com/2019/12/cmip5-model-atmospheric-warming-1979-2018-some-comparisons-to-observations/ and McKitrick at https://www.drroyspencer.com/2019/11/comments-by-ross-mckitrick-on-the-continuation-of-climate-model-failure/. The CMIP5 models were also severely criticised by Hourdin et al in their paper “The art and science of climate model tuning”, Bull Am Met Soc, 98, 589-602, pointing out the lack of transparency in model tuning, illustrating these were freely tuned to give results falling in an “anticipated acceptable range”. The CMIP6 models are no better in that respect. In that context, it is inexplicable that the CMIP6 models have an even higher sensitivity.
Observations also confirm only very modest warming. Satellite observations over the last 40 years indicate warming of ~0.14°C/decade, indicating ~1.2°C further rise by 2100, warranting planned adaptation in the decades ahead, but confirming that there is no “climate crisis”. Ref Dr Roy Spencer Set Data: http://www.drroyspencer.com/.
16
Even before the release of AR6, there was no plausible empirical basis for estimating ECS to be 3°C. On the other hand, there was significant evidence that ECS lies below 1.5°C and may be as low as 1°C or even lower, again confirming that there is no climate “emergency”. It is clear that evidence for Low Climate Sensitivity was ignored in the AR6 Report (a) The Earth’s Tropical Longwave Radiative Response to Temperature Perturbations Chapter 7 “The Earth’s energy budget, climate feedbacks, and climate sensitivity” makes no reference to Lindzen and Choi (2011; hereafter LC11), the most important paper on climate feedbacks and climate sensitivity written in recent decades. Using monthly-mean satellite radiation data and reanalysis temperature data, the LC11 paper shows that the Earth’s all-sky longwave radiative response to surface temperature perturbations averaged over the tropical oceans (20°S-20°N) significantly exceeds the Planck response (≈ 3.2 W m-2 K-1). The corresponding response of the CMIP5 models, whether run in AMIP mode (SST and sea ice prescribed) or CMIP mode (SST and sea ice simulated) lies significantly below the Planck value. This serious observation/model discrepancy will here be referred to as the Tropical Longwave Response (TLR) Discrepancy. No information is provided in Chapter 7 regarding the TLR discrepancy in the CMIP6 models; only global mean radiative responses on interannual time scales are provided. These do not allow the observation/model discrepancy to be seen for what it is. The reality of the TLR Discrepancy was confirmed by Mauritsen and Stevens (2015, hereafter MS15). Again using monthly-mean CERES observations, they arrived at results very similar to those of LC11. They stated that “the discrepancy between the [tropical all-sky LW] observations on the one hand and the models on the other is robust.” Using a simple energy balance model, LC11 showed that the TLR discrepancy leads to a significant overestimation of equilibrium climate sensitivity (ECS) by the GCMs. The value of ECS they obtained using the simple energy balance model and the observational value of the radiative response was less than 1°C. The AR5 report (2013) rejected the significance of the LC11 results on incorrect grounds. In Section 10.8.2.2, the report incorrectly stated that the energy balance model used by LC11 was limited to the tropics. However, it was clearly shown by Bates (2016; hereafter B16) that LC11’s energy balance model was global. It corresponds to Model A of B16 with the extratropical radiative response coefficient set to its Planck value (Appendix B of B16). B16 also showed that the TLR Discrepancy can result in an even more serious overestimation of ECS by the GCMs than had been indicated by LC11. Now, in AR6, the LC11 paper is not even referred to. The AR6 authors appear to base their justification of this on the Sherwood et al. (2020) paper, which is now incorrectly taken as the “gold standard” in matters of climate sensitivity: it is referred to 22 times in Chapter 7. The grounds put forward in Sherwood et al (2020) for rejecting the significance of the LC11 paper are twofold: (1) It is stated that there is no clear evidence that precipitation efficiency would increase in a warmer climate; (2) It is stated that the LC11 results are nullified by the results of I. N. Williams and Pierrehumbert (2017). In response to the above: (1) The LC11 results are based on observations; they do not depend on any particular physical mechanism such as precipitation efficiency; (2) Lindzen and Choi (2021) have shown that the results of Williams and Pierrehumbert (2017) are invalid. In brief, the failure of AR6 to discuss the TLR Discrepancy discovered by LC11 invalidates the report as far as the central issues of climate feedbacks and climate sensitivity are concerned.
17
(b) Satellite-observed tropospheric temperature trends Using satellite microwave observations, Christy and McNider (2017) found that, when the cooling effects of the El Chichon and Mt. Pinatubo volcanic eruptions are removed, the global lower tropospheric temperature trend in the period 1979-2017 is just under 0.1°C per decade. Since tropospheric temperatures are expected on physical grounds to increase faster than surface temperatures, the above figure places an upper bound on the global surface temperature trend in the same period. A lower tropospheric temperature trend of 0.1°C per decade is entirely consistent with low ECS as indicated by the LC11 results. Christy and McNider (2017) found that the corresponding mean tropospheric temperature trend in the CMIP5 GCMs is more than twice the above figure. This GCM/Observational discrepancy will here be referred to as the Tropospheric Temperature Trend (TTT) Discrepancy. Just as in the case of the LC11 paper, the Christy and McNider (2017) paper received no mention in the AR6 report. Tuning of the CMIP6 models to eliminate the TLR and TTT Discrepancies, both of which are reliably established and strongly ECS-related, was not discussed in AR6. This is an extremely serious omission. If it is not possible to tune the GCMs so as to eliminate these discrepancies, this should have been openly acknowledged. The lack of discussion of this topic is, by itself, sufficient to make the CMIP6 model results unacceptable. (c) Summary In summary, the claim in AR6 (Chapter 7, p.7-8) that “All lines of evidence help rule out ECS values below 1.5°C” is erroneous. The fact is that the relevant evidence has been ignored. References
o Bates (2016), J. R. Estimating climate sensitivity using two-zone energy balance models. Earth and Space Science, 3, 207-225. Open access at http://onlinelibrary.wiley.com/doi/10.1002/2015EA000154/epdf
o Christy, J.R. and R.T. McNider (2017). Satellite Bulk Tropospheric Temperatures as a Metric for Climate Sensitivity. Asia-Pac. J. Atmos. Sci., 53(4), 511-518, DOI:10.1007/s13143-017-0070-z
o Lindzen, R. S., and Y.-S. Choi (2011). On the observational determination of climate sensitivity and its implications, Asia-Pacific J. Atmos. Sci., 47, 377–390. [LC11]
o Lindzen, R.S and Choi, Y-S. (2021). The Iris Effect: A Review. Asia-Pacific J. Atmos. Sci., https://doi.org/10.1007/s13143-021-00238-1
o Mauritsen, T. and Stevens, B. (2015). Missing iris effect as a possible cause of muted hydrological change and high climate sensitivity in models. Nat. Geosci. 8, 346–351. doi:10.1038/ngeo2414. [MS15]
o Sherwood, S. et al., 2020: An assessment of Earth’s climate sensitivity using multiple lines of evidence. Reviews of Geophysics, 58(4), doi:10.1029/2019rg000678
o Williams, I. N., & Pierrehumbert, R. T. (2017). Observational evidence against strongly stabilizing tropical cloud feedbacks. Geophysical Research Letters, 44, 1503–1510. https://doi.org/10.1002/2016GL072202
o Unless wealthy nations commit to tackling emissions now, the world is on a “catastrophic pathway” to 2.7-degrees of heating by the end of the century, UN Secretary General António Guterres warned on Friday, Sept 17, 2021.
It is clear that the SPM has ignored the latest science relating to climate sensitivity, leading a false state of “climate crisis”. This also makes nonsense of its estimated “remaining Carbon budgets”. Adaptation versus Mitigation The SPM effectively admits in section D2 hat even severe mitigation will not cause any detectable reduction in global temperatures discernable from natural variability in the coming decades. This very important admission indicates that climate strategy should be primarily based on adaptation, not mitigation.