32

CRL SOP #: MS014 Revision No: 0
Revision Date: January 30, 2008 Page 2 of 32
CRL METHOD MS014
ANALYSIS OF ALDICARB, BROMADIOLONE, CARBOFURAN, OXAMYL AND METHOMYL IN WATER BY LIQUID CHROMATOGRAPHY/TANDEM MASS SPECTROMETRY
(LC/MS/MS)
TABLE OF CONTENTS SECTION PGS PG NO. 1. SCOPE AND APPLICATION 1 3 2. LIST OF ACRONYMS AND ABBREVIATIONS 1 4 3. SUMMARY OF METHOD 1 5 4. HEALTH AND SAFETY 1 5 5. CAUTIONS AND INTERFERENCES 1 5 6. APPARATUS AND MATERIALS 2 6 7. INSTRUMENT CALIBRATION 3 7 8. SAMPLE COLLECTION, HANDLING AND PRESERVATION 1 9 9. ANALYTICAL PROCEDURE 3 9 10. WASTE HANDLING AND POLLUTION PREVENTION 1 11 11. CALCULATION AND DOCUMENTATION 2 11 12. ROUTINE ANALYSIS 4 12 13. QUALITY CONTROL 2 15 14. TROUBLESHOOTING GUIDE PREVENTIVE MAINTENANCE 2 17 15. REFERENCES 1 19 16. TABLES AND VALIDATION DATA 5 20 17. ATTACHMENTS 8 25
DISCLAIMER The mention of trade names or commercial products in this document is for illustrative purposes, and does not constitute an endorsement or recommendation for use by the U. S. Environmental Protection Agency.

CRL SOP #: MS014 Revision No: 0
Revision Date: January 30, 2008 Page 3 of 32
1. Scope and Application
1.1 This procedure covers the determination of aldicarb, bromadiolone, carbofuran, oxamyl, and methomyl which are analyzed by direct injection without derivatization by liquid chromatography/tandem mass spectrometry (LC/MS/MS). These compounds are qualitatively and quantitatively determined by this method.
1.2 This is the Chicago Regional Laboratory (CRL) method for the analysis of aldicarb, bromadiolone,
carbofuran, oxamyl, and methomyl in water samples by LC/MS/MS utilizing the Waters 2695™ liquid chromatograph (LC) system and a Quattro micro™ MS/MS.
1.3 The limit of detection (LOD) and the CRL reporting limits (RL) for these compounds are listed in
Table 1. This standard operating procedure (SOP) has been tested on laboratory water and Chicago River water samples. The precision and accuracy (P&A) quality control acceptance criteria are shown in Table 2. Limit of Detection and P&A values will be updated regularly as more data is collected.
1.4 The statistical method, utilizing the Laboratory Control Standards (LCS) and their duplicates, will
be used to calculate uncertainty as more data is collected. Uncertainty values will be provided after further inter-laboratory method validation.
1.5 LOD with precision and accuracy studies must be performed before an analytical SOP may be
used and will be repeated for any major SOP revisions. These studies evaluate whether the reporting limits and calibration standard concentrations are appropriate. LOD studies must be performed annually for this method if values are reported below the reporting limit.
CRL SOP #: MS014 Revision No: 0
Revision Date: January 30, 2008 Page 4 of 32
2. List of Acronyms and Abbreviations
CAS Chemical Abstract Service CCC Continuing Calibration Check CD Compact Disc CRL Chicago Regional Laboratory EPA U.S. Environmental Protection Agency IC Initial Calibration LC Liquid Chromatography LCS Laboratory Control Sample LOD Limit of Detection LV Calibration Level MDL Method Detection Limit MRM Multiple Reaction Monitoring MS Mass Spectrometry MS/MS Tandem Mass Spectrometry MS/MSD Matrix Spike/Matrix Spike Duplicate NIST National Institute of Standards and Technology PPB Parts per Billion PPM Parts per Million PPT Parts per Trillion P&A Precision and Accuracy QA Quality Assurance QC Quality Control REC Percent Recovery RL Reporting Limit RLIMS Relational Laboratory Information Management System RSD Relative Standard Deviation RT Retention Time RTS Retention Time Shift SOP Standard Operating Procedure SRM Single Reaction Monitoring SS Surrogate Standard TC Target Compound TCL Target Compound List
CRL SOP #: MS014 Revision No: 0
Revision Date: January 30, 2008 Page 5 of 32
3. Summary of Method 3.1 For aldicarb, bromadiolone, carbofuran, oxamyl, and methomyl analysis the samples are
shipped to the lab at 4°C. The samples are spiked with surrogates, filtered using a syringe driven Millex® HV PVDF filter unit and analyzed directly by LC/MS/MS within 7 days.
3.2 The target compounds are identified by comparing the sample primary and confirmatory
multiple reaction monitoring (MRM) transitions to the known standard primary and confirmatory MRM transitions. The retention time for the analytes of interest must also fall within the retention time of the standard by ±5%. The target compounds are each quantitated using the primary single reaction monitoring (SRM) transition utilizing external calibration. The final report issued for each sample lists the total concentration of aldicarb, bromadiolone, carbofuran, oxamyl, and methomyl, if detected, or reporting limit, if not detected, in μg/L for water samples. Concentrations below the reporting limit will not be reported.
4. Health and Safety
The toxicity and carcinogenicity of each reagent used in this method has not been precisely defined; however, each chemical compound is treated as a health hazard. From this viewpoint, exposure to these chemicals is reduced to the lowest possible level. The laboratory maintains a web reference of material data safety sheets regarding the safe handling of the chemicals specified in this method. The address is www.msdsvault.com. The username in CRLUSER and password is CRLMSDS.
5. Cautions and Interferences
Method interferences may be caused by contaminants in solvents, reagents, glassware and other apparatus that lead to discrete artifacts or elevated baseline in the selected ion current profiles. All of these materials are routinely demonstrated to be free from interferences by analyzing laboratory reagent blanks under the same conditions as the samples.
5.1 All reagents and solvents should be of pesticide residue purity or higher to minimize
interference problems.
5.2 Matrix interferences may be caused by contaminants from the sample, sampling devices or storage containers. The extent of matrix interferences will vary considerably from sample source to sample source, depending upon variations of the sample matrix.
6. Apparatus and Materials
6.1. LC/MS System
6.1.1 Liquid Chromatograph (LC) System - An analytical system complete with a
temperature programmable liquid chromatograph with a solvent mixer (Waters - Model 2695™) and all required accessories including syringes, solvent degasser and autosampler. The injection port must be designed for 100 μL injection.
CRL SOP #: MS014 Revision No: 0
Revision Date: January 30, 2008 Page 6 of 32
6.1.2 Analytical column - Waters – XBridge™ C18 150 mm x 2.1 mm, 3.5 μm particle size, or equivalent.
6.1.3 Mass Spectrometer (MS) System – A Waters Quattro micro™ mass spectrometer
was used. A mass spectrometer capable of MRM analysis with the ability to scan fast enough to obtain at least 14 scans over a peak with adequate sensitivity is required. Refer to mass spectrometer specifications for more detail.
6.1.4 Data Backup Device - A data archival unit (IBM computer; Microsoft Windows XP
and Novell Netware file server- R5CRL) to archive data. All the lab generated data are also stored on the primary server. In addition, the laboratory has capabilities to store and retrieve data using other devices such as CD or DVD writers.
6.1.5 Data System - Masslynx™ Service Pack 4 or more recent must be interfaced to the
LC/MS that allows the continuous acquisition and storage on machine-readable media of all mass spectra obtained throughout the duration of the chromatographic program. Quanlynx™ is used for all quantitation from data generated from the LC/MS.
6.1.6 Ultra pure nitrogen gas generator or equivalent nitrogen gas supply
6.2 Glassware and Miscellaneous Supplies
6.2.1 Vials - 2-mL autosampler vials with teflon-lined screw tops. 6.2.2 Syringes - 0. 25 mL, 0.5 mL, 1 mL and 5.0 mL ±1% accuracy. 6.2.3 Micro-syringes - 100 μL, 50 μL, 25 μL and 10 μL ±1% accuracy. 6.2.4 Ultra pure Argon gas
6.2.5 Analytical balance accurate to 0.1 mg; reference weights traceable to Class S or S-1 weights.
6.2.6 NIST traceable thermometer.
6.2.7 Class A volumetric glassware.
6.2.8 Grab sample bottle – 250 mL or larger amber glass, fitted with Teflon lined screw cap. If amber bottles are not available, the samples should be protected from light.
6.2.9 Millex® HV Syringe driven filter unit PVDF 0.45 μm (Millipore Corporation,
Catalog # SLHV0033NS)
6.3 Reagents and Standards
When compound purity is assayed to be 98% or greater, the weight may be used without correction

CRL SOP #: MS014 Revision No: 0
Revision Date: January 30, 2008 Page 7 of 32
to calculate the concentration of the stock standard. All weights and concentrations listed in this SOP are corrected to 100% if less than 98% purity. Expiration time of the stock standards and all subsequent solutions are 7 days from the time prepared if stored protected from light (amber vials) and at 4°C or less. The spiking standards and surrogates can be used longer than 7 days if they fall within +/- twenty percent of the given concentration using a new calibration curve where the standards are less than 7 days old and stored protected from light (amber vials) at 4°C or less.
6.3.1 Solvents – Acetonitrile, Methanol, Isopropyl Alcohol, and Water, HPLC mass
spectrometry pesticide quality or equivalent.
6.3.2 Ammonium Acetate (ACS Reagent Grade or better)
6.3.3 Ammonium Hydroxide (Concentrated, ACS Reagent Grade or better)
6.3.4 Target Analytes- Aldicarb (CAS # 116-06-3), bromadiolone (CAS # 28772-56-7), carbofuran (CAS # 1563-66-2), oxamyl (CAS # 23135-22-0), and methomyl (CAS # 16752-77-5),
6.3.5 Surrogate – 4-Bromo-3,5-dimethylphenyl-N-methylcarbamate (BDMC) (CAS # 672-99-
1)
6.3.6 Label all standards with LIMS ID; and verify the correct grade of solvents in comment field.
6.3.7 Traceability of standards is done using the manufacturer’s specifications provided at time
of purchase.
6.3.8 Verification procedures are not available against reference materials for this draft method at this time.
7. Instrument Calibration and Standardization Procedures
All calibration standard preparations should be noted in the LC/MS Standards Logbook and LIMS. All standard stock vials include the identification of target compounds, concentrations, expiration date, and are referenced in LC/MS logbook. All small vials where space is an issue shall include a LIMS number which can be referenced back to the logbook. All stock solutions are prepared with methanol unless otherwise stated.
7.1 Surrogate Spiking Solution
Surrogate standard solution consisting of 4-Bromo-3,5-dimethylphenyl-N-methylcarbamate (BDMC) (CAS # 672-99-1) is added to all samples. The surrogate compound (BDMC) is added to the samples to produce a concentration of 50 μg/L. (i.e., 25 μL of a 50 ppm methanol solution containing BDMC is added to a 25 mL water sample.)
7.2 Target Compounds Spiking Solution

CRL SOP #: MS014 Revision No: 0
Revision Date: January 30, 2008 Page 8 of 32
Each matrix spike or LCS/LCSD sample is spiked with 25 μl of a 25 ppm methanol solution of aldicarb, bromadiolone, carbofuran, oxamyl, and methomyl to achieve a concentration of 25 ppb in 25 mL of water.
7.3 Calibration Standards
Calibration stock standard solution is prepared from standard materials or purchased as certified solutions. A stock standard Solution A (Level 6) containing aldicarb, bromadiolone, carbofuran, oxamyl, methomyl and BDMC in 90% water/10% methanol was diluted using 90% water/10% methanol to prepare Levels 1 through 5 as shown in Tables 3 & 4. All concentrated stock standard solutions are made in methanol. The resulting calibration standards made from these stock standards should contain 10% methanol in water to assure analyte solubility.
7.4 Calibration of Mass Spectrometer
The Waters Quattro micro™ mass spectrometer is calibrated monthly or when mass shifts of more than 0.5 Dalton are noticed by the analyst. The calibration file is saved in the Masslynx™ file folder. The calibration solution normally used is a mixture of NaCsI. Other calibration solutions can also be used per manufacturer’s specifications. The detailed procedure for calibrating the mass spectrometer can be found in the Masslynx™ instruction manual located near the instrument.
7.5 Quantitation of Target Analytes
The quantitation of the target analytes is accomplished with Quanlynx™ software. No internal standards are used. An external calibration is used along with monitoring BDMC surrogate recovery. Refer to Table 5 for the SRM transitions and retention times.
7.6 Initial Calibration
The initial calibration contains a 6 point curve as shown in Tables 3 and 4. Depending on instrument type the sensitivity and calibration curve responses may vary. At a minimum, a five point linear or a six point quadratic calibration curve will be utilized for all analytes. The coefficient of the determination (r2) of the linear fit must be greater than or equal to 0.98. The coefficient of the determination (r2) of the quadratic curve must be greater than or equal to 0.99. A calibration curve and an instrument blank will be analyzed at the beginning of each run or daily to insure instrument stability. A new curve will be generated daily. The calibration method is saved and used to quantify all samples.
8. Sample Collection, Handling and Preservation
8.1 Grab samples are collected in pre-cleaned amber glass containers with Teflon-lined caps. Field blanks are needed to follow conventional sampling practices. Samples are collected and refrigerated. Automatic sampling equipment must be free of Tygon tubing and other potential sources of contamination.
8.2 All samples are iced or refrigerated at 4ºC (± 2ºC) from the time of collection until
analysis.
CRL SOP #: MS014 Revision No: 0
Revision Date: January 30, 2008 Page 9 of 32
8.3 At the laboratory, samples are stored in the refrigerator at 4ºC or less until requested for
analysis. The samples should be analyzed within 7 days of collection or as soon as possible. After injection in the LC/MS/MS, the vial septa are replaced and the vials are stored in a refrigerator. The sample integrity due to decomposition of the target analytes is not addressed in this SOP and further sample collection and preservation studies need to be undertaken.
8.4 Conventional laboratory practices involving chain of custody, field sampling, sampling
protocols, preservation and holding times are referenced from CRL SOPs GEN004 and GEN013.
9. Analytical Procedure
9.1 Liquid Chromatography/Mass Spectrometry 9.1.1 The following are the liquid chromatographic conditions:
LC Chromatographic Column: (XBridge™ C18 3.5 μm particle, 150 mm x 2.1 mm or equivalent).
Injections of all calibration standards and samples are made at a 100 μL volume. The first sample analyzed after the curve is a blank to insure there is no carry-over. Analyze the calibration curve and samples in high to low concentrations so carry-over is less of a concern in case the LC cleaning cycle does not take care of the system between injections adequately. The gradient conditions for the liquid chromatograph are shown in Table 6. All samples and blanks are filtered through a Millex HV syringe driven filter unit PVDF with 0.45 μm pore size to remove particulates in the water samples. The syringes must be rinsed to full volume 3 times with 50/50 acetonitrile/water between all field samples, QC samples, blanks and standards. Calibration standards are not filtered through the syringe driven filter units since no particulates are present.
9.1.2 The following are the mass spectrometer conditions: Variable parameters depending on analyte are shown in Table 5.
The instrument is set in the Electrospray (+) positive source setting. Capillary Voltage: 3.5 kV Cone: Variable depending on analyte (Table 5) Extractor: 2 Volts RF Lens: 0.2 Volts Source Temperature: 120 °C Desolvation Temperature: 300 °C Desolvation Gas Flow: 500 L/hr Cone Gas Flow: 25 L/hr Low Mass Resolution 1: 14.5 High Mass Resolution 1: 14.5

CRL SOP #: MS014 Revision No: 0
Revision Date: January 30, 2008 Page 10 of 32
Ion Energy 1: 0.5 Entrance Energy: -1 Collision Energy: Variable depending on analyte (Table 5) Exit Energy: 2 Low Mass Resolution 2: 15 High Mass resolution 2: 15 Ion Energy 2: 0.5 Multiplier: 650 Gas Cell Pirani Gauge: 3.3 x 10⁻³ Torr Inter-Channel Delay : 0.02 seconds Inter-Scan Delay: 0.1 seconds Repeats: 1 Span: 0 Daltons Dwell: 0.1 Seconds
9.1.3 If the absolute amount of a target compound exceeds the working range of the
LC/MS system (see Level 6 in Table 3), the prepared sample is diluted with reagent water and re-analyzed.
9.1.4 If there are two or more analyses for a particular fraction due to sample dilution,
the analyst must determine which is the best result to report. 9.1.5 All qualitative and quantitative measurements are performed as described in
Section 9.2. When not being analyzed, samples are stored in the refrigerator at 4ºC or less and protected from light in screw cap top vials equipped with Teflon-lined septa.
9.2 Qualitative and Quantitative Analysis
9.2.1 An external calibration is used monitoring the SRM transitions of each analyte. Quanlynx™ Software is utilized to conduct the quantitation of the target analytes and surrogates. The SRM transitions of each analyte are used for quantitation and confirmation. This gives us confirmation by isolating the parent ion, fragmenting it to the product ion fragment, and also relating it to the retention time in the calibration standard.
9.2.2 The Quanlynx™ manual should be consulted in order to use the software
correctly. The quantitation method is set as an external calibration using the peak areas in ppt or ppb units as long as the analyst is consistent.
9.2.3 If the polynomial type is linear excluding the point of origin and a fit weighting
of 1/X in order to give more weighting to the lower concentrations. The retention time window of the MRM transitions must be within 5% of the retention time of the analyte in the level 4 calibration standard. If this is not true, the calibration curve needs to be re-analyzed to see if there was a shift in retention time during the analysis and the sample needs to be re-injected. If the retention time is still incorrect in the sample the analyte is referred to as an unknown. The r2 should be > 0.98 for each analyte. If one of the calibration standards other than the high or low point causes the curve to be <0.98 this point

CRL SOP #: MS014 Revision No: 0
Revision Date: January 30, 2008 Page 11 of 32
must be re-injected or a new calibration curve must be made. If the low or high point is excluded, a five point curve is acceptable but the calibration range and reporting limits must be modified to reflect this change.
9.2.4 If the polynomial type is quadratic, the point of origin is excluded and a fit
weighting of 1/X in order to give more weighting to the lower concentrations. The retention time window of the MRM transitions must be within 5% of the retention time of the analyte in the level 4 calibration standard. If this is not true the calibration curve needs to be re-analyzed to see if there was a shift in retention time during the analysis and the sample needs to be re-injected. If the retention time is still incorrect in the sample the analyte is referred to as an unknown. The coefficient of the determination, r2, should be > 0.99 for each analyte. If one of the calibration standards, other than the high or low, causes the curve to be <0.99 this point must be re-injected or a new calibration curve must be made. If the low or high point is excluded, a six point curve is acceptable using a quadratic fit. An initial 7 point curve over the calibration range is suggested in the event the low or high point must be excluded to obtain a coefficient of the determination > 0.99. In this event, the calibration range and reporting limits must be modified to reflect this change.
10. Waste Handling and Pollution Prevention
10.1 A green tag identifying the contents of the carboy is placed on the waste container. Remember to always attach the appropriate chemical waste label and date the beginning of collection before using the container.
10.2 Additional information on waste reduction is found in the laboratory safety facility
plan.
11. Calculations and Documentation
11.1 Computer programs used for analysis of data include Masslynx™ with Quanlynx™ software..
11.2 Clarification of where professional judgment is used in the data reduction and
verification process. CRL SOP GEN014 is followed for manual integration procedures.
11.3 All data packages are verified by a qualified analyst. The qualified analyst signs
off on the narrative and checklist. The data review is done using CRL SOP GEN010.
11.4 All QA/QC data and final results are reported to the customer.
11.5 Electronic data storage reference. All data is archived to
R5CRL/GCMS/Analysts Name/work order #.
CRL SOP #: MS014 Revision No: 0
Revision Date: January 30, 2008 Page 12 of 32
12. Routine Analysis
12.1 The concentration in the water sample is calculated using the 1/X weighted calibration curve determined by the equation that fits the calibration curve. The water sample results are reported in micrograms per liter (μg/L). These results are reported without any corrections for recovery data. All QC data obtained are included in the CRL data packages.
12.2 Analytical Sequence
12.2.1 Prepare a sequence that includes all QC samples and field samples. The first
sample to be analyzed is a 100 μL injection of a blank sample. 12.2.2 The calibration standards, Levels 6 through 1 are analyzed next. Verify that all
analytes have been properly identified and quantified. Using software programs, manually integrate as necessary. Print quantitation reports for the calibration standards.
12.2.3 Update the calibration file and print a calibration report. Review the report for
calibration outliers and make area corrections. If corrections have been made, update the calibration file and regenerate a calibration report. Alternatively, re-analyze "nonconforming" calibration level(s) and repeat the above procedures.
12.2.4 If the initial calibration data are acceptable samples are analyzed during the 24-
hour period ending with a midpoint calibration standard. This ending midpoint calibration standard must have each analyte concentration within 30% of the calculated true concentration or the affected analytes from that run must be qualified estimated or re-analyzed with passing criteria to remove the qualification . This insures that there is minimal instrument drift and/or MS interface interferences which can cause matrix enhancement or suppression.
12.2.5 The next samples to be analyzed should be in the following recommended
sequence: Lab Blank, LCS, diluted samples, samples and MS/MSD followed by a midpoint calibration standard to check instrument stability over the analysis period.
12.2.6 Archive all the raw data promptly to the R5CRL server. 12.2.7 Generate quantitation reports for all samples following data system specifications
and the Chromatographic Peak Interpretation SOP (QMP Appendix 2). Generate the final data. Copies of the original and final sequence listings should be included in the data packages as well as in the Instrument Sample Log binders. If manual integration was used, the Quanlynx Audit Report is accessible showing the details how, when and why the peak was changed. The entire quantitation method is saved and archived.
12.2.8 Review the quantitation reports for all samples making sure all surrogate and
target compounds have been properly quantitated. Check for integration errors.

CRL SOP #: MS014 Revision No: 0
Revision Date: January 30, 2008 Page 13 of 32
12.2.9 Review the quantitation reports for all samples. Delete any false positive method specific parameters results that are less than the method detection limits listed in Table 1.
12.2.10 Create sample header and miscellaneous information files for all samples in the
analytical sequence. 12.2.11 Generate the report forms using Quanlynx™ software. 12.2.12 Be sure the blank sample data have been properly reviewed. Then generate a QC
form listing field samples prepared with the associated lab blank sample. 12.2.13 Verify that all spike compounds were present on the MS and MSD and LCS
sample quantitation reports. Investigate any gross deviations in spike concentrations from expected values.
12.2.14 Generate analysis data sheets for blank, and field samples. Review the final
results and upload the applicable data (sample results, surrogate spike compound recovery data and matrix precision and accuracy data) into CRL RLIMS, when available.
12.2.15 On a daily basis archive all the processed data files to their designated archiving
location in the R5CRL server (see the CRL SOP # GEN002). 12.3 Data Package Assembly 12.3.1 Create a calibration deliverables package with the following: copies of sequence
files, initial and continuing calibration reports, and quantitation reports for calibration standards.
12.3.2 Create a QC deliverables package with applicable QC Forms. 12.3.3 Create a sample deliverables package with the following for each sample: sample
data sheet, sample quantitation report. Make sure all method specific parameter peaks are correctly labeled on the chromatogram.
12.4 Data Package Quality Control
12.4.1 Analysts are primarily responsible for performing data evaluation and verification tasks. See CRL SOP (GEN010) on data review, validation and qualification criteria. For data qualification purposes, apply the QC criteria specified in this SOP.
12.4.2 All data packages must be approved and signed by a qualified Analyst and a
secondary reviewer prior to release. 12.5 Data Reduction and LIMS Entry and Reporting (Automatic upload is still not available
for LC/MS analysis)

CRL SOP #: MS014 Revision No: 0
Revision Date: January 30, 2008 Page 14 of 32
12.5.1 All LIMS data entry is based on first creating a bench sheet describing the
sample preparation. This bench sheet describes the samples prepared, and the quality control samples. The analyst must make certain that the preparation date in LIMS matches the actual preparation date. By convention, if the sample preparation proceeds overnight, the date started is used for the LIMS preparation date.
12.5.2 When the data are ready to be entered, the bench sheet is called up into the Data
Entry/Review module. All analyses or selected analyses can be included. If only a few analyses are to be entered, data may be entered manually. Otherwise, it may be more practical to use Data Tool.
12.5.2.1 When performing manual data entry, enter the results in the column
Result. For each result, enter the date of analysis in the column Analyzed. This column has a calendar feature as do other date fields in LIMS. If dilutions were necessary for the analysis, enter the dilution in the column Dilution. The sample result should be the one measured and not corrected for the dilution factor. Verify that the correct initials are present in the Analyst field and the instrument field.
12.5.2.2 If all data are entered, click the Save button on the top row. After
saving, proceed to the Review page by clicking Query on the second row. Verify that all conversions to reporting units and dilutions have been calculated correctly. Verify that reporting limits have been correctly applied. Flags may be added at this stage, following the guidance given in the GC/MS Data Review SOPs. Before review by the secondary reviewer, the data may be locked, and the status should be updated to analyzed.
12.5.2.3 If Data Tool is to be used, once the batch is called up in Data
Entry/Review, click Export to create an Excel file in the User Directory. Name this file in such a manner that it can be easily associated with that analysis.
12.5.2.4 A file is created by the instrument (a .txt file from QuanlynxTM) with the
instrument readings for each sample. If multiple measurements for a given sample are present, such as for dilutions, the .txt file can be loaded into a text editor, such as Word Pad, and the sample IDs for the sample readings that are not to be used can be altered so that Data Tool does not recognize them. This altered file must be saved as a .txt file for Data Tool to use it. There is no need to remove the analytical spikes, because the software recognizes them as such.
12.5.2.5 Once in Data Tool, click Browse for the Element Data Entry Table, and
call up the .xls file created earlier. If unneeded sample entries remain in the lower left-hand box, click Clear. Double-click on the desired .txt file and either Auto Select or highlight individual samples and click Include.
12.5.2.6 Once the field samples and quality control samples are selected, click

CRL SOP #: MS014 Revision No: 0
Revision Date: January 30, 2008 Page 15 of 32
Done and it will return to the main Data Tool page. Click Merge Files. If either Unmatched Analytes or Unmatched Units appear in red, repair the cross table with the assistance, if necessary, of the MS Group Leader. Verify that the results in Initial Result are correct, and click Save, which will create an Excel file. Name this one differently from the name chosen previously and click Done.
12.5.2.7 Return to the Data Entry/Review module and click Open, using the .xls
file created in the paragraph above. Verify that all items are correct as in the manual data entry in 12.5.2.1 and click Save. Query the data and proceed as in 12.5.2.2.
12.6 LIMS Report Generation
12.6.1 Once all LC/MS data is entered with the status of Analyzed, prepare a draft
report. In LIMS, select Project Management, Reports. Choose the work order and the analyses, and select the report. For LC/MS analyses, the LIMS analyses are all multiple element analyses as of this writing. The report chosen will typically be C_Analysis.rpt or C_Sample.rpt. If QC is to be omitted from the report, choose Modified Draft, unchecking the quality control samples that were not analyzed. This draft report need not be signed. It is only for the purpose of review.
After the peer reviewer has updated the status of the LIMS entries to Reviewed,
the final report may be generated. The mode of generation of the report is the same as above, and either the Final Report or Modified Final Report is chosen. All pages of the report and the transmittal form must be signed and dated.
13. Quality Control
Refer to Region 5-Chicago Regional Laboratory SOP GEN010 for a detailed QA/QC protocol.
A-Initial demonstration, which include precision and accuracy (P&A) study and LOD: 13.1 An initial demonstration of the laboratory capability to generate data of acceptable
quality must be done. A precision and accuracy (P&A, as shown in Table 2 and Section 17 Attachment) study must be performed whenever a major modification is made to this method.
13.1.1 For a precision and accuracy (P&A) study, a check standard containing the
aldicarb, bromadiolone, carbofuran, oxamyl, methomyl and BDMC near or below the midpoint concentration in the calibration table must be analyzed, a minimum of 4 replicates. The check samples are then analyzed according to the method beginning in Sections 9 and 10.
13.1.2 The average percent recovery (X), and the standard deviation (σ) of the
recoveries is calculated for each analyte. Establish the QC confidence limits at 95.4% (2σ).

CRL SOP #: MS014 Revision No: 0
Revision Date: January 30, 2008 Page 16 of 32
13.2 Limit of Detection Limit Test: A mixed stock solution of the target analytes will be serially diluted to achieve standards of successively lower concentrations. These standards will be diluted to a concentration which is below the ORD-NHSRC risk criteria. If the risk criteria level is insufficient for detection, ORD-NHSRC will be consulted. The Limit of Detection (LOD) will be determined for each of these analytes. The LOD will be determined by the signal to noise ratio at a concentration ≤ one third of the lowest point of the calibration curve. An environmental water matrix will be used to conduct the initial signal to noise determination. Adequate signal to noise at this level should be greater than 3:1. Since the LOD is dependent upon matrix, instrument type and instrument maintenance, LOD will be provided in the procedure as guidance only. Data for LODs are shown in Table 1 and Section 17 Attachments.
B- On going QC:
13.3 LCS/LCSD Spikes As part of the Region 5 CRL QC program, spike accuracy for a clean matrix (in this case reagent water) is monitored and updated regularly. LCS/LCSD spikes should be prepared at a frequency of at least one pair for every 20 samples. Records are maintained of the reagent water target compound spike analyses and the average percent recovery (X) and the standard deviation of the percent recovery (σ) are calculated. This procedure maintains a 95.4% confidence interval from X±2σ to use as upper and lower control limits for evaluation of spiked target compound recovery.
13.4 Surrogates:
As part of the Region 5 CRL QC program, all samples are spiked with surrogate standard spiking solution as described in Section 7. An average percent recovery of the surrogate compound and the standard deviation of the percent recovery are calculated and updated regularly. This procedure maintains a 95.4% confidence interval from X±2σ control limits for surrogate compounds.
13.5 Reagent Blank:
A reagent blank is prepared each day, with analyte free water with a frequency of at least one for every 20 samples to investigate for system/laboratory contamination.
13.6 MS/MSD:
As part of the Region 5 CRL QC program, target compound spike accuracy in the sample matrix is monitored and updated regularly. Records are maintained of spiked matrix analyses, and the average percent recovery (X) and corresponding standard deviation (σ) are calculated. This procedure maintains a 95.4% confidence interval of X±2σ to use as upper and lower control limits for evaluation of spiked compound recovery in the sample matrix. When required, a matrix spike and matrix spike duplicate (MS/MSD - section 7.2) are prepared with a frequency of at least one MS/MSD pair for every 5 samples to investigate for matrix interferences. If the laboratory has not received MS/MSD samples for site specific precision and accuracy (P&A) data, the laboratory will evaluate the site data quality based on the Lab Control Sample (LCS - section 7.2) data. If there is enough sample in the site samples to conduct MS/MSD and duplicate analysis that will be used for site specific precision and accuracy (P&A) data.
CRL SOP #: MS014 Revision No: 0
Revision Date: January 30, 2008 Page 17 of 32
14. Troubleshooting Guide and Preventive Maintenance
There are many reasons an instrument or analysis may fail, a few are noted here and may be updated periodically.
14.1 Symptom: Inadequate Abundance or Sensitivity
Probable Causes: 14.1.1 Dirty or contaminated ion source, electron multiplier, or quadrupole rod surfaces. 14.1.2 Potentials of ion source elements at wrong values due to open or short circuits. 14.1.3 Faulty ion source electronics, detector electronics or power supply. 14.2 Symptom: Improper Isotope Ratios
Probable Causes: 14.2.1 High "background" levels of undesired substances (Contamination from earlier
sample injections) which contribute additional abundance at the isotope mass. Bake out the ion source assembly and condition the column.
14.2.2 Resolution of adjacent masses set improperly: higher than normal ratios due to
poor resolution (peaks too wide) or lower ratios due to over resolution (narrow peaks).
14.3 Symptom: Low Overall Sensitivity
Probable Causes: 14.3.1 Dirty or contaminated ion source, electron multiplier or quadrupole rod surfaces. 14.3.2 Electron multiplier with low gain. . 14.4 Symptom: Poor Reproducibility Probable Causes: 14.4.1 Loose or intermittent connection either to a printed circuit or to one or more ion
source or quadrupole elements inside the analyzer assembly. 14.5 Symptom: High Background Probable Causes:
CRL SOP #: MS014 Revision No: 0
Revision Date: January 30, 2008 Page 18 of 32
14.5.1 Dirty or contaminated ion source, electron multiplier or quadrupole rod surfaces. Bake out the source.
14.5.2 "Yesterday's" Samples - There is the possibility that some previously injected
sample can still be present in the vacuum system long after it was thought to be evacuated. This phenomenon depends on sample volatility, temperature, etc.
14.5.3 Contamination in a recently cleaned vacuum system - After any venting of a
vacuum system for maintenance, there is the potential for introducing new substances into the vacuum system. Some substances are normal and can be pumped out, while others require more cleaning or baking.
14.5.3.1 Solvents used in the cleaning process: These will be present for a while
but should be pumped out as heat is applied to the vacuum system. 14.5.3.2 Water absorbed on the metal surfaces while vented. This will pump
out with heat.
14.5.3.3 "Fingerprints" - Heavy organic substances from inadequate clean room procedures may not be pumped out and may require source cleaning.
14.6 Symptom: Mass Spectrometer Does Not Respond Probable Cause: 14.6.1 The mass spectrometer electronics are not on - Check the switch. 14.6.2 Secondary fuse blown - Check the secondary fuses on the rear of the mass
spectrometer and replace the faulty fuse or fuses. 14.6.3 Board failure
CRL SOP #: MS014 Revision No: 0
Revision Date: January 30, 2008 Page 19 of 32
15. References
Code of Federal Regulations, 40 CFR Part 136, Appendix B.
Sampling and Analysis Procedures for Screening of Industrial Effluents for Priority Pollutants: May 1977, Revised April 1977; U.S. Environmental Protection Agency. Environmental Monitoring Support Laboratory, Cincinnati, Ohio 45268. Available from Effluent Guidelines Division, Washington, DC 20160.
Standard Practices for Preparation of Sample Containers and for Preservation of Organic Constituents, American Society for Testing and Materials, Philadelphia. ASTM Annual Book of Standards, Part 31, D3694-78.
Carcinogens - Working with Carcinogens; U.S. Department of Health, Education and Welfare. Center for Disease Control. National Institute for Occupational Safety and Health, Publication No. 77-206, August 1977.
OSHA Safety and Health Standards, General Industry, (29 CFR 1910), Occupational Safety and Health Administration, OSHA 2206 (Revised, January 1976). Provist, L.P.; "Interpretation of Percent Recovery Data" American Laboratory 1983, 15, 58-63. (The value of 2.44 used in the equation in Section 8.3.3 is two times the value of 1.22 derived in this report).
Standard Practices for Sampling Water, American Society for Testing and Materials, Philadelphia. ASTM Annual Book Standards, Part 31, D3370-76.
Methods 330.4 (Titrimetric, DPD-FAS) and 330.5 (Spectrophotometric, DPR) for Chlorine, Total Residual, Methods for Chemical Analysis of Water and Wastes, U.S. Environmental Protection Agency, Environmental Monitoring and Support Laboratory, Cincinnati, Ohio 45268, March 1979. EPA-600/4-79-020
McNair, N.M.; Bonelli, E.J. Basic Chromatography;, Consolidated Printing: Berkeley, CA, 1969; p. 52.
Interlaboratory Method Study for EPA Method 625- Base/Neutrals, Acids and Pesticides, Final Report for EPA Contract 68-03-3102.

CRL SOP #: MS014 Revision No: 0
Revision Date: January 30, 2008 Page 20 of 32
16. Appendices
Tables and Validation Data Number Revision Date Item Title of Pages Number Revised Table 1 Method Parameters 1 0 08/2007 Table 2 Quality Control Acceptance Criteria 1 0 08/2007 Table 3 Concentration of Calibration Standards 1 0 08/2007 Table 4 Preparation of Calibration Standards 1 0 08/2007 Table 5 Retention Times, MRM ions, and 1 0 08/2007
Analyte-specific Mass Spectrometer Parameters Table 6 Gradient Conditions for 1 0 08/2007 Liquid Chromatography
CRL SOP #: MS014 Revision No: 0
Revision Date: January 30, 2008 Page 21 of 32
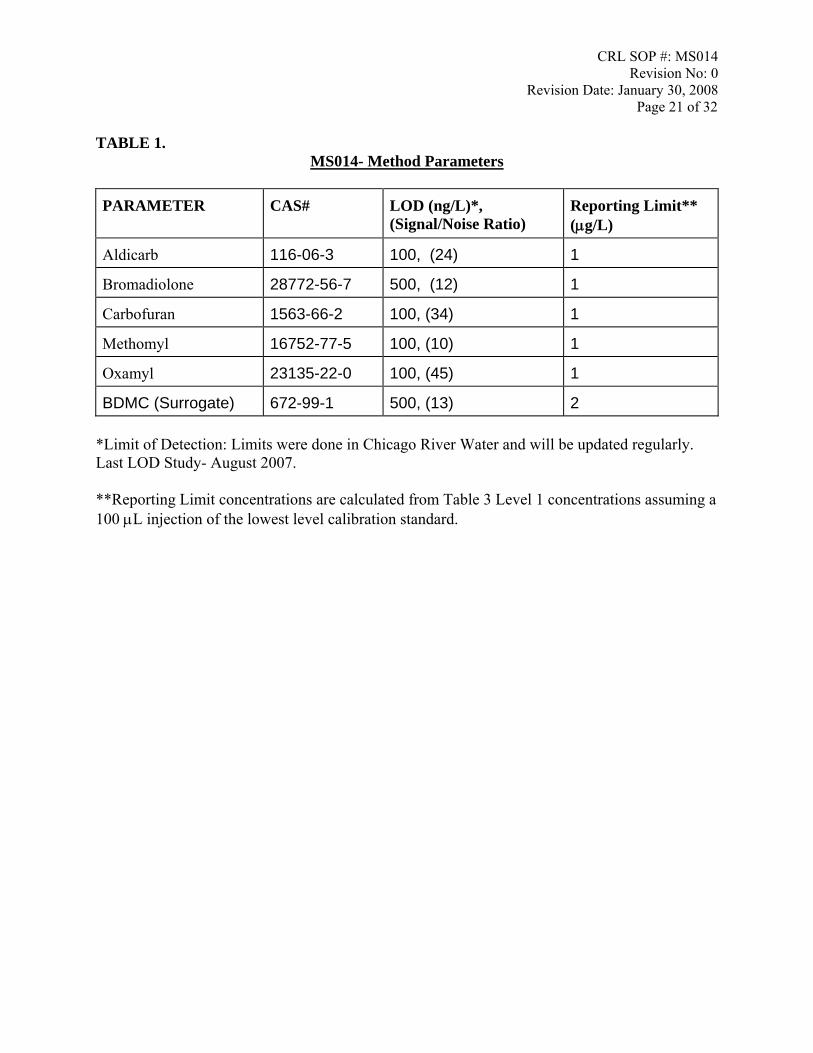
TABLE 1.
MS014- Method Parameters
PARAMETER CAS# LOD (ng/L)*, (Signal/Noise Ratio)
Reporting Limit** (μg/L)
Aldicarb 116-06-3 100, (24) 1
Bromadiolone 28772-56-7 500, (12) 1
Carbofuran 1563-66-2 100, (34) 1
Methomyl 16752-77-5 100, (10) 1
Oxamyl 23135-22-0 100, (45) 1
BDMC (Surrogate) 672-99-1 500, (13) 2
*Limit of Detection: Limits were done in Chicago River Water and will be updated regularly. Last LOD Study- August 2007. **Reporting Limit concentrations are calculated from Table 3 Level 1 concentrations assuming a 100 μL injection of the lowest level calibration standard.

CRL SOP #: MS014 Revision No: 0
Revision Date: January 30, 2008 Page 22 of 32
TABLE 2. Quality Control Acceptance Criteria
PARAMETER % Recovery*
LCS/LCSD Reagent Water
% Recovery* MS/MSD
Environmental Water Aldicarb 78-138 77-137
Bromadiolone 81-141 69-129
Carbofuran 74-134 72-132
Methomyl 71-131 38-98
Oxamyl 71-131 25-85
BDMC (Surrogate) 72-132 63-123 Currently, LCS spike recovery limits are used to assess site sample data quality. Matrix Spike, Matrix Spike Duplicate and Lab Control Sample spike recovery limits will be revised annually or upon collection of 20 QC data points, whichever is sooner. *The quality control acceptance criteria shall be updated regularly. Preliminary Acceptance Criteria are set at ±30% of the average recovery based on reagent and river water as shown in Section 17 Attachments.
LAST UPDATE August, 2007
TABLE 3.
Concentrations of Calibration Standards (μg/L).
CRL SOP #: MS014 Revision No: 0
Revision Date: January 30, 2008 Page 23 of 32
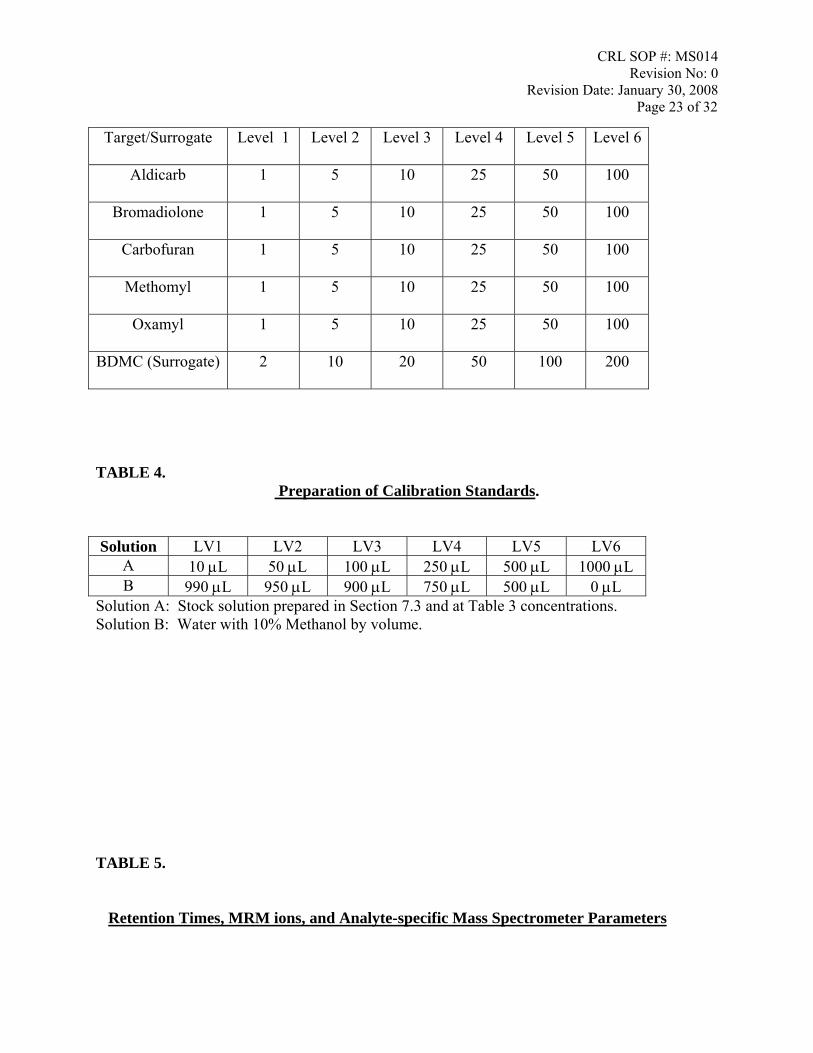
Target/Surrogate Level 1 Level 2 Level 3 Level 4 Level 5 Level 6
Aldicarb 1 5 10 25 50 100
Bromadiolone 1 5 10 25 50 100
Carbofuran 1 5 10 25 50 100
Methomyl 1 5 10 25 50 100
Oxamyl 1 5 10 25 50 100
BDMC (Surrogate) 2 10 20 50 100 200
TABLE 4.
Preparation of Calibration Standards.
Solution LV1 LV2 LV3 LV4 LV5 LV6 A 10 μL 50 μL 100 μL 250 μL 500 μL 1000 μL B 990 μL 950 μL 900 μL 750 μL 500 μL 0 μL
Solution A: Stock solution prepared in Section 7.3 and at Table 3 concentrations. Solution B: Water with 10% Methanol by volume. TABLE 5.
Retention Times, MRM ions, and Analyte-specific Mass Spectrometer Parameters

CRL SOP #: MS014 Revision No: 0
Revision Date: January 30, 2008 Page 24 of 32
Analyte Retention time (min)
Electropray Ionazation
Cone Voltage
Primary SRM Mass transition
(Parent > product)
Primary SRM
collision energy (eV)
Confirmatory SRM Mass transition
(Parent > product)
Confirmatory SRM
collision energy (eV)
Aldicarb 10.2 10 208.2 > 115.9 7 208.2>88.7 15 Bromadiolone 13.1 37 509 > 251.2 20 511>251.2 20 Carbofuran 12.1 27 222.2 > 165.2 12 222.2>123 20 Methomyl 7.8 17 163.1 > 87.7 8 163.1>105.8 8 Oxamyl 7.6 15 237.2 > 71.6 8 237.2>89.8 8 BDMC (surrogate) 14.2 25 258.1 > 122 24 258.1>201.2 9
TABLE 6.
Gradient Conditions for Liquid Chromatography.
Time
(minutes)
Flow
(μL/minute)
Percent
Acetonitrile
Percent
95 %Water/5% CH3CN
Percent 50 mmolar
NH4OAc/NH4OH 95 %Water/5% CH3CN
0 300 0 95 5 2 300 0 95 5 4 300 30 65 5 6 300 35 60 5 8 300 35 60 5
10 300 75 20 5 11.5 300 75 20 5 12 300 95 0 5 18 300 95 0 5 20 300 0 95 5 23 300 0 95 5
*Column Temperature at 30°C, Sample compartment at 15°C. Equilibration time- 2 minutes.
TABLE 7.
Uncertainty Determination
To Be Determined 17. Attachments

CRL SOP #: MS014 Revision No: 0
Revision Date: January 30, 2008 Page 25 of 32
17.1 Limit of Detection Study
17.2 Precision and Accuracy 17.3 Representative Calibration Curves
CRL SOP #: MS014 Revision No: 0
Revision Date: January 30, 2008 Page 26 of 32
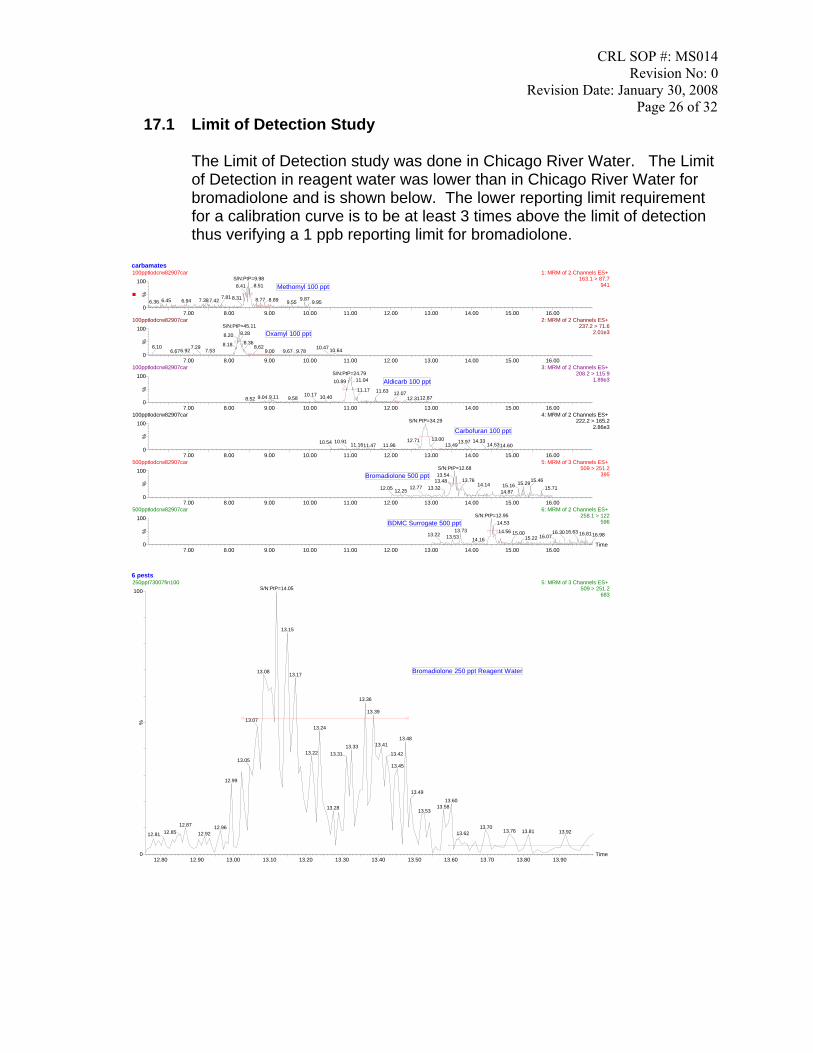
17.1 Limit of Detection Study
The Limit of Detection study was done in Chicago River Water. The Limit of Detection in reagent water was lower than in Chicago River Water for bromadiolone and is shown below. The lower reporting limit requirement for a calibration curve is to be at least 3 times above the limit of detection thus verifying a 1 ppb reporting limit for bromadiolone.
carbamates
Time7.00 8.00 9.00 10.00 11.00 12.00 13.00 14.00 15.00 16.00
%
0
100
7.00 8.00 9.00 10.00 11.00 12.00 13.00 14.00 15.00 16.00
%
0
100
7.00 8.00 9.00 10.00 11.00 12.00 13.00 14.00 15.00 16.00
%
0
100
7.00 8.00 9.00 10.00 11.00 12.00 13.00 14.00 15.00 16.00
%
0
100
7.00 8.00 9.00 10.00 11.00 12.00 13.00 14.00 15.00 16.00
%
0
100
7.00 8.00 9.00 10.00 11.00 12.00 13.00 14.00 15.00 16.00
%
0
100100pptlodcrw82907car 1: MRM of 2 Channels ES+
163.1 > 87.7941
S/N:PtP=9.988.41
7.386.456.36 6.94 7.42 7.81 8.31
8.51
9.878.77 8.89 9.55 9.95
100pptlodcrw82907car 2: MRM of 2 Channels ES+ 237.2 > 71.6
2.01e3S/N:PtP=45.11
8.20
8.186.92
6.106.67 7.53
7.29
8.28
8.3610.64
8.629.789.679.00
10.47
100pptlodcrw82907car 3: MRM of 2 Channels ES+ 208.2 > 115.9
1.89e3S/N:PtP=24.7910.89
9.119.048.52 10.409.5810.17
11.04
11.17 11.63 12.0712.8712.31
100pptlodcrw82907car 4: MRM of 2 Channels ES+ 222.2 > 165.2
2.86e3S/N:PtP=34.29
12.7111.1610.9110.54 11.9611.47
13.0014.53
14.3313.49
13.9714.60
500pptlodcrw82907car 5: MRM of 3 Channels ES+ 509 > 251.2
395S/N:PtP=12.6813.54
13.4813.3212.2512.05 12.77
15.2913.7615.1614.14
14.87
15.4615.71
500pptlodcrw82907car 6: MRM of 2 Channels ES+ 258.1 > 122
596S/N:PtP=12.95
13.7313.5313.22
14.16
14.53
14.56 16.8116.6316.3016.07
15.0015.22 16.98
Methomyl 100 ppt
Oxamyl 100 ppt
Aldicarb 100 ppt
Carbofuran 100 ppt
Bromadiolone 500 ppt
BDMC Surrogate 500 ppt
6 pests
Time12.80 12.90 13.00 13.10 13.20 13.30 13.40 13.50 13.60 13.70 13.80 13.90
%
0
100250ppt73007fin100 5: MRM of 3 Channels ES+
509 > 251.2683
S/N:PtP=14.05
13.08
13.07
13.05
12.99
12.8712.8512.81
12.9612.92
13.15
13.17
13.36
13.24
13.2213.33
13.31
13.28
13.39
13.4813.41
13.42
13.45
13.4913.60
13.5813.53
13.7013.62 13.76 13.81 13.92
Bromadiolone 250 ppt Reagent Water
CRL SOP #: MS014 Revision No: 0
Revision Date: January 30, 2008 Page 27 of 32
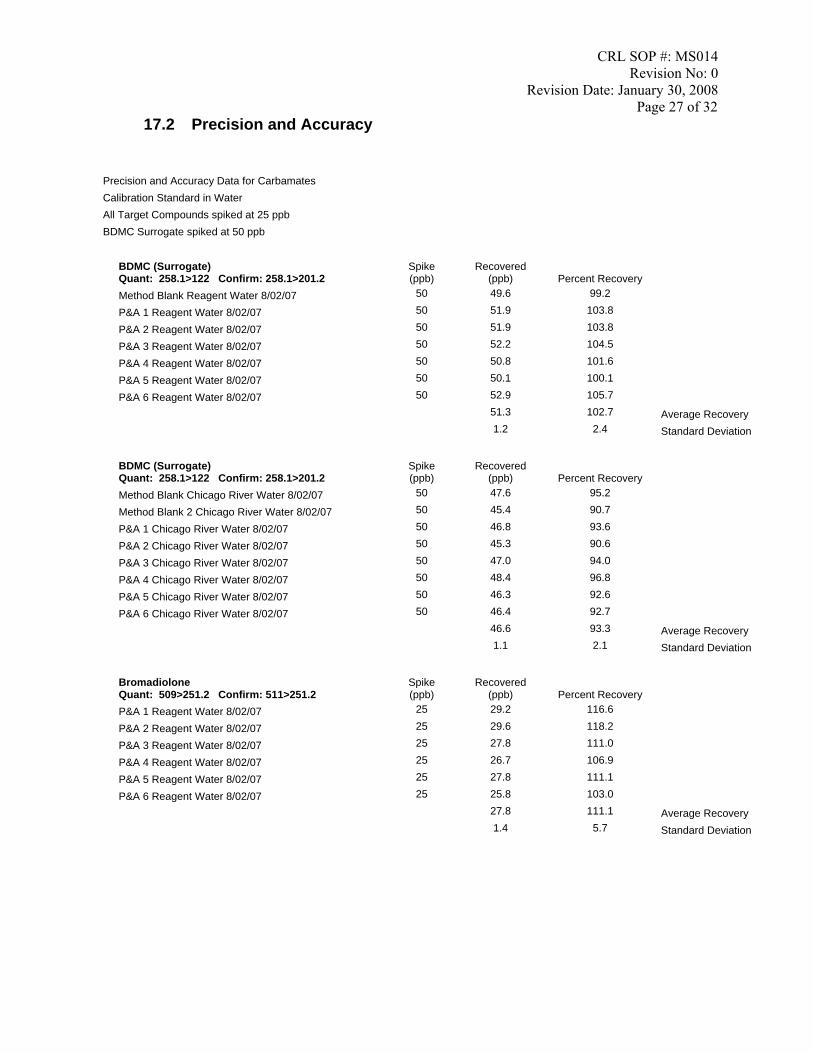
17.2 Precision and Accuracy
Precision and Accuracy Data for Carbamates Calibration Standard in Water All Target Compounds spiked at 25 ppb BDMC Surrogate spiked at 50 ppb
BDMC (Surrogate) Quant: 258.1>122 Confirm: 258.1>201.2
Spike (ppb)
Recovered (ppb) Percent Recovery
Method Blank Reagent Water 8/02/07 50 49.6 99.2 P&A 1 Reagent Water 8/02/07 50 51.9 103.8 P&A 2 Reagent Water 8/02/07 50 51.9 103.8 P&A 3 Reagent Water 8/02/07 50 52.2 104.5 P&A 4 Reagent Water 8/02/07 50 50.8 101.6 P&A 5 Reagent Water 8/02/07 50 50.1 100.1 P&A 6 Reagent Water 8/02/07 50 52.9 105.7 51.3 102.7 Average Recovery 1.2 2.4 Standard Deviation
BDMC (Surrogate) Quant: 258.1>122 Confirm: 258.1>201.2
Spike (ppb)
Recovered (ppb) Percent Recovery
Method Blank Chicago River Water 8/02/07 50 47.6 95.2 Method Blank 2 Chicago River Water 8/02/07 50 45.4 90.7 P&A 1 Chicago River Water 8/02/07 50 46.8 93.6 P&A 2 Chicago River Water 8/02/07 50 45.3 90.6 P&A 3 Chicago River Water 8/02/07 50 47.0 94.0 P&A 4 Chicago River Water 8/02/07 50 48.4 96.8 P&A 5 Chicago River Water 8/02/07 50 46.3 92.6 P&A 6 Chicago River Water 8/02/07 50 46.4 92.7 46.6 93.3 Average Recovery 1.1 2.1 Standard Deviation
Bromadiolone Quant: 509>251.2 Confirm: 511>251.2
Spike (ppb)
Recovered (ppb) Percent Recovery
P&A 1 Reagent Water 8/02/07 25 29.2 116.6 P&A 2 Reagent Water 8/02/07 25 29.6 118.2 P&A 3 Reagent Water 8/02/07 25 27.8 111.0 P&A 4 Reagent Water 8/02/07 25 26.7 106.9 P&A 5 Reagent Water 8/02/07 25 27.8 111.1 P&A 6 Reagent Water 8/02/07 25 25.8 103.0 27.8 111.1 Average Recovery 1.4 5.7 Standard Deviation

CRL SOP #: MS014 Revision No: 0
Revision Date: January 30, 2008 Page 28 of 32
Bromadiolone Quant: 509>251.2 Confirm: 511>251.2
Spike (ppb)
Recovered (ppb) Percent Recovery
P&A 1 Chicago River Water 8/02/07 25 23.8 95.4 P&A 2 Chicago River Water 8/02/07 25 25.3 101.1 P&A 3 Chicago River Water 8/02/07 25 23.9 95.6 P&A 4 Chicago River Water 8/02/07 25 24.8 99.0 P&A 5 Chicago River Water 8/02/07 25 25.4 101.6 P&A 6 Chicago River Water 8/02/07 25 25.4 101.6 24.8 99.0 Average Recovery 0.7 2.9 Standard Deviation
Carbofuran Quant: 222.2>165.2 Confirm: 222.2>123
Spike (ppb)
Recovered (ppb) Percent Recovery
P&A 1 Reagent Water 8/02/07 25 24.9 99.7 P&A 2 Reagent Water 8/02/07 25 26.2 104.7 P&A 3 Reagent Water 8/02/07 25 26.3 105.3 P&A 4 Reagent Water 8/02/07 25 26.6 106.5 P&A 5 Reagent Water 8/02/07 25 26.7 106.9 P&A 6 Reagent Water 8/02/07 25 26.2 104.9 26.2 104.6 Average Recovery 0.6 2.6 Standard Deviation
Carbofuran Quant: 222.2>165.2 Confirm: 222.2>123
Spike (ppb)
Recovered (ppb) Percent Recovery
P&A 1 Chicago River Water 8/02/07 25 25.9 103.8 P&A 2 Chicago River Water 8/02/07 25 25.7 102.8 P&A 3 Chicago River Water 8/02/07 25 25.8 103.2 P&A 4 Chicago River Water 8/02/07 25 25.8 103.2 P&A 5 Chicago River Water 8/02/07 25 24.8 99.2 P&A 6 Chicago River Water 8/02/07 25 25.6 102.2 25.6 102.4 Average Recovery 0.4 1.6 Standard Deviation
Aldicarb Quant: 208.2>115.9 Confirm: 208.2>88.7
Spike (ppb)
Recovered (ppb) Percent Recovery
P&A 1 Reagent Water 8/02/07 25 26.6 106.6 P&A 2 Reagent Water 8/02/07 25 26.8 107.0 P&A 3 Reagent Water 8/02/07 25 27.7 110.9 P&A 4 Reagent Water 8/02/07 25 27.7 110.6 P&A 5 Reagent Water 8/02/07 25 26.7 106.7 P&A 6 Reagent Water 8/02/07 25 27.1 108.4 27.1 108.4 Average Recovery 0.5 2.0 Standard Deviation

CRL SOP #: MS014 Revision No: 0
Revision Date: January 30, 2008 Page 29 of 32
Aldicarb Quant: 208.2>115.9 Confirm: 208.2>88.7
Spike (ppb)
Recovered (ppb) Percent Recovery
P&A 1 Chicago River Water 8/02/07 25 26.9 107.4 P&A 2 Chicago River Water 8/02/07 25 27.0 107.8 P&A 3 Chicago River Water 8/02/07 25 27.0 108.2 P&A 4 Chicago River Water 8/02/07 25 26.7 106.6 P&A 5 Chicago River Water 8/02/07 25 27.0 108.2 P&A 6 Chicago River Water 8/02/07 25 26.0 104.1 26.8 107.0 Average Recovery 0.4 1.6 Standard Deviation
Oxamyl Quant: 237.2>71.6 Confirm: 237.2>89.8
Spike (ppb)
Recovered (ppb) Percent Recovery
P&A 1 Reagent Water 8/02/07 25 25.5 102.1 P&A 2 Reagent Water 8/02/07 25 25.5 101.8 P&A 3 Reagent Water 8/02/07 25 24.6 98.3 P&A 4 Reagent Water 8/02/07 25 25.5 102.1 P&A 5 Reagent Water 8/02/07 25 25.2 100.7 P&A 6 Reagent Water 8/02/07 25 25.4 101.7 25.3 101.1 Average Recovery 0.4 1.5 Standard Deviation
Oxamyl Quant: 237.2>71.6 Confirm: 237.2>89.8
Spike (ppb)
Recovered (ppb) Percent Recovery
P&A 1 Chicago River Water 8/02/07 25 14.6 58.6 P&A 2 Chicago River Water 8/02/07 25 13.3 53.2 P&A 3 Chicago River Water 8/02/07 25 14.0 56.0 P&A 4 Chicago River Water 8/02/07 25 14.3 57.3 P&A 5 Chicago River Water 8/02/07 25 13.2 52.7 P&A 6 Chicago River Water 8/02/07 25 13.6 54.4 13.8 55.4 Average Recovery 0.6 2.3 Standard Deviation
Methomyl Quant: 163.1>87.7 Confirm: 163.1>105.8
Spike (ppb)
Recovered (ppb) Percent Recovery
P&A 1 Reagent Water 8/02/07 25 24.7 98.7 P&A 2 Reagent Water 8/02/07 25 24.8 99.2 P&A 3 Reagent Water 8/02/07 25 24.4 97.6 P&A 4 Reagent Water 8/02/07 25 25.3 101.1 P&A 5 Reagent Water 8/02/07 25 24.3 97.2 P&A 6 Reagent Water 8/02/07 25 25.4 101.4 24.8 99.2 Average Recovery 0.4 1.7 Standard Deviation
CRL SOP #: MS014 Revision No: 0
Revision Date: January 30, 2008 Page 30 of 32
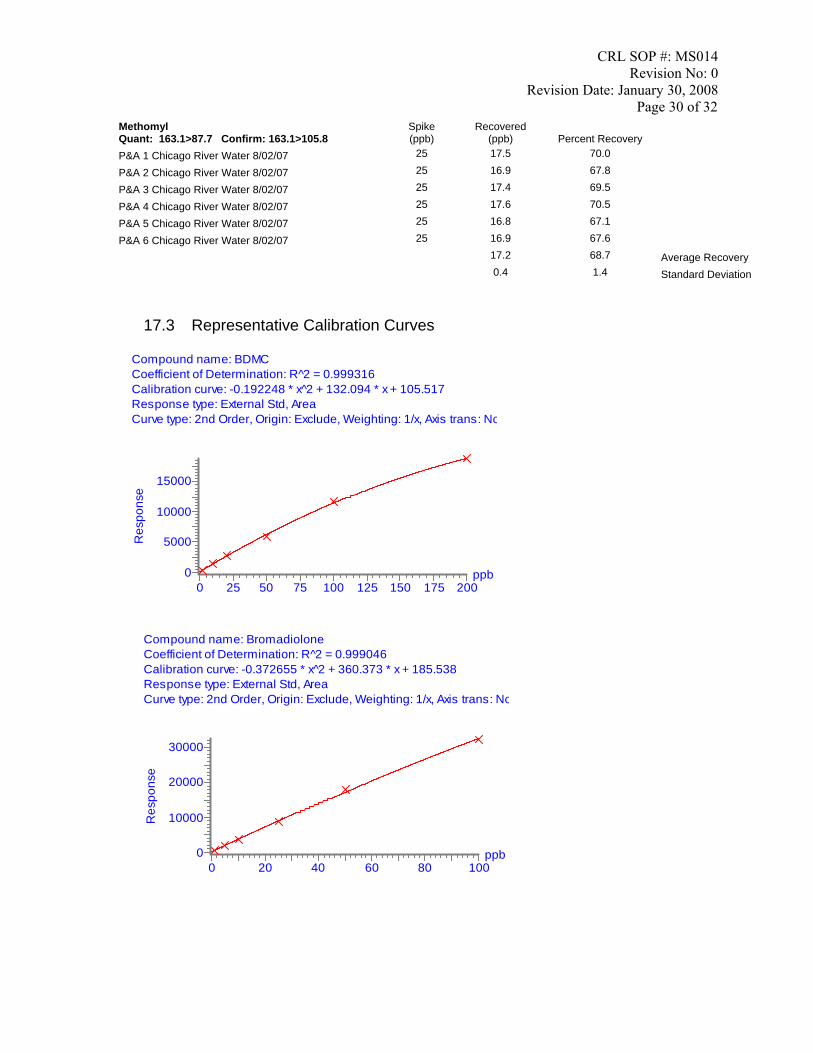
Methomyl Quant: 163.1>87.7 Confirm: 163.1>105.8
Spike (ppb)
Recovered (ppb) Percent Recovery
P&A 1 Chicago River Water 8/02/07 25 17.5 70.0 P&A 2 Chicago River Water 8/02/07 25 16.9 67.8 P&A 3 Chicago River Water 8/02/07 25 17.4 69.5 P&A 4 Chicago River Water 8/02/07 25 17.6 70.5 P&A 5 Chicago River Water 8/02/07 25 16.8 67.1 P&A 6 Chicago River Water 8/02/07 25 16.9 67.6 17.2 68.7 Average Recovery 0.4 1.4 Standard Deviation
17.3 Representative Calibration Curves
Compound name: BromadioloneCoefficient of Determination: R^2 = 0.999046 Calibration curve: -0.372655 * x̂ 2 + 360.373 * x + 185.538Response type: External Std, AreaCurve type: 2nd Order, Origin: Exclude, Weighting: 1/x, Axis trans: No
ppb0 20 40 60 80 100
Res
pons
e
0
10000
20000
30000
Compound name: BDMCCoefficient of Determination: R^2 = 0.999316 Calibration curve: -0.192248 * x̂ 2 + 132.094 * x + 105.517Response type: External Std, AreaCurve type: 2nd Order, Origin: Exclude, Weighting: 1/x, Axis trans: No
ppb0 25 50 75 100 125 150 175 200
Res
pons
e
0
5000
10000
15000

CRL SOP #: MS014 Revision No: 0
Revision Date: January 30, 2008 Page 31 of 32
Compound name: OxamylCoefficient of Determination: R^2 = 0.999622 Calibration curve: -9.41396 * x̂ 2 + 3089.51 * x + -298.355Response type: External Std, AreaCurve type: 2nd Order, Origin: Exclude, Weighting: 1/x, Axis trans: No
ppb0 20 40 60 80 100
Res
pons
e
0
100000
200000
Compound name: AldicarbCoefficient of Determination: R^2 = 0.999987 Calibration curve: -7.86686 * x̂ 2 + 3275.84 * x + -210.138Response type: External Std, AreaCurve type: 2nd Order, Origin: Exclude, Weighting: 1/x, Axis trans: No
ppb0 20 40 60 80 100
Res
pons
e
0
100000
200000
Compound name: CarbofuranCoefficient of Determination: R^2 = 0.999961 Calibration curve: -15.4309 * x̂ 2 + 7149.9 * x + 69.2164Response type: External Std, AreaCurve type: 2nd Order, Origin: Exclude, Weighting: 1/x, Axis trans: No
ppb0 20 40 60 80 100
Res
pons
e
0
200000
400000

CRL SOP #: MS014 Revision No: 0
Revision Date: January 30, 2008 Page 32 of 32
Compound name: MethomylCoefficient of Determination: R^2 = 0.999539 Calibration curve: -6.17431 * x̂ 2 + 1934.84 * x + -181.738Response type: External Std, AreaCurve type: 2nd Order, Origin: Exclude, Weighting: 1/x, Axis trans: No
ppb0 20 40 60 80 100
Res
pons
e
0
50000
100000


