32
Croatia in Global Value Chains Ivana Vidaković Peruško, Katarina Kovač, Miroslav Jošić Zagreb, February 2018 Surveys S-32

Croatia in Global Value Chains
Ivana Vidaković Peruško, Katarina Kovač, Miroslav Jošić
Zagreb, February 2018
Surveys S-32


SURVEYS S-32

PUBLISHERCroatian National Bank Publishing Department Trg hrvatskih velikana 3, 10000 Zagreb Phone: +385 1 45 64 555 Contact phone: +385 1 45 65 006 Fax: +385 1 45 64 687
WEBSITEwww.hnb.hr
EDITOR-IN-CHIEFLjubinko Jankov
EDITORIAL BOARDVedran Šošić Gordi Sušić Davor Kunovac Tomislav Ridzak Evan Kraft Maroje Lang Ante Žigman
EDITORRomana Sinković
DESIGNERVjekoslav Gjergja
TECHNICAL EDITORSlavko Križnjak
The views expressed in this paper are not necessarily the views of the Croatian National Bank.Those using data from this publication are requested to cite the source.Any additional corrections that might be required will be made in the website version.
ISSN 1334-0131 (online)

Zagreb, February 2018
SURVEYS S-32
Croatia in Global Value Chains
Ivana Vidaković Peruško, Katarina Kovač, Miroslav Jošić

ABSTRACT V
Croatia in Global Value Chains
Abstract
Global value chains have become a powerful source of in-creased efficiency and firm competitiveness. This paper ex-plores Croatian participation in GVCs. Our results suggest that Croatia’s integration in GVCs did not essentially change from 2000 until 2014. Involvement in GVCs did not change in peer countries either, but they significantly increased their back-ward and decreased forward participation, while the structure of integration in Croatia stayed almost the same. In addition, the analysis of the structure of value added in exports in manu-facturing sector shows that the share of domestic value added in gross exports in 2014 was high in the production of food, beverages and tobacco industry, pharmaceutical products, and computers and electronics. Moreover, the pharmaceutical in-dustry is the only industry that significantly increased the share of domestic value added in exports from 2000 to 2014. Finally, our results indicate that Croatia is strongly integrated in GVC trade only with a few countries, with Germany being its most important GVC partner.
Keywords: global value chains, Croatia, GVC participation index, VAX
matrix
JEL: F14, F60, P52
Abstract v
1 Introduction to global value chains 1
2 Traditional trade statistics measures: what are the limitations? 1
3 Data description and sources 2
4 Trade statistics overview 24.1 What does Croatia export and where? 24.2 What does Croatia import? 34.3 Stylized facts from intermediate products trade 6
5 Croatia’s participation in GVCs 75.1 International comparison 75.2 Decomposition of value added in exports 85.3 Final destinations for Croatia’s goods and services 11
6 Conclusion 11
References 13
Appendices 14Appendix A: Estimating trade in value added 14Appendix B: Additional figures 15Appendix C: Additional tables 16
Contents
1 INTRODUCTION TO GLOBAL VALUE CHAINS
Croatia in Global Value Chains
1
1 Introduction to global value chains
International trade flows are one of key factors for a coun-try’s economic growth. Conventional trade statistics are used to analyze exports and imports between countries. However, one of the crucial shortcomings of such data is their inability to show the real value created by trade, or which industries cre-ate most of the value. The real value added is a difference be-tween the value of output (gross exports) and the value of im-ports (usually intermediate products). Understanding the role of an economy in global value chains improves policymaking, in particular in the areas related to competitiveness, economic growth and employment. Similarly, not knowing the difference between the gross exports and the gross value of exports can lead to misguided policy decisions.
Global value chains emphasize how export competitiveness relies on the sourcing of efficient inputs and access to final producers and consumers abroad (De Backer et al., 2013). As companies seek to improve their operations by establishing dif-ferent steps of production across different locations, cross-bor-der transactions in intermediate goods and services have come to prevail in international trade, leading to growth of trade in intermediates that is faster than in final products. Such inter-national fragmentation of production is a powerful source of increased efficiency and firm competitiveness, as production is undertaken wherever the essential materials and compe tences are available at competitive cost and quality. The ability to identify trade in intermediate products can provide important insights into how countries integrate into GVCs (Ahmad et al, 2017).
Countries can be involved in GVCs in different ways. Those that produce at the beginning of the production chain (up-stream) import fewer intermediate goods and services, but ex-port more of them than countries that are located at the end of the chain (downstream). Thus, countries can participate in GVCs by using foreign inputs in exports (backward partici-pation), or can be suppliers of intermediate goods and servi-ces that are further used in other countries’ exports (forward participation).
New data enable analyzing the value added created in ex-ports on the industry level, which is of high importance be-cause not all industries are positioned the same way along the supply chains. Some industries, such as petroleum production, do not contain as many imported inputs as, for example, mo-tor vehicles, but are involved in GVCs through value added in-corporated in goods that are exported (UNCTAD, GVC: In-vestment and Development, World Investment Report, 2013). The higher the share of the foreign value added component, the less important is the industry for economic growth. A high share of foreign value added undermines the ability of total de-mand and exports to generate GDP. However, the use of for-eign inputs can improve competitiveness and thereby increase the domestic value added, which can significantly contribute to economic growth (Ali-Yrkko et al., 2016).
The purpose of this paper is to analyze Croatian participa-tion in GVCs, and the extent to which it differs from that in its main trading partners and peers. Furthermore, we show which industries generate the most value in exports and, finally, what countries are Croatia’s main GVC partners. In this respect, the GVC data for Croatia can be considered as a valuable comple-mentary tool to traditional trade statistics.
To the best of our knowledge, this is the first paper that studies Croatian integration in GVCs, and is based on the most recent data by World Input-Output Database that includes Croatia.
The paper is structured as follows. Section 2 provides an explanation on the limitations of traditional trade statis-tics measures. Section 3 offers a brief description of the da-ta used in the paper. Section 4 discusses the destinations of Croatian exports of final and intermediate goods and services, and which countries are the main sources of goods and ser-vices in Croatia. In addition, it offers some stylized facts from analysis of intermediate products trade. Section 5 summarizes main findings on Croatia’s participation in GVCs. Section 6 concludes.
2 Traditional trade statistics measures: what are the limitations?
Global value chains challenge the way trade and output sta-tistics are collected (De Backer et al., 2013). The traditional approach of documenting cross-border transactions, such as data on imports and exports, does not provide suffcient infor-mation about involvement in globalized production. Higher exports no longer guarantee higher output or adequate pro-duction-associated benefits, such as employment creation and industrialization (Banga, 2013). The products purchased by consumers are made of inputs originating from separate loca-tions around the world. However, neither goods nor services are appropriately captured within traditional trade statistics be-cause the value of intermediate inputs traded along the value chain is recorded several times. Furthermore, the trade data cannot reveal from which industry the value was added or from
which industries they were imported.There are many issues that arise because of the fact that
trade data are supplied in gross value terms. Specifically, the domestic as opposed to the foreign value added of traded products is effectively being overlooked. According to the tra-ditional trade statistics, a country producing a crucial element of a foreign-assembled good is not recognized as highly inte-grated into the global market. In contrast, an assembling econ-omy is considered as internationally highly-integrated, solely by virtue of importing inputs and exporting final products. Such reasoning neglects the value added of the input-produc-ing country being inherent in the value of the final product, ir-respective of the final export location.
The role of the economy, and in particular of the industrial

3 DATA DESCRIPTION AND SOURCES
Ivana Vidaković Peruško, Katarina Kovač, Miroslav Jošić
2
sector that plays a key role in the global production process, is not properly accounted for by traditional trade statistics. The key diffculty is that the conventional approach to analysis of trade does not track the sequence of value added generation – from product invention to the final consumption.
For the above reasons, there is increasing recognition that analysis based on gross trade statistics can result in inaccurate
assessments of international trade. In order to assess the actual contribution of trade to economic growth, one should identify the actual value traded using international input-output tables, which combine national accounts and bilateral trade statistics linking production processes within and across countries and industries, avoiding the double-counting problem that affects conventional trade statistics (Ahmad et al., 2017).
3 Data description and sources
While the term “value chain” stands for the complete set of activities, such as design, production, marketing, distribution and support to the final consumer, the term “global” empha-sizes interconnectedness among countries (De Backer & Mir-oudot, 2014). While the notion of GVC is not new, quantita-tive evaluation became feasible only recently as a result of an improvement of inter-country input-output tables by, among others, the Organisation for Economic Co-operation and De-velopment’s (OECD) Trade in Value Added (TIVA) and World Input-Output Database (WIOD). The importance of GVC is further noticeable from the effort and resources dedicated to computing GVC participation indices by leading organizations like the OECD, International Monetary Fund (IMF), Bank of International Settlements (BIS), along with various central banks around the world.
For the purpose of trade statistics and Croatia’s participa-tion in GVC analysis, this paper employs data from WIOD as in Timmer, Los, Stehrer, & de Vries (2016). The database provides annual time series of national input-output tables, in-terconnected by bilateral international trade flows. Apart from domestic flows captured by national input-output tables, world
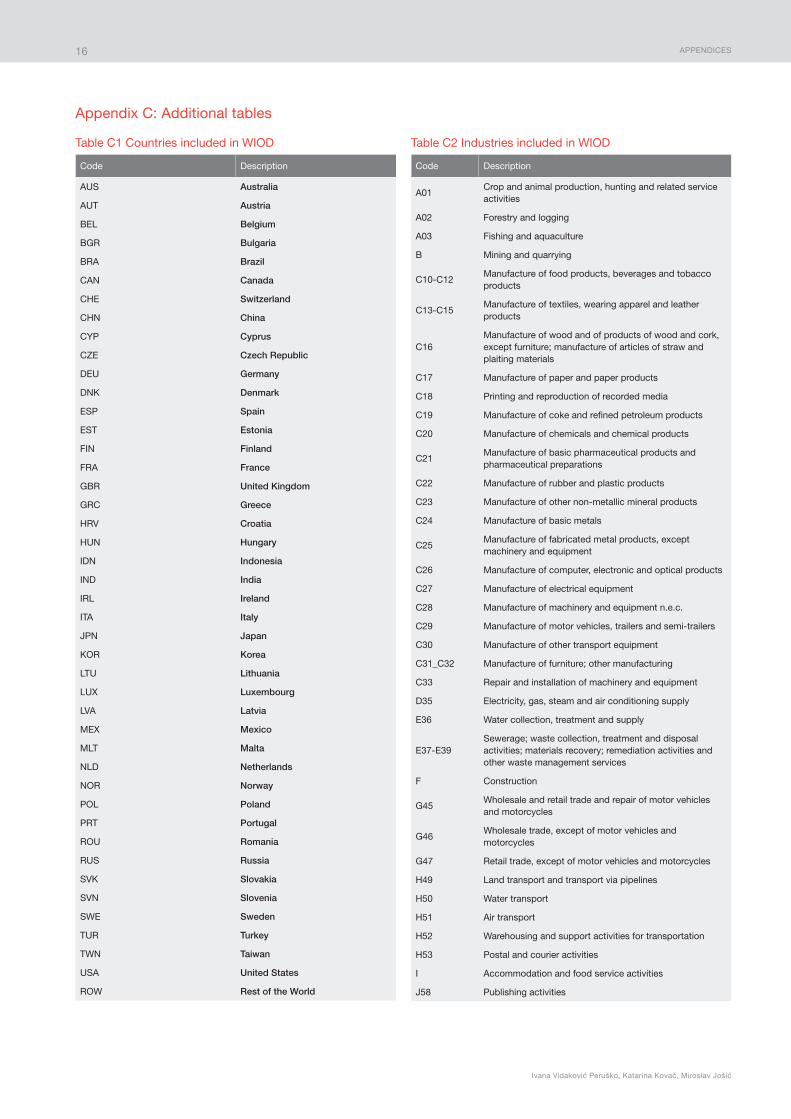
input-output tables provide necessary inputs for the analysis of both domestic and international product rows, keeping track of the initial point in global chain. The key assumption used in integrating national input-output tables into the global input-output network is that each product is produced either by a domestic industry or by a foreign industry. The data cover the period from 2000 through 2014. WIOD covers a total of 44 countries (28 EU countries, 15 world major economies and a residual representing “Rest of the World”) and 56 industries (product groups) based on the 2-digit International Standard Industrial Classification (ISIC) (for all industries and coun-tries covered see Appendix C,). The value of trade comprises trade in both goods and services, measured in current prices. Together, the countries involved account for more than 85% of the world GDP (Timmer et al., 2016).
An issue with assessing Croatian value added trade is that WIOD does not include Bosnia and Herzegovina, Serbia and Montenegro, which are countries that belong to the group of Croatia’s major trading partners. These countries are included as a part of the “Rest of the world” component.
Source: Authors’ calculations, based on WIOD (2016 vintage database).
Figure 1 Croatian main export markets in 2014, by product typeas % of total exports
6%
5%
4%
4%
2%
4%
3%
2%
2%
1%
0 2 4 6 8 10 12%
Italy
Germany
Slovenia
Austria
Hungary
Intermediate products Final products
4 Trade statistics overview
Moving different stages of production to different coun-tries has become profitable, so the importance of intermediate goods and services in global trade has increased. This section gives an overview of Croatian trade with an emphasis on the movement of intermediate and final goods and services across Croatia’s major trading partners. Furthermore, since inter-mediate goods and services dominate international trade, the section examines the positions of different countries in the in-termediates’ trade. We conclude the section by discussing how the share of intermediate goods and services has changed be-tween two points in time, 2000 and 2014.
4.1 What does Croatia export and where?
Croatia exports most of its products, both final and inter-mediate goods and services to Italy, Germany, Slovenia, Aus-tria and Hungary, accounting for one third of total exports (Figure 1). Intermediates account for 63% of total exports on average.

4 TRADE STATISTICS OVERVIEW
Croatia in Global Value Chains
3
The share of intermediates in total Croatian exports (63%) is slightly lower than the world average (65%) (Figure 2). However, Croatian trade partners have higher shares, with Austria being the only exception. Among Croatia’s major trad-ing partners included in the WIOD, Italy has the lowest share of intermediates in total exports (that is, highest share of final goods). Croatia has the highest share of intermediates in total exports among peer countries.2
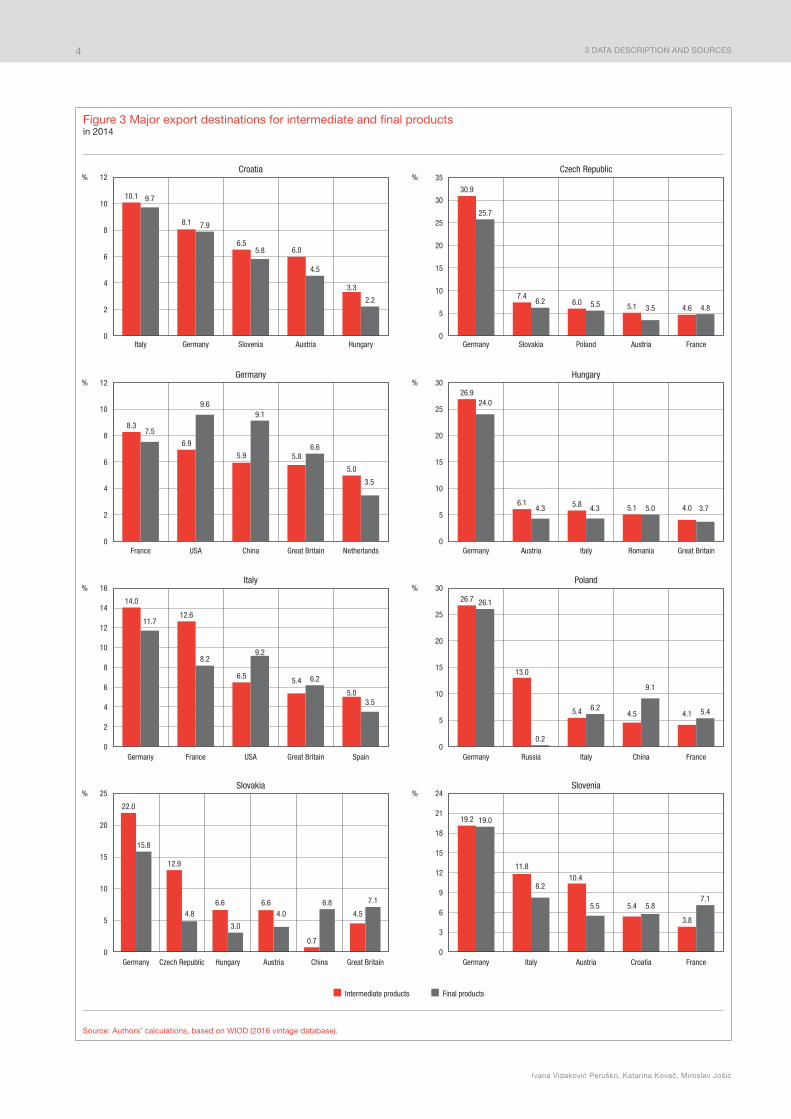
Both intermediate and final goods and services are similar-ly represented in exports to Croatian main export markets, as shown in Figure 3 (see page 4). The figure also shows that 10% of total intermediate and also final goods and services are exported to Italy. Germany is the most important export mar-ket for both the intermediate and final goods and services for peer countries. Moreover, the Czech Republic, Hungary and Poland export about a third of total intermediates to Germa-ny. Croatia accounts as an important export market only for Slovenia.
4.2 What does Croatia import?
Croatia imports most of its products from Germany, Italy, Austria, Slovenia, Hungary, and Russia, in that order (Figure 4). Imports of intermediate goods and services is higher than of final ones. This is most noticeable in the structure of imports from Russia. Almost 3% of total Croatian imports comes from Russia, and almost all are intermediates (mostly natural gas).
Intermediates account for a higher share of imports than final goods and services in all countries (Figure 5). Croatia has a lower share of intermediates in total imports (61%) than the
world average (65%), and its major trade partners and peers (CEE countries on average have 70%).
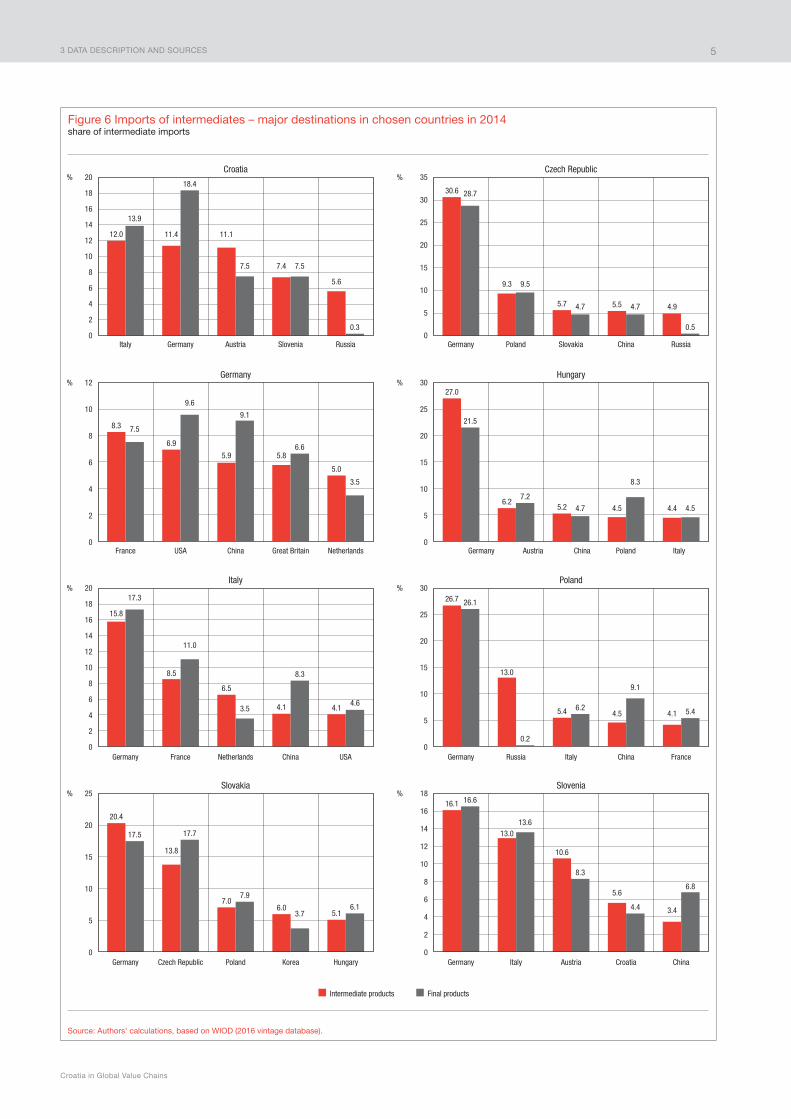
Major Croatian trading partners in imports of both inter-mediate and final products are the same as for exports (Figure 6): Italy, Germany, Austria and Slovenia. Russia is added due to its importance when it comes to imports of intermediates. Germany seems to be the most important source of products for all Croatian major trading partners and peers. China was one of the most important sources for final goods and services in all observed countries except for Slovakia.
Source: Authors’ calculations, based on WIOD (2016 vintage database).1
Figure 2 Intermediates export as a percentage of total exportsin 2014
%
55%
56%
57%
59%
60%
60%
61%
62%
62%
63%
65%
65%
50 52 54 56 58 60 62 64 66
IT
SK
DE
HU
CEE
PL
EU-28
CZ
SI
HR
All countries
AT
1 See Appendix C, Table 1 for country definition.
2 According to the WIOD, Croatia’s main trading partners are Austria, Germany, Hungary, Italy, and Slovenia. However, this paper analyzes countries more com-parable to Croatia to get a better insight into how much Croatia differs from peer countries. Peer countries include countries in the Central and Eastern Europe (the Czech Republic, Hungary, Poland, Slovakia and Slovenia) and main trading partners (Austria, Germany, Italy and Slovenia).
Source: Authors’ calculations, based on WIOD (2016 vintage database).
Figure 4 Croatian main import sources in 2014, by product type as % of total imports
0 2 4 6 8 10 161412%
Intermediate products Final products
7%
7%
7%
5%
3%
3%
7%
5%
3%
3%
2%
0%
Germany
Italy
Austria
Slovenia
Hungary
Russia
Source: Authors’ calculations, based on WIOD (2016 vintage database).
Figure 5 Intermediates imports as a percentage of total imports in 2014
%
60%
61%
64%
65%
65%
65%
66%
66%
70%
71%
74%
77%
0 10 20 30 40 50 60 70 80
SI
HR
DE
All countries
PL
AT
EU-28
IT
CEE
SK
CZ
HU
3 DATA DESCRIPTION AND SOURCES
Ivana Vidaković Peruško, Katarina Kovač, Miroslav Jošić
4
Source: Authors’ calculations, based on WIOD (2016 vintage database).
Figure 3 Major export destinations for intermediate and final productsin 2014
10.1
8.1
6.56.0
3.3
9.7
7.9
5.8
4.5
2.2
Intermediate products Final products
14.0
12.6
6.55.4
5.0
11.7
8.29.2
6.2
3.5
0
2
4
6
8
10
12
14
16
Germany France USA Spain
Italy
8.3
6.9
5.9 5.8
5.0
7.5
9.69.1
6.6
3.5
0
2
4
6
8
10
12
France USA China Great Britain Great Britain
Great Britain
Great Britain
Netherlands
Germany
30.9
7.46.0 5.1 4.6
25.7
6.2 5.5 3.5 4.8
% %
0
2
4
6
8
10
12
Italy Germany Slovenia Austria Hungary
Croatia
0
5
10
15
20
25
30
35
Germany Slovakia Poland Austria France
Czech Republic
% %
% %
% %
19.2
11.810.4
5.4
3.8
19.0
8.2
5.5 5.87.1
0
3
6
9
12
15
18
21
24
Germany Italy Austria Croatia France
Slovenia
22.0
12.9
6.6 6.6
0.7
4.5
15.8
4.8
3.0
4.06.8 7.1
0
5
10
15
20
25
Germany Czech Republic Hungary Austria China
Slovakia
26.9
6.1 5.8 5.1 4.0
24.0
4.3 4.3 5.0 3.7
0
5
10
15
20
25
30
Germany Austria Italy Romania
Hungary
26.7
13.0
5.4 4.5 4.1
26.1
0.2
6.2
9.1
5.4
0
5
10
15
20
25
30
Germany Russia Italy China France
Poland
3 DATA DESCRIPTION AND SOURCES
Croatia in Global Value Chains
5
Source: Authors’ calculations, based on WIOD (2016 vintage database).
Figure 6 Imports of intermediates – major destinations in chosen countries in 2014 share of intermediate imports
Intermediate products Final products
Italy
France USA China Great Britain Netherlands
Germany
% %Croatia Czech Republic
% %
% %
% %
Germany Italy Austria Croatia China
SloveniaSlovakia
Hungary
Germany Russia Italy China France
Poland
12.0 11.4 11.1
7.4
5.6
13.9
18.4
7.5 7.5
0.3
Italy Germany Austria Slovenia Russia Germany Poland Slovakia China Russia
Germany Austria China Poland Italy
8.3
6.9
5.9 5.8
5.0
7.5
9.6
9.1
6.6
3.5
15.8
8.5
6.5
4.1 4.1
17.3
11.0
3.5
8.3
4.6
Germany France Netherlands China USA
26.7
13.0
5.4 4.5 4.1
26.1
0.2
6.2
9.1
5.4
20.4
13.8
7.06.0
5.1
17.5 17.7
7.9
3.76.1
Germany Czech Republic Poland Korea Hungary
16.1
13.0
10.6
5.6
3.4
16.6
13.6
8.3
4.4
6.8
0
2
4
6
8
10
12
14
16
18
20
30.6
9.3
5.7 5.5 4.9
28.7
9.5
4.7 4.7
0.50
5
10
15
20
25
30
35
0
2
4
6
8
10
12
0
5
10
15
20
25
3027.0
6.25.2 4.5 4.4
21.5
7.2
4.7
8.3
4.5
0
2
4
6
8
10
12
14
16
18
0
5
10
15
20
25
30
0
5
10
15
20
25
0
2
4
6
8
10
12
14
16
18
20
4 TRADE STATISTICS OVERVIEW
Ivana Vidaković Peruško, Katarina Kovač, Miroslav Jošić
6
4.3 Stylized facts from intermediate products trade
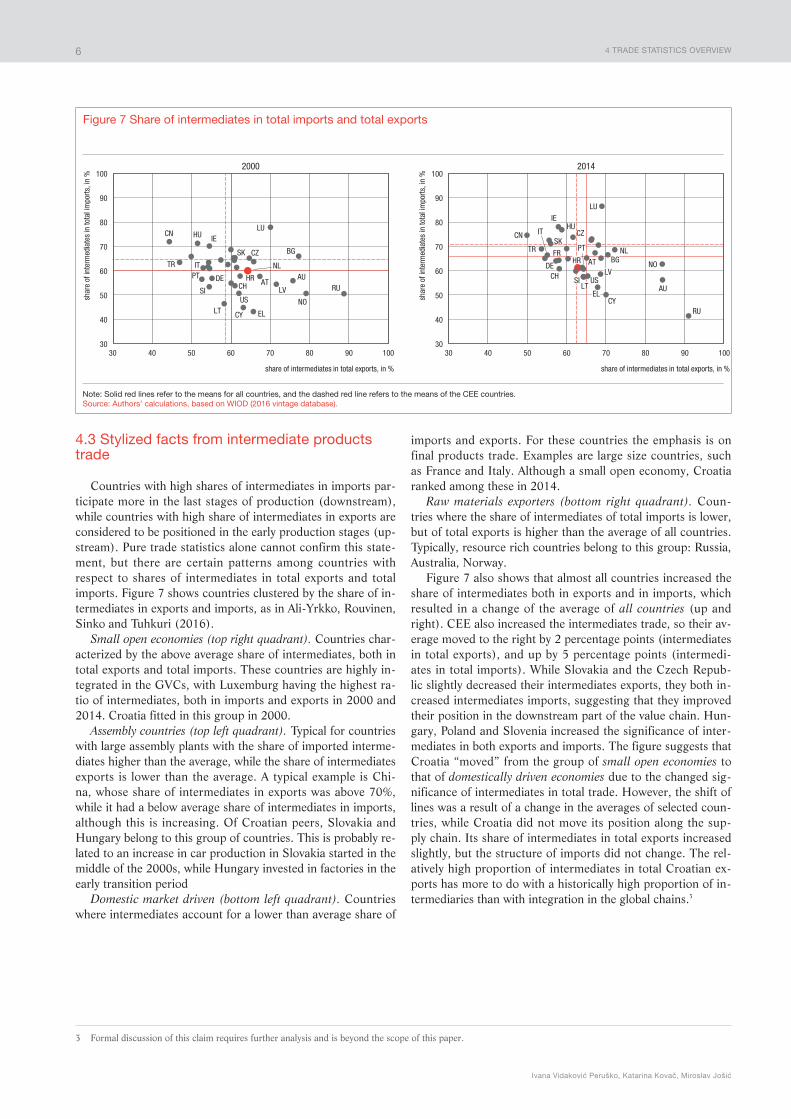
Countries with high shares of intermediates in imports par-ticipate more in the last stages of production (downstream), while countries with high share of intermediates in exports are considered to be positioned in the early production stages (up-stream). Pure trade statistics alone cannot confirm this state-ment, but there are certain patterns among countries with respect to shares of intermediates in total exports and total imports. Figure 7 shows countries clustered by the share of in-termediates in exports and imports, as in Ali-Yrkko, Rouvinen, Sinko and Tuhkuri (2016).
Small open economies (top right quadrant). Countries char-acterized by the above average share of intermediates, both in total exports and total imports. These countries are highly in-tegrated in the GVCs, with Luxemburg having the highest ra-tio of intermediates, both in imports and exports in 2000 and 2014. Croatia fitted in this group in 2000.
Assembly countries (top left quadrant). Typical for countries with large assembly plants with the share of imported interme-diates higher than the average, while the share of intermediates exports is lower than the average. A typical example is Chi-na, whose share of intermediates in exports was above 70%, while it had a below average share of intermediates in imports, although this is increasing. Of Croatian peers, Slovakia and Hungary belong to this group of countries. This is probably re-lated to an increase in car production in Slovakia started in the middle of the 2000s, while Hungary invested in factories in the early transition period
Domestic market driven (bottom left quadrant). Countries where intermediates account for a lower than average share of
imports and exports. For these countries the emphasis is on final products trade. Examples are large size countries, such as France and Italy. Although a small open economy, Croatia ranked among these in 2014.
Raw materials exporters (bottom right quadrant). Coun-tries where the share of intermediates of total imports is lower, but of total exports is higher than the average of all countries. Typically, resource rich countries belong to this group: Russia, Australia, Norway.
Figure 7 also shows that almost all countries increased the share of intermediates both in exports and in imports, which resulted in a change of the average of all countries (up and right). CEE also increased the intermediates trade, so their av-erage moved to the right by 2 percentage points (intermediates in total exports), and up by 5 percentage points (intermedi-ates in total imports). While Slovakia and the Czech Repub-lic slightly decreased their intermediates exports, they both in-creased intermediates imports, suggesting that they improved their position in the downstream part of the value chain. Hun-gary, Poland and Slovenia increased the significance of inter-mediates in both exports and imports. The figure suggests that Croatia “moved” from the group of small open economies to that of domestically driven economies due to the changed sig-nificance of intermediates in total trade. However, the shift of lines was a result of a change in the averages of selected coun-tries, while Croatia did not move its position along the sup-ply chain. Its share of intermediates in total exports increased slightly, but the structure of imports did not change. The rel-atively high proportion of intermediates in total Croatian ex-ports has more to do with a historically high proportion of in-termediaries than with integration in the global chains.3
3 Formal discussion of this claim requires further analysis and is beyond the scope of this paper.
Note: Solid red lines refer to the means for all countries, and the dashed red line refers to the means of the CEE countries.Source: Authors’ calculations, based on WIOD (2016 vintage database).
Figure 7 Share of intermediates in total imports and total exports
shar
e of
inte
rmed
iate
s in
tota
l im
ports
, in
%
shar
e of
inte
rmed
iate
s in
tota
l im
ports
, in
%
AUAT
BG
CH
CN
CY
CZ
DE
EL
HR
HU IE
IT
LT
LU
LV
NL
NO
PT
RU
SK
SI
TR
US
30
40
50
60
70
80
90
100
30
40
50
60
70
80
90
100
30 40 50 60 70 80 90 100
share of intermediates in total exports, in %
30 40 50 60 70 80 90 100
share of intermediates in total exports, in %
2000 2014
AU
AT BG
CH
CN
CY
CZ
DE
FR
EL
HR
HUIE
IT
LT
LU
LV
NL
NO
PT
RU
SK
SI
TR
US

5 CROATIA’S PARTICIPATION IN GVCS
Croatia in Global Value Chains
7
5 Croatia’s participation in GVCs
Conventional gross trade statistics have been useful for ana-lyzing the gross trade among countries. However, as already mentioned, they suffer from double accounting and record the value added created abroad (intermediates exports of another country). They do not reveal how much value added has been generated in a country, or which industries have created the value.
Export performance in Croatia is less pronounced when measured in value added rather than in gross terms (Figure 8). While gross exports of goods and services in Croatia in 2000 were 7.5 billion USD, only part of them, 5.6 billion USD, con-tributed to the GDP. In 2009, with the crisis, the value added of exports (that is, the income generated by exporting) de-creased by less than 14 p.p., while the gross exports decreased by almost 20 p.p. In 2014 total gross exports were 23.3 billion USD, while the value added of exports was 6.4 billion USD lower.
5.1 International comparison
One of the most widely used indicators for analyzing the in-volvement of a country in GVCs is the GVC participation index (Koopman, Powers, Wang & Wei, 2011), which is defined as follows:
GVC participation EXiIVA
EXiFVA
ii i= +
where IVAi stands for indirect value added (value added that reflects the contribution of domestic suppliers whose exported goods and services are built into later exported products to the third countries), FVAi foreign value added of exports in coun-try i, and EXi represents its gross exports.
A country either provides inputs for other countries’ exports (forward participation) or uses other countries’ inputs to gen-erate exports (backward participation). While a forward link-age indicator is given by the indirect domestic value added, a backward linkage indicator refers to the import content of ex-ports (foreign value added).
Countries with high rates of specialization have larger back-ward linkage components, while economies that are resource rich tend to have higher forward linkage components. In 2014 China was one of the countries with the highest participation in GVCs, particularly due to the forward participation (that is, downstream links) (Figure 9). Hungary, the Czech Republic and Slovakia were also highly involved in the GVCs, but mostly due to backward participation. Taking into account the evo-lution of backward participation in GVC between 2000 and 2014, most countries increased their backward participation (particularly the Czech Republic, Japan and Turkey), while only few countries, Cyprus, Canada, Russia and Australia, de-creased their backward participation index (changes in for-ward and backward participation between 2000 and 2014 are presented in Figure 17, Appendix B).
Croatia’s participation in GVCs in 2014 was slightly be-low the world average and significantly below five Central and Eastern Europe countries and the EU average (Figure 9). As for Croatia’s major trading partners, Italy had the highest GVC participation index, with dominant forward participation. Due to more pronounced backward participation in 2014, Austria was also more involved in GVCs than Croatia. Finally, Germa-ny’s GVC participation index was most similar to the Croatian, having both forward and backward linkages very much alike. However, Germany increased its backward participation sig-nificantly between 2000 and 2014, while the forward partici-pation index decreased. At the same time, the backward partic-ipation index for Croatia slightly increased between 2000 and 2014, while the forward participation index stayed roughly the same (Appendix B, Figure 17). In other words, the capacity of the Croatian firms to perform in the downstream parts of value chains has remained limited.
Source: Authors’ calculations, based on WIOD (2016 vintage database).
Figure 8 Value added exports vs gross exports in Croatia
2000
2001
2002
2003
2004
2005
2006
2007
2008
2009
2010
2011
2012
2013
2014
0
5
10
15
20
25
30
billi
on U
SD
Gross exports VA exports
When assessing the actual contribution of each country and industry to economic growth, the gross value of exports can be decomposed into foreign and domestic value added. While the foreign value added as a share of exports indicates what part of a country’s gross exports consists of imported inputs, the domestic value added is a part of the exports created within the country. Furthermore, the domestic value added can be further split into three components: exported directly final goods and intermediates (direct domestic VA), exported intermediates to a country that exports it further to the third countries (indirect domestic VA) and re-imported domestic intermediates.
Assessing domestic and foreign value added further enables analyzing the most commonly used indicators of the involve-ment of countries in the GVC: the GVC participation index de-veloped by Koopman et al (2011) and VAX matrix introduced by Johnson and Noguera (2012) (for methodology on estimat-ing trade in value – added see Appendix A).

5 CROATIA’S PARTICIPATION IN GVCS
Ivana Vidaković Peruško, Katarina Kovač, Miroslav Jošić
8
Source: Authors’ calculations, based on WIOD (2016 vintage database).
Figure 9 GVC participation across countriesin 2014
%
0
10
20
30
40
50
60
70
80
90
LUX
MLT
CHN
HUN
CZE
SVK
FIN
EST
BEL
KOR
ITA
BGR
ESP
TUR
GRC
DNK
IRL
POL
FRA
SVN
ROU
AUT
MEX LVA
TWN
PRT
CYP
JPN
ROW
SWE
NLD
DEU
HRV
LTU
IND
BRA
CAN
IDN
GBR
CHE
AUS
USA
RUS
NOR
CEE
EU-2
8
WOR
Backward participation Forward participation GVC participation index 2014 GVC participation index 2000
5.2 Decomposition of value added in exports
When compared to its key competitive markets, Croatia on-ly marginally changed its overall position in GVCs from 2000 until 2014. However, there were some changes in the structure of the value added content of gross exports: both indirect do-mestic value added and foreign value added increased, while direct domestic value added decreased (Figure 10). The Czech Republic and Slovakia had the most pronounced increase in the foreign content of exports.
As the direct domestic value added is directly absorbed by the importers in the partnering economy, the picture is similar to that in gross trade statistics. By contrast, exported interme-diates re-exported to third countries (indirect domestic value added) are a measure of forward participation. China had the highest share of indirect domestic value added in 2014, fol-lowed by Italy and the United States (Figure 11). Analogously to Figure 9, those countries participate in GVCs mostly due to the forward linkage component.
Given that the indirect content of domestic value added was not ultimately destined to one country, rather used for re-export to third countries, it is particularly important for real economic growth and job creation. Almost one third of Croa-tia’s domestic value added is indirect value, and is somewhat higher than in the CEE countries (21% and 22%, respectively). Croatia is the only country in which the indirect component of domestic value added increased from 2000 to 2014, followed by a larger decrease in the direct domestic component. This could be related to improved relations of Croatian companies with trade partners (or new agreements concluded), who ex-ported Croatian goods further to the third countries. However, an increase in indirect domestic value added could also be a result of some large companies establishing firms and facilities in neighboring countries (Bosnia & Herzegovina, Serbia and Macedonia) which were used for exports to third countries; some Croatian manufacturers undertook certain measures be-fore entering the EU, within which they moved their produc-tion to other countries in order to take advantage of duty-free
Source: Authors’ calculations, based on WIOD (2016 vintage database).
Figure 10 Evolution of value added content of gross exports
a) In Croatia b) Change between 2000 and 2014
–15 –10 –5 0 5 10 15
HRV
HUN
SVN
DEU
POL
ITA
AUT
SVK
CZE
27%
25%
46%
51%
27%
24%
0% 20% 40% 60% 80% 100%
2014
2000
Indirect domestic VA Direct domestic VA Reimported domestic VA Foreign VA
in percentage points

5 CROATIA’S PARTICIPATION IN GVCS
Croatia in Global Value Chains
9
Source: Authors’ calculations, based on WIOD (2016 vintage database).
Figure 13 Share of foreign value added in gross exportsin manufacturing
151515
222930
343435
363940
4143
4445
4748
51
0%%
20 40 60
RussiaChina
United StatesAustralia
ItalyGermany
CroatiaWorld
LithuaniaPoland
SloveniaLatvia
AustriaCEE
Czech Rep.BulgariaSlovakiaEstonia
Hungary
RussiaChina
United StatesAustralia
ItalyGermany
CroatiaWorld
LithuaniaPoland
SloveniaLatvia
AustriaCEE
Czech Rep.BulgariaSlovakiaEstonia
Hungary
10
32
66
56
98
77
109
119
125
6
0 5 10 15
a) Level in 2014 b) Change between 2000 and 2014
in percentage points
placement of goods in the free trade area once Croatia entered the EU (Ranilović, 2016; Ćudina and Sušić, 2013).
5.2.1 GVC participation by sectorIn most of the countries, the growth of GVC participation
was not homogenous across industries, due in particular to the low foreign value added (that is high domestic value added) component in services. Therefore, apart from general interna-tional comparison, the focus is on further emphasis of the role of industrial heterogeneity with regard to the domestic and for-eign origin of value added.
The share of foreign value added in Croatia is higher in manufacturing sector than in the overall economy which is, of course, to be expected due to international fragmentation, which initially started as an industry-demanded process. Ex-ports of services are generally made up of less foreign value
added than manufactured products (Figure 12), although for-eign value added in the sector of hotels and restaurants (tour-ism service) is somewhat higher than in other services. Agri-culture, as expected, also contains a low share of foreign value added.
Analysis of foreign value added in manufacturing in Croatia indicates that one third was generated abroad, which is some-what lower than the world average (34%), but significantly low-er than the average of the CEE countries (43%) (Figure 13a). From 2000 to 2014 Croatia made smaller progress than all its major trading partners and peers. At the same time, Slovakia and the Czech Republic improved their backward participation position more than any of selected countries (Figure 13b).
When it comes to domestic value added as a content of gross exports, it is mostly high in agriculture, raw materials and services (Ali-Yrkko et al., 2016). As can be seen in Figure
Source: Authors’ calculations, based on WIOD (2016 vintage database).
Figure 11 Value added content of gross exports in 2014, by country
Indirect domestic VA Direct domestic VAReimported domestic VA Foreign VA
0% 20% 40% 60% 80% 100%
ChinaItaly
United StatesRussiaJapanWorld
GermanyPolandCroatiaEU-28
AustriaCEE
SloveniaCzech Republic
SlovakiaHungary
4 Industries included in each sector are listed in Appendix C3, Table 3.
Source: Authors’ calculations, based on WIOD (2016 vintage database).
Figure 12 Evolution of foreign value added in Croatia by sector4
2000
2001
2002
2003
2004
2005
2006
2007
2008
2009
2010
2011
2012
2013
2014
0
10
20
30
40
50
60
70%
Total economyHotels and restaurants
AgricultureServices (excl. hotels and restaurants)Mining and quarrying Manufacturing

5 CROATIA’S PARTICIPATION IN GVCS
Ivana Vidaković Peruško, Katarina Kovač, Miroslav Jošić
10
12, this is the case in Croatia: the highest share of domestic value added is in agriculture and services. Looking more close-ly at the structure of the manufacturing sector in 2014, the share of domestic value added in gross exports was particularly high (more than 75%) in water supply, food, beverages and the tobacco industry, production of pharmaceutical products, computers and electronics, and water supply and waste collec-tion (Figure 14).
It is interesting to notice that industries that are traditionally marked as crucial in Croatia, such as the production of coke and refined petroleum, and chemicals and chemical products had the highest drop in the share of domestic value added be-tween 2000 and 2014 in favor of foreign value added (from 88% to 49% and 64% to 63%, respectively). On the other hand, the pharmaceutical industry was the only industry to in-crease the share of domestic value added in the same period, from 74% to 79%. However, in order to draw conclusions on its importance for the local economy, one should scale these proportions by total volume of corresponding industries’ ex-ports, which is beyond the scope of this paper. The proportion of domestic or foreign value added in gross exports should on-ly serve as information that helps to identify trade-offs from in-dustry specific integration into GVCs and, therefore, calibrate policy accordingly.
5.2.2 GVC participation by partner countrySubsequent to the analysis of foreign and domestic value
added embodied in trade, this section focuses on countries that
Source: Authors’ calculations, based on WIOD (2016 vintage database).
Figure 14 Share of domestic value added in gross exportsby main industries
% %
30
40
50
60
70
80
90
100
2000
2001
2002
2003
2004
2005
2006
2007
2008
2009
2010
2011
2012
2013
2014
2000
2001
2002
2003
2004
2005
2006
2007
2008
2009
2010
2011
2012
2013
2014
Pharmaceutical products Chemicals and chemical productsCoke and refined petroleum Electricity, gas, air conditioning
65
68
70
73
75
78
80
Food, beverages and tobacco Wood and wood productsTextiles Paper and paper products
% %
2000
2001
2002
2003
2004
2005
2006
2007
2008
2009
2010
2011
2012
2013
2014
2000
2001
2002
2003
2004
2005
2006
2007
2008
2009
2010
2011
2012
2013
2014
55
60
65
70
75
80
85
Motor vehicles and transport equipment Computers and electronicsElectrical equipment Machinery and equipment
55
60
65
70
75
Basic metals and metal products Rubber and plasticNon-metallic mineral products Furniture
Note: Croatian value added embodied in a foreign country’s exports (forward participation) and a foreign country’s value added contained in Croatian exports (backward participation), for Croatian main GVC partner countries.Source: Authors’ calculations, based on WIOD (2016 vintage database).
Figure 15 Main GVC partner countries for Croatia in 2014 in %
DEU
ITA
SVN
AUT
BEL
HUNNLDFRA
CHN
GBR
CZE
SWECHE
POL
USA
RUS
0.0
0.5
1.0
1.5
2.0
2.5
3.0
3.5
0.0 0.5 1.0 1.5 2.0 2.5 3.0 3.5
Back
war
d pa
rtici
patio
n
forward participation
6 CONCLUSION
Croatia in Global Value Chains
11
are the main Croatian GVC partners.Croatia is strongly integrated with six partner countries
(Figure 15). However, there is room for improvement, espe-cially with Russia, the US and China, where forward partici-pation is several times smaller than backward participation. Enabling both forward and backward linkages, Germany is Croatia’s main GVC trading partner (Figure 15). Italy, Aus-tria and Slovenia were respectively the second, third and fourth most important countries in terms of both forward and back-ward linkages. As expected, Russia is an important GVC part-ner country due to the backward linkage, implying that Croatia imports Russian intermediaries, and then further exports them to third countries.
5.3 Final destinations for Croatia’s goods and services
So far, only the gross exports measure was used in ana-lyzing the value added component of Croatia’s exports. The
question is to estimate the dependence of the Croatian econ-omy on final demand in different countries. Traditional trade statistics report only bilateral transactions (imports and ex-ports) without the notion on where Croatian goods and ser-vices are finally consumed. Value added in final demand or VAX matrix is a measure that captures the connection between industries and consumers, be they foreign or domestic, even if they are not directly or closely connected (Johnson & Noguera, 2012).5 The highlighted row in Table 1 shows the contribution of other countries’ final demand to Croatian GDP. Accord-ing to the VAX matrix, the most important drivers of Croa-tia’s GDP growth are Germany and Italy (1.8 billion dollars of Croatia’s GDP is attributable to meeting final demand in these two countries). It also shows that Croatia’s exports depend on Chinese and US final demand, similarly to the Austrian and Slovenian, which is not visible from the traditional trade statis-tics. An obvious remark for the Croatian economy is that it is mostly domestically driven economy with almost 80% of total demand in 2014 being domestically driven (40.7 billion dollars out of 51.2 billion dollars).6
6 Conclusion
Empirical evidence demonstrates that joining GVCs brings positive and significant gains in productivity. Accordingly, this paper analyzes Croatians participation in GVCs, compares Croatia with its main trading partners and peer countries, and shows which exporting industries generate the most of Croa-tia’s value added.
Our results show that Croatia’s integration in GVCs from 2000 until 2014, measured by the GVC participation index, essentially stayed unchanged. Moreover, its composition also did not change. Although the GVC participation index did not increase much in the CEE countries and Croatia’s major trad-ing partners either (except in the Czech Republic and Italy), they changed their position along the GVCs. Namely, all the observed countries significantly increased their backward and decreased their forward participation. This means they im-proved their position in the global value chains by increasing the foreign content of exports and therefore improving their position in the downstream part of the value chain, which might have resulted in improving their competitiveness. At the same time, Croatia slightly increased its backward component, while the growth of indirect domestic value in exports was negligible.
This study also shows that Croatia’s growth is mostly do-mestically driven. Almost 80% of value added in gross exports is created domestically. However, between 2000 and 2014
direct domestic value added decreased in favour of the indi-rect component. Moreover, Croatia is the only one among an-alyzed countries that increased the indirect part of domestic value added, while the foreign content grew least among the peer countries. Therefore, Croatia could improve its backward participation by using cheaper foreign inputs while improving its competitiveness.
Analysis of the structure of value added in exports in the manufacturing sector shows that the share of domestic value added in gross exports in 2014 was particularly high in the production of food and beverages and in the tobacco indus-try, pharmaceutical products, and computers and electronics. Moreover, the pharmaceutical industry is the only industry that significantly increased the share of domestic value added from 2000 to 2014.
Croatia is strongly integrated with a few countries, Germa-ny being the most important GVC partner, followed by Italy, Austria and Slovenia, in that order. Russia is an important GVC partner country due to the backward linkage, implying that Croatia imports Russian intermediaries, and then further exports them to third countries.
Finally, the VAX matrix also shows that Croatia’s growth is mostly domestically driven, and that the highest contribution of foreign final demand comes from Germany and Italy.
5 For methodology see Appendix A.
6 The figures for all countries included in WIOD are presented in Appendix C, Table C4.

5 CROATIA’S PARTICIPATION IN GVCS
Ivana Vidaković Peruško, Katarina Kovač, Miroslav Jošić
12
Tabl
e 1
The
impo
rtan
ce o
f tra
ding
par
tner
s ba
sed
on th
e VA
X m
atrix
in 2
014
(in b
illio
n U
SD
)
AU
TB
GR
CH
EC
HN
CZ
ED
EU
ES
TH
RV
HU
NIR
LIT
ALT
ULV
AP
OL
RO
UR
US
SV
KS
VN
TUR
US
AO
ther
co
untr
ies
Tota
l D
omes
tical
ly
driv
en (i
n %
)
AU
T31
9.4
0.3
3.5
4.1
1.8
20.0
0.1
0.8
2.0
0.3
5.5
0.1
0.1
1.9
0.9
1.5
1.0
0.7
1.0
5.1
35.3
405
79
BG
R0.
339
.20.
10.
70.
21.
10.
00.
00.
10.
10.
70.
00.
00.
20.
50.
30.
10.
10.
80.
67.
753
74
CH
E2.
40.
154
5.0
7.4
0.8
17.6
0.1
0.1
0.6
1.2
7.1
0.1
0.1
1.3
0.3
2.0
0.3
0.1
1.0
16.3
94.7
699
78
CH
N2.
50.
54.
09,
440.
44.
036
.30.
50.
33.
12.
413
.90.
40.
36.
01.
615
.11.
80.
510
.312
6.2
728.
610
,399
91
CZ
E2.
20.
20.
92.
214
3.8
13.1
0.1
0.2
1.4
0.2
2.1
0.1
0.1
2.8
0.5
1.8
2.6
0.2
0.7
2.6
20.7
198
73
DE
U22
.31.
421
.852
.514
.72,
956.
80.
71.
210
.54.
434
.70.
70.
521
.55.
418
.46.
21.
511
.361
.037
2.7
3620
82
ES
T0.
10.
00.
10.
20.
00.
417
.50.
00.
00.
00.
10.
10.
30.
10.
00.
40.
00.
00.
00.
35.
025
70
HR
V0.
40.
00.
10.
40.
10.
90.
040
.70.
20.
00.
90.
00.
00.
10.
10.
10.
10.
40.
10.
46.
151
80
HU
N1.
60.
20.
51.
20.
96.
90.
00.
392
.60.
32.
10.
00.
01.
01.
30.
60.
80.
20.
41.
913
.712
773
IRL
0.4
0.1
2.8
3.5
0.3
4.0
0.0
0.0
0.3
157.
42.
70.
00.
00.
60.
20.
40.
10.
00.
310
.852
.723
767
ITA
3.8
0.8
7.8
10.1
2.3
26.9
0.2
0.9
2.0
1.7
1,76
6.8
0.2
0.1
5.0
3.0
4.6
1.3
0.9
5.3
19.3
134.
91,
998
88
LTU
0.1
0.0
0.1
0.4
0.1
1.0
0.2
0.0
0.1
0.0
0.3
33.3
0.4
0.5
0.0
0.7
0.0
0.0
0.1
0.6
8.1
4672
LVA
0.1
0.0
0.2
0.2
0.0
0.5
0.3
0.0
0.0
0.0
0.1
0.2
21.9
0.2
0.0
0.4
0.0
0.0
0.1
0.2
4.4
2976
PO
L2.
00.
31.
73.
64.
121
.80.
40.
21.
70.
74.
50.
60.
440
8.2
1.2
3.2
1.9
0.3
1.5
4.8
49.0
512
80
RO
U1.
20.
50.
51.
30.
45.
20.
00.
11.
00.
22.
60.
00.
00.
614
8.7
0.6
0.3
0.1
1.1
1.8
20.5
187
80
RU
S3.
90.
65.
042
.83.
823
.70.
50.
61.
41.
512
.01.
70.
914
.13.
11,
309.
11.
80.
38.
024
.426
5.0
1,72
476
SV
K1.
30.
10.
30.
71.
94.
50.
00.
11.
00.
21.
30.
00.
01.
30.
31.
071
.80.
10.
30.
810
.497
74
SV
N0.
80.
00.
30.
40.
21.
80.
00.
50.
30.
01.
20.
00.
00.
20.
10.
20.
133
.30.
20.
45.
145
74
TUR
0.7
0.8
0.6
5.1
0.5
7.4
0.1
0.1
0.5
0.3
3.9
0.1
0.1
1.2
1.2
4.7
0.3
0.1
656.
26.
460
.375
187
US
A3.
90.
59.
784
.02.
647
.10.
20.
42.
629
.116
.70.
30.
24.
21.
45.
01.
10.
37.
016
,384
.481
5.9
17,4
1794
Oth
er
coun
trie
s25
.37.
649
.889
9.6
20.9
285.
23.
34.
017
.948
.613
9.0
4.5
2.5
39.9
16.7
61.0
13.2
4.0
69.4
875.
69,
641.
512
,229
79
Not
e: O
ther
cou
ntrie
s in
clud
e R
est o
f the
wor
ld a
nd o
ther
cou
ntrie
s th
at a
re n
ot in
this
tabl
e, b
ut a
re in
clud
ed in
WIO
D.
Sou
rce:
Aut
hors
’ cal
cula
tions
, bas
ed o
n W
IOD
(201
6 vi
ntag
e da
taba
se).
REFERENCES
Croatia in Global Value Chains
13
Ahmad, N., T. Bohn, N. Mulder, M. Vaillant, and D. Zaclice-ver (2017): Indicators on global value chains, OECD Statistics Working Papers 2017/08.
Ali-Yrkko, J., P. Rouvinen, P. Sinko, and J. Tuhkuri (2016): Finland in global value chains, Prime Minister’s Offce Publications.
Baldwin, J., and B. Yan (2014): Global value chains and the productivity of Canadian manufacturing firms, Economic Analysis Research Paper Series, Statistics Canada, Analytical Studies Branch.
Banga, R. (2013): Measuring value in global value chains, UNCTAD Background Paper.
Barro, R. (2015): Convergence and modernization, Economic Journal, 125 (585), pp. 911-942.
Ćudina, A., and G. Sušić (2013): The Impact of Croatia’s Accession to the EU on Economic Relations with the CEFTA Countries, Ekonomski pregled, Vol. 64 (4), pp. 376-396.
De Backer, K., and S. Miroudot (2014): Mapping global value chain, ECB working paper, 1677.
Gibbon, P., J. Bair, and S. Ponte (2008): Governing global value chains: An introduction, Economy and Society, 82 (3), pp. 315-338.
Johnson, R. C., and G. Noguera (2012): Accounting for inter-mediates: production sharing and trade in value added, Journal of International Economics, 82 (2), pp. 224-236.
References
Koopman, R., W. Powers, Z. Wang, and S-J. Wei (2011): Give credit where credit is due: tracing value added in global produc-tion chains, NBER working paper 16426.
Kowalski, P. et al. (2015): Participation of developing countries in global value chains: Implications for trade and trade-related policies, OECD Trade Policy Papers, 179, OECD Publishing, Paris.
Kulmer, V., M. Kernitzkyi, J. Koberl, and A. Niedler (2015): Global value chains: implications for Austrian economy, FIW-Research Reports 2014/15.
Leontief, W. (1936): Quantitative input and output relations in the economic system of the United States, The Review of Eco-nomic and Statistics, 18 (3), pp. 105-25.
Ranilović, N. (2017): The Effects of Economic Integration on Croatian Merchandise Trade: A Gravity Model Study, Compar-ative Economic Studies, 59, Issue 3, pp. 382-404.
Timmer, M. P., B. Los, R. Stehrer, and G. J. de Vries (2016): An Anatomy of the Global Trade Slowdown based on the WIOD 2016 Release, (GGDC Research Memoranda, No. 162), University of Groningen.
UNCTAD (2013): World Investment Report, Global Value Chains: Investment and Trade for Development.
APPENDICES
Ivana Vidaković Peruško, Katarina Kovač, Miroslav Jošić
14
Appendices
Appendix A: Estimating trade in value added
Given that conventional statistical records on trade data do not provide adequate information concerning the degree of involvement in the process of globalized production, this sec-tion proposes a methodology appropriate for tracking trade in value added. The methodology used to estimate trade in value added stems from Leontief (1936). The author demonstrated that, once the interconnections between different industries and different countries are familiar, total output required for production of one unit of final goods is easily tracked. The quantity and type of intermediary goods that are necessary for the one unit of final good of interest is determined using in-put-output tables across industries and countries. Namely, $1 of exports creates value added in trade directly, that is exactly the first-round domestic value added part of exports. Further-more, $1 of exports is produced with the use of intermediate products, each of which creates value added itself, and that is how indirect (second round) value added is generated. This procedure is repeated with intermediate products, and after a finite number of iterations, it gets to the raw materials used in the production process. Now, total domestic value added in trade is given as a sum of all indirect (second-round) val-ue added terms and one direct term, generated through $1 of exports.
The formalization of an accounting structure used for the estimation of value added component, as in Johnson and Noguera (2012) is presented below. Every industry sector s 2 S within a country i 2 N produces tradable good with the use of domestic inputs and imported intermediate goods. The amount of good produced by sector s in country i is denoted as qi(s); that is either used further as an intermediate good in the production process, or consumed as a final product. The main characteristic of the global input-output structure is that it separates bilateral flows of qi(s) for intermediate and final use. In order to capture these four dimensions appropriately (2 different sectors × 2 different countries), source countries are denoted by i, and destination countries by j. The amount of final goods from production sector s in source country i desig-nated for country j is denoted as qij
c (s); while the amount of in-termediary products from industry s in country i used in sector t of country j is marked as qij
m(s; t): These flows satisfy market clearing conditions for goods, therefore:
( ) ( ) ( , )q s q s q s ti ijc
j
ijm
tj
= +/ //
Assuming a common price pi (s); the market clearing condi-tion can be rewritten in value terms as:
( ) ( ) ( , )y s c s m s ti ij
j
ij
tj
= +/ // , (1)
where values of production, final consumption and intermedi-ate goods flows are yi(s) / pi(s)qi(s), cij(s) / pi(s)qij
c(s) and mij(s,t) / pi(s)qij
m(s,t). If xij(s) denotes gross bilateral exports, ( ) ( ) ( , )s c s m s tij ij ij
t| = +/ meaning that gross bilateral exports incorporate goods both of intermediate and final use out of the country.
Intuitively, (1) says that total output yi(s) is thus divided
between domestic final use, domestic intermediate use, and gross exports.
Presuming many countries (N) and industrial sectors (S) involved in the analysis of global trade, introducing compact notation facilitates formalization. In particular: Sx1 vector yi stands for total (both intermediate and final use) value of output in each industrial sector; Sx1 vector cij denotes final goods flows from country i to country j, and Sx1 vector cii de-notes final demand of country i for its own products. Assum-ing SxS input-output matrix A, the use of intermediary goods from country i in country j would be Aijyj: Common matrix ele-ment of direct technical coeffcients Aij (s; t) has a major role: it characterizes international association of inputs and out-puts. For instance, it illustrates the value of s=steel import-ed by j=Croatia from i=Germany needed for the production of t=boats, as a ratio of total production of boats in Croatia. Compactly written, with A being the global input-output ma-trix, it comes up as follows:
, ,A
A
A
A
A
A
A
A
A
A
Y
y
y
y
c
c
c
cN N
N
N
NN N
j
j
j
Nj
11
21
1
12
22
2
1
2
1
2
1
2
h h
g
g
j
g
h h h/ / /
R
T
SSSSSSSSSSS
R
T
SSSSSSSSSSS
R
T
SSSSSSSSSSS
V
X
WWWWWWWWWWW
V
X
WWWWWWWWWWW
V
X
WWWWWWWWWWW
.
Now, the goods market clearing condition is:
y Ay cjj
= +/ , (2)
that is the typical description of an input-output system, having total output distributed between intermediate and final consumption. Solving this system of equations for y:
( )y I A cjj
1= - -/ , (3)
where (I – A)–1 is the so-called Leontief inverse of the in-put-output matrix A, which calculates the direct and indirect output value needed to satisfy final demand in country j. In order to visualize direct versus indirect terms, Leontief in-verse is expressed as ( )I A A
inf k
k
1
0- =-
=/ , infinite sequence,
where the zero order term multiplied with the vector of final consumption, cj, represents direct output consumed as final goods. The first order term stands for direct output plus in-puts used in the production of that particular direct final out-put: .I A cj+5 ? The second order term, in addition, contains intermediates needed for production of first round intermedi-ate goods: I A A cj2+ +5 ? : The same logic applies for the third round, fourth round terms, and continues until it gets to the raw materials used in production process. In that way, output from country i is disintegrated into the quantity of output from i used to produce final consumption goods in j; that is a dif-ferent concept from gross exports. While exports from coun-try i to country j are detected directly, output flows are rather estimated with the use of information provided by the global input demand for final goods consumed in particular country. In order to get the value added streaming from aforementioned bilateral trade transactions, the share of value added to output is determined for each industrial sector within a country i as
( , )r A s t1 ,i j isj
= - // that is the GDP to gross exports ratio, for each industrial sector level. Now, the value added exports

APPENDICES
Croatia in Global Value Chains
15
and value added share of exports (VAX ratio) are defined as follows:• Value added exports equals the absolute value added pro-
duced by industry s in country i destined to country j: vaij(s)= ri(s)yij(s), while total value added produced in coun-try i is easily calculated as ( )va va sij ij
s=/ .
• VAX ratio equals vaij(s)/xij(s), xij(s) being the gross bilateral exports.For more on specific indicators on GVCs see Ahmad, Bohn,
Mulder, Vaillant, and Zaclicever (2017).
Appendix B: Additional figures
Source: Authors’ calculations, based on WIOD (2016 vintage database).
Figure 17 Change in backward participation index and forward participation index 2000-2014 across countries
–10
–5
0
5
10
15
perc
enta
ge p
oint
s
CYP
CAN
RUS
ROW
IDN
AUS
CHN
SWE
MEX
BRA
GBR
ROU
CHE
USA
HRV
PRT
FRA
NOR
TWN
HUN
SVN
DEU
KOR
ESP
POL
DNK
BGR
ITA
LVA
AUT
IND
MLT EST
BEL
IRL
FIN
SVK
NLD
LUX
GRC
TUR
LTU
JPN
CZE
Change in backward Change in forward
APPENDICES
Ivana Vidaković Peruško, Katarina Kovač, Miroslav Jošić
16
Appendix C: Additional tables
Table C1 Countries included in WIOD
Code Description
AUS Australia
AUT Austria
BEL Belgium
BGR Bulgaria
BRA Brazil
CAN Canada
CHE Switzerland
CHN China
CYP Cyprus
CZE Czech Republic
DEU Germany
DNK Denmark
ESP Spain
EST Estonia
FIN Finland
FRA France
GBR United Kingdom
GRC Greece
HRV Croatia
HUN Hungary
IDN Indonesia
IND India
IRL Ireland
ITA Italy
JPN Japan
KOR Korea
LTU Lithuania
LUX Luxembourg
LVA Latvia
MEX Mexico
MLT Malta
NLD Netherlands
NOR Norway
POL Poland
PRT Portugal
ROU Romania
RUS Russia
SVK Slovakia
SVN Slovenia
SWE Sweden
TUR Turkey
TWN Taiwan
USA United States
ROW Rest of the World
Table C2 Industries included in WIOD
Code Description
A01Crop and animal production, hunting and related service activities
A02 Forestry and logging
A03 Fishing and aquaculture
B Mining and quarrying
C10-C12Manufacture of food products, beverages and tobacco products
C13-C15Manufacture of textiles, wearing apparel and leather products
C16Manufacture of wood and of products of wood and cork, except furniture; manufacture of articles of straw and plaiting materials
C17 Manufacture of paper and paper products
C18 Printing and reproduction of recorded media
C19 Manufacture of coke and refined petroleum products
C20 Manufacture of chemicals and chemical products
C21Manufacture of basic pharmaceutical products and pharmaceutical preparations
C22 Manufacture of rubber and plastic products
C23 Manufacture of other non-metallic mineral products
C24 Manufacture of basic metals
C25Manufacture of fabricated metal products, except machinery and equipment
C26 Manufacture of computer, electronic and optical products
C27 Manufacture of electrical equipment
C28 Manufacture of machinery and equipment n.e.c.
C29 Manufacture of motor vehicles, trailers and semi-trailers
C30 Manufacture of other transport equipment
C31_C32 Manufacture of furniture; other manufacturing
C33 Repair and installation of machinery and equipment
D35 Electricity, gas, steam and air conditioning supply
E36 Water collection, treatment and supply
E37-E39Sewerage; waste collection, treatment and disposal activities; materials recovery; remediation activities and other waste management services
F Construction
G45Wholesale and retail trade and repair of motor vehicles and motorcycles
G46Wholesale trade, except of motor vehicles and motorcycles
G47 Retail trade, except of motor vehicles and motorcycles
H49 Land transport and transport via pipelines
H50 Water transport
H51 Air transport
H52 Warehousing and support activities for transportation
H53 Postal and courier activities
I Accommodation and food service activities
J58 Publishing activities

APPENDICES
Croatia in Global Value Chains
17
Code Description
J59_J60Motion picture, video and television programme production, sound recording and music publishing activities; programming and broadcasting activities
J61 Telecommunications
J62_J63Computer programming, consultancy and related activities; information service activities
K64Financial service activities, except insurance and pension funding
K65Insurance, reinsurance and pension funding, except compulsory social security
K66Activities auxiliary to financial services and insurance activities
L68 Real estate activities
M69_M70Legal and accounting activities; activities of head offices; management consultancy activities
M71Architectural and engineering activities; technical testing and analysis
M72 Scientific research and development
M73 Advertising and market research
M74_M75Other professional, scientific and technical activities; veterinary activities
N Administrative and support service activities
O84Public administration and defence; compulsory social security
P85 Education
Q Human health and social work activities
R_S Other service activities
TActivities of households as employers; undifferentiated goods- and services-producing activities of households for own use
U Activities of extraterritorial organizations and bodies
Table C3 Decomposition of sectors
Code Industries Sectors
A01 -A03 Agriculture Primary production
B Mining and quarrying Primary production
C10-C12 Food, beverages and tobacco Manufacturing
C13-C15 Textiles Manufacturing
C16 Wood and wood products Manufacturing
C17 Paper and paper products Manufacturing
C18 Recorded media Manufacturing
C19 Coke and refined petroleum Manufacturing
C20 Chemicals and chemical products Manufacturing
C21 Pharmaceutical products Manufacturing
C22 Rubber and plastic Manufacturing
C23 Non-metallic mineral products Manufacturing
C24-C25 Basic metals and metal products Manufacturing
C26 Computers and electronics Manufacturing
C27 Electrical equipment Manufacturing
C28 Machinery and equipment Manufacturing
C29-C30Motor vehicles and transport equipment
Manufacturing
C31_C32 Furniture Manufacturing
C33 Repair and installation equip Manufacturing
D35 Electricity, gas, air conditioning Manufacturing
E36-E39 Water and sewerage Services
F Construction Services
G45-G47 Retail trade Services
H49-H53 Transport Services
I Hotels and restaurants Services
J58-J63Communication and computer programming
Services
K64-K66 Financial and insurance activities Services
L68 Real estate Services
M69_M75Professional scientific and technical activities
Services
N; O84; R_SAdministration; public administration and defense; other service activities
Services
P85 Education Services
Q Human health and social work Services

Tabl
e C
4 In
terd
epen
denc
ies
betw
een
diffe
rent
cou
ntrie
s in
201
4
AUS
AUT
BEL
BGR
BRA
CAN
CHE
CHN
CYP
CZE
DEU
DNK
ESP
EST
FIN
FRA
GBR
GRC
HRV
HUN
IDN
IND
IRL
ITA
JPN
KOR
LTU
LUX
LVA
MEX
MLT
NLD
NOR
POL
PRT
ROU
RUS
SVK
SVN
SWE
TUR
TWN
USA
ROW
AUS
1,177.9
0.2
0.7
0.1
2.2
1.3
0.8
60.9
0.0
0.2
2.1
0.3
0.9
0.0
0.2
1.7
2.6
0.1
0.0
0.1
5.1
6.8
0.3
1.3
31.4
9.7
0.0
0.1
0.0
1.0
0.0
0.8
0.2
0.5
0.1
0.1
0.6
0.1
0.0
0.3
1.0
5.3
9.8
57.4
AUT
0.5
319.4
1.2
0.3
0.8
1.0
3.5
4.1
0.0
1.8
20.0
0.6
1.5
0.1
0.4
4.0
2.8
0.3
0.8
2.0
0.3
0.7
0.3
5.5
1.3
0.9
0.1
0.2
0.1
0.6
0.1
1.2
0.4
1.9
0.2
0.9
1.5
1.0
0.7
1.1
1.0
0.3
5.1
15.0
BEL
1.3
1.3
368.4
0.2
1.4
1.0
3.6
6.2
0.1
1.2
16.3
1.3
3.4
0.1
0.8
14.3
8.8
0.5
0.2
0.8
0.5
1.3
1.1
5.3
1.8
1.0
0.1
1.6
0.1
0.8
0.1
7.5
1.0
1.9
0.6
0.5
1.5
0.4
0.1
2.3
1.6
0.4
11.4
28.2
BGR
0.1
0.3
0.5
39.2
0.1
0.1
0.1
0.7
0.0
0.2
1.1
0.1
0.3
0.0
0.1
0.5
0.4
0.5
0.0
0.1
0.1
0.1
0.1
0.7
0.1
0.1
0.0
0.0
0.0
0.1
0.0
0.2
0.0
0.2
0.1
0.5
0.3
0.1
0.1
0.1
0.8
0.0
0.6
4.0
BRA
1.2
0.4
1.5
0.22,089.1
2.6
0.5
35.3
0.0
0.2
5.6
0.6
2.7
0.0
0.4
4.2
3.4
0.2
0.1
0.2
3.2
6.2
0.3
3.3
6.9
3.8
0.1
0.1
0.0
2.8
0.0
3.8
0.9
0.7
0.8
0.4
1.3
0.1
0.3
0.6
1.7
1.8
21.0
55.2
CAN
1.6
0.4
1.4
0.1
2.51,394.0
0.7
15.6
0.0
0.2
3.7
0.4
1.3
0.0
0.4
5.2
6.8
0.2
0.0
0.2
1.3
2.4
0.9
2.5
9.8
3.5
0.0
0.2
0.0
7.4
0.2
1.4
0.9
0.5
0.2
0.3
0.8
0.2
0.0
0.8
0.9
1.4
172.3
55.3
CHE
1.4
2.4
3.5
0.1
1.5
2.5
545.0
7.4
0.1
0.8
17.6
1.1
3.0
0.1
0.7
8.2
7.2
0.4
0.1
0.6
0.6
2.1
1.2
7.1
4.1
1.8
0.1
1.8
0.1
1.0
0.1
4.8
0.7
1.3
0.4
0.3
2.0
0.3
0.1
0.9
1.0
0.7
16.3
46.2
CHN
20.1
2.5
6.4
0.5
20.4
22.1
4.09,440.4
0.2
4.0
36.3
3.6
9.8
0.5
3.9
22.2
21.7
1.3
0.3
3.1
19.6
24.9
2.4
13.9
56.4
47.9
0.4
0.5
0.3
18.3
0.2
14.1
2.3
6.0
1.2
1.6
15.1
1.8
0.5
5.9
10.3
14.7
126.2
390.9
CYP
0.0
0.1
0.1
0.0
0.0
0.0
0.0
0.1
17.3
0.1
0.2
0.2
0.0
0.0
0.0
0.1
0.3
0.1
0.0
0.1
0.0
0.0
0.0
0.2
0.1
0.0
0.0
0.0
0.0
0.0
0.3
0.1
0.0
0.1
0.0
0.1
0.2
0.0
0.0
0.1
0.0
0.0
0.2
1.7
CZE
0.2
2.2
1.7
0.2
0.4
0.3
0.9
2.2
0.0
143.8
13.1
0.6
1.2
0.1
0.4
2.9
2.3
0.1
0.2
1.4
0.2
0.4
0.2
2.1
0.5
0.4
0.1
0.1
0.1
0.4
0.0
1.0
0.3
2.8
0.2
0.5
1.8
2.6
0.2
0.7
0.7
0.1
2.6
6.3
DEU
5.0
22.3
14.7
1.4
9.7
7.8
21.8
52.5
0.2
14.7
2,956.8
10.3
20.0
0.7
6.1
51.9
41.2
2.1
1.2
10.5
3.0
7.6
4.4
34.7
12.8
10.2
0.7
2.8
0.5
7.8
0.3
20.5
4.9
21.5
3.5
5.4
18.4
6.2
1.5
10.6
11.3
3.2
61.0
116.5
DNK
0.4
0.4
0.8
0.1
0.7
0.6
0.7
3.7
0.0
0.3
5.5
258.0
1.0
0.1
1.3
2.3
4.3
0.2
0.1
0.8
0.3
0.6
0.3
1.2
1.4
0.8
0.1
0.1
0.1
0.3
0.0
1.1
2.9
1.2
0.2
0.2
0.9
0.2
0.0
4.0
0.5
0.2
3.7
15.1
ESP
1.0
0.9
2.8
1.2
2.7
1.3
1.8
5.9
0.1
0.9
10.9
1.01,162.9
0.1
0.6
16.5
6.9
0.6
0.1
0.6
0.6
1.4
0.7
7.2
2.5
1.6
0.1
0.3
0.1
1.9
0.1
2.1
0.7
1.7
6.0
0.7
1.6
0.4
0.2
1.0
2.9
0.7
8.8
42.5
EST
0.1
0.1
0.1
0.0
0.0
0.0
0.1
0.2
0.0
0.0
0.4
0.2
0.1
17.5
0.7
0.2
0.3
0.0
0.0
0.0
0.0
0.1
0.0
0.1
0.1
0.1
0.1
0.0
0.3
0.0
0.0
0.1
0.4
0.1
0.0
0.0
0.4
0.0
0.0
0.7
0.0
0.0
0.3
1.7
FIN
0.4
0.4
0.8
0.0
0.5
0.5
0.6
3.1
0.0
0.2
4.1
0.7
0.8
0.5
204.0
1.6
2.2
0.1
0.0
0.2
0.4
0.4
0.5
1.2
1.2
0.9
0.1
0.1
0.2
0.3
0.0
1.3
1.0
1.0
0.1
0.1
1.6
0.1
0.0
2.8
0.7
0.2
4.2
8.9
FRA
2.1
2.4
12.5
0.5
5.2
3.9
6.3
18.2
0.1
2.5
33.1
2.6
21.4
0.1
1.42,333.1
26.5
0.9
0.3
1.8
1.8
3.2
2.8
18.7
5.9
3.9
0.2
2.1
0.1
2.4
0.2
8.3
2.5
4.4
2.5
1.7
4.6
1.4
0.3
3.4
4.5
1.1
28.0
70.1
GBR
4.2
2.2
8.5
0.4
3.6
9.8
8.2
19.1
0.3
1.7
26.6
4.5
6.3
0.2
2.0
27.0
2,421.6
1.2
0.3
1.3
1.5
5.9
14.0
12.4
8.4
6.1
0.2
8.5
0.2
2.7
1.2
8.4
5.2
3.4
1.5
1.0
3.8
0.6
0.2
4.8
3.2
1.5
49.9
112.7
GRC
0.1
0.1
0.3
0.4
0.2
0.1
0.2
1.3
0.2
0.1
1.0
0.1
0.3
0.0
0.1
0.5
0.8
190.5
0.0
0.1
0.2
0.4
0.1
1.0
0.5
0.3
0.0
0.0
0.0
0.1
0.0
0.2
0.0
0.2
0.1
0.3
0.2
0.0
0.0
0.1
2.1
0.1
1.1
13.2
HRV
0.0
0.4
0.3
0.0
0.1
0.1
0.1
0.4
0.0
0.1
0.9
0.1
0.1
0.0
0.0
0.3
0.3
0.1
40.7
0.2
0.1
0.1
0.0
0.9
0.1
0.1
0.0
0.0
0.0
0.0
0.0
0.1
0.1
0.1
0.0
0.1
0.1
0.1
0.4
0.1
0.1
0.0
0.4
4.0
HUN
0.1
1.6
0.6
0.2
0.2
0.2
0.5
1.2
0.0
0.9
6.9
0.3
0.8
0.0
0.2
1.5
1.6
0.1
0.3
92.6
0.1
0.2
0.3
2.1
0.3
0.3
0.0
0.1
0.0
0.3
0.0
0.8
0.2
1.0
0.1
1.3
0.6
0.8
0.2
0.5
0.4
0.1
1.9
5.2
IDN
3.5
0.2
0.5
0.1
2.4
1.0
0.2
19.5
0.0
0.2
2.4
0.2
1.7
0.1
0.1
1.4
1.4
0.2
0.0
0.1
749.4
7.1
0.2
2.0
15.4
6.2
0.0
0.0
0.0
1.1
0.0
1.7
0.1
0.4
0.2
0.1
0.9
0.1
0.1
0.2
1.7
3.5
9.2
45.4
IND
1.7
0.4
1.4
0.1
3.8
1.6
0.8
13.8
0.1
0.4
4.7
0.7
1.7
0.0
0.7
3.8
3.9
0.3
0.1
0.2
2.91,945.6
0.3
2.7
4.0
3.3
0.0
0.1
0.0
1.8
0.0
1.5
0.3
0.8
0.4
0.2
1.3
0.2
0.1
0.8
3.5
1.2
18.7
76.5
IRL
0.5
0.4
2.0
0.1
0.9
1.1
2.8
3.5
0.0
0.3
4.0
0.6
1.6
0.0
0.4
2.7
8.4
0.2
0.0
0.3
0.2
0.5
157.4
2.7
1.4
1.0
0.0
1.0
0.0
0.8
0.1
1.8
0.5
0.6
0.2
0.2
0.4
0.1
0.0
0.7
0.3
0.3
10.8
25.7
ITA
2.1
3.8
3.9
0.8
3.7
2.8
7.8
10.1
0.2
2.3
26.9
1.9
10.5
0.2
1.2
25.8
13.6
1.6
0.9
2.0
1.1
2.5
1.71,766.8
4.1
3.2
0.2
1.0
0.1
2.8
0.4
3.4
1.2
5.0
1.5
3.0
4.6
1.3
0.9
2.3
5.3
0.7
19.3
43.3
JPN
4.9
0.7
1.9
0.1
4.5
6.5
1.3
70.2
0.0
0.9
9.8
0.6
1.9
0.1
0.4
4.9
6.1
0.2
0.1
0.8
9.9
6.1
1.3
2.84,131.4
24.8
0.1
0.2
0.0
8.7
0.0
3.2
0.6
1.1
0.3
0.3
3.6
0.5
0.1
0.8
1.9
13.2
52.3
109.9
KOR
3.6
0.5
0.9
0.1
6.4
3.4
0.6
72.5
0.0
1.1
5.8
0.5
1.5
0.1
0.4
3.0
4.2
0.2
0.1
0.9
6.0
6.8
0.5
2.4
17.3
1,093.6
0.1
0.1
0.0
6.9
0.1
1.6
0.5
1.8
0.3
0.4
5.5
1.7
0.3
0.6
3.5
5.3
35.3
70.3
LTU
0.1
0.1
0.2
0.0
0.1
0.1
0.1
0.4
0.0
0.1
1.0
0.4
0.2
0.2
0.2
0.4
0.4
0.0
0.0
0.1
0.0
0.1
0.0
0.3
0.1
0.1
33.3
0.0
0.4
0.0
0.0
0.2
0.4
0.5
0.0
0.0
0.7
0.0
0.0
0.4
0.1
0.0
0.6
4.6
LUX
0.1
0.4
1.2
0.1
0.1
0.1
0.9
0.9
0.1
0.2
2.9
0.3
0.4
0.0
0.1
1.6
1.1
0.2
0.0
0.2
0.1
0.2
0.6
1.2
0.4
0.2
0.0
33.2
0.0
0.1
0.3
0.9
0.2
0.2
0.1
0.1
0.3
0.1
0.0
0.4
0.1
0.1
0.8
10.6
LVA
0.0
0.1
0.1
0.0
0.0
0.0
0.2
0.2
0.0
0.0
0.5
0.2
0.1
0.3
0.2
0.2
0.4
0.0
0.0
0.0
0.0
0.0
0.0
0.1
0.1
0.1
0.2
0.0
21.9
0.0
0.0
0.1
0.2
0.2
0.0
0.0
0.4
0.0
0.0
0.3
0.1
0.0
0.2
2.1
MEX
0.7
0.1
0.5
0.0
2.5
6.6
0.5
5.5
0.0
0.1
1.7
0.2
3.6
0.0
0.1
1.6
1.4
0.1
0.0
0.1
0.4
2.3
0.3
1.2
2.3
1.8
0.0
0.0
0.01,090.6
0.0
0.5
0.1
0.2
0.2
0.1
0.3
0.1
0.0
0.1
0.7
0.5
84.1
15.2
MLT
0.0
0.1
0.1
0.0
0.0
0.0
0.0
0.1
0.0
0.0
0.1
0.1
0.0
0.0
0.0
0.1
0.3
0.0
0.0
0.0
0.0
0.0
0.0
0.2
0.0
0.0
0.0
0.0
0.0
0.0
7.5
0.1
0.1
0.0
0.0
0.1
0.0
0.0
0.0
0.1
0.0
0.0
0.1
0.5
NLD
1.7
2.7
12.2
0.3
3.2
2.0
4.4
11.7
0.1
2.1
55.1
2.6
5.3
0.2
1.6
20.6
19.1
0.7
0.2
1.4
1.0
2.1
4.9
13.9
3.0
2.1
0.2
0.7
0.2
1.4
0.4
565.5
2.0
3.7
0.9
0.9
2.8
0.8
0.2
2.8
2.5
0.9
19.2
50.2
NOR
0.7
0.7
2.0
0.1
2.9
1.8
0.7
6.4
0.0
0.4
13.3
3.4
3.3
0.2
1.6
9.4
18.7
0.3
0.1
0.3
0.7
1.5
1.0
2.3
2.6
1.9
0.3
0.3
0.1
0.6
0.0
2.0
343.5
2.1
0.3
0.2
2.3
0.2
0.1
5.1
1.3
0.5
8.6
32.7
POL
0.5
2.0
3.0
0.3
0.7
1.1
1.7
3.6
0.1
4.1
21.8
2.2
2.5
0.4
1.1
5.9
5.6
0.3
0.2
1.7
0.3
0.7
0.7
4.5
1.0
1.0
0.6
0.2
0.4
0.6
0.1
2.5
1.5
408.2
0.3
1.2
3.2
1.9
0.3
2.6
1.5
0.2
4.8
15.2
PRT
0.2
0.2
0.8
0.0
0.9
0.3
0.4
1.2
0.0
0.2
2.0
0.2
3.9
0.0
0.1
2.6
1.5
0.1
0.0
0.1
0.1
0.2
0.2
1.0
0.4
0.2
0.0
0.0
0.0
0.2
0.0
0.4
0.2
0.2
181.9
0.1
0.2
0.1
0.0
0.3
0.4
0.1
1.9
12.8
ROU
0.1
1.2
1.0
0.5
0.3
0.3
0.5
1.3
0.0
0.4
5.2
0.3
0.9
0.0
0.1
2.4
1.1
0.3
0.1
1.0
0.1
0.3
0.2
2.6
0.4
0.3
0.0
0.3
0.0
0.2
0.0
0.7
0.1
0.6
0.1
148.7
0.6
0.3
0.1
0.4
1.1
0.1
1.8
10.5
RUS
2.6
3.9
3.4
0.6
4.1
4.5
5.0
42.8
0.4
3.8
23.7
1.6
5.0
0.5
3.3
9.3
10.1
1.2
0.6
1.4
3.7
7.2
1.5
12.0
22.2
8.3
1.7
0.4
0.9
1.9
0.1
3.1
1.3
14.1
0.7
3.11,309.1
1.8
0.3
3.4
8.0
1.7
24.4
165.5
SVK
0.2
1.3
0.5
0.1
0.1
0.1
0.3
0.7
0.0
1.9
4.5
0.2
0.4
0.0
0.1
1.1
1.7
0.0
0.1
1.0
0.0
0.1
0.2
1.3
0.2
0.2
0.0
0.1
0.0
0.1
0.0
0.4
0.1
1.3
0.1
0.3
1.0
71.8
0.1
0.2
0.3
0.0
0.8
4.3
SVN
0.1
0.8
0.3
0.0
0.1
0.1
0.3
0.4
0.0
0.2
1.8
0.1
0.2
0.0
0.0
0.5
0.3
0.0
0.5
0.3
0.0
0.1
0.0
1.2
0.1
0.1
0.0
0.0
0.0
0.1
0.0
0.1
0.0
0.2
0.0
0.1
0.2
0.1
33.3
0.1
0.2
0.0
0.4
2.6
SWE
1.0
1.0
2.6
0.1
1.5
1.0
1.6
5.4
0.0
0.6
9.1
5.7
1.8
0.5
4.1
4.7
5.4
0.2
0.1
0.5
0.6
1.2
0.9
2.7
1.9
1.2
0.2
0.3
0.2
0.7
0.2
3.0
7.3
2.0
0.3
0.3
1.7
0.3
0.1
426.6
1.1
0.4
7.5
25.8
TUR
0.7
0.7
1.3
0.8
1.3
1.1
0.6
5.1
0.0
0.5
7.4
0.5
2.5
0.1
0.3
3.9
3.4
0.7
0.1
0.5
1.0
1.4
0.3
3.9
1.3
0.9
0.1
0.1
0.1
0.7
0.1
1.1
0.3
1.2
0.4
1.2
4.7
0.3
0.1
0.6
656.2
0.3
6.4
36.6
TWN
2.0
0.3
0.5
0.1
2.9
2.8
0.4
49.4
0.0
0.4
3.9
0.3
0.8
0.1
0.3
2.0
2.6
0.1
0.0
0.4
2.1
2.1
0.3
1.4
10.0
5.6
0.0
0.0
0.0
3.3
0.0
1.1
0.3
0.7
0.1
0.2
0.7
0.3
0.0
0.4
1.1
370.1
18.4
46.1
USA
13.7
3.9
15.7
0.5
26.1
121.5
9.7
84.0
0.2
2.6
47.1
5.1
9.1
0.2
3.9
37.9
36.0
1.9
0.4
2.6
6.5
14.6
29.1
16.7
41.2
25.0
0.3
7.8
0.2
93.0
0.5
20.6
4.3
4.2
1.6
1.4
5.0
1.1
0.3
7.7
7.0
7.716,384.4
314.1
ROW
45.6
9.4
23.0
3.5
70.8
33.6
14.7
473.6
0.8
6.8
65.3
11.6
43.9
0.9
4.7
62.2
57.1
9.4
2.0
6.8
51.5
127.7
17.1
51.0
205.4
99.6
2.5
3.9
0.9
28.0
0.7
29.4
6.5
11.2
9.5
8.3
24.3
5.4
1.6
7.6
32.5
39.0
309.2
8,670

The following Surveys have been published
No. Date Title Author(s)
S-1 March 2000 Banking Sector Problems: Causes, Solutions and Consequences Ljubinko Jankov
S-2 April 2000 Banking System in 1998
S-3 December 2000The Lending Policies of Croatian Banks: Results of the Second CNB Bank Interview Project
Evan Kraft with Hrvoje Dolenec, Mladen Duliba, Michael Faulend, Tomislav Galac, Vedran Šošić and Mladen Mirko Tepuš
S-4 December 2000 What Has Been the Impact of Foreign Banks in CroatiaTomislav Galac and Evan Kraft
S-5 September 2001 Currency Crises: Theoretical and Empirical Overview of the 1990sAnte Babić and Ante Žigman
S-6 April 2002 An Analysis of the Operation of Building Societies in the Republic of Croatia Mladen Mirko Tepuš
S-7 April 2002 Ten Years of Transition Central Banking in the CEE and the BalticsWarren Coats and Marko Škreb
S-8 May 2002Fiscal Consolidation, External Competitiveness and Monetary Policy: A Reply to the WIIW
Evan Kraft Tihomir Stučka
S-9 November 2004 Survey and Analysis of Foreign Direct Investment in the Republic of Croatia Alen Škudar
S-10 February 2005 Does Croatia Need Risk-Based Deposit Insurance Premia? Tomislav Galac
S-11 February 2005 How Can Croatia’s Deposit Insurance System Be Improved? Michael Faulend and Evan Kraft
S-12 April 2005 An Analysis of Housing Finance Models in the Republic of Croatia Mladen Mirko Tepuš
S-13 July 2005EU Criteria with Special Emphasis on the Economic Convergence Criteria – Where is Croatia?
Michael Faulend, Davor Lončarek, Ivana Curavić and Ana Šabić
S-14 December 2005Results of the Third CNB Bank Survey: Croatian Banking in the Consolidation and Market Positioning Stage, 2000 – 2002
Tomislav Galac
S-15 November 2008 Results of the Fifth CNB Bank SurveyLana Ivičić, Mirna Dumičić, Ante Burić, Ivan Huljak
S-16 December 2008 Results of the Fourth CNB Bank Survey Tomislav Galac and Lana Dukić
S-17 September 2014 Framework for Monitoring Macroeconomic Imbalances in the European Union – Significance for Croatia Mislav Brkić and Ana Šabić
S-18 August 2015 A Brief Introduction to the World of Macroprudential Policy Mirna Dumičić
S-19 October 2015Features of the Labour Market and Wage Setting in Croatia: Firms Survey Results
Marina Kunovac and Andreja Pufnik
S-20 November 2016 Are Shadow Banks Hiding in Croatia as Well? Mirna Dumičić and Tomislav Ridzak
S-21 December 2016 A Note on Kuna Lending Igor Ljubaj and Suzana Petrović
S-22 July 2017Microeconomic Aspects of Productivity Developments during the Great Recession in Croatia – the CompNet Productivity Module Research Results
Miljana Valdec and Jurica Zrnc
S-23 August 2017Price Competitiveness of the Manufacturing Sector – a Sector Approach Based on Technological Intensity Level
Enes Đozović
S-24 October 2017Exposure of the Private Non-financial Sector to Interest Rate Risk: Analysis of Results of the Survey on Interest Rate Variability
Mate Rosan
S-25 August 2017 CNB Transparency and Monetary Policy Katja Gattin Turkalj and Igor Ljubaj
S-26 October 2017Adoption of the Euro in Croatia: Possible Effects on International Trade and Investments
Maja Bukovšak, Andrijana Ćudina and Nina Pavić
S-27 November 2017Effects of the Adoption of the Euro on Consumer Prices and Inflation Perceptions: An Overview of Experiences and Assessment of the Possible Impact in Croatia
Andreja Pufnik
S-28 November 2017 Can the Adoption of the Euro in Croatia Reduce the Cost of Borrowing? Davor Kunovac and Nina Pavić
S-29 November 2017 Estimating Potential Growth and Output Gap in Croatia Goran Jovičić
S-30 January 2018Is the Euro the Optimum Currency for Croatia: An Assessment Using the Optimum Currency Area Theory
Mislav Brkić and Ana Šabić
S-31 February 2018 Persistence of Euroisation in CroatiaMirna Dumičić, Igor Ljubaj and Ana Martinis
Guidelines to authors
In its periodical publications Working Papers, Surveys and Technical Papers, the Croatian National Bank publishes scien-tific and scholarly papers of the Bank’s employees and other associate contributors.
After the submission, the manuscripts shall be subject to peer review and classification by the Manuscript Review and Classification Committee. The authors shall be informed of the acceptance or rejection of their manuscript for publication within two months following the manuscript submission.
Manuscripts are submitted and published in Croatian and/or English language.
Manuscripts submitted for publication should meet the fol-lowing requirements:
Manuscripts should be submitted via e-mail or optical stor-age media (CD, DVD), accompanied by one printed paper copy. The acceptable text format is Word.
The first page of the manuscript should contain the article title, first and last name of the author and his/her academic degree, name of the institution with which the author is associ-ated, author’s co-workers, and the complete mailing address of the corresponding author to whom a copy of the manuscript with requests for corrections shall be sent.
Additional information, such as acknowledgments, should be incorporate in the text at the end of the introductory section.
The second page should contain the abstract and the key words. The abstract is required to be explicit, descriptive, writ-ten in third person, consisting of not more than 250 words (maximum 1500 characters). The abstract should be followed by maximum 5 key words.
A single line spacing and A4 paper size should be used. The text must not be formatted, apart from applying bold and italic script to certain parts of the text. Titles must be numerated and separated from the text by double-line spacing, without for-matting.
Tables, figures and charts that are a constituent part of the
paper must be well laid out, containing: number, title, units of measurement, legend, data source, and footnotes. The foot-notes referring to tables, figures and charts should be indi-cated by lower-case letters (a,b,c…) placed right below. When the tables, figures and charts are subsequently submitted, it is necessary to mark the places in the text where they should be inserted. They should be numbered in the same sequence as in the text and should be referred to in accordance with that numeration. If the tables and charts were previously inserted in the text from other programs, these databases in the Excel format should also be submitted (charts must contain the cor-responding data series).
The preferred formats for illustrations are EPS or TIFF with explanations in 8 point Helvetica (Ariel, Swiss). The scanned illustration must have 300 dpi resolution for grey scale and full colour illustration, and 600 dpi for lineart (line drawings, diagrams, charts).
Formulae must be legible. Indices and superscript must be explicable. The symbols’ meaning must be given following the equation where they are used for the first time. The equations in the text referred to by the author should be marked by a se-rial number in brackets closer to the right margin.
Notes at the foot of the page (footnotes) should by indicat-ed by Arabic numerals in superscript. They should be brief and written in a smaller font than the rest of the text.
References cited in the text are listed at the last page of the manuscript in the alphabetical order, according to the authors’ last names. References should also include data on the pub-lisher, city and year of publishing.
Publishing Department maintains the right to send back for the author’s revision the accepted manuscript and illustrations that do not meet the above stated requirements.
All contributors who wish to publish their papers are wel-comed to do so by addressing them to the Publishing Depart-ment, following the above stated guidelines.
The Croatian National Bank publications
Croatian National Bank – Annual ReportRegular annual publication surveying annual monetary and general economic developments as well as statistical data.
Croatian National Bank – Semi-annual ReportRegular semi-annual publication surveying semi-annual mon-etary and general economic developments and statistical data.
Banks BulletinPublication providing survey of data on banks.
Croatian National Bank – BulletinRegular monthly publication surveying monthly monetary and general economic developments and monetary statistics.
Croatian National Bank – Working PapersOccasional publication containing shorter scientific papers written by the CNB employees and associate contributors.
Croatian National Bank – SurveysOccasional publication containing scholarly papers written by the CNB employees and associate contributors.
Croatian National Bank – Technical PapersOccasional publication containing papers of informative char-acter written by CNB employees and associate contributors.
The Croatian National Bank also issues other publications such as, for example, numismatic issues, brochures, publica-tions in other media (CD-ROM, DVD), books, monographs and papers of special interest to the CNB as well as proceed-ings of conferences organised or co-organised by the CNB, ed-ucational materials and other similar publications.


ISSN 1334-014X (online)


