173
Crompton Greaves Limited 75th Annual Report
Crompton Greaves Limited75th Annual Report
DE
SIG
N W
WW
.IC
DIN
DIA
.CO
M I
PR
INT
ED
AT
PA
RK
SO
NS
GR
AP
HIC
S
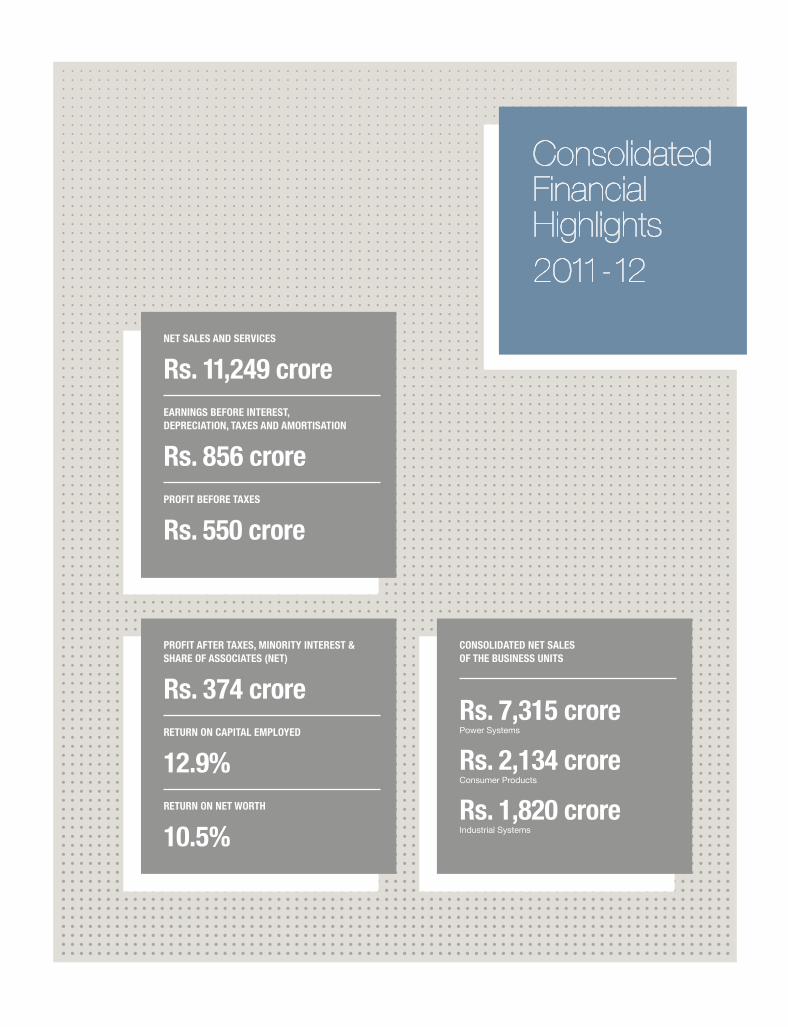
PROFIT AFTER TAXES, MINORITY INTEREST & SHARE OF ASSOCIATES (NET)
Rs. 374 croreRETURN ON CAPITAL EMPLOYED
12.9%RETURN ON NET WORTH
10.5%
NET SALES AND SERVICES
Rs. 11,249 crore EARNINGS BEFORE INTEREST, DEPRECIATION, TAXES AND AMORTISATION
Rs. 856 crorePROFIT BEFORE TAXES
Rs. 550 crore
CONSOLIDATED NET SALES OF THE BUSINESS UNITS
Rs. 7,315 crorePower Systems
Rs. 2,134 croreConsumer Products
Rs. 1,820 croreIndustrial Systems
Consolidated Financial Highlights2011-12
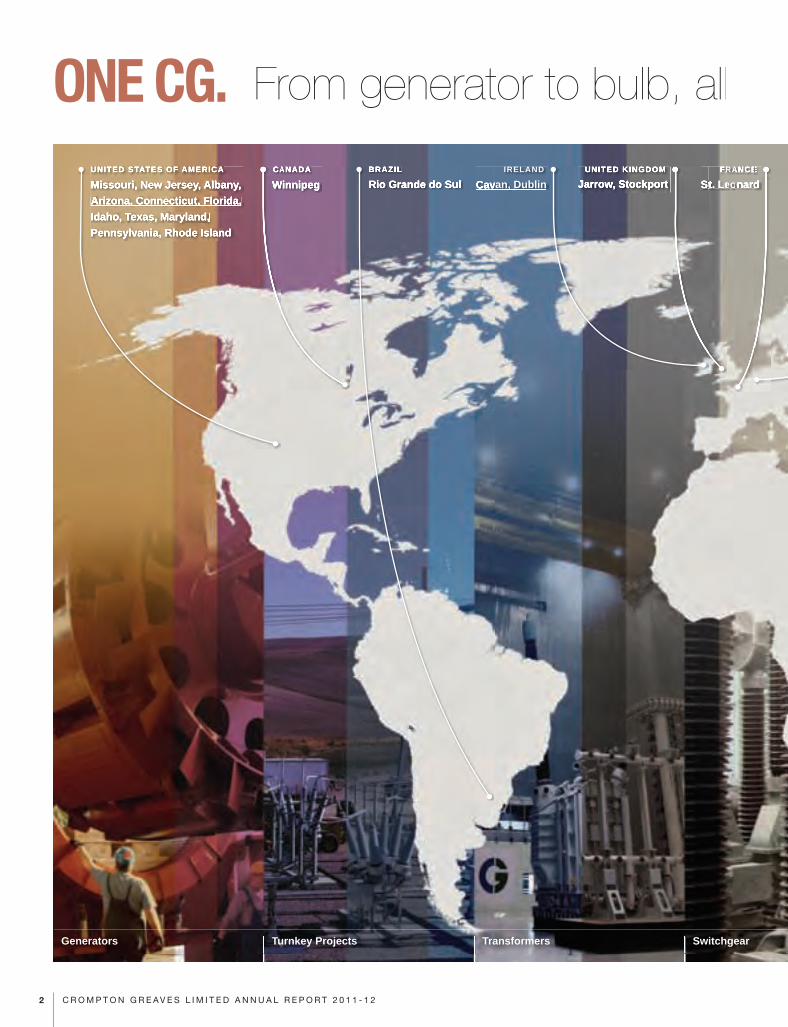
IRELAND
Cavan, Dublin
ONE CG. From generator to bulb, all
FRANCE
St. LeonardUNITED KINGDOM
Jarrow, StockportCANADA
WinnipegBRAZIL
Rio Grande do SulUNITED STATES OF AMERICA
Missouri, New Jersey, Albany, Arizona, Connecticut, Florida, Idaho, Texas, Maryland, Pennsylvania, Rhode Island
FRANCE
St. LeonardFRANCE
St. LeonardUNITED KINGDOM
Jarrow, StockportJarrow, Stockport St. LeonardSt. LeonardCANADA
WinnipegUNITED STATES OF AMERICA
Missouri, New Jersey, Albany, Arizona, Connecticut, Florida, Arizona, Connecticut, Florida, Idaho, Texas, Maryland, Pennsylvania, Rhode Island
CANADACANADA
WinnipegWinnipeg
Generators Turnkey Projects Transformers Switchgear
FRANCE
St. LeonardCavan, DublinBRAZILBRAZIL
Rio Grande do SulRio Grande do Sul
2 C R O M P T O N G R E A V E S L I M I T E D A N N U A L R E P O R T 2 0 1 1 - 1 2
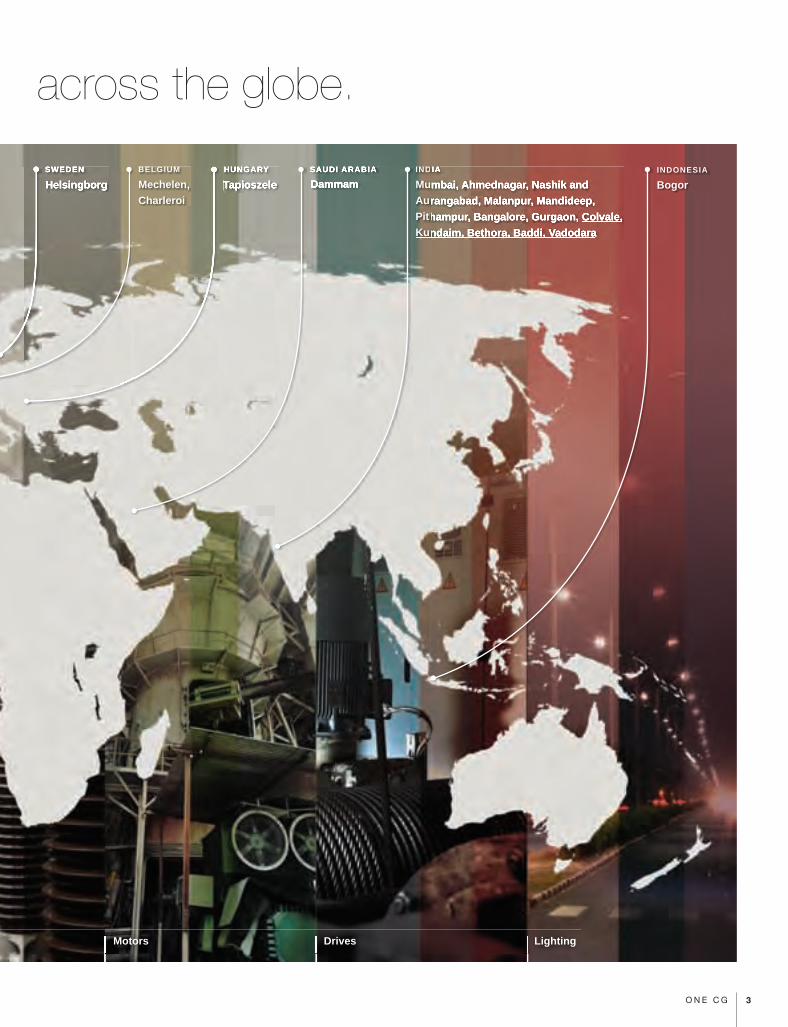
across the globe.
HUNGARY
TapioszeleINDIA
Mumbai, Ahmednagar, Nashik and Aurangabad, Malanpur, Mandideep, Pithampur, Bangalore, Gurgaon, Colvale, Kundaim, Bethora, Baddi, Vadodara
SAUDI ARABIA
DammamINDONESIA
BogorSWEDEN
HelsingborgINDIA
Mumbai, Ahmednagar, Nashik and Aurangabad, Malanpur, Mandideep, Pithampur, Bangalore, Gurgaon, Colvale, Kundaim, Bethora, Baddi, Vadodara
SAUDI ARABIASAUDI ARABIA
DammamHUNGARY
TapioszeleTapioszeleTapioszele
Switchgear Motors Drives Lighting
BELGIUM
Mechelen, Charleroi
SWEDENSWEDEN
Helsingborg
3O N E C G

SMART SOLUTIONS AND SMART SERVICESCGÕ s Systems & Solutions business has uniquely packaged the competencies assimilated through separate acquisitions over the years to provide comprehensive turnkey solutions to its customers. CGÕ s Service Division offers a complete suite of asset management and condition-monitoring solutions. Combined with leading-edge products, CG offers Ò one-stop-shopÓ solutions to utilities and industries for their power solutions needs, building trusted long-term relationships.
Power County wind farm, IdahoCG Power Solutions USA executed CG’s first end-to-end total solutions project comprising project development, engineering, procurement and construction (EPC) and site management of the Power County wind farm in Idaho, USA, with a total generating capacity of 45 MW. The project cost was USD 98 million and was totally funded by CG. Cutting-edge project management ensured timely delivery as per committed deadlines. At full capacity it will provide clean power to 45,000 homes in California and Washington States.
CGÕ s service operationsSeen in the inset is the service of a shell transformer for Rio Tinto in Charleroi, Belgium. Eight layers of the windings were repaired in a record time of 14 weeks to the great satisfaction of the client.
ONE CG.AREA OF LEASED LAND (PRIVATE & STATE)
7,600 acres
NUMBER OF WINDMILLS
18
Smart solutions from design
4 C R O M P T O N G R E A V E S L I M I T E D A N N U A L R E P O R T 2 0 1 1 - 1 2

CUTTING EDGE PROJECT MANAGEMENT THAT ENSURES TIMELY DELIVERY
E N D T O E N D S O L U T I O N S
NUMBER OF WINDMILLS
18
POWER GENERATING CAPACITY
45 MW
HOMES POWERED WITH GREEN ENERGY
45,000
to maintenance.
5O N E C G
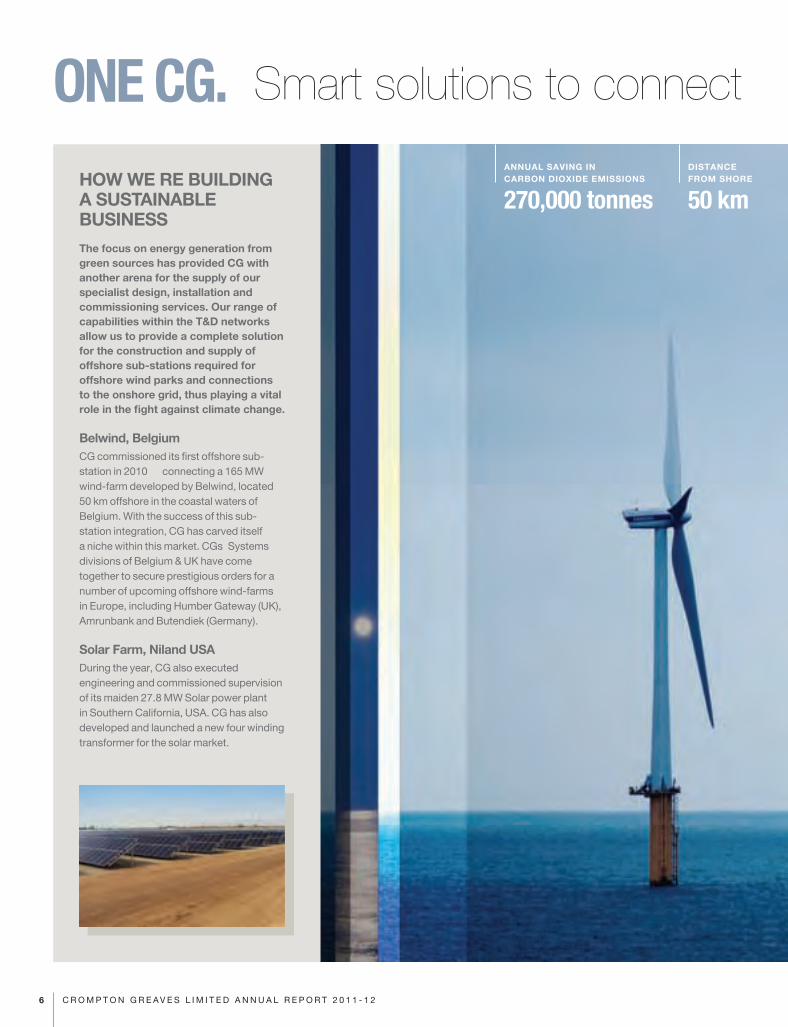
ONE CG.HOW WEÕ RE BUILDING A SUSTAINABLE BUSINESSThe focus on energy generation from green sources has provided CG with another arena for the supply of our specialist design, installation and commissioning services. Our range of capabilities within the T&D networks allow us to provide a complete solution for the construction and supply of offshore sub-stations required for offshore wind parks and connections to the onshore grid, thus playing a vital role in the fight against climate change.
Belwind, BelgiumCG commissioned its first offshore sub-station in 2010 Ñ connecting a 165 MW wind-farm developed by Belwind, located 50 km offshore in the coastal waters of Belgium. With the success of this sub-station integration, CG has carved itself a niche within this market. CGÕs Systems divisions of Belgium & UK have come together to secure prestigious orders for a number of upcoming offshore wind-farms in Europe, including Humber Gateway (UK), Amrunbank and Butendiek (Germany).
Solar Farm, Niland USADuring the year, CG also executed engineering and commissioned supervision of its maiden 27.8 MW Solar power plant in Southern California, USA. CG has also developed and launched a new four winding transformer for the solar market.
ANNUAL SAVING IN CARBON DIOXIDE EMISSIONS
270,000 tonnes
DISTANCE FROM SHORE
50 km
Smart solutions to connect
6 C R O M P T O N G R E A V E S L I M I T E D A N N U A L R E P O R T 2 0 1 1 - 1 2
R E N E W A B L E E N E R G Y
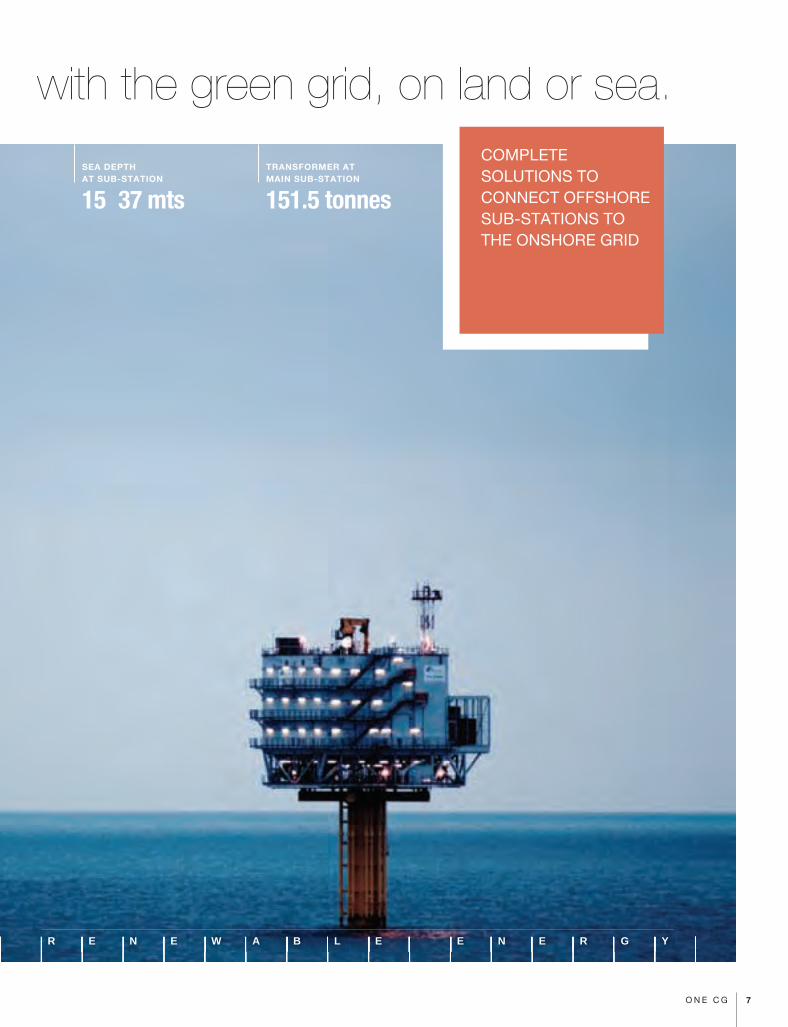
DISTANCE FROM SHORE
50 km
SEA DEPTH AT SUB-STATION
15Ð 37 mts
TRANSFORMER AT MAIN SUB-STATION
151.5 tonnes
COMPLETE SOLUTIONS TO CONNECT OFFSHORE SUB-STATIONS TO THE ONSHORE GRID
with the green grid, on land or sea.
7O N E C G
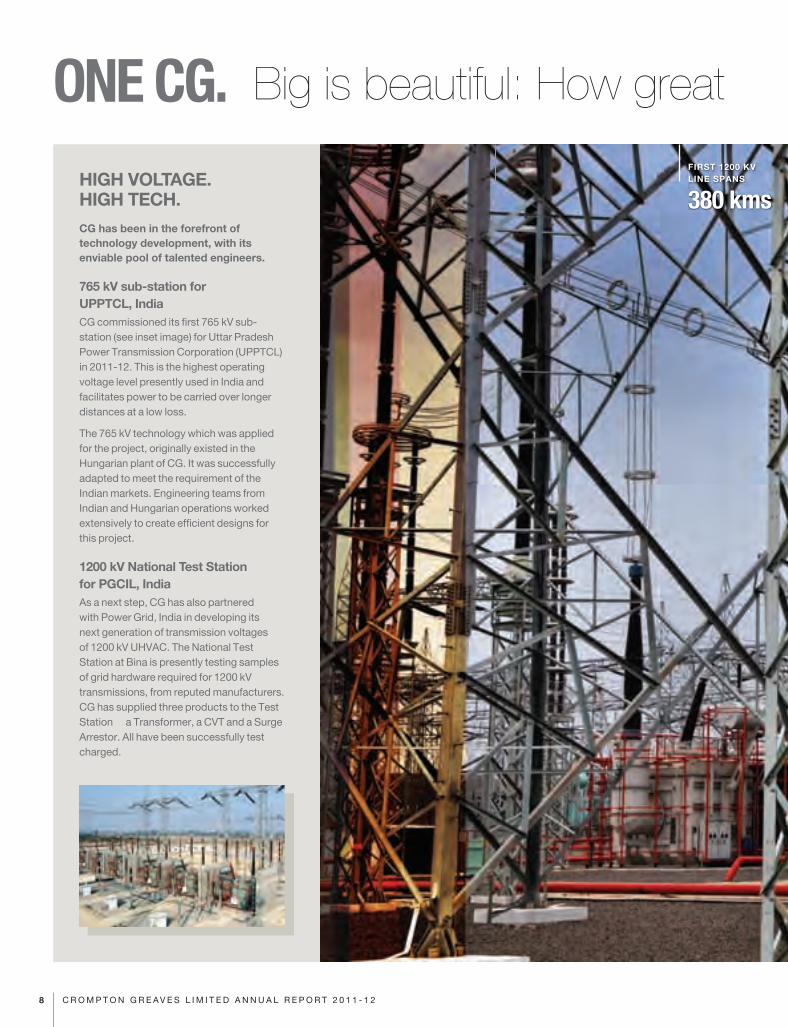
ONE CG.HIGH VOLTAGE. HIGH TECH.CG has been in the forefront of technology development, with its enviable pool of talented engineers.
765 kV sub-station for UPPTCL, IndiaCG commissioned its first 765 kV sub-station (see inset image) for Uttar Pradesh Power Transmission Corporation (UPPTCL) in 2011-12. This is the highest operating voltage level presently used in India and facilitates power to be carried over longer distances at a low loss.
The 765 kV technology which was applied for the project, originally existed in the Hungarian plant of CG. It was successfully adapted to meet the requirement of the Indian markets. Engineering teams from Indian and Hungarian operations worked extensively to create efficient designs for this project.
1200 kV National Test Station for PGCIL, IndiaAs a next step, CG has also partnered with Power Grid, India in developing its next generation of transmission voltages of 1200 kV UHVAC. The National Test Station at Bina is presently testing samples of grid hardware required for 1200 kV transmissions, from reputed manufacturers. CG has supplied three products to the Test StationÑ a Transformer, a CVT and a Surge Arrestor. All have been successfully test charged.
FIRST 1200 KV LINE SPANS
380 kms
Big is beautiful: How great
8 C R O M P T O N G R E A V E S L I M I T E D A N N U A L R E P O R T 2 0 1 1 - 1 2
FIRST 1200 KV LINE SPANS
380 kms
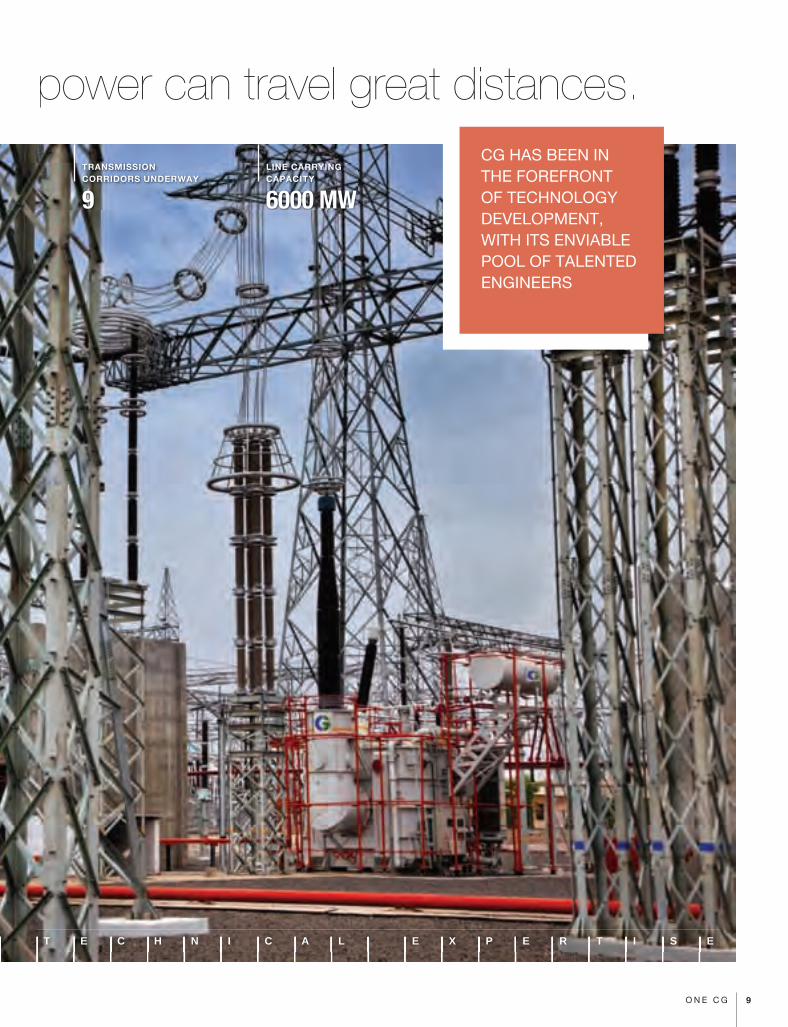
TRANSMISSION CORRIDORS UNDERWAY
9
LINE CARRYING CAPACITY
6000 MW
power can travel great distances.
T E C H N I C A L E X P E R T I S E
CG HAS BEEN IN THE FOREFRONT OF TECHNOLOGY DEVELOPMENT, WITH ITS ENVIABLE POOL OF TALENTED ENGINEERS
9O N E C G
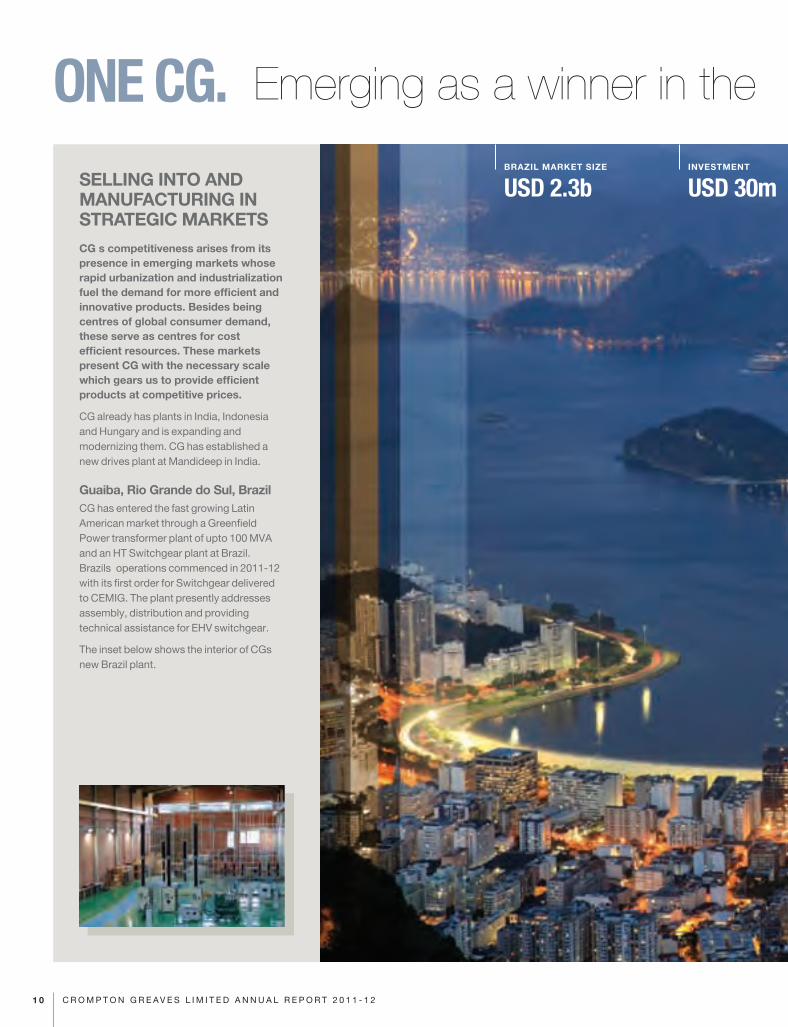
SELLING INTO AND MANUFACTURING IN STRATEGIC MARKETSCGÕ s competitiveness arises from its presence in emerging markets whose rapid urbanization and industrialization fuel the demand for more efficient and innovative products. Besides being centres of global consumer demand, these serve as centres for cost efficient resources. These markets present CG with the necessary scale which gears us to provide efficient products at competitive prices.
CG already has plants in India, Indonesia and Hungary and is expanding and modernizing them. CG has established a new drives plant at Mandideep in India.
Guaiba, Rio Grande do Sul, BrazilCG has entered the fast growing Latin American market through a Greenfield Power transformer plant of upto 100 MVA and an HT Switchgear plant at Brazil. BrazilÕs operations commenced in 2011-12 with its first order for Switchgear delivered to CEMIG. The plant presently addresses assembly, distribution and providing technical assistance for EHV switchgear.
The inset below shows the interior of CGÕs new Brazil plant.
BRAZIL MARKET SIZE
USD 2.3bINVESTMENT
USD 30m
Emerging as a winner in the ONE CG.
1 0 C R O M P T O N G R E A V E S L I M I T E D A N N U A L R E P O R T 2 0 1 1 - 1 2

INVESTMENT
USD 30mPLANT SIZE
27 acresSWITCHGEAR RANGE
275 kV
worldÕ s emerging markets.
E M E R G I N G M A R K E T S
CG ALREADY HAS PLANTS IN INDIA, INDONESIA AND HUNGARY AND IS EXPANDING AND MODERNIZING THEM
1 1O N E C G
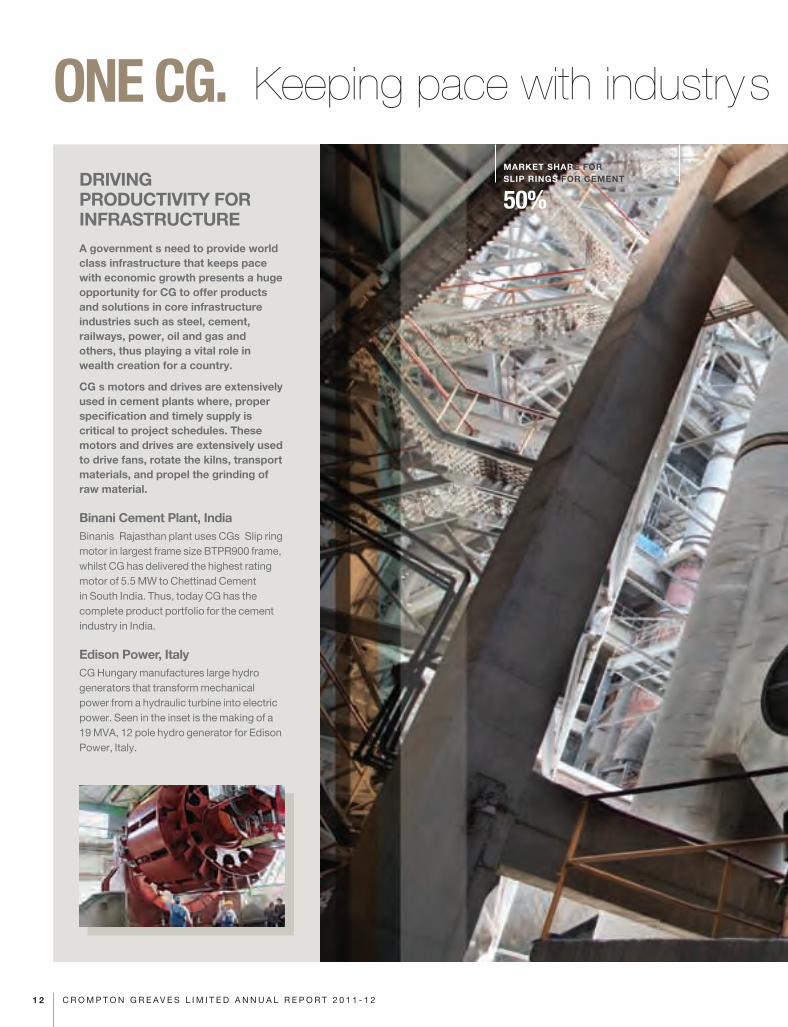
ONE CG.DRIVING PRODUCTIVITY FOR INFRASTRUCTUREA governmentÕ s need to provide world class infrastructure that keeps pace with economic growth presents a huge opportunity for CG to offer products and solutions in core infrastructure industries such as steel, cement, railways, power, oil and gas and others, thus playing a vital role in wealth creation for a country.
CGÕ s motors and drives are extensively used in cement plants where, proper specification and timely supply is critical to project schedules. These motors and drives are extensively used to drive fans, rotate the kilns, transport materials, and propel the grinding of raw material.
Binani Cement Plant, IndiaBinaniÕs Rajasthan plant uses CGÕs Slip ring motor in largest frame size BTPR900 frame, whilst CG has delivered the highest rating motor of 5.5 MW to Chettinad Cement in South India. Thus, today CG has the complete product portfolio for the cement industry in India.
Edison Power, ItalyCG Hungary manufactures large hydro generators that transform mechanical power from a hydraulic turbine into electric power. Seen in the inset is the making of a 19 MVA, 12 pole hydro generator for Edison Power, Italy.
MARKET SHARE FORSLIP RINGS FOR CEMENT
50%
Keeping pace with industryÕ s
1 2 C R O M P T O N G R E A V E S L I M I T E D A N N U A L R E P O R T 2 0 1 1 - 1 2
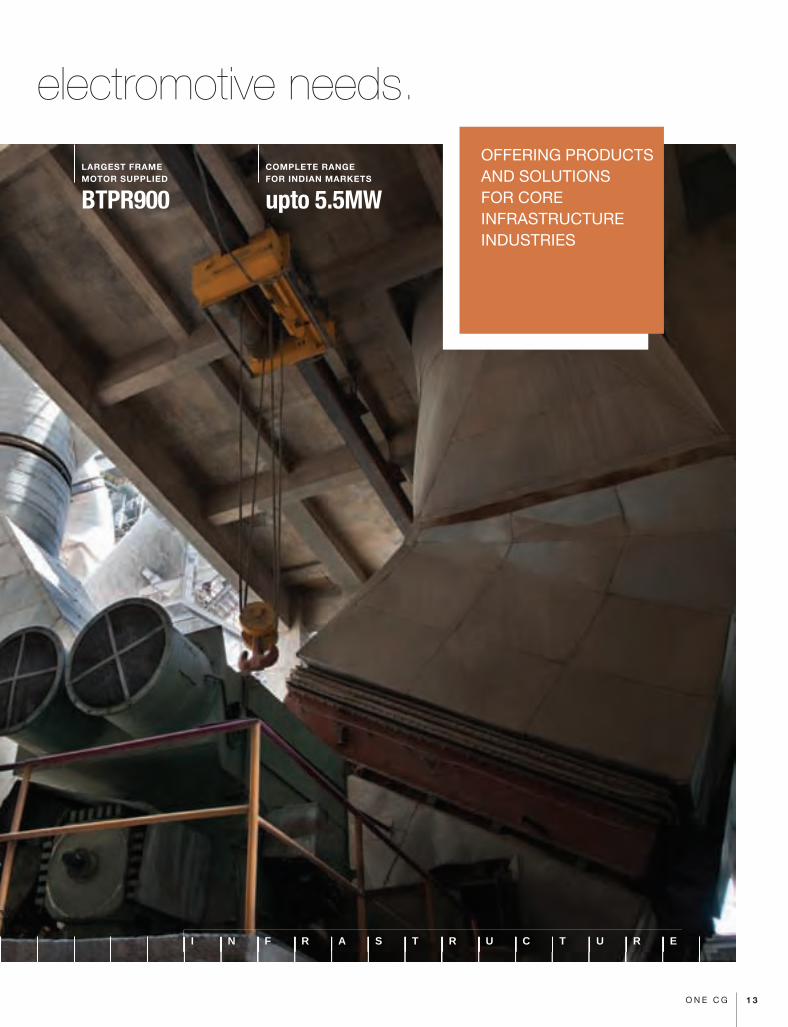
LARGEST FRAME MOTOR SUPPLIED
BTPR900
COMPLETE RANGE FOR INDIAN MARKETS
upto 5.5MW
OFFERING PRODUCTS AND SOLUTIONS FOR CORE INFRASTRUCTURE INDUSTRIES
electromotive needs.
I N F R A S T R U C T U R E
1 3O N E C G
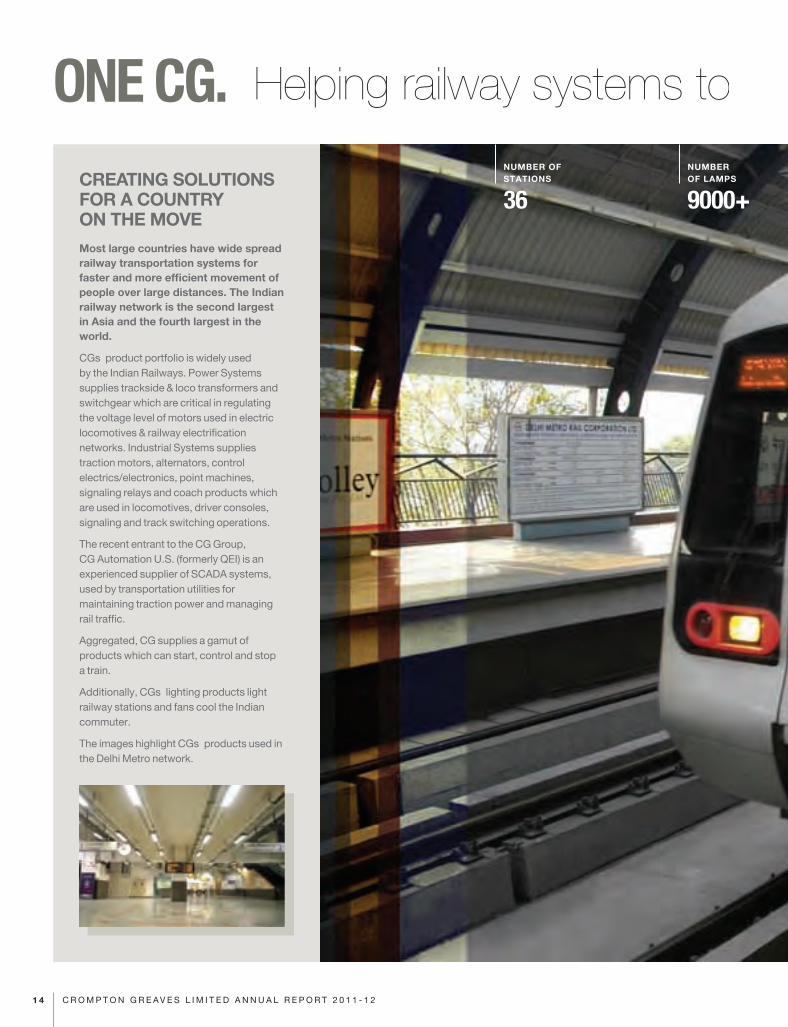
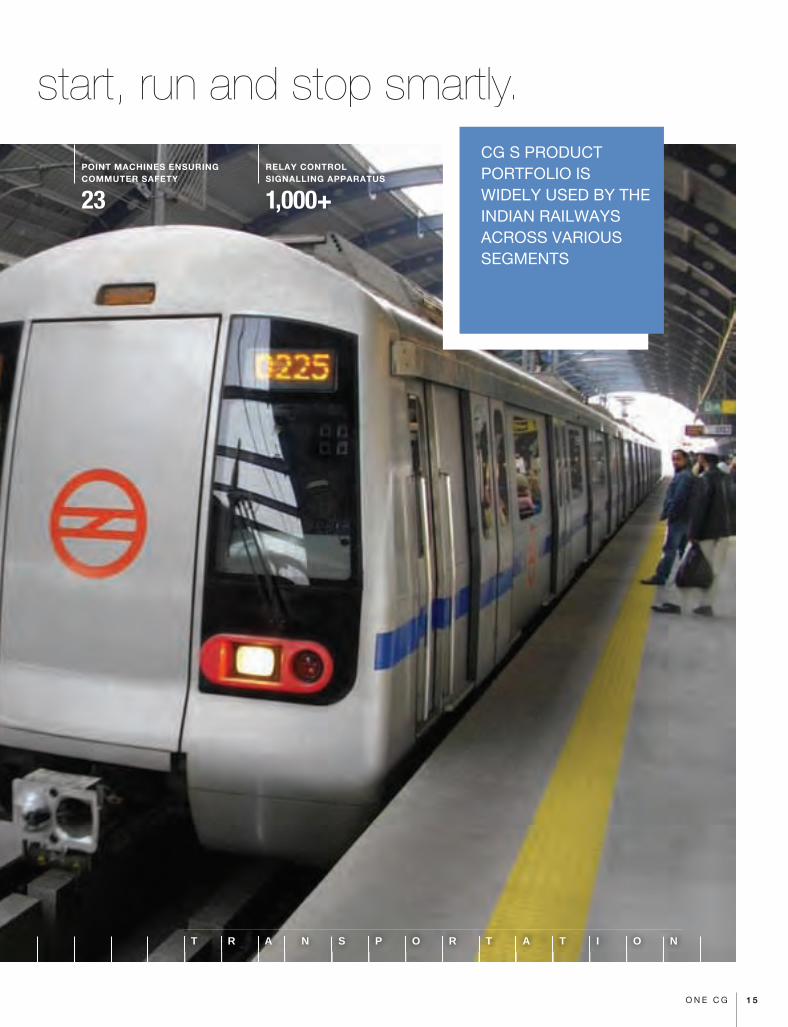
CREATING SOLUTIONS FOR A COUNTRY ON THE MOVEMost large countries have wide spread railway transportation systems for faster and more efficient movement of people over large distances. The Indian railway network is the second largest in Asia and the fourth largest in the world.
CGÕs product portfolio is widely used by the Indian Railways. Power Systems supplies trackside & loco transformers and switchgear which are critical in regulating the voltage level of motors used in electric locomotives & railway electrification networks. Industrial Systems supplies traction motors, alternators, control electrics/electronics, point machines, signaling relays and coach products which are used in locomotives, driver consoles, signaling and track switching operations.
The recent entrant to the CG Group, CG Automation U.S. (formerly QEI) is an experienced supplier of SCADA systems, used by transportation utilities for maintaining traction power and managing rail traffic.
Aggregated, CG supplies a gamut of products which can start, control and stop a train.
Additionally, CGÕs lighting products light railway stations and fans cool the Indian commuter.
The images highlight CGÕs products used in the Delhi Metro network.
ONE CG. Helping railway systems to
NUMBER OF STATIONS
36
NUMBER OF LAMPS
9000+
1 4 C R O M P T O N G R E A V E S L I M I T E D A N N U A L R E P O R T 2 0 1 1 - 1 2
T R A N S P O R T A T I O N
start, run and stop smartly.CGÕ S PRODUCT PORTFOLIO IS WIDELY USED BY THE INDIAN RAILWAYS ACROSS VARIOUS SEGMENTS
NUMBER OF LAMPS
9000+
POINT MACHINES ENSURING COMMUTER SAFETY
23
RELAY CONTROL SIGNALLING APPARATUS
1,000+
1 5O N E C G
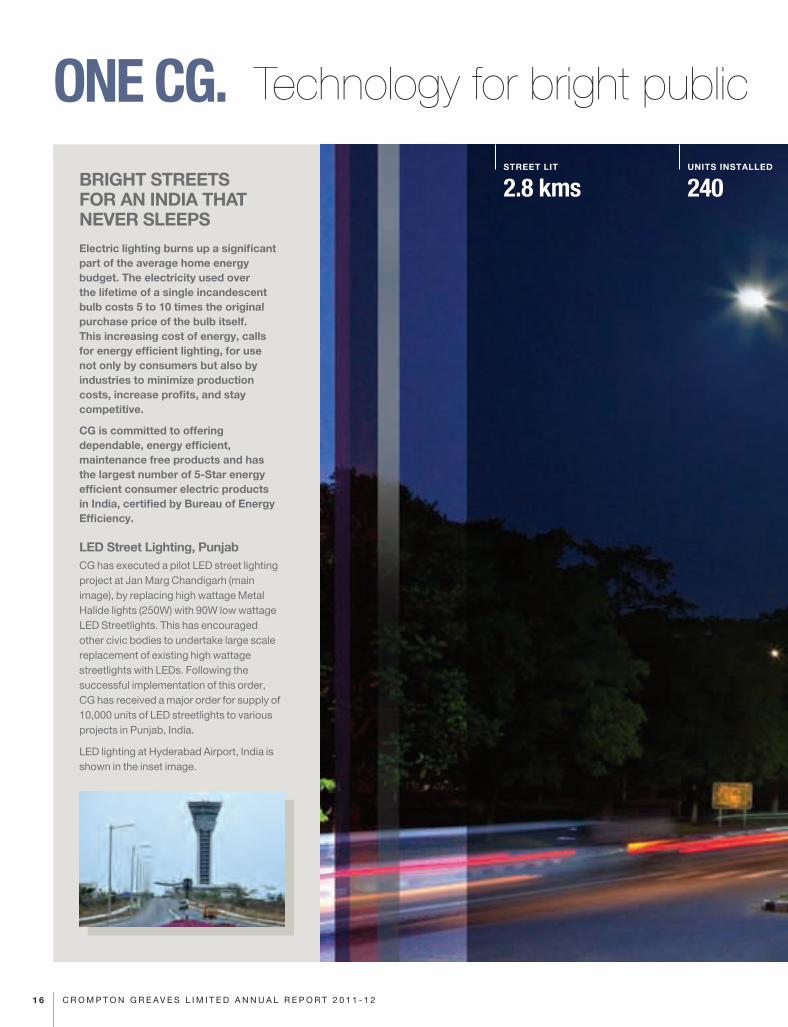
ONE CG.BRIGHT STREETS FOR AN INDIA THAT NEVER SLEEPSElectric lighting burns up a significant part of the average home energy budget. The electricity used over the lifetime of a single incandescent bulb costs 5 to 10 times the original purchase price of the bulb itself. This increasing cost of energy, calls for energy efficient lighting, for use not only by consumers but also by industries to minimize production costs, increase profits, and stay competitive.
CG is committed to offering dependable, energy efficient, maintenance free products and has the largest number of 5-Star energy efficient consumer electric products in India, certified by Bureau of Energy Efficiency.
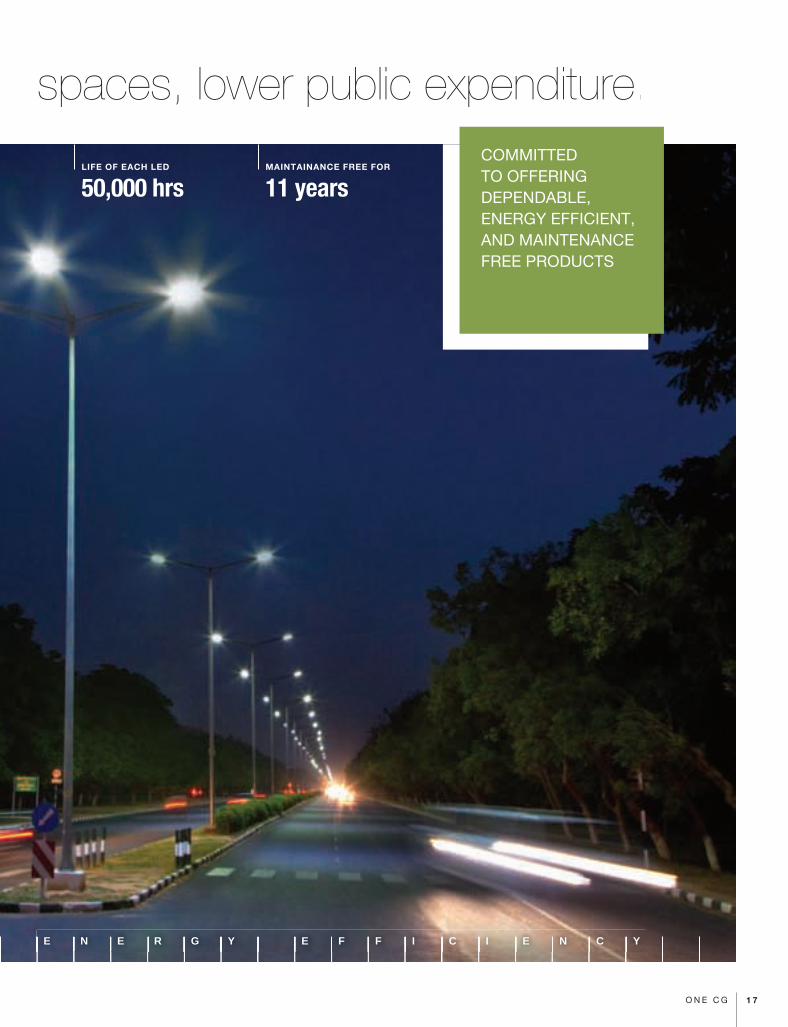
LED Street Lighting, PunjabCG has executed a pilot LED street lighting project at Jan Marg Chandigarh (main image), by replacing high wattage Metal Halide lights (250W) with 90W low wattage LED Streetlights. This has encouraged other civic bodies to undertake large scale replacement of existing high wattage streetlights with LEDs. Following the successful implementation of this order, CG has received a major order for supply of 10,000 units of LED streetlights to various projects in Punjab, India.
LED lighting at Hyderabad Airport, India is shown in the inset image.
STREET LIT
2.8 kmsUNITS INSTALLED
240
Technology for bright public
1 6 C R O M P T O N G R E A V E S L I M I T E D A N N U A L R E P O R T 2 0 1 1 - 1 2
E N E R G Y E F F I C I E N C Y
UNITS INSTALLED
240LIFE OF EACH LED
50,000 hrs MAINTAINANCE FREE FOR
11 years
spaces, lower public expenditure.COMMITTED TO OFFERING DEPENDABLE, ENERGY EFFICIENT, AND MAINTENANCE FREE PRODUCTS
1 7O N E C G
Corporate Information
BOARD OF DIRECTORS
CHAIRMAN
G Thapar
VICE CHAIRMAN
SM Trehan
CEO & MANAGING DIRECTOR
L Demortier
NON-EXECUTIVE & INDEPENDENT
S Bayman M Pudumjee
O Goswami SP Talwar
S Labroo V von Massow
S Prabhu
AUDITORS
Sharp & Tannan
SOLICITORS
Crawford Bayley & Co
CHIEF FINANCIAL OFFICER
M Acharya
COMPANY SECRETARY
W Henriques
BANKERS
Union Bank of India
IDBI Bank Ltd
State Bank of India
ICICI Bank Ltd
Corporation Bank
The Royal Bank of Scotland NV
Canara Bank
Standard Chartered Bank
Bank of Maharashtra
Credit Agricole CIB
Yes Bank Ltd.
REGISTERED OFFICE
6th Floor, CG House,
Dr. Annie Besant Road,
Worli,
Mumbai 400 030
1 8 C R O M P T O N G R E A V E S L I M I T E D A N N U A L R E P O R T 2 0 1 1 - 1 2
Mr Gautam Thapar (left) with Mr L Demortier
1 9C O R P O R AT E I N F O R M AT I O N
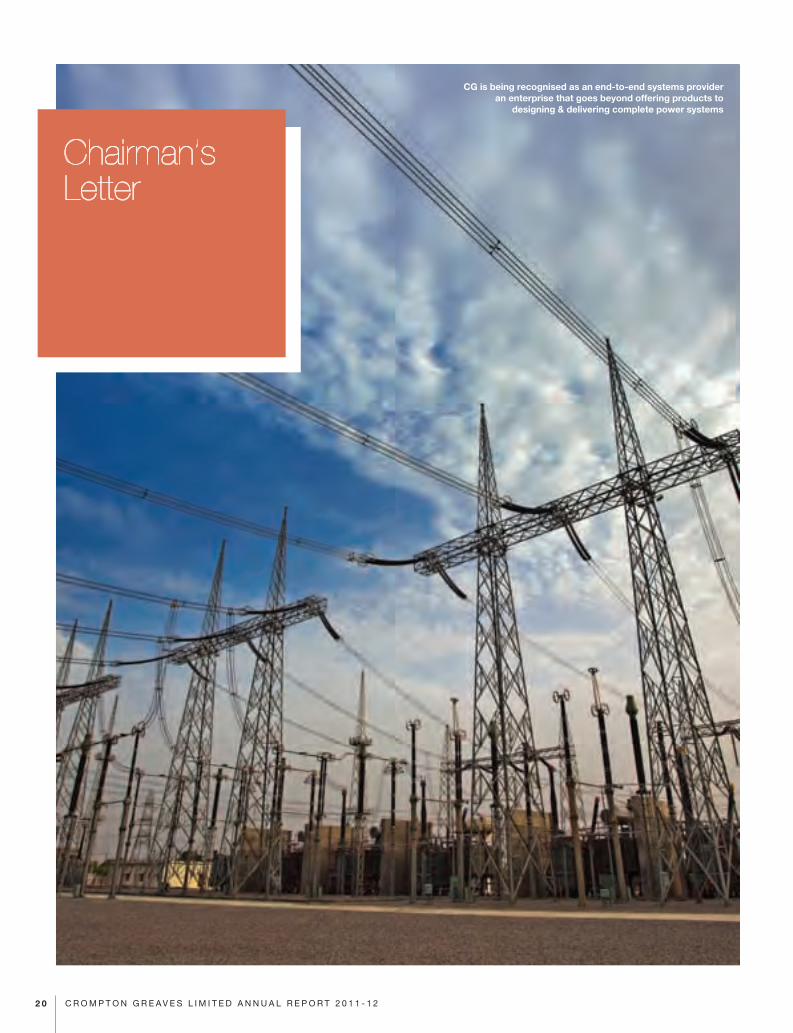
CG is being recognised as an end-to-end systems provider Ñ an enterprise that goes beyond offering products to
designing & delivering complete power systems
ChairmanÕ s Letter
2 0 C R O M P T O N G R E A V E S L I M I T E D A N N U A L R E P O R T 2 0 1 1 - 1 2
The history of all growing global corporations is replete with instances when events have required a strategic change of gear. FY2012 was such a time for your Company. After a decade of rapidly growing revenues, EBIDTA, EBIT and PAT that made Crompton Greaves the cynosure of many eyes, there was a sudden break in the momentum. Why did this happen? And, more importantly, where do we go from here?
Before I answer these questions, let me share
some facts. Despite the slowdown in growth
and profits, your Company’s consolidated
net sales and income from services grew by
over 12% to Rs.11,249 crore in FY2012, or
over US$ 2.3 billion. The unexecuted order
book as on 31 March 2012 was up by 16.7%
and stood at Rs.8,368 crore. Crompton
Greaves still earned EBIDTA of Rs.856
crore in FY2012; PBT of Rs.550 crore; and
PAT of Rs.374 crore. Despite the return on
capital employed (ROCE) being less than
in the past, the fact is that your Company’s
ROCE remains in the top quartile among
comparable players in India and the rest of
the world.
So, what Crompton Greaves witnessed in
FY2012 was a brake. It was not a dramatic
decline to negative territory.
To return to my first question: why did it
happen? The reduction in profitability was
mostly on account of CG Power Systems. It
occurred due to four factors.
First, intensified global competition. In
the last eighteen months, power equipment
prices came under severe pressure
with many Chinese and South Korean
manufacturers attempting to increase
capacity utilisation by offering rock-bottom
quotes to major global customers. The good
news is that such intense competition may
have passed. Buyers have understood which
players can deliver quality, and those who
cannot.
Equally, it is important to note that no
power equipment manufacturer or solutions
provider will enjoy the kind of prices and
margins that were the norm for half a decade
leading up to FY2010. Companies will have
to be more productive and competitive; and
focus on bundling equipment as a part of
selling end-to-end solutions. Your Company
is no exception to this reality.
Second, increasing raw material costs,
which rose at rates much higher than
finished goods prices, especially for copper
and steel. Consequently, all companies
witnessed increases in their material-to-
sales ratio (MSR). As I write, it looks as if the
growth in MSR has played out, and there are
beginnings of a moderate decline in the ratio.
Third, many power transmission and
distribution customers were not taking
delivery of their transformers or sub-stations,
usually on account of uncertainties and also
cash problems. This was particularly true in
Europe and North America. It blocked scarce
factory space, did not allow for revenue
recognition, and extended the working
capital cycle, with its attendant costs.
Fourth, CG Power had certain internal
issues regarding work flow at some of its
facilities. From the last quarter of FY2011
and through the first three quarters of
FY2012, these led to blocking of lines and
higher costsÑ which affected EBIDTA. The
problems have been identified and will be
solved in FY2013.
Despite these constraints, there were many
successes. Let me highlight a few for the
power business, which accounted for 65% of
your Company’s consolidated top line.
� In FY2012, CG Power India’s plant
at Mandideep, near Bhopal delivered
to the Power Grid Corporation of India
Limited (PGCIL) (i) three 765 kV 500 MVA
transformers; (ii) 30 units of 80 MVAr 765 kV
shunt reactors; and (iii) two 110 MVAr 765 kV
shunt reactors. During the year, for the
765 kV category, PGCIL alone has given
orders to CG Power India for 28 units of 500
MVA 765 kV power transformers, and 10
units of 80 MVAr 765 kV shunt reactors.
� The switchgear division of CG Power India
successfully test charged the first 1200 kV
capacitive voltage transformer (CVT) for
PGCIL at Bina, Madhya Pradesh; and it
successfully erected and tested the first
1200 kV surge arrester, also at Bina.
� Six 765 kV power transformers
manufactured by PT-Hungary, CG’s power
transformer facility at Tapioszele, are now
operational at different sites.
2 1C H A I R M A N ' S L E T T E R
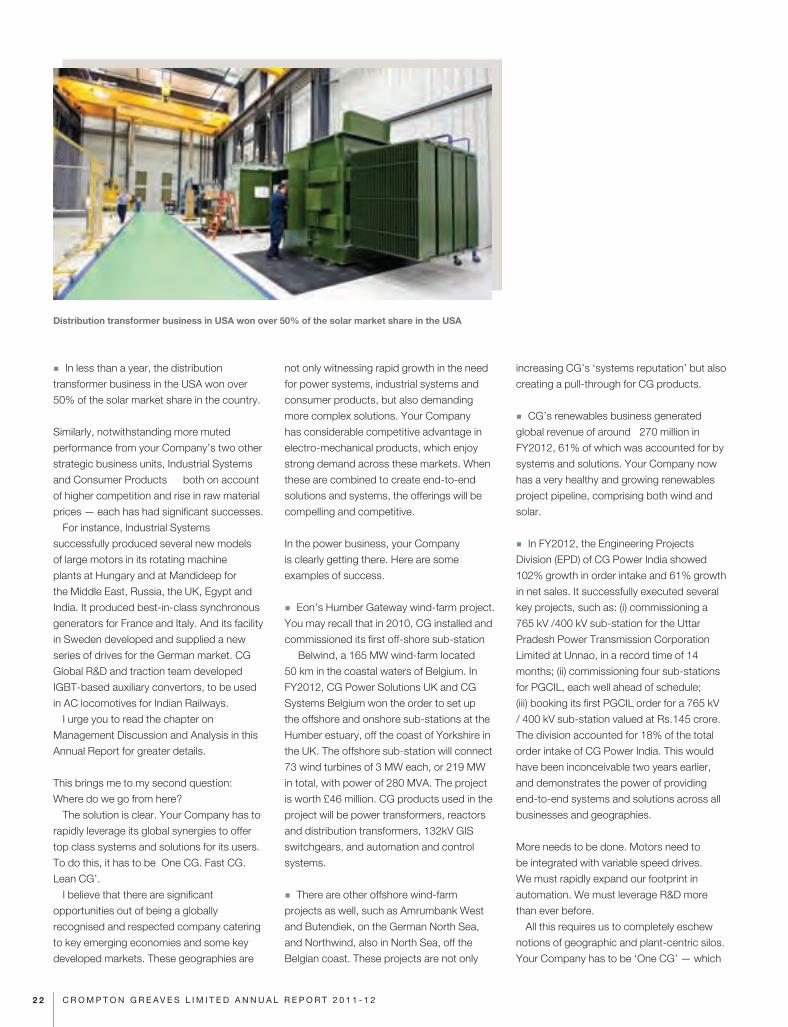
� In less than a year, the distribution
transformer business in the USA won over
50% of the solar market share in the country.
Similarly, notwithstanding more muted
performance from your Company’s two other
strategic business units, Industrial Systems
and Consumer Products Ñ both on account
of higher competition and rise in raw material
prices — each has had significant successes.
For instance, Industrial Systems
successfully produced several new models
of large motors in its rotating machine
plants at Hungary and at Mandideep for
the Middle East, Russia, the UK, Egypt and
India. It produced best-in-class synchronous
generators for France and Italy. And its facility
in Sweden developed and supplied a new
series of drives for the German market. CG
Global R&D and traction team developed
IGBT-based auxiliary convertors, to be used
in AC locomotives for Indian Railways.
I urge you to read the chapter on
Management Discussion and Analysis in this
Annual Report for greater details.
This brings me to my second question:
Where do we go from here?
The solution is clear. Your Company has to
rapidly leverage its global synergies to offer
top class systems and solutions for its users.
To do this, it has to be Ô One CG. Fast CG.
Lean CG’.
I believe that there are significant
opportunities out of being a globally
recognised and respected company catering
to key emerging economies and some key
developed markets. These geographies are
not only witnessing rapid growth in the need
for power systems, industrial systems and
consumer products, but also demanding
more complex solutions. Your Company
has considerable competitive advantage in
electro-mechanical products, which enjoy
strong demand across these markets. When
these are combined to create end-to-end
solutions and systems, the offerings will be
compelling and competitive.
In the power business, your Company
is clearly getting there. Here are some
examples of success.
� Eon’s Humber Gateway wind-farm project.
You may recall that in 2010, CG installed and
commissioned its first off-shore sub-station
Ñ Belwind, a 165 MW wind-farm located
50 km in the coastal waters of Belgium. In
FY2012, CG Power Solutions UK and CG
Systems Belgium won the order to set up
the offshore and onshore sub-stations at the
Humber estuary, off the coast of Yorkshire in
the UK. The offshore sub-station will connect
73 wind turbines of 3 MW each, or 219 MW
in total, with power of 280 MVA. The project
is worth £46 million. CG products used in the
project will be power transformers, reactors
and distribution transformers, 132kV GIS
switchgears, and automation and control
systems.
� There are other offshore wind-farm
projects as well, such as Amrumbank West
and Butendiek, on the German North Sea,
and Northwind, also in North Sea, off the
Belgian coast. These projects are not only
increasing CG’s ‘systems reputation’ but also
creating a pull-through for CG products.
� CG’s renewables business generated
global revenue of around Û 270 million in
FY2012, 61% of which was accounted for by
systems and solutions. Your Company now
has a very healthy and growing renewables
project pipeline, comprising both wind and
solar.
� In FY2012, the Engineering Projects
Division (EPD) of CG Power India showed
102% growth in order intake and 61% growth
in net sales. It successfully executed several
key projects, such as: (i) commissioning a
765 kV /400 kV sub-station for the Uttar
Pradesh Power Transmission Corporation
Limited at Unnao, in a record time of 14
months; (ii) commissioning four sub-stations
for PGCIL, each well ahead of schedule;
(iii) booking its first PGCIL order for a 765 kV
/ 400 kV sub-station valued at Rs.145 crore.
The division accounted for 18% of the total
order intake of CG Power India. This would
have been inconceivable two years earlier,
and demonstrates the power of providing
end-to-end systems and solutions across all
businesses and geographies.
More needs to be done. Motors need to
be integrated with variable speed drives.
We must rapidly expand our footprint in
automation. We must leverage R&D more
than ever before.
All this requires us to completely eschew
notions of geographic and plant-centric silos.
Your Company has to be ‘One CG’ — which
Distribution transformer business in USA won over 50% of the solar market share in the USA
2 2 C R O M P T O N G R E A V E S L I M I T E D A N N U A L R E P O R T 2 0 1 1 - 1 2
leverages the right resources and the right
skills to produce the best possible product
or solution for selling anywhere. The DNA
of selling must be one where the customers
come first; not where the factory is.
Your Company has to be a ‘Fast CG’.
Businesses come from geographic regions.
Therefore, your Company has been
restructured according to six areas: South
East Asia, India, Middle East and Africa,
Europe and Russia, North America and Latin
America. Businesses come from different
sectors. Consequently, CG is also being
organised along clearly defined business
verticals such as renewables, oil and gas and
mining, both within and across the SBUs.
‘Fast CG’ requires your Company to react
very quickly to the business opportunities
— be these geographic or sector-specific —
and allocate the task of execution to the team
or plant that can best do it, and as quickly as
it can.
‘Lean CG’ requires global best practices in
sourcing; outstanding shop-floor capabilities
and processes; significant increases in
manufacturing efficiency and throughput;
plus substantial improvements in key
capacities, whether these be through new
greenfield facilities or via acquisitions.
Have we got there yet? The answer is ‘No’.
But I am convinced, along with your Board
of Directors and your Company’s senior
management team, that no effort will be
spared to create a well oiled customer-
delighting CG Ñ one that supplies solutions,
systems and products in a seamlessly unified
manner across the globe. The change has
already begun. It will take some time but we
will get there.
Why am I so hopeful? Because I have
closely seen the sea changes that have
occurred within your Company even in the
last decade Ñ when it transformed from
being a largely India-oriented player to Indian
corporation with an international business.
We now need to make the full transition to
being a global corporation, that is respected
by its customers and peers. I have witnessed
what your Company’s employees are
capable of delivering. I have seen how they
can collaborate and innovate to produce
successes. And I have seen their pride and
hunger for winning. So, I have little doubt that
we will be able to successfully execute Ô One
CG. Fast CG. Lean CG’.
While FY 2012 was a difficult year, the re-
modelling has begun. Bear with CG, because
the platform for creating a global enterprise
has commenced. One that will make all of us
prouder than ever before.
Thank you all for your support.
Yours,
Gautam ThaparChairman
CG has to rapidly leverage its global synergies to offer top class systems and solutions for its users. To do this, it has to be Ô One CG. Fast CG. Lean CGÕ
2 3C H A I R M A N ' S L E T T E R
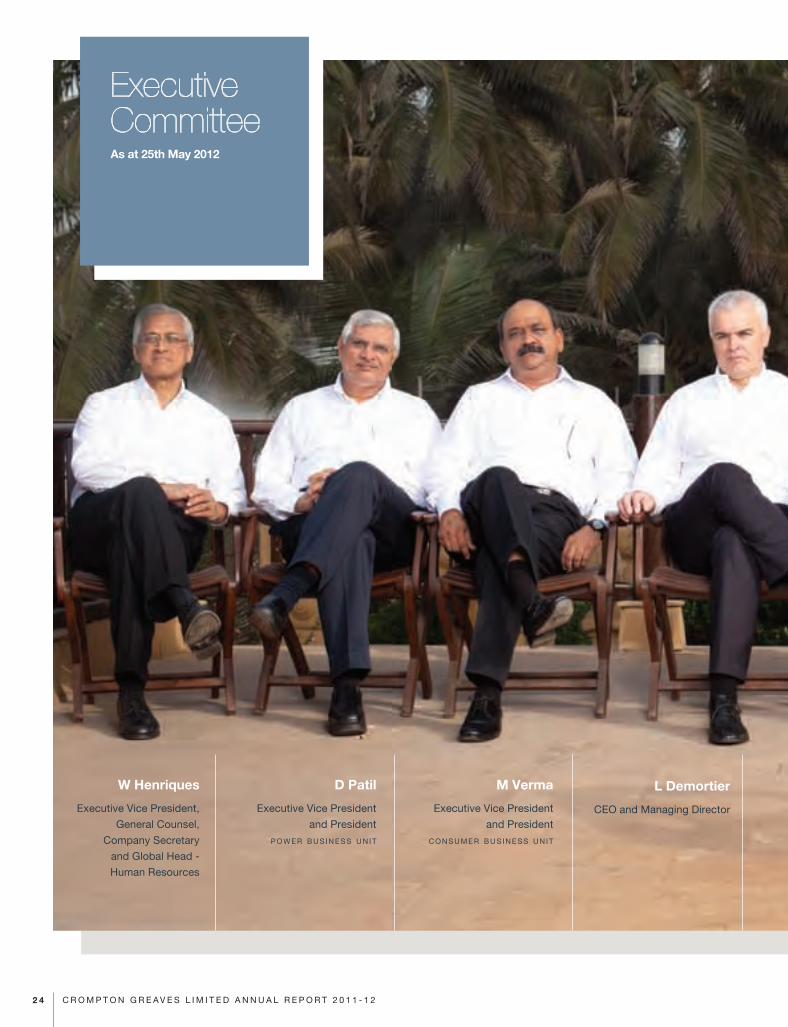
Executive CommitteeAs at 25th May 2012
W Henriques
Executive Vice President,
General Counsel,
Company Secretary
and Global Head -
Human Resources
D Patil
Executive Vice President
and President
p o w e r b u s i n e s s u n i t
M Verma
Executive Vice President
and President
c o n s u m e r b u s i n e s s u n i t
L Demortier
CEO and Managing Director
2 4 C R O M P T O N G R E A V E S L I M I T E D A N N U A L R E P O R T 2 0 1 1 - 1 2
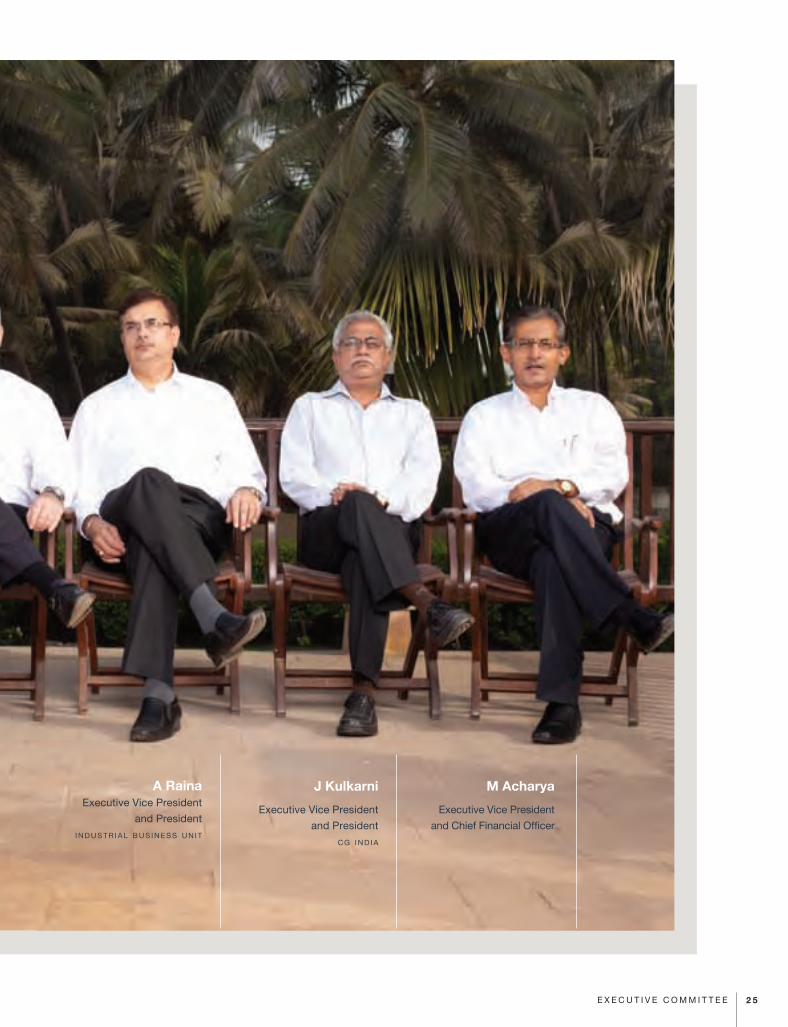
A RainaExecutive Vice President
and President
i n d u s t r i a l b u s i n e s s u n i t
J Kulkarni
Executive Vice President
and President
c g i n d i a
M Acharya
Executive Vice President
and Chief Financial Officer
2 5E X E C U T I V E C O M M I T T E E
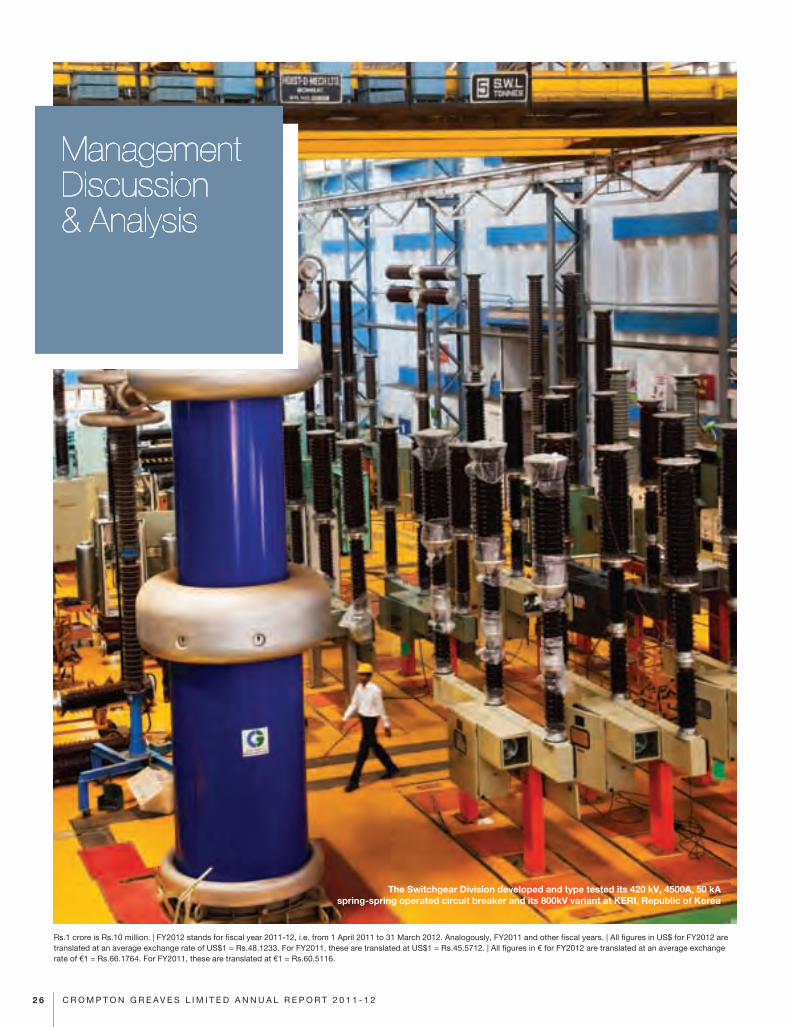
The Switchgear Division developed and type tested its 420 kV, 4500A, 50 kA spring-spring operated circuit breaker and its 800kV variant at KERI, Republic of Korea
Management Discussion & Analysis
Rs.1 crore is Rs.10 million. | FY2012 stands for fiscal year 2011-12, i.e. from 1 April 2011 to 31 March 2012. Analogously, FY2011 and other fiscal years. | All figures in US$ for FY2012 are translated at an average exchange rate of US$1 = Rs.48.1233. For FY2011, these are translated at US$1 = Rs.45.5712. | All figures in € for FY2012 are translated at an average exchange rate of €1 = Rs.66.1764. For FY2011, these are translated at €1 = Rs.60.5116.
2 6 C R O M P T O N G R E A V E S L I M I T E D A N N U A L R E P O R T 2 0 1 1 - 1 2
With a global turnover in FY2012 of over US$ 2.4 billion, Crompton Greaves Limited (Ô CGÕ or Ô the CompanyÕ ) has manufacturing, solutions and services facilities in Belgium, Brazil, Canada, Hungary, Indonesia, Ireland, France, the UK, the USA, Saudi Arabia, Sweden, in addition to over 14 manufacturing and design locations in India. Employing approximately 9,000 people from different nations across the world, CG is a multinational, multi-product, multi-solutions and multi-services company. Though diversified and differentiated, the Company is bound by the objective of ‘One CG’ — a unified entity offering solutions, products and services to create customer delight though best-in-class global excellence.
CG has three major businesses: Power
Systems, Industrial Systems and Consumer
Products.
Power Systems � At Rs.7,315 crore in FY2012, power
systems accounted for 65% of CG’s
consolidated net revenues.
� It has overseas facilities at Mechelen
and Charleroi (Belgium), Rio Grande do Sul
(Brazil), St. Leonard (France), Cavan and
Dublin (Ireland), Tapioszele (Hungary), Jarrow
and Stockport (UK), Winnipeg (Canada),
Washington (Missouri, USA), Springfield (New
Jersey, USA), Albany, Arizona, Connecticut,
Florida, Idaho, Maryland, Pennsylvania, Rhode
Island and Texas (USA), Saudi Arabia and
Bogor (Indonesia).
� Has Indian facilities at Kanjur Marg
(Mumbai), Malanpur and Mandideep
(Madhya Pradesh), Nashik and Aurangabad
(Maharashtra), Bangalore (Karnataka) and
Gurgaon (Haryana).
Industrial Systems � Net revenue in FY2012 was Rs.1,820 crore,
or 16% of CG’s consolidated top-line.
� Has facilities at Tapioszele (Hungary),
Helsingborg (Sweden), Mandideep and
Pithampur (Madhya Pradesh), Kanjur Marg
(Mumbai, Maharashtra), Ahmednagar
(Maharashtra) and Colvale and Kundaim (Goa).
Consumer Products � Earned net revenue of Rs.2,134 crore in
FY2012, and accounted for 19% of CG’s
consolidated net revenue.
� Has facilities at Bethora and Kundaim
(Goa), Baddi (Himachal Pradesh), Kanjur
Marg (Mumbai), Ahmednagar (Maharashtra),
and Vadodara (Gujarat).
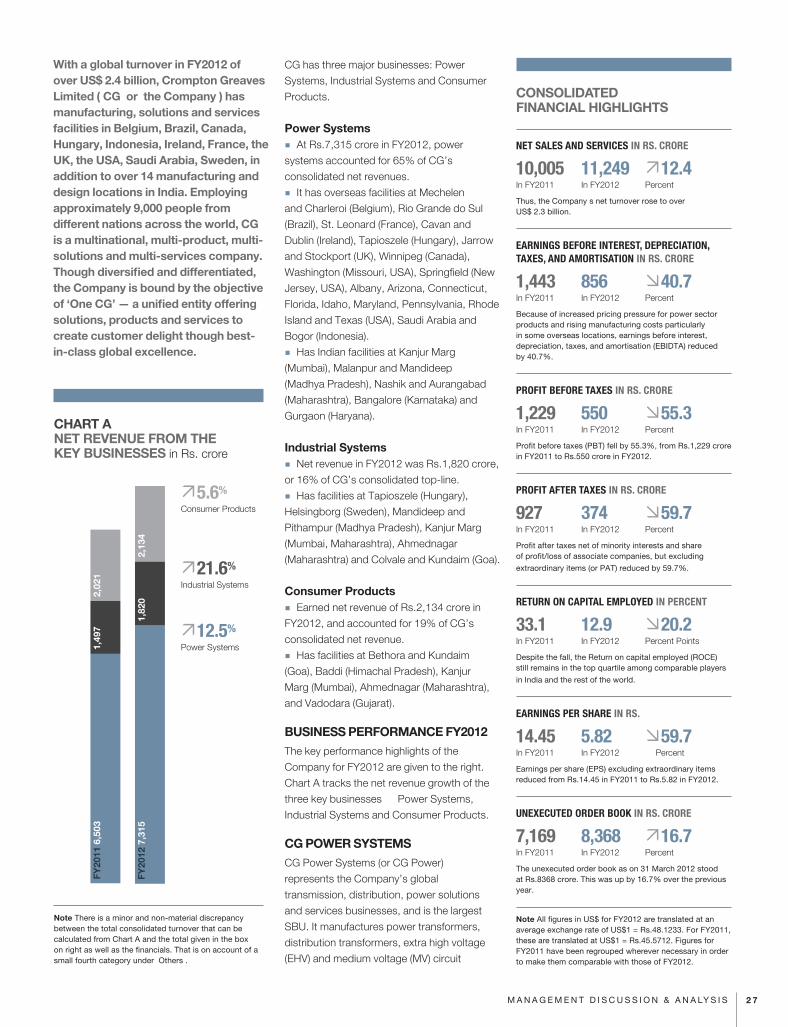
BUSINESS PERFORMANCE FY2012 The key performance highlights of the
Company for FY2012 are given to the right.
Chart A tracks the net revenue growth of the
three key businesses Ñ Power Systems,
Industrial Systems and Consumer Products.
CG POWER SYSTEMSCG Power Systems (or CG Power)
represents the Company’s global
transmission, distribution, power solutions
and services businesses, and is the largest
SBU. It manufactures power transformers,
distribution transformers, extra high voltage
(EHV) and medium voltage (MV) circuit
CONSOLIDATED FINANCIAL HIGHLIGHTS
NET SALES AND SERVICES IN RS. CRORE
10,005 11,249 12.4In FY2011 In FY2012 Percent
Thus, the CompanyÕ s net turnover rose to over US$ 2.3 billion.
EARNINGS BEFORE INTEREST, DEPRECIATION, TAXES, AND AMORTISATION IN RS. CRORE
1,443 856 40.7In FY2011 In FY2012 Percent
Because of increased pricing pressure for power sector products and rising manufacturing costs particularly in some overseas locations, earnings before interest, depreciation, taxes, and amortisation (EBIDTA) reduced by 40.7%.
PROFIT BEFORE TAXES IN RS. CRORE
1,229 550 55.3In FY2011 In FY2012 Percent
Profit before taxes (PBT) fell by 55.3%, from Rs.1,229 crore in FY2011 to Rs.550 crore in FY2012.
PROFIT AFTER TAXES IN RS. CRORE
927 374 59.7In FY2011 In FY2012 Percent
Profit after taxes net of minority interests and share of profit/loss of associate companies, but excluding
extraordinary items (or PAT) reduced by 59.7%.
RETURN ON CAPITAL EMPLOYED IN PERCENT
33.1 12.9 20.2In FY2011 In FY2012 Percent Points
Despite the fall, the Return on capital employed (ROCE) still remains in the top quartile among comparable players
in India and the rest of the world.
EARNINGS PER SHARE IN RS.
14.45 5.82 59.7In FY2011 In FY2012 Percent
Earnings per share (EPS) excluding extraordinary items reduced from Rs.14.45 in FY2011 to Rs.5.82 in FY2012.
UNEXECUTED ORDER BOOK IN RS. CRORE
7,169 8,368 16.7In FY2011 In FY2012 Percent
The unexecuted order book as on 31 March 2012 stood at Rs.8368 crore. This was up by 16.7% over the previous year.
Note All figures in US$ for FY2012 are translated at an average exchange rate of US$1 = Rs.48.1233. For FY2011, these are translated at US$1 = Rs.45.5712. Figures for FY2011 have been regrouped wherever necessary in order to make them comparable with those of FY2012.
CHART A NET REVENUE FROM THE KEY BUSINESSES in Rs. crore
Note There is a minor and non-material discrepancy between the total consolidated turnover that can be calculated from Chart A and the total given in the box on right as well as the financials. That is on account of a small fourth category under Ô OthersÕ .
5.6%
Consumer Products
21.6%
Industrial Systems
12.5%
Power Systems
FY20
11 6
,503
1,49
72,
021
FY20
12 7
,315
1,82
02,
134
2 7M A N A G E M E N T D I S C U S S I O N & A N A LY S I S
breakers, switchgears, EHV instrument
transformers, lightning arrestors, isolators
and vacuum interrupters. It provides turnkey
solutions for transmission and distribution
(T&D) through custom-made sub-station
projects, engineering, procurement
and construction (EPC) as well as other
integrated end-to-end contracts that involve
solutions, design, products, procurement,
construction, erection and servicing. CG
Power’s facilities abroad and in India have
been listed earlier; a more detailed listing is
found at the end of this annual report.
Consolidated Financial PerformanceThe key consolidated performance of CG
Power is given in Table 1. As the table shows,
while the SBU benefited from a healthy
growth in net sales and a significant increase
in the unexecuted order book (UEOB), its
profitability was affected in FY2012. The
reasons are given later in the chapter.
� Net sales of CG Power grew by 12.5% to Rs.7,315 crore in FY2012.
� EBIDTA fell by 57.3% to Rs.401 crore in FY2012, and EBIT by 70.3% to Rs.239 crore.
� There was a 19% increase in capital employed to Rs.2,569 crore. This was mostly due to additional investments, as well as some key customers not taking delivery of successfully tested orders on due dates, which tied up working capital.
� As on 31 March 2012, the UEOB was up by 19.3% to Rs.7,832 crore.
CG Power Overseas: Financial PerformanceThe financial performance of the CG Power
Overseas is given in Table 2.
CG Power India: Financial PerformanceTable 3 gives the key financial performance
indicators for FY2011 and FY2012.
As Tables 2 and 3 indicate, despite double-
digit growth in the top-line Ñ a creditable
achievement given the difficult global
economic scenario Ñ both the overseas
and India-based CG Power businesses have
been affected by lower profits. There are four
reasons for this which need explaining. Three
of these are external to the Company, and
one is internal.
� First, the markets in FY2012 were more
competitive than ever before. Prices came
under pressure because of competition
from some Chinese and South Korean
manufacturers who were eager to increase
the line-utilisations by offering rock-bottom
prices to the major global buyers of T&D
equipment. All T&D suppliers had to respond
to the lower prices, if only to maintain their
market shares. CG was no exception. The
positive news is that the period of intense
competition, which began in FY2011
and continued through much of FY2012,
seems to be a thing of the past. Buyers
have understood which global players can
deliver quality Ñ on-time and without re-
work. Prices have begun to gradually firm
up. Having said that, it is unlikely that any
supplier can get the prices and margins that
were readily available up for a four to five
TABLE 1 CONSOLIDATED FINANCIAL PERFORMANCE, CG POWERYear ended 31 March
NET SALES IN RS. CRORE
6,503 7,315 12.5In FY2011 In FY2012 Percent
EBIDTA IN RS. CRORE
937 401 57.3In FY2011 In FY2012 Percent
EBIT IN RS. CRORE
807 239 70.3In FY2011 In FY2012 Percent
CAPITAL EMPLOYED IN RS. CRORE
2,159 2,569 19.0In FY2011 In FY2012 Percent
ROCE IN PERCENT
37.4% 9.3% 28.1In FY2011 In FY2012 Percent points
UNEXECUTED ORDER BOOK IN RS. CRORE
6,565 7,832 19.3In FY2011 In FY2012 Percent
Note Figures have been re-grouped wherever necessary to make them comparable
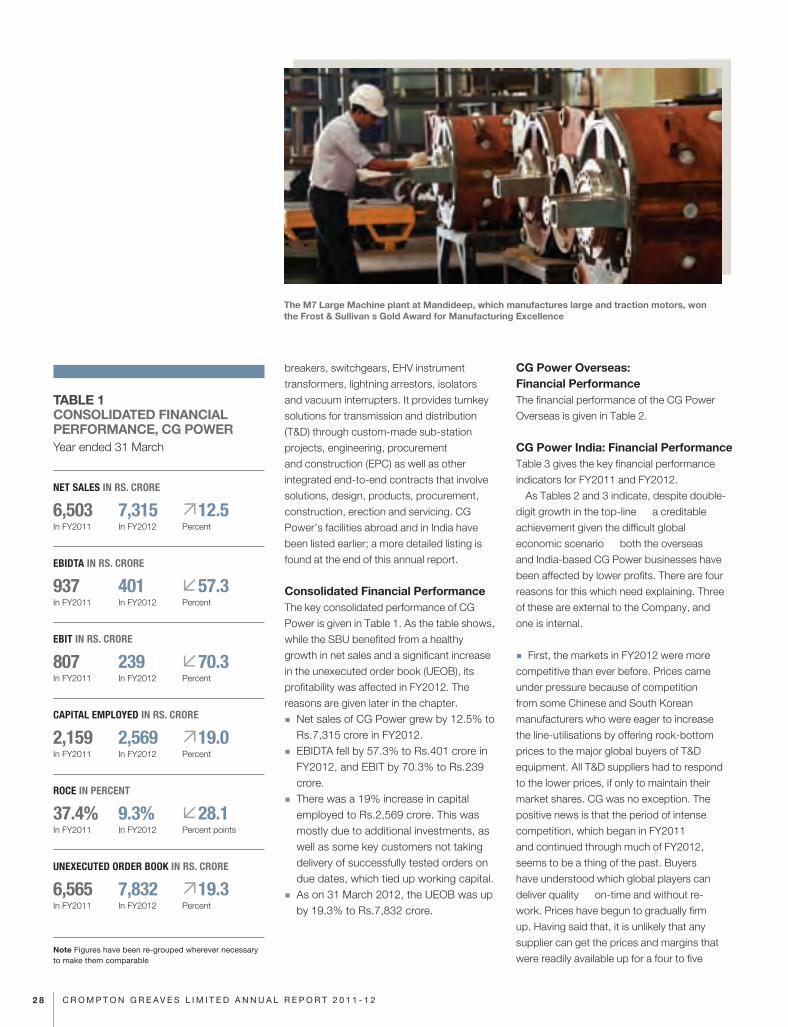
The M7 Large Machine plant at Mandideep, which manufactures large and traction motors, won the Frost & SullivanÕ s Gold Award for Manufacturing Excellence
2 8 C R O M P T O N G R E A V E S L I M I T E D A N N U A L R E P O R T 2 0 1 1 - 1 2
year period upto FY2010. Every player in
the space will need to be more productive;
more competitive; and learn how to bundle
attractive solutions instead of selling discrete
equipment.
� Second, from FY2011 right up to the third
quarter of FY2012, raw material costs rose
at rates much higher than finished goods
prices. This was especially true of copper
and steel. Consequently, all companies in
the power T&D business Ñ barring perhaps
the Chinese, for whom no authentic cost
data are available Ñ witnessed steady, often
sharp, increases in the value of their material-
to-sales ratio (MSR). CG Power was no
exception. Thankfully, the growth in MSR has
plateaued out with there being a line of sight
of a slow decline in the ratio in the coming
future. Thus, it is hoped that the pincer of
falling product prices and higher MSR will be
a thing of the past.
� Third, many T&D customers all over the
world are not taking physical delivery of their
transformers or sub-stations. They have had
either cash problems or other operational
issues. The typical method is to push back
the date of testing at the bay, which blocks
scarce factory space, does not allow revenue
recognition, and extends the working capital
cycle. Given the importance of many of the
key customers, the suppliers acquiesce Ñ to
the detriment of profits.
� Fourth, CG Power had certain internal
issues regarding test-bed problems and
re-work at some of its facilities in India and
abroad, which have been identified and will
be solved in FY2013. However, it is a fact
that from the last quarter of FY2011 and
through the first three quarters of FY2012,
these led to blocking up of lines as well as
higher cost of time and material in re-work
and re-testing Ñ which affected EBIDTA.
CG Power: Key Developments in FY2012 Having stated the negatives up-front, it is
time to dwell on the positives. There are
many, of which the most significant is that
CG is definitely being globally recognised
as an end-to-end systems provider Ñ
an enterprise that goes beyond offering
products to designing and delivering
complete power systems.
Creating Power Solutions � EONÕ S HUMBER GATEWAY WIND-FARM
PROJECT Readers may recall that in 2010,
CG installed and commissioned its first
off-shore sub-station of a 165MW wind-
farm called Belwind, located 50 km in the
coastal waters of Belgium. Based on this
success, CG Power Solutions UK and
CG System Belgium together bid for and
secured the order for setting up the offshore
and onshore sub-stations at the Humber
estuary, off the coast of Yorkshire in the
UK. The offshore sub-station is 8 km off the
Yorkshire coast. It will connect 73 offshore
wind turbines of 3 MW each, or 219 MW
in total, with power of 280 MVA. A 132 kV
sub-sea cable will connect the offshore
sub-station to the onshore facility, which will
then hook up to the 132/275 kV National
Grid connection. The project is worth £46
million Ñ £22.7 million for setting up the
onshore facilities, and £23.3 million for the
offshore. CG products that will be used in the
project are: (i) power transformers, reactors
and distribution transformers for onshore
and offshore, (ii) 132kV GIS switchgears for
offshore; and (iii) CG automation and control
systems for both onshore and offshore.
� OTHER OFFSHORE WIND-FARM PROJECTS
There have been other orders as well for
setting up offshore sub-stations, such as
from:
� Amrumbank West, 35 km off shore from Helgoland in the German part of the North Sea, valued at Û 10.7 million,
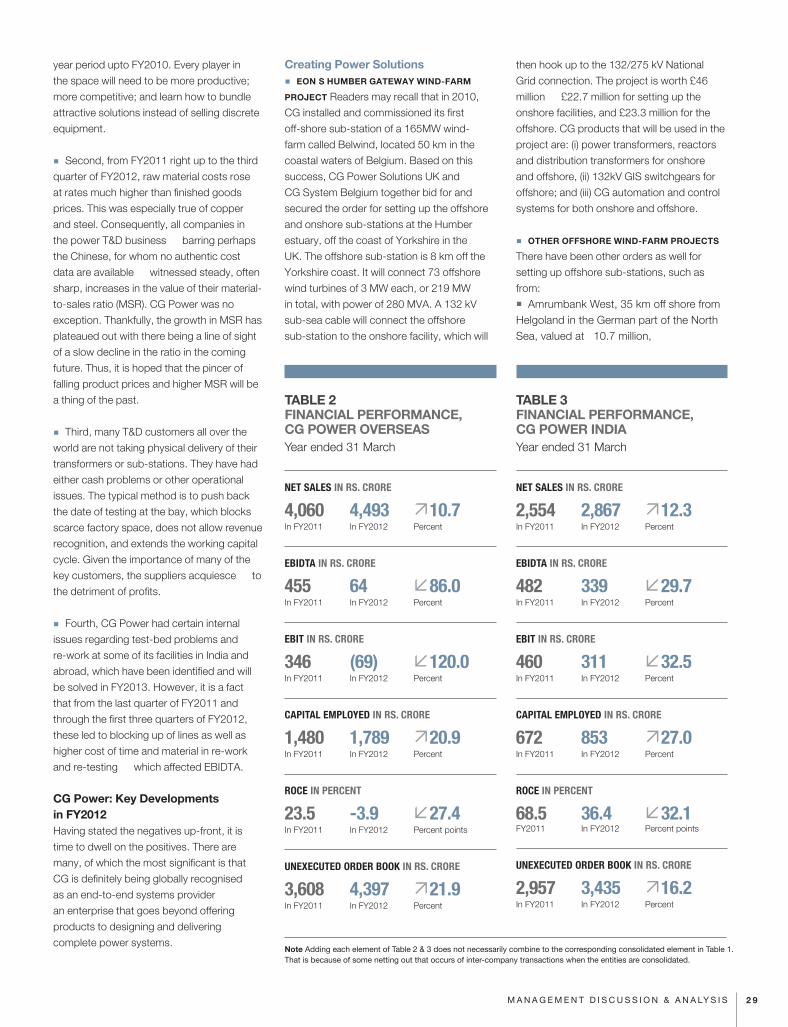
TABLE 2FINANCIAL PERFORMANCE, CG POWER OVERSEAS Year ended 31 March
NET SALES IN RS. CRORE
4,060 4,493 10.7In FY2011 In FY2012 Percent
EBIDTA IN RS. CRORE
455 64 86.0In FY2011 In FY2012 Percent
EBIT IN RS. CRORE
346 (69) 120.0In FY2011 In FY2012 Percent
CAPITAL EMPLOYED IN RS. CRORE
1,480 1,789 20.9In FY2011 In FY2012 Percent
ROCE IN PERCENT
23.5 -3.9 27.4In FY2011 In FY2012 Percent points
UNEXECUTED ORDER BOOK IN RS. CRORE
3,608 4,397 21.9In FY2011 In FY2012 Percent
TABLE 3 FINANCIAL PERFORMANCE, CG POWER INDIA Year ended 31 March
NET SALES IN RS. CRORE
2,554 2,867 12.3In FY2011 In FY2012 Percent
EBIDTA IN RS. CRORE
482 339 29.7In FY2011 In FY2012 Percent
EBIT IN RS. CRORE
460 311 32.5In FY2011 In FY2012 Percent
CAPITAL EMPLOYED IN RS. CRORE
672 853 27.0In FY2011 In FY2012 Percent
ROCE IN PERCENT
68.5 36.4 32.1FY2011 In FY2012 Percent points
UNEXECUTED ORDER BOOK IN RS. CRORE
2,957 3,435 16.2In FY2011 In FY2012 Percent
Note Adding each element of Table 2 & 3 does not necessarily combine to the corresponding consolidated element in Table 1. That is because of some netting out that occurs of inter-company transactions when the entities are consolidated.
2 9M A N A G E M E N T D I S C U S S I O N & A N A LY S I S
� Butendiek, also on German North Sea, some 35 km off the coast of Schleswig-Holstein, at Û 10 million, and � Northwind, in North Sea, 40 km offshore from Belgian coast at Û 3.4 million. These orders and their execution are
increasing the ‘systems competence’ within
CG, not only to create a systems reputation
but also to create ‘pull through’ for CG
products. The end-to-end systems approach
also de-risks the Power SBU from an over-
reliance on stand-alone transformers.
� WIND RENEWABLES From a zero base
three years ago, CG now accounts for
4.2% of the global offshore wind market
in systems Ñ a share that is expected to
increase in the future. CG’s SLIM® and Bio-
SLIM® transformers now comprise 51.2% of
products in the global offshore wind markets.
� SOLAR RENEWABLES FY2012 saw
CG making its entry into market for solar
renewables. The Company won an order
from the US-based solar energy major, First
Solar for Û 19.5 million. First Solar is a US
listed corporation. At the end of 2011, it had
a cumulative global production of 5 GW of
solar energy across the US, Asia (including
India) and Australia Ñ providing electricity
to 2.5 million homes and earning a net sales
of almost US$ 2.8 billion. In addition, CG
won another solar order from SMA for Û 5
million. These orders give CG a 5.9% share
of the overall US solar market, including
households; and a 23.5% share of the US
solar utility market. Incidentally, FY2012 saw
CG selling over 500 distribution transformers
for photo-voltaic applications in solar
renewables.
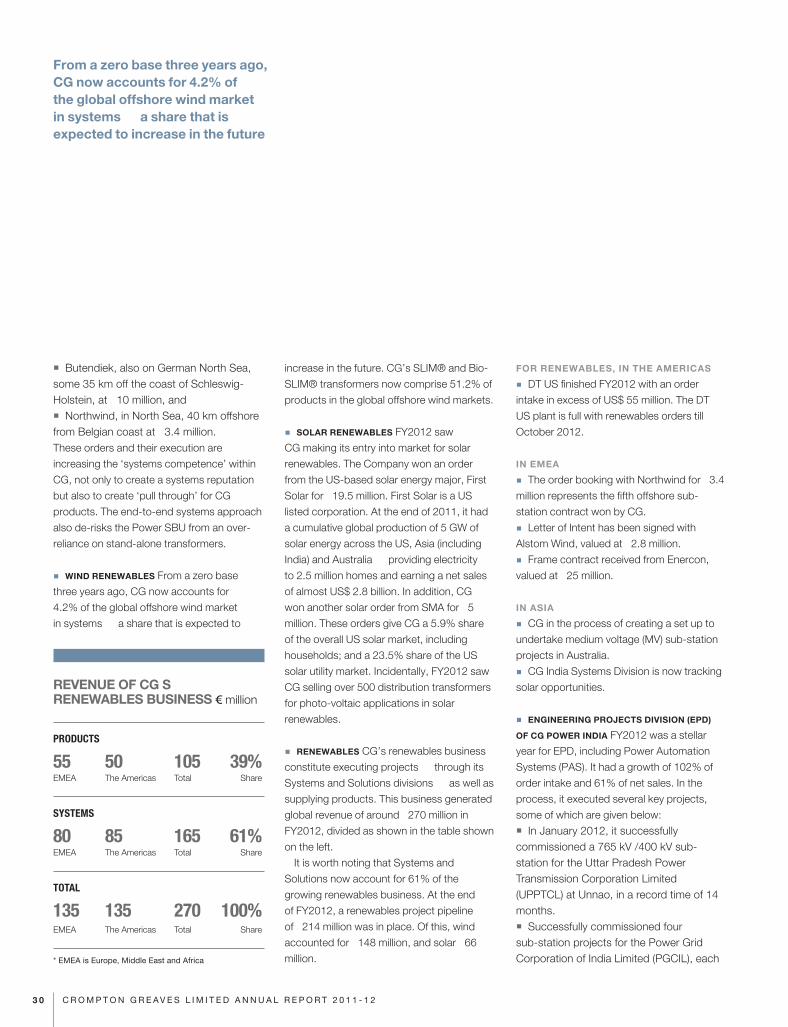
� RENEWABLES CG’s renewables business
constitute executing projects Ñ through its
Systems and Solutions divisions Ñ as well as
supplying products. This business generated
global revenue of around Û 270 million in
FY2012, divided as shown in the table shown
on the left.
It is worth noting that Systems and
Solutions now account for 61% of the
growing renewables business. At the end
of FY2012, a renewables project pipeline
of Û 214 million was in place. Of this, wind
accounted for Û 148 million, and solar Û 66
million.
FOR RENEWABLES, IN THE AMERICAS
� DT US finished FY2012 with an order
intake in excess of US$ 55 million. The DT
US plant is full with renewables orders till
October 2012.
IN EMEA
� The order booking with Northwind for Û 3.4
million represents the fifth offshore sub-
station contract won by CG.
� Letter of Intent has been signed with
Alstom Wind, valued at Û 2.8 million.
� Frame contract received from Enercon,
valued at Û 25 million.
IN ASIA
� CG in the process of creating a set up to
undertake medium voltage (MV) sub-station
projects in Australia.
� CG India Systems Division is now tracking
solar opportunities.
� ENGINEERING PROJECTS DIVISION (EPD)
OF CG POWER INDIA FY2012 was a stellar
year for EPD, including Power Automation
Systems (PAS). It had a growth of 102% of
order intake and 61% of net sales. In the
process, it executed several key projects,
some of which are given below:
� In January 2012, it successfully commissioned a 765 kV /400 kV sub-station for the Uttar Pradesh Power Transmission Corporation Limited (UPPTCL) at Unnao, in a record time of 14 months.� Successfully commissioned four sub-station projects for the Power Grid Corporation of India Limited (PGCIL), each
REVENUE OF CGÕ S RENEWABLES BUSINESS € million
PRODUCTS
55 50 105 39%EMEA The Americas Total Share
SYSTEMS
80 85 165 61%EMEA The Americas Total Share
TOTAL
135 135 270 100%EMEA The Americas Total Share
* EMEA is Europe, Middle East and Africa
From a zero base three years ago, CG now accounts for 4.2% of the global offshore wind market in systems Ñ a share that is expected to increase in the future
3 0 C R O M P T O N G R E A V E S L I M I T E D A N N U A L R E P O R T 2 0 1 1 - 1 2
well ahead of schedule. These were: (i) 400 kV at Bhiwadi, Rajasthan (five months before schedule); (ii) 400 kV at Neemrana, Rajasthan (six months ahead); (iii) 400 kV at Sikar, Rajasthan (six months ahead); and (iv) 400 kV at Panchkula, Haryana (five months before schedule).� In August 2011, EPD booked its first PGCIL order for a 765 kV / 400 kV sub-station valued at Rs.145 crore. To be located at Durg (near Raipur in the district of Chhattisgarh), it involves setting up 13 bays of 765 kV and 10 bays of 400 kV. The project is to be completed by October 2013.� With an order intake of Rs.606 crore during FY2012, EPD and PAS together accounted for 18% of the total order intake of CG Power India. This would have been inconceivable even two years ago, and demonstrates the need for, and the power of providing end-to-end systems and solutions across all CG’s geographies.
Making Best-in-Class Power TransformersFY2012 has seen CG Power producing,
erecting and commissioning some
outstanding power transformers (PT). Here
are a few examples:
� CG POWER INDIAÕ S PLANT AT MANDIDEEP,
NEAR BHOPAL (CALLED T3) delivered its first
80 MVAr, 765 kV shunt reactor to PGCIL in
June 2011. In January 2012, it delivered its
first 500 MVA 765 kV power transformer, also
to PGCIL. In March 2012, T3 manufactured,
type-tested and delivered its first 110 MVAr,
765 kV shunt reactor to PGCIL.
� During FY2012, T3 delivered a large
number of 765 kV power transformers and
reactors to PGCIL. These were:
� three 765 kV 500 MVA transformers; � 30 units of 80 MVAr 765 kV shunt reactors; and� two 110 MVAr 765 kV shunt reactors.
� In FY2012, the following number of 765 kV
transformers and reactors supplied from T3
were actually commissioned:
� Three 333 MVA 765 kV transformers at UPPTCL’s sub-station at Unnao.� One 765 kV generator transformer for the National Thermal Power Corporation (NTPC) at Sipat in Chhattisgarh.� Seven 80 MVAr 765kV shunt reactors at different PGCIL sites.
� During FY2012, for the 765 kV category,
PGCIL alone has given orders to CG Power
India for (i) 28 units of 500 MVA 765 kV
power transformers, and (ii)10 units of 80
MVAr 765 kV shunt reactors.
� T1, WHICH IS CGÕ S POWER TRANSFORMER
FACILITY AT KANJUR MARG, MUMBAI,
designed, produced and commissioned
for Adani Power a bank of seven 270 MVA
single-phase Generator Step Up (GSU)
power transformers. It was the largest such
order in India, and meant for the client’s 2 x
660 MW super-critical thermal power plant in
Rajasthan.
� THE SWITCHGEAR DIVISION OF CG POWER
INDIA had several wins in FY2012. Some of
key ones were:
� Test charged the first 1200 kV capacitive voltage transformer (CVT) for PGCIL at its National Test Station at Bina, Madhya Pradesh. � Successfully erecting and testing the first 1200 kV surge arrester — also at PGCIL’s National Test Station at Bina. � Developed and type tested at KERI, Republic of Korea (i) 420 kV 4500A, 50 KA spring-spring operated circuit breaker, as well as (ii) its 800 kV variant. The testing was successfully concluded in February 2012.
� CG-ZIV POWER AUTOMATION SOLUTIONS
LIMITED, a joint venture with the ZIV Group
of Spain for sub-station automation solutions
received its first orders from PGCIL for 132
kV and 220 kV control panels.
� PT-HUNGARY, CGÕ S POWER TRANSFORMER
FACILITY AT TAPIOSZELE, has begun to
contribute in a significant manner. Here are
a few facts:
� Six 765 kV power transformers manufactured by this facility are now operational at different sites. � It has designed a new type of 765 kV transformer with the regular winding on auxiliary limb, which promises to have a strong market for specific applications.� It has successfully completed a KEMA ‘short-circuit proof’ test for a 250 MVA, 420 kV transformer that is being built for TERNA, Italy’s transmission grid major.� It has received orders from EDF (France), Union Fenosa (Spain), Ukraine, Lithuania, Estonia, Germany and Norway.
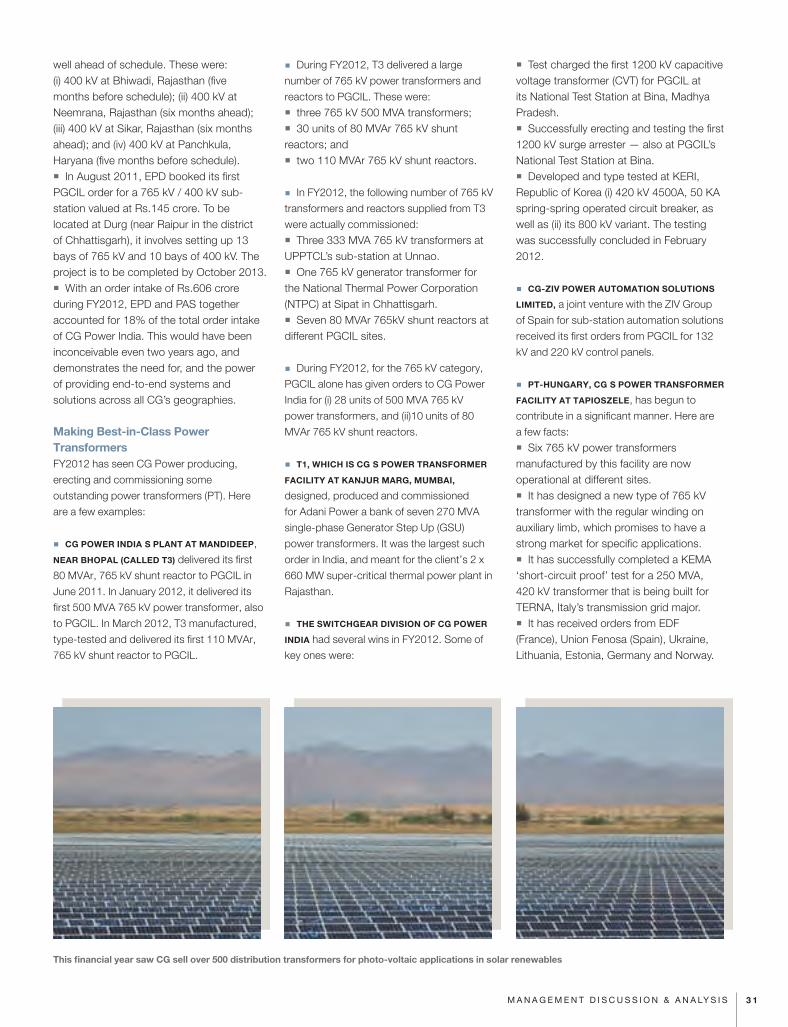
This financial year saw CG sell over 500 distribution transformers for photo-voltaic applications in solar renewables
3 1M A N A G E M E N T D I S C U S S I O N & A N A LY S I S
It has successfully pre-qualified for Saudi Electricity Company and the Western Power Distribution in the UK. It has also received the GOST certification from Russia, which opens the door to supply transformers for Russian power transmission projects.� Hungary leveraged its strong engineering and product manufacturing skills to launch a servicing business for (i) refurbishment of other makes of transformers, (ii) calibration of measuring instruments for other divisions and third parties, and (iii) replacement of windings on site. The business has started picking up.
� PT-BELGIUM AT MECHELEN had some
notable successes, such as:
� Manufacturing low noise power transformers at less than 50 dB on the A-scale. It sold three such transformers Ñ 80 MVA in the range of 150 kV to 20 kV Ñ to Alliander, a Dutch power distribution major, and ought to be an important reference for the EMEA markets.� Building a 400 kV, 530 MVA dual voltage power transformer — a first for CG Power in EMEA Ñ for a Belgian generator company. � Producing the first water-cooled ‘oil-forced, water-forced’ (OFWF) power transformer for an offshore sub-station.� Winning major orders from (i) the Saudi Electricity Company (SEC), (ii) National Contracting Company Limited, for SEC, (iii) Sonelgaz in Algeria, (iv) Statnett in Norway, and (vi) the Ministry of Electricity, Iraq.
� PT USA, AT WASHINGTON, MISSOURI,
has stabilised, and started production and
shipment. The key performances for FY2012
were:
� Generator Step-Up (GSU) transformers were rolled out. This should enable power transformers manufactured in the USA to enter the wind, solar and geo-thermal markets Ñ which are growing faster than the typical utility market.� Produced the first set of 161 kV rated power transformers, which were sold to the Tennessee Valley Authority. � Secured 46 new customers as well as multi-year blanket contracts from key utilities.
� PT CANADA AT WINNIPEG performed
creditably, given the constraints of working
with a single production line. The main
achievements in FY2012 were:
� New design for its HVDC convertor transformer delivered over 20% performance enhancement compared to the previous versions. � Winnipeg is now the Ô Centre of Excellence’ for HVDC. There has been a significant order intake from Manitoba Hydro. � There were significant orders for generator step-up (GSU) transformers from Ontario Power Corporation; and for power transformers from SNC Lavalin as well as First Solar.
� PT INDONESIA AT BOGOR did extremely
well in FY2012. Here are some key
indicators:
� Crossed US$ 100 million in sales for the first time. Has a healthy order intake US$ 133 million and an UEOB of US$ 128 million.� FY2012 saw the maximum MVA produced in any year: 7,267 MVA comprising 148 units.� 500 kV test bay expansion was completed.� Big DT and 500 kV power transformers were introduced in the product portfolio.� Received the first orders for 12 units of 167 MVA 550 kV transformers from PLN, Indonesia’s government-owned corporation that controls electricity distribution throughout the archipelago. PT Indonesia secured over US$ 62 million of business from PLN during the course of the year. � Successfully designed, manufactured and tested 220 kV delta connected transformers for copper mines in Peru.
New Business Vertical for CG Power: Oil and GasGiven the huge growth in global investments
in the oil and gas sector, it was a natural
area for CG to offer power equipment as
well as solutions. The business started in
the second half of FY2012, and has had an
encouraging beginning. In the course of four
months, a tentative order pipeline of Û 150
million has been developed. The requisite
sales infrastructure is being set up in various
locations, such as at Houston, the Middle
East and Asia.
The Company is working on creating
structures of business cooperation between
CG and other entities in medium- and low-
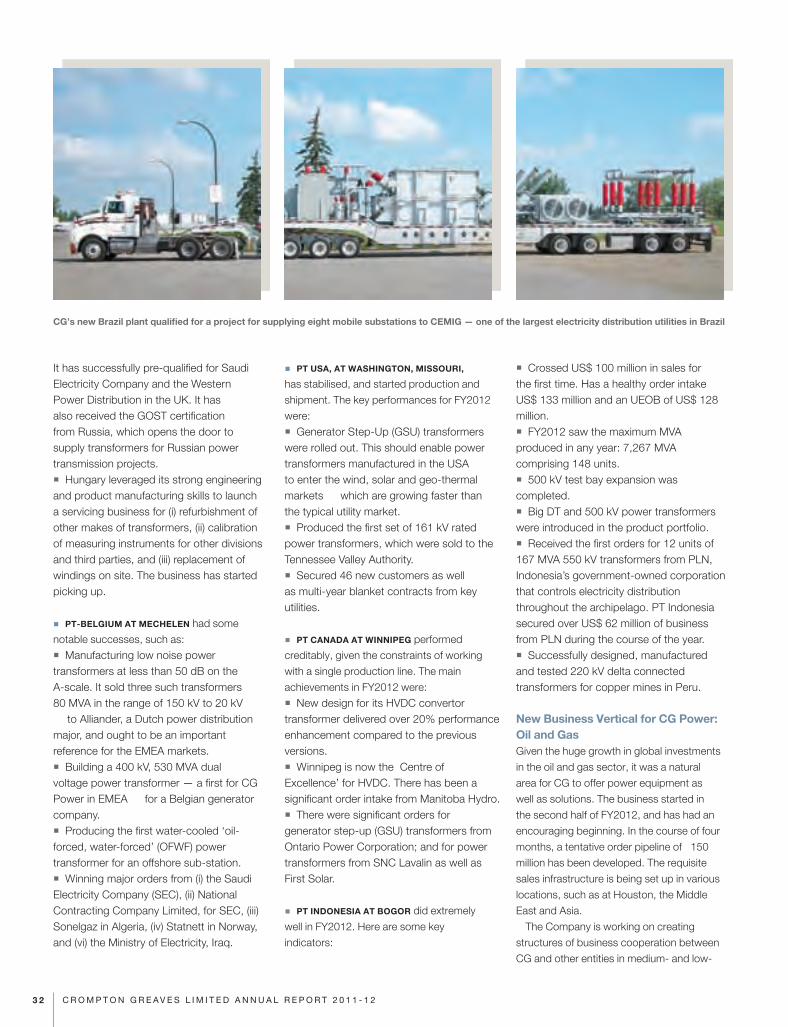
CG’s new Brazil plant qualified for a project for supplying eight mobile substations to CEMIG — one of the largest electricity distribution utilities in Brazil
3 2 C R O M P T O N G R E A V E S L I M I T E D A N N U A L R E P O R T 2 0 1 1 - 1 2
voltage transformer space to (i) offer a larger
suite of products to oil and gas majors and
international EPC players, and (ii) access
major oil and gas markets in the USA, Russia,
the Caspian and the Middle East. At the
time of writing this Management Discussion
and Analysis, CG products from India and
Indonesia are in the process of being pre-
qualified for oil and gas end-users and global
EPC contractors. The Company expects
to see good results from this vertical in the
years to come.
PT and Switchgears: The Brazil ProjectLast year, the Board of Directors of CG had
in-principle approved the establishment of
a greenfield power transformer plant up to
100 MVA and an HT switchgear plant in
Brazil. The Brazil operations commenced
in FY2012. CG has signed a Letter of Intent
with the State of Rio Grande do Sul (in south
Brazil) to set up a plant to manufacture HV
power transformers and switchgear. Land
has been made available in an industrial
complex; and fiscal incentives are expected
from the state government.
In the meanwhile, CG has started operating
from a leased facility to assemble, distribute
and provide technical assistance for EHV
switchgears. It is also setting up a team
of skilled technical professionals to offer
EPC solutions for sub-stations. At present,
CG Brazil has qualified for a project of
approximately US$ 17 million for supplying
eight mobile sub-stations to CEMIG Ñ one
of the largest electricity distribution utilities in
Brazil.
Distribution Transformers (DT)The headline news are as follows:
A The DT-USA business has picked up.
FY2012 saw a 9% increase in DT production
(in MVA terms) in the US versus the previous
year. This is creditable, in two counts.
First, the growth is greater than the overall
increase in demand from the traditional DT
users; and second, because this growth was
accompanied by price increases.
B The DT-Ireland business has also grown
by 12% in terms of MVA produced. However,
price pressures have continued. Ireland
suffered from lack of orders during the first
half of the year; strong sales growth in the
second half brought the unit back to break-
even levels. Also, production realignment in
Ireland has created flexibility on the line to
shift from single phase to three phase DTs.
C DT-Belgium has contracted by 5% in
volume terms.
DT-USA
Some key developments in FY2012 were:
� Entered the solar market and secured over US$ 29 million of orders from major solar developers. As mentioned earlier, total US orders from the renewable market, i.e. wind and solar, for FY2012 were US$ 55 million. � 23% of total order revenue came from new designs that fetched higher margins.� In less than a year, DT-USA won over 50% of the solar market share in the country.
DT-BELGIUM
The major items worth noting were:
� Produced KFWF (forced water cooling) Bio-SLIM® DTs for multi-MW wind turbines.
� Initiated work in development of arc suppression coils, which is especially targeted for the French market.� New markets were developed, such as Hungary, Kazakhstan and Algeria.� Worked closely with the Renewables vertical to offer solutions, and orders were received via Enercon for Canada.
CG POWER INDIAÕ S EXPORTS
CG Power India’s exports did well in FY2012.
In the USA, it secured a seven-year global
frame agreement with a power major for the
supply of generator transformers ranging
from 20 MVA to 320 MVA and up to 230
kV. It executed another significant order
in the USA for power transformers and
switchgear. The business maintained its
market leadership in Peru and Colombia;
secured major orders in Nigeria to retain
its No.1 position in the market; entered
Ghana, Zambia and Zimbabwe, the latter
with 100% advance payment; won orders in
Bangladesh; received its first order from Sri
Lanka after a gap of a decade; and sustained
market leadership in Malaysia for the sixth
consecutive year with 60% market share in
transformers and switchgears. In FY2012,
Malaysia gave orders for CG India’s largest
GSU power transformer of 350 MVA / 275
kV and its largest single phase auto power
transformer of 350 MVA / 500 kV.
NEW PRODUCTS
New products accounted for 24% of the
sales of CG Power in FY2012.
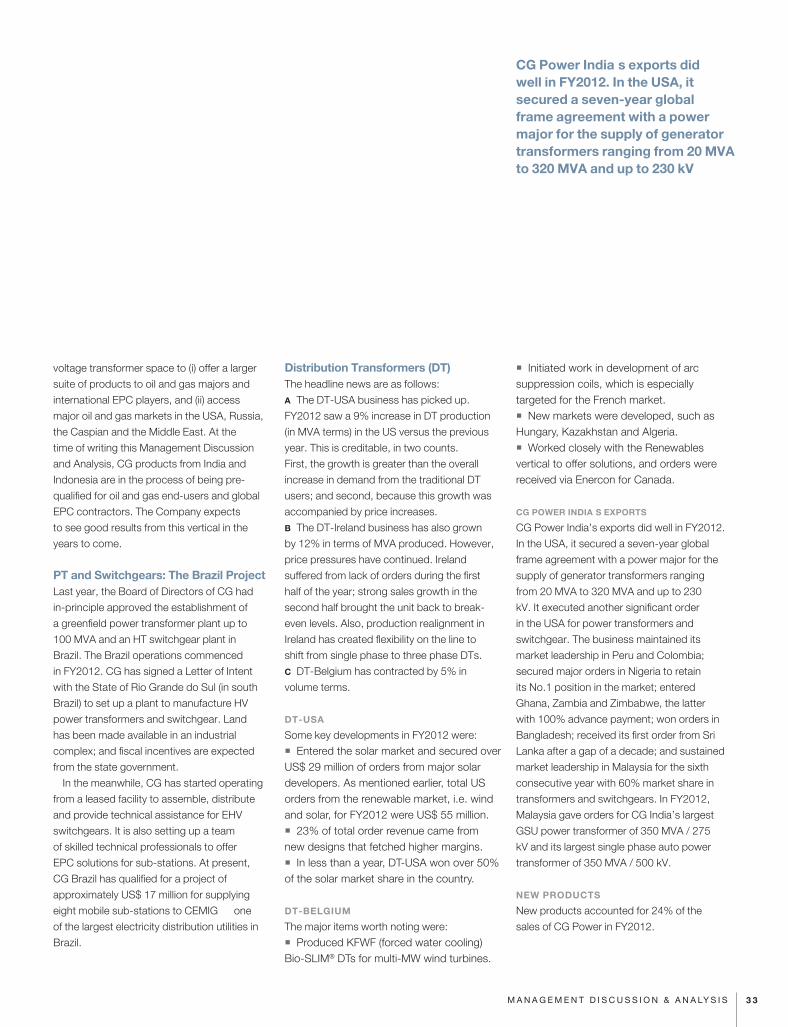
CG Power IndiaÕ s exports did well in FY2012. In the USA, it secured a seven-year global frame agreement with a power major for the supply of generator transformers ranging from 20 MVA to 320 MVA and up to 230 kV
3 3M A N A G E M E N T D I S C U S S I O N & A N A LY S I S
CG INDUSTRIAL SYSTEMS
CG Industrial Systems manufactures the
following types of products:
� High tension (HT) motors.
� Low tension (LT) motors.
� Fractional horse power (FHP) motors.
� Direct current (DC) motors.
� AC drives.
� AC generators.
� Variable frequency drives and solutions based on insulated gate bi-polar transistor (IGBT) technology; soft starters and shaft power monitors; and rotary heat exchangers with switch reluctance motors for saving energy.
� Railway transportation and signalling equipment.
� Stampings.
Table 4 gives the financial performance of
Industrial Systems over the last two years.
Industrial Systems’ net sales increased by
21.6% over FY2011 to reach Rs.1,820 crore.
Thanks to higher input costs and pricing
pressures, EBIDTA declined by 3.1% to
Rs.266 crore. There was almost a doubling of
capital employed in the SBU, which grew by
95.9% to Rs.823 crore at the end of FY2012.
This was on account of investments in, and
further modernisation of, existing plants; as
well as incorporating the capital employed
in Emotron Ñ the Swedish drives business
which was acquired in May 2011.
Higher depreciation on greater capital
employed played a role in Industrial System’s
EBIT declining by 20.4% to Rs.210 crore. It
also reduced the ROCE from a high of 62.9%
in FY2011 to a nevertheless healthy 25.5%
in FY2012.
The somewhat worrying story is the fall in
UEOB, which reduced by 11% to Rs.534
crore at the end of FY2012. It should be
mentioned, however, that the UEOB is
still quite adequate. The concern is how
it will grow in FY2013, given the sharp
deterioration in GDP growth witnessed in
FY2012 Ñ to 6.5% for the full year, and to
5.3% for Q4, FY2012.
Some of the key developments for FY2012
are given below:
� CG ACQUIRED EMOTRON, LOCATED
AT HELSINGBORG, SWEDEN, IN MAY 2011
FOR AN ENTERPRISE VALUE OF Û 57.8
MILLION. Emotron is engaged in the design,
engineering and manufacturing of drive
solutions, using the latest insulated gate bi-
polar transistor (IGBT) technology for variable
frequency drives ranging from 200 V to 690
V, and from 0.2 kW to 3,000 kW. These are
used for: (i) flow controls in pumps, fans and
compressors; (ii) material handling, such
as cranes, crushers, mills and conveyors;
and (iii) lift controls such as elevators.
Emotron also manufacturers soft starters
and shaft power monitors that are used in
industrial applications, as well as rotary heat
exchangers with switch reluctance motors for
saving energy.
� NELCO FACILITIES SHIFTED TO MANDIDEEP.
Bought by CG in FY2011, all operations
of NELCO’s erstwhile Mahape plant, near
Mumbai, were shifted to Mandideep by
February 2012.
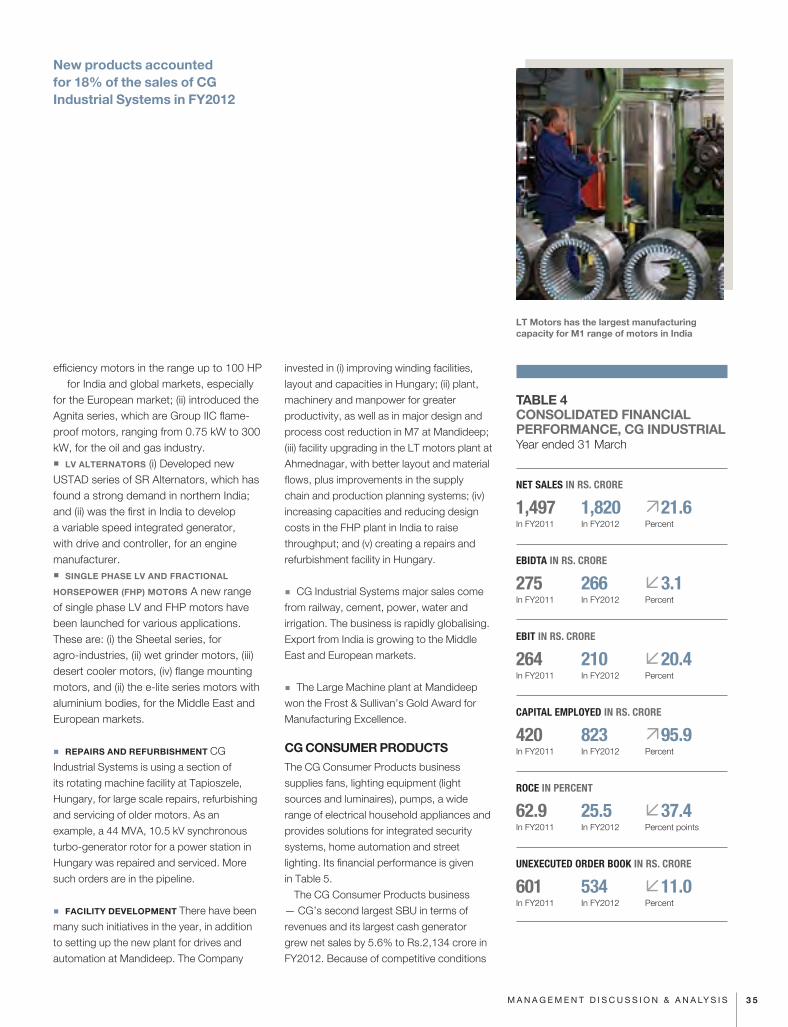
� NEW PRODUCTS ACCOUNTED FOR 18% OF
SALES OF CG INDUSTRIAL SYSTEMS IN FY2012.
The year saw the successful manufacture
and sale of several new products, such as:
� LARGE MOTORS The rotating machine division of CG Hungary produced (i) 8.3 MW, 8 Pole, 6.6 kV motors for a steel mill in the Middle East; and (ii) 4.5 MW, 20 Pole, 6 kV motors as well as 3.3 MW, 22 Pole, 6 kV water-cooled motors for the circulating water pump of the Rostov nuclear power plant in Russia. The Large Machines plant at Mandideep in India manufactured and sold: (i) 2.85 MW, 16 Pole, 11 kV motors for a thermal power plant in India; (ii) 7.5 MW, 6 Pole, 11 kV motor for a cement mill in Egypt; (ii) 4.6 MW, 6 Pole, 3.3 kV cage rotor motor for a cement mill in the UK; and (iii) large flame-proof motors for oil and gas applications.� SYNCHRONOUS GENERATORS CG produced (i) 1,680 kVA, 6 Pole, 690V synchronous generator with Bureau Veritas certification, for marine duty application in France; and (ii), 19 MVA, 12 Pole, 6.3 kV horizontal hydro-generator for a customer in Italy. � LV AC DRIVES (i) CG Sweden developed and supplied a new series of drives for the German market, ranging from 11 kW to 22 kW; (ii) launched a new frame size, called Size D, in the FDU/VFX range between 30 kW and 37 kW. CG Global R&D and traction team developed IGBT-based auxiliary convertors, to be used in AC locomotives for the Indian Railways.� THREE-PHASE LV MOTORS (i) Developed and launched the APEX series-IE2 high
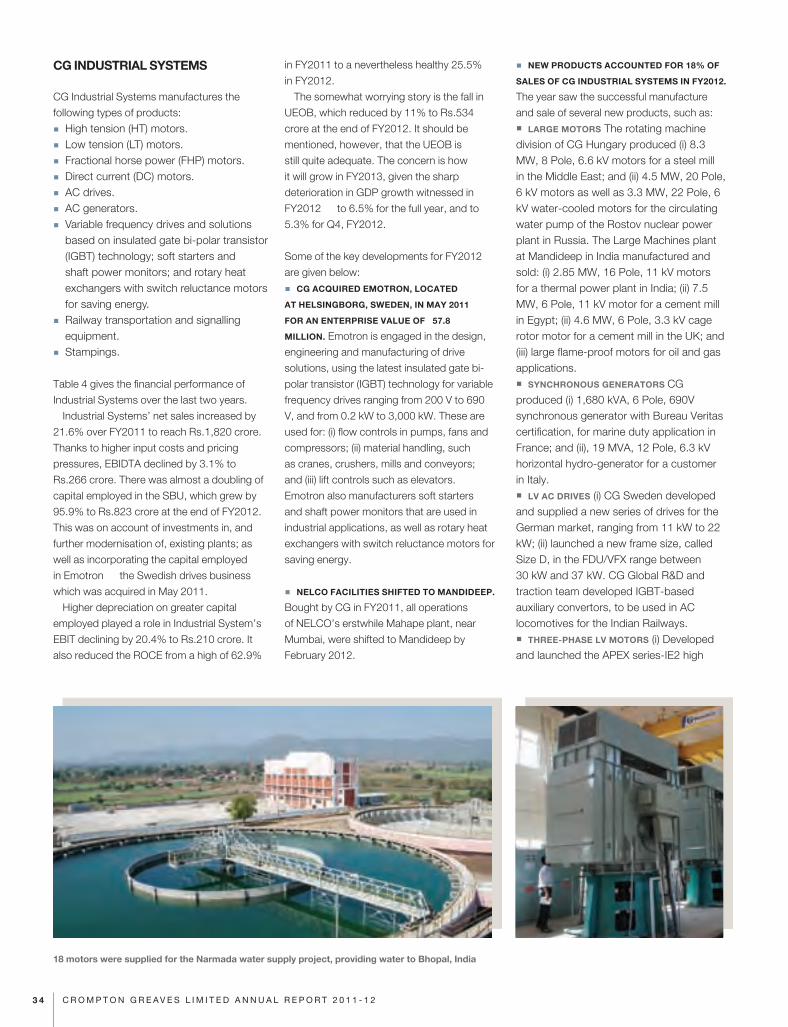
18 motors were supplied for the Narmada water supply project, providing water to Bhopal, India
3 4 C R O M P T O N G R E A V E S L I M I T E D A N N U A L R E P O R T 2 0 1 1 - 1 2
efficiency motors in the range up to 100 HP Ñ for India and global markets, especially for the European market; (ii) introduced the Agnita series, which are Group IIC flame-proof motors, ranging from 0.75 kW to 300 kW, for the oil and gas industry.� LV ALTERNATORS (i) Developed new USTAD series of SR Alternators, which has found a strong demand in northern India; and (ii) was the first in India to develop a variable speed integrated generator, with drive and controller, for an engine manufacturer.� SINGLE PHASE LV AND FRACTIONAL
HORSEPOWER (FHP) MOTORS A new range of single phase LV and FHP motors have been launched for various applications. These are: (i) the Sheetal series, for agro-industries, (ii) wet grinder motors, (iii) desert cooler motors, (iv) flange mounting motors, and (ii) the e-lite series motors with aluminium bodies, for the Middle East and European markets.
� REPAIRS AND REFURBISHMENT CG
Industrial Systems is using a section of
its rotating machine facility at Tapioszele,
Hungary, for large scale repairs, refurbishing
and servicing of older motors. As an
example, a 44 MVA, 10.5 kV synchronous
turbo-generator rotor for a power station in
Hungary was repaired and serviced. More
such orders are in the pipeline.
� FACILITY DEVELOPMENT There have been
many such initiatives in the year, in addition
to setting up the new plant for drives and
automation at Mandideep. The Company
invested in (i) improving winding facilities,
layout and capacities in Hungary; (ii) plant,
machinery and manpower for greater
productivity, as well as in major design and
process cost reduction in M7 at Mandideep;
(iii) facility upgrading in the LT motors plant at
Ahmednagar, with better layout and material
flows, plus improvements in the supply
chain and production planning systems; (iv)
increasing capacities and reducing design
costs in the FHP plant in India to raise
throughput; and (v) creating a repairs and
refurbishment facility in Hungary.
� CG Industrial Systems major sales come
from railway, cement, power, water and
irrigation. The business is rapidly globalising.
Export from India is growing to the Middle
East and European markets.
� The Large Machine plant at Mandideep
won the Frost & Sullivan’s Gold Award for
Manufacturing Excellence.
CG CONSUMER PRODUCTS The CG Consumer Products business
supplies fans, lighting equipment (light
sources and luminaires), pumps, a wide
range of electrical household appliances and
provides solutions for integrated security
systems, home automation and street
lighting. Its financial performance is given
in Table 5.
The CG Consumer Products business
— CG’s second largest SBU in terms of
revenues and its largest cash generator Ñ
grew net sales by 5.6% to Rs.2,134 crore in
FY2012. Because of competitive conditions
New products accounted for 18% of the sales of CG Industrial Systems in FY2012
TABLE 4CONSOLIDATED FINANCIAL PERFORMANCE, CG INDUSTRIAL Year ended 31 March
NET SALES IN RS. CRORE
1,497 1,820 21.6In FY2011 In FY2012 Percent
EBIDTA IN RS. CRORE
275 266 3.1In FY2011 In FY2012 Percent
EBIT IN RS. CRORE
264 210 20.4In FY2011 In FY2012 Percent
CAPITAL EMPLOYED IN RS. CRORE
420 823 95.9In FY2011 In FY2012 Percent
ROCE IN PERCENT
62.9 25.5 37.4In FY2011 In FY2012 Percent points
UNEXECUTED ORDER BOOK IN RS. CRORE
601 534 11.0In FY2011 In FY2012 Percent
LT Motors has the largest manufacturing capacity for M1 range of motors in India
3 5M A N A G E M E N T D I S C U S S I O N & A N A LY S I S
and higher raw material costs, the EBIDTA
fell by 13.4% to Rs.270 crore; EBIT also fell
by 10.2% to Rs.263 crore. The business’
ROCE reduced, but was still high, at 286%.
CG is a fast growing consumer product
brand in India. It is the market leader in fans
with a strong brand image; occupies the
second spot in lighting; is the fastest growing
brand in home appliances; and the leader
in the domestic pumps segment. It has
developed and launched a whole range of
energy efficient and green products. Its foray
into the rural segment has helped the business
to maintain its growth objectives despite
difficult market conditions in urban India.
� CGÕ S FANS grew at 2% by value in
FY2012, in a market that shrank by 2.3%. It
continued its overall leadership status and,
in doing so, further increased its market
share in the country. CG’s fans retained
their ‘Superbrand’ status for the sixth year
in succession. In its portfolio, there are four
Bureau of Energy Efficiency (BEE) Star rated
products: two having the highest 5-star
rating, one 4-star, and another 3-star. The
business also introduced a full range of
premium ceiling fans, which allow flexibility
to consumers to select from a wide range of
colours and styles. The portfolio that is being
developed will include a range of battery
back-up fans. Its foray into the segment of
industrial fans has been successful. New
products accounted for over 25% of total
fan sales. It also developed a new 35 watts
brushless DC (BLDC) ceiling fan. It has also
introduced a range of energy efficient ‘power-
saver’ fans that use a new motor which
delivers the same breeze at either 50 watts
or 60 watts of power. The BLDC platform is
aimed at revolutionising segment offerings.
� CGÕ S LIGHTING also retained its
‘Superbrand’ status for the fifth consecutive
year, with an overall number two position in
India. CG’s lighting business grew by 17%
in FY2012, compared to an overall market
growth of 12% Ñ resulting in the Company
increasing its overall market share. In
FY2011, CG was the first in India to produce
a highly energy efficient light emitting diode
(LED) lamp with an average life of 50,000
burning hours, and consuming only 5 watts
of power to produce the light of a 40 watt
bulb. FY2012 saw the Company pushing
hard to make inroads with LED lamps and
street lighting. It did so successfully: (i)
by selling over 40,000 LED street lighting
units; and (ii) by winning an LED street
lighting contract from the Government of
Punjab for 9,500 units. The business won
another special project Ñ that of putting
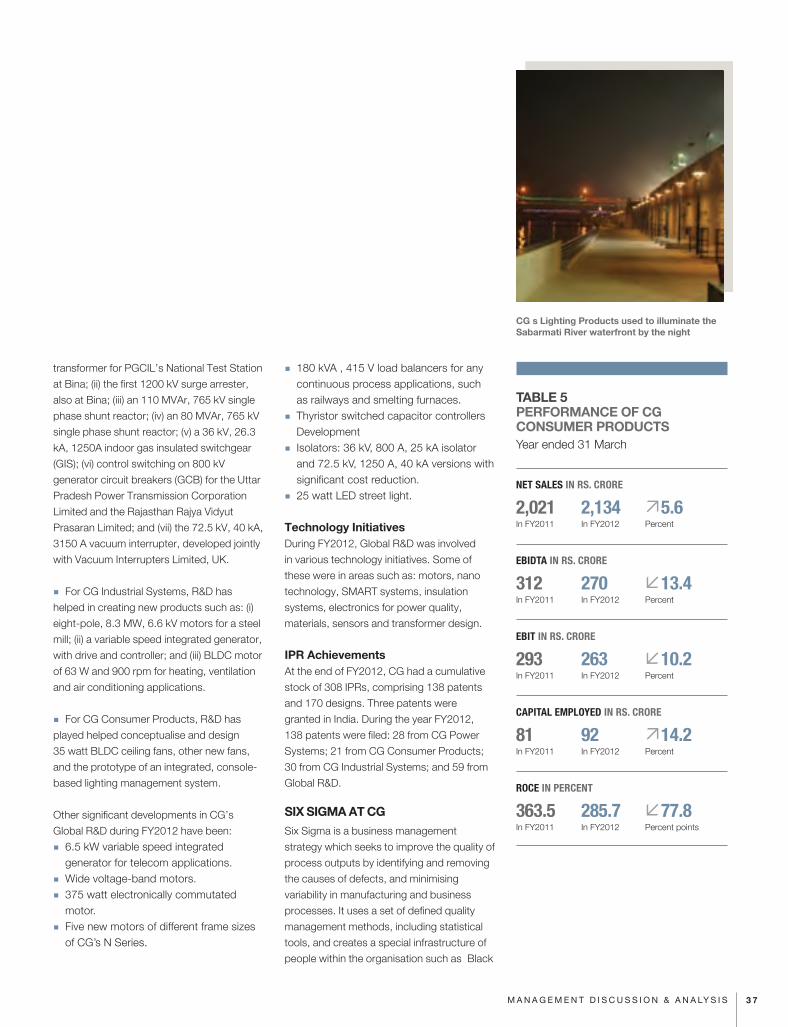
up 1,500 LED-based luminaires across the
River Sabarmati in Ahmedabad, Gujarat.
In FY2012, CG continued to enjoy industry
leadership in high intensity discharge lamps
used for public lighting. This business has
taken a leadership position in LED luminaires,
with the introduction of full range of down
lighters, office lighting tiles and industrial
luminaires Ñ apart from the already
introduced outdoor range. The green initiative
has led to the business having achieved
the lowest consumption of mercury in the
manufacturing of lamps at its integrated unit
at Baroda.
� THE PUMPS DIVISION de-grew by 4% in
FY2012, in a market that shrank by over
8%. which was considerably faster than the
market. Overall, CG retained its number two
position in this business, with leadership in
the domestic pumps segment. The division
is focusing on industrial and agricultural
pumps as well as integrated water treatment
solutions to grow the business. The new
manufacturing unit at Ahmednagar is being
automated to deliver higher productivity
per man hour. Introduction of specialised
industrial application pumps has enabled
successful entry into the B2B segment.
� CGÕ S APPLIANCES DIVISION grew by 25%
in value terms during FY2012 versus an
estimated market growth of 21%. Now a
significant player in geysers, it is perceived to
be ranked number three in the market. The
business is poised to make an entry with a full
portfolio of small and personal care appliances.
� NEW PRODUCTS accounted for 25% of the
sales of the CG Consumer business.
GLOBAL RESEARCH & DEVELOPMENTThis section outlines the key Research &
Development (R&D) achievements in FY2012.
New product developmentThe Company has a well defined
metric to determine new product (NP)
development.
� For CG Power India, some of the
new products were: (i) the 1200 kV auto
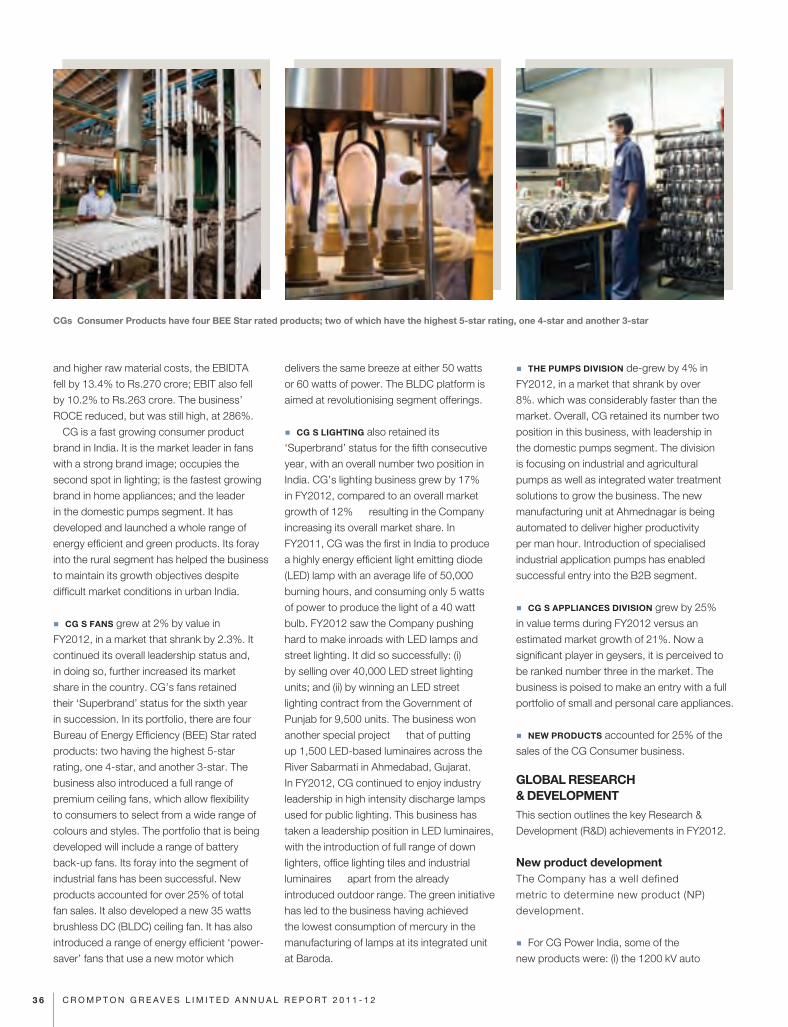
CGÕs Consumer Products have four BEE Star rated products; two of which have the highest 5-star rating, one 4-star and another 3-star
3 6 C R O M P T O N G R E A V E S L I M I T E D A N N U A L R E P O R T 2 0 1 1 - 1 2
transformer for PGCIL’s National Test Station
at Bina; (ii) the first 1200 kV surge arrester,
also at Bina; (iii) an 110 MVAr, 765 kV single
phase shunt reactor; (iv) an 80 MVAr, 765 kV
single phase shunt reactor; (v) a 36 kV, 26.3
kA, 1250A indoor gas insulated switchgear
(GIS); (vi) control switching on 800 kV
generator circuit breakers (GCB) for the Uttar
Pradesh Power Transmission Corporation
Limited and the Rajasthan Rajya Vidyut
Prasaran Limited; and (vii) the 72.5 kV, 40 kA,
3150 A vacuum interrupter, developed jointly
with Vacuum Interrupters Limited, UK.
� For CG Industrial Systems, R&D has
helped in creating new products such as: (i)
eight-pole, 8.3 MW, 6.6 kV motors for a steel
mill; (ii) a variable speed integrated generator,
with drive and controller; and (iii) BLDC motor
of 63 W and 900 rpm for heating, ventilation
and air conditioning applications.
� For CG Consumer Products, R&D has
played helped conceptualise and design
35 watt BLDC ceiling fans, other new fans,
and the prototype of an integrated, console-
based lighting management system.
Other significant developments in CG’s
Global R&D during FY2012 have been:
� 6.5 kW variable speed integrated generator for telecom applications.
� Wide voltage-band motors.
� 375 watt electronically commutated motor.
� Five new motors of different frame sizes of CG’s N Series.
� 180 kVA , 415 V load balancers for any continuous process applications, such as railways and smelting furnaces.
� Thyristor switched capacitor controllers Development
� Isolators: 36 kV, 800 A, 25 kA isolator and 72.5 kV, 1250 A, 40 kA versions with significant cost reduction.
� 25 watt LED street light.
Technology InitiativesDuring FY2012, Global R&D was involved
in various technology initiatives. Some of
these were in areas such as: motors, nano
technology, SMART systems, insulation
systems, electronics for power quality,
materials, sensors and transformer design.
IPR AchievementsAt the end of FY2012, CG had a cumulative
stock of 308 IPRs, comprising 138 patents
and 170 designs. Three patents were
granted in India. During the year FY2012,
138 patents were filed: 28 from CG Power
Systems; 21 from CG Consumer Products;
30 from CG Industrial Systems; and 59 from
Global R&D.
SIX SIGMA AT CGSix Sigma is a business management
strategy which seeks to improve the quality of
process outputs by identifying and removing
the causes of defects, and minimising
variability in manufacturing and business
processes. It uses a set of defined quality
management methods, including statistical
tools, and creates a special infrastructure of
people within the organisation such as Ô Black
TABLE 5PERFORMANCE OF CG CONSUMER PRODUCTS Year ended 31 March
NET SALES IN RS. CRORE
2,021 2,134 5.6In FY2011 In FY2012 Percent
EBIDTA IN RS. CRORE
312 270 13.4In FY2011 In FY2012 Percent
EBIT IN RS. CRORE
293 263 10.2In FY2011 In FY2012 Percent
CAPITAL EMPLOYED IN RS. CRORE
81 92 14.2In FY2011 In FY2012 Percent
ROCE IN PERCENT
363.5 285.7 77.8In FY2011 In FY2012 Percent points
CGÕ s Lighting Products used to illuminate the Sabarmati River waterfront by the night
3 7M A N A G E M E N T D I S C U S S I O N & A N A LY S I S
Belts’ and ‘Green Belts’ who are experts
in these methods. Each Six Sigma project
follows a defined sequence of steps and has
quantified financial targets, i.e. cost reduction
and/or profit increase.
CG, especially in India, has been following
Six Sigma for several years. Given below are
the key facts about Six Sigma in CG during
FY2012.
� Within CG India, there were 28 Black Belts
(BBs) who implemented 71 Six Sigma projects
in FY2012, versus 52 in the previous year.
� Similarly, 469 Green Belts (GBs) helped to
execute 612 GB projects in the year Ñ which
was 33% more than the previous year.
� The estimated direct financial impact of
these projects in FY2012 was Rs.7.6 crore.
� The Six Sigma drive is being
internationalised. Projects have been
undertaken in the USA, Indonesia and
Hungary. At present, 31 GBs have been
trained at these locations.
� 166 projects have been identified for CG
India during FY2013. If these are all successfully
executed, the estimated savings should be
between Rs.28 crore and Rs.35 crore.
HUMAN RESOURCESFY2012 saw focused organisational attention
on the creation of ‘One CG’ — an initiative
to better leverage CG’s strengths from the
revenue and cost perspectives. Creating
a single organisation is based upon the
execution of three key elements: One Offering,
One Structure and One Face to the Customer.
Going forward, the Company’s businesses
will be managed along product lines Ñ for
instance, Power Transformers, instead of a
division called CG Power. This new approach
should create better global accountability
and visibility with respect to revenues and
costs for each major product line. All support
functions, such as finance, legal and Human
Resources (HR), have been organised into
one global team to support all product lines
and, hence, the business units, across all
geographies.
With the objective of ‘One CG’, FY 2012
saw an acceleration of CG’s HR practices to
all foreign locations Ñ in an effort to create an
integrated HR organisation with a common
direction and themes. Towards this objective,
CGHR4U, the Company’s HR portal which
integrates employees with Company’s
initiatives, was launched across the world.
The mission: to complete a full-fledged
implementation of CGHR4U everywhere
before the end of FY2013.
To further strengthen CG’s performance
orientation, the Performance Management
Systems (PMS) was enhanced with greater
data-based objectivity and measurement of
performance Ñ including a uniform approach
to goal setting through the creation of a
Goal Directory. Introduction of behavioural
evaluation to the PMS has contributed to more
holistic performance evaluation outcomes.
Strengthening leadership capabilities
continues as a priority area. The Company has
launched its second global programme, called
‘Leading a Global Organisation’ (LAGO), which
exposes chosen executives to international
management inputs and gives them exposure
across divisions and geographies. To
enhance functional competencies, Ô Functional
Leadership Academies’ are being conducted
globally in key areas.
At CG, increasing labour productivity
quotients are central to HR. During FY2012,
revised time standards to further improve
manpower utilisation under the Company’s
CGPS initiatives were conducted to
recalibrate expectations from the workforce.
These studies have been completed at most
of the divisions in India, and have yielded
increased productivity at various plants.
Given the tested, proven and measured
business benefits of CGPS in India, this
initiative has been extended across the globe.
It has been already completed in Indonesia
and Hungary; and is in an advanced stage of
progress in Ireland and Canada. For FY2012,
Belgium and the USA will be the focal point
for CGPS.
CORPORATE SOCIAL RESPONSIBILITYFY2012 is the sixth year of CG’s dedication
to Corporate Social Responsibility (CSR).
The Company believes that it must have a
conscious objective to support, uplift and
enhance the sustainability of the communities
surrounding its facilities at a global level.
CSR in India � In India, the theme of education continued
with CG enlarging its efforts to improve
infrastructure facilities of schools through
renovation of school buildings, providing
amenities and financial subsidies for better
teaching staff.
� CG’s theme of encouraging affirmative
action helped students in this category
Going forward, the CompanyÕ s businesses will be managed along product lines to create better global accountability for each major product line
3 8 C R O M P T O N G R E A V E S L I M I T E D A N N U A L R E P O R T 2 0 1 1 - 1 2
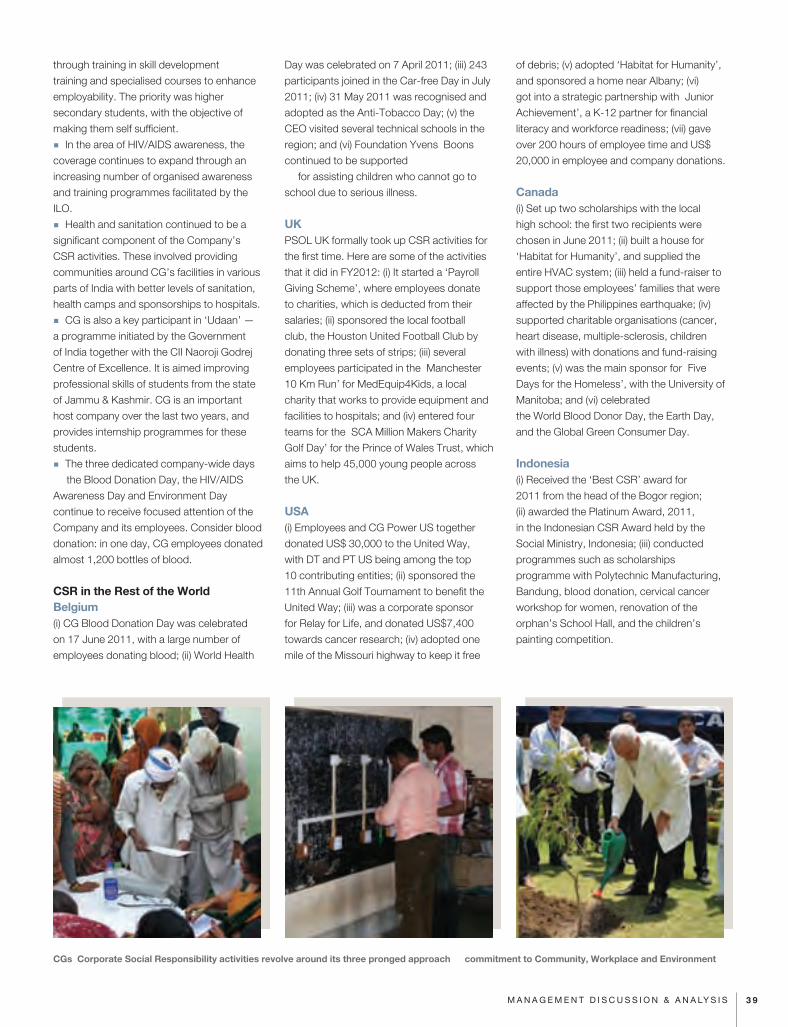
through training in skill development
training and specialised courses to enhance
employability. The priority was higher
secondary students, with the objective of
making them self sufficient.
� In the area of HIV/AIDS awareness, the
coverage continues to expand through an
increasing number of organised awareness
and training programmes facilitated by the
ILO.
� Health and sanitation continued to be a
significant component of the Company’s
CSR activities. These involved providing
communities around CG’s facilities in various
parts of India with better levels of sanitation,
health camps and sponsorships to hospitals.
� CG is also a key participant in ‘Udaan’ —
a programme initiated by the Government
of India together with the CII Naoroji Godrej
Centre of Excellence. It is aimed improving
professional skills of students from the state
of Jammu & Kashmir. CG is an important
host company over the last two years, and
provides internship programmes for these
students.
� The three dedicated company-wide days
Ñ the Blood Donation Day, the HIV/AIDS
Awareness Day and Environment Day Ñ
continue to receive focused attention of the
Company and its employees. Consider blood
donation: in one day, CG employees donated
almost 1,200 bottles of blood.
CSR in the Rest of the WorldBelgium(i) CG Blood Donation Day was celebrated
on 17 June 2011, with a large number of
employees donating blood; (ii) World Health
Day was celebrated on 7 April 2011; (iii) 243
participants joined in the Car-free Day in July
2011; (iv) 31 May 2011 was recognised and
adopted as the Anti-Tobacco Day; (v) the
CEO visited several technical schools in the
region; and (vi) Foundation YvensÐ Boons
continued to be supported
Ñ for assisting children who cannot go to
school due to serious illness.
UKPSOL UK formally took up CSR activities for
the first time. Here are some of the activities
that it did in FY2012: (i) It started a ‘Payroll
Giving Scheme’, where employees donate
to charities, which is deducted from their
salaries; (ii) sponsored the local football
club, the Houston United Football Club by
donating three sets of strips; (iii) several
employees participated in the Ô Manchester
10 Km Run’ for MedEquip4Kids, a local
charity that works to provide equipment and
facilities to hospitals; and (iv) entered four
teams for the Ô SCA Million Makers Charity
Golf Day’ for the Prince of Wales Trust, which
aims to help 45,000 young people across
the UK.
USA(i) Employees and CG Power US together
donated US$ 30,000 to the United Way,
with DT and PT US being among the top
10 contributing entities; (ii) sponsored the
11th Annual Golf Tournament to benefit the
United Way; (iii) was a corporate sponsor
for Relay for Life, and donated US$7,400
towards cancer research; (iv) adopted one
mile of the Missouri highway to keep it free
of debris; (v) adopted ‘Habitat for Humanity’,
and sponsored a home near Albany; (vi)
got into a strategic partnership with Ô Junior
Achievement’, a K-12 partner for financial
literacy and workforce readiness; (vii) gave
over 200 hours of employee time and US$
20,000 in employee and company donations.
Canada(i) Set up two scholarships with the local
high school: the first two recipients were
chosen in June 2011; (ii) built a house for
‘Habitat for Humanity’, and supplied the
entire HVAC system; (iii) held a fund-raiser to
support those employees’ families that were
affected by the Philippines earthquake; (iv)
supported charitable organisations (cancer,
heart disease, multiple-sclerosis, children
with illness) with donations and fund-raising
events; (v) was the main sponsor for Ô Five
Days for the Homeless’, with the University of
Manitoba; and (vi) celebrated
the World Blood Donor Day, the Earth Day,
and the Global Green Consumer Day.
Indonesia(i) Received the ‘Best CSR’ award for
2011 from the head of the Bogor region;
(ii) awarded the Platinum Award, 2011,
in the Indonesian CSR Award held by the
Social Ministry, Indonesia; (iii) conducted
programmes such as scholarships
programme with Polytechnic Manufacturing,
Bandung, blood donation, cervical cancer
workshop for women, renovation of the
orphan’s School Hall, and the children’s
painting competition.
CGÕs Corporate Social Responsibility activities revolve around its three pronged approach Ñ commitment to Community, Workplace and Environment
3 9M A N A G E M E N T D I S C U S S I O N & A N A LY S I S
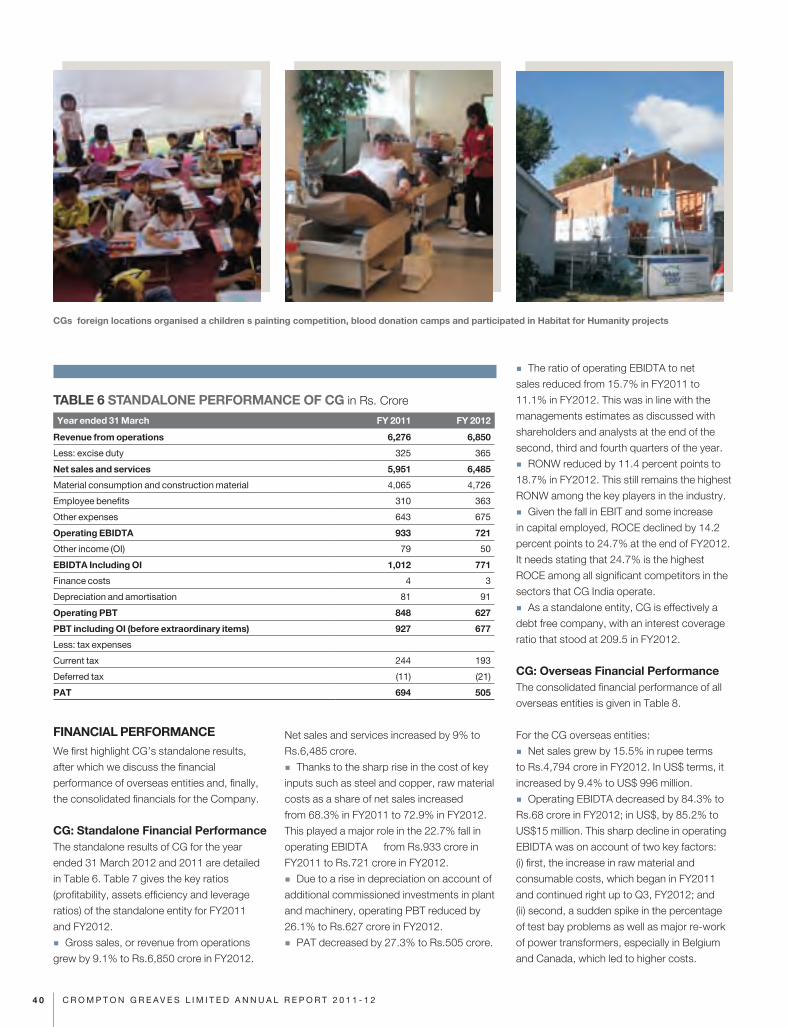
FINANCIAL PERFORMANCEWe first highlight CG’s standalone results,
after which we discuss the financial
performance of overseas entities and, finally,
the consolidated financials for the Company.
CG: Standalone Financial PerformanceThe standalone results of CG for the year
ended 31 March 2012 and 2011 are detailed
in Table 6. Table 7 gives the key ratios
(profitability, assets efficiency and leverage
ratios) of the standalone entity for FY2011
and FY2012.
� Gross sales, or revenue from operations
grew by 9.1% to Rs.6,850 crore in FY2012.
Net sales and services increased by 9% to
Rs.6,485 crore.
� Thanks to the sharp rise in the cost of key
inputs such as steel and copper, raw material
costs as a share of net sales increased
from 68.3% in FY2011 to 72.9% in FY2012.
This played a major role in the 22.7% fall in
operating EBIDTA Ñ from Rs.933 crore in
FY2011 to Rs.721 crore in FY2012.
� Due to a rise in depreciation on account of
additional commissioned investments in plant
and machinery, operating PBT reduced by
26.1% to Rs.627 crore in FY2012.
� PAT decreased by 27.3% to Rs.505 crore.
� The ratio of operating EBIDTA to net
sales reduced from 15.7% in FY2011 to
11.1% in FY2012. This was in line with the
managements estimates as discussed with
shareholders and analysts at the end of the
second, third and fourth quarters of the year.
� RONW reduced by 11.4 percent points to
18.7% in FY2012. This still remains the highest
RONW among the key players in the industry.
� Given the fall in EBIT and some increase
in capital employed, ROCE declined by 14.2
percent points to 24.7% at the end of FY2012.
It needs stating that 24.7% is the highest
ROCE among all significant competitors in the
sectors that CG India operate.
� As a standalone entity, CG is effectively a
debt free company, with an interest coverage
ratio that stood at 209.5 in FY2012.
CG: Overseas Financial PerformanceThe consolidated financial performance of all
overseas entities is given in Table 8.
For the CG overseas entities:
� Net sales grew by 15.5% in rupee terms
to Rs.4,794 crore in FY2012. In US$ terms, it
increased by 9.4% to US$ 996 million.
� Operating EBIDTA decreased by 84.3% to
Rs.68 crore in FY2012; in US$, by 85.2% to
US$15 million. This sharp decline in operating
EBIDTA was on account of two key factors:
(i) first, the increase in raw material and
consumable costs, which began in FY2011
and continued right up to Q3, FY2012; and
(ii) second, a sudden spike in the percentage
of test bay problems as well as major re-work
of power transformers, especially in Belgium
and Canada, which led to higher costs.
TABLE 6 STANDALONE PERFORMANCE OF CG in Rs. Crore
Year ended 31 March FY 2011 FY 2012
Revenue from operations 6,276 6,850
Less: excise duty 325 365
Net sales and services 5,951 6,485
Material consumption and construction material 4,065 4,726
Employee benefits 310 363
Other expenses 643 675
Operating EBIDTA 933 721
Other income (OI) 79 50
EBIDTA Including OI 1,012 771
Finance costs 4 3
Depreciation and amortisation 81 91
Operating PBT 848 627
PBT including OI (before extraordinary items) 927 677
Less: tax expenses
Current tax 244 193
Deferred tax (11) (21)
PAT 694 505
CGÕs foreign locations organised a childrenÕ s painting competition, blood donation camps and participated in Habitat for Humanity projects
4 0 C R O M P T O N G R E A V E S L I M I T E D A N N U A L R E P O R T 2 0 1 1 - 1 2
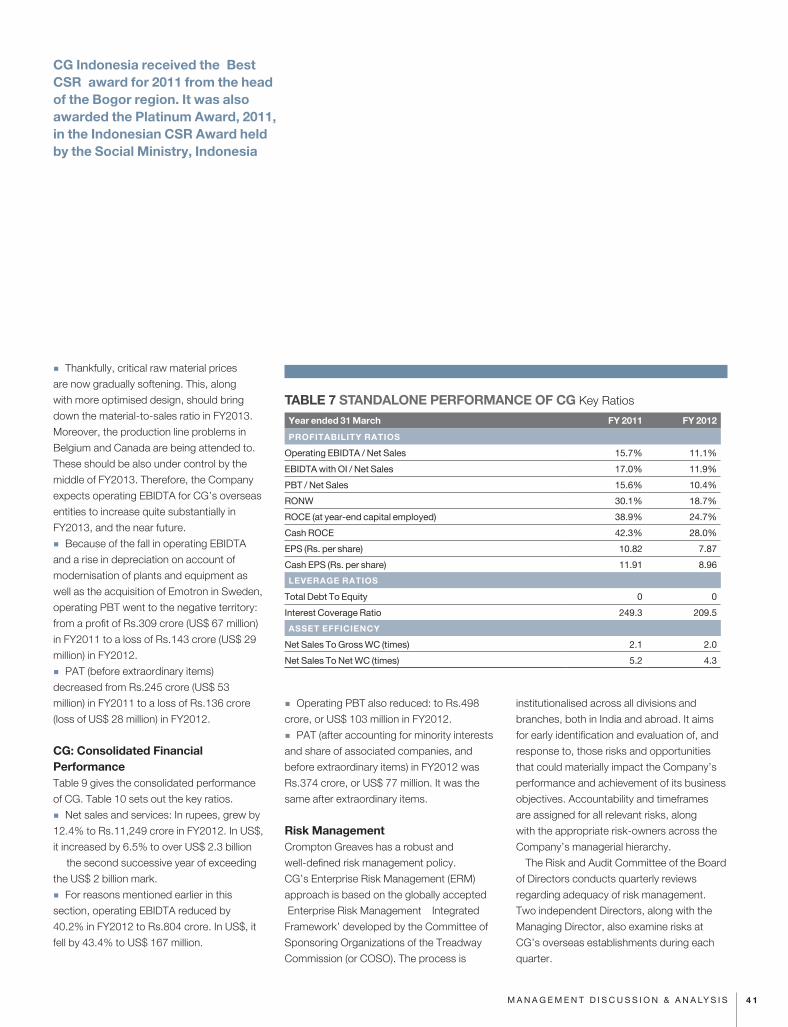
� Thankfully, critical raw material prices
are now gradually softening. This, along
with more optimised design, should bring
down the material-to-sales ratio in FY2013.
Moreover, the production line problems in
Belgium and Canada are being attended to.
These should be also under control by the
middle of FY2013. Therefore, the Company
expects operating EBIDTA for CG’s overseas
entities to increase quite substantially in
FY2013, and the near future.
� Because of the fall in operating EBIDTA
and a rise in depreciation on account of
modernisation of plants and equipment as
well as the acquisition of Emotron in Sweden,
operating PBT went to the negative territory:
from a profit of Rs.309 crore (US$ 67 million)
in FY2011 to a loss of Rs.143 crore (US$ 29
million) in FY2012.
� PAT (before extraordinary items)
decreased from Rs.245 crore (US$ 53
million) in FY2011 to a loss of Rs.136 crore
(loss of US$ 28 million) in FY2012.
CG: Consolidated Financial PerformanceTable 9 gives the consolidated performance
of CG. Table 10 sets out the key ratios.
� Net sales and services: In rupees, grew by
12.4% to Rs.11,249 crore in FY2012. In US$,
it increased by 6.5% to over US$ 2.3 billion
Ñ the second successive year of exceeding
the US$ 2 billion mark.
� For reasons mentioned earlier in this
section, operating EBIDTA reduced by
40.2% in FY2012 to Rs.804 crore. In US$, it
fell by 43.4% to US$ 167 million.
� Operating PBT also reduced: to Rs.498
crore, or US$ 103 million in FY2012.
� PAT (after accounting for minority interests
and share of associated companies, and
before extraordinary items) in FY2012 was
Rs.374 crore, or US$ 77 million. It was the
same after extraordinary items.
Risk ManagementCrompton Greaves has a robust and
well-defined risk management policy.
CG’s Enterprise Risk Management (ERM)
approach is based on the globally accepted
Ô Enterprise Risk Management Ð Integrated
Framework’ developed by the Committee of
Sponsoring Organizations of the Treadway
Commission (or COSO). The process is
institutionalised across all divisions and
branches, both in India and abroad. It aims
for early identification and evaluation of, and
response to, those risks and opportunities
that could materially impact the Company’s
performance and achievement of its business
objectives. Accountability and timeframes
are assigned for all relevant risks, along
with the appropriate risk-owners across the
Company’s managerial hierarchy.
The Risk and Audit Committee of the Board
of Directors conducts quarterly reviews
regarding adequacy of risk management.
Two independent Directors, along with the
Managing Director, also examine risks at
CG’s overseas establishments during each
quarter.
TABLE 7 STANDALONE PERFORMANCE OF CG Key Ratios
Year ended 31 March FY 2011 FY 2012
PROFITABILITY RATIOS
Operating EBIDTA / Net Sales 15.7% 11.1%
EBIDTA with OI / Net Sales 17.0% 11.9%
PBT / Net Sales 15.6% 10.4%
RONW 30.1% 18.7%
ROCE (at year-end capital employed) 38.9% 24.7%
Cash ROCE 42.3% 28.0%
EPS (Rs. per share) 10.82 7.87
Cash EPS (Rs. per share) 11.91 8.96
LEVERAGE RATIOS
Total Debt To Equity 0 0
Interest Coverage Ratio 249.3 209.5
ASSET EFFICIENCY
Net Sales To Gross WC (times) 2.1 2.0
Net Sales To Net WC (times) 5.2 4.3
CG Indonesia received the Ô Best CSRÕ award for 2011 from the head of the Bogor region. It was also awarded the Platinum Award, 2011, in the Indonesian CSR Award held by the Social Ministry, Indonesia
4 1M A N A G E M E N T D I S C U S S I O N & A N A LY S I S
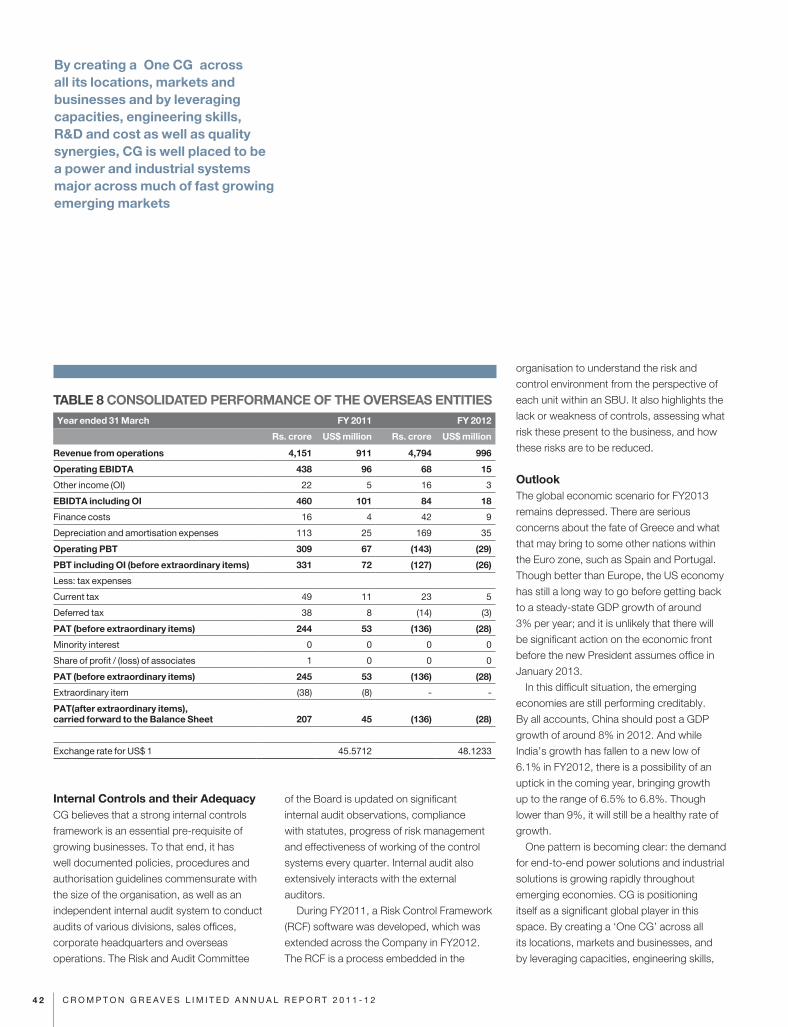
Internal Controls and their AdequacyCG believes that a strong internal controls
framework is an essential pre-requisite of
growing businesses. To that end, it has
well documented policies, procedures and
authorisation guidelines commensurate with
the size of the organisation, as well as an
independent internal audit system to conduct
audits of various divisions, sales offices,
corporate headquarters and overseas
operations. The Risk and Audit Committee
of the Board is updated on significant
internal audit observations, compliance
with statutes, progress of risk management
and effectiveness of working of the control
systems every quarter. Internal audit also
extensively interacts with the external
auditors.
During FY2011, a Risk Control Framework
(RCF) software was developed, which was
extended across the Company in FY2012.
The RCF is a process embedded in the
organisation to understand the risk and
control environment from the perspective of
each unit within an SBU. It also highlights the
lack or weakness of controls, assessing what
risk these present to the business, and how
these risks are to be reduced.
OutlookThe global economic scenario for FY2013
remains depressed. There are serious
concerns about the fate of Greece and what
that may bring to some other nations within
the Euro zone, such as Spain and Portugal.
Though better than Europe, the US economy
has still a long way to go before getting back
to a steady-state GDP growth of around
3% per year; and it is unlikely that there will
be significant action on the economic front
before the new President assumes office in
January 2013.
In this difficult situation, the emerging
economies are still performing creditably.
By all accounts, China should post a GDP
growth of around 8% in 2012. And while
India’s growth has fallen to a new low of
6.1% in FY2012, there is a possibility of an
uptick in the coming year, bringing growth
up to the range of 6.5% to 6.8%. Though
lower than 9%, it will still be a healthy rate of
growth.
One pattern is becoming clear: the demand
for end-to-end power solutions and industrial
solutions is growing rapidly throughout
emerging economies. CG is positioning
itself as a significant global player in this
space. By creating a ‘One CG’ across all
its locations, markets and businesses, and
by leveraging capacities, engineering skills,
TABLE 8 CONSOLIDATED PERFORMANCE OF THE OVERSEAS ENTITIESYear ended 31 March FY 2011 FY 2012
Rs. crore US$ million Rs. crore US$ million
Revenue from operations 4,151 911 4,794 996
Operating EBIDTA 438 96 68 15
Other income (OI) 22 5 16 3
EBIDTA including OI 460 101 84 18
Finance costs 16 4 42 9
Depreciation and amortisation expenses 113 25 169 35
Operating PBT 309 67 (143) (29)
PBT including OI (before extraordinary items) 331 72 (127) (26)
Less: tax expenses
Current tax 49 11 23 5
Deferred tax 38 8 (14) (3)
PAT (before extraordinary items) 244 53 (136) (28)
Minority interest 0 0 0 0
Share of profit / (loss) of associates 1 0 0 0
PAT (before extraordinary items) 245 53 (136) (28)
Extraordinary item (38) (8) - -
PAT(after extraordinary items), carried forward to the Balance Sheet 207 45 (136) (28)
Exchange rate for US$ 1 45.5712 48.1233
By creating a Ô One CGÕ across all its locations, markets and businesses and by leveraging capacities, engineering skills, R&D and cost as well as quality synergies, CG is well placed to be a power and industrial systems major across much of fast growing emerging markets
4 2 C R O M P T O N G R E A V E S L I M I T E D A N N U A L R E P O R T 2 0 1 1 - 1 2
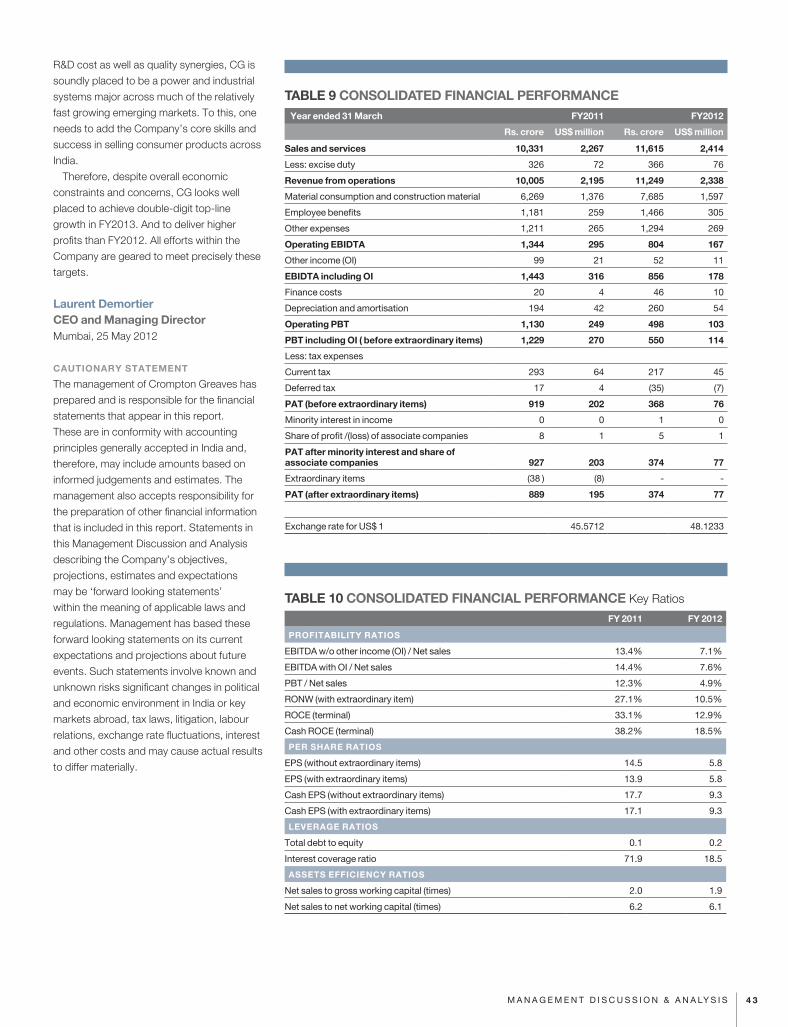
R&D cost as well as quality synergies, CG is
soundly placed to be a power and industrial
systems major across much of the relatively
fast growing emerging markets. To this, one
needs to add the Company’s core skills and
success in selling consumer products across
India.
Therefore, despite overall economic
constraints and concerns, CG looks well
placed to achieve double-digit top-line
growth in FY2013. And to deliver higher
profits than FY2012. All efforts within the
Company are geared to meet precisely these
targets.
Laurent DemortierCEO and Managing DirectorMumbai, 25 May 2012
CAUTIONARY STATEMENT
The management of Crompton Greaves has
prepared and is responsible for the financial
statements that appear in this report.
These are in conformity with accounting
principles generally accepted in India and,
therefore, may include amounts based on
informed judgements and estimates. The
management also accepts responsibility for
the preparation of other financial information
that is included in this report. Statements in
this Management Discussion and Analysis
describing the Company’s objectives,
projections, estimates and expectations
may be ‘forward looking statements’
within the meaning of applicable laws and
regulations. Management has based these
forward looking statements on its current
expectations and projections about future
events. Such statements involve known and
unknown risks significant changes in political
and economic environment in India or key
markets abroad, tax laws, litigation, labour
relations, exchange rate fluctuations, interest
and other costs and may cause actual results
to differ materially.
TABLE 10 CONSOLIDATED FINANCIAL PERFORMANCE Key Ratios
FY 2011 FY 2012
PROFITABILITY RATIOS
EBITDA w/o other income (OI) / Net sales 13.4% 7.1%
EBITDA with OI / Net sales 14.4% 7.6%
PBT / Net sales 12.3% 4.9%
RONW (with extraordinary item) 27.1% 10.5%
ROCE (terminal) 33.1% 12.9%
Cash ROCE (terminal) 38.2% 18.5%
PER SHARE RATIOS
EPS (without extraordinary items) 14.5 5.8
EPS (with extraordinary items) 13.9 5.8
Cash EPS (without extraordinary items) 17.7 9.3
Cash EPS (with extraordinary items) 17.1 9.3
LEVERAGE RATIOS
Total debt to equity 0.1 0.2
Interest coverage ratio 71.9 18.5
ASSETS EFFICIENCY RATIOS
Net sales to gross working capital (times) 2.0 1.9
Net sales to net working capital (times) 6.2 6.1
TABLE 9 CONSOLIDATED FINANCIAL PERFORMANCE Year ended 31 March FY2011 FY2012
Rs. crore US$ million Rs. crore US$ million
Sales and services 10,331 2,267 11,615 2,414
Less: excise duty 326 72 366 76
Revenue from operations 10,005 2,195 11,249 2,338
Material consumption and construction material 6,269 1,376 7,685 1,597
Employee benefits 1,181 259 1,466 305
Other expenses 1,211 265 1,294 269
Operating EBIDTA 1,344 295 804 167
Other income (OI) 99 21 52 11
EBIDTA including OI 1,443 316 856 178
Finance costs 20 4 46 10
Depreciation and amortisation 194 42 260 54
Operating PBT 1,130 249 498 103
PBT including OI ( before extraordinary items) 1,229 270 550 114
Less: tax expenses
Current tax 293 64 217 45
Deferred tax 17 4 (35) (7)
PAT (before extraordinary items) 919 202 368 76
Minority interest in income 0 0 1 0
Share of profit /(loss) of associate companies 8 1 5 1
PAT after minority interest and share of associate companies 927 203 374 77
Extraordinary items (38 ) (8) - -
PAT (after extraordinary items) 889 195 374 77
Exchange rate for US$ 1 45.5712 48.1233
4 3M A N A G E M E N T D I S C U S S I O N & A N A LY S I S
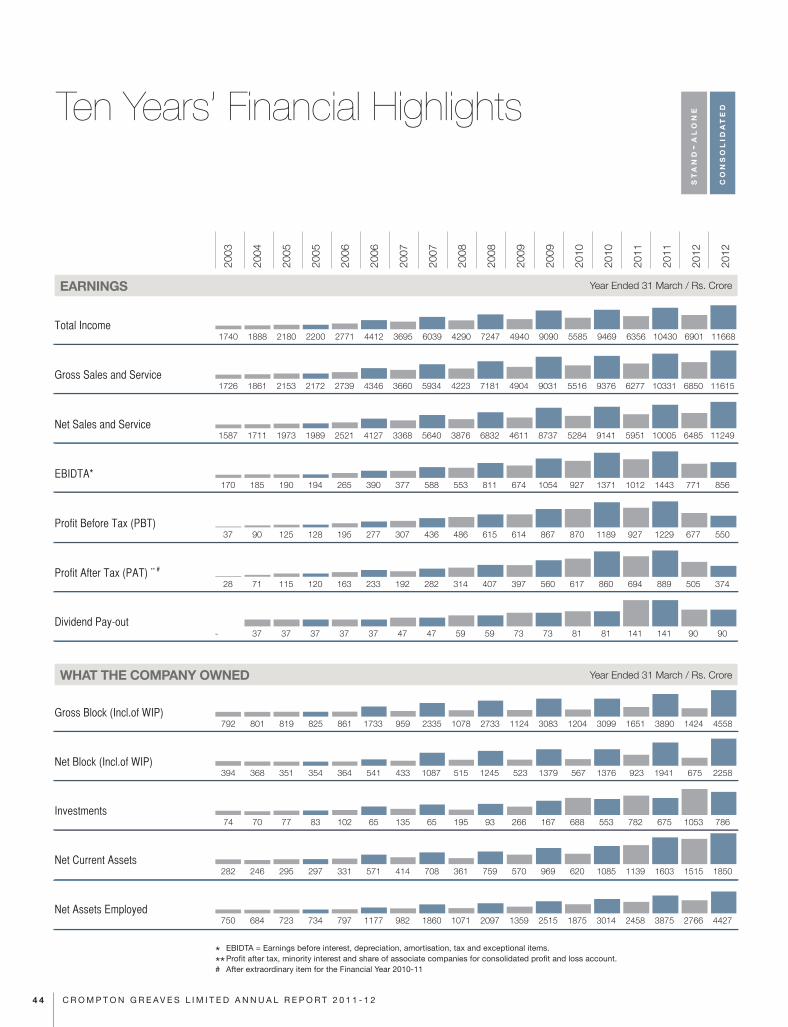
STAND-ALONE
CONSOLID
ATED
2003
2004
2005
2005
2006
2006
2007
2007
2008
2008
2009
2009
2010
2010
2011
2011
2012
2012
EARNINGS Year Ended 31 March / Rs. Crore
1740 1888 2180 2200 2771 4412 3695 6039 4290 7247 4940 9090 5585 9469 6356 10430 6901 11668
792 801 819 825 861 1733 959 2335 1078 2733 1124 3083 1204 3099 1651 3890 1424 4558
394 368 351 354 364 541 433 1087 515 1245 523 1379 567 1376 923 1941 675 2258
74 70 77 83 102 65 135 65 195 93 266 167 688 553 782 675 1053 786
282 246 295 297 331 571 414 708 361 759 570 969 620 1085 1139 1603 1515 1850
750 684 723 734 797 1177 982 1860 1071 2097 1359 2515 1875 3014 2458 3875 2766 4427
1726 1861 2153 2172 2739 4346 3660 5934 4223 7181 4904 9031 5516 9376 6277 10331 6850 11615
1587 1711 1973 1989 2521 4127 3368 5640 3876 6832 4611 8737 5284 9141 5951 10005 6485 11249
170 185 190 194 265 390 377 588 553 811 674 1054 927 1371 1012 1443 771 856
37 90 125 128 195 277 307 436 486 615 614 867 870 1189 927 1229 677 550
28 71 115 120 163 233 192 282 314 407 397 560 617 860 694 889 505 374
- 37 37 37 37 37 47 47 59 59 73 73 81 81 141 141 90 90
WHAT THE COMPANY OWNED Year Ended 31 March / Rs. Crore
2003
2004
2005
2005
2006
2006
2007
2007
2008
2008
2009
2009
2010
2010
2011
2011
2012
2012
WHAT THE COMPANY OWED Year Ended 31 March / Rs. Crore
459 334 315 315 250 422 270 904 88 842 54 718 27 501 13 470 7.5 1044
52 52 52 52 52 52 73 73 73 73 73 73 128 128 128 128 128 128
403 288 356 367 484 733 601 896 858 1229 1169 1758 1637 2376 2176 3146 2573 3483
1033 982 912 915 1052 1970 1317 3139 1383 3484 1570 3919 1627 3518 1712 3874 1826 5003
442 340 408 419 536 785 674 969 931 1302 1242 1831 1765 2504 2304 3275 2701 3611
291 340 408 419 536 742 674 927 931 1243 1242 1783 1765 2504 2304 3275 2701 3560
NET WORTH OF THE COMPANY Year Ended 31 March / Rs. Crore
4.5 5.3 6.4 6.5 8.4 11.6 10.5 14.5 14.5 19.4 19.4 27.8 27.5 39.0 35.9 51.0 42.1 55.5
0.44 1.10 1.79 1.87 2.54 3.63 3.00 4.39 4.89 6.34 6.19 8.73 9.62 13.40 10.82 13.85 7.87 5.82
RATIOS Year Ended 31 March
1.74 2.12 2.45 2.53 3.40 5.03 4.03 6.48 5.76 8.36 7.08 11.22 10.74 16.62 11.91 17.13 8.96 9.34
1.49 1.38 1.49 1.5 1.41 1.37 1.39 1.32 1.28 1.29 1.38 1.3 1.39 1.36 1.70 1.48 1.84 1.45
1.58 0.98 0.77 0.75 0.47 0.57 0.4 0.98 0.09 0.68 0.04 0.4 0.02 0.2 0.00 0.09 0.00 0.17
10.7 10.8 9.6 9.8 10.5 9.4 11.2 10.4 14.3 11.9 14.6 12.1 17.5 15.0 17.0 14.4 11.9 7.6
9.6 20.9 28.2 28.6 30.4 31.4 28.5 30.4 33.7 32.7 32.0 31.4 35.0 34.3 30.1 27.1 18.7 10.5
4.0 4.6 5.6 5.6 6.9 7.6 7.8 5.2 7.5 5.5 8.8 6.3 9.3 6.6 6.5 5.2 9.6 5.0
5707 5470 5256 8174 4916 7801 4912 7972 5002 8307 5094 8564 5116 8647 5214 8702 5365 8966
Total Income
Gross Sales and Service
Net Sales and Service
EBIDTA*
Profit Before Tax (PBT)
Profit After Tax (PAT) ** #
Dividend Pay-out
Gross Block (Incl.of WIP)
Net Block (Incl.of WIP)
Investments
Net Current Assets
Net Assets Employed
Borrowings
Total Liabilities
Shareholders’ Funds
Tangible Net Worth***
Share Capital
Reserves and Surplus
Book Value Per Share (In Rs.)
Earnings Per Share (In Rs.) #
Cash Earnings Per Share (In Rs.) #
Current Ratio
Debt Equity Ratio
EBIDTA/Net Sales %
Return on Tangible Net Worth %
Fixed Assets Turnover Ratio (times)
No. of Permanent Employees
* EBIDTA = Earnings before interest, depreciation, amortisation, tax and exceptional items.
** Profit after tax, minority interest and share of associate companies for consolidated profit and loss account.# After extraordinary item for the Financial Year 2010-11
*** Tangible Net Worth = Shareholders' Funds – Miscellaneous Exps. (unamortised) – Deferred Tax Asset (net). # After extraordinary item for the Financial Year 2010-11. Basis for Net Current Assets, Net Assets employed, Current ratio and Debt Equity ratio, for the year 2011 & 2012 are as per the revised Schedule VI of the Companies Act, 1956, as notified by Ministry of Corporate Affairs.
Ten Years’ Financial Highlights
4 4 C R O M P T O N G R E A V E S L I M I T E D A N N U A L R E P O R T 2 0 1 1 - 1 2
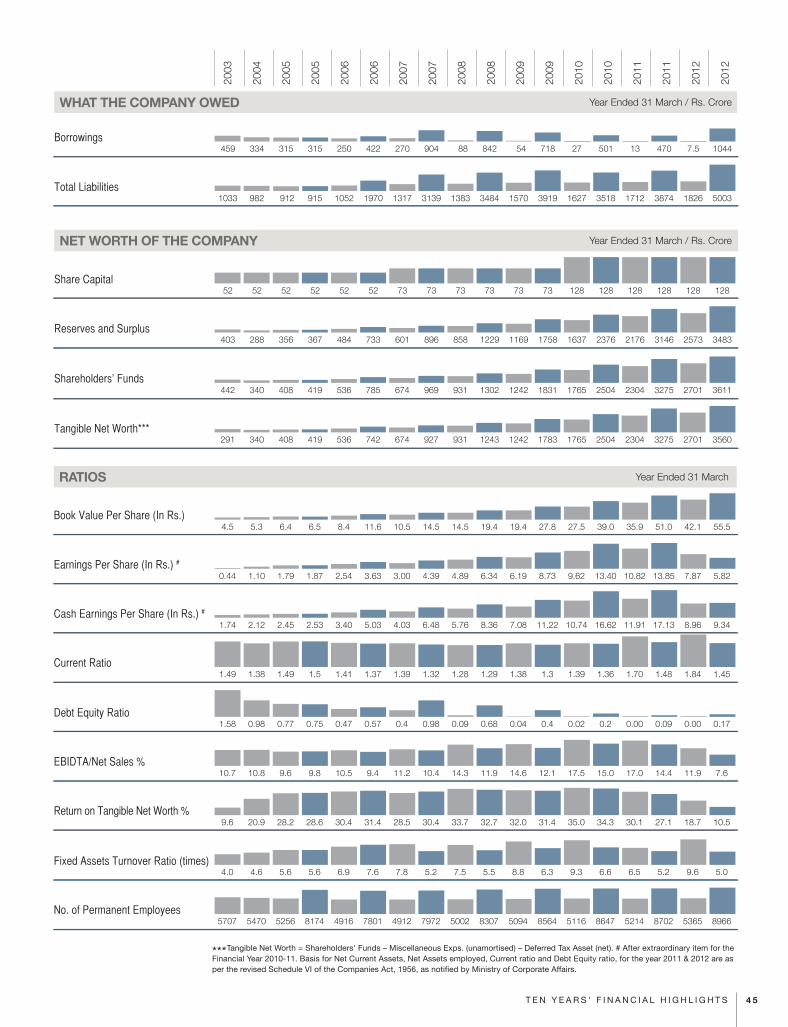
STAND-ALONE
CONSOLID
ATED
2003
2004
2005
2005
2006
2006
2007
2007
2008
2008
2009
2009
2010
2010
2011
2011
2012
2012
EARNINGS Year Ended 31 March / Rs. Crore
1740 1888 2180 2200 2771 4412 3695 6039 4290 7247 4940 9090 5585 9469 6356 10430 6901 11668
792 801 819 825 861 1733 959 2335 1078 2733 1124 3083 1204 3099 1651 3890 1424 4558
394 368 351 354 364 541 433 1087 515 1245 523 1379 567 1376 923 1941 675 2258
74 70 77 83 102 65 135 65 195 93 266 167 688 553 782 675 1053 786
282 246 295 297 331 571 414 708 361 759 570 969 620 1085 1139 1603 1515 1850
750 684 723 734 797 1177 982 1860 1071 2097 1359 2515 1875 3014 2458 3875 2766 4427
1726 1861 2153 2172 2739 4346 3660 5934 4223 7181 4904 9031 5516 9376 6277 10331 6850 11615
1587 1711 1973 1989 2521 4127 3368 5640 3876 6832 4611 8737 5284 9141 5951 10005 6485 11249
170 185 190 194 265 390 377 588 553 811 674 1054 927 1371 1012 1443 771 856
37 90 125 128 195 277 307 436 486 615 614 867 870 1189 927 1229 677 550
28 71 115 120 163 233 192 282 314 407 397 560 617 860 694 889 505 374
- 37 37 37 37 37 47 47 59 59 73 73 81 81 141 141 90 90
WHAT THE COMPANY OWNED Year Ended 31 March / Rs. Crore
2003
2004
2005
2005
2006
2006
2007
2007
2008
2008
2009
2009
2010
2010
2011
2011
2012
2012
WHAT THE COMPANY OWED Year Ended 31 March / Rs. Crore
459 334 315 315 250 422 270 904 88 842 54 718 27 501 13 470 7.5 1044
52 52 52 52 52 52 73 73 73 73 73 73 128 128 128 128 128 128
403 288 356 367 484 733 601 896 858 1229 1169 1758 1637 2376 2176 3146 2573 3483
1033 982 912 915 1052 1970 1317 3139 1383 3484 1570 3919 1627 3518 1712 3874 1826 5003
442 340 408 419 536 785 674 969 931 1302 1242 1831 1765 2504 2304 3275 2701 3611
291 340 408 419 536 742 674 927 931 1243 1242 1783 1765 2504 2304 3275 2701 3560
NET WORTH OF THE COMPANY Year Ended 31 March / Rs. Crore
4.5 5.3 6.4 6.5 8.4 11.6 10.5 14.5 14.5 19.4 19.4 27.8 27.5 39.0 35.9 51.0 42.1 55.5
0.44 1.10 1.79 1.87 2.54 3.63 3.00 4.39 4.89 6.34 6.19 8.73 9.62 13.40 10.82 13.85 7.87 5.82
RATIOS Year Ended 31 March
1.74 2.12 2.45 2.53 3.40 5.03 4.03 6.48 5.76 8.36 7.08 11.22 10.74 16.62 11.91 17.13 8.96 9.34
1.49 1.38 1.49 1.5 1.41 1.37 1.39 1.32 1.28 1.29 1.38 1.3 1.39 1.36 1.70 1.48 1.84 1.45
1.58 0.98 0.77 0.75 0.47 0.57 0.4 0.98 0.09 0.68 0.04 0.4 0.02 0.2 0.00 0.09 0.00 0.17
10.7 10.8 9.6 9.8 10.5 9.4 11.2 10.4 14.3 11.9 14.6 12.1 17.5 15.0 17.0 14.4 11.9 7.6
9.6 20.9 28.2 28.6 30.4 31.4 28.5 30.4 33.7 32.7 32.0 31.4 35.0 34.3 30.1 27.1 18.7 10.5
4.0 4.6 5.6 5.6 6.9 7.6 7.8 5.2 7.5 5.5 8.8 6.3 9.3 6.6 6.5 5.2 9.6 5.0
5707 5470 5256 8174 4916 7801 4912 7972 5002 8307 5094 8564 5116 8647 5214 8702 5365 8966
Total Income
Gross Sales and Service
Net Sales and Service
EBIDTA*
Profit Before Tax (PBT)
Profit After Tax (PAT) ** #
Dividend Pay-out
Gross Block (Incl.of WIP)
Net Block (Incl.of WIP)
Investments
Net Current Assets
Net Assets Employed
Borrowings
Total Liabilities
Shareholders’ Funds
Tangible Net Worth***
Share Capital
Reserves and Surplus
Book Value Per Share (In Rs.)
Earnings Per Share (In Rs.) #
Cash Earnings Per Share (In Rs.) #
Current Ratio
Debt Equity Ratio
EBIDTA/Net Sales %
Return on Tangible Net Worth %
Fixed Assets Turnover Ratio (times)
No. of Permanent Employees
* EBIDTA = Earnings before interest, depreciation, amortisation, tax and exceptional items.
** Profit after tax, minority interest and share of associate companies for consolidated profit and loss account.# After extraordinary item for the Financial Year 2010-11
*** Tangible Net Worth = Shareholders' Funds – Miscellaneous Exps. (unamortised) – Deferred Tax Asset (net). # After extraordinary item for the Financial Year 2010-11. Basis for Net Current Assets, Net Assets employed, Current ratio and Debt Equity ratio, for the year 2011 & 2012 are as per the revised Schedule VI of the Companies Act, 1956, as notified by Ministry of Corporate Affairs.
Ten Years’ Financial Highlights
4 5T E N Y E A R S ' F I N A N C I A L H I G H L I G H T S

DirectorsÕ Report
Installation of 245 kV GIS in Triege, Denmark
4 6 C R O M P T O N G R E A V E S L I M I T E D A N N U A L R E P O R T 2 0 1 1 - 1 2
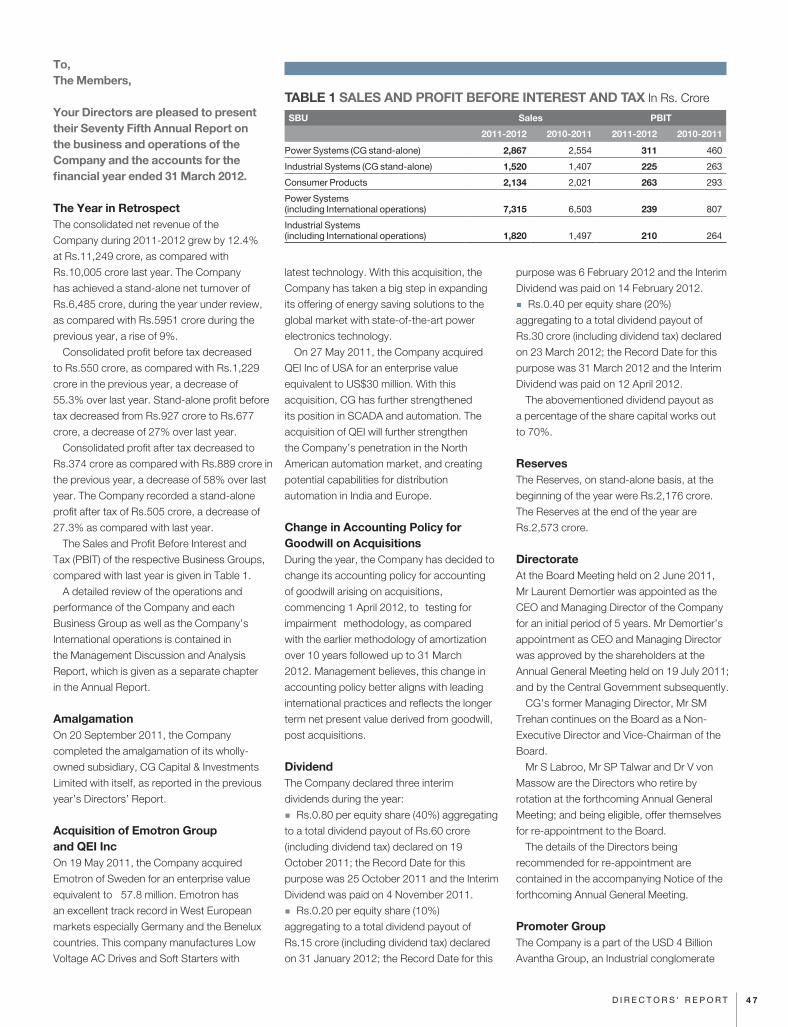
To,The Members,
Your Directors are pleased to present their Seventy Fifth Annual Report on the business and operations of the Company and the accounts for the financial year ended 31 March 2012.
The Year in RetrospectThe consolidated net revenue of the
Company during 2011-2012 grew by 12.4%
at Rs.11,249 crore, as compared with
Rs.10,005 crore last year. The Company
has achieved a stand-alone net turnover of
Rs.6,485 crore, during the year under review,
as compared with Rs.5951 crore during the
previous year, a rise of 9%.
Consolidated profit before tax decreased
to Rs.550 crore, as compared with Rs.1,229
crore in the previous year, a decrease of
55.3% over last year. Stand-alone profit before
tax decreased from Rs.927 crore to Rs.677
crore, a decrease of 27% over last year.
Consolidated profit after tax decreased to
Rs.374 crore as compared with Rs.889 crore in
the previous year, a decrease of 58% over last
year. The Company recorded a stand-alone
profit after tax of Rs.505 crore, a decrease of
27.3% as compared with last year.
The Sales and Profit Before Interest and
Tax (PBIT) of the respective Business Groups,
compared with last year is given in Table 1.
A detailed review of the operations and
performance of the Company and each
Business Group as well as the Company’s
International operations is contained in
the Management Discussion and Analysis
Report, which is given as a separate chapter
in the Annual Report.
Amalgamation On 20 September 2011, the Company
completed the amalgamation of its wholly-
owned subsidiary, CG Capital & Investments
Limited with itself, as reported in the previous
year’s Directors’ Report.
Acquisition of Emotron Group and QEI IncOn 19 May 2011, the Company acquired
Emotron of Sweden for an enterprise value
equivalent to Û 57.8 million. Emotron has
an excellent track record in West European
markets especially Germany and the Benelux
countries. This company manufactures Low
Voltage AC Drives and Soft Starters with
latest technology. With this acquisition, the
Company has taken a big step in expanding
its offering of energy saving solutions to the
global market with state-of-the-art power
electronics technology.
On 27 May 2011, the Company acquired
QEI Inc of USA for an enterprise value
equivalent to US$30 million. With this
acquisition, CG has further strengthened
its position in SCADA and automation. The
acquisition of QEI will further strengthen
the Company’s penetration in the North
American automation market, and creating
potential capabilities for distribution
automation in India and Europe.
Change in Accounting Policy for Goodwill on Acquisitions During the year, the Company has decided to
change its accounting policy for accounting
of goodwill arising on acquisitions,
commencing 1 April 2012, to Ò testing for
impairmentÓ methodology, as compared
with the earlier methodology of amortization
over 10 years followed up to 31 March
2012. Management believes, this change in
accounting policy better aligns with leading
international practices and reflects the longer
term net present value derived from goodwill,
post acquisitions.
DividendThe Company declared three interim
dividends during the year:
� Rs.0.80 per equity share (40%) aggregating
to a total dividend payout of Rs.60 crore
(including dividend tax) declared on 19
October 2011; the Record Date for this
purpose was 25 October 2011 and the Interim
Dividend was paid on 4 November 2011.
� Rs.0.20 per equity share (10%)
aggregating to a total dividend payout of
Rs.15 crore (including dividend tax) declared
on 31 January 2012; the Record Date for this
purpose was 6 February 2012 and the Interim
Dividend was paid on 14 February 2012.
� Rs.0.40 per equity share (20%)
aggregating to a total dividend payout of
Rs.30 crore (including dividend tax) declared
on 23 March 2012; the Record Date for this
purpose was 31 March 2012 and the Interim
Dividend was paid on 12 April 2012.
The abovementioned dividend payout as
a percentage of the share capital works out
to 70%.
ReservesThe Reserves, on stand-alone basis, at the
beginning of the year were Rs.2,176 crore.
The Reserves at the end of the year are
Rs.2,573 crore.
DirectorateAt the Board Meeting held on 2 June 2011,
Mr Laurent Demortier was appointed as the
CEO and Managing Director of the Company
for an initial period of 5 years. Mr Demortier’s
appointment as CEO and Managing Director
was approved by the shareholders at the
Annual General Meeting held on 19 July 2011;
and by the Central Government subsequently.
CG’s former Managing Director, Mr SM
Trehan continues on the Board as a Non-
Executive Director and Vice-Chairman of the
Board.
Mr S Labroo, Mr SP Talwar and Dr V von
Massow are the Directors who retire by
rotation at the forthcoming Annual General
Meeting; and being eligible, offer themselves
for re-appointment to the Board.
The details of the Directors being
recommended for re-appointment are
contained in the accompanying Notice of the
forthcoming Annual General Meeting.
Promoter Group The Company is a part of the USD 4 Billion
Avantha Group, an Industrial conglomerate
TABLE 1 SALES AND PROFIT BEFORE INTEREST AND TAX In Rs. Crore
SBU Sales PBIT
2011-2012 2010-2011 2011-2012 2010-2011
Power Systems (CG stand-alone) 2,867 2,554 311 460
Industrial Systems (CG stand-alone) 1,520 1,407 225 263
Consumer Products 2,134 2,021 263 293
Power Systems (including International operations) 7,315 6,503 239 807
Industrial Systems (including International operations) 1,820 1,497 210 264
4 7D I R E C T O R S ' R E P O R T
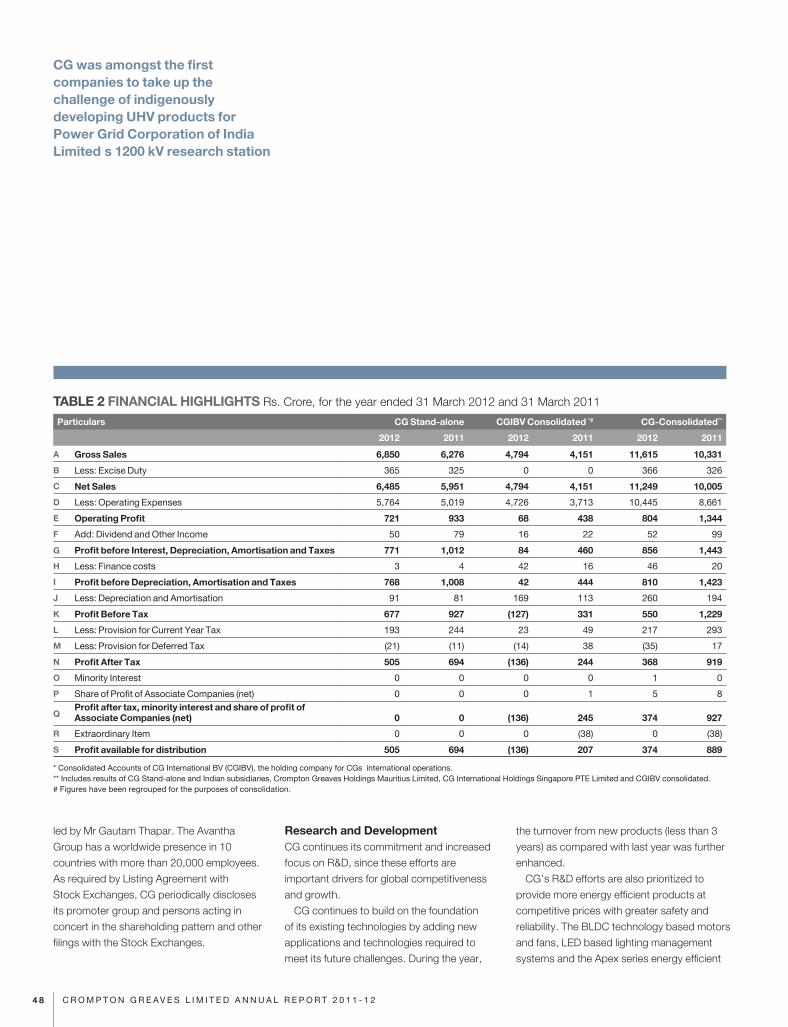
led by Mr Gautam Thapar. The Avantha
Group has a worldwide presence in 10
countries with more than 20,000 employees.
As required by Listing Agreement with
Stock Exchanges, CG periodically discloses
its promoter group and persons acting in
concert in the shareholding pattern and other
filings with the Stock Exchanges.
Research and Development CG continues its commitment and increased
focus on R&D, since these efforts are
important drivers for global competitiveness
and growth.
CG continues to build on the foundation
of its existing technologies by adding new
applications and technologies required to
meet its future challenges. During the year,
the turnover from new products (less than 3
years) as compared with last year was further
enhanced.
CG’s R&D efforts are also prioritized to
provide more energy efficient products at
competitive prices with greater safety and
reliability. The BLDC technology based motors
and fans, LED based lighting management
systems and the Apex series energy efficient
TABLE 2 FINANCIAL HIGHLIGHTS Rs. Crore, for the year ended 31 March 2012 and 31 March 2011
Particulars CG Stand-alone CGIBV Consolidated *# CG-Consolidated**
2012 2011 2012 2011 2012 2011
A Gross Sales 6,850 6,276 4,794 4,151 11,615 10,331
B Less: Excise Duty 365 325 0 0 366 326
C Net Sales 6,485 5,951 4,794 4,151 11,249 10,005
D Less: Operating Expenses 5,764 5,019 4,726 3,713 10,445 8,661
E Operating Profit 721 933 68 438 804 1,344
F Add: Dividend and Other Income 50 79 16 22 52 99
G Profit before Interest, Depreciation, Amortisation and Taxes 771 1,012 84 460 856 1,443
H Less: Finance costs 3 4 42 16 46 20
I Profit before Depreciation, Amortisation and Taxes 768 1,008 42 444 810 1,423
J Less: Depreciation and Amortisation 91 81 169 113 260 194
K Profit Before Tax 677 927 (127) 331 550 1,229
L Less: Provision for Current Year Tax 193 244 23 49 217 293
M Less: Provision for Deferred Tax (21) (11) (14) 38 (35) 17
N Profit After Tax 505 694 (136) 244 368 919
O Minority Interest 0 0 0 0 1 0
P Share of Profit of Associate Companies (net) 0 0 0 1 5 8
QProfit after tax, minority interest and share of profit of Associate Companies (net) 0 0 (136) 245 374 927
R Extraordinary Item 0 0 0 (38) 0 (38)
S Profit available for distribution 505 694 (136) 207 374 889
* Consolidated Accounts of CG International BV (CGIBV), the holding company for CGÕs international operations. ** Includes results of CG Stand-alone and Indian subsidiaries, Crompton Greaves Holdings Mauritius Limited, CG International Holdings Singapore PTE Limited and CGIBV consolidated. # Figures have been regrouped for the purposes of consolidation.
CG was amongst the first companies to take up the challenge of indigenously developing UHV products for Power Grid Corporation of India LimitedÕ s 1200 kV research station
4 8 C R O M P T O N G R E A V E S L I M I T E D A N N U A L R E P O R T 2 0 1 1 - 1 2
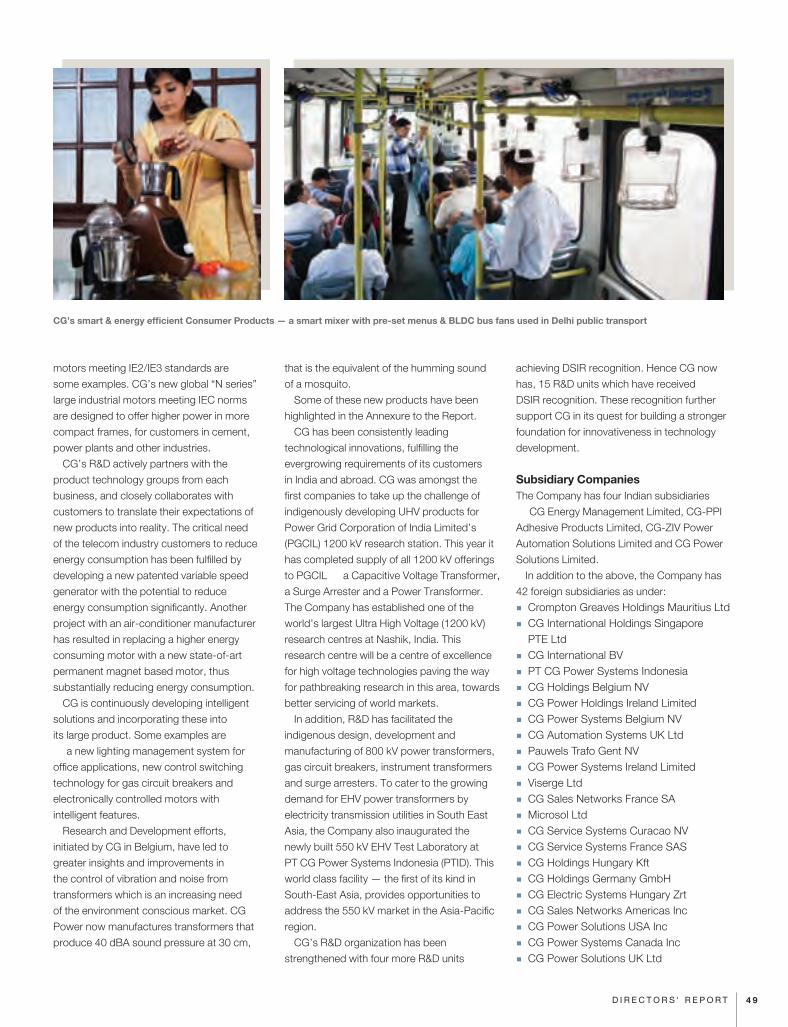
motors meeting IE2/IE3 standards are
some examples. CG’s new global “N series”
large industrial motors meeting IEC norms
are designed to offer higher power in more
compact frames, for customers in cement,
power plants and other industries.
CG’s R&D actively partners with the
product technology groups from each
business, and closely collaborates with
customers to translate their expectations of
new products into reality. The critical need
of the telecom industry customers to reduce
energy consumption has been fulfilled by
developing a new patented variable speed
generator with the potential to reduce
energy consumption significantly. Another
project with an air-conditioner manufacturer
has resulted in replacing a higher energy
consuming motor with a new state-of-art
permanent magnet based motor, thus
substantially reducing energy consumption.
CG is continuously developing intelligent
solutions and incorporating these into
its large product. Some examples are
Ñ a new lighting management system for
office applications, new control switching
technology for gas circuit breakers and
electronically controlled motors with
intelligent features.
Research and Development efforts,
initiated by CG in Belgium, have led to
greater insights and improvements in
the control of vibration and noise from
transformers which is an increasing need
of the environment conscious market. CG
Power now manufactures transformers that
produce 40 dBA sound pressure at 30 cm,
that is the equivalent of the humming sound
of a mosquito.
Some of these new products have been
highlighted in the Annexure to the Report.
CG has been consistently leading
technological innovations, fulfilling the
evergrowing requirements of its customers
in India and abroad. CG was amongst the
first companies to take up the challenge of
indigenously developing UHV products for
Power Grid Corporation of India Limited’s
(PGCIL) 1200 kV research station. This year it
has completed supply of all 1200 kV offerings
to PGCIL Ñ a Capacitive Voltage Transformer,
a Surge Arrester and a Power Transformer.
The Company has established one of the
world’s largest Ultra High Voltage (1200 kV)
research centres at Nashik, India. This
research centre will be a centre of excellence
for high voltage technologies paving the way
for pathbreaking research in this area, towards
better servicing of world markets.
In addition, R&D has facilitated the
indigenous design, development and
manufacturing of 800 kV power transformers,
gas circuit breakers, instrument transformers
and surge arresters. To cater to the growing
demand for EHV power transformers by
electricity transmission utilities in South East
Asia, the Company also inaugurated the
newly built 550 kV EHV Test Laboratory at
PT CG Power Systems Indonesia (PTID). This
world class facility — the first of its kind in
South-East Asia, provides opportunities to
address the 550 kV market in the Asia-Pacific
region.
CG’s R&D organization has been
strengthened with four more R&D units
achieving DSIR recognition. Hence CG now
has, 15 R&D units which have received
DSIR recognition. These recognition further
support CG in its quest for building a stronger
foundation for innovativeness in technology
development.
Subsidiary CompaniesThe Company has four Indian subsidiaries
Ñ CG Energy Management Limited, CG-PPI
Adhesive Products Limited, CG-ZIV Power
Automation Solutions Limited and CG Power
Solutions Limited.
In addition to the above, the Company has
42 foreign subsidiaries as under:
� Crompton Greaves Holdings Mauritius Ltd
� CG International Holdings Singapore PTE Ltd
� CG International BV
� PT CG Power Systems Indonesia
� CG Holdings Belgium NV
� CG Power Holdings Ireland Limited
� CG Power Systems Belgium NV
� CG Automation Systems UK Ltd
� Pauwels Trafo Gent NV
� CG Power Systems Ireland Limited
� Viserge Ltd
� CG Sales Networks France SA
� Microsol Ltd
� CG Service Systems Curacao NV
� CG Service Systems France SAS
� CG Holdings Hungary Kft
� CG Holdings Germany GmbH
� CG Electric Systems Hungary Zrt
� CG Sales Networks Americas Inc
� CG Power Solutions USA Inc
� CG Power Systems Canada Inc
� CG Power Solutions UK Ltd
CG’s smart & energy efficient Consumer Products — a smart mixer with pre-set menus & BLDC bus fans used in Delhi public transport
4 9D I R E C T O R S ' R E P O R T
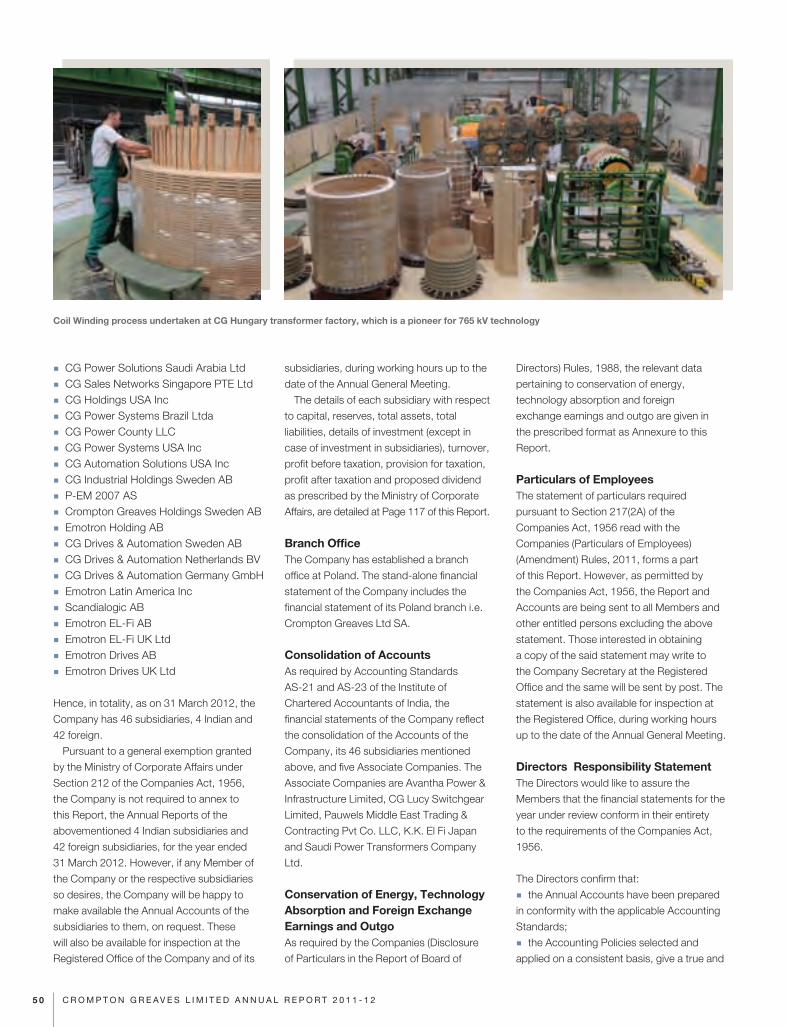
� CG Power Solutions Saudi Arabia Ltd
� CG Sales Networks Singapore PTE Ltd
� CG Holdings USA Inc
� CG Power Systems Brazil Ltda
� CG Power County LLC
� CG Power Systems USA Inc
� CG Automation Solutions USA Inc
� CG Industrial Holdings Sweden AB
� P-EM 2007 AS
� Crompton Greaves Holdings Sweden AB
� Emotron Holding AB
� CG Drives & Automation Sweden AB
� CG Drives & Automation Netherlands BV
� CG Drives & Automation Germany GmbH
� Emotron Latin America Inc
� Scandialogic AB
� Emotron EL-Fi AB
� Emotron EL-Fi UK Ltd
� Emotron Drives AB
� Emotron Drives UK Ltd
Hence, in totality, as on 31 March 2012, the
Company has 46 subsidiaries, 4 Indian and
42 foreign.
Pursuant to a general exemption granted
by the Ministry of Corporate Affairs under
Section 212 of the Companies Act, 1956,
the Company is not required to annex to
this Report, the Annual Reports of the
abovementioned 4 Indian subsidiaries and
42 foreign subsidiaries, for the year ended
31 March 2012. However, if any Member of
the Company or the respective subsidiaries
so desires, the Company will be happy to
make available the Annual Accounts of the
subsidiaries to them, on request. These
will also be available for inspection at the
Registered Office of the Company and of its
subsidiaries, during working hours up to the
date of the Annual General Meeting.
The details of each subsidiary with respect
to capital, reserves, total assets, total
liabilities, details of investment (except in
case of investment in subsidiaries), turnover,
profit before taxation, provision for taxation,
profit after taxation and proposed dividend
as prescribed by the Ministry of Corporate
Affairs, are detailed at Page 117 of this Report.
Branch OfficeThe Company has established a branch
office at Poland. The stand-alone financial
statement of the Company includes the
financial statement of its Poland branch i.e.
Crompton Greaves Ltd SA.
Consolidation of AccountsAs required by Accounting Standards
AS-21 and AS-23 of the Institute of
Chartered Accountants of India, the
financial statements of the Company reflect
the consolidation of the Accounts of the
Company, its 46 subsidiaries mentioned
above, and five Associate Companies. The
Associate Companies are Avantha Power &
Infrastructure Limited, CG Lucy Switchgear
Limited, Pauwels Middle East Trading &
Contracting Pvt Co. LLC, K.K. El Fi Japan
and Saudi Power Transformers Company
Ltd.
Conservation of Energy, Technology Absorption and Foreign Exchange Earnings and OutgoAs required by the Companies (Disclosure
of Particulars in the Report of Board of
Directors) Rules, 1988, the relevant data
pertaining to conservation of energy,
technology absorption and foreign
exchange earnings and outgo are given in
the prescribed format as Annexure to this
Report.
Particulars of Employees The statement of particulars required
pursuant to Section 217(2A) of the
Companies Act, 1956 read with the
Companies (Particulars of Employees)
(Amendment) Rules, 2011, forms a part
of this Report. However, as permitted by
the Companies Act, 1956, the Report and
Accounts are being sent to all Members and
other entitled persons excluding the above
statement. Those interested in obtaining
a copy of the said statement may write to
the Company Secretary at the Registered
Office and the same will be sent by post. The
statement is also available for inspection at
the Registered Office, during working hours
up to the date of the Annual General Meeting.
DirectorsÕ Responsibility StatementThe Directors would like to assure the
Members that the financial statements for the
year under review conform in their entirety
to the requirements of the Companies Act,
1956.
The Directors confirm that:
� the Annual Accounts have been prepared
in conformity with the applicable Accounting
Standards;
� the Accounting Policies selected and
applied on a consistent basis, give a true and
Coil Winding process undertaken at CG Hungary transformer factory, which is a pioneer for 765 kV technology
5 0 C R O M P T O N G R E A V E S L I M I T E D A N N U A L R E P O R T 2 0 1 1 - 1 2
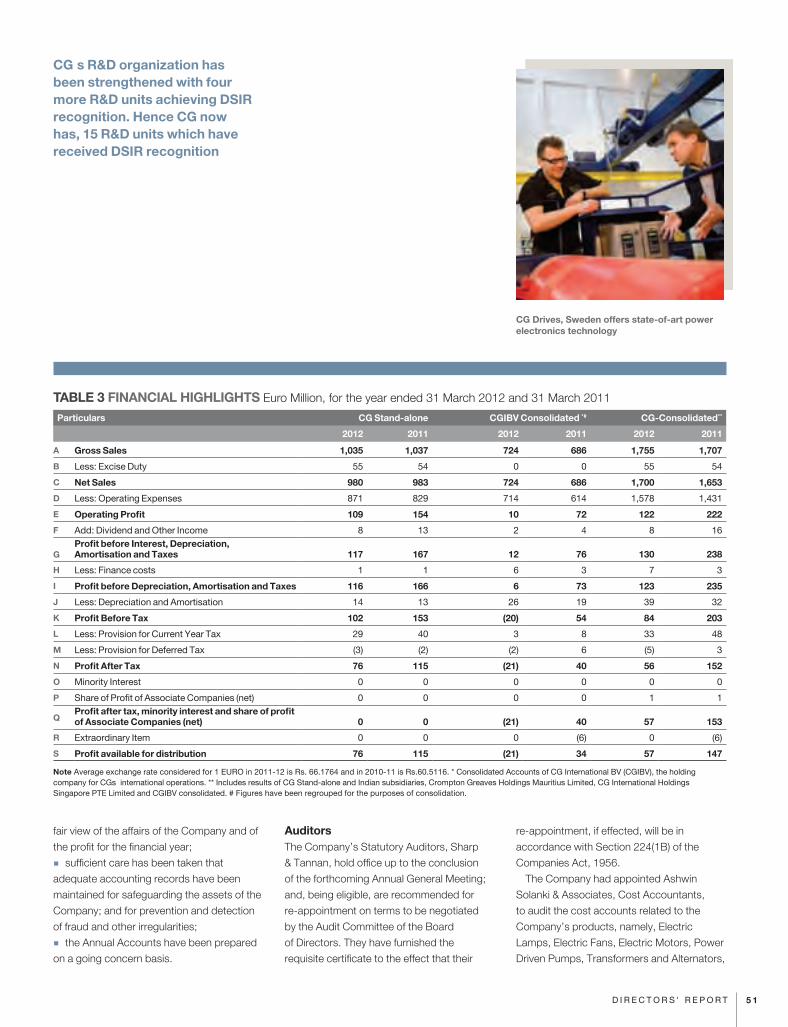
fair view of the affairs of the Company and of
the profit for the financial year;
� sufficient care has been taken that
adequate accounting records have been
maintained for safeguarding the assets of the
Company; and for prevention and detection
of fraud and other irregularities;
� the Annual Accounts have been prepared
on a going concern basis.
AuditorsThe Company’s Statutory Auditors, Sharp
& Tannan, hold office up to the conclusion
of the forthcoming Annual General Meeting;
and, being eligible, are recommended for
re-appointment on terms to be negotiated
by the Audit Committee of the Board
of Directors. They have furnished the
requisite certificate to the effect that their
re-appointment, if effected, will be in
accordance with Section 224(1B) of the
Companies Act, 1956.
The Company had appointed Ashwin
Solanki & Associates, Cost Accountants,
to audit the cost accounts related to the
Company’s products, namely, Electric
Lamps, Electric Fans, Electric Motors, Power
Driven Pumps, Transformers and Alternators,
TABLE 3 FINANCIAL HIGHLIGHTS Euro Million, for the year ended 31 March 2012 and 31 March 2011
Particulars CG Stand-alone CGIBV Consolidated *# CG-Consolidated**
2012 2011 2012 2011 2012 2011
A Gross Sales 1,035 1,037 724 686 1,755 1,707
B Less: Excise Duty 55 54 0 0 55 54
C Net Sales 980 983 724 686 1,700 1,653
D Less: Operating Expenses 871 829 714 614 1,578 1,431
E Operating Profit 109 154 10 72 122 222
F Add: Dividend and Other Income 8 13 2 4 8 16
GProfit before Interest, Depreciation, Amortisation and Taxes 117 167 12 76 130 238
H Less: Finance costs 1 1 6 3 7 3
I Profit before Depreciation, Amortisation and Taxes 116 166 6 73 123 235
J Less: Depreciation and Amortisation 14 13 26 19 39 32
K Profit Before Tax 102 153 (20) 54 84 203
L Less: Provision for Current Year Tax 29 40 3 8 33 48
M Less: Provision for Deferred Tax (3) (2) (2) 6 (5) 3
N Profit After Tax 76 115 (21) 40 56 152
O Minority Interest 0 0 0 0 0 0
P Share of Profit of Associate Companies (net) 0 0 0 0 1 1
QProfit after tax, minority interest and share of profit of Associate Companies (net) 0 0 (21) 40 57 153
R Extraordinary Item 0 0 0 (6) 0 (6)
S Profit available for distribution 76 115 (21) 34 57 147
Note Average exchange rate considered for 1 EURO in 2011-12 is Rs. 66.1764 and in 2010-11 is Rs.60.5116. * Consolidated Accounts of CG International BV (CGIBV), the holding company for CGÕs international operations. ** Includes results of CG Stand-alone and Indian subsidiaries, Crompton Greaves Holdings Mauritius Limited, CG International Holdings Singapore PTE Limited and CGIBV consolidated. # Figures have been regrouped for the purposes of consolidation.
CG Drives, Sweden offers state-of-art power electronics technology
CGÕ s R&D organization has been strengthened with four more R&D units achieving DSIR recognition. Hence CG now has, 15 R&D units which have received DSIR recognition
5 1D I R E C T O R S ' R E P O R T
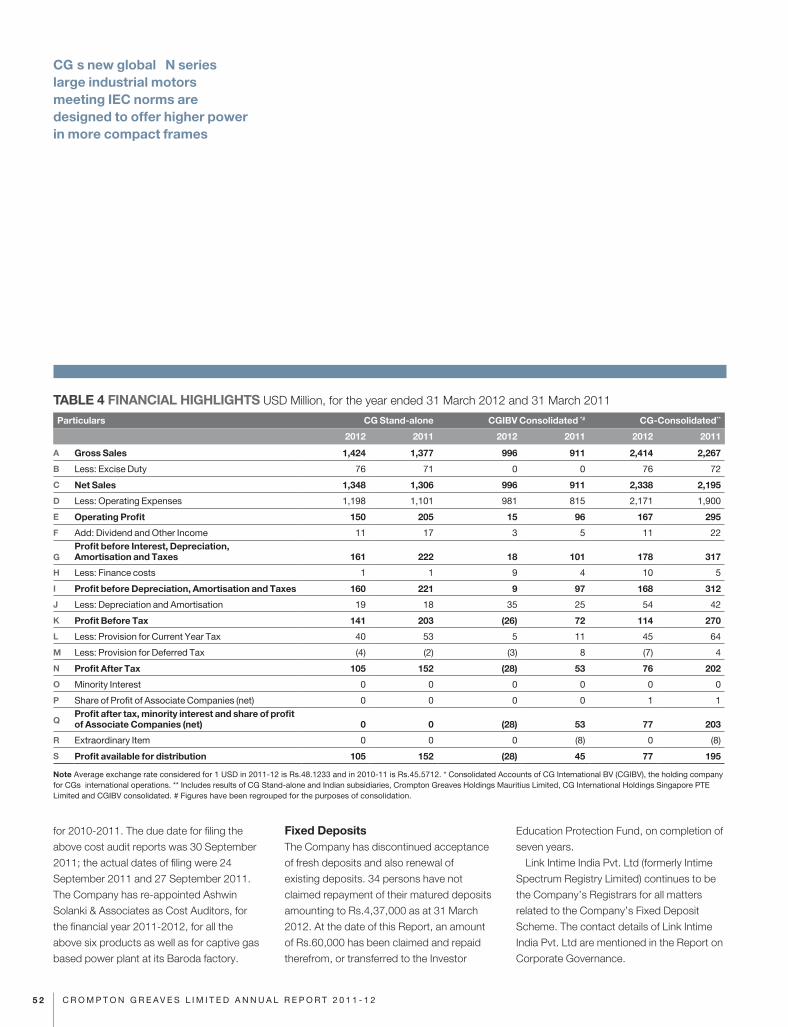
for 2010-2011. The due date for filing the
above cost audit reports was 30 September
2011; the actual dates of filing were 24
September 2011 and 27 September 2011.
The Company has re-appointed Ashwin
Solanki & Associates as Cost Auditors, for
the financial year 2011-2012, for all the
above six products as well as for captive gas
based power plant at its Baroda factory.
Fixed DepositsThe Company has discontinued acceptance
of fresh deposits and also renewal of
existing deposits. 34 persons have not
claimed repayment of their matured deposits
amounting to Rs.4,37,000 as at 31 March
2012. At the date of this Report, an amount
of Rs.60,000 has been claimed and repaid
therefrom, or transferred to the Investor
Education Protection Fund, on completion of
seven years.
Link Intime India Pvt. Ltd (formerly Intime
Spectrum Registry Limited) continues to be
the Company’s Registrars for all matters
related to the Company’s Fixed Deposit
Scheme. The contact details of Link Intime
India Pvt. Ltd are mentioned in the Report on
Corporate Governance.
TABLE 4 FINANCIAL HIGHLIGHTS USD Million, for the year ended 31 March 2012 and 31 March 2011
Particulars CG Stand-alone CGIBV Consolidated *# CG-Consolidated**
2012 2011 2012 2011 2012 2011
A Gross Sales 1,424 1,377 996 911 2,414 2,267
B Less: Excise Duty 76 71 0 0 76 72
C Net Sales 1,348 1,306 996 911 2,338 2,195
D Less: Operating Expenses 1,198 1,101 981 815 2,171 1,900
E Operating Profit 150 205 15 96 167 295
F Add: Dividend and Other Income 11 17 3 5 11 22
GProfit before Interest, Depreciation, Amortisation and Taxes 161 222 18 101 178 317
H Less: Finance costs 1 1 9 4 10 5
I Profit before Depreciation, Amortisation and Taxes 160 221 9 97 168 312
J Less: Depreciation and Amortisation 19 18 35 25 54 42
K Profit Before Tax 141 203 (26) 72 114 270
L Less: Provision for Current Year Tax 40 53 5 11 45 64
M Less: Provision for Deferred Tax (4) (2) (3) 8 (7) 4
N Profit After Tax 105 152 (28) 53 76 202
O Minority Interest 0 0 0 0 0 0
P Share of Profit of Associate Companies (net) 0 0 0 0 1 1
QProfit after tax, minority interest and share of profit of Associate Companies (net) 0 0 (28) 53 77 203
R Extraordinary Item 0 0 0 (8) 0 (8)
S Profit available for distribution 105 152 (28) 45 77 195
Note Average exchange rate considered for 1 USD in 2011-12 is Rs.48.1233 and in 2010-11 is Rs.45.5712. * Consolidated Accounts of CG International BV (CGIBV), the holding company for CGÕs international operations. ** Includes results of CG Stand-alone and Indian subsidiaries, Crompton Greaves Holdings Mauritius Limited, CG International Holdings Singapore PTE Limited and CGIBV consolidated. # Figures have been regrouped for the purposes of consolidation.
CGÕ s new global Ò N seriesÓ large industrial motors meeting IEC norms are designed to offer higher power in more compact frames
5 2 C R O M P T O N G R E A V E S L I M I T E D A N N U A L R E P O R T 2 0 1 1 - 1 2
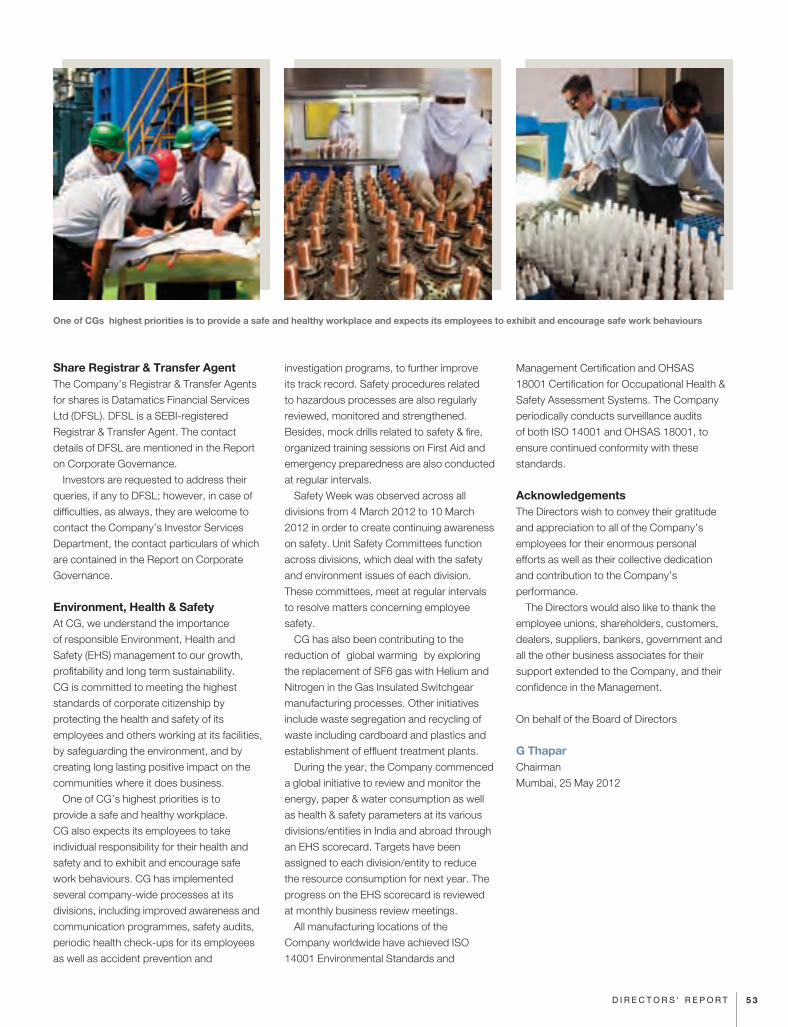
Share Registrar & Transfer AgentThe Company’s Registrar & Transfer Agents
for shares is Datamatics Financial Services
Ltd (DFSL). DFSL is a SEBI-registered
Registrar & Transfer Agent. The contact
details of DFSL are mentioned in the Report
on Corporate Governance.
Investors are requested to address their
queries, if any to DFSL; however, in case of
difficulties, as always, they are welcome to
contact the Company’s Investor Services
Department, the contact particulars of which
are contained in the Report on Corporate
Governance.
Environment, Health & Safety At CG, we understand the importance
of responsible Environment, Health and
Safety (EHS) management to our growth,
profitability and long term sustainability.
CG is committed to meeting the highest
standards of corporate citizenship by
protecting the health and safety of its
employees and others working at its facilities,
by safeguarding the environment, and by
creating long lasting positive impact on the
communities where it does business.
One of CG’s highest priorities is to
provide a safe and healthy workplace.
CG also expects its employees to take
individual responsibility for their health and
safety and to exhibit and encourage safe
work behaviours. CG has implemented
several company-wide processes at its
divisions, including improved awareness and
communication programmes, safety audits,
periodic health check-ups for its employees
as well as accident prevention and
investigation programs, to further improve
its track record. Safety procedures related
to hazardous processes are also regularly
reviewed, monitored and strengthened.
Besides, mock drills related to safety & fire,
organized training sessions on First Aid and
emergency preparedness are also conducted
at regular intervals.
Safety Week was observed across all
divisions from 4 March 2012 to 10 March
2012 in order to create continuing awareness
on safety. Unit Safety Committees function
across divisions, which deal with the safety
and environment issues of each division.
These committees, meet at regular intervals
to resolve matters concerning employee
safety.
CG has also been contributing to the
reduction of Ò global warmingÓ by exploring
the replacement of SF6 gas with Helium and
Nitrogen in the Gas Insulated Switchgear
manufacturing processes. Other initiatives
include waste segregation and recycling of
waste including cardboard and plastics and
establishment of effluent treatment plants.
During the year, the Company commenced
a global initiative to review and monitor the
energy, paper & water consumption as well
as health & safety parameters at its various
divisions/entities in India and abroad through
an EHS scorecard. Targets have been
assigned to each division/entity to reduce
the resource consumption for next year. The
progress on the EHS scorecard is reviewed
at monthly business review meetings.
All manufacturing locations of the
Company worldwide have achieved ISO
14001 Environmental Standards and
Management Certification and OHSAS
18001 Certification for Occupational Health &
Safety Assessment Systems. The Company
periodically conducts surveillance audits
of both ISO 14001 and OHSAS 18001, to
ensure continued conformity with these
standards.
AcknowledgementsThe Directors wish to convey their gratitude
and appreciation to all of the Company’s
employees for their enormous personal
efforts as well as their collective dedication
and contribution to the Company’s
performance.
The Directors would also like to thank the
employee unions, shareholders, customers,
dealers, suppliers, bankers, government and
all the other business associates for their
support extended to the Company, and their
confidence in the Management.
On behalf of the Board of Directors
G ThaparChairman
Mumbai, 25 May 2012
One of CGÕs highest priorities is to provide a safe and healthy workplace and expects its employees to exhibit and encourage safe work behaviours
5 3D I R E C T O R S ' R E P O R T
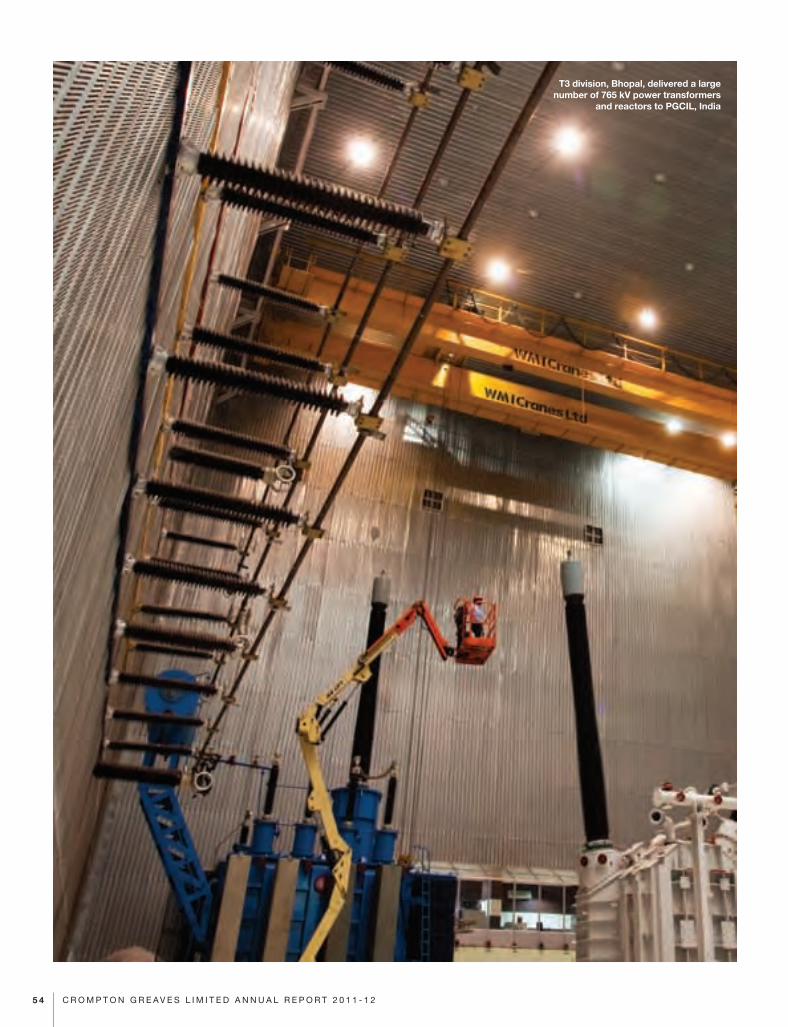
T3 division, Bhopal, delivered a large number of 765 kV power transformers
and reactors to PGCIL, India
5 4 C R O M P T O N G R E A V E S L I M I T E D A N N U A L R E P O R T 2 0 1 1 - 1 2
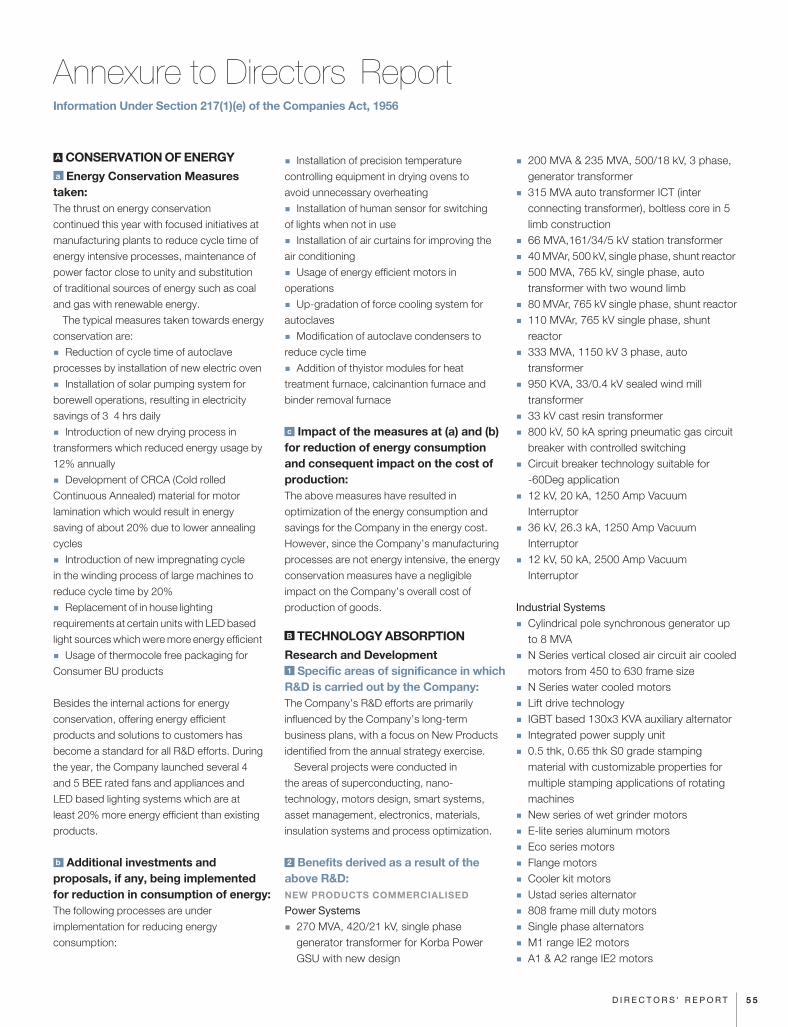
A CONSERVATION OF ENERGY a Energy Conservation Measures taken: The thrust on energy conservation
continued this year with focused initiatives at
manufacturing plants to reduce cycle time of
energy intensive processes, maintenance of
power factor close to unity and substitution
of traditional sources of energy such as coal
and gas with renewable energy.
The typical measures taken towards energy
conservation are:
� Reduction of cycle time of autoclave
processes by installation of new electric oven
� Installation of solar pumping system for
borewell operations, resulting in electricity
savings of 3Ð 4 hrs daily
� Introduction of new drying process in
transformers which reduced energy usage by
12% annually
� Development of CRCA (Cold rolled
Continuous Annealed) material for motor
lamination which would result in energy
saving of about 20% due to lower annealing
cycles
� Introduction of new impregnating cycle
in the winding process of large machines to
reduce cycle time by 20%
� Replacement of in house lighting
requirements at certain units with LED based
light sources which were more energy efficient
� Usage of thermocole free packaging for
Consumer BU products
Besides the internal actions for energy
conservation, offering energy efficient
products and solutions to customers has
become a standard for all R&D efforts. During
the year, the Company launched several 4
and 5 BEE rated fans and appliances and
LED based lighting systems which are at
least 20% more energy efficient than existing
products.
b Additional investments and proposals, if any, being implemented for reduction in consumption of energy:The following processes are under
implementation for reducing energy
consumption:
� Installation of precision temperature
controlling equipment in drying ovens to
avoid unnecessary overheating
� Installation of human sensor for switching
of lights when not in use
� Installation of air curtains for improving the
air conditioning
� Usage of energy efficient motors in
operations
� Up-gradation of force cooling system for
autoclaves
� Modification of autoclave condensers to
reduce cycle time
� Addition of thyistor modules for heat
treatment furnace, calcinantion furnace and
binder removal furnace
c Impact of the measures at (a) and (b) for reduction of energy consumption and consequent impact on the cost of production:The above measures have resulted in
optimization of the energy consumption and
savings for the Company in the energy cost.
However, since the Company’s manufacturing
processes are not energy intensive, the energy
conservation measures have a negligible
impact on the Company’s overall cost of
production of goods.
B TECHNOLOGY ABSORPTIONResearch and Development 1 Specific areas of significance in which R&D is carried out by the Company:The Company’s R&D efforts are primarily
influenced by the Company’s long-term
business plans, with a focus on New Products
identified from the annual strategy exercise.
Several projects were conducted in
the areas of superconducting, nano-
technology, motors design, smart systems,
asset management, electronics, materials,
insulation systems and process optimization.
2 Benefits derived as a result of the above R&D:NEW PRODUCTS COMMERCIALISED
Power Systems
� 270 MVA, 420/21 kV, single phase generator transformer for Korba Power GSU with new design
� 200 MVA & 235 MVA, 500/18 kV, 3 phase, generator transformer
� 315 MVA auto transformer ICT (inter connecting transformer), boltless core in 5 limb construction
� 66 MVA,161/34/5 kV station transformer
� 40 MVAr, 500 kV, single phase, shunt reactor
� 500 MVA, 765 kV, single phase, auto transformer with two wound limb
� 80 MVAr, 765 kV single phase, shunt reactor
� 110 MVAr, 765 kV single phase, shunt reactor
� 333 MVA, 1150 kV 3 phase, auto transformer
� 950 KVA, 33/0.4 kV sealed wind mill transformer
� 33 kV cast resin transformer
� 800 kV, 50 kA spring pneumatic gas circuit breaker with controlled switching
� Circuit breaker technology suitable for -60Deg application
� 12 kV, 20 kA, 1250 Amp Vacuum Interruptor
� 36 kV, 26.3 kA, 1250 Amp Vacuum Interruptor
� 12 kV, 50 kA, 2500 Amp Vacuum Interruptor
Industrial Systems
� Cylindrical pole synchronous generator up to 8 MVA
� N Series vertical closed air circuit air cooled motors from 450 to 630 frame size
� N Series water cooled motors
� Lift drive technology
� IGBT based 130x3 KVA auxiliary alternator
� Integrated power supply unit
� 0.5 thk, 0.65 thk S0 grade stamping material with customizable properties for multiple stamping applications of rotating machines
� New series of wet grinder motors
� E-lite series aluminum motors
� Eco series motors
� Flange motors
� Cooler kit motors
� Ustad series alternator
� 808 frame mill duty motors
� Single phase alternators
� M1 range IE2 motors
� A1 & A2 range IE2 motors
Annexure to DirectorsÕ Report Information Under Section 217(1)(e) of the Companies Act, 1956
5 5D I R E C T O R S ' R E P O R T
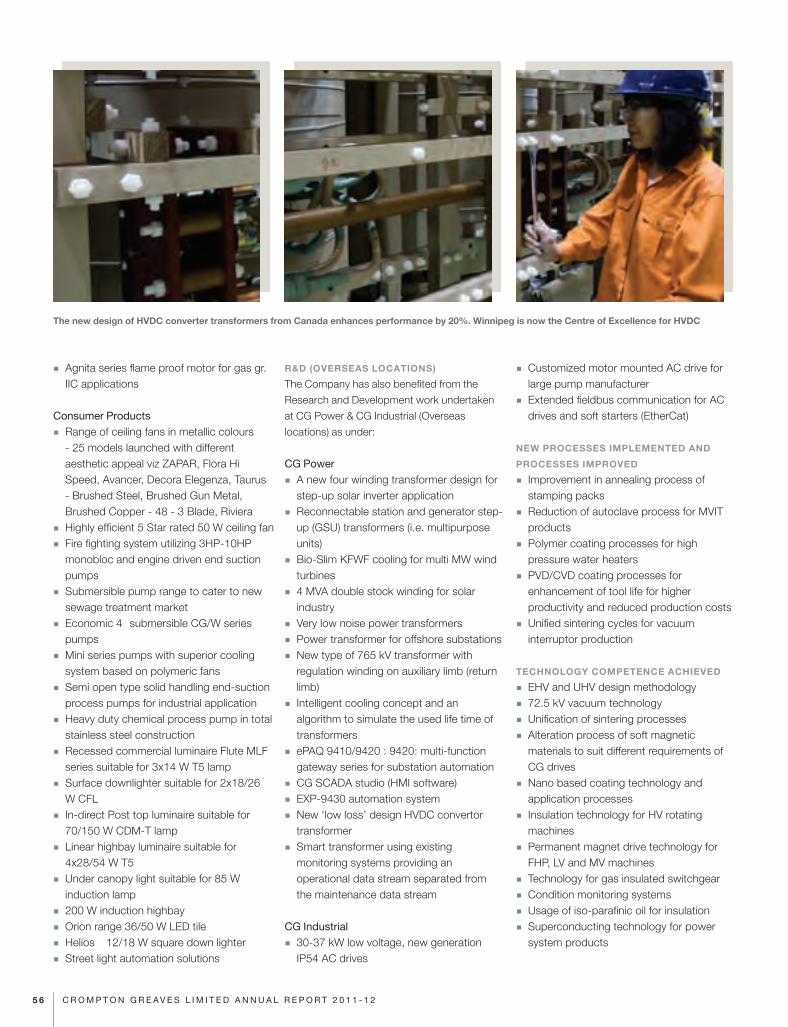
� Agnita series flame proof motor for gas gr. IIC applications
Consumer Products
� Range of ceiling fans in metallic colours - 25 models launched with different aesthetic appeal viz ZAPAR, Flora Hi Speed, Avancer, Decora Elegenza, Taurus - Brushed Steel, Brushed Gun Metal, Brushed Copper - 48 - 3 Blade, Riviera
� Highly efficient 5 Star rated 50 W ceiling fan
� Fire fighting system utilizing 3HP-10HP monobloc and engine driven end suction pumps
� Submersible pump range to cater to new sewage treatment market
� Economic 4Ó submersible CG/W series pumps
� Mini series pumps with superior cooling system based on polymeric fans
� Semi open type solid handling end-suction process pumps for industrial application
� Heavy duty chemical process pump in total stainless steel construction
� Recessed commercial luminaire Flute MLF series suitable for 3x14 W T5 lamp
� Surface downlighter suitable for 2x18/26 W CFL
� In-direct Post top luminaire suitable for 70/150 W CDM-T lamp
� Linear highbay luminaire suitable for 4x28/54 W T5
� Under canopy light suitable for 85 W induction lamp
� 200 W induction highbay
� Orion range 36/50 W LED tile
� Helios Ð 12/18 W square down lighter
� Street light automation solutions
R&D (OVERSEAS LOCATIONS)
The Company has also benefited from the
Research and Development work undertaken
at CG Power & CG Industrial (Overseas
locations) as under:
CG Power
� A new four winding transformer design for step-up solar inverter application
� Reconnectable station and generator step-up (GSU) transformers (i.e. multipurpose units)
� Bio-Slim KFWF cooling for multi MW wind turbines
� 4 MVA double stock winding for solar industry
� Very low noise power transformers
� Power transformer for offshore substations
� New type of 765 kV transformer with regulation winding on auxiliary limb (return limb)
� Intelligent cooling concept and an algorithm to simulate the used life time of transformers
� ePAQ 9410/9420 : 9420: multi-function gateway series for substation automation
� CG SCADA studio (HMI software)
� EXP-9430 automation system
� New ‘low loss’ design HVDC convertor transformer
� Smart transformer using existing monitoring systems providing an operational data stream separated from the maintenance data stream
CG Industrial
� 30-37 kW low voltage, new generation IP54 AC drives
� Customized motor mounted AC drive for large pump manufacturer
� Extended fieldbus communication for AC drives and soft starters (EtherCat)
NEW PROCESSES IMPLEMENTED AND
PROCESSES IMPROVED
� Improvement in annealing process of stamping packs
� Reduction of autoclave process for MVIT products
� Polymer coating processes for high pressure water heaters
� PVD/CVD coating processes for enhancement of tool life for higher productivity and reduced production costs
� Unified sintering cycles for vacuum interruptor production
TECHNOLOGY COMPETENCE ACHIEVED
� EHV and UHV design methodology
� 72.5 kV vacuum technology
� Unification of sintering processes
� Alteration process of soft magnetic materials to suit different requirements of CG drives
� Nano based coating technology and application processes
� Insulation technology for HV rotating machines
� Permanent magnet drive technology for FHP, LV and MV machines
� Technology for gas insulated switchgear
� Condition monitoring systems
� Usage of iso-parafinic oil for insulation
� Superconducting technology for power system products
The new design of HVDC converter transformers from Canada enhances performance by 20%. Winnipeg is now the Centre of Excellence for HVDC
5 6 C R O M P T O N G R E A V E S L I M I T E D A N N U A L R E P O R T 2 0 1 1 - 1 2
PATENTS
During the year, three patents have been
granted in India.
During the year, the Company filed 138
patents in India and 8 patents overseas through
Patent Co-operation Treaty process, which
together with 546 patents filed earlier, are
pending for registration.
3 Future Plan of ActionThe Company’s future R&D efforts will
comprise consolidating its efforts towards
development of intelligent consumer products
and energy efficient power systems and
industrial systems. The Company also plans to
leverage its external collaborations to shorten
the life cycle of technology development,
develop key platform technologies, plan new
R&D establishments at overseas locations and
greater number of collaborative projects with
academia, suppliers and research houses.
4 Expenditure on R&D The Company’s expenditure on R&D is given
in Table 5.
TECHNOLOGY ABSORPTION,
ADAPTATION AND INNOVATION
1 Efforts and Benefits:
The indigenous development of technology
is a milestone for CG by transforming it
from a technology adopting company to
technology driven company. Through in-house
development and partnering with the global
players, the competency for manufacturing
UHV products such as 800 kV class generator
transformer, auto transformer and shunt
reactor has been achieved. The Company also
proved its capability in the 1200 kV segment
by developing 1200 kV auto transformer
indigenously for UHV National Test Station at
Bina, Madhya Pradesh.
2 Imported Technology : Nil
C FOREIGN EXCHANGE EARNINGS AND OUTGO a Activities relating to exports; initiatives
taken to increase exports; development
of new export markets for products and
services; and export plans:
The Company’s activities and initiatives relating
to exports are contained in the Management
Discussion and Analysis Report.
b Total Foreign Exchange Earned
and Used
The total foreign exchange earned and used
by the Company is given in Table 6.
On behalf of the Board of Directors
G ThaparChairman
Mumbai, 25 May 2012
TABLE 5 EXPENDITURE ON R&D Rs. Crore for the year ended 31 March 2012
Stand-alone
(a) Capital 60.57
(b) Revenue 37.65
(c) Total (a + b) 98.22
(d) Total R&D expenditure:
as a percentage of net turnover 1.51
as a percentage of profit before tax and extraordinary item 14.51
TABLE 6 FOREIGN EXCHANGE EARNED & USED Rs. crore
Total
Foreign Exchange Earned 898.93
Foreign Exchange Used 749.13
CG is continuously developing intelligent solutions and incorporating these into its large product portfolio
5 7D I R E C T O R S ' R E P O R T
CGÕ s drives business offers valuable solutions to process industries which
need speed control for efficient operations
Corporate Governance
5 8 C R O M P T O N G R E A V E S L I M I T E D A N N U A L R E P O R T 2 0 1 1 - 1 2
THE COMPANYÕ S PHILOSOPHY ON CORPORATE GOVERNANCE
The Corporate Governance framework should ensure the strategic guidance of the Company, the effective monitoring of Management by the Board, and the BoardÕ s accountability to the Company and the Shareholders.Ñ OECD Principles of Corporate Governance (2004)
CG believes in an empowered Board. Seven
out of the ten Directors on the CG Board are
Independent. CG’s Independent Directors
have the full freedom to interact directly
with the CG Management. Presentations
are made by the CG Management at Board
Meetings on the long-term vision and
direction for the Company with detailed
three-year and annual rolling plans. The plans
are a culmination of extensive market studies
based on evaluation of potential market,
customer trends, competitive landscape,
assessment of opportunity and action plan
for value differentiation. All the Directors
engage intensely with the Management
at such Board presentations to better
appreciate and respond to the changing
business environment as well as its risks and
concerns.
A detailed review of performance versus
plans is presented by the Management
at Quarterly Board Meetings. The Board
Agendas are comprehensive and are
circulated several days in advance, for the
Directors to be fully informed and contribute
effectively to Board discussions. These
detailed business presentations at each
Board Meeting strengthen the Directors’
appreciation of business issues, to enable
them to provide better advice and oversight
to the Company. In addition to the Quarterly
Board Meetings, dedicated Board Meetings
are held, exclusively to discuss strategic
issues related to the future direction of the
Company, acquisition opportunities etc, in
the Company’s endeavour to improve the
Board’s involvement with the Company’s
business.
To support the strategic business
directions approved by the Board from time
to time, the Management Organisational
structure sustains strong operational
execution at the business and the functional
level globally, additionally reviewed by an
Executive Committee comprising the CEO
and senior leadership of the Company.
The Management has the accountability
for deployment of the business plans,
budgets, policies and procedures, as
well as enhancing the quality, efficiency
and effectiveness of each business. The
Management acts within a system of internal
controls and risk management procedures
which ensure that decision making powers
are judiciously used for the purposes
intended, with comprehensive segregation of
duties to ensure the desired outcomes.
BOARD OF DIRECTORS CompositionAt the Board Meeting held on 2 June 2011,
Mr Laurent Demortier was appointed as the
CEO and Managing Director of the Company
for an initial period of 5 years. Mr Demortier’s
appointment as CEO and Managing Director
was approved by the shareholders at the
Annual General Meeting held on 19 July
2011; and by the Central Government
subsequently.
CG’s former Managing Director, Mr SM
Trehan continues on the Board as a Non-
Executive Director and Vice-Chairman of the
Board.
As on the date of this Report, the Company
has a ten-member Board of Directors. The
Chairman, Mr Gautam Thapar is a Non-
Executive Director and a member of the
Promoter Group. The Vice-Chairman, Mr
SM Trehan is a Non-Executive Director.
Seven other Non-Executive Directors Ð Mr
Scott Bayman, Dr Omkar Goswami, Mr
Sanjay Labroo, Mr Suresh Prabhu, Ms Meher
Pudumjee, Mr Satya Pal Talwar and Dr
Valentin von Massow Ð are independent in
terms of Clause 49 of the Listing Agreement
with Stock Exchanges. Mr Laurent Demortier
is the CEO and Managing Director. Thus,
the Board of Crompton Greaves presently
comprises of one Executive Director and nine
Non-Executive Directors, of whom seven
are Independent Directors. Table 1 gives the
composition of the Board, and the number of
outside Directorships held by each. None of
the Directors are related to each other.
Board MeetingsThere were seven Board Meetings held
during FY 2012 : on 28 April 2011, 2 June
2011, 19 July 2011, 18/19 October 2011,
30/31 January 2012, 15 March 2012 and
23 March 2012. The Company’s last Annual
General Meeting was held on 19 July 2011.
TABLE 1 COMPOSITION OF THE BOARD as on 31 March 2012
Name Particulars Other Board Representations
Directorships 1Committee Memberships 2
Committee Chairmanships 2
Mr Gautam Thapar Non-Executive Chairman; Promoter 9 2 0
Mr Sudhir Trehan 3 Non-Executive; Vice-Chairman 3 0 0
Mr Laurent Demortier 4 Executive; CEO and Managing Director 3 0 0
Mr Scott Bayman Non-Executive; Independent 1 0 0
Dr Omkar Goswami Non-Executive; Independent 11 4 3
Mr Sanjay Labroo Non-Executive; Independent 15 2 0
Mr Suresh Prabhu Non-Executive; Independent 1 0 0
Ms Meher Pudumjee Non-Executive; Independent 7 1 0
Mr Satya Pal Talwar Non-Executive; Independent 12 4 4
Dr Valentin von Massow Non-Executive; Independent 1 0 0
Notes 1 Includes private limited companies, but excludes alternate directorships and foreign bodies corporate. 2 Of only public limited companies. 3 Mr SM Trehan was Managing Director of the Company upto 1 June 2011. 4 Mr L Demortier is CEO and Managing Director from 2 June 2011.
5 9C O R P O R AT E G O V E R N A N C E
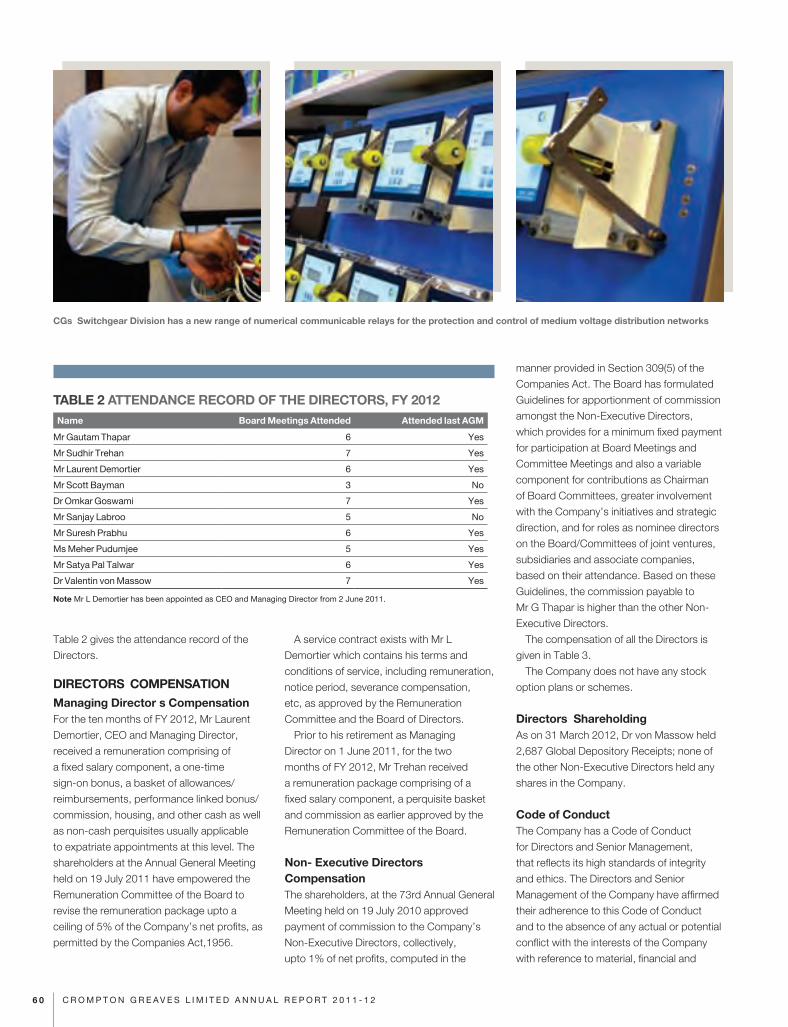
Table 2 gives the attendance record of the
Directors.
DIRECTORSÕ COMPENSATIONManaging DirectorÕ s CompensationFor the ten months of FY 2012, Mr Laurent
Demortier, CEO and Managing Director,
received a remuneration comprising of
a fixed salary component, a one-time
sign-on bonus, a basket of allowances/
reimbursements, performance linked bonus/
commission, housing, and other cash as well
as non-cash perquisites usually applicable
to expatriate appointments at this level. The
shareholders at the Annual General Meeting
held on 19 July 2011 have empowered the
Remuneration Committee of the Board to
revise the remuneration package upto a
ceiling of 5% of the Company’s net profits, as
permitted by the Companies Act,1956.
A service contract exists with Mr L
Demortier which contains his terms and
conditions of service, including remuneration,
notice period, severance compensation,
etc, as approved by the Remuneration
Committee and the Board of Directors.
Prior to his retirement as Managing
Director on 1 June 2011, for the two
months of FY 2012, Mr Trehan received
a remuneration package comprising of a
fixed salary component, a perquisite basket
and commission as earlier approved by the
Remuneration Committee of the Board.
Non- Executive DirectorsÕ CompensationThe shareholders, at the 73rd Annual General
Meeting held on 19 July 2010 approved
payment of commission to the Company’s
Non-Executive Directors, collectively,
upto 1% of net profits, computed in the
manner provided in Section 309(5) of the
Companies Act. The Board has formulated
Guidelines for apportionment of commission
amongst the Non-Executive Directors,
which provides for a minimum fixed payment
for participation at Board Meetings and
Committee Meetings and also a variable
component for contributions as Chairman
of Board Committees, greater involvement
with the Company’s initiatives and strategic
direction, and for roles as nominee directors
on the Board/Committees of joint ventures,
subsidiaries and associate companies,
based on their attendance. Based on these
Guidelines, the commission payable to
Mr G Thapar is higher than the other Non-
Executive Directors.
The compensation of all the Directors is
given in Table 3.
The Company does not have any stock
option plans or schemes.
DirectorsÕ ShareholdingAs on 31 March 2012, Dr von Massow held
2,687 Global Depository Receipts; none of
the other Non-Executive Directors held any
shares in the Company.
Code of Conduct The Company has a Code of Conduct
for Directors and Senior Management,
that reflects its high standards of integrity
and ethics. The Directors and Senior
Management of the Company have affirmed
their adherence to this Code of Conduct
and to the absence of any actual or potential
conflict with the interests of the Company
with reference to material, financial and
TABLE 2 ATTENDANCE RECORD OF THE DIRECTORS, FY 2012 Name Board Meetings Attended Attended last AGM
Mr Gautam Thapar 6 Yes
Mr Sudhir Trehan 7 Yes
Mr Laurent Demortier 6 Yes
Mr Scott Bayman 3 No
Dr Omkar Goswami 7 Yes
Mr Sanjay Labroo 5 No
Mr Suresh Prabhu 6 Yes
Ms Meher Pudumjee 5 Yes
Mr Satya Pal Talwar 6 Yes
Dr Valentin von Massow 7 Yes
Note Mr L Demortier has been appointed as CEO and Managing Director from 2 June 2011.
CGÕs Switchgear Division has a new range of numerical communicable relays for the protection and control of medium voltage distribution networks
6 0 C R O M P T O N G R E A V E S L I M I T E D A N N U A L R E P O R T 2 0 1 1 - 1 2
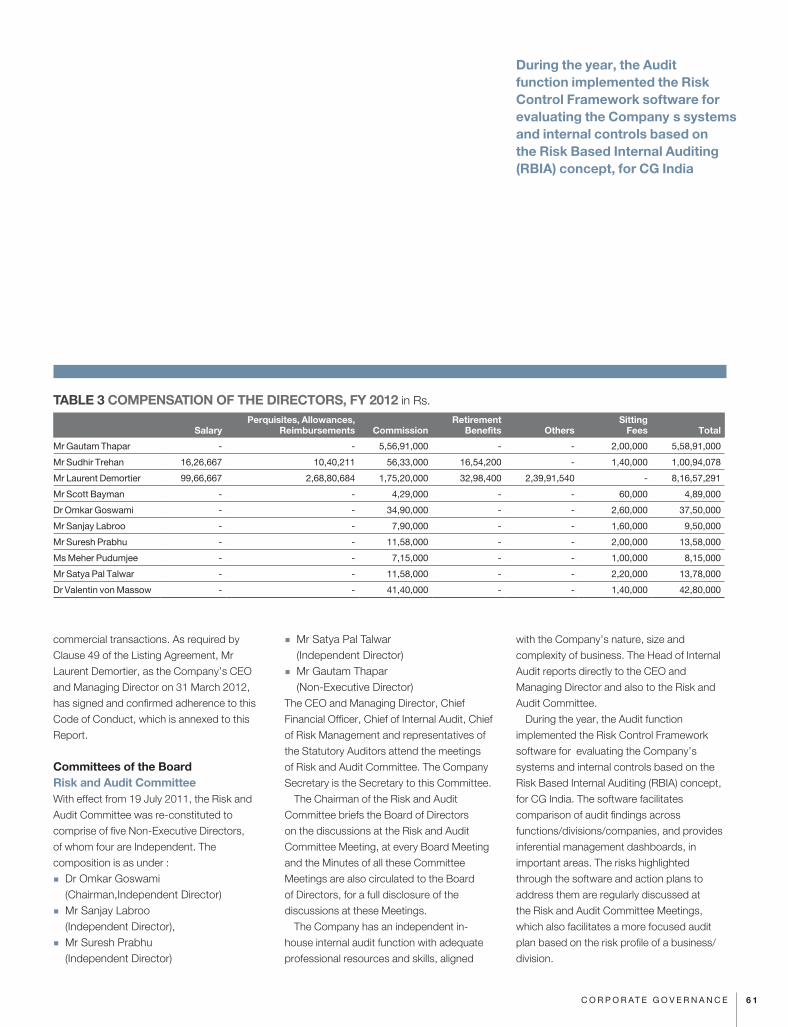
commercial transactions. As required by
Clause 49 of the Listing Agreement, Mr
Laurent Demortier, as the Company’s CEO
and Managing Director on 31 March 2012,
has signed and confirmed adherence to this
Code of Conduct, which is annexed to this
Report.
Committees of the BoardRisk and Audit CommitteeWith effect from 19 July 2011, the Risk and
Audit Committee was re-constituted to
comprise of five Non-Executive Directors,
of whom four are Independent. The
composition is as under :
� Dr Omkar Goswami (Chairman,Independent Director)
� Mr Sanjay Labroo (Independent Director),
� Mr Suresh Prabhu (Independent Director)
� Mr Satya Pal Talwar (Independent Director)
� Mr Gautam Thapar (Non-Executive Director)
The CEO and Managing Director, Chief
Financial Officer, Chief of Internal Audit, Chief
of Risk Management and representatives of
the Statutory Auditors attend the meetings
of Risk and Audit Committee. The Company
Secretary is the Secretary to this Committee.
The Chairman of the Risk and Audit
Committee briefs the Board of Directors
on the discussions at the Risk and Audit
Committee Meeting, at every Board Meeting
and the Minutes of all these Committee
Meetings are also circulated to the Board
of Directors, for a full disclosure of the
discussions at these Meetings.
The Company has an independent in-
house internal audit function with adequate
professional resources and skills, aligned
with the Company’s nature, size and
complexity of business. The Head of Internal
Audit reports directly to the CEO and
Managing Director and also to the Risk and
Audit Committee.
During the year, the Audit function
implemented the Risk Control Framework
software for evaluating the Company’s
systems and internal controls based on the
Risk Based Internal Auditing (RBIA) concept,
for CG India. The software facilitates
comparison of audit findings across
functions/divisions/companies, and provides
inferential management dashboards, in
important areas. The risks highlighted
through the software and action plans to
address them are regularly discussed at
the Risk and Audit Committee Meetings,
which also facilitates a more focused audit
plan based on the risk profile of a business/
division.
TABLE 3 COMPENSATION OF THE DIRECTORS, FY 2012 in Rs.
SalaryPerquisites, Allowances,
Reimbursements CommissionRetirement
Benefits Others Sitting
Fees Total
Mr Gautam Thapar - - 5,56,91,000 - - 2,00,000 5,58,91,000
Mr Sudhir Trehan 16,26,667 10,40,211 56,33,000 16,54,200 - 1,40,000 1,00,94,078
Mr Laurent Demortier 99,66,667 2,68,80,684 1,75,20,000 32,98,400 2,39,91,540 - 8,16,57,291
Mr Scott Bayman - - 4,29,000 - - 60,000 4,89,000
Dr Omkar Goswami - - 34,90,000 - - 2,60,000 37,50,000
Mr Sanjay Labroo - - 7,90,000 - - 1,60,000 9,50,000
Mr Suresh Prabhu - - 11,58,000 - - 2,00,000 13,58,000
Ms Meher Pudumjee - - 7,15,000 - - 1,00,000 8,15,000
Mr Satya Pal Talwar - - 11,58,000 - - 2,20,000 13,78,000
Dr Valentin von Massow - - 41,40,000 - - 1,40,000 42,80,000
During the year, the Audit function implemented the Risk Control Framework software for evaluating the CompanyÕ s systems and internal controls based on the Risk Based Internal Auditing (RBIA) concept, for CG India
6 1C O R P O R AT E G O V E R N A N C E
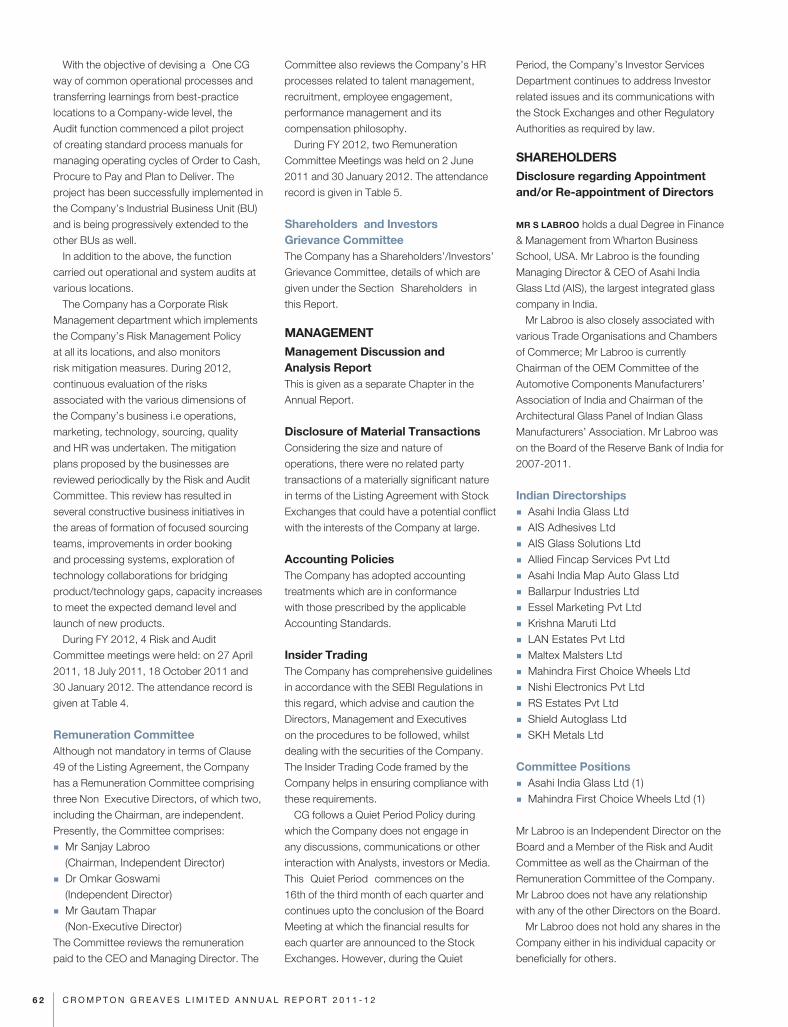
With the objective of devising a Ò One CGÓ
way of common operational processes and
transferring learnings from best-practice
locations to a Company-wide level, the
Audit function commenced a pilot project
of creating standard process manuals for
managing operating cycles of Order to Cash,
Procure to Pay and Plan to Deliver. The
project has been successfully implemented in
the Company’s Industrial Business Unit (BU)
and is being progressively extended to the
other BUs as well.
In addition to the above, the function
carried out operational and system audits at
various locations.
The Company has a Corporate Risk
Management department which implements
the Company’s Risk Management Policy
at all its locations, and also monitors
risk mitigation measures. During 2012,
continuous evaluation of the risks
associated with the various dimensions of
the Company’s business i.e operations,
marketing, technology, sourcing, quality
and HR was undertaken. The mitigation
plans proposed by the businesses are
reviewed periodically by the Risk and Audit
Committee. This review has resulted in
several constructive business initiatives in
the areas of formation of focused sourcing
teams, improvements in order booking
and processing systems, exploration of
technology collaborations for bridging
product/technology gaps, capacity increases
to meet the expected demand level and
launch of new products.
During FY 2012, 4 Risk and Audit
Committee meetings were held: on 27 April
2011, 18 July 2011, 18 October 2011 and
30 January 2012. The attendance record is
given at Table 4.
Remuneration CommitteeAlthough not mandatory in terms of Clause
49 of the Listing Agreement, the Company
has a Remuneration Committee comprising
three NonÐ Executive Directors, of which two,
including the Chairman, are independent.
Presently, the Committee comprises:
� Mr Sanjay Labroo (Chairman, Independent Director)
� Dr Omkar Goswami (Independent Director)
� Mr Gautam Thapar (Non-Executive Director)
The Committee reviews the remuneration
paid to the CEO and Managing Director. The
Committee also reviews the Company’s HR
processes related to talent management,
recruitment, employee engagement,
performance management and its
compensation philosophy.
During FY 2012, two Remuneration
Committee Meetings was held on 2 June
2011 and 30 January 2012. The attendance
record is given in Table 5.
ShareholdersÕ and InvestorsÕ Grievance CommitteeThe Company has a Shareholders’/Investors’
Grievance Committee, details of which are
given under the Section Ò ShareholdersÓ in
this Report.
MANAGEMENTManagement Discussion and Analysis Report This is given as a separate Chapter in the
Annual Report.
Disclosure of Material Transactions Considering the size and nature of
operations, there were no related party
transactions of a materially significant nature
in terms of the Listing Agreement with Stock
Exchanges that could have a potential conflict
with the interests of the Company at large.
Accounting Policies The Company has adopted accounting
treatments which are in conformance
with those prescribed by the applicable
Accounting Standards.
Insider Trading The Company has comprehensive guidelines
in accordance with the SEBI Regulations in
this regard, which advise and caution the
Directors, Management and Executives
on the procedures to be followed, whilst
dealing with the securities of the Company.
The Insider Trading Code framed by the
Company helps in ensuring compliance with
these requirements.
CG follows a Quiet Period Policy during
which the Company does not engage in
any discussions, communications or other
interaction with Analysts, investors or Media.
This Ò Quiet PeriodÓ commences on the
16th of the third month of each quarter and
continues upto the conclusion of the Board
Meeting at which the financial results for
each quarter are announced to the Stock
Exchanges. However, during the Quiet
Period, the Company’s Investor Services
Department continues to address Investor
related issues and its communications with
the Stock Exchanges and other Regulatory
Authorities as required by law.
SHAREHOLDERSDisclosure regarding Appointment and/or Re-appointment of Directors
MR S LABROO holds a dual Degree in Finance
& Management from Wharton Business
School, USA. Mr Labroo is the founding
Managing Director & CEO of Asahi India
Glass Ltd (AIS), the largest integrated glass
company in India.
Mr Labroo is also closely associated with
various Trade Organisations and Chambers
of Commerce; Mr Labroo is currently
Chairman of the OEM Committee of the
Automotive Components Manufacturers’
Association of India and Chairman of the
Architectural Glass Panel of Indian Glass
Manufacturers’ Association. Mr Labroo was
on the Board of the Reserve Bank of India for
2007-2011.
Indian Directorships � Asahi India Glass Ltd
� AIS Adhesives Ltd
� AIS Glass Solutions Ltd
� Allied Fincap Services Pvt Ltd
� Asahi India Map Auto Glass Ltd
� Ballarpur Industries Ltd
� Essel Marketing Pvt Ltd
� Krishna Maruti Ltd
� LAN Estates Pvt Ltd
� Maltex Malsters Ltd
� Mahindra First Choice Wheels Ltd
� Nishi Electronics Pvt Ltd
� RS Estates Pvt Ltd
� Shield Autoglass Ltd
� SKH Metals Ltd
Committee Positions � Asahi India Glass Ltd (1)
� Mahindra First Choice Wheels Ltd (1)
Mr Labroo is an Independent Director on the
Board and a Member of the Risk and Audit
Committee as well as the Chairman of the
Remuneration Committee of the Company.
Mr Labroo does not have any relationship
with any of the other Directors on the Board.
Mr Labroo does not hold any shares in the
Company either in his individual capacity or
beneficially for others.
6 2 C R O M P T O N G R E A V E S L I M I T E D A N N U A L R E P O R T 2 0 1 1 - 1 2
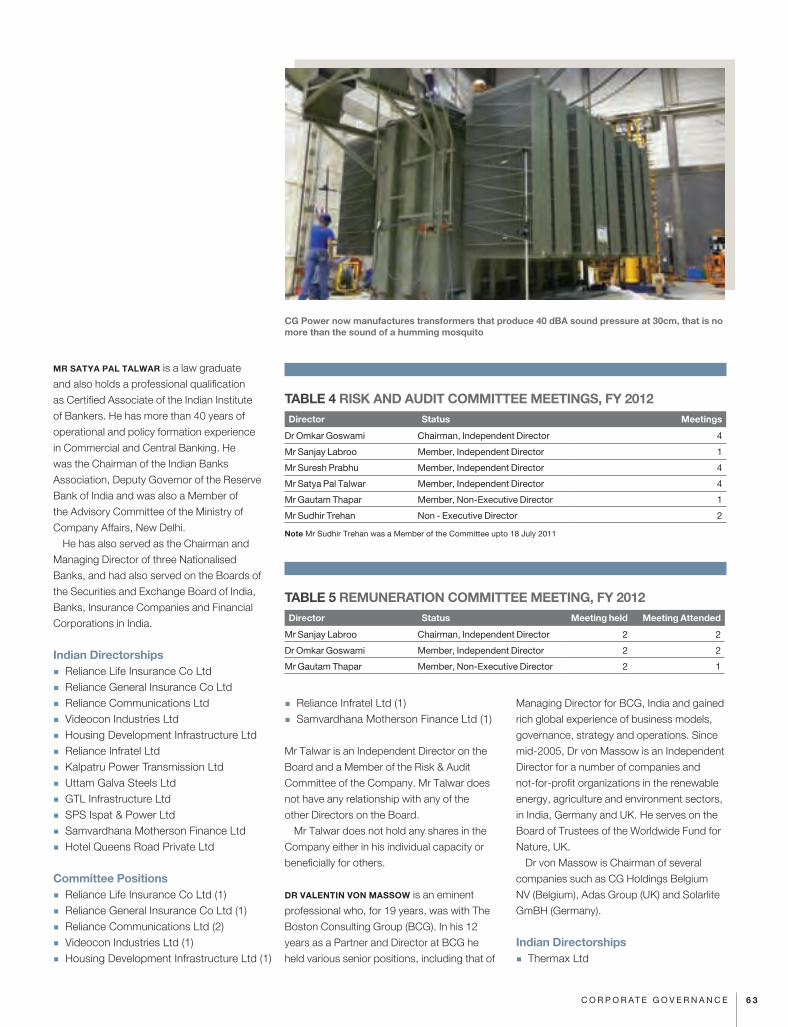
MR SATYA PAL TALWAR is a law graduate
and also holds a professional qualification
as Certified Associate of the Indian Institute
of Bankers. He has more than 40 years of
operational and policy formation experience
in Commercial and Central Banking. He
was the Chairman of the Indian Banks
Association, Deputy Governor of the Reserve
Bank of India and was also a Member of
the Advisory Committee of the Ministry of
Company Affairs, New Delhi.
He has also served as the Chairman and
Managing Director of three Nationalised
Banks, and had also served on the Boards of
the Securities and Exchange Board of India,
Banks, Insurance Companies and Financial
Corporations in India.
Indian Directorships � Reliance Life Insurance Co Ltd
� Reliance General Insurance Co Ltd
� Reliance Communications Ltd
� Videocon Industries Ltd
� Housing Development Infrastructure Ltd
� Reliance Infratel Ltd
� Kalpatru Power Transmission Ltd
� Uttam Galva Steels Ltd
� GTL Infrastructure Ltd
� SPS Ispat & Power Ltd
� Samvardhana Motherson Finance Ltd
� Hotel Queens Road Private Ltd
Committee Positions � Reliance Life Insurance Co Ltd (1)
� Reliance General Insurance Co Ltd (1)
� Reliance Communications Ltd (2)
� Videocon Industries Ltd (1)
� Housing Development Infrastructure Ltd (1)
� Reliance Infratel Ltd (1)
� Samvardhana Motherson Finance Ltd (1)
Mr Talwar is an Independent Director on the
Board and a Member of the Risk & Audit
Committee of the Company. Mr Talwar does
not have any relationship with any of the
other Directors on the Board.
Mr Talwar does not hold any shares in the
Company either in his individual capacity or
beneficially for others.
DR VALENTIN VON MASSOW is an eminent
professional who, for 19 years, was with The
Boston Consulting Group (BCG). In his 12
years as a Partner and Director at BCG he
held various senior positions, including that of
Managing Director for BCG, India and gained
rich global experience of business models,
governance, strategy and operations. Since
mid-2005, Dr von Massow is an Independent
Director for a number of companies and
not-for-profit organizations in the renewable
energy, agriculture and environment sectors,
in India, Germany and UK. He serves on the
Board of Trustees of the Worldwide Fund for
Nature, UK.
Dr von Massow is Chairman of several
companies such as CG Holdings Belgium
NV (Belgium), Adas Group (UK) and Solarlite
GmBH (Germany).
Indian Directorships � Thermax Ltd
TABLE 5 REMUNERATION COMMITTEE MEETING, FY 2012Director Status Meeting held Meeting Attended
Mr Sanjay Labroo Chairman, Independent Director 2 2
Dr Omkar Goswami Member, Independent Director 2 2
Mr Gautam Thapar Member, Non-Executive Director 2 1
TABLE 4 RISK AND AUDIT COMMITTEE MEETINGS, FY 2012 Director Status Meetings
Dr Omkar Goswami Chairman, Independent Director 4
Mr Sanjay Labroo Member, Independent Director 1
Mr Suresh Prabhu Member, Independent Director 4
Mr Satya Pal Talwar Member, Independent Director 4
Mr Gautam Thapar Member, Non-Executive Director 1
Mr Sudhir Trehan Non - Executive Director 2
Note Mr Sudhir Trehan was a Member of the Committee upto 18 July 2011
CG Power now manufactures transformers that produce 40 dBA sound pressure at 30cm, that is no more than the sound of a humming mosquito
6 3C O R P O R AT E G O V E R N A N C E
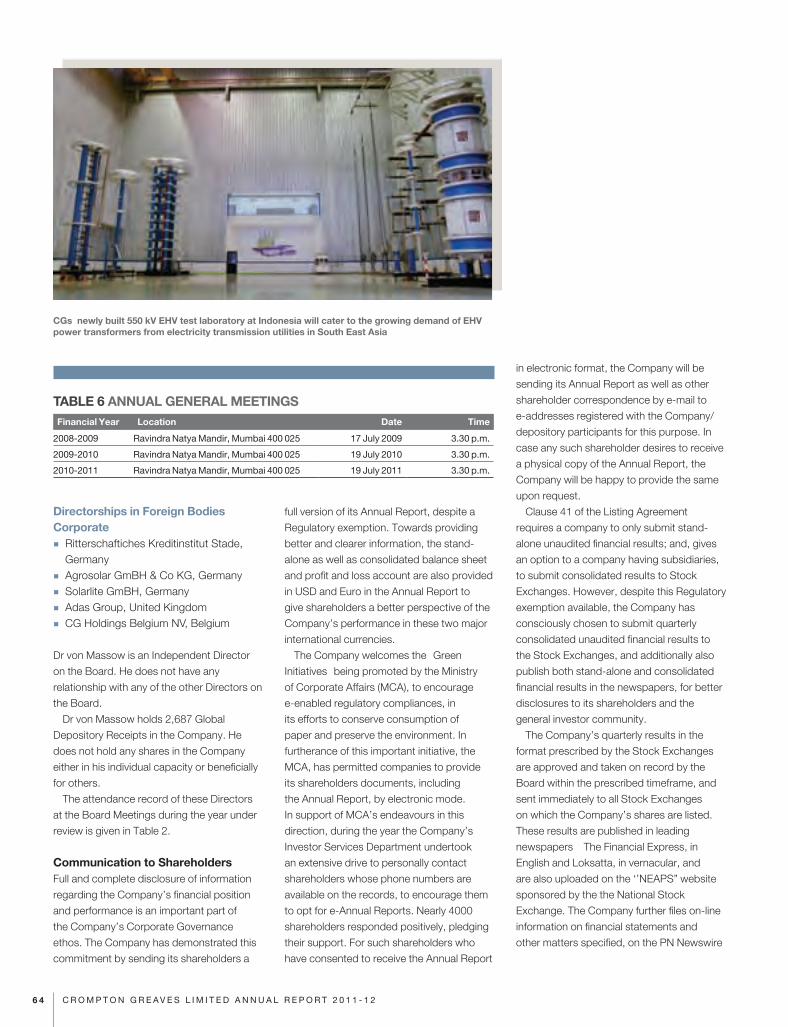
Directorships in Foreign Bodies Corporate
� Ritterschaftiches Kreditinstitut Stade, Germany
� Agrosolar GmBH & Co KG, Germany
� Solarlite GmBH, Germany
� Adas Group, United Kingdom
� CG Holdings Belgium NV, Belgium
Dr von Massow is an Independent Director
on the Board. He does not have any
relationship with any of the other Directors on
the Board.
Dr von Massow holds 2,687 Global
Depository Receipts in the Company. He
does not hold any shares in the Company
either in his individual capacity or beneficially
for others.
The attendance record of these Directors
at the Board Meetings during the year under
review is given in Table 2.
Communication to ShareholdersFull and complete disclosure of information
regarding the Company’s financial position
and performance is an important part of
the Company’s Corporate Governance
ethos. The Company has demonstrated this
commitment by sending its shareholders a
full version of its Annual Report, despite a
Regulatory exemption. Towards providing
better and clearer information, the stand-
alone as well as consolidated balance sheet
and profit and loss account are also provided
in USD and Euro in the Annual Report to
give shareholders a better perspective of the
Company’s performance in these two major
international currencies.
The Company welcomes the Ò Green
InitiativesÓ being promoted by the Ministry
of Corporate Affairs (MCA), to encourage
e-enabled regulatory compliances, in
its efforts to conserve consumption of
paper and preserve the environment. In
furtherance of this important initiative, the
MCA, has permitted companies to provide
its shareholders documents, including
the Annual Report, by electronic mode.
In support of MCA’s endeavours in this
direction, during the year the Company’s
Investor Services Department undertook
an extensive drive to personally contact
shareholders whose phone numbers are
available on the records, to encourage them
to opt for e-Annual Reports. Nearly 4000
shareholders responded positively, pledging
their support. For such shareholders who
have consented to receive the Annual Report
in electronic format, the Company will be
sending its Annual Report as well as other
shareholder correspondence by e-mail to
e-addresses registered with the Company/
depository participants for this purpose. In
case any such shareholder desires to receive
a physical copy of the Annual Report, the
Company will be happy to provide the same
upon request.
Clause 41 of the Listing Agreement
requires a company to only submit stand-
alone unaudited financial results; and, gives
an option to a company having subsidiaries,
to submit consolidated results to Stock
Exchanges. However, despite this Regulatory
exemption available, the Company has
consciously chosen to submit quarterly
consolidated unaudited financial results to
the Stock Exchanges, and additionally also
publish both stand-alone and consolidated
financial results in the newspapers, for better
disclosures to its shareholders and the
general investor community.
The Company’s quarterly results in the
format prescribed by the Stock Exchanges
are approved and taken on record by the
Board within the prescribed timeframe, and
sent immediately to all Stock Exchanges
on which the Company’s shares are listed.
These results are published in leading
newspapers Ð The Financial Express, in
English and Loksatta, in vernacular, and
are also uploaded on the ‘’NEAPS” website
sponsored by the the National Stock
Exchange. The Company further files on-line
information on financial statements and
other matters specified, on the PN Newswire
TABLE 6 ANNUAL GENERAL MEETINGSFinancial Year Location Date Time
2008-2009 Ravindra Natya Mandir, Mumbai 400 025 17 July 2009 3.30 p.m.
2009-2010 Ravindra Natya Mandir, Mumbai 400 025 19 July 2010 3.30 p.m.
2010-2011 Ravindra Natya Mandir, Mumbai 400 025 19 July 2011 3.30 p.m.
CGÕs newly built 550 kV EHV test laboratory at Indonesia will cater to the growing demand of EHV power transformers from electricity transmission utilities in South East Asia
6 4 C R O M P T O N G R E A V E S L I M I T E D A N N U A L R E P O R T 2 0 1 1 - 1 2
website which is approved by the London
Stock Exchange.
After every quarterly Board Meeting
for declaration of results, the Company
conducts an analyst meeting to provide
greater transparency and clarifications
on the Company’s financial performance.
This meeting is also web-cast live on the
Company’s website www.cgglobal.com.
Information about the Company in general,
its financial results, and other information,
including official press releases can also be
accessed at the Company’s website.
During the year, the Company has
published a Ò Frequently Ask Questions (FAQ)
Section” on the Company’s website, to better
familiarise shareholders with the procedural
requirements and documentation of certain
share related procedures. Shareholders
referring to the FAQs are greatly facilitated
in terms of speedy response and immediate
availability of requisite information.
Information on General Body Meetings The details of the last 3 Annual General
Meetings are given in Table 6.
Given below are the Special Resolutions that
were approved by shareholders at the last
three Annual General Meetings:
17 July 2009No Special Resolution was passed at the
Annual General Meeting held on 17 July
2009.
19 July 2010Special Resolution was passed for payment
of commission to Non-Executive Directors
upto 1% of the net profits of the Company
per annum.
19 July 2011Special Resolution was passed for
appointment of Mr S Goswami to hold an
office of place of profit in the Company’s
subsidiary.
Details of Capital Market Non-Compliance, if anyThe Company has complied with all
requirements of the Listing Agreement with
Stock Exchanges as well as the regulations
and guidelines prescribed by SEBI. There
were no penalties or strictures imposed on
the Company by any Regulatory Authorities
for non-compliance on any matter related to
capital markets, during the last three years.
ShareholdersÕ and InvestorsÕ Grievance CommitteeDuring FY 2012, the Shareholders’/Investors’
Committee met on 31 January 2012 at which
meeting all Members were present.
The Committee reviews the redressal of
investors’ complaints related to transfers and
transmission of shares, non-receipt of annual
reports, dividends and other share related
matters, the periodicity and effectiveness
of the share transfer process, statutory
certifications, depository related issues and
activities of the Registrar and Transfer Agent.
In addition to review by this Committee, the
Company continues its existing practice
of reporting to the Directors at each Board
Meeting, the number and category of
shareholder complaints received and the
status of their resolution.
The Company received four shareholders’
complaints during the financial year under
review, which were of a routine nature and
were satisfactorily resolved. There are no
outstanding complaints or shares pending
transfer as on 31 March 2012.
Unclaimed SharesClause 5A of the Listing Agreement with
Stock Exchanges requires a listed company
to transfer shares, which have remained
unclaimed pursuant to a public issue or
any other issue, to an Unclaimed Suspense
Account with a Depository Participant. The
voting rights with respect to the shares held
in such Unclaimed Suspense Account would
be frozen and future share allotments would
also be issued directly to such account. This
Clause requires a Company to send three
reminders in this regard before the transfer.
The Company has sent three reminders
on 11 April 2011, 30 June 2011 and 28
November 2011. 9,80,140 shares pertaining
to 4,115 shareholders have remained
unclaimed. These shares will be shortly
credited to Ò Crompton Greaves Limited Ð
Unclaimed Suspense Demat AccountÓ . Even
after transfer of shares, genuine shareholders
can claim their shares after submission of the
requisite documentary proof of their identity
to the Company.
GOVERNANCE OF SUBSIDIARIESThe subsidiaries of the Company
are adequately empowered through
delegation of the operational powers to
local Management at all locations. The
Management of subsidiary companies are
responsible for statutory compliances, health
& safety concerns, integrity of accounts
and assurance on internal controls. For
effective governance, the material contents
of the minutes of Board Meetings of all
Indian as well as foreign subsidiaries of the
Company are placed before the Board of
Directors of the Company for review. The
Company has also established a mechanism
through which material defaults, show cause
notices, dangerous occurrences, product
liability claims, significant developments in
human resources, major financial decisions
and similar significant actions/decisions
of all subsidiary companies are reported
to the Company’s Board of Directors. In
addition, the internal control procedures
and operational risks of these subsidiaries
are also reviewed by the Risk and Audit
Committee of the Board.
CEO AND CFO CERTIFICATIONAs on 31 March 2012, Mr L Demortier, CEO
and Managing Director and Mr M Acharya,
Chief Financial Officer have certified to
the Board with respect to the financial
statements, internal controls and other
matters, as required by Clause 49 of the
Listing Agreement with Stock Exchanges,
and the said Certificate is contained in this
Annual Report.
AUDITORSÕ CERTIFICATE ON CORPORATE GOVERNANCEThe Company has obtained a certificate
from the Auditors of the Company regarding
compliance with the provisions relating to
Corporate Governance prescribed by Clause
49 of the Listing Agreement with Stock
Exchanges, which is attached herewith.
REPORT ON CORPORATE GOVERNANCEThis chapter, read together with the
information given in the chapter titled
Ò Additional Shareholder InformationÓ ,
constitutes the compliance report on
Corporate Governance for FY 2012.
6 5C O R P O R AT E G O V E R N A N C E
Additional Shareholder Information
6 6 C R O M P T O N G R E A V E S L I M I T E D A N N U A L R E P O R T 2 0 1 1 - 1 2
ANNUAL GENERAL MEETING
DATE
Friday, 3 August 2012
TIME
3.00 p.m.
VENUE
Swatantryaveer Savarkar Rashtriya Smarak 4th Floor, 252, Veer Savarkar Marg
Shivaji Park, Dadar
Mumbai 400 028
FINANCIAL CALENDAR
FIRST QUARTER RESULTS
End July
SECOND QUARTER RESULTS
End October
THIRD QUARTER RESULTS
End January
LAST QUARTER RESULTS AND ANNUAL
AUDITED RESULTS
April/May
DATES OF BOOK CLOSURE
28 July 2012 to 3 August 2012
The register of members and share transfer
books of the Company will remain closed
from Saturday, 28 July 2012 to Friday,
3 August 2012, both days inclusive.
UNCLAIMED DIVIDENDS
Dividends pertaining to the financial years
2005-2006 to 2011-2012 which remain
unclaimed for a period of seven years, will
be transferred to the Investor Education
and Protection Fund. To enable the
members to claim their dividend before its
transfer to the above Fund, the proposed
dates of transfer are given below:
DATE OF DUE DATE FOR TRANSFER
DECLARATION TO THE INVESTOR
OF DIVIDEND EDUCATION AND
PROTECTION FUND
14 OCTOBER 2005 13 NOVEMBER 2012
25 JANUARY 2006 24 FEBRUARY 2013
29 MARCH 2006 28 APRIL 2013
14 OCTOBER 2006 13 NOVEMBER 2013
25 JANUARY 2007 24 FEBRUARY 2014
21 MARCH 2007 20 APRIL 2014
30 OCTOBER 2007 29 NOVEMBER 2014
30 JANUARY 2008 1 MARCH 2015
28 MARCH 2008 27 APRIL 2015
21 OCTOBER 2008 20 NOVEMBER 2015
23 JANUARY 2009 22 FEBRUARY 2016
24 MARCH 2009 23 APRIL 2016
27 OCTOBER 2009 26 NOVEMBER 2016
28 JANUARY 2010 27 FEBRUARY 2017
25 OCTOBER 2010 24 NOVEMBER 2017
28 JANUARY 2011 27 FEBRUARY 2018
23 MARCH 2011 22 APRIL 2018
19 OCTOBER 2011 18 NOVEMBER 2018
31 JANUARY 2012 2 MARCH 2019
23 MARCH 2012 22 APRIL 2019
REGISTRAR AND AGENTS
FOR SHARES
The Company’s R&T Agent is Datamatics
Financial Services Limited. Datamatics
Financial Services Limited is a SEBI
registered Registrar and Transfer Agent,
whose contact details are:
Datamatics Financial Services LtdUNIT Crompton Greaves Limited
Plot No B-5, Part B Crosslane
MIDC Marol Andheri (East)
Mumbai 400 093
TEL + 91 (0) 22 66712151 to 66712160
FAX+ 91 (0) 22 6671 2230
EMAIL [email protected]
FOR FIXED DEPOSITS
The Registrar details are as under:
Link Intime India Pvt Ltd (formerly Intime Spectrum Registry Ltd)
C-13 Pannalal Silk Mills Compound
L B S Marg Bhandup (West)
Mumbai 400 078
TEL + 91 (0) 22 25963838
FAX + 91 (0) 22 25962691
EMAIL [email protected]
SHARE TRANSFER SYSTEM
The Company’s shares are compulsorily
traded in dematerialised form. In the
case of transfers in physical form which
are lodged at the Registrar and Transfer
Agent’s office, these are processed within
a maximum period of 30 days from the
date of receipt.
All share transfers and other share
related issues are approved by a Director
or by a Senior Executive duly authorised
by the Board. Approvals are, generally,
on a weekly basis. During FY 2012, 47
approvals were obtained. The total number
of shares in physical form transferred
during the year under review was 1,21,940
shares.
6 7A D D I T I O N A L S H A R E H O L D E R I N F O R M AT I O N
DEMATERIALISATION OF SHARES
As on 31 March 2012, 98.78% of the total
shares of the Company were demateri-
alised, compared with 98.6% last year.
GLOBAL DEPOSITORY RECEIPTS
The Company issued Global Depository
Receipts (GDRs) in 1996 and the
underlying shares for each GDR were
issued in the name of The Bank of New
York, the Depository: each GDR of the
Company is equivalent to 5 shares. As
on 31 March 2012, 3,14,362 GDRs were
outstanding, which represented 15,71,809
underlying equity shares.
STOCK CODES
BSE, MUMBAI
500093
NATIONAL STOCK EXCHANGE
CROMPGREAV
GDR
5090318
ISIN
INE067A01029 (NSDL & CDSL)
CORPORATE IDENTIFICATION NUMBER
L99999MH1937PLC002641
LISTING DETAILS
The Company’s shares are listed and
traded on the Mumbai and National Stock
Exchanges. The Company’s GDRs are listed
on the London Stock Exchange.
The Stock Exchange, MumbaiPhiroze Jeejeebhoy Towers
Dalal Street
Mumbai 400 001
National Stock Exchange of India LtdExchange Plaza
Bandra-Kurla Complex
Bandra (East)
Mumbai 400 051
The Company’s payment of listing fees are
up to date.
MARKET PRICE DATA The Stock Exchange, Mumbai
Month Highest of the Month (Rs.) Lowest of the Month (Rs.) Closing (Rs.) Sensex
1st trading day of the Month 1st trading day of the Month
April 2011 297.00 246.30 272.90 19,420.39
May 2011 265.70 235.50 249.95 18,998.02
June 2011 276.00 246.00 264.95 18,608.81
July 2011 269.95 167.05 264.40 18,762.80
August 2011 171.00 133.75 160.35 18,314.33
September 2011 163.45 144.00 150.10 16,821.46
October 2011 175.00 135.00 146.35 16,151.45
November 2011 147.45 112.10 138.75 17,480.83
December 2011 139.50 107.15 128.00 16,483.45
January 2012 146.75 123.50 124.50 15,517.92
February 2012 167.00 123.70 143.95 17,300.58
March 2012 157.70 132.50 142.25 17,583.97
As at 31 March 2012 138.15 17,404.20
DISTRIBUTION OF SHAREHOLDING on 31 March 2012
No. of Shares No of Shareholders % of Shareholders
Upto 500 1,14,306 86.56
501-1,000 7,335 5.55
1,001-2,000 4,796 3.63
2,001-3,000 1,700 1.29
3,001-4,000 1,027 0.78
4,001-5000 539 0.41
5,001-10,000 1,234 0.93
10,001 and above 1,122 0.85
1,32,059 100.00
CATEGORIES OF SHAREHOLDERS on 31 March 2012
Category No of Shares of Rs.2 each %
Promoters 26,74,51,070 41.69
Indian Institutional Investors 4,93,94,674 7.70
Bodies Corporate 5,49,36,283 8.56
Foreign Institutional Investors 11,90,20,891 18.55
NRIs, OCBs, GDRs 1,11,79,354 1.75
Mutual Funds 8,09,56,082 12.62
General Public 5,85,53,182 9.13
Directors 0 0
64,14,91,536 100.00
6 8 C R O M P T O N G R E A V E S L I M I T E D A N N U A L R E P O R T 2 0 1 1 - 1 2
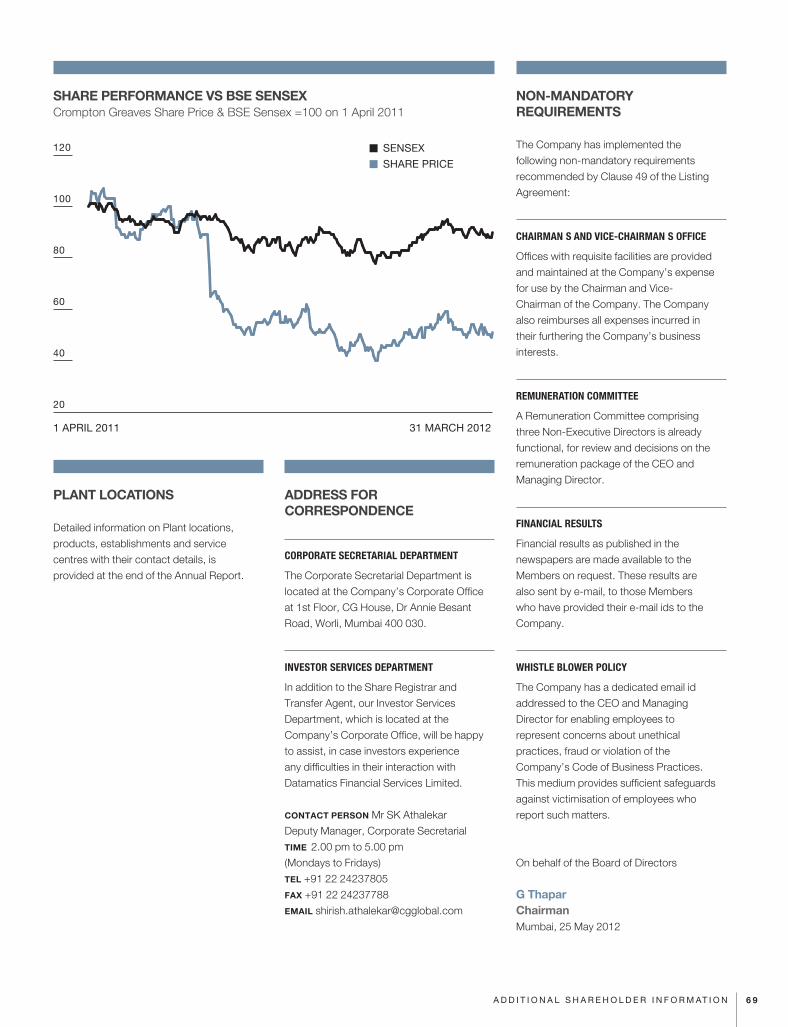
SHARE PERFORMANCE VS BSE SENSEXCrompton Greaves Share Price & BSE Sensex =100 on 1 April 2011
PLANT LOCATIONS
Detailed information on Plant locations,
products, establishments and service
centres with their contact details, is
provided at the end of the Annual Report.
ADDRESS FOR CORRESPONDENCE
CORPORATE SECRETARIAL DEPARTMENT
The Corporate Secretarial Department is
located at the Company’s Corporate Office
at 1st Floor, CG House, Dr Annie Besant
Road, Worli, Mumbai 400 030.
INVESTOR SERVICES DEPARTMENT
In addition to the Share Registrar and
Transfer Agent, our Investor Services
Department, which is located at the
Company’s Corporate Office, will be happy
to assist, in case investors experience
any difficulties in their interaction with
Datamatics Financial Services Limited.
CONTACT PERSON Mr SK Athalekar
Deputy Manager, Corporate Secretarial
TIME 2.00 pm to 5.00 pm
(Mondays to Fridays)
TEL +91 22 24237805
FAX +91 22 24237788
EMAIL [email protected]
NON-MANDATORY REQUIREMENTS
The Company has implemented the
following non-mandatory requirements
recommended by Clause 49 of the Listing
Agreement:
CHAIRMANÕ S AND VICE-CHAIRMANÕ S OFFICE
Offices with requisite facilities are provided
and maintained at the Company’s expense
for use by the Chairman and Vice-
Chairman of the Company. The Company
also reimburses all expenses incurred in
their furthering the Company’s business
interests.
REMUNERATION COMMITTEE
A Remuneration Committee comprising
three Non-Executive Directors is already
functional, for review and decisions on the
remuneration package of the CEO and
Managing Director.
FINANCIAL RESULTS
Financial results as published in the
newspapers are made available to the
Members on request. These results are
also sent by e-mail, to those Members
who have provided their e-mail ids to the
Company.
WHISTLE BLOWER POLICY
The Company has a dedicated email id
addressed to the CEO and Managing
Director for enabling employees to
represent concerns about unethical
practices, fraud or violation of the
Company’s Code of Business Practices.
This medium provides sufficient safeguards
against victimisation of employees who
report such matters.
On behalf of the Board of Directors
G ThaparChairman Mumbai, 25 May 2012
120
100
80
60
40
20
1 APRIL 2011 31 MARCH 2012
SENSEX
SHARE PRICE
6 9A D D I T I O N A L S H A R E H O L D E R I N F O R M AT I O N
To
The Board of Directors
Crompton Greaves Limited
We have reviewed the Stand-alone and
Consolidated financial results and the cash
flow statement of Crompton Greaves Limited
(the Company) for the financial year ended 31
March 2012, and certify that:
(a) These results and statements, to the best
of our knowledge and belief :
(i) do not contain any materially untrue
statement or omit any material fact or contain
statements that might be misleading;
(ii) present a true and fair view of the
Company’s affairs and are in compliance with
existing accounting standards, applicable
laws and regulations.
(b) To the best of our knowledge and belief,
there are no transactions entered into
by the Company during the year, which
are fraudulent, illegal or violative of the
Company’s Code of Conduct.
(c) We accept responsibility for establishing
and maintaining internal controls and have
evaluated the effectiveness of the internal
control systems of the Company and have
disclosed to the Auditors and the Audit
Committee, deficiencies in the design or
operation of internal controls of which we are
aware, and the steps taken and proposed to
be taken to rectify these deficiencies.
(d) We have also indicated to the Auditors
and the Audit Committee :
(i) significant changes in the internal controls
with respect to financial reporting during
the year and the achievement of adequate
internal controls within the Company’s ERP
systems;
(ii) significant changes in accounting
policies during the year, and these have
been disclosed in the notes to the financial
statements.
(e) To the best of our knowledge and
belief, there are no instances of significant
fraud involving either the Management or
employees having a significant Role in the
Company’s internal control systems with
respect to financial reporting.
L DemortierCEO & Managing Director
M AcharyaChief Financial Officer
Mumbai, 25 May 2012
To
The Members
Crompton Greaves Limited
CG House, Dr. Annie Besant Road,
Worli, Mumbai 400 030
Dear Sirs,
We have examined the compliance of
conditions of Corporate Governance by
Crompton Greaves Limited, for the year
ended 31 March 2012, as stipulated in
Clause 49 of the Listing Agreement entered
into by the Company with the Stock
Exchanges.
The compliance of conditions of
Corporate Governance is the responsibility
of the Management. Our examination was
limited to a review of the procedures and
implementations thereof, adopted by the
Company for ensuring compliance with the
conditions of Corporate Governance as
stipulated in the said clauses. It is neither
an audit nor an expression of opinion on the
financial statements of the Company.
In our opinion and to the best of our
information and according to the explanations
given to us and the representations made
by the Directors and the Management, we
certify that the Company has complied with
the conditions of Corporate Governance
as stipulated in Clause 49 of the above
mentioned Listing Agreement.
We further state that such compliance is
neither an assurance as to the future viability
of the Company nor of the efficiency or
effectiveness with which the Management
has conducted the affairs of the Company.
For Sharp & TannanChartered AccountantsRegistration No.109982W
L VaidyanathanPartnerMembership No.16368
Mumbai, 25 May 2012
CEO & MANAGING DIRECTORÕ S AND CHIEF FINANCIAL OFFICERÕ S CERTIFICATE ON CORPORATE GOVERNANCE
AUDITORSÕ CERTIFICATE ON CORPORATE GOVERNANCE
Certificates
7 0 C R O M P T O N G R E A V E S L I M I T E D A N N U A L R E P O R T 2 0 1 1 - 1 2
This is to certify that all the Members of the
Board of Directors and Senior Management
(i.e. one level below the Executive Directors
i.e. Vice President level) of the Company,
have confirmed compliance with the
Company’s Code of Conduct during April
2011 to March 2012.
The Company’s Code requires every Member
of the Board and Senior Management to:
� Fulfill the functions of their office with
integrity as well as professionalism and
exercise the powers attached thereto, with
due care and diligence.
� Act in the best interests of, and fulfill
their fiduciary obligations to the Company’s
shareholders, whilst also considering the
interests of other stakeholders.
� Take informed business decisions based
on independent judgment and in the best
interests of the Company, not influenced by
personal interest or gain.
� Respect the confidentiality of information
and use utmost discretion whilst deciding its
disclosure or dissemination, ensuring that
no personal advantage or detriment to the
Company results from the same.
� Make available to, and share information
with fellow Directors/Executives when
considered expedient in the best interests of
the Company.
� Protect and use the Company’s assets for
legitimate business purposes and be alert to
situations that could lead to loss or misuse of
these assets.
� Minimise any situation or action that can
create conflict of interests of the Company
vis-ˆ -vis personal interest or interests of
associated persons, and make adequate
disclosures, where necessary.
� Act in a manner that will protect the
Company’s reputation.
� Encourage reporting of behaviour, which
is contrary to the Company’s “Values”,
and ensure that the person reporting such
violation is not aggrieved in any manner.
� Comply, in letter and spirit, with all
applicable laws, rules and regulations, and
also honour the philosophy of Ò good faithÓ ,
guided by one’s sense of right and wrong.
� Abide by the relevant terms of the Insider
Trading Code formulated by the Company,
and any other Code that may be formulated
from time to time, as applicable.
� Adhere to the terms of the powers
delegated by the Board.
� Whilst entering into contracts with Service
Providers and Consultants, protect the
arrangement for disclosure or dissemination
of confidential information.
� Establish processes and systems for
storage, retrieval and dissemination of
documents, both in physical and electronic
form, so that the obligations of this Code of
Conduct are fulfilled.
� Raise concerns, if any, on the above
issues, at a Board Meeting.
L DemortierCEO and Managing Director
Mumbai, 25 May 2012
DECLARATION OF COMPLIANCE WITH CODE OF CONDUCT
Declaration
7 1A D D I T I O N A L S H A R E H O L D E R I N F O R M AT I O N

Stand-Alone Financials
7 2 C R O M P T O N G R E A V E S L I M I T E D A N N U A L R E P O R T 2 0 1 1 - 1 2
7 3F i n a n c i a l s
AUDITORS’ REPORT TO THE MEMBERS OF CROMPTON GREAVES LIMITED
We have audited the attached Balance Sheet of Crompton Greaves Limited (the ‘Company’) as at 31st March, 2012, the Statement of Profit and Loss and also the Cash Flow Statement for the year ended on that date, annexed thereto. These financial statements are the responsibility of the Company’s management. Our responsibility is to express an opinion on these financial statements based on our audit.
We conducted our audit in accordance with auditing standards generally accepted in India. Those Standards require that we plan and perform the audit to obtain reasonable assurance about whether the financial statements are free of material misstatement. An audit includes examining, on a test basis, evidence supporting the amounts and disclosures in the financial statements. An audit also includes assessing the accounting principles used and significant estimates made by management, as well as evaluating the overall financial statement presentation. We believe that our audit provides a reasonable basis for our opinion.
In accordance with provisions of Section 227 of the Companies Act 1956, we report that:
1. As required by the Companies (Auditor’s Report) Order, 2003 as amended by the Companies (Auditor’s Report) (Amendment) Order, 2004 issued by the Central Government of India in terms of Section 227 (4A) of the Companies Act, 1956, we enclose in the Annexure, a statement on the matters specified in paragraphs 4 and 5 of the said Order.
2. Further to our comments in the Annexure referred to above, we report that:
(a) we have obtained all the information and explanations, which to the best of our knowledge and belief were necessary for the purposes of our audit;
(b) in our opinion, proper books of account as required by law have been kept by the Company, so far as appears from our examination of those books;
(c) the Balance Sheet, the Statement of Profit and Loss and the Cash Flow Statement dealt with by this report are in agreement with the books of account;
(d) in our opinion, the Balance Sheet, the Statement of Profit and Loss and the Cash Flow Statement dealt with by this report comply with the accounting standards referred to in Section 211 (3C) of the Companies Act, 1956; and
(e) on the basis of the written representations received from directors of the Company as on 31st March, 2012 and taken on record by the Board of Directors, we report that none of the directors is disqualified as on 31st March, 2012 from being appointed as a director in terms of Section 274 (1)(g) of the Companies Act, 1956.
In our opinion and to the best of our information and according to the explanations given to us, the said Financial Statements, read together with the Significant Accounting Policies in Note 1 and the Notes on the Financial Statements in Note 2 to 49, give the information required by the Companies Act, 1956, in the manner so required and give a true and fair view in conformity with the accounting principles generally accepted in India:
(i) in the case of the Balance Sheet, of the state of affairs of the Company as at 31st March, 2012;
(ii) in the case of the Statement of Profit and Loss, of the profit for the year ended on that date; and
(iii) in case of the Cash Flow Statement, of the cash flows for the year ended on that date.
For SHARP & TANNAN
CHARTERED ACCOUNTANTS
Registration no. 109982W
L. Vaidyanathan
PARTNER
Mumbai, 25th May, 2012 Membership no. 16368
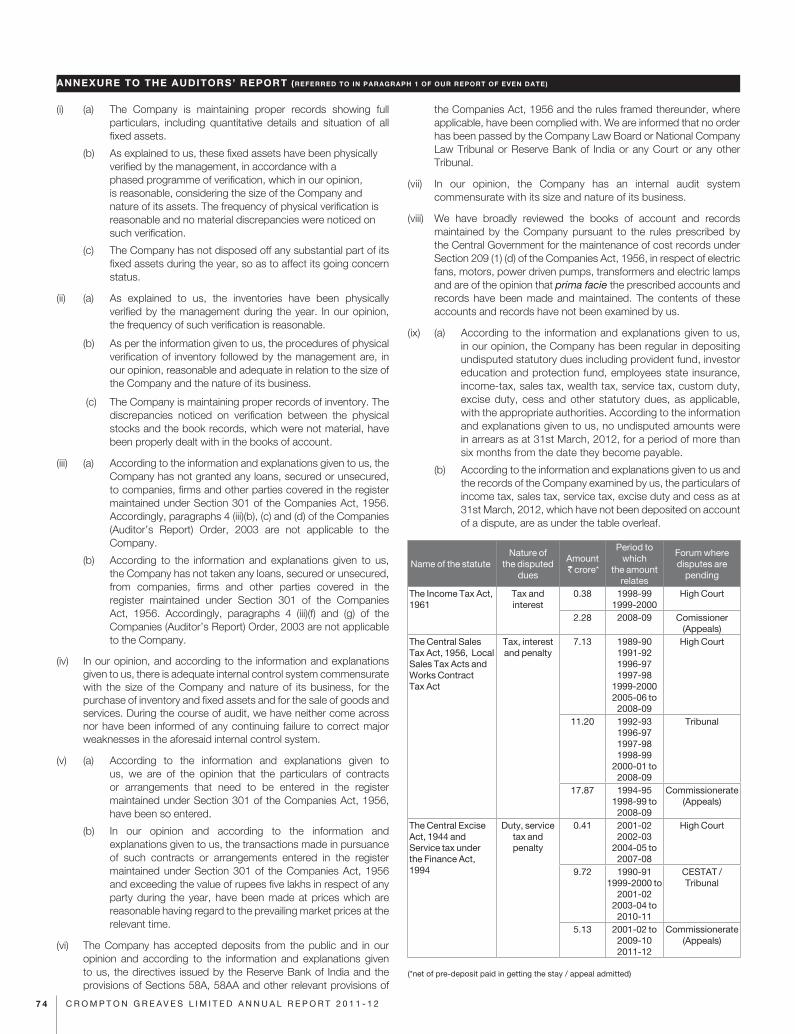
7 4 c R O M P T O n G R E a V E s l i M i T E D a n n U a l R E P O R T 2 0 1 1 - 1 2
ANNEXURE TO THE AUDITORS’ REPORT (REFERRED TO IN PARAGRAPH 1 OF OUR REPORT OF EVEN DATE)
(i) (a) The Company is maintaining proper records showing full particulars, including quantitative details and situation of all fixed assets.
(b) As explained to us, these fixed assets have been physically verified by the management, in accordance with a phased programme of verification, which in our opinion, is reasonable, considering the size of the Company and nature of its assets. The frequency of physical verification is reasonable and no material discrepancies were noticed on such verification.
(c) The Company has not disposed off any substantial part of its fixed assets during the year, so as to affect its going concern status.
(ii) (a) As explained to us, the inventories have been physically verified by the management during the year. In our opinion, the frequency of such verification is reasonable.
(b) As per the information given to us, the procedures of physical verification of inventory followed by the management are, in our opinion, reasonable and adequate in relation to the size of the Company and the nature of its business.
(c) The Company is maintaining proper records of inventory. The discrepancies noticed on verification between the physical stocks and the book records, which were not material, have been properly dealt with in the books of account.
(iii) (a) According to the information and explanations given to us, the Company has not granted any loans, secured or unsecured, to companies, firms and other parties covered in the register maintained under Section 301 of the Companies Act, 1956. Accordingly, paragraphs 4 (iii)(b), (c) and (d) of the Companies (Auditor’s Report) Order, 2003 are not applicable to the Company.
(b) According to the information and explanations given to us, the Company has not taken any loans, secured or unsecured, from companies, firms and other parties covered in the register maintained under Section 301 of the Companies Act, 1956. Accordingly, paragraphs 4 (iii)(f) and (g) of the Companies (Auditor’s Report) Order, 2003 are not applicable to the Company.
(iv) In our opinion, and according to the information and explanations given to us, there is adequate internal control system commensurate with the size of the Company and nature of its business, for the purchase of inventory and fixed assets and for the sale of goods and services. During the course of audit, we have neither come across nor have been informed of any continuing failure to correct major weaknesses in the aforesaid internal control system.
(v) (a) According to the information and explanations given to us, we are of the opinion that the particulars of contracts or arrangements that need to be entered in the register maintained under Section 301 of the Companies Act, 1956, have been so entered.
(b) In our opinion and according to the information and explanations given to us, the transactions made in pursuance of such contracts or arrangements entered in the register maintained under Section 301 of the Companies Act, 1956 and exceeding the value of rupees five lakhs in respect of any party during the year, have been made at prices which are reasonable having regard to the prevailing market prices at the relevant time.
(vi) The Company has accepted deposits from the public and in our opinion and according to the information and explanations given to us, the directives issued by the Reserve Bank of India and the provisions of Sections 58A, 58AA and other relevant provisions of
the Companies Act, 1956 and the rules framed thereunder, where applicable, have been complied with. We are informed that no order has been passed by the Company Law Board or National Company Law Tribunal or Reserve Bank of India or any Court or any other Tribunal.
(vii) In our opinion, the Company has an internal audit system commensurate with its size and nature of its business.
(viii) We have broadly reviewed the books of account and records maintained by the Company pursuant to the rules prescribed by the Central Government for the maintenance of cost records under Section 209 (1) (d) of the Companies Act, 1956, in respect of electric fans, motors, power driven pumps, transformers and electric lamps and are of the opinion that prima facie the prescribed accounts and records have been made and maintained. The contents of these accounts and records have not been examined by us.
(ix) (a) According to the information and explanations given to us, in our opinion, the Company has been regular in depositing undisputed statutory dues including provident fund, investor education and protection fund, employees state insurance, income-tax, sales tax, wealth tax, service tax, custom duty, excise duty, cess and other statutory dues, as applicable, with the appropriate authorities. According to the information and explanations given to us, no undisputed amounts were in arrears as at 31st March, 2012, for a period of more than six months from the date they become payable.
(b) According to the information and explanations given to us and the records of the Company examined by us, the particulars of income tax, sales tax, service tax, excise duty and cess as at 31st March, 2012, which have not been deposited on account of a dispute, are as under the table overleaf.
name of the statutenature of
the disputed dues
amount crore*
Period to which
the amount relates
Forum where disputes are
pending
The income Tax act, 1961
Tax and interest
0.38 1998-99 1999-2000
High court
2.28 2008-09 comissioner (appeals)
The central sales Tax act, 1956, local sales Tax acts and Works contract Tax act
Tax, interest and penalty
7.13 1989-90 1991-92 1996-97 1997-98
1999-2000 2005-06 to 2008-09
High court
11.20 1992-93 1996-97 1997-981998-99
2000-01 to 2008-09
Tribunal
17.87 1994-95 1998-99 to 2008-09
commissionerate (appeals)
The central Excise act, 1944 and service tax under the Finance act, 1994
Duty, service tax and penalty
0.41 2001-02 2002-03
2004-05 to 2007-08
High court
9.72 1990-91 1999-2000 to
2001-022003-04 to 2010-11
cEsTaT / Tribunal
5.13 2001-02 to 2009-10 2011-12
commissionerate (appeals)
(*net of pre-deposit paid in getting the stay / appeal admitted)
7 5F i n a n c i a l s
ANNEXURE TO THE AUDITORS’ REPORT (Contd. )
(x) The Company has no accumulated losses as at 31st March, 2012 and it has not incurred any cash losses in the financial year ended on that date and in the immediately preceding financial year.
(xi) According to the information and explanations given to us, in our opinion the Company has not defaulted in the repayment of dues to any financial institutions or bank as at the balance sheet date. The Company has not issued any debentures.
(xii) According to the information and explanations given to us, the Company has not granted any loans and advances on the basis of security by way of pledge of shares, debentures and other securities.
(xiii) The provisions of any special statute applicable to chit fund / nidhi / mutual benefit fund / society are not applicable to the Company.
(xiv) In our opinion and according to the information and explanations given to us, the Company is not dealing in or trading in securities. The Company has invested surplus funds in mutual funds. According to the information and explanations given to us, proper records have been maintained of the transactions and contracts and timely entries have been made therein. The investments in mutual funds have been held by the Company in its own name.
(xv) In our opinion and according to the information and explanations given to us, the terms and conditions of guarantee given by the Company for loans taken by others from bank or financial institutions are not prima facie prejudicial to the interests of the Company.
(xvi) In our opinion and according to the information and explanations given to us, the term-loans have been applied for the purposes for which they were obtained.
(xvii) According to the information and explanations given to us and on an overall examination of the balance sheet of the Company, we report that no funds raised on short-term basis have been used for long-term investments.
(xviii) The Company has not made any preferential allotment of shares to parties and companies covered in the register maintained under Section 301 of the Companies Act, 1956, during the year.
(xix) The Company has not issued any debentures during the year. Hence, reporting on paragraph 4 (xix) of the Companies (Auditor’s Report) Order, 2003 pertaining to creation of security or charge for debentures does not arise.
(xx) The Company has not raised any money by public issues during the year. Accordingly, paragraph 4 (xx) of the Companies (Auditor’s Report) Order, 2003 is not applicable to the Company.
(xxi) During the course of our examination of the books and records of the Company, carried out in accordance with the generally accepted auditing practices in India, and according to the information and explanations given to us, we have neither come across any instances of material fraud on or by the Company, noticed or reported during the year, nor have we been informed of such case by the management.
For SHARP & TANNAN
CHARTERED ACCOUNTANTS
Registration no. 109982W
L. Vaidyanathan
PARTNER
Mumbai, 25th May, 2012 Membership no. 16368
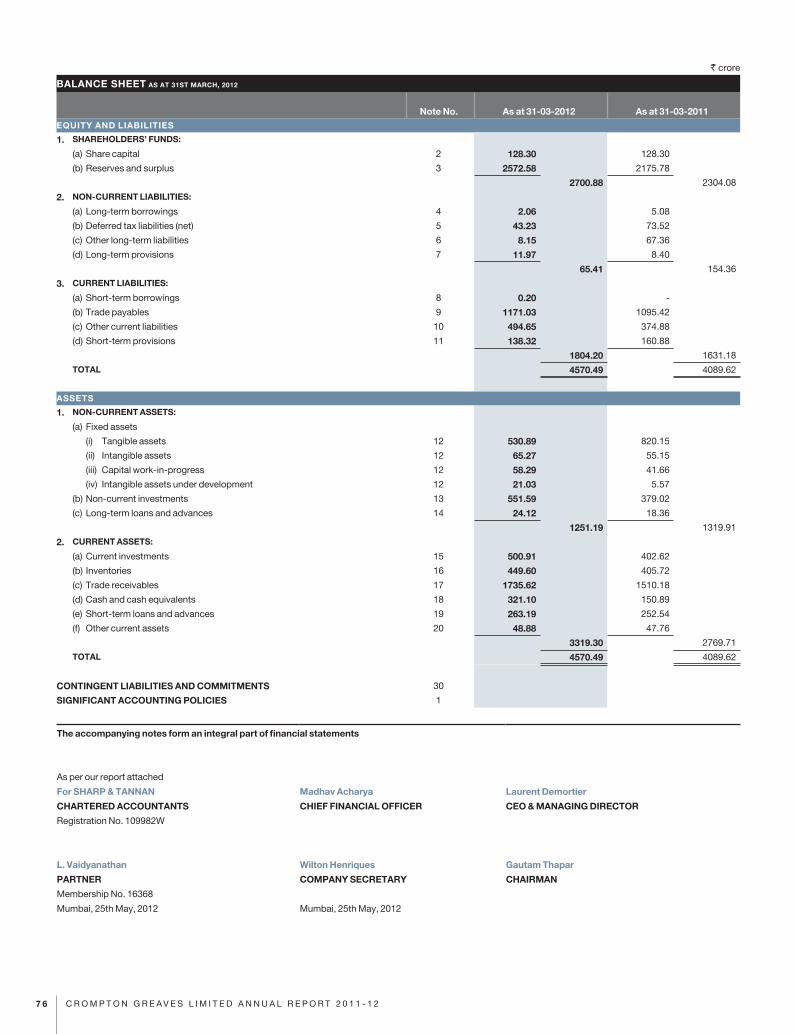
` crore
7 6 C R O M P T O N G R E A V E S L I M I T E D A N N U A L R E P O R T 2 0 1 1 - 1 2
Note No. As at 31-03-2012 As at 31-03-2011EQUITY AND LIABILITIES
1. SHAREHOLDERS’ FUNDS:
(a) share capital 2 128.30 128.30
(b) Reserves and surplus 3 2572.58 2175.78
2700.88 2304.08
2. NON-CURRENT LIABILITIES:
(a) long-term borrowings 4 2.06 5.08
(b) Deferred tax liabilities (net) 5 43.23 73.52
(c) Other long-term liabilities 6 8.15 67.36
(d) long-term provisions 7 11.97 8.40
65.41 154.36
3. CURRENT LIABILITIES:
(a) short-term borrowings 8 0.20 -
(b) Trade payables 9 1171.03 1095.42
(c) Other current liabilities 10 494.65 374.88
(d) short-term provisions 11 138.32 160.88
1804.20 1631.18
TOTAL 4570.49 4089.62
ASSETS
1. NON-CURRENT ASSETS:
(a) Fixed assets
(i) Tangible assets 12 530.89 820.15
(ii) intangible assets 12 65.27 55.15
(iii) capital work-in-progress 12 58.29 41.66
(iv) intangible assets under development 12 21.03 5.57
(b) non-current investments 13 551.59 379.02
(c) long-term loans and advances 14 24.12 18.36
1251.19 1319.91
2. CURRENT ASSETS:
(a) current investments 15 500.91 402.62
(b) inventories 16 449.60 405.72
(c) Trade receivables 17 1735.62 1510.18
(d) cash and cash equivalents 18 321.10 150.89
(e) short-term loans and advances 19 263.19 252.54
(f) Other current assets 20 48.88 47.76
3319.30 2769.71
TOTAL 4570.49 4089.62
CONTINGENT LIABILITIES AND COMMITMENTS 30
SIGNIFICANT ACCOUNTING POLICIES 1
BALANCE SHEET AS AT 31ST MARCH, 2012
The accompanying notes form an integral part of financial statements
as per our report attached
For SHARP & TANNAN Madhav Acharya Laurent Demortier
CHARTERED ACCOUNTANTS CHIEF FINANCIAL OFFICER CEO & MANAGING DIRECTOR
Registration no. 109982W
L. Vaidyanathan Wilton Henriques Gautam Thapar
PARTNER COMPANY SECRETARY CHAIRMAN
Membership no. 16368
Mumbai, 25th May, 2012 Mumbai, 25th May, 2012
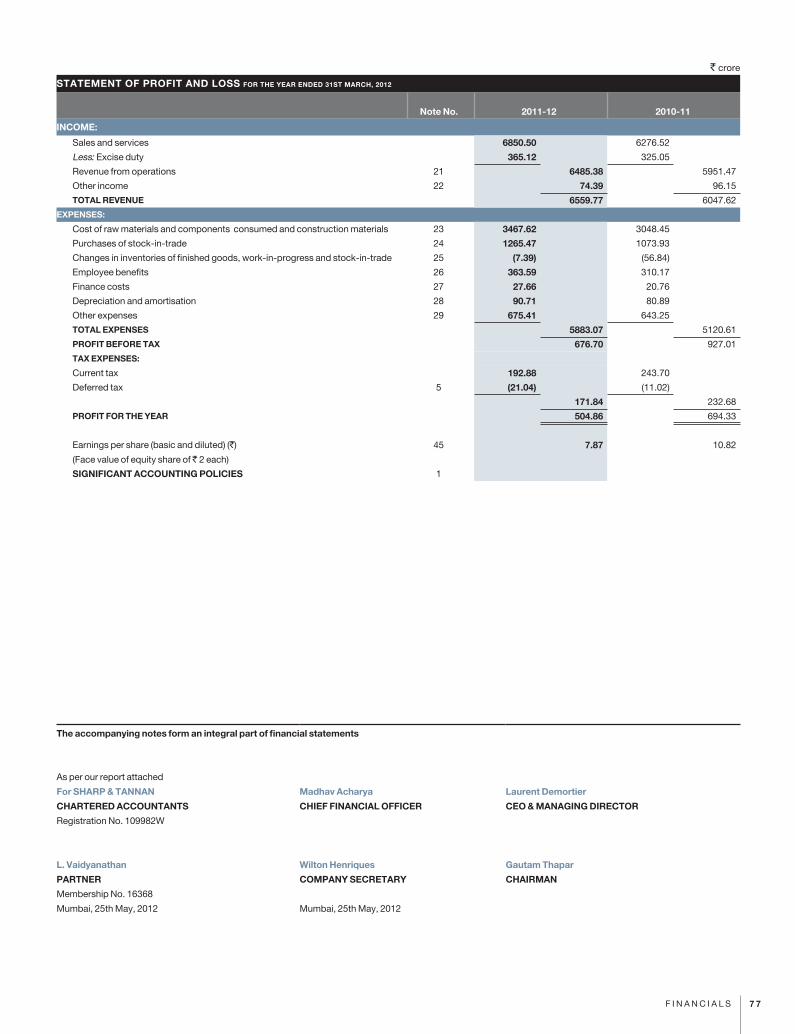
` crore
7 7F i n a n c i a l s
STATEMENT OF PROFIT AND LOSS FOR THE YEAR ENDED 31ST MARCH, 2012
Note No. 2011-12 2010-11
INCOME:
sales and services 6850.50 6276.52
less: Excise duty 365.12 325.05
Revenue from operations 21 6485.38 5951.47
Other income 22 74.39 96.15
TOTAL REVENUE 6559.77 6047.62
EXPENSES:
cost of raw materials and components consumed and construction materials 23 3467.62 3048.45
Purchases of stock-in-trade 24 1265.47 1073.93
changes in inventories of finished goods, work-in-progress and stock-in-trade 25 (7.39) (56.84)
Employee benefits 26 363.59 310.17
Finance costs 27 27.66 20.76
Depreciation and amortisation 28 90.71 80.89
Other expenses 29 675.41 643.25
TOTAL EXPENSES 5883.07 5120.61
PROFIT BEFORE TAX 676.70 927.01
TAX EXPENSES:
current tax 192.88 243.70
Deferred tax 5 (21.04) (11.02)
171.84 232.68
PROFIT FOR THE YEAR 504.86 694.33
Earnings per share (basic and diluted) (`)
(Face value of equity share of 2 each)
45 7.87 10.82
SIGNIFICANT ACCOUNTING POLICIES 1
The accompanying notes form an integral part of financial statements
as per our report attached
For SHARP & TANNAN Madhav Acharya Laurent Demortier
CHARTERED ACCOUNTANTS CHIEF FINANCIAL OFFICER CEO & MANAGING DIRECTOR
Registration no. 109982W
L. Vaidyanathan Wilton Henriques Gautam Thapar
PARTNER COMPANY SECRETARY CHAIRMAN
Membership no. 16368
Mumbai, 25th May, 2012 Mumbai, 25th May, 2012
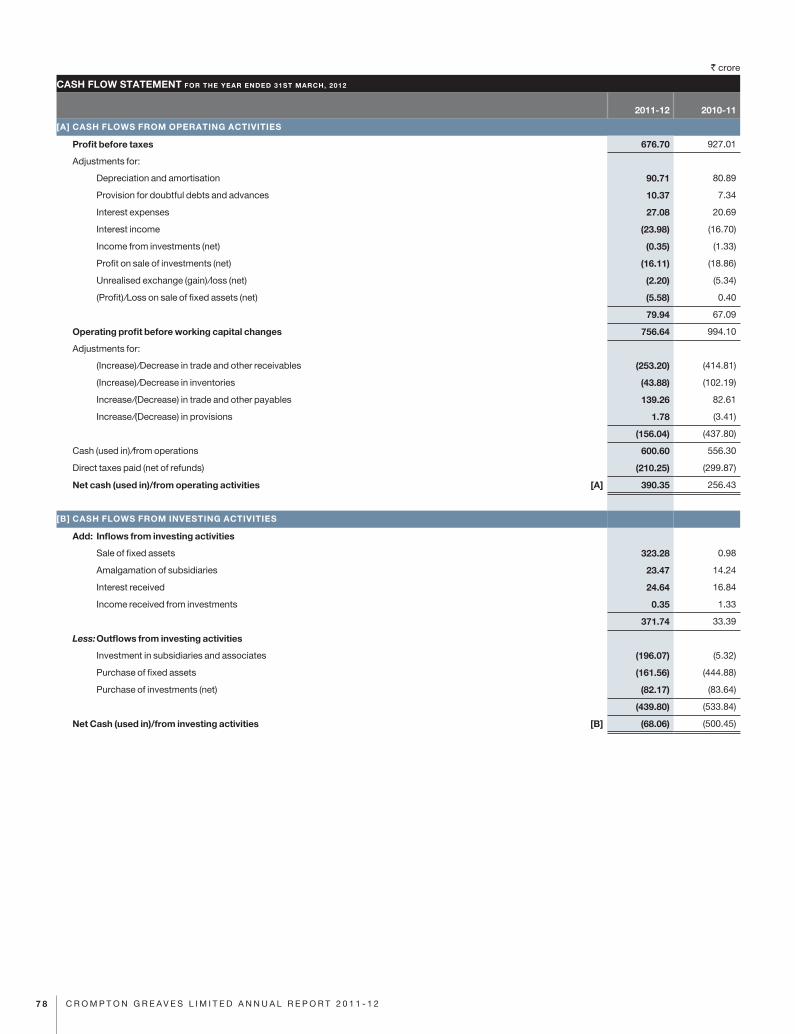
` crore
7 8 C R O M P T O N G R E A V E S L I M I T E D A N N U A L R E P O R T 2 0 1 1 - 1 2
2011-12 2010-11
[A] CASH FLOWS FROM OPERATING ACTIVITIES
Profit before taxes 676.70 927.01
adjustments for:
Depreciation and amortisation 90.71 80.89
Provision for doubtful debts and advances 10.37 7.34
interest expenses 27.08 20.69
interest income (23.98) (16.70)
income from investments (net) (0.35) (1.33)
Profit on sale of investments (net) (16.11) (18.86)
Unrealised exchange (gain)/loss (net) (2.20) (5.34)
(Profit)/loss on sale of fixed assets (net) (5.58) 0.40
79.94 67.09
Operating profit before working capital changes 756.64 994.10
adjustments for:
(increase)/Decrease in trade and other receivables (253.20) (414.81)
(increase)/Decrease in inventories (43.88) (102.19)
increase/(Decrease) in trade and other payables 139.26 82.61
increase/(Decrease) in provisions 1.78 (3.41)
(156.04) (437.80)
cash (used in)/from operations 600.60 556.30
Direct taxes paid (net of refunds) (210.25) (299.87)
Net cash (used in)/from operating activities [A] 390.35 256.43
[B] CASH FLOWS FROM INVESTING ACTIVITIES
Add: Inflows from investing activities
sale of fixed assets 323.28 0.98
amalgamation of subsidiaries 23.47 14.24
interest received 24.64 16.84
income received from investments 0.35 1.33
371.74 33.39
Less: Outflows from investing activities
investment in subsidiaries and associates (196.07) (5.32)
Purchase of fixed assets (161.56) (444.88)
Purchase of investments (net) (82.17) (83.64)
(439.80) (533.84)
Net Cash (used in)/from investing activities [B] (68.06) (500.45)
CASH FLOW STATEMENT FOR THE YEAR ENDED 31ST MARCH, 2012
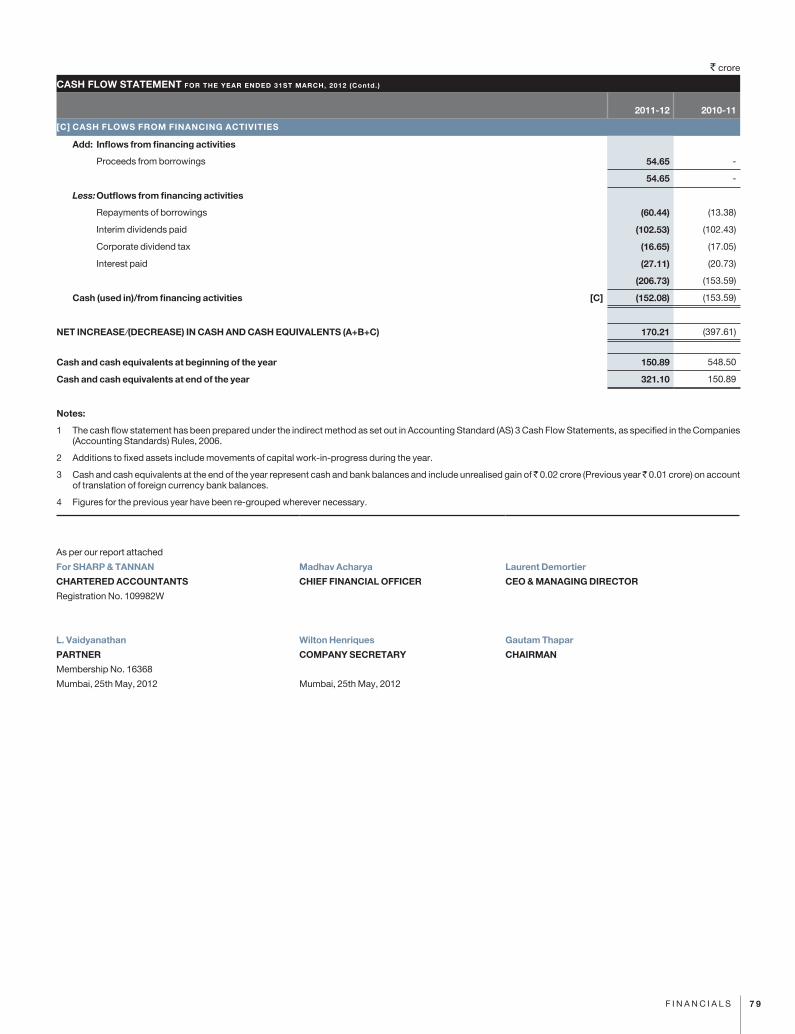
` crore
7 9F i n a n c i a l s
CASH FLOW STATEMENT FOR THE YEAR ENDED 31ST MARCH, 2012 (Contd. )
2011-12 2010-11
[C] CASH FLOWS FROM FINANCING ACTIVITIES
Add: Inflows from financing activities
Proceeds from borrowings 54.65 -
54.65 -
Less:Outflows from financing activities
Repayments of borrowings (60.44) (13.38)
interim dividends paid (102.53) (102.43)
corporate dividend tax (16.65) (17.05)
interest paid (27.11) (20.73)
(206.73) (153.59)
Cash (used in)/from financing activities [C] (152.08) (153.59)
NET INCREASE/(DECREASE) IN CASH AND CASH EQUIVALENTS (A+B+C) 170.21 (397.61)
Cash and cash equivalents at beginning of the year 150.89 548.50
Cash and cash equivalents at end of the year 321.10 150.89
Notes:
1 The cash flow statement has been prepared under the indirect method as set out in accounting standard (as) 3 cash Flow statements, as specified in the companies (accounting standards) Rules, 2006.
2 additions to fixed assets include movements of capital work-in-progress during the year.
3 cash and cash equivalents at the end of the year represent cash and bank balances and include unrealised gain of 0.02 crore (Previous year 0.01 crore) on account of translation of foreign currency bank balances.
4 Figures for the previous year have been re-grouped wherever necessary.
as per our report attached
For SHARP & TANNAN Madhav Acharya Laurent Demortier
CHARTERED ACCOUNTANTS CHIEF FINANCIAL OFFICER CEO & MANAGING DIRECTOR
Registration no. 109982W
L. Vaidyanathan Wilton Henriques Gautam Thapar
PARTNER COMPANY SECRETARY CHAIRMAN
Membership no. 16368
Mumbai, 25th May, 2012 Mumbai, 25th May, 2012
8 0 c R O M P T O n G R E a V E s l i M i T E D a n n U a l R E P O R T 2 0 1 1 - 1 2
NOTES ACCOMPANYING TO THE FINANCIAL STATEMENTS
1. Basis of accounting
The company maintains its accounts on accrual basis following the historical cost convention, in accordance with the Generally accepted accounting Principles (GaaP) except for the revaluation of certain fixed assets acquired before 30th June, 1985 and in compliance with the provisions of the companies act, 1956 and the accounting standards specified in the companies (accounting standards) Rules, 2006 (as amended). However, certain escalation and other claims are accounted for in terms of contracts with the customers / admitted by the appropriate authorities.
2. Use of estimates
The preparation of financial statements in conformity with GaaP requires that the management of the company makes estimates and assumptions that affect the reported amounts of income and expenses of the period, the reported balances of assets and liabilities and the disclosures relating to contingent liabilities and commitments as of the date of the financial statements. Examples of such estimates include the useful life of tangible and intangible fixed assets, allowance for doubtful debts / advances, future obligations in respect of retirement benefit plans, etc. Difference, if any, between the actual results and estimates is recognised in the period in which the results are known.
3. Fixed assets
(a) Fixed assets are stated at original cost net of tax / duty credit availed, if any, except for land and buildings added prior to 30th June, 1985 which are stated at revalued cost as at that date based on the report of technical expert, less accumulated depreciation and amortisation.
(b) Fixed assets are eliminated from financial statements, either on disposal or when retired from active use. The retired assets are disposed off immediately.
(c) administrative and other general overhead expenses that are specifically attributable to construction or acquisition of fixed assets or bringing the fixed assets to working condition are allocated and capitalised as a part of the fixed assets.
(d) Pre-operative expenses, including interest on borrowings upto the date of commercial operations, are treated as part of the project cost and capitalised.
(e) internally manufactured fixed assets are capitalised at factory cost, including excise duty, where applicable.
(f) capital work-in-progress includes cost of fixed assets under installation / under development as at the balance sheet date.
(g) capital expenditure on research and development is classified under tangible assets and depreciated on the same basis as other fixed assets.
4. Impairment of assets
as at each balance sheet date, the carrying amount of assets is tested for impairment so as to determine:
(a) the provision for impairment loss, if any; and
(b) the reversal of impairment loss recognised in previous periods, if any.
impairment loss is recognised when the carrying amount of an asset exceeds its recoverable amount.
Recoverable amount is determined:
(a) in the case of an individual asset, at the higher of the net selling price and the value in use; and
(b) in the case of a cash generating unit (a group of assets that generates identified, independent cash flows), at the higher of the cash generating unit’s net selling price and the value in use.
(Value in use is determined as the present value of estimated future cash flows from the continuing use of an asset and from its disposal at the end of its useful life.)
1. SIGNIFICANT ACCOUNTING POLICIES
8 1F i n a n c i a l s
NOTES ACCOMPANYING TO THE FINANCIAL STATEMENTS (Contd. )
5. Intangible assets and amortisation
intangible assets are recognised when it is probable that the future economic benefits that are attributable to the assets will flow to the company and the cost of the asset can be measured reliably. intangible assets are amortised as follows:
(a) Goodwill : Over a period of ten years;
(b) specialised software : Over a period of five years;
(c) Technical know-how : Over a period of five years from the date of commercial production;
(d) commercial rights : Over a period of ten years; and
(e) Development costs:
(1) Revenue expenditure on research is expensed under respective heads of account in the period in which it is incurred.
(2) Development expenditure on new product is capitalised as intangible asset, if all of the following can be demonstrated:
(a) the technical feasibility of completing the intangible asset so that it will be available for use or sale;
(b) the company has intention to complete the intangible asset and use or sell it;
(c) the company has ability to use or sell the intangible asset;
(d) the manner in which the probable future economic benefit will be generated including the existence of a market for output of the intangible asset or intangible asset itself or if it is to be used internally, the usefulness of the intangible asset;
(e) the availability of adequate technical, financial and other resources to complete the development and to use or sell the intangible asset; and
(f) the company has ability to measure the expenditure attributable to the intangible asset during the development reliably.
The development expenditure capitalised as intangible asset is amortised over a period of five years.
Other development costs that do not meet above criteria are expensed in the period in which they are incurred.
6. Investments
Each category / item of investment is valued as follows:
(a) long-term investments are carried at cost, after providing for any diminution in value, if such diminution is other than temporary in nature.
(b) current investments are carried at the lower of cost and fair value.
The determination of carrying amount of such investments is done on the basis of weighted average cost of each individual investment.
7. Inventories
inventories are valued after providing for obsolescence as under:
(a) Raw materials, packing materials, construction materials, stores and spares
: at lower of cost, on weighted average basis and net realisable value.
(b) Work-in-progress - Manufacturing : at lower of cost of material, plus appropriate production overheads and net realisable value.
(c) Finished goods - Manufacturing : at lower of cost of material plus appropriate production overheads, including excise duty paid / payable on such goods and net realisable value.
(d) Finished goods - Trading : at lower of cost, on weighted average basis and net realisable value.
8. Cash and cash equivalents
(a) cash comprises cash on hand and demand deposits with banks.
(b) cash equivalents are short-term, highly liquid investment that are readily convertible into known amounts of cash and which are subject to an insignificant risk of changes in value.
9. Foreign currency transactions and foreign operations
(a) The reporting currency of the company is indian Rupee.
(b) Foreign currency transactions are recorded on initial recognition in the reporting currency, using the exchange rate at the date of the transaction. at each balance sheet date, foreign currency monetary items are reported using the closing rate. non-monetary items which are carried at historical cost denominated in a foreign currency are reported using the historical rate.
(c) Exchange differences that arise on settlement of monetary items or on reporting at each balance sheet date of the company’s monetary items at the closing rate are recognised as income or expenses in the period in which they arise.
(d) Financial statements of foreign operation are treated as integral operations and translated as in the same manner as foreign currency transactions, as described above. Exchange differences arising on such translation are recognised as income or expenses of the period in which they arise.
1. SIGNIFICANT ACCOUNTING POLICIES
8 2 c R O M P T O n G R E a V E s l i M i T E D a n n U a l R E P O R T 2 0 1 1 - 1 2
10. Derivative contracts
(a) Derivative contracts entered into, to hedge foreign currency / price risks on unexecuted firm commitments and highly probable forecast transactions, are recognised in the financial statements at fair value as on the balance sheet date. The gains or losses arising out of fair valuation of derivative contracts are recognised in the statement of profit and loss or balance sheet, as the case may be, after applying the test of hedge effectiveness. The gains or losses are recognised as hedge reserve in the balance sheet when the hedge is effective and where the hedge is ineffective the same is recognised in the statement of profit and loss.
(b) The premium or discount on forward contracts is amortised as expense or income over the period of the contract.
(c) Gains and losses on roll over or cancellation of derivative contracts which qualify as effective hedge are recognised in the statement of profit and loss in the same period in which the hedged item is accounted.
11. Revenue recognition
(a) Revenue from sale of goods is recognised, when all the significant risks and rewards of ownership are transferred to the buyer, under the terms of contract and no significant uncertainty exists regarding the amount of the consideration that will be derived from the sale of the goods. sales include excise duty and price variation, if any and exclude value added tax / sales tax, brokerage and commission.
(b) service income is recognised as per the terms of the contracts with the customers on proportionate completion method.
(c) Revenue from contracts is recognised by applying percentage of completion method after providing for foreseeable losses, if any. Percentage of completion is determined as a proportion of the costs incurred upto the reporting date to the total estimated cost to complete. Foreseeable loss, if any, on the contracts is recognised as an expense in the period in which it is foreseen, irrespective of the stage of completion of the contract. While determining the amount of foreseeable loss, all elements of costs and related incidental income not included in contract revenue is taken into consideration. contract is reflected at cost till such time the outcome of the contract cannot be ascertained reliably and at realisable value thereafter.
(d) interest income on deposits, securities and loans is recognised at the agreed rate on time proportion basis.
(e) Dividend income is accounted for when the right to receive the same is established.
(f) Other items of income are accounted as and when the right to receive arises.
12. Employee benefits
(a) short-term employee benefits:
all employee benefits payable wholly within twelve months of rendering service are classified as short-term employee benefits. Benefits such as salaries, wages, short-term compensated absences, etc., and the expected cost of bonus, ex-gratia are recognised during the period in which the employee renders the related service.
(b) Post-employment benefits:
Defined contribution plans
company’s contributions paid / payable during the year to provident fund, officer’s superannuation fund, employee state insurance scheme and labour welfare fund are recognised during the period in which the employee renders the related service.
Defined benefit plans
For defined benefit schemes in the form of gratuity fund and post retirement medical benefits, the cost of providing benefits is determined using the Projected Unit credit Method, with actuarial valuations being carried out at each balance sheet date, which recognises each period of service as giving rise to additional unit of employee benefit entitlement and measures each unit separately to build up the final obligation.
The obligation is measured at the present value of the estimated future cash flows. The discount rate used for determining the present value of the obligation under defined benefit plans, is based on the market yields on government securities as at the balance sheet date, having maturity periods approximating to the terms of related obligations.
actuarial gains and losses are recognised in full in the statement of profit and loss, for the period in which they occur.
Past service cost is recognised immediately to the extent that the benefits are already vested, and otherwise is amortised on a straight-line basis over the average period until the benefits become vested.
The retirement benefit obligation recognised in the balance sheet represents the present value of the defined benefit obligation as adjusted for unrecognised past service cost and as reduced by the fair value of scheme assets.
(c) long-term employee benefits
compensated absences which are not expected to occur within twelve months after the end of the period in which the employee renders the related services are recognised as a liability at the present value of the defined benefit obligation at the balance sheet date.
(d) Termination benefits
Termination benefits are recognised as an expense in the period in which they are incurred.
NOTES ACCOMPANYING TO THE FINANCIAL STATEMENTS (Contd. )
1. SIGNIFICANT ACCOUNTING POLICIES
8 3F i n a n c i a l s
13. Depreciation (a) Owned assets:
(1) Revalued assets Depreciation is provided on straight line method on the values and at the rates specified in schedule XiV to the companies act,
1956. The difference between depreciation provided on revalued amount and on historical cost is recouped out of revalution reserve.
(2) assets carried at historical cost Depreciation on the fixed assets carried at historical cost is provided at the rates and in the manner specified in schedule XiV to
the companies act, 1956, on written down value method other than on buildings and plant and equipments, which are depreciated on a straight line method.
(b) leased assets: (1) leasehold land are amortised over the period of lease. (2) Buildings constructed on leasehold land are depreciated at normal rate as prescribed in schedule XiV to the companies act, 1956,
where the lease period of land is beyond the life of the building. (3) in other cases, buildings constructed on leasehold land are amortised over the lease period of the land.
14. Borrowing costs (a) Borrowing costs that are attributable to the acquisition, construction or production of a qualifying asset are capitalised as part of
the cost of such asset till such time as the asset is ready for its intended use or sale. a qualifying asset is an asset that necessarily requires a substantial period of time (generally over twelve months) to get ready for its intended use or sale.
(b) all other borrowing costs are recognised as expense in the period in which they are incurred.
15. Segment accounting (a) segment accounting policies segment accounting policies are in line with the accounting policies of the company. in addition, the following specific accounting
policies have been followed for segment reporting: (1) segment revenue includes sales and other income directly identifiable with / allocable to the segment including inter-segment revenue. (2) Expenses that are directly identifiable with / allocable to segments are considered for determining the segment result. Expenses
which relate to the company as a whole and not allocable to segments are included under unallocable expenditure. (3) income which relates to the company as a whole and not allocable to segments is included in unallocable income. (4) segment result includes margins on inter-segment and sales which are reduced in arriving at the profit before tax of the company. (5) segment assets and liabilities include those directly identifiable with the respective segments. Unallocable assets and liabilities
represent the assets and liabilities that relate to the company as a whole and not allocable to any segment. (b) inter-segment transfer pricing
segment revenue resulting from transactions with other business segments is accounted on the basis of transfer price agreed between the segments. such transfer prices are either determined to yield a desired margin or agreed on a negotiated basis.
16. Taxes on income (a) Tax on income for the current period is determined on the basis of estimated taxable income and tax credits computed in accordance
with the provisions of the income Tax act, 1961 and based on the expected outcome of assessments / appeals. (b) Deferred tax is recognised on timing differences between the accounted income and the taxable income for the year and quantified
using the tax rates and tax laws enacted or substantively enacted as on the balance sheet date. (c) Deferred tax assets relating to unabsorbed depreciation / business losses are recognised and carried forward to the extent there is
virtual certainty that sufficient future taxable income will be available against which such deferred tax assets can be realised. (d) Other deferred tax assets are recognised and carried forward to the extent that there is a reasonable certainty that sufficient future
taxable income will be available against which such deferred tax assets can be realised.
17. Provisions, Contingent liabilities, Contingent assets and Commitments (a) Provisions are recognised for liabilities that can be measured only by using a substantial degree of estimation, if:
(1) the company has a present obligation as a result of a past event;
(2) a probable outflow of resources is expected to settle the obligation; and
(3) the amount of the obligation can be reliably estimated.
(b) Reimbursement by another party, expected in respect of expenditure required to settle a provision, is recognised when it is virtually certain that reimbursement will be received if, obligation is settled.
(c) contingent liability is disclosed in the case of:
(1) a present obligation arising from past events, when it is not probable that an outflow of resources will be required to settle the obligation;
(2) a present obligation when no reliable estimate is possible;
(3) a possible obligation arising from past events, unless the probability of outflow of resources is remote.
(d) contingent assets are neither recognised nor disclosed.
(e) commitments include the amount of purchase order (net of advance) issued to parties for completion of asset.
(f) Provisions, contingent liabilities, contingent assets and commitments are reviewed at each balance sheet date.
NOTES ACCOMPANYING TO THE FINANCIAL STATEMENTS (Contd. )
1. SIGNIFICANT ACCOUNTING POLICIES
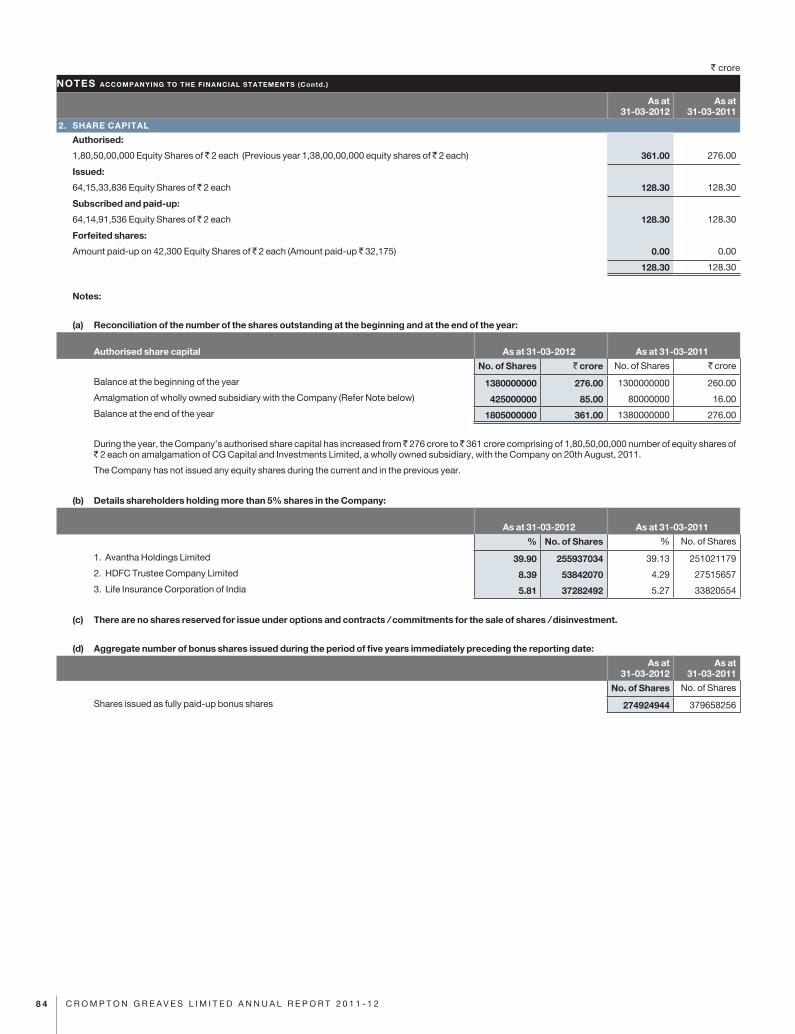
` crore
8 4 C R O M P T O N G R E A V E S L I M I T E D A N N U A L R E P O R T 2 0 1 1 - 1 2
As at 31-03-2012
As at 31-03-2011
2. SHARE CAPITAL
Authorised:
1,80,50,00,000 Equity shares of 2 each (Previous year 1,38,00,00,000 equity shares of 2 each) 361.00 276.00
Issued:
64,15,33,836 Equity shares of 2 each 128.30 128.30
Subscribed and paid-up:
64,14,91,536 Equity shares of 2 each 128.30 128.30
Forfeited shares:
amount paid-up on 42,300 Equity shares of 2 each (amount paid-up 32,175) 0.00 0.00
128.30 128.30
Notes:
(a) Reconciliation of the number of the shares outstanding at the beginning and at the end of the year:
Authorised share capital As at 31-03-2012 As at 31-03-2011
No. of Shares ` crore no. of shares ` crore
Balance at the beginning of the year 1380000000 276.00 1300000000 260.00
amalgmation of wholly owned subsidiary with the company (Refer note below) 425000000 85.00 80000000 16.00
Balance at the end of the year 1805000000 361.00 1380000000 276.00
During the year, the company’s authorised share capital has increased from 276 crore to 361 crore comprising of 1,80,50,00,000 number of equity shares of ` 2 each on amalgamation of cG capital and investments limited, a wholly owned subsidiary, with the company on 20th august, 2011.
The company has not issued any equity shares during the current and in the previous year.
(b) Details shareholders holding more than 5% shares in the Company:
As at 31-03-2012 As at 31-03-2011
% No. of Shares % no. of shares
1. avantha Holdings limited 39.90 255937034 39.13 251021179
2. HDFc Trustee company limited 8.39 53842070 4.29 27515657
3. life insurance corporation of india 5.81 37282492 5.27 33820554
(c) There are no shares reserved for issue under options and contracts / commitments for the sale of shares / disinvestment.
(d) Aggregate number of bonus shares issued during the period of five years immediately preceding the reporting date:
As at 31-03-2012
As at 31-03-2011
No. of Shares no. of shares
shares issued as fully paid-up bonus shares 274924944 379658256
NOTES ACCOMPANYING TO THE FINANCIAL STATEMENTS (Contd. )
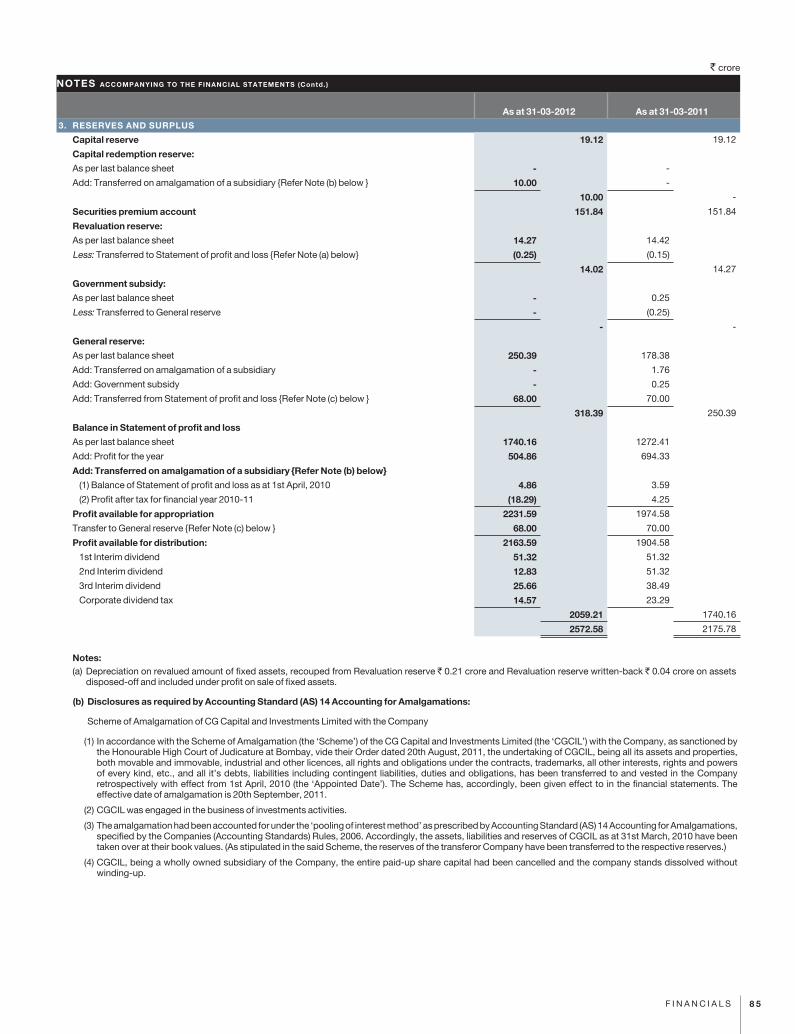
` crore
8 5F i n a n c i a l s
As at 31-03-2012 As at 31-03-20113. RESERVES AND SURPLUS
Capital reserve 19.12 19.12
Capital redemption reserve:
as per last balance sheet - -
add: Transferred on amalgamation of a subsidiary {Refer note (b) below } 10.00 -
10.00 -
Securities premium account 151.84 151.84
Revaluation reserve:
as per last balance sheet 14.27 14.42
less: Transferred to statement of profit and loss {Refer note (a) below} (0.25) (0.15)
14.02 14.27
Government subsidy:
as per last balance sheet - 0.25
less: Transferred to General reserve - (0.25)
- -
General reserve:
as per last balance sheet 250.39 178.38
add: Transferred on amalgamation of a subsidiary - 1.76
add: Government subsidy - 0.25
add: Transferred from statement of profit and loss {Refer note (c) below } 68.00 70.00
318.39 250.39
Balance in Statement of profit and loss
as per last balance sheet 1740.16 1272.41
add: Profit for the year 504.86 694.33
Add: Transferred on amalgamation of a subsidiary {Refer Note (b) below}
(1) Balance of statement of profit and loss as at 1st april, 2010 4.86 3.59
(2) Profit after tax for financial year 2010-11 (18.29) 4.25
Profit available for appropriation 2231.59 1974.58
Transfer to General reserve {Refer note (c) below } 68.00 70.00
Profit available for distribution: 2163.59 1904.58
1st interim dividend 51.32 51.32
2nd interim dividend 12.83 51.32
3rd interim dividend 25.66 38.49
corporate dividend tax 14.57 23.29
2059.21 1740.16
2572.58 2175.78
Notes:(a) Depreciation on revalued amount of fixed assets, recouped from Revaluation reserve ` 0.21 crore and Revaluation reserve written-back ` 0.04 crore on assets
disposed-off and included under profit on sale of fixed assets.
(b) Disclosures as required by Accounting Standard (AS) 14 Accounting for Amalgamations:
scheme of amalgamation of cG capital and investments limited with the company
(1) in accordance with the scheme of amalgamation (the ‘scheme’) of the cG capital and investments limited (the ‘cGcil’) with the company, as sanctioned by the Honourable High court of Judicature at Bombay, vide their Order dated 20th august, 2011, the undertaking of cGcil, being all its assets and properties, both movable and immovable, industrial and other licences, all rights and obligations under the contracts, trademarks, all other interests, rights and powers of every kind, etc., and all it’s debts, liabilities including contingent liabilities, duties and obligations, has been transferred to and vested in the company retrospectively with effect from 1st april, 2010 (the ‘appointed Date’). The scheme has, accordingly, been given effect to in the financial statements. The effective date of amalgamation is 20th september, 2011.
(2) cGcil was engaged in the business of investments activities.
(3) The amalgamation had been accounted for under the ‘pooling of interest method’ as prescribed by accounting standard (as) 14 accounting for amalgamations, specified by the companies (accounting standards) Rules, 2006. accordingly, the assets, liabilities and reserves of cGcil as at 31st March, 2010 have been taken over at their book values. (as stipulated in the said scheme, the reserves of the transferor company have been transferred to the respective reserves.)
(4) cGcil, being a wholly owned subsidiary of the company, the entire paid-up share capital had been cancelled and the company stands dissolved without winding-up.
NOTES ACCOMPANYING TO THE FINANCIAL STATEMENTS (Contd. )
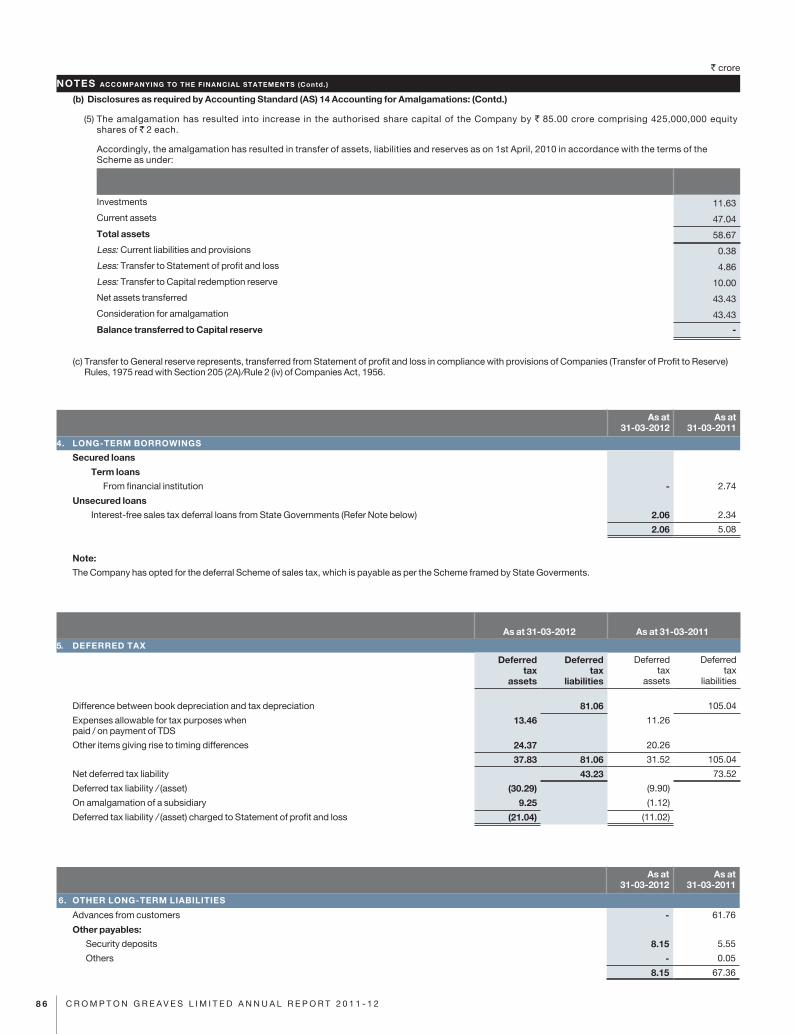
` crore
8 6 C R O M P T O N G R E A V E S L I M I T E D A N N U A L R E P O R T 2 0 1 1 - 1 2
(b) Disclosures as required by Accounting Standard (AS) 14 Accounting for Amalgamations: (Contd.)
(5) The amalgamation has resulted into increase in the authorised share capital of the company by ` 85.00 crore comprising 425,000,000 equity shares of 2 each.
accordingly, the amalgamation has resulted in transfer of assets, liabilities and reserves as on 1st april, 2010 in accordance with the terms of the scheme as under:
investments 11.63
current assets 47.04
Total assets 58.67
less: current liabilities and provisions 0.38
less: Transfer to statement of profit and loss 4.86
less: Transfer to capital redemption reserve 10.00
net assets transferred 43.43
consideration for amalgamation 43.43
Balance transferred to Capital reserve -
(c) Transfer to General reserve represents, transferred from statement of profit and loss in compliance with provisions of companies (Transfer of Profit to Reserve) Rules, 1975 read with section 205 (2a)/Rule 2 (iv) of companies act, 1956.
As at 31-03-2012
As at 31-03-2011
4. LONG-TERM BORROWINGS
Secured loans
Term loans
From financial institution - 2.74
Unsecured loans
interest-free sales tax deferral loans from state Governments (Refer note below) 2.06 2.34
2.06 5.08
Note:
The company has opted for the deferral scheme of sales tax, which is payable as per the scheme framed by state Goverments.
As at 31-03-2012 As at 31-03-20115. DEFERRED TAX
Deferred tax
assets
Deferred tax
liabilities
Deferred tax
assets
Deferred tax
liabilities
Difference between book depreciation and tax depreciation 81.06 105.04
Expenses allowable for tax purposes when paid / on payment of TDs
13.46 11.26
Other items giving rise to timing differences 24.37 20.26
37.83 81.06 31.52 105.04
net deferred tax liability 43.23 73.52
Deferred tax liability / (asset) (30.29) (9.90)
On amalgamation of a subsidiary 9.25 (1.12)
Deferred tax liability / (asset) charged to statement of profit and loss (21.04) (11.02)
As at 31-03-2012
As at 31-03-2011
6. OTHER LONG-TERM LIABILITIES
advances from customers - 61.76
Other payables:
security deposits 8.15 5.55
Others - 0.05
8.15 67.36
NOTES ACCOMPANYING TO THE FINANCIAL STATEMENTS (Contd. )
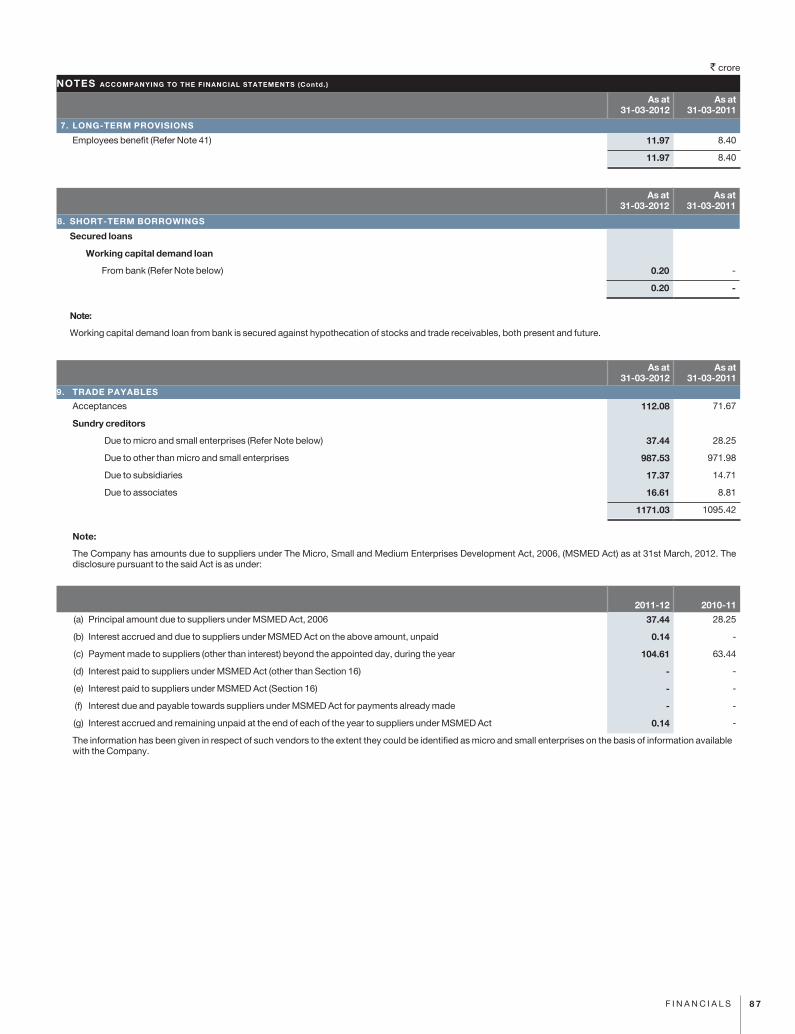
` crore
8 7F i n a n c i a l s
As at 31-03-2012
As at 31-03-2011
7. LONG-TERM PROVISIONS
Employees benefit (Refer note 41) 11.97 8.40
11.97 8.40
As at 31-03-2012
As at 31-03-2011
8. SHORT-TERM BORROWINGS
Secured loans
Working capital demand loan
From bank (Refer note below) 0.20 -
0.20 -
Note:
Working capital demand loan from bank is secured against hypothecation of stocks and trade receivables, both present and future.
As at 31-03-2012
As at 31-03-2011
9. TRADE PAYABLES
acceptances 112.08 71.67
Sundry creditors
Due to micro and small enterprises (Refer note below) 37.44 28.25
Due to other than micro and small enterprises 987.53 971.98
Due to subsidiaries 17.37 14.71
Due to associates 16.61 8.81
1171.03 1095.42
Note:
The company has amounts due to suppliers under The Micro, small and Medium Enterprises Development act, 2006, (MsMED act) as at 31st March, 2012. The disclosure pursuant to the said act is as under:
2011-12 2010-11
(a) Principal amount due to suppliers under MsMED act, 2006 37.44 28.25
(b) interest accrued and due to suppliers under MsMED act on the above amount, unpaid 0.14 -
(c) Payment made to suppliers (other than interest) beyond the appointed day, during the year 104.61 63.44
(d) interest paid to suppliers under MsMED act (other than section 16) - -
(e) interest paid to suppliers under MsMED act (section 16) - -
(f) interest due and payable towards suppliers under MsMED act for payments already made - -
(g) interest accrued and remaining unpaid at the end of each of the year to suppliers under MsMED act 0.14 -
The information has been given in respect of such vendors to the extent they could be identified as micro and small enterprises on the basis of information available with the company.
NOTES ACCOMPANYING TO THE FINANCIAL STATEMENTS (Contd. )
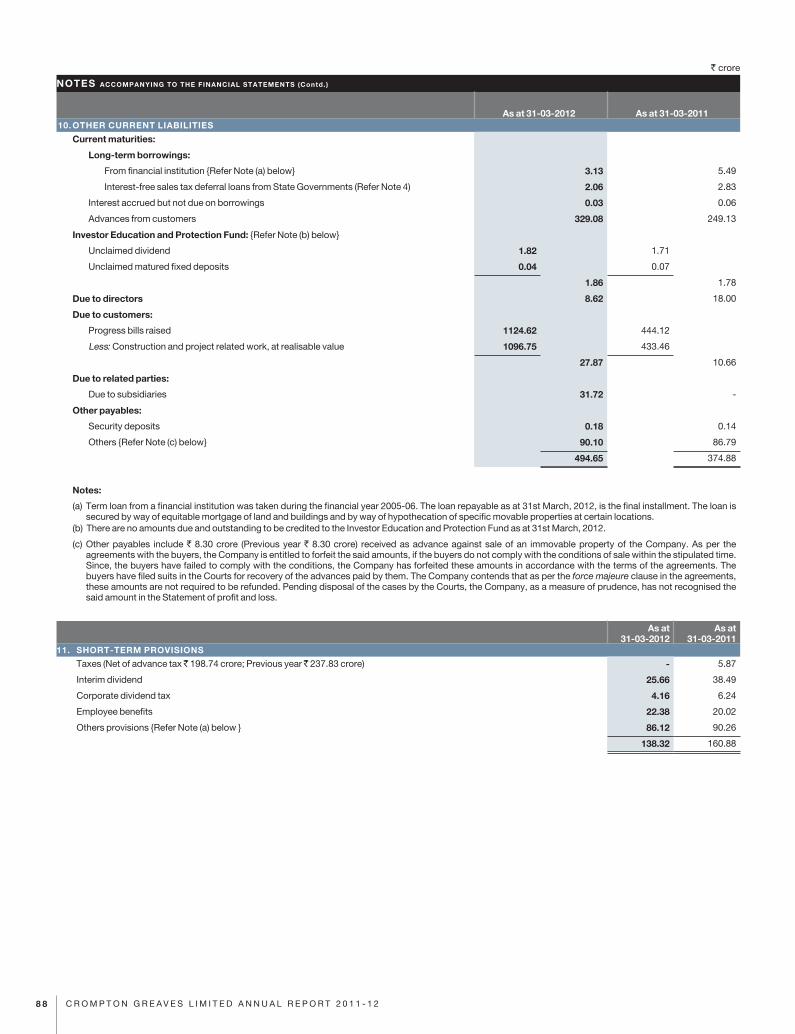
` crore
8 8 C R O M P T O N G R E A V E S L I M I T E D A N N U A L R E P O R T 2 0 1 1 - 1 2
As at 31-03-2012 As at 31-03-201110. OTHER CURRENT LIABILITIES
Current maturities:
Long-term borrowings:
From financial institution {Refer note (a) below} 3.13 5.49
interest-free sales tax deferral loans from state Governments (Refer note 4) 2.06 2.83
interest accrued but not due on borrowings 0.03 0.06
advances from customers 329.08 249.13
Investor Education and Protection Fund: {Refer note (b) below}
Unclaimed dividend 1.82 1.71
Unclaimed matured fixed deposits 0.04 0.07
1.86 1.78
Due to directors 8.62 18.00
Due to customers:
Progress bills raised 1124.62 444.12
less: construction and project related work, at realisable value 1096.75 433.46
27.87 10.66
Due to related parties:
Due to subsidiaries 31.72 -
Other payables:
security deposits 0.18 0.14
Others {Refer note (c) below} 90.10 86.79
494.65 374.88
Notes:
(a) Term loan from a financial institution was taken during the financial year 2005-06. The loan repayable as at 31st March, 2012, is the final installment. The loan is secured by way of equitable mortgage of land and buildings and by way of hypothecation of specific movable properties at certain locations.
(b) There are no amounts due and outstanding to be credited to the investor Education and Protection Fund as at 31st March, 2012.
(c) Other payables include ` 8.30 crore (Previous year ` 8.30 crore) received as advance against sale of an immovable property of the company. as per the agreements with the buyers, the company is entitled to forfeit the said amounts, if the buyers do not comply with the conditions of sale within the stipulated time. since, the buyers have failed to comply with the conditions, the company has forfeited these amounts in accordance with the terms of the agreements. The buyers have filed suits in the courts for recovery of the advances paid by them. The company contends that as per the force majeure clause in the agreements, these amounts are not required to be refunded. Pending disposal of the cases by the courts, the company, as a measure of prudence, has not recognised the said amount in the statement of profit and loss.
As at 31-03-2012
As at 31-03-2011
11. SHORT-TERM PROVISIONS
Taxes (net of advance tax 198.74 crore; Previous year 237.83 crore) - 5.87
interim dividend 25.66 38.49
corporate dividend tax 4.16 6.24
Employee benefits 22.38 20.02
Others provisions {Refer note (a) below } 86.12 90.26
138.32 160.88
NOTES ACCOMPANYING TO THE FINANCIAL STATEMENTS (Contd. )
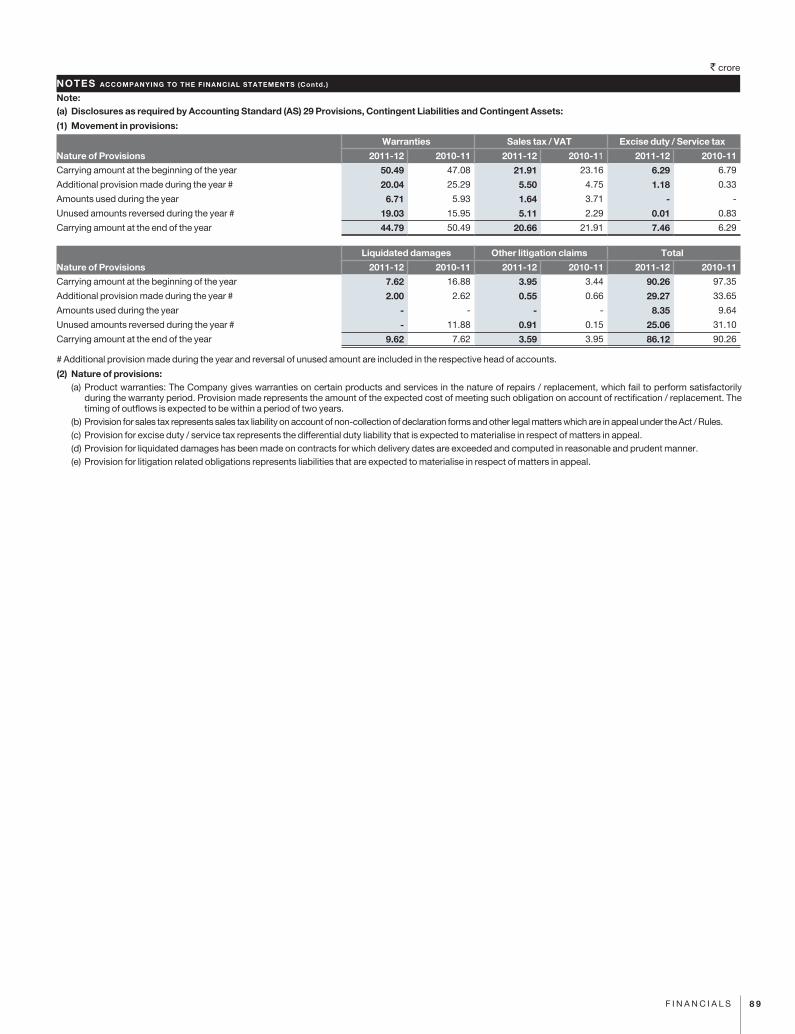
` crore
8 9F i n a n c i a l s
Note:(a) Disclosures as required by Accounting Standard (AS) 29 Provisions, Contingent Liabilities and Contingent Assets:
(1) Movement in provisions:
Nature of Provisions
Warranties Sales tax / VAT Excise duty / Service tax
2011-12 2010-11 2011-12 2010-11 2011-12 2010-11
carrying amount at the beginning of the year 50.49 47.08 21.91 23.16 6.29 6.79
additional provision made during the year # 20.04 25.29 5.50 4.75 1.18 0.33
amounts used during the year 6.71 5.93 1.64 3.71 - -
Unused amounts reversed during the year # 19.03 15.95 5.11 2.29 0.01 0.83
carrying amount at the end of the year 44.79 50.49 20.66 21.91 7.46 6.29
Nature of Provisions
Liquidated damages Other litigation claims Total
2011-12 2010-11 2011-12 2010-11 2011-12 2010-11
carrying amount at the beginning of the year 7.62 16.88 3.95 3.44 90.26 97.35
additional provision made during the year # 2.00 2.62 0.55 0.66 29.27 33.65
amounts used during the year - - - - 8.35 9.64
Unused amounts reversed during the year # - 11.88 0.91 0.15 25.06 31.10
carrying amount at the end of the year 9.62 7.62 3.59 3.95 86.12 90.26
# additional provision made during the year and reversal of unused amount are included in the respective head of accounts.
(2) Nature of provisions: (a) Product warranties: The company gives warranties on certain products and services in the nature of repairs / replacement, which fail to perform satisfactorily
during the warranty period. Provision made represents the amount of the expected cost of meeting such obligation on account of rectification / replacement. The timing of outflows is expected to be within a period of two years.
(b) Provision for sales tax represents sales tax liability on account of non-collection of declaration forms and other legal matters which are in appeal under the act / Rules. (c) Provision for excise duty / service tax represents the differential duty liability that is expected to materialise in respect of matters in appeal. (d) Provision for liquidated damages has been made on contracts for which delivery dates are exceeded and computed in reasonable and prudent manner. (e) Provision for litigation related obligations represents liabilities that are expected to materialise in respect of matters in appeal.
NOTES ACCOMPANYING TO THE FINANCIAL STATEMENTS (Contd. )
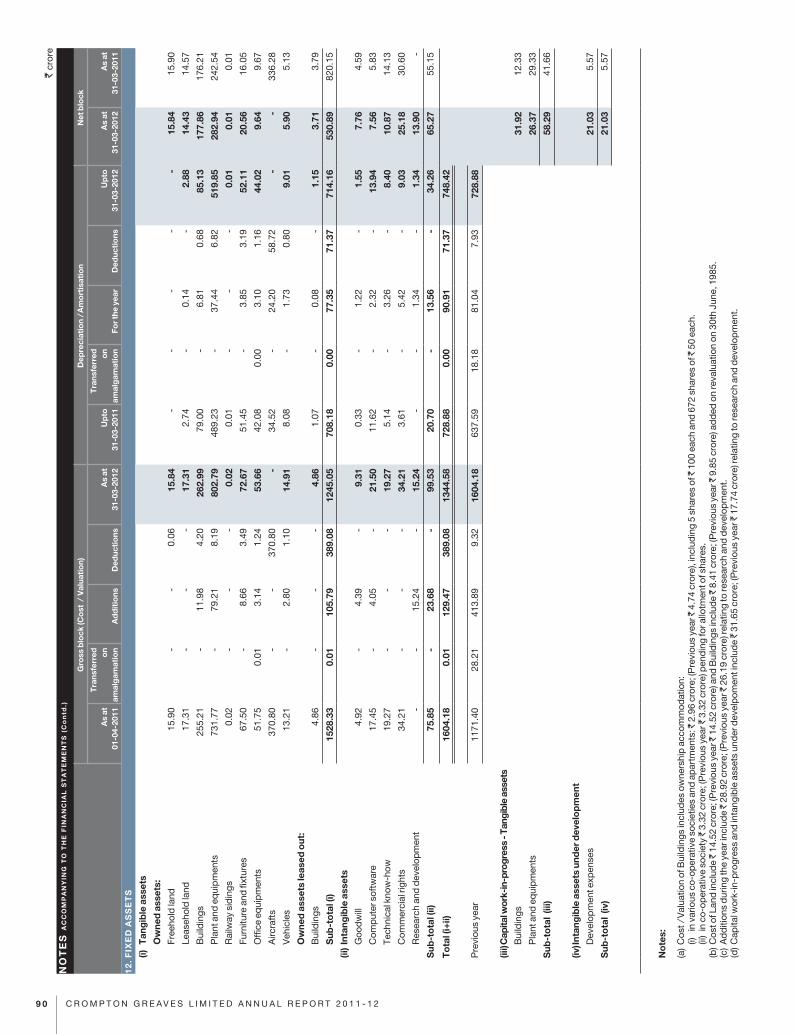
` cr
ore
NO
TE
S A
CC
OM
PA
NY
ING
TO
TH
E F
INA
NC
IAL
ST
AT
EM
EN
TS
(C
on
td.)
Gro
ss b
lock
(Co
st /
Val
uati
on)
D
epre
ciat
ion
/ Am
ort
isat
ion
Net
blo
ck
As
at
01-
04-2
011
Tra
nsfe
rred
o
n am
alg
amat
ion
Ad
dit
ions
D
educ
tio
ns
As
at
31-
03-2
012
Up
to
31-0
3-20
11
Tra
nsfe
rred
o
n am
alg
amat
ion
Fo
r the
yea
r D
educ
tio
ns
Up
to
31-
03-2
012
As
at
31-0
3-20
12
As
at
31-0
3-20
11
12
.FIX
ED
AS
SE
TS
(i) T
ang
ible
ass
ets
O
wne
d a
sset
s:
Fr
eeho
ld la
nd15
.90
-
-
0.06
15.8
4-
-
-
-
-
15.8
415
.90
le
aseh
old
land
17.3
1 -
-
-
17
.31
2.74
-
0.14
-2.
8814
.43
14.5
7
B
uild
ings
255.
21 -
11
.98
4.20
262.
9979
.00
-
6.81
0.68
85.1
317
7.86
176.
21
P
lant
and
eq
uip
men
ts73
1.77
-
79.2
18.
1980
2.79
489.
23 -
37
.44
6.82
519.
8528
2.94
242.
54
R
ailw
ay s
idin
gs0.
02 -
-
-
0.
020.
01 -
-
-
0.01
0.01
0.01
Fu
rnitu
re a
nd fi
xtur
es67
.50
-
8.66
3.49
72.6
751
.45
-
3.85
3.19
52.1
120
.56
16.0
5
O
ffice
eq
uip
men
ts
51.7
50.
013.
141.
2453
.66
42.0
80.
003.
101.
1644
.02
9.64
9.67
a
ircra
fts
370.
80 -
-
37
0.80
-
34.5
2 -
24
.20
58.7
2 -
-
33
6.28
V
ehic
les
13.2
1 -
2.
801.
1014
.91
8.08
-
1.73
0.80
9.01
5.90
5.13
O
wne
d a
sset
s le
ased
out
:
B
uild
ings
4.86
-
-
-
4.86
1.07
-
0.08
-
1.15
3.71
3.79
S
ub-t
ota
l (i)
1528
.33
0.01
105.
7938
9.08
1245
.05
708.
180.
0077
.35
71.3
771
4.16
530.
8982
0.15
(ii)
Inta
ngib
le a
sset
s
G
ood
will
4.92
-
4.39
-
9.31
0.33
-
1.22
-
1.55
7.76
4.59
c
omp
uter
sof
twar
e17
.45
-
4.05
-
21.5
011
.62
-
2.32
-
13.9
47.
565.
83
Te
chni
cal k
now
-how
19.2
7 -
-
-
19
.27
5.14
-
3.26
-
8.40
10.8
714
.13
c
omm
erci
al ri
ghts
34.2
1 -
-
-
34
.21
3.61
-
5.42
-
9.03
25.1
830
.60
R
esea
rch
and
dev
elop
men
t -
-
15
.24
-
15.2
4 -
-
1.
34 -
1.
3413
.90
-
Sub
-to
tal (
ii)75
.85
-
23.6
8 -
99
.53
20.7
0 -
13
.56
-
34.2
665
.27
55.1
5
To
tal (
i+ii)
1604
.18
0.01
129.
4738
9.08
1344
.58
728.
880.
0090
.91
71.3
774
8.42
Pre
viou
s ye
ar11
71.4
028
.21
413.
899.
3216
04.1
863
7.59
18.1
881
.04
7.93
728.
88
(iii)
Cap
ital w
ork-
in-p
rogr
ess
- Tan
gibl
e as
sets
B
uild
ings
31.9
212
.33
P
lant
and
eq
uip
men
ts26
.37
29.3
3
Sub
-to
tal
(iii)
58.2
941
.66
(iv) I
ntan
gib
le a
sset
s un
der
dev
elo
pm
ent
D
evel
opm
ent e
xpen
ses
21.0
35.
57
Sub
-to
tal
(iv)
21.0
35.
57
No
tes:
(a)
cos
t / V
alua
tion
of B
uild
ings
incl
udes
ow
ners
hip
acc
omm
odat
ion:
(i)
in v
ario
us c
o-op
erat
ive
soci
etie
s an
d a
par
tmen
ts:
2.9
6 cr
ore;
(Pre
viou
s ye
ar
4.7
4 cr
ore)
, inc
lud
ing
5 sh
ares
of
100
eac
h an
d 6
72 s
hare
s of
5
0 ea
ch.
(ii
) in
co-
oper
ativ
e so
ciet
y 3
.32
cror
e; (P
revi
ous
year
3
.32
cror
e) p
end
ing
for a
llotm
ent o
f sha
res.
(b) c
ost o
f lan
d in
clud
e 1
4.52
cro
re; (
Pre
viou
s ye
ar
14.
52 c
rore
) and
Bui
ldin
gs in
clud
e 8
.41
cror
e; (P
revi
ous
year
9
.85
cror
e) a
dd
ed o
n re
valu
atio
n on
30t
h Ju
ne, 1
985.
(c)
ad
diti
ons
dur
ing
the
year
incl
ude
28.
92 c
rore
; (P
revi
ous
year
2
6.19
cro
re) r
elat
ing
to re
sear
ch a
nd d
evel
opm
ent.
(d) c
apita
l wor
k-in
-pro
gres
s an
d in
tang
ible
ass
ets
und
er d
evel
pom
ent i
nclu
de
31.
65 c
rore
; (P
revi
ous
year
1
7.74
cro
re) r
elat
ing
to re
sear
ch a
nd d
evel
opm
ent.
9 0 c R O M P T O n G R E a V E s l i M i T E D a n n U a l R E P O R T 2 0 1 1 - 1 2
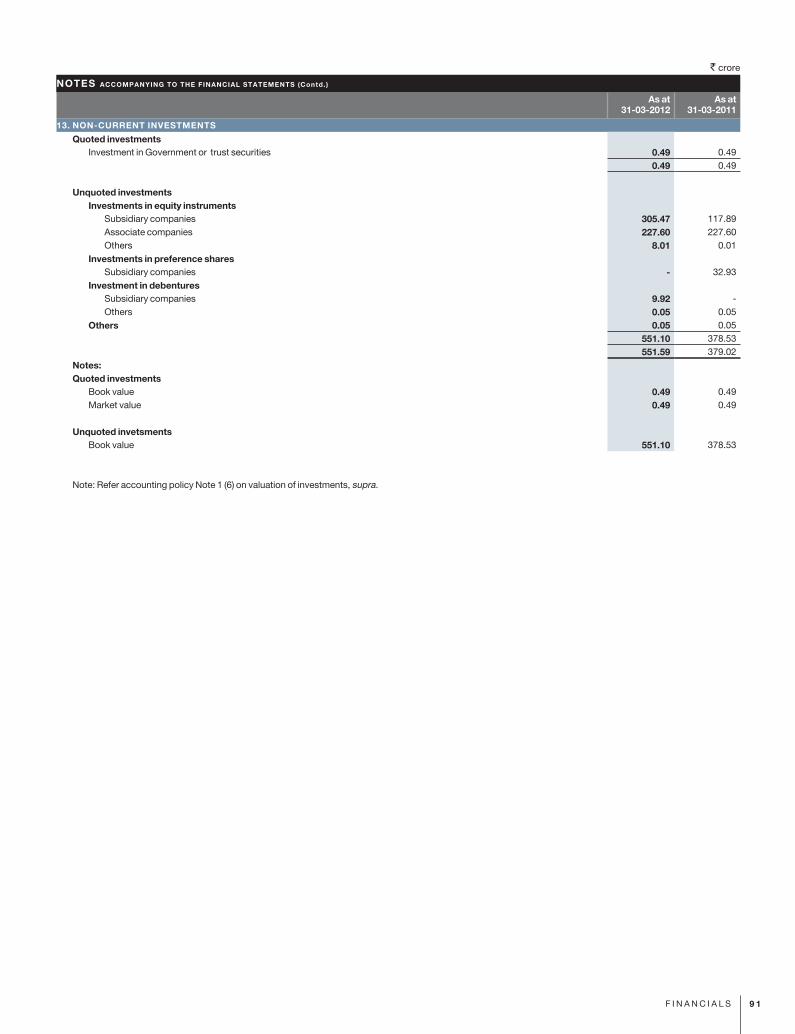
` crore
9 1F i n a n c i a l s
Gro
ss b
lock
(Co
st /
Val
uati
on)
D
epre
ciat
ion
/ Am
ort
isat
ion
Net
blo
ck
As
at
01-
04-2
011
Tra
nsfe
rred
o
n am
alg
amat
ion
Ad
dit
ions
D
educ
tio
ns
As
at
31-
03-2
012
Up
to
31-0
3-20
11
Tra
nsfe
rred
o
n am
alg
amat
ion
Fo
r the
yea
r D
educ
tio
ns
Up
to
31-
03-2
012
As
at
31-0
3-20
12
As
at
31-0
3-20
11
12
.FIX
ED
AS
SE
TS
(i) T
ang
ible
ass
ets
O
wne
d a
sset
s:
Fr
eeho
ld la
nd15
.90
-
-
0.06
15.8
4-
-
-
-
-
15.8
415
.90
le
aseh
old
land
17.3
1 -
-
-
17
.31
2.74
-
0.14
-2.
8814
.43
14.5
7
B
uild
ings
255.
21 -
11
.98
4.20
262.
9979
.00
-
6.81
0.68
85.1
317
7.86
176.
21
P
lant
and
eq
uip
men
ts73
1.77
-
79.2
18.
1980
2.79
489.
23 -
37
.44
6.82
519.
8528
2.94
242.
54
R
ailw
ay s
idin
gs0.
02 -
-
-
0.
020.
01 -
-
-
0.01
0.01
0.01
Fu
rnitu
re a
nd fi
xtur
es67
.50
-
8.66
3.49
72.6
751
.45
-
3.85
3.19
52.1
120
.56
16.0
5
O
ffice
eq
uip
men
ts
51.7
50.
013.
141.
2453
.66
42.0
80.
003.
101.
1644
.02
9.64
9.67
a
ircra
fts
370.
80 -
-
37
0.80
-
34.5
2 -
24
.20
58.7
2 -
-
33
6.28
V
ehic
les
13.2
1 -
2.
801.
1014
.91
8.08
-
1.73
0.80
9.01
5.90
5.13
O
wne
d a
sset
s le
ased
out
:
B
uild
ings
4.86
-
-
-
4.86
1.07
-
0.08
-
1.15
3.71
3.79
S
ub-t
ota
l (i)
1528
.33
0.01
105.
7938
9.08
1245
.05
708.
180.
0077
.35
71.3
771
4.16
530.
8982
0.15
(ii)
Inta
ngib
le a
sset
s
G
ood
will
4.92
-
4.39
-
9.31
0.33
-
1.22
-
1.55
7.76
4.59
c
omp
uter
sof
twar
e17
.45
-
4.05
-
21.5
011
.62
-
2.32
-
13.9
47.
565.
83
Te
chni
cal k
now
-how
19.2
7 -
-
-
19
.27
5.14
-
3.26
-
8.40
10.8
714
.13
c
omm
erci
al ri
ghts
34.2
1 -
-
-
34
.21
3.61
-
5.42
-
9.03
25.1
830
.60
R
esea
rch
and
dev
elop
men
t -
-
15
.24
-
15.2
4 -
-
1.
34 -
1.
3413
.90
-
Sub
-to
tal (
ii)75
.85
-
23.6
8 -
99
.53
20.7
0 -
13
.56
-
34.2
665
.27
55.1
5
To
tal (
i+ii)
1604
.18
0.01
129.
4738
9.08
1344
.58
728.
880.
0090
.91
71.3
774
8.42
Pre
viou
s ye
ar11
71.4
028
.21
413.
899.
3216
04.1
863
7.59
18.1
881
.04
7.93
728.
88
(iii)
Cap
ital w
ork-
in-p
rogr
ess
- Tan
gibl
e as
sets
B
uild
ings
31.9
212
.33
P
lant
and
eq
uip
men
ts26
.37
29.3
3
Sub
-to
tal
(iii)
58.2
941
.66
(iv) I
ntan
gib
le a
sset
s un
der
dev
elo
pm
ent
D
evel
opm
ent e
xpen
ses
21.0
35.
57
Sub
-to
tal
(iv)
21.0
35.
57
No
tes:
(a)
cos
t / V
alua
tion
of B
uild
ings
incl
udes
ow
ners
hip
acc
omm
odat
ion:
(i)
in v
ario
us c
o-op
erat
ive
soci
etie
s an
d a
par
tmen
ts:
2.9
6 cr
ore;
(Pre
viou
s ye
ar
4.7
4 cr
ore)
, inc
lud
ing
5 sh
ares
of
100
eac
h an
d 6
72 s
hare
s of
5
0 ea
ch.
(ii
) in
co-
oper
ativ
e so
ciet
y 3
.32
cror
e; (P
revi
ous
year
3
.32
cror
e) p
end
ing
for a
llotm
ent o
f sha
res.
(b) c
ost o
f lan
d in
clud
e 1
4.52
cro
re; (
Pre
viou
s ye
ar
14.
52 c
rore
) and
Bui
ldin
gs in
clud
e 8
.41
cror
e; (P
revi
ous
year
9
.85
cror
e) a
dd
ed o
n re
valu
atio
n on
30t
h Ju
ne, 1
985.
(c)
ad
diti
ons
dur
ing
the
year
incl
ude
28.
92 c
rore
; (P
revi
ous
year
2
6.19
cro
re) r
elat
ing
to re
sear
ch a
nd d
evel
opm
ent.
(d) c
apita
l wor
k-in
-pro
gres
s an
d in
tang
ible
ass
ets
und
er d
evel
pom
ent i
nclu
de
31.
65 c
rore
; (P
revi
ous
year
1
7.74
cro
re) r
elat
ing
to re
sear
ch a
nd d
evel
opm
ent.
As at 31-03-2012
As at 31-03-2011
13. NON-CURRENT INVESTMENTS
Quoted investmentsinvestment in Government or trust securities 0.49 0.49
0.49 0.49
Unquoted investmentsInvestments in equity instruments subsidiary companies 305.47 117.89 associate companies 227.60 227.60 Others 8.01 0.01Investments in preference shares subsidiary companies - 32.93Investment in debentures subsidiary companies 9.92 - Others 0.05 0.05Others 0.05 0.05
551.10 378.53551.59 379.02
Notes:Quoted investments
Book value 0.49 0.49Market value 0.49 0.49
Unquoted invetsmentsBook value 551.10 378.53
note: Refer accounting policy note 1 (6) on valuation of investments, supra.
NOTES ACCOMPANYING TO THE FINANCIAL STATEMENTS (Contd. )
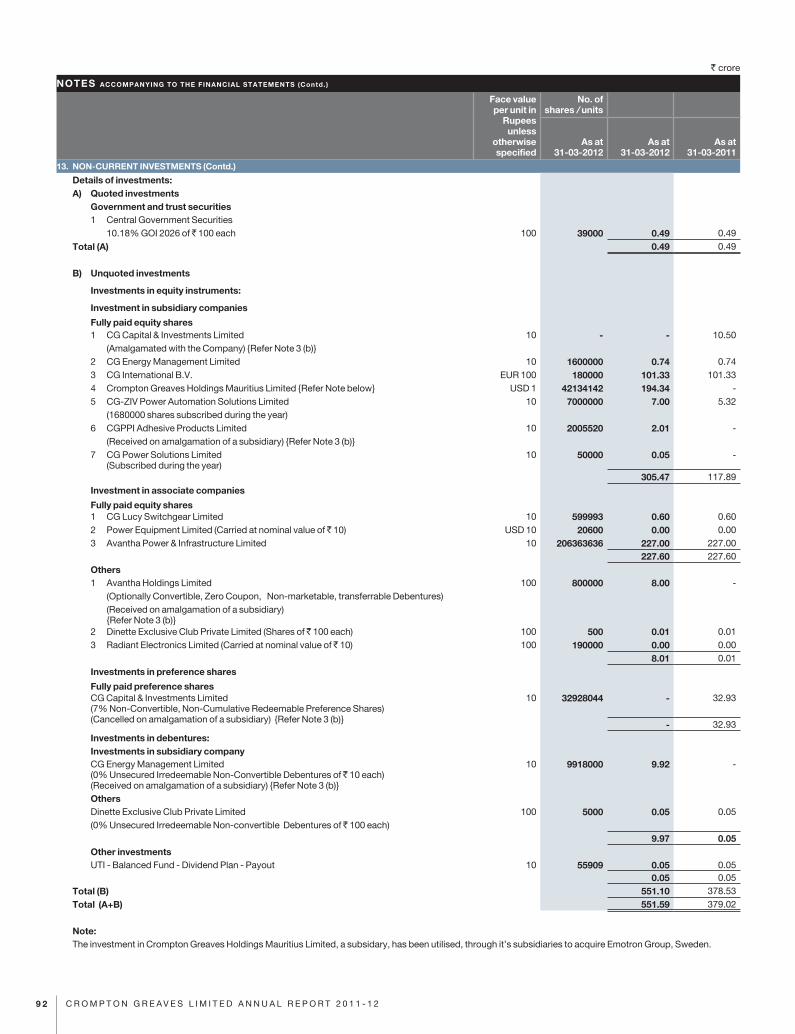
` crore
9 2 C R O M P T O N G R E A V E S L I M I T E D A N N U A L R E P O R T 2 0 1 1 - 1 2
Face value per unit in
Rupees unless
otherwise specified
No. of shares / units
As at 31-03-2012
As at 31-03-2012
As at 31-03-2011
13. NON-CURRENT INVESTMENTS (Contd.)
Details of investments:A) Quoted investments
Government and trust securities1 central Government securities 10.18% GOi 2026 of 100 each 100 39000 0.49 0.49
Total (A) 0.49 0.49
B) Unquoted investments
Investments in equity instruments:
Investment in subsidiary companies
Fully paid equity shares1 cG capital & investments limited 10 - - 10.50 (amalgamated with the company) {Refer note 3 (b)}2 cG Energy Management limited 10 1600000 0.74 0.743 cG international B.V. EUR 100 180000 101.33 101.334 crompton Greaves Holdings Mauritius limited {Refer note below} UsD 1 42134142 194.34 - 5 cG-ZiV Power automation solutions limited 10 7000000 7.00 5.32 (1680000 shares subscribed during the year)6 cGPPi adhesive Products limited 10 2005520 2.01 - (Received on amalgamation of a subsidiary) {Refer note 3 (b)}7 cG Power solutions limited
(subscribed during the year)10 50000 0.05 -
305.47 117.89Investment in associate companies
Fully paid equity shares1 cG lucy switchgear limited 10 599993 0.60 0.602 Power Equipment limited (carried at nominal value of 10) UsD 10 20600 0.00 0.003 avantha Power & infrastructure limited 10 206363636 227.00 227.00
227.60 227.60Others1 avantha Holdings limited 100 800000 8.00 - (Optionally convertible, Zero coupon, non-marketable, transferrable Debentures) (Received on amalgamation of a subsidiary)
{Refer note 3 (b)}2 Dinette Exclusive club Private limited (shares of 100 each) 100 500 0.01 0.013 Radiant Electronics limited (carried at nominal value of 10) 100 190000 0.00 0.00
8.01 0.01 Investments in preference shares
Fully paid preference sharescG capital & investments limited (7% non-convertible, non-cumulative Redeemable Preference shares) (cancelled on amalgamation of a subsidiary) {Refer note 3 (b)}
10 32928044 - 32.93
- 32.93Investments in debentures:Investments in subsidiary companycG Energy Management limited (0% Unsecured irredeemable non-convertible Debentures of 10 each) (Received on amalgamation of a subsidiary) {Refer note 3 (b)}
10 9918000 9.92 -
OthersDinette Exclusive club Private limited 100 5000 0.05 0.05(0% Unsecured irredeemable non-convertible Debentures of 100 each)
9.97 0.05Other investmentsUTi - Balanced Fund - Dividend Plan - Payout 10 55909 0.05 0.05
0.05 0.05Total (B) 551.10 378.53Total (A+B) 551.59 379.02
Note:The investment in crompton Greaves Holdings Mauritius limited, a subsidary, has been utilised, through it’s subsidiaries to acquire Emotron Group, sweden.
NOTES ACCOMPANYING TO THE FINANCIAL STATEMENTS (Contd. )
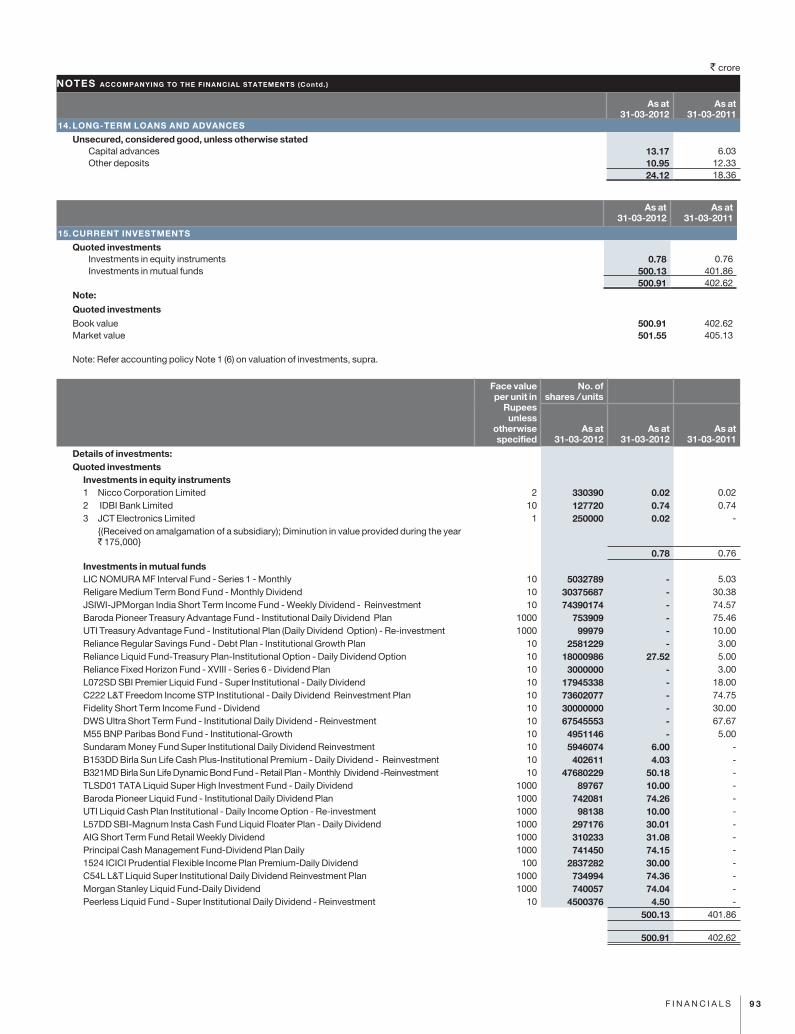
` crore
9 3F i n a n c i a l s
As at 31-03-2012
As at 31-03-2011
14. LONG-TERM LOANS AND ADVANCES
Unsecured, considered good, unless otherwise stated capital advances 13.17 6.03 Other deposits 10.95 12.33
24.12 18.36
As at 31-03-2012
As at 31-03-2011
15. CURRENT INVESTMENTS
Quoted investments investments in equity instruments 0.78 0.76 investments in mutual funds 500.13 401.86
500.91 402.62Note:
Quoted investments
Book value 500.91 402.62Market value 501.55 405.13
note: Refer accounting policy note 1 (6) on valuation of investments, supra.
Face value per unit in
Rupees unless
otherwise specified
No. of shares / units
As at 31-03-2012
As at 31-03-2012
As at 31-03-2011
Details of investments:Quoted investments
Investments in equity instruments1 nicco corporation limited 2 330390 0.02 0.022 iDBi Bank limited 10 127720 0.74 0.743 JcT Electronics limited 1 250000 0.02 - {(Received on amalgamation of a subsidiary); Diminution in value provided during the year
` 175,000}0.78 0.76
Investments in mutual fundslic nOMURa MF interval Fund - series 1 - Monthly 10 5032789 - 5.03Religare Medium Term Bond Fund - Monthly Dividend 10 30375687 - 30.38JsiWi-JPMorgan india short Term income Fund - Weekly Dividend - Reinvestment 10 74390174 - 74.57Baroda Pioneer Treasury advantage Fund - institutional Daily Dividend Plan 1000 753909 - 75.46UTi Treasury advantage Fund - institutional Plan (Daily Dividend Option) - Re-investment 1000 99979 - 10.00Reliance Regular savings Fund - Debt Plan - institutional Growth Plan 10 2581229 - 3.00Reliance liquid Fund-Treasury Plan-institutional Option - Daily Dividend Option 10 18000986 27.52 5.00Reliance Fixed Horizon Fund - XViii - series 6 - Dividend Plan 10 3000000 - 3.00l072sD sBi Premier liquid Fund - super institutional - Daily Dividend 10 17945338 - 18.00c222 l&T Freedom income sTP institutional - Daily Dividend Reinvestment Plan 10 73602077 - 74.75Fidelity short Term income Fund - Dividend 10 30000000 - 30.00DWs Ultra short Term Fund - institutional Daily Dividend - Reinvestment 10 67545553 - 67.67M55 BnP Paribas Bond Fund - institutional-Growth 10 4951146 - 5.00sundaram Money Fund super institutional Daily Dividend Reinvestment 10 5946074 6.00 - B153DD Birla sun life cash Plus-institutional Premium - Daily Dividend - Reinvestment 10 402611 4.03 - B321MD Birla sun life Dynamic Bond Fund - Retail Plan - Monthly Dividend -Reinvestment 10 47680229 50.18 - TlsD01 TaTa liquid super High investment Fund - Daily Dividend 1000 89767 10.00 - Baroda Pioneer liquid Fund - institutional Daily Dividend Plan 1000 742081 74.26 - UTi liquid cash Plan institutional - Daily income Option - Re-investment 1000 98138 10.00 - l57DD sBi-Magnum insta cash Fund liquid Floater Plan - Daily Dividend 1000 297176 30.01 - aiG short Term Fund Retail Weekly Dividend 1000 310233 31.08 - Principal cash Management Fund-Dividend Plan Daily 1000 741450 74.15 - 1524 icici Prudential Flexible income Plan Premium-Daily Dividend 100 2837282 30.00 - c54l l&T liquid super institutional Daily Dividend Reinvestment Plan 1000 734994 74.36 - Morgan stanley liquid Fund-Daily Dividend 1000 740057 74.04 - Peerless liquid Fund - super institutional Daily Dividend - Reinvestment 10 4500376 4.50 -
500.13 401.86
500.91 402.62
NOTES ACCOMPANYING TO THE FINANCIAL STATEMENTS (Contd. )
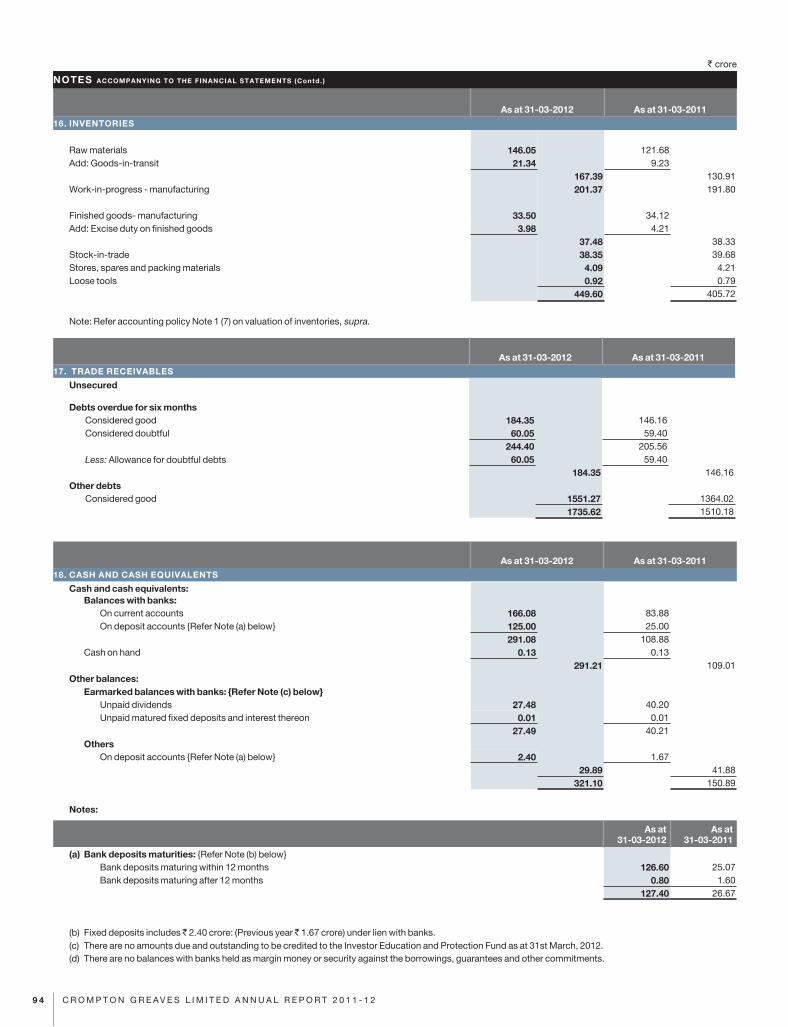
` crore
9 4 C R O M P T O N G R E A V E S L I M I T E D A N N U A L R E P O R T 2 0 1 1 - 1 2
As at 31-03-2012 As at 31-03-201116. INVENTORIES
Raw materials 146.05 121.68add: Goods-in-transit 21.34 9.23
167.39 130.91Work-in-progress - manufacturing 201.37 191.80
Finished goods- manufacturing 33.50 34.12add: Excise duty on finished goods 3.98 4.21
37.48 38.33stock-in-trade 38.35 39.68stores, spares and packing materials 4.09 4.21loose tools 0.92 0.79
449.60 405.72
note: Refer accounting policy note 1 (7) on valuation of inventories, supra.
As at 31-03-2012 As at 31-03-201117. TRADE RECEIVABLES
Unsecured
Debts overdue for six monthsconsidered good 184.35 146.16considered doubtful 60.05 59.40
244.40 205.56Less: allowance for doubtful debts 60.05 59.40
184.35 146.16Other debts
considered good 1551.27 1364.021735.62 1510.18
As at 31-03-2012 As at 31-03-201118. CASH AND CASH EQUIVALENTS
Cash and cash equivalents:Balances with banks:
On current accounts 166.08 83.88On deposit accounts {Refer note (a) below} 125.00 25.00
291.08 108.88cash on hand 0.13 0.13
291.21 109.01Other balances:
Earmarked balances with banks: {Refer Note (c) below}Unpaid dividends 27.48 40.20Unpaid matured fixed deposits and interest thereon 0.01 0.01
27.49 40.21Others
On deposit accounts {Refer note (a) below} 2.40 1.6729.89 41.88
321.10 150.89
Notes:
As at 31-03-2012
As at 31-03-2011
(a) Bank deposits maturities: {Refer note (b) below}Bank deposits maturing within 12 months 126.60 25.07Bank deposits maturing after 12 months 0.80 1.60
127.40 26.67
(b) Fixed deposits includes 2.40 crore: (Previous year 1.67 crore) under lien with banks.(c) There are no amounts due and outstanding to be credited to the investor Education and Protection Fund as at 31st March, 2012.(d) There are no balances with banks held as margin money or security against the borrowings, guarantees and other commitments.
NOTES ACCOMPANYING TO THE FINANCIAL STATEMENTS (Contd. )
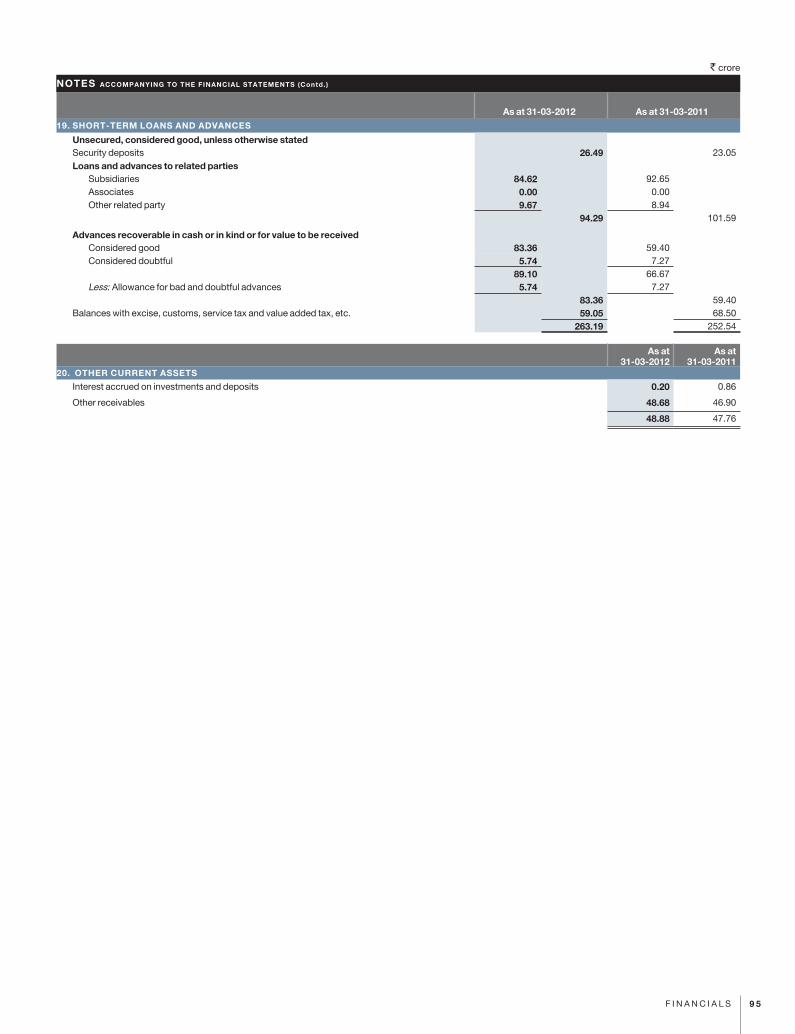
` crore
9 5F i n a n c i a l s
As at 31-03-2012 As at 31-03-201119. SHORT-TERM LOANS AND ADVANCES
Unsecured, considered good, unless otherwise statedsecurity deposits 26.49 23.05Loans and advances to related parties
subsidiaries 84.62 92.65associates 0.00 0.00 Other related party 9.67 8.94
94.29 101.59
Advances recoverable in cash or in kind or for value to be received considered good 83.36 59.40considered doubtful 5.74 7.27
89.10 66.67less: allowance for bad and doubtful advances 5.74 7.27
83.36 59.40Balances with excise, customs, service tax and value added tax, etc. 59.05 68.50
263.19 252.54
As at 31-03-2012
As at 31-03-2011
20. OTHER CURRENT ASSETS
interest accrued on investments and deposits 0.20 0.86
Other receivables 48.68 46.90
48.88 47.76
NOTES ACCOMPANYING TO THE FINANCIAL STATEMENTS (Contd. )
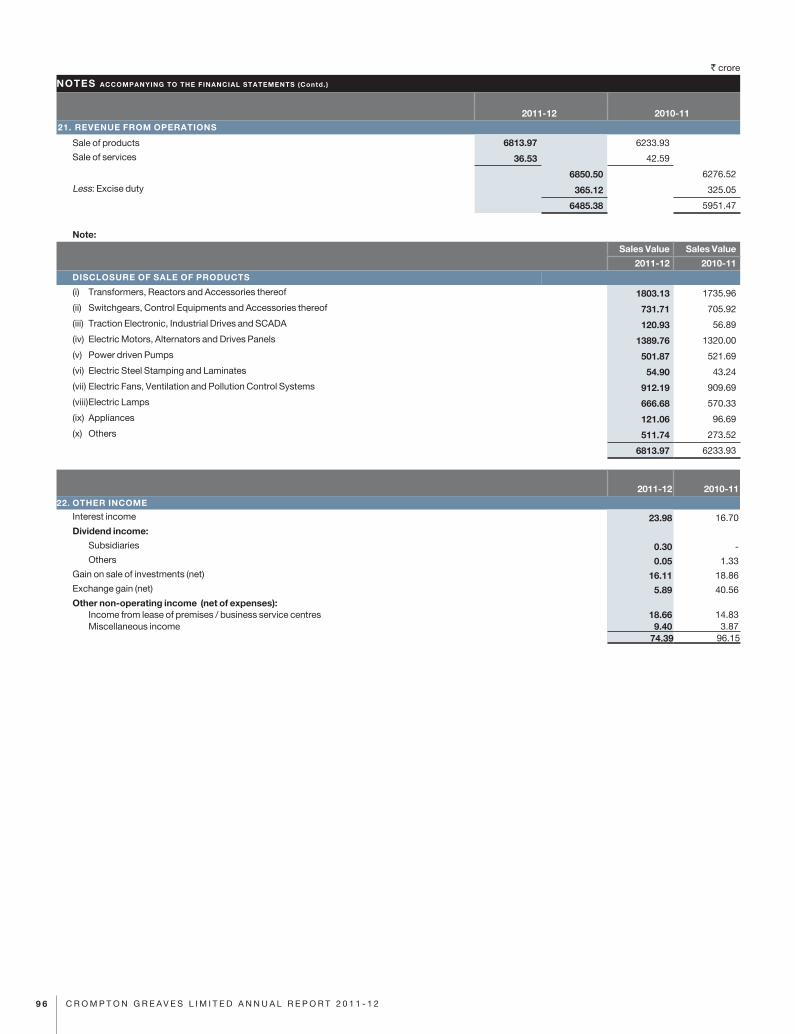
` crore
9 6 C R O M P T O N G R E A V E S L I M I T E D A N N U A L R E P O R T 2 0 1 1 - 1 2
2011-12 2010-1121. REVENUE FROM OPERATIONS
sale of products 6813.97 6233.93
sale of services 36.53 42.59
6850.50 6276.52
less: Excise duty 365.12 325.05
6485.38 5951.47
Note:
Sales Value Sales Value
2011-12 2010-11DISCLOSURE OF SALE OF PRODUCTS
(i) Transformers, Reactors and accessories thereof 1803.13 1735.96
(ii) switchgears, control Equipments and accessories thereof 731.71 705.92
(iii) Traction Electronic, industrial Drives and scaDa 120.93 56.89
(iv) Electric Motors, alternators and Drives Panels 1389.76 1320.00
(v) Power driven Pumps 501.87 521.69
(vi) Electric steel stamping and laminates 54.90 43.24
(vii) Electric Fans, Ventilation and Pollution control systems 912.19 909.69
(viii)Electric lamps 666.68 570.33
(ix) appliances 121.06 96.69
(x) Others 511.74 273.52
6813.97 6233.93
2011-12 2010-1122. OTHER INCOME
interest income 23.98 16.70Dividend income:
subsidiaries 0.30 - Others 0.05 1.33
Gain on sale of investments (net) 16.11 18.86Exchange gain (net) 5.89 40.56Other non-operating income (net of expenses):
income from lease of premises / business service centres 18.66 14.83Miscellaneous income 9.40 3.87
74.39 96.15
NOTES ACCOMPANYING TO THE FINANCIAL STATEMENTS (Contd. )
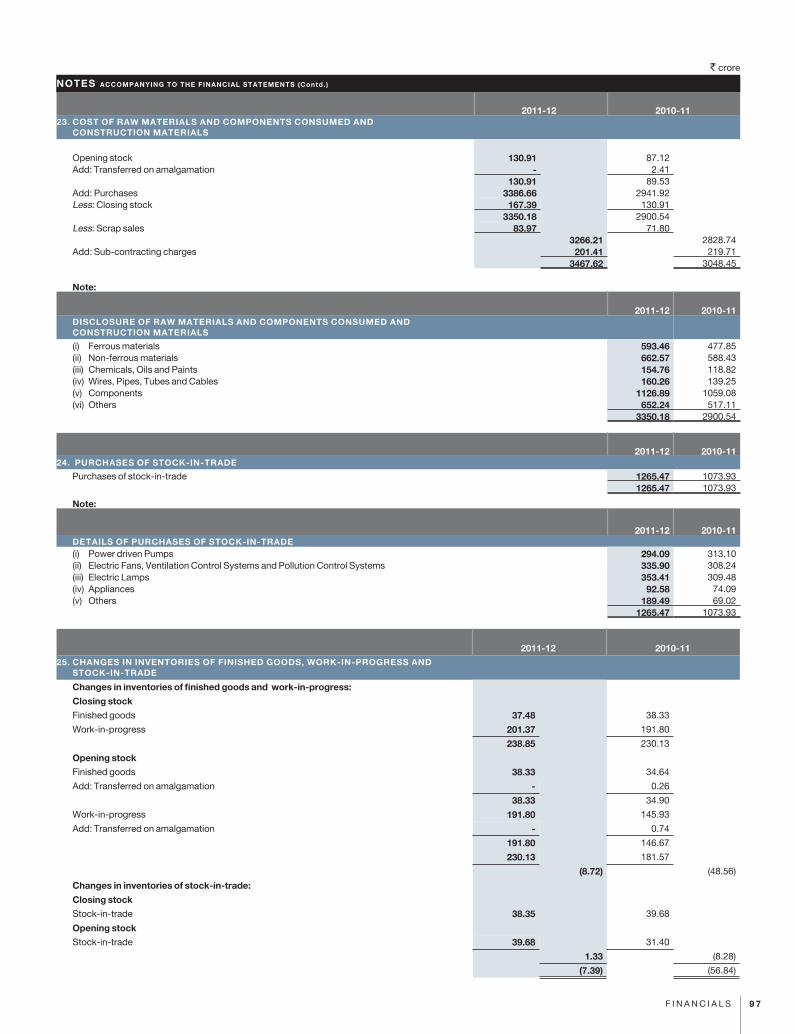
` crore
9 7F i n a n c i a l s
2011-12 2010-1123. COST OF RAW MATERIALS AND COMPONENTS CONSUMED AND
CONSTRUCTION MATERIALS
Opening stock 130.91 87.12add: Transferred on amalgamation - 2.41
130.91 89.53add: Purchases 3386.66 2941.92less: closing stock 167.39 130.91
3350.18 2900.54less: scrap sales 83.97 71.80
3266.21 2828.74add: sub-contracting charges 201.41 219.71
3467.62 3048.45
Note:
2011-12 2010-11DISCLOSURE OF RAW MATERIALS AND COMPONENTS CONSUMED AND CONSTRUCTION MATERIALS
(i) Ferrous materials 593.46 477.85(ii) non-ferrous materials 662.57 588.43(iii) chemicals, Oils and Paints 154.76 118.82(iv) Wires, Pipes, Tubes and cables 160.26 139.25(v) components 1126.89 1059.08(vi) Others 652.24 517.11
3350.18 2900.54
2011-12 2010-1124. PURCHASES OF STOCK-IN-TRADE
Purchases of stock-in-trade 1265.47 1073.931265.47 1073.93
Note:
2011-12 2010-11DETAILS OF PURCHASES OF STOCK-IN-TRADE(i) Power driven Pumps 294.09 313.10(ii) Electric Fans, Ventilation control systems and Pollution control systems 335.90 308.24(iii) Electric lamps 353.41 309.48(iv) appliances 92.58 74.09(v) Others 189.49 69.02
1265.47 1073.93
2011-12 2010-1125. CHANGES IN INVENTORIES OF FINISHED GOODS, WORK-IN-PROGRESS AND
STOCK-IN-TRADE
Changes in inventories of finished goods and work-in-progress:
Closing stock
Finished goods 37.48 38.33
Work-in-progress 201.37 191.80
238.85 230.13
Opening stock
Finished goods 38.33 34.64
add: Transferred on amalgamation - 0.26
38.33 34.90
Work-in-progress 191.80 145.93
add: Transferred on amalgamation - 0.74
191.80 146.67
230.13 181.57
(8.72) (48.56)
Changes in inventories of stock-in-trade:
Closing stock
stock-in-trade 38.35 39.68
Opening stock
stock-in-trade 39.68 31.40
1.33 (8.28)
(7.39) (56.84)
NOTES ACCOMPANYING TO THE FINANCIAL STATEMENTS (Contd. )
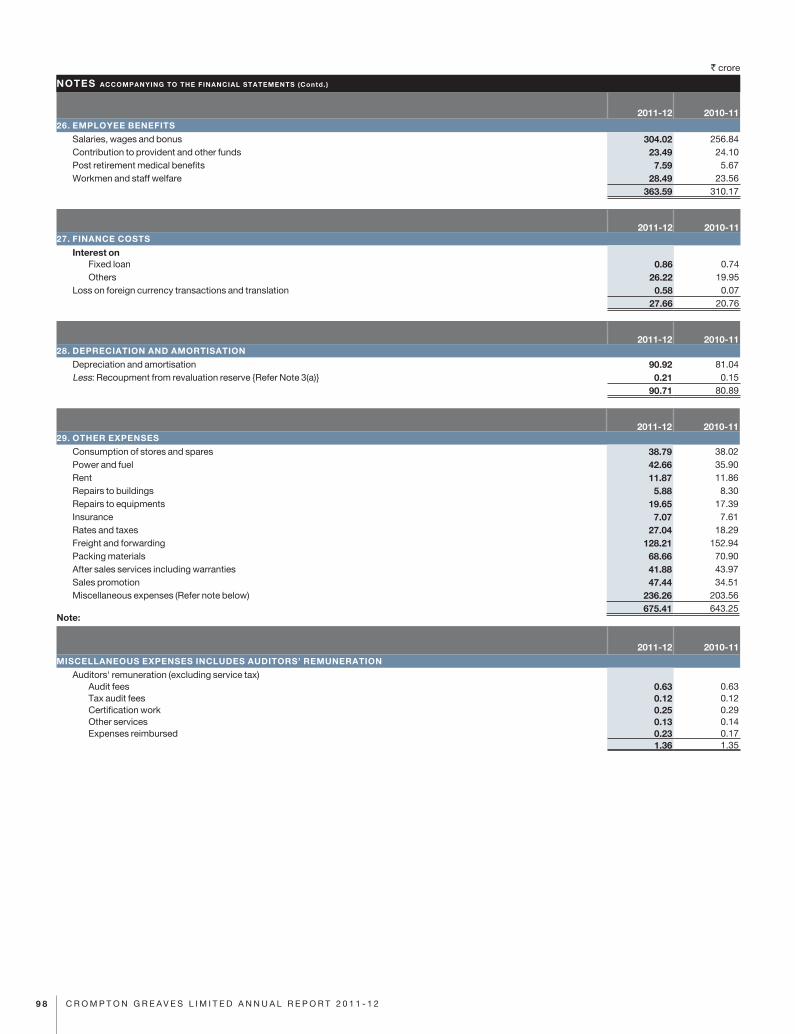
` crore
9 8 C R O M P T O N G R E A V E S L I M I T E D A N N U A L R E P O R T 2 0 1 1 - 1 2
2011-12 2010-1126. EMPLOYEE BENEFITS
salaries, wages and bonus 304.02 256.84contribution to provident and other funds 23.49 24.10Post retirement medical benefits 7.59 5.67Workmen and staff welfare 28.49 23.56
363.59 310.17
2011-12 2010-1127. FINANCE COSTS
Interest on Fixed loan 0.86 0.74 Others 26.22 19.95loss on foreign currency transactions and translation 0.58 0.07
27.66 20.76
2011-12 2010-1128. DEPRECIATION AND AMORTISATION
Depreciation and amortisation 90.92 81.04less: Recoupment from revaluation reserve {Refer note 3(a)} 0.21 0.15
90.71 80.89
2011-12 2010-1129. OTHER EXPENSES
consumption of stores and spares 38.79 38.02Power and fuel 42.66 35.90Rent 11.87 11.86Repairs to buildings 5.88 8.30Repairs to equipments 19.65 17.39insurance 7.07 7.61Rates and taxes 27.04 18.29Freight and forwarding 128.21 152.94Packing materials 68.66 70.90after sales services including warranties 41.88 43.97sales promotion 47.44 34.51Miscellaneous expenses (Refer note below) 236.26 203.56
675.41 643.25Note:
2011-12 2010-11MISCELLANEOUS EXPENSES INCLUDES AUDITORS’ REMUNERATION
auditors' remuneration (excluding service tax) audit fees 0.63 0.63 Tax audit fees 0.12 0.12 certification work 0.25 0.29 Other services 0.13 0.14 Expenses reimbursed 0.23 0.17
1.36 1.35
NOTES ACCOMPANYING TO THE FINANCIAL STATEMENTS (Contd. )
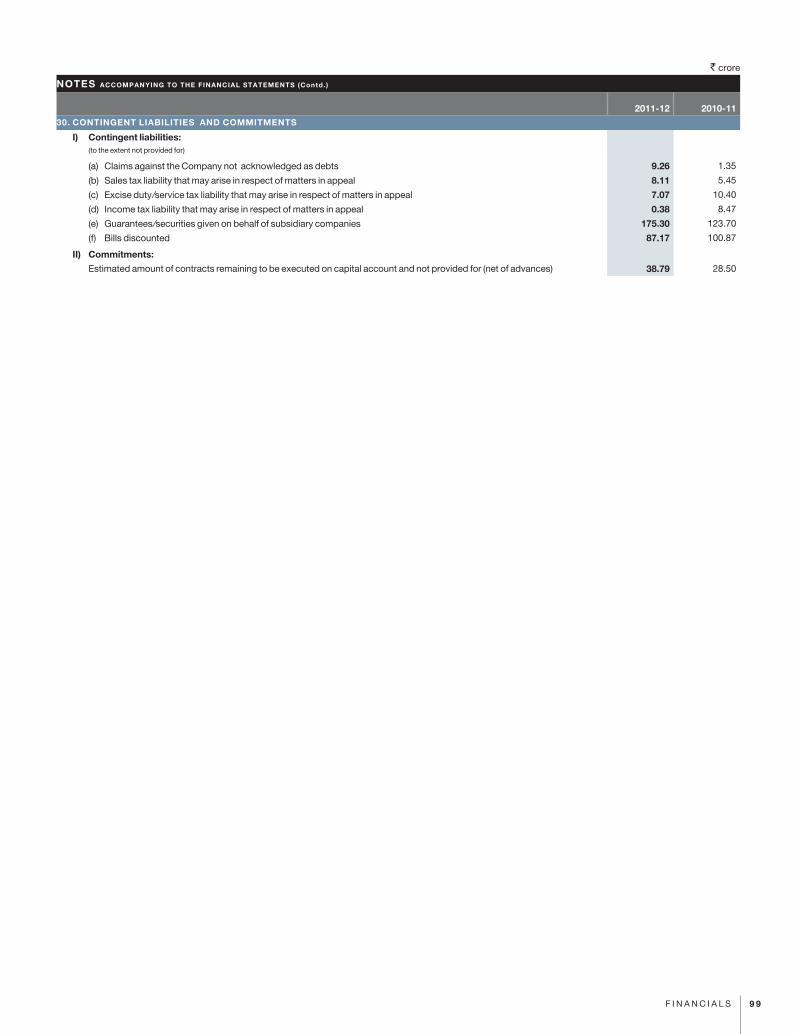
` crore
9 9F i n a n c i a l s
2011-12 2010-1130. CONTINGENT LIABILITIES AND COMMITMENTS
I) Contingent liabilities: (to the extent not provided for)
(a) claims against the company not acknowledged as debts 9.26 1.35
(b) sales tax liability that may arise in respect of matters in appeal 8.11 5.45
(c) Excise duty/service tax liability that may arise in respect of matters in appeal 7.07 10.40
(d) income tax liability that may arise in respect of matters in appeal 0.38 8.47
(e) Guarantees/securities given on behalf of subsidiary companies 175.30 123.70
(f) Bills discounted 87.17 100.87
II) Commitments:
Estimated amount of contracts remaining to be executed on capital account and not provided for (net of advances) 38.79 28.50
NOTES ACCOMPANYING TO THE FINANCIAL STATEMENTS (Contd. )
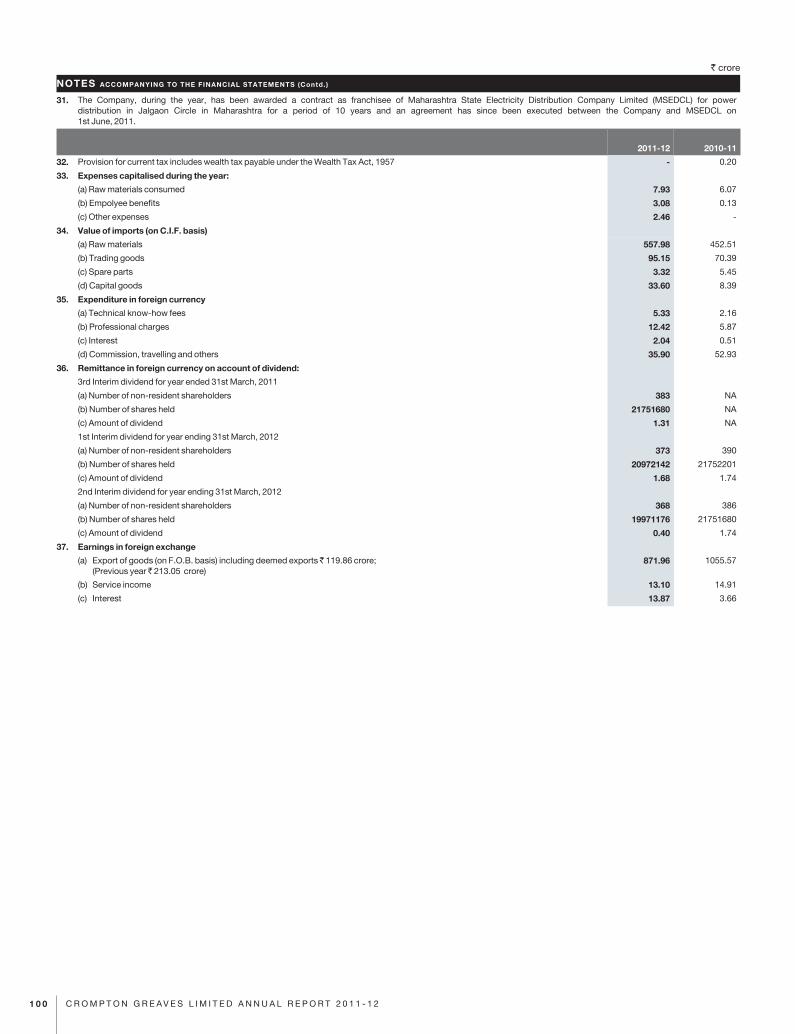
` crore
1 0 0 C R O M P T O N G R E A V E S L I M I T E D A N N U A L R E P O R T 2 0 1 1 - 1 2
31. The Company, during the year, has been awarded a contract as franchisee of Maharashtra State Electricity Distribution Company Limited (MSEDCL) for power distribution in Jalgaon Circle in Maharashtra for a period of 10 years and an agreement has since been executed between the Company and MSEDCL on 1st June, 2011.
2011-12 2010-11
32. Provision for current tax includes wealth tax payable under the Wealth Tax Act, 1957 - 0.20
33. Expenses capitalised during the year:
(a) Raw materials consumed 7.93 6.07
(b) Empolyee benefits 3.08 0.13
(c) Other expenses 2.46 -
34. Value of imports (on C.I.F. basis)
(a) Raw materials 557.98 452.51
(b) Trading goods 95.15 70.39
(c) Spare parts 3.32 5.45
(d) Capital goods 33.60 8.39
35. Expenditure in foreign currency
(a) Technical know-how fees 5.33 2.16
(b) Professional charges 12.42 5.87
(c) Interest 2.04 0.51
(d) Commission, travelling and others 35.90 52.93
36. Remittance in foreign currency on account of dividend:
3rd Interim dividend for year ended 31st March, 2011
(a) Number of non-resident shareholders 383 NA
(b) Number of shares held 21751680 NA
(c) Amount of dividend 1.31 NA
1st Interim dividend for year ending 31st March, 2012
(a) Number of non-resident shareholders 373 390
(b) Number of shares held 20972142 21752201
(c) Amount of dividend 1.68 1.74
2nd Interim dividend for year ending 31st March, 2012
(a) Number of non-resident shareholders 368 386
(b) Number of shares held 19971176 21751680
(c) Amount of dividend 0.40 1.74
37. Earnings in foreign exchange
(a) Export of goods (on F.O.B. basis) including deemed exports 119.86 crore; (Previous year 213.05 crore)
871.96 1055.57
(b) Service income 13.10 14.91
(c) Interest 13.87 3.66
NOTES ACCOMPANYING TO THE FINANCIAL STATEMENTS (Contd. )
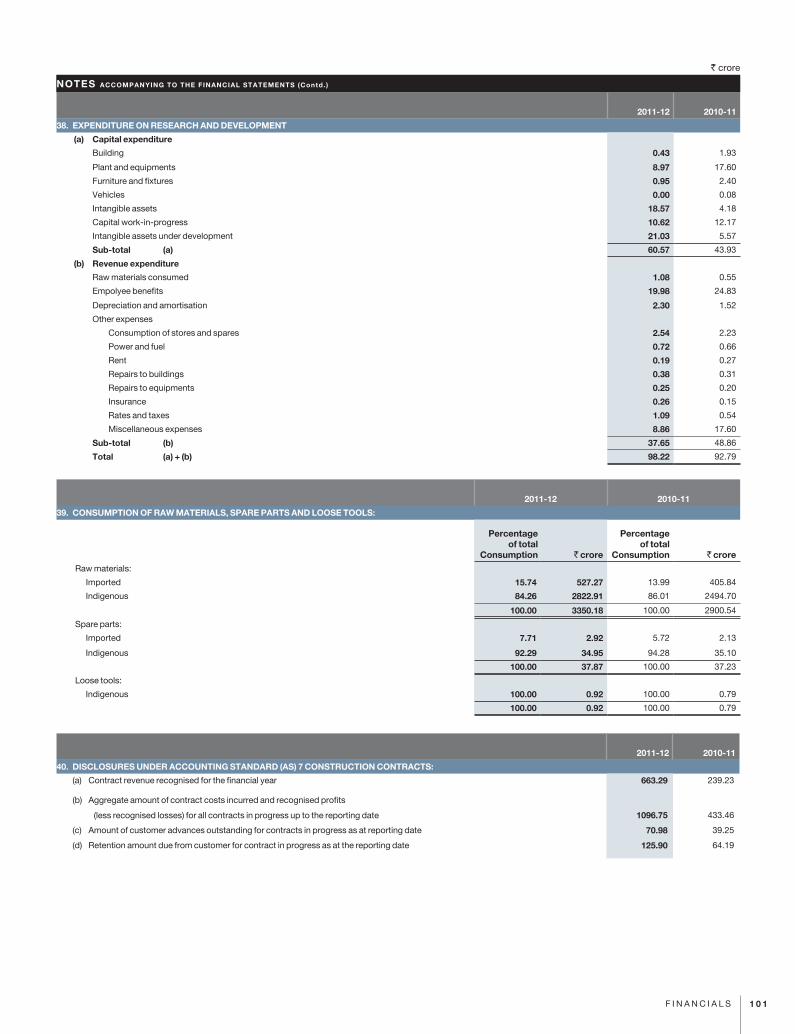
` crore
1 0 1F I N A N C I A L S
2011-12 2010-11
38. EXPENDITURE ON RESEARCH AND DEVELOPMENT
(a) Capital expenditure
Building 0.43 1.93
Plant and equipments 8.97 17.60
Furniture and fixtures 0.95 2.40
Vehicles 0.00 0.08
Intangible assets 18.57 4.18
Capital work-in-progress 10.62 12.17
Intangible assets under development 21.03 5.57
Sub-total (a) 60.57 43.93
(b) Revenue expenditure
Raw materials consumed 1.08 0.55
Empolyee benefits 19.98 24.83
Depreciation and amortisation 2.30 1.52
Other expenses
Consumption of stores and spares 2.54 2.23
Power and fuel 0.72 0.66
Rent 0.19 0.27
Repairs to buildings 0.38 0.31
Repairs to equipments 0.25 0.20
Insurance 0.26 0.15
Rates and taxes 1.09 0.54
Miscellaneous expenses 8.86 17.60
Sub-total (b) 37.65 48.86
Total (a) + (b) 98.22 92.79
2011-12 2010-11
39. CONSUMPTION OF RAW MATERIALS, SPARE PARTS AND LOOSE TOOLS:
Percentageof total
Consumption ` crore
Percentageof total
Consumption ` crore
Raw materials:
Imported 15.74 527.27 13.99 405.84
Indigenous 84.26 2822.91 86.01 2494.70
100.00 3350.18 100.00 2900.54
Spare parts:
Imported 7.71 2.92 5.72 2.13
Indigenous 92.29 34.95 94.28 35.10
100.00 37.87 100.00 37.23
Loose tools:
Indigenous 100.00 0.92 100.00 0.79
100.00 0.92 100.00 0.79
2011-12 2010-11
40. DISCLOSURES UNDER ACCOUNTING STANDARD (AS) 7 CONSTRUCTION CONTRACTS:
(a) Contract revenue recognised for the financial year 663.29 239.23
(b) Aggregate amount of contract costs incurred and recognised profits
(less recognised losses) for all contracts in progress up to the reporting date 1096.75 433.46
(c) Amount of customer advances outstanding for contracts in progress as at reporting date 70.98 39.25
(d) Retention amount due from customer for contract in progress as at the reporting date 125.90 64.19
NOTES ACCOMPANYING TO THE FINANCIAL STATEMENTS (Contd. )
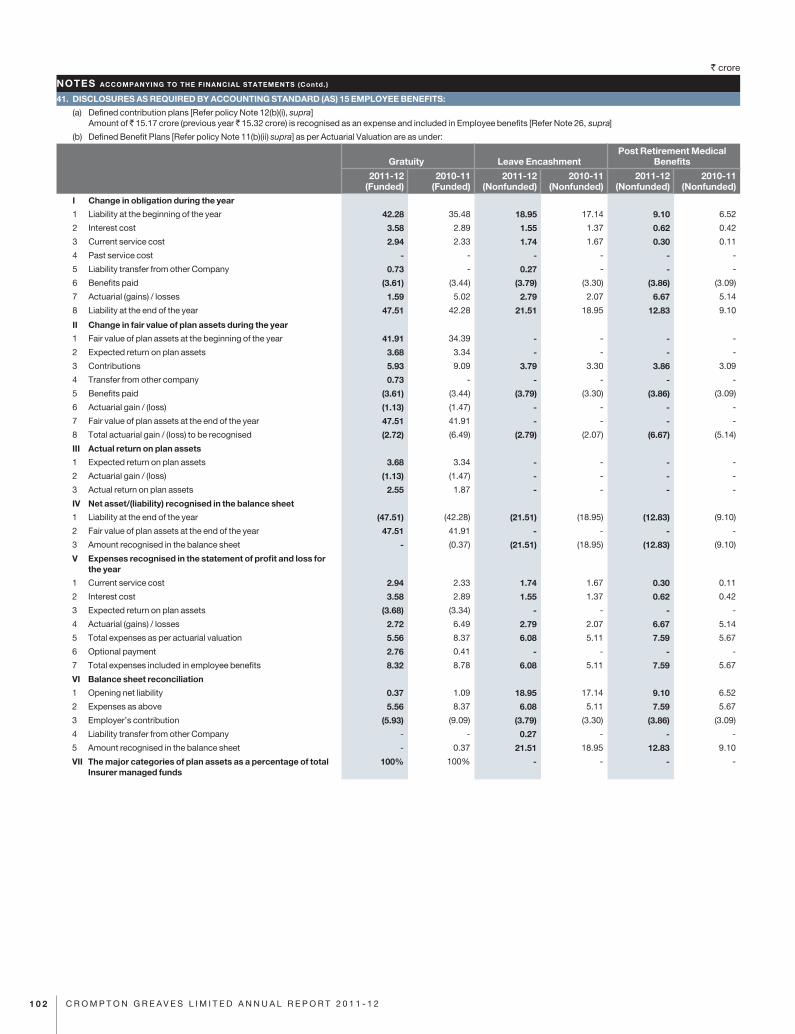
` crore
1 0 2 C R O M P T O N G R E A V E S L I M I T E D A N N U A L R E P O R T 2 0 1 1 - 1 2
41. DISCLOSURES AS REQUIRED BY ACCOUNTING STANDARD (AS) 15 EMPLOYEE BENEFITS:
(a) Defined contribution plans [Refer policy Note 12(b)(i), supra] Amount of 15.17 crore (previous year 15.32 crore) is recognised as an expense and included in Employee benefits [Refer Note 26, supra]
(b) Defined Benefit Plans [Refer policy Note 11(b)(ii) supra] as per Actuarial Valuation are as under:
Gratuity Leave EncashmentPost Retirement Medical
Benefits
2011-12(Funded)
2010-11(Funded)
2011-12(Nonfunded)
2010-11(Nonfunded)
2011-12(Nonfunded)
2010-11(Nonfunded)
I Change in obligation during the year
1 Liability at the beginning of the year 42.28 35.48 18.95 17.14 9.10 6.52
2 Interest cost 3.58 2.89 1.55 1.37 0.62 0.42
3 Current service cost 2.94 2.33 1.74 1.67 0.30 0.11
4 Past service cost - - - - - -
5 Liability transfer from other Company 0.73 - 0.27 - - -
6 Benefits paid (3.61) (3.44) (3.79) (3.30) (3.86) (3.09)
7 Actuarial (gains) / losses 1.59 5.02 2.79 2.07 6.67 5.14
8 Liability at the end of the year 47.51 42.28 21.51 18.95 12.83 9.10
II Change in fair value of plan assets during the year
1 Fair value of plan assets at the beginning of the year 41.91 34.39 - - - -
2 Expected return on plan assets 3.68 3.34 - - - -
3 Contributions 5.93 9.09 3.79 3.30 3.86 3.09
4 Transfer from other company 0.73 - - - - -
5 Benefits paid (3.61) (3.44) (3.79) (3.30) (3.86) (3.09)
6 Actuarial gain / (loss) (1.13) (1.47) - - - -
7 Fair value of plan assets at the end of the year 47.51 41.91 - - - -
8 Total actuarial gain / (loss) to be recognised (2.72) (6.49) (2.79) (2.07) (6.67) (5.14)
III Actual return on plan assets
1 Expected return on plan assets 3.68 3.34 - - - -
2 Actuarial gain / (loss) (1.13) (1.47) - - - -
3 Actual return on plan assets 2.55 1.87 - - - -
IV Net asset/(liability) recognised in the balance sheet
1 Liability at the end of the year (47.51) (42.28) (21.51) (18.95) (12.83) (9.10)
2 Fair value of plan assets at the end of the year 47.51 41.91 - - - -
3 Amount recognised in the balance sheet - (0.37) (21.51) (18.95) (12.83) (9.10)
V Expenses recognised in the statement of profit and loss for the year
1 Current service cost 2.94 2.33 1.74 1.67 0.30 0.11
2 Interest cost 3.58 2.89 1.55 1.37 0.62 0.42
3 Expected return on plan assets (3.68) (3.34) - - - -
4 Actuarial (gains) / losses 2.72 6.49 2.79 2.07 6.67 5.14
5 Total expenses as per actuarial valuation 5.56 8.37 6.08 5.11 7.59 5.67
6 Optional payment 2.76 0.41 - - - -
7 Total expenses included in employee benefits 8.32 8.78 6.08 5.11 7.59 5.67
VI Balance sheet reconciliation
1 Opening net liability 0.37 1.09 18.95 17.14 9.10 6.52
2 Expenses as above 5.56 8.37 6.08 5.11 7.59 5.67
3 Employer’s contribution (5.93) (9.09) (3.79) (3.30) (3.86) (3.09)
4 Liability transfer from other Company - - 0.27 - - -
5 Amount recognised in the balance sheet - 0.37 21.51 18.95 12.83 9.10
VII The major categories of plan assets as a percentage of totalInsurer managed funds
100% 100% - - - -
NOTES ACCOMPANYING TO THE FINANCIAL STATEMENTS (Contd. )
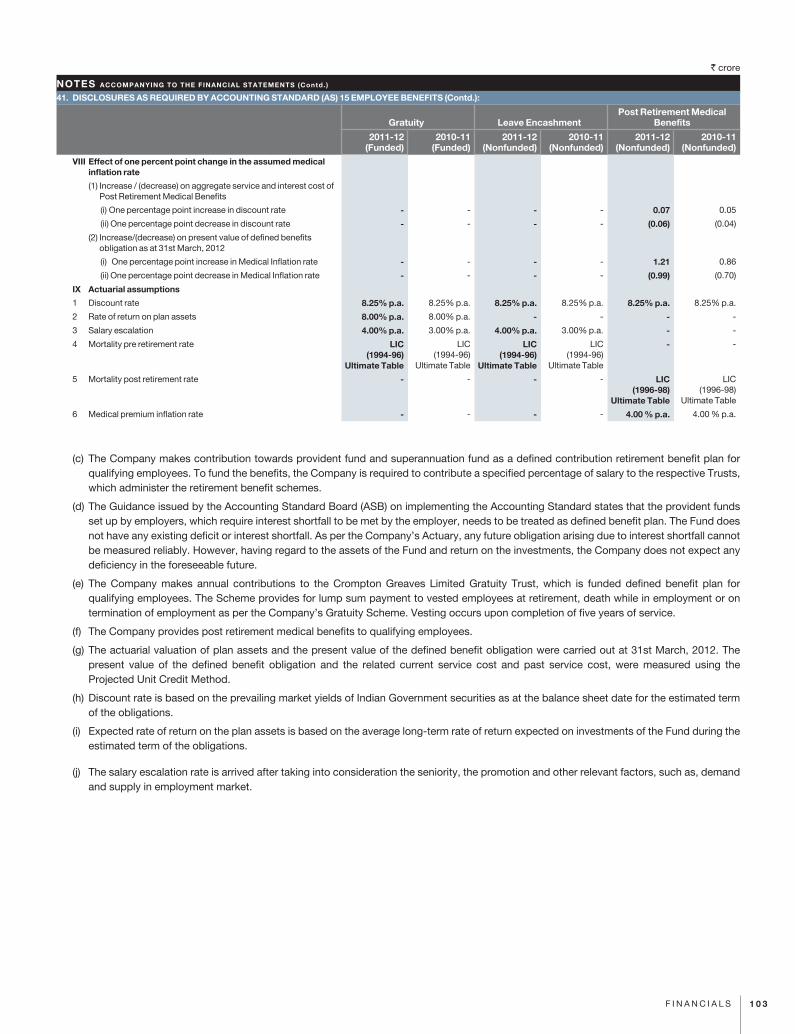
` crore
1 0 3F I N A N C I A L S
41. DISCLOSURES AS REQUIRED BY ACCOUNTING STANDARD (AS) 15 EMPLOYEE BENEFITS (Contd.):
Gratuity Leave EncashmentPost Retirement Medical
Benefits
2011-12(Funded)
2010-11(Funded)
2011-12(Nonfunded)
2010-11(Nonfunded)
2011-12(Nonfunded)
2010-11(Nonfunded)
VIII Effect of one percent point change in the assumed medical inflation rate
(1) Increase / (decrease) on aggregate service and interest cost of Post Retirement Medical Benefits
(i) One percentage point increase in discount rate - - - - 0.07 0.05
(ii) One percentage point decrease in discount rate - - - - (0.06) (0.04)
(2) Increase/(decrease) on present value of defined benefits obligation as at 31st March, 2012
(i) One percentage point increase in Medical Inflation rate - - - - 1.21 0.86
(ii) One percentage point decrease in Medical Inflation rate - - - - (0.99) (0.70)
IX Actuarial assumptions
1 Discount rate 8.25% p.a. 8.25% p.a. 8.25% p.a. 8.25% p.a. 8.25% p.a. 8.25% p.a.
2 Rate of return on plan assets 8.00% p.a. 8.00% p.a. - - - -
3 Salary escalation 4.00% p.a. 3.00% p.a. 4.00% p.a. 3.00% p.a. - -
4 Mortality pre retirement rate LIC (1994-96)
Ultimate Table
LIC (1994-96)
Ultimate Table
LIC (1994-96)
Ultimate Table
LIC (1994-96)
Ultimate Table
- -
5 Mortality post retirement rate - - - - LIC (1996-98)
Ultimate Table
LIC (1996-98)
Ultimate Table
6 Medical premium inflation rate - - - - 4.00 % p.a. 4.00 % p.a.
(c) The Company makes contribution towards provident fund and superannuation fund as a defined contribution retirement benefit plan for qualifying employees. To fund the benefits, the Company is required to contribute a specified percentage of salary to the respective Trusts, which administer the retirement benefit schemes.
(d) The Guidance issued by the Accounting Standard Board (ASB) on implementing the Accounting Standard states that the provident funds set up by employers, which require interest shortfall to be met by the employer, needs to be treated as defined benefit plan. The Fund does not have any existing deficit or interest shortfall. As per the Company’s Actuary, any future obligation arising due to interest shortfall cannot be measured reliably. However, having regard to the assets of the Fund and return on the investments, the Company does not expect any deficiency in the foreseeable future.
(e) The Company makes annual contributions to the Crompton Greaves Limited Gratuity Trust, which is funded defined benefit plan for qualifying employees. The Scheme provides for lump sum payment to vested employees at retirement, death while in employment or on termination of employment as per the Company’s Gratuity Scheme. Vesting occurs upon completion of five years of service.
(f) The Company provides post retirement medical benefits to qualifying employees.
(g) The actuarial valuation of plan assets and the present value of the defined benefit obligation were carried out at 31st March, 2012. The present value of the defined benefit obligation and the related current service cost and past service cost, were measured using the Projected Unit Credit Method.
(h) Discount rate is based on the prevailing market yields of Indian Government securities as at the balance sheet date for the estimated term of the obligations.
(i) Expected rate of return on the plan assets is based on the average long-term rate of return expected on investments of the Fund during the estimated term of the obligations.
(j) The salary escalation rate is arrived after taking into consideration the seniority, the promotion and other relevant factors, such as, demand and supply in employment market.
NOTES ACCOMPANYING TO THE FINANCIAL STATEMENTS (Contd. )
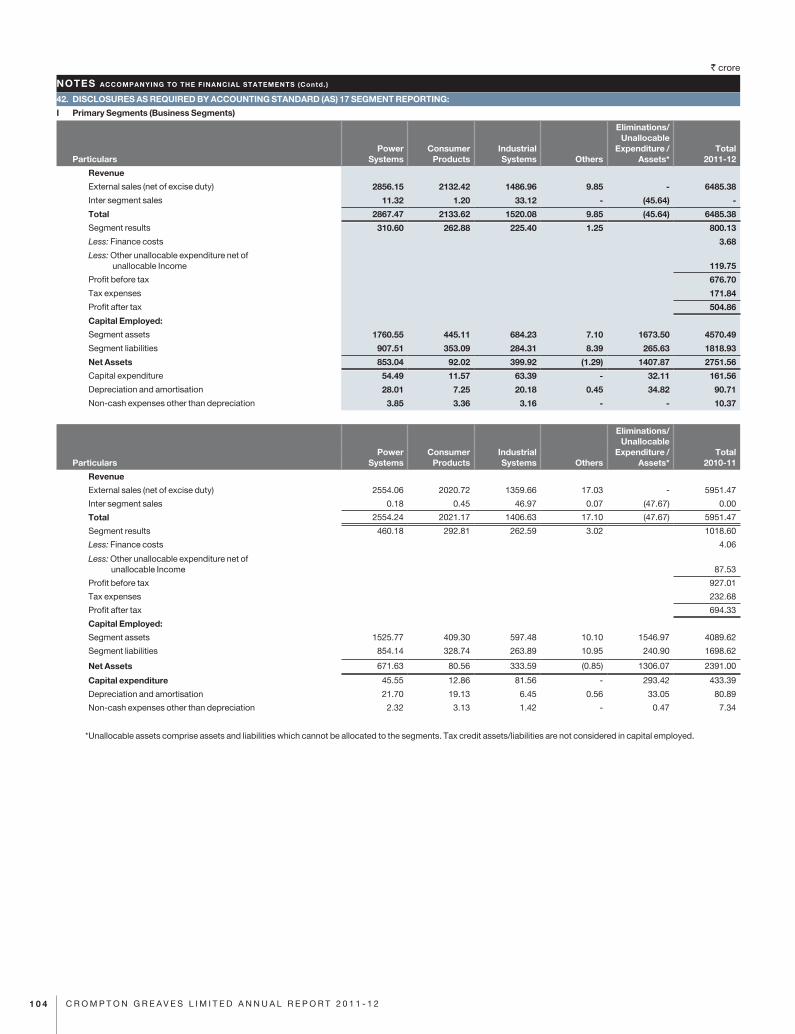
` crore
1 0 4 C R O M P T O N G R E A V E S L I M I T E D A N N U A L R E P O R T 2 0 1 1 - 1 2
42. DISCLOSURES AS REQUIRED BY ACCOUNTING STANDARD (AS) 17 SEGMENT REPORTING:
I Primary Segments (Business Segments)
ParticularsPower
SystemsConsumer
ProductsIndustrialSystems Others
Eliminations/Unallocable
Expenditure /Assets*
Total2011-12
Revenue
External sales (net of excise duty) 2856.15 2132.42 1486.96 9.85 - 6485.38
Inter segment sales 11.32 1.20 33.12 - (45.64) -
Total 2867.47 2133.62 1520.08 9.85 (45.64) 6485.38
Segment results 310.60 262.88 225.40 1.25 800.13
Less: Finance costs 3.68
Less: Other unallocable expenditure net of unallocable Income 119.75
Profit before tax 676.70
Tax expenses 171.84
Profit after tax 504.86
Capital Employed:
Segment assets 1760.55 445.11 684.23 7.10 1673.50 4570.49
Segment liabilities 907.51 353.09 284.31 8.39 265.63 1818.93
Net Assets 853.04 92.02 399.92 (1.29) 1407.87 2751.56
Capital expenditure 54.49 11.57 63.39 - 32.11 161.56
Depreciation and amortisation 28.01 7.25 20.18 0.45 34.82 90.71
Non-cash expenses other than depreciation 3.85 3.36 3.16 - - 10.37
ParticularsPower
SystemsConsumer
ProductsIndustrialSystems Others
Eliminations/Unallocable
Expenditure /Assets*
Total2010-11
Revenue
External sales (net of excise duty) 2554.06 2020.72 1359.66 17.03 - 5951.47
Inter segment sales 0.18 0.45 46.97 0.07 (47.67) 0.00
Total 2554.24 2021.17 1406.63 17.10 (47.67) 5951.47
Segment results 460.18 292.81 262.59 3.02 1018.60
Less: Finance costs 4.06
Less: Other unallocable expenditure net of unallocable Income 87.53
Profit before tax 927.01
Tax expenses 232.68
Profit after tax 694.33
Capital Employed:
Segment assets 1525.77 409.30 597.48 10.10 1546.97 4089.62
Segment liabilities 854.14 328.74 263.89 10.95 240.90 1698.62
Net Assets 671.63 80.56 333.59 (0.85) 1306.07 2391.00
Capital expenditure 45.55 12.86 81.56 - 293.42 433.39
Depreciation and amortisation 21.70 19.13 6.45 0.56 33.05 80.89
Non-cash expenses other than depreciation 2.32 3.13 1.42 - 0.47 7.34
*Unallocable assets comprise assets and liabilities which cannot be allocated to the segments. Tax credit assets/liabilities are not considered in capital employed.
NOTES ACCOMPANYING TO THE FINANCIAL STATEMENTS (Contd. )
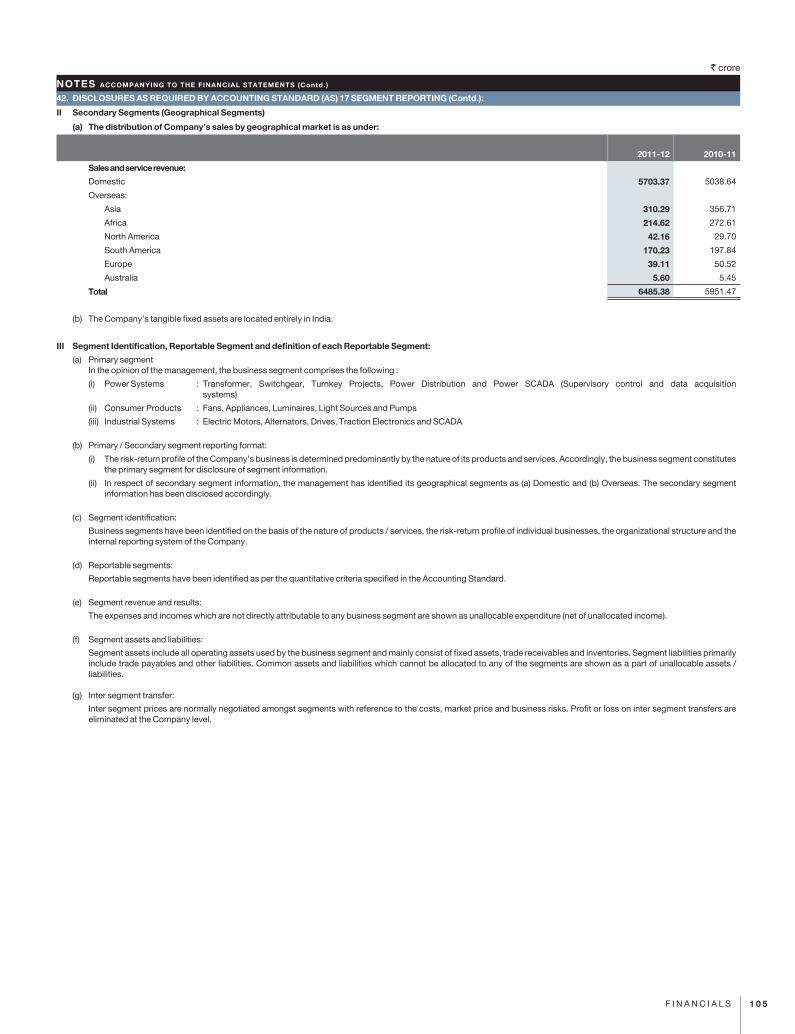
` crore
1 0 5F I N A N C I A L S
42. DISCLOSURES AS REQUIRED BY ACCOUNTING STANDARD (AS) 17 SEGMENT REPORTING (Contd.):
II Secondary Segments (Geographical Segments)
(a) The distribution of Company’s sales by geographical market is as under:
2011-12 2010-11
Sales and service revenue:
Domestic 5703.37 5038.64
Overseas:
Asia 310.29 356.71
Africa 214.62 272.61
North America 42.16 29.70
South America 170.23 197.84
Europe 39.11 50.52
Australia 5.60 5.45
Total 6485.38 5951.47
(b) The Company’s tangible fixed assets are located entirely in India.
III Segment Identification, Reportable Segment and definition of each Reportable Segment:
(a) Primary segmentIn the opinion of the management, the business segment comprises the following :
(i) Power Systems : Transformer, Switchgear, Turnkey Projects, Power Distribution and Power SCADA (Supervisory control and data acquisition systems)
(ii) Consumer Products : Fans, Appliances, Luminaires, Light Sources and Pumps
(iii) Industrial Systems : Electric Motors, Alternators, Drives, Traction Electronics and SCADA
(b) Primary / Secondary segment reporting format:
(i) The risk-return profile of the Company’s business is determined predominantly by the nature of its products and services. Accordingly, the business segment constitutes the primary segment for disclosure of segment information.
(ii) In respect of secondary segment information, the management has identified its geographical segments as (a) Domestic and (b) Overseas. The secondary segment information has been disclosed accordingly.
(c) Segment identification:
Business segments have been identified on the basis of the nature of products / services, the risk-return profile of individual businesses, the organizational structure and the internal reporting system of the Company.
(d) Reportable segments:
Reportable segments have been identified as per the quantitative criteria specified in the Accounting Standard.
(e) Segment revenue and results:
The expenses and incomes which are not directly attributable to any business segment are shown as unallocable expenditure (net of unallocated income).
(f) Segment assets and liabilities:
Segment assets include all operating assets used by the business segment and mainly consist of fixed assets, trade receivables and inventories. Segment liabilities primarily include trade payables and other liabilities. Common assets and liabilities which cannot be allocated to any of the segments are shown as a part of unallocable assets / liabilities.
(g) Inter segment transfer:
Inter segment prices are normally negotiated amongst segments with reference to the costs, market price and business risks. Profit or loss on inter segment transfers are eliminated at the Company level.
NOTES ACCOMPANYING TO THE FINANCIAL STATEMENTS (Contd. )
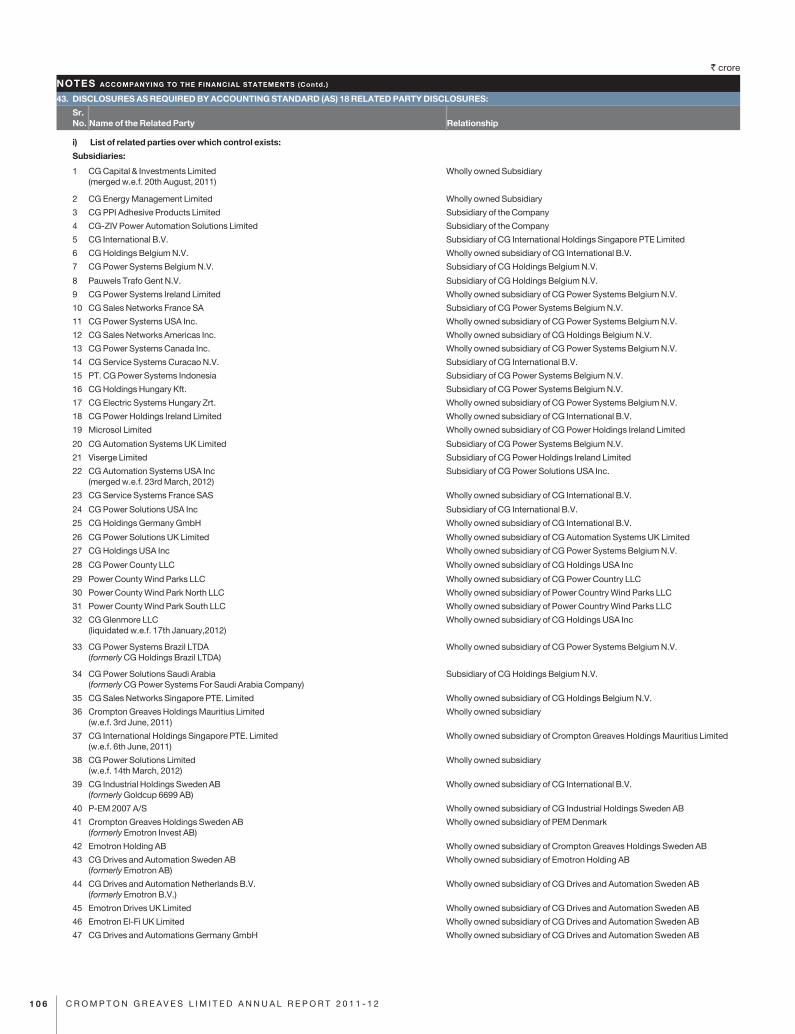
` crore
1 0 6 C R O M P T O N G R E A V E S L I M I T E D A N N U A L R E P O R T 2 0 1 1 - 1 2
43. DISCLOSURES AS REQUIRED BY ACCOUNTING STANDARD (AS) 18 RELATED PARTY DISCLOSURES:
Sr. No. Name of the Related Party Relationship
i) List of related parties over which control exists:
Subsidiaries:
1 CG Capital & Investments Limited(merged w.e.f. 20th August, 2011)
Wholly owned Subsidiary
2 CG Energy Management Limited Wholly owned Subsidiary
3 CG PPI Adhesive Products Limited Subsidiary of the Company
4 CG-ZIV Power Automation Solutions Limited Subsidiary of the Company
5 CG International B.V. Subsidiary of CG International Holdings Singapore PTE Limited
6 CG Holdings Belgium N.V. Wholly owned subsidiary of CG International B.V.
7 CG Power Systems Belgium N.V. Subsidiary of CG Holdings Belgium N.V.
8 Pauwels Trafo Gent N.V. Subsidiary of CG Holdings Belgium N.V.
9 CG Power Systems Ireland Limited Wholly owned subsidiary of CG Power Systems Belgium N.V.
10 CG Sales Networks France SA Subsidiary of CG Power Systems Belgium N.V.
11 CG Power Systems USA Inc. Wholly owned subsidiary of CG Power Systems Belgium N.V.
12 CG Sales Networks Americas Inc. Wholly owned subsidiary of CG Holdings Belgium N.V.
13 CG Power Systems Canada Inc. Wholly owned subsidiary of CG Power Systems Belgium N.V.
14 CG Service Systems Curacao N.V. Subsidiary of CG International B.V.
15 PT. CG Power Systems Indonesia Subsidiary of CG Power Systems Belgium N.V.
16 CG Holdings Hungary Kft. Subsidiary of CG Power Systems Belgium N.V.
17 CG Electric Systems Hungary Zrt. Wholly owned subsidiary of CG Power Systems Belgium N.V.
18 CG Power Holdings Ireland Limited Wholly owned subsidiary of CG International B.V.
19 Microsol Limited Wholly owned subsidiary of CG Power Holdings Ireland Limited
20 CG Automation Systems UK Limited Subsidiary of CG Power Systems Belgium N.V.
21 Viserge Limited Subsidiary of CG Power Holdings Ireland Limited
22 CG Automation Systems USA Inc(merged w.e.f. 23rd March, 2012)
Subsidiary of CG Power Solutions USA Inc.
23 CG Service Systems France SAS Wholly owned subsidiary of CG International B.V.
24 CG Power Solutions USA Inc Subsidiary of CG International B.V.
25 CG Holdings Germany GmbH Wholly owned subsidiary of CG International B.V.
26 CG Power Solutions UK Limited Wholly owned subsidiary of CG Automation Systems UK Limited
27 CG Holdings USA Inc Wholly owned subsidiary of CG Power Systems Belgium N.V.
28 CG Power County LLC Wholly owned subsidiary of CG Holdings USA Inc
29 Power County Wind Parks LLC Wholly owned subsidiary of CG Power Country LLC
30 Power County Wind Park North LLC Wholly owned subsidiary of Power Country Wind Parks LLC
31 Power County Wind Park South LLC Wholly owned subsidiary of Power Country Wind Parks LLC
32 CG Glenmore LLC(liquidated w.e.f. 17th January,2012)
Wholly owned subsidiary of CG Holdings USA Inc
33 CG Power Systems Brazil LTDA(formerly CG Holdings Brazil LTDA)
Wholly owned subsidiary of CG Power Systems Belgium N.V.
34 CG Power Solutions Saudi Arabia (formerly CG Power Systems For Saudi Arabia Company)
Subsidiary of CG Holdings Belgium N.V.
35 CG Sales Networks Singapore PTE. Limited Wholly owned subsidiary of CG Holdings Belgium N.V.
36 Crompton Greaves Holdings Mauritius Limited(w.e.f. 3rd June, 2011)
Wholly owned subsidiary
37 CG International Holdings Singapore PTE. Limited(w.e.f. 6th June, 2011)
Wholly owned subsidiary of Crompton Greaves Holdings Mauritius Limited
38 CG Power Solutions Limited (w.e.f. 14th March, 2012)
Wholly owned subsidiary
39 CG Industrial Holdings Sweden AB (formerly Goldcup 6699 AB)
Wholly owned subsidiary of CG International B.V.
40 P-EM 2007 A/S Wholly owned subsidiary of CG Industrial Holdings Sweden AB
41 Crompton Greaves Holdings Sweden AB (formerly Emotron Invest AB)
Wholly owned subsidiary of PEM Denmark
42 Emotron Holding AB Wholly owned subsidiary of Crompton Greaves Holdings Sweden AB
43 CG Drives and Automation Sweden AB(formerly Emotron AB)
Wholly owned subsidiary of Emotron Holding AB
44 CG Drives and Automation Netherlands B.V. (formerly Emotron B.V.)
Wholly owned subsidiary of CG Drives and Automation Sweden AB
45 Emotron Drives UK Limited Wholly owned subsidiary of CG Drives and Automation Sweden AB
46 Emotron El-Fi UK Limited Wholly owned subsidiary of CG Drives and Automation Sweden AB
47 CG Drives and Automations Germany GmbH Wholly owned subsidiary of CG Drives and Automation Sweden AB
NOTES ACCOMPANYING TO THE FINANCIAL STATEMENTS (Contd. )
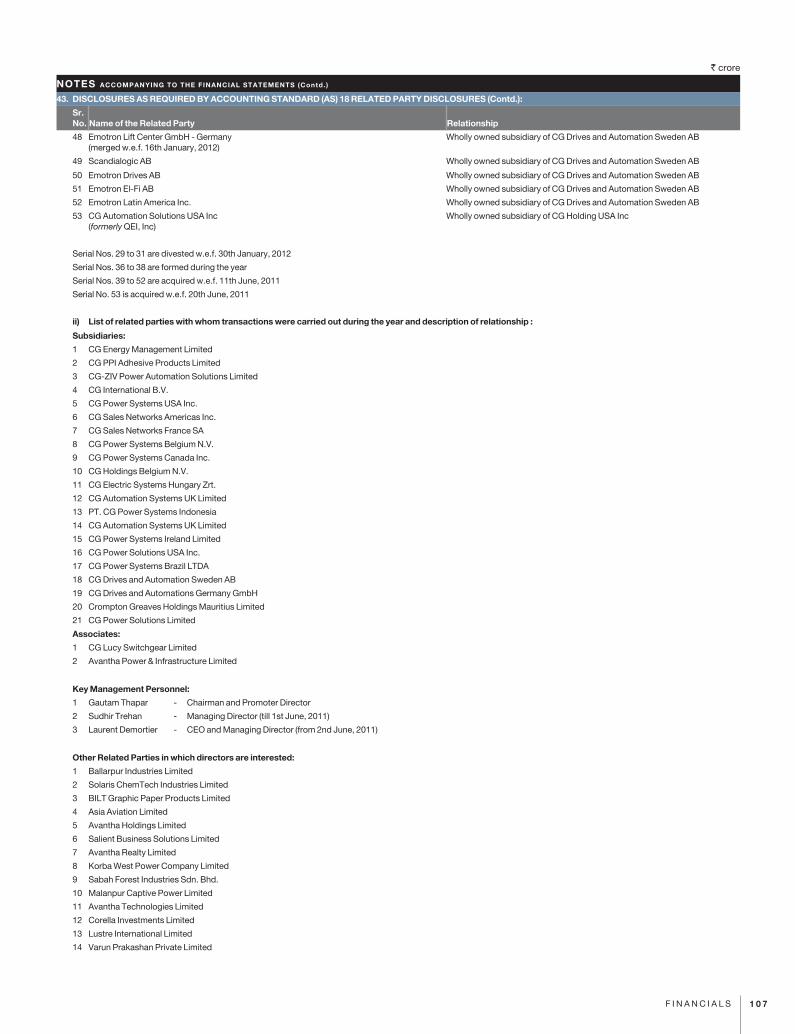
` crore
1 0 7F I N A N C I A L S
43. DISCLOSURES AS REQUIRED BY ACCOUNTING STANDARD (AS) 18 RELATED PARTY DISCLOSURES (Contd.):
Sr. No. Name of the Related Party Relationship
48 Emotron Lift Center GmbH - Germany (merged w.e.f. 16th January, 2012)
Wholly owned subsidiary of CG Drives and Automation Sweden AB
49 Scandialogic AB Wholly owned subsidiary of CG Drives and Automation Sweden AB
50 Emotron Drives AB Wholly owned subsidiary of CG Drives and Automation Sweden AB
51 Emotron El-Fi AB Wholly owned subsidiary of CG Drives and Automation Sweden AB
52 Emotron Latin America Inc. Wholly owned subsidiary of CG Drives and Automation Sweden AB
53 CG Automation Solutions USA Inc (formerly QEI, Inc)
Wholly owned subsidiary of CG Holding USA Inc
Serial Nos. 29 to 31 are divested w.e.f. 30th January, 2012
Serial Nos. 36 to 38 are formed during the year
Serial Nos. 39 to 52 are acquired w.e.f. 11th June, 2011
Serial No. 53 is acquired w.e.f. 20th June, 2011
ii) List of related parties with whom transactions were carried out during the year and description of relationship :
Subsidiaries:
1 CG Energy Management Limited
2 CG PPI Adhesive Products Limited
3 CG-ZIV Power Automation Solutions Limited
4 CG International B.V.
5 CG Power Systems USA Inc.
6 CG Sales Networks Americas Inc.
7 CG Sales Networks France SA
8 CG Power Systems Belgium N.V.
9 CG Power Systems Canada Inc.
10 CG Holdings Belgium N.V.
11 CG Electric Systems Hungary Zrt.
12 CG Automation Systems UK Limited
13 PT. CG Power Systems Indonesia
14 CG Automation Systems UK Limited
15 CG Power Systems Ireland Limited
16 CG Power Solutions USA Inc.
17 CG Power Systems Brazil LTDA
18 CG Drives and Automation Sweden AB
19 CG Drives and Automations Germany GmbH
20 Crompton Greaves Holdings Mauritius Limited
21 CG Power Solutions Limited
Associates:
1 CG Lucy Switchgear Limited
2 Avantha Power & Infrastructure Limited
Key Management Personnel:
1 Gautam Thapar - Chairman and Promoter Director
2 Sudhir Trehan - Managing Director (till 1st June, 2011)
3 Laurent Demortier - CEO and Managing Director (from 2nd June, 2011)
Other Related Parties in which directors are interested:
1 Ballarpur Industries Limited
2 Solaris ChemTech Industries Limited
3 BILT Graphic Paper Products Limited
4 Asia Aviation Limited
5 Avantha Holdings Limited
6 Salient Business Solutions Limited
7 Avantha Realty Limited
8 Korba West Power Company Limited
9 Sabah Forest Industries Sdn. Bhd.
10 Malanpur Captive Power Limited
11 Avantha Technologies Limited
12 Corella Investments Limited
13 Lustre International Limited
14 Varun Prakashan Private Limited
NOTES ACCOMPANYING TO THE FINANCIAL STATEMENTS (Contd. )
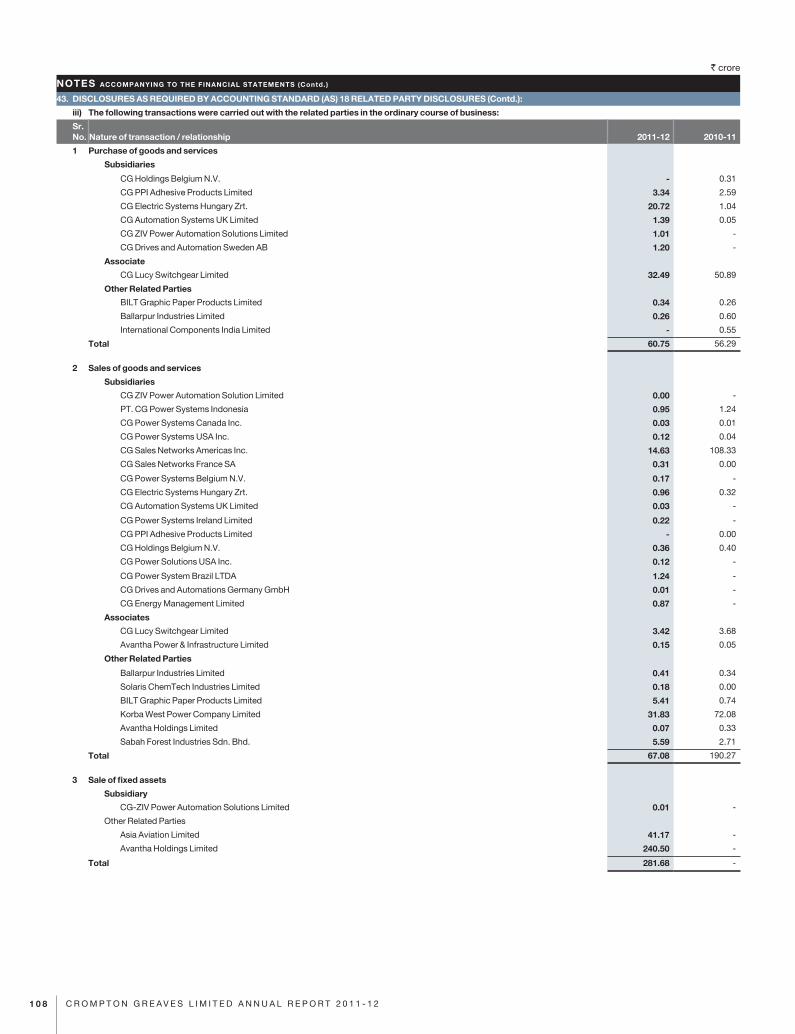
` crore
1 0 8 C R O M P T O N G R E A V E S L I M I T E D A N N U A L R E P O R T 2 0 1 1 - 1 2
43. DISCLOSURES AS REQUIRED BY ACCOUNTING STANDARD (AS) 18 RELATED PARTY DISCLOSURES (Contd.):
iii) The following transactions were carried out with the related parties in the ordinary course of business:
Sr. No. Nature of transaction / relationship 2011-12 2010-11
1 Purchase of goods and services
Subsidiaries
CG Holdings Belgium N.V. - 0.31
CG PPI Adhesive Products Limited 3.34 2.59
CG Electric Systems Hungary Zrt. 20.72 1.04
CG Automation Systems UK Limited 1.39 0.05
CG ZIV Power Automation Solutions Limited 1.01 -
CG Drives and Automation Sweden AB 1.20 -
Associate
CG Lucy Switchgear Limited 32.49 50.89
Other Related Parties
BILT Graphic Paper Products Limited 0.34 0.26
Ballarpur Industries Limited 0.26 0.60
International Components India Limited - 0.55
Total 60.75 56.29
2 Sales of goods and services
Subsidiaries
CG ZIV Power Automation Solution Limited 0.00 -
PT. CG Power Systems Indonesia 0.95 1.24
CG Power Systems Canada Inc. 0.03 0.01
CG Power Systems USA Inc. 0.12 0.04
CG Sales Networks Americas Inc. 14.63 108.33
CG Sales Networks France SA 0.31 0.00
CG Power Systems Belgium N.V. 0.17 -
CG Electric Systems Hungary Zrt. 0.96 0.32
CG Automation Systems UK Limited 0.03 -
CG Power Systems Ireland Limited 0.22 -
CG PPI Adhesive Products Limited - 0.00
CG Holdings Belgium N.V. 0.36 0.40
CG Power Solutions USA Inc. 0.12 -
CG Power System Brazil LTDA 1.24 -
CG Drives and Automations Germany GmbH 0.01 -
CG Energy Management Limited 0.87 -
Associates
CG Lucy Switchgear Limited 3.42 3.68
Avantha Power & Infrastructure Limited 0.15 0.05
Other Related Parties
Ballarpur Industries Limited 0.41 0.34
Solaris ChemTech Industries Limited 0.18 0.00
BILT Graphic Paper Products Limited 5.41 0.74
Korba West Power Company Limited 31.83 72.08
Avantha Holdings Limited 0.07 0.33
Sabah Forest Industries Sdn. Bhd. 5.59 2.71
Total 67.08 190.27
3 Sale of fixed assets
Subsidiary
CG-ZIV Power Automation Solutions Limited 0.01 -
Other Related Parties
Asia Aviation Limited 41.17 -
Avantha Holdings Limited 240.50 -
Total 281.68 -
NOTES ACCOMPANYING TO THE FINANCIAL STATEMENTS (Contd. )
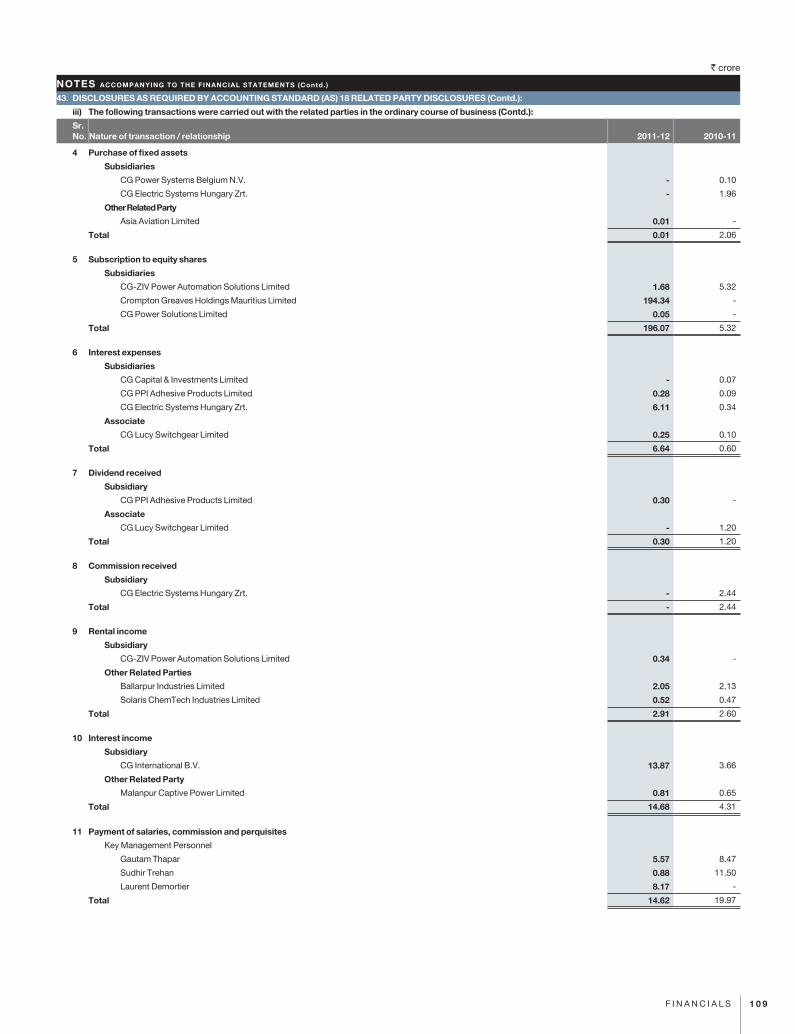
` crore
1 0 9F I N A N C I A L S
43. DISCLOSURES AS REQUIRED BY ACCOUNTING STANDARD (AS) 18 RELATED PARTY DISCLOSURES (Contd.):
iii) The following transactions were carried out with the related parties in the ordinary course of business (Contd.):
Sr. No. Nature of transaction / relationship 2011-12 2010-11
4 Purchase of fixed assets
Subsidiaries
CG Power Systems Belgium N.V. - 0.10
CG Electric Systems Hungary Zrt. - 1.96
Other Related Party
Asia Aviation Limited 0.01 -
Total 0.01 2.06
5 Subscription to equity shares
Subsidiaries
CG-ZIV Power Automation Solutions Limited 1.68 5.32
Crompton Greaves Holdings Mauritius Limited 194.34 -
CG Power Solutions Limited 0.05 -
Total 196.07 5.32
6 Interest expenses
Subsidiaries
CG Capital & Investments Limited - 0.07
CG PPI Adhesive Products Limited 0.28 0.09
CG Electric Systems Hungary Zrt. 6.11 0.34
Associate
CG Lucy Switchgear Limited 0.25 0.10
Total 6.64 0.60
7 Dividend received
Subsidiary
CG PPI Adhesive Products Limited 0.30 -
Associate
CG Lucy Switchgear Limited - 1.20
Total 0.30 1.20
8 Commission received
Subsidiary
CG Electric Systems Hungary Zrt. - 2.44
Total - 2.44
9 Rental income
Subsidiary
CG-ZIV Power Automation Solutions Limited 0.34 -
Other Related Parties
Ballarpur Industries Limited 2.05 2.13
Solaris ChemTech Industries Limited 0.52 0.47
Total 2.91 2.60
10 Interest income
Subsidiary
CG International B.V. 13.87 3.66
Other Related Party
Malanpur Captive Power Limited 0.81 0.65
Total 14.68 4.31
11 Payment of salaries, commission and perquisites
Key Management Personnel
Gautam Thapar 5.57 8.47
Sudhir Trehan 0.88 11.50
Laurent Demortier 8.17 -
Total 14.62 19.97
NOTES ACCOMPANYING TO THE FINANCIAL STATEMENTS (Contd. )
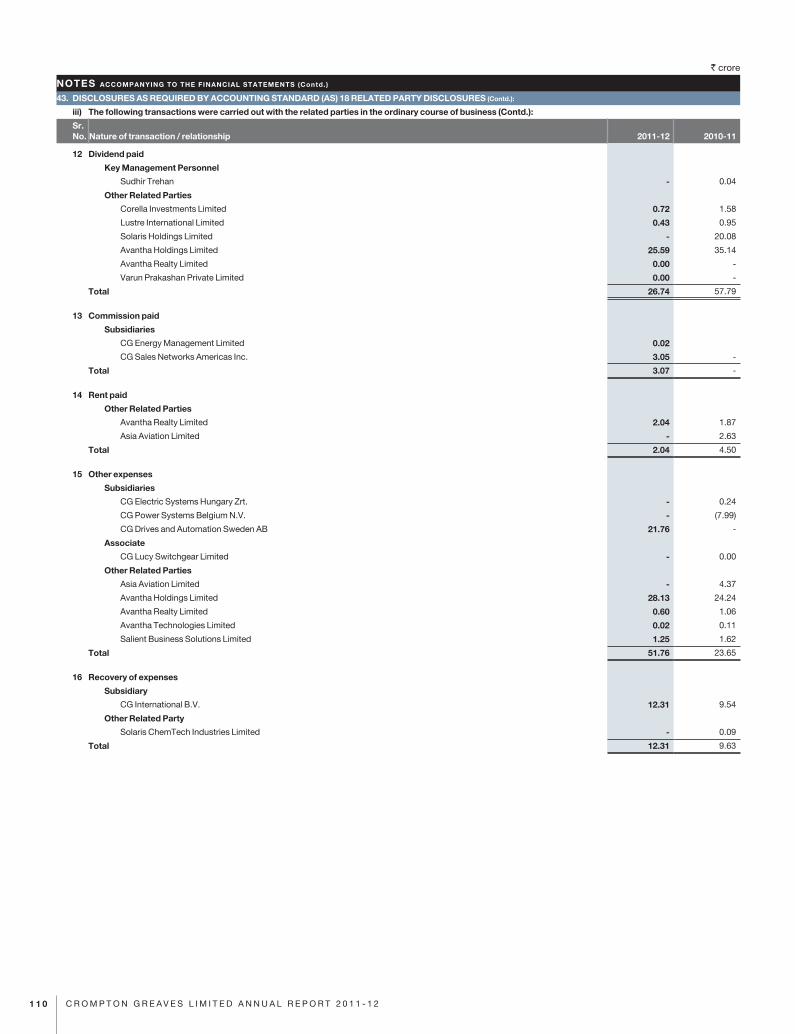
` crore
1 1 0 C R O M P T O N G R E A V E S L I M I T E D A N N U A L R E P O R T 2 0 1 1 - 1 2
43. DISCLOSURES AS REQUIRED BY ACCOUNTING STANDARD (AS) 18 RELATED PARTY DISCLOSURES (Contd.):
iii) The following transactions were carried out with the related parties in the ordinary course of business (Contd.):
Sr. No. Nature of transaction / relationship 2011-12 2010-11
12 Dividend paid
Key Management Personnel
Sudhir Trehan - 0.04
Other Related Parties
Corella Investments Limited 0.72 1.58
Lustre International Limited 0.43 0.95
Solaris Holdings Limited - 20.08
Avantha Holdings Limited 25.59 35.14
Avantha Realty Limited 0.00 -
Varun Prakashan Private Limited 0.00 -
Total 26.74 57.79
13 Commission paid
Subsidiaries
CG Energy Management Limited 0.02
CG Sales Networks Americas Inc. 3.05 -
Total 3.07 -
14 Rent paid
Other Related Parties
Avantha Realty Limited 2.04 1.87
Asia Aviation Limited - 2.63
Total 2.04 4.50
15 Other expenses
Subsidiaries
CG Electric Systems Hungary Zrt. - 0.24
CG Power Systems Belgium N.V. - (7.99)
CG Drives and Automation Sweden AB 21.76 -
Associate
CG Lucy Switchgear Limited - 0.00
Other Related Parties
Asia Aviation Limited - 4.37
Avantha Holdings Limited 28.13 24.24
Avantha Realty Limited 0.60 1.06
Avantha Technologies Limited 0.02 0.11
Salient Business Solutions Limited 1.25 1.62
Total 51.76 23.65
16 Recovery of expenses
Subsidiary
CG International B.V. 12.31 9.54
Other Related Party
Solaris ChemTech Industries Limited - 0.09
Total 12.31 9.63
NOTES ACCOMPANYING TO THE FINANCIAL STATEMENTS (Contd. )
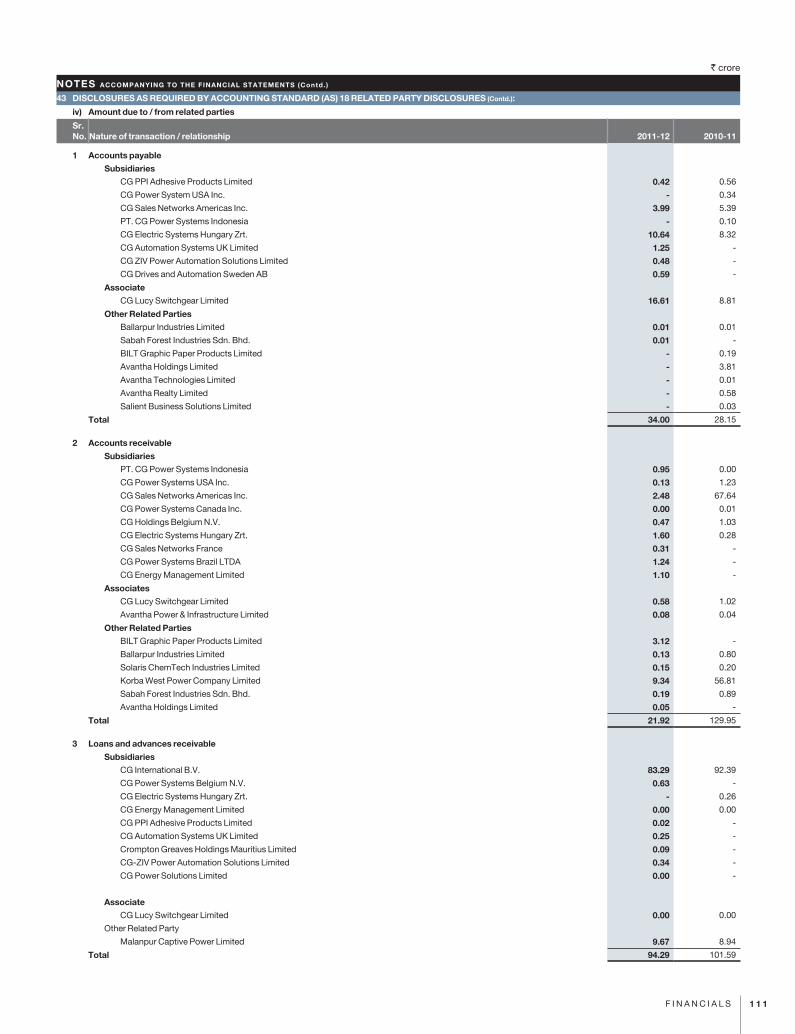
` crore
1 1 1F I N A N C I A L S
43 DISCLOSURES AS REQUIRED BY ACCOUNTING STANDARD (AS) 18 RELATED PARTY DISCLOSURES (Contd.):
iv) Amount due to / from related parties
Sr. No. Nature of transaction / relationship 2011-12 2010-11
1 Accounts payable
Subsidiaries
CG PPI Adhesive Products Limited 0.42 0.56
CG Power System USA Inc. - 0.34
CG Sales Networks Americas Inc. 3.99 5.39
PT. CG Power Systems Indonesia - 0.10
CG Electric Systems Hungary Zrt. 10.64 8.32
CG Automation Systems UK Limited 1.25 -
CG ZIV Power Automation Solutions Limited 0.48 -
CG Drives and Automation Sweden AB 0.59 -
Associate
CG Lucy Switchgear Limited 16.61 8.81
Other Related Parties
Ballarpur Industries Limited 0.01 0.01
Sabah Forest Industries Sdn. Bhd. 0.01 -
BILT Graphic Paper Products Limited - 0.19
Avantha Holdings Limited - 3.81
Avantha Technologies Limited - 0.01
Avantha Realty Limited - 0.58
Salient Business Solutions Limited - 0.03
Total 34.00 28.15
2 Accounts receivable
Subsidiaries
PT. CG Power Systems Indonesia 0.95 0.00
CG Power Systems USA Inc. 0.13 1.23
CG Sales Networks Americas Inc. 2.48 67.64
CG Power Systems Canada Inc. 0.00 0.01
CG Holdings Belgium N.V. 0.47 1.03
CG Electric Systems Hungary Zrt. 1.60 0.28
CG Sales Networks France 0.31 -
CG Power Systems Brazil LTDA 1.24 -
CG Energy Management Limited 1.10 -
Associates
CG Lucy Switchgear Limited 0.58 1.02
Avantha Power & Infrastructure Limited 0.08 0.04
Other Related Parties
BILT Graphic Paper Products Limited 3.12 -
Ballarpur Industries Limited 0.13 0.80
Solaris ChemTech Industries Limited 0.15 0.20
Korba West Power Company Limited 9.34 56.81
Sabah Forest Industries Sdn. Bhd. 0.19 0.89
Avantha Holdings Limited 0.05 -
Total 21.92 129.95
3 Loans and advances receivable
Subsidiaries
CG International B.V. 83.29 92.39
CG Power Systems Belgium N.V. 0.63 -
CG Electric Systems Hungary Zrt. - 0.26
CG Energy Management Limited 0.00 0.00
CG PPI Adhesive Products Limited 0.02 -
CG Automation Systems UK Limited 0.25 -
Crompton Greaves Holdings Mauritius Limited 0.09 -
CG-ZIV Power Automation Solutions Limited 0.34 -
CG Power Solutions Limited 0.00 -
Associate
CG Lucy Switchgear Limited 0.00 0.00
Other Related Party
Malanpur Captive Power Limited 9.67 8.94
Total 94.29 101.59
NOTES ACCOMPANYING TO THE FINANCIAL STATEMENTS (Contd. )
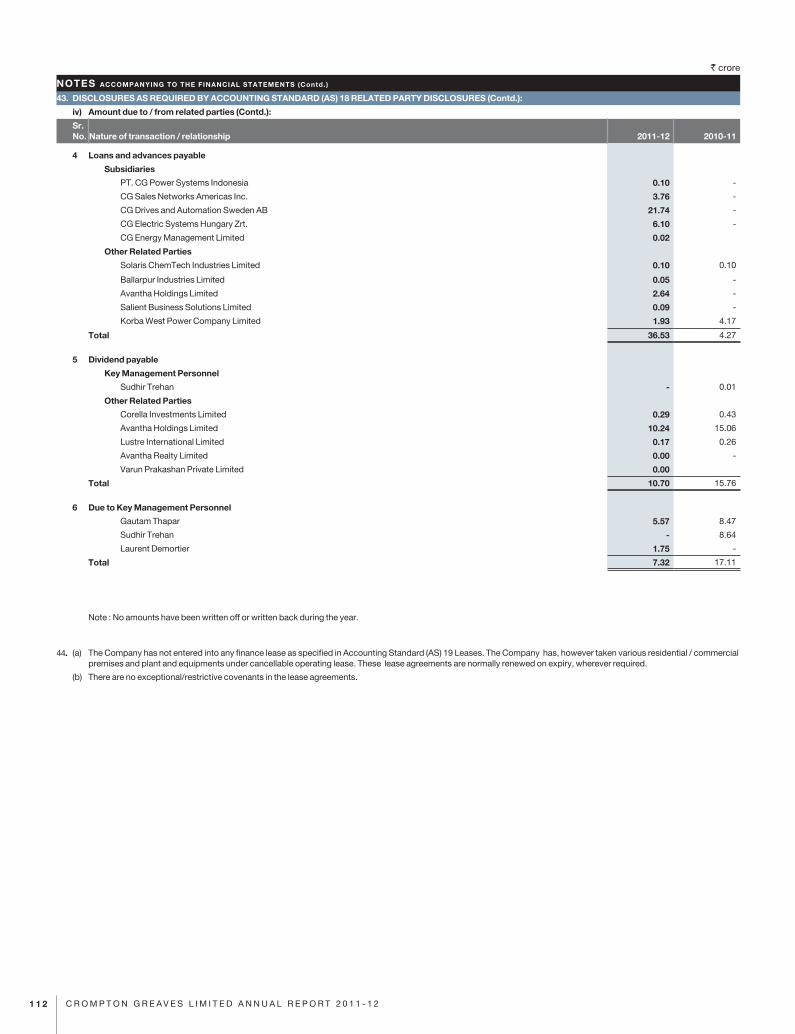
` crore
1 1 2 C R O M P T O N G R E A V E S L I M I T E D A N N U A L R E P O R T 2 0 1 1 - 1 2
43. DISCLOSURES AS REQUIRED BY ACCOUNTING STANDARD (AS) 18 RELATED PARTY DISCLOSURES (Contd.):
iv) Amount due to / from related parties (Contd.):
Sr. No. Nature of transaction / relationship 2011-12 2010-11
4 Loans and advances payable
Subsidiaries
PT. CG Power Systems Indonesia 0.10 -
CG Sales Networks Americas Inc. 3.76 -
CG Drives and Automation Sweden AB 21.74 -
CG Electric Systems Hungary Zrt. 6.10 -
CG Energy Management Limited 0.02
Other Related Parties
Solaris ChemTech Industries Limited 0.10 0.10
Ballarpur Industries Limited 0.05 -
Avantha Holdings Limited 2.64 -
Salient Business Solutions Limited 0.09 -
Korba West Power Company Limited 1.93 4.17
Total 36.53 4.27
5 Dividend payable
Key Management Personnel
Sudhir Trehan - 0.01
Other Related Parties
Corella Investments Limited 0.29 0.43
Avantha Holdings Limited 10.24 15.06
Lustre International Limited 0.17 0.26
Avantha Realty Limited 0.00 -
Varun Prakashan Private Limited 0.00
Total 10.70 15.76
6 Due to Key Management Personnel
Gautam Thapar 5.57 8.47
Sudhir Trehan - 8.64
Laurent Demortier 1.75 -
Total 7.32 17.11
Note : No amounts have been written off or written back during the year.
44. (a) The Company has not entered into any finance lease as specified in Accounting Standard (AS) 19 Leases. The Company has, however taken various residential / commercial premises and plant and equipments under cancellable operating lease. These lease agreements are normally renewed on expiry, wherever required.
(b) There are no exceptional/restrictive covenants in the lease agreements.
NOTES ACCOMPANYING TO THE FINANCIAL STATEMENTS (Contd. )
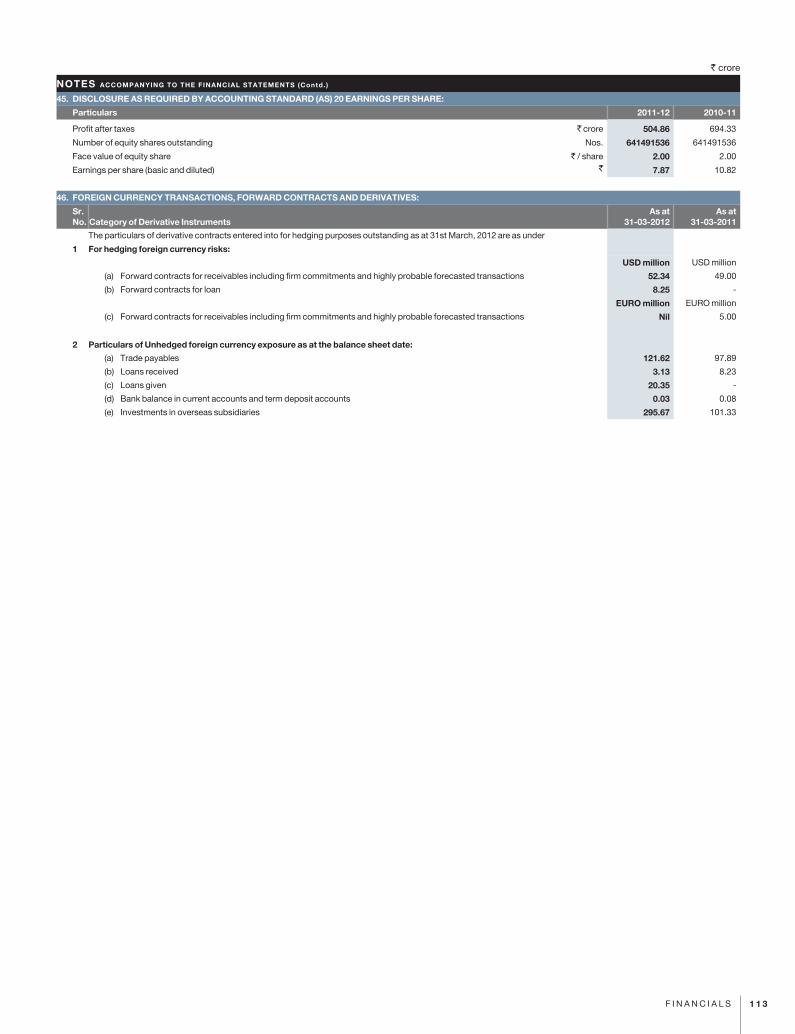
` crore
1 1 3F I N A N C I A L S
46. FOREIGN CURRENCY TRANSACTIONS, FORWARD CONTRACTS AND DERIVATIVES:
Sr. No. Category of Derivative Instruments
As at 31-03-2012
As at 31-03-2011
The particulars of derivative contracts entered into for hedging purposes outstanding as at 31st March, 2012 are as under
1 For hedging foreign currency risks:
USD million USD million
(a) Forward contracts for receivables including firm commitments and highly probable forecasted transactions 52.34 49.00
(b) Forward contracts for loan 8.25 -
EURO million EURO million
(c) Forward contracts for receivables including firm commitments and highly probable forecasted transactions Nil 5.00
2 Particulars of Unhedged foreign currency exposure as at the balance sheet date:
(a) Trade payables 121.62 97.89
(b) Loans received 3.13 8.23
(c) Loans given 20.35 -
(d) Bank balance in current accounts and term deposit accounts 0.03 0.08
(e) Investments in overseas subsidiaries 295.67 101.33
NOTES ACCOMPANYING TO THE FINANCIAL STATEMENTS (Contd. )
45. DISCLOSURE AS REQUIRED BY ACCOUNTING STANDARD (AS) 20 EARNINGS PER SHARE:
Particulars 2011-12 2010-11
Profit after taxes ` crore 504.86 694.33
Number of equity shares outstanding Nos. 641491536 641491536
Face value of equity share ` / share 2.00 2.00
Earnings per share (basic and diluted) ` 7.87 10.82
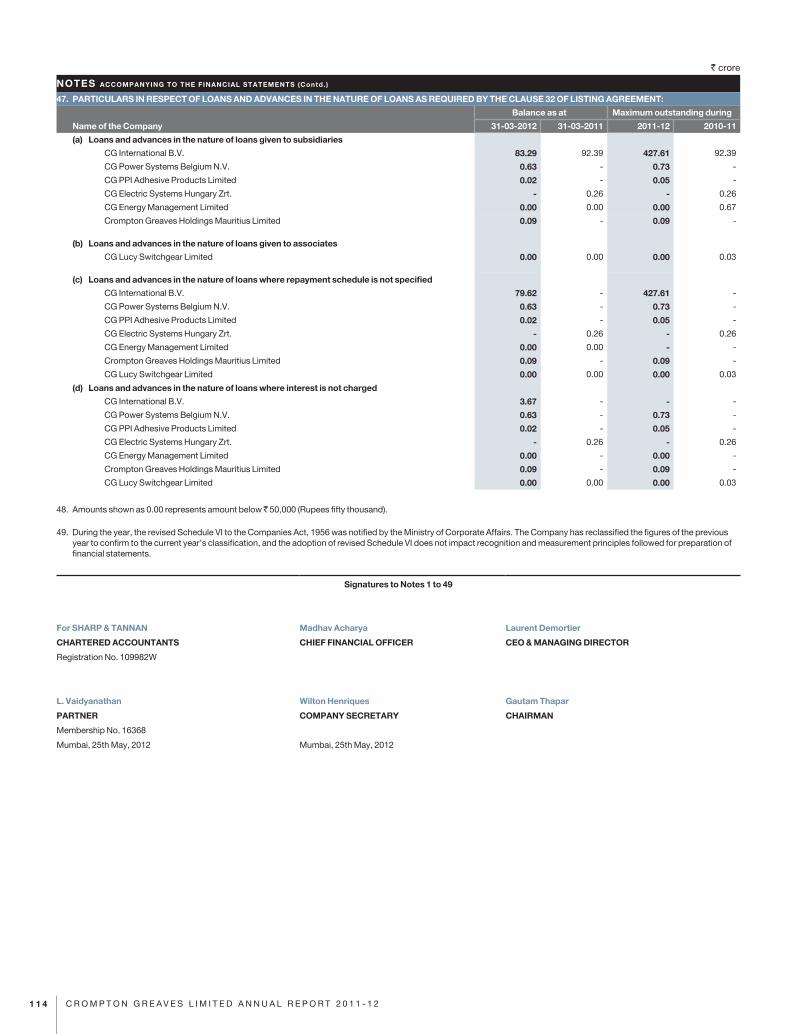
` crore
1 1 4 C R O M P T O N G R E A V E S L I M I T E D A N N U A L R E P O R T 2 0 1 1 - 1 2
Signatures to Notes 1 to 49
For SHARP & TANNAN Madhav Acharya Laurent Demortier
CHARTERED ACCOUNTANTS CHIEF FINANCIAL OFFICER CEO & MANAGING DIRECTOR
Registration No. 109982W
L. Vaidyanathan Wilton Henriques Gautam Thapar
PARTNER COMPANY SECRETARY CHAIRMAN
Membership No. 16368
Mumbai, 25th May, 2012 Mumbai, 25th May, 2012
47. PARTICULARS IN RESPECT OF LOANS AND ADVANCES IN THE NATURE OF LOANS AS REQUIRED BY THE CLAUSE 32 OF LISTING AGREEMENT:
Name of the Company
Balance as at Maximum outstanding during
31-03-2012 31-03-2011 2011-12 2010-11
(a) Loans and advances in the nature of loans given to subsidiaries
CG International B.V. 83.29 92.39 427.61 92.39
CG Power Systems Belgium N.V. 0.63 - 0.73 -
CG PPI Adhesive Products Limited 0.02 - 0.05 -
CG Electric Systems Hungary Zrt. - 0.26 - 0.26
CG Energy Management Limited 0.00 0.00 0.00 0.67
Crompton Greaves Holdings Mauritius Limited 0.09 - 0.09 -
(b) Loans and advances in the nature of loans given to associates
CG Lucy Switchgear Limited 0.00 0.00 0.00 0.03
(c) Loans and advances in the nature of loans where repayment schedule is not specified
CG International B.V. 79.62 - 427.61 -
CG Power Systems Belgium N.V. 0.63 - 0.73 -
CG PPI Adhesive Products Limited 0.02 - 0.05 -
CG Electric Systems Hungary Zrt. - 0.26 - 0.26
CG Energy Management Limited 0.00 0.00 - -
Crompton Greaves Holdings Mauritius Limited 0.09 - 0.09 -
CG Lucy Switchgear Limited 0.00 0.00 0.00 0.03
(d) Loans and advances in the nature of loans where interest is not charged
CG International B.V. 3.67 - - -
CG Power Systems Belgium N.V. 0.63 - 0.73 -
CG PPI Adhesive Products Limited 0.02 - 0.05 -
CG Electric Systems Hungary Zrt. - 0.26 - 0.26
CG Energy Management Limited 0.00 - 0.00 -
Crompton Greaves Holdings Mauritius Limited 0.09 - 0.09 -
CG Lucy Switchgear Limited 0.00 0.00 0.00 0.03
48. Amounts shown as 0.00 represents amount below 50,000 (Rupees fifty thousand).
49. During the year, the revised Schedule VI to the Companies Act, 1956 was notified by the Ministry of Corporate Affairs. The Company has reclassified the figures of the previous year to confirm to the current year’s classification, and the adoption of revised Schedule VI does not impact recognition and measurement principles followed for preparation of financial statements.
NOTES ACCOMPANYING TO THE FINANCIAL STATEMENTS (Contd. )
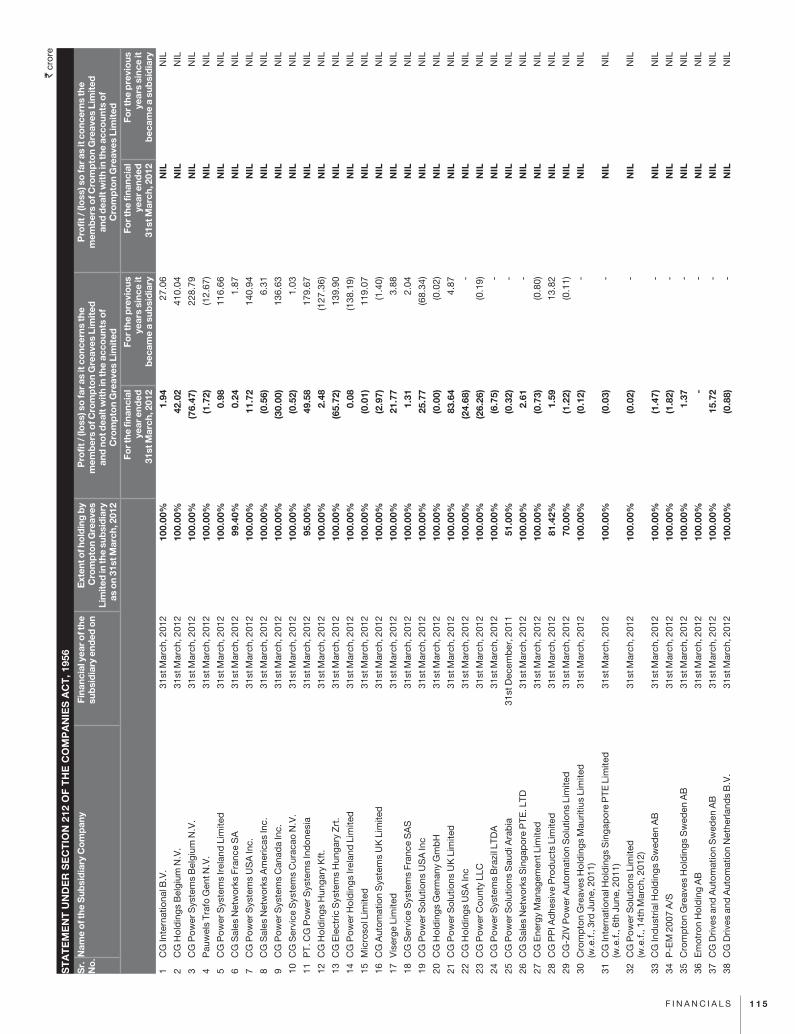
1 1 5F i n a n c i a l s
Sr.
N
o.N
ame
of t
he S
ubsi
dia
ry C
om
pan
yFi
nanc
ial y
ear o
f the
su
bsi
dia
ry e
nded
on
Ext
ent o
f ho
ldin
g b
y C
rom
pto
n G
reav
es
Lim
ited
in th
e su
bsi
dia
ry
as o
n 31
st M
arch
, 201
2
Pro
fit /
(loss
) so
far a
s it
co
ncer
ns th
e
mem
ber
s o
f Cro
mp
ton
Gre
aves
Lim
ited
an
d n
ot d
ealt
wit
h in
the
acco
unts
of
Cro
mp
ton
Gre
aves
Lim
ited
Pro
fit /
(loss
) so
far a
s it
co
ncer
ns th
e
mem
ber
s o
f Cro
mp
ton
Gre
aves
Lim
ited
an
d d
ealt
wit
h in
the
acco
unts
of
Cro
mp
ton
Gre
aves
Lim
ited
For t
he fi
nanc
ial
year
end
ed
31st
Mar
ch, 2
012
For t
he p
revi
ous
ye
ars
sinc
e it
b
ecam
e a
sub
sid
iary
For t
he fi
nanc
ial
year
end
ed
31st
Mar
ch, 2
012
For t
he p
revi
ous
ye
ars
sinc
e it
b
ecam
e a
sub
sid
iary
1c
G in
tern
atio
nal B
.V.
31st
Mar
ch, 2
012
100.
00%
1.9
4 27
.06
NIL
n
il
2c
G H
old
ing
s B
elg
ium
n.V
.31
st M
arch
, 201
210
0.00
% 4
2.02
41
0.04
N
IL
nil
3c
G P
ow
er s
yste
ms
Bel
giu
m n
.V.
31st
Mar
ch, 2
012
100.
00%
(76.
47)
228.
79
NIL
n
il
4P
auw
els
Tra
fo G
ent n
.V.
31st
Mar
ch, 2
012
100.
00%
(1.7
2)(1
2.67
) N
IL
nil
5c
G P
ow
er s
yste
ms
irel
and
lim
ited
31st
Mar
ch, 2
012
100.
00%
0.9
8 11
6.66
N
IL
nil
6c
G s
ales
net
wo
rks
Fra
nce
sa
31st
Mar
ch, 2
012
99.4
0% 0
.24
1.87
N
IL
nil
7c
G P
ow
er s
yste
ms
Us
a in
c.31
st M
arch
, 201
210
0.00
% 1
1.72
14
0.94
N
IL
nil
8c
G s
ales
net
wo
rks
am
eric
as in
c.31
st M
arch
, 201
210
0.00
% (0
.56)
6.31
N
IL
nil
9c
G P
ow
er s
yste
ms
can
ada
inc.
31st
Mar
ch, 2
012
100.
00%
(30.
00)
136.
63
NIL
n
il
10c
G s
ervi
ce s
yste
ms
cur
acao
n.V
.31
st M
arch
, 201
210
0.00
% (0
.52)
1.03
N
IL
nil
11P
T. c
G P
ow
er s
yste
ms
ind
one
sia
31st
Mar
ch, 2
012
95.0
0% 4
9.58
17
9.67
N
IL
nil
12c
G H
old
ing
s H
ung
ary
Kft
.31
st M
arch
, 201
210
0.00
% 2
.48
(127
.36)
NIL
n
il
13c
G E
lect
ric s
yste
ms
Hun
gar
y Z
rt.
31st
Mar
ch, 2
012
100.
00%
(65.
72)
139.
90
NIL
n
il
14c
G P
ow
er H
old
ing
s ir
elan
d l
imite
d31
st M
arch
, 201
210
0.00
% 0
.08
(138
.19)
NIL
n
il
15M
icro
sol l
imite
d31
st M
arch
, 201
210
0.00
% (0
.01)
11
9.07
N
IL
nil
16c
G a
uto
mat
ion
sys
tem
s U
K l
imite
d31
st M
arch
, 201
210
0.00
% (2
.97)
(1.4
0) N
IL
nil
17V
iser
ge
lim
ited
31st
Mar
ch, 2
012
100.
00%
21.
77
3.88
N
IL
nil
18c
G s
ervi
ce s
yste
ms
Fra
nce
sa
s31
st M
arch
, 201
210
0.00
% 1
.31
2.04
N
IL
nil
19c
G P
ow
er s
olu
tions
Us
a in
c31
st M
arch
, 201
210
0.00
% 2
5.77
(6
8.34
) N
IL
nil
20c
G H
old
ing
s G
erm
any
Gm
bH
31st
Mar
ch, 2
012
100.
00%
(0.0
0)(0
.02)
NIL
n
il
21c
G P
ow
er s
olu
tions
UK
lim
ited
31st
Mar
ch, 2
012
100.
00%
83.
64
4.8
7 N
IL
nil
22c
G H
old
ing
s U
sa
inc
31st
Mar
ch, 2
012
100.
00%
(24.
68)
-
NIL
n
il
23c
G P
ow
er c
oun
ty l
lc31
st M
arch
, 201
210
0.00
% (2
6.26
) (0
.19)
NIL
n
il
24c
G P
ow
er s
yste
ms
Bra
zil l
TD
a31
st M
arch
, 201
210
0.00
% (6
.75)
-
NIL
n
il
25c
G P
ow
er s
olu
tions
sau
di a
rab
ia31
st D
ecem
ber
, 201
151
.00%
(0.3
2) -
N
IL
nil
26c
G s
ales
net
wo
rks
sin
gap
ore
PT
E. l
TD
31st
Mar
ch, 2
012
100.
00%
2.6
1 -
N
IL
nil
27c
G E
nerg
y M
anag
emen
t lim
ited
31st
Mar
ch, 2
012
100.
00%
(0.7
3)(0
.80)
NIL
n
il
28c
G P
Pi a
dhe
sive
Pro
duc
ts l
imite
d31
st M
arch
, 201
281
.42%
1.5
9 13
.82
NIL
n
il
29c
G-Z
iV P
ow
er a
uto
mat
ion
so
lutio
ns l
imite
d31
st M
arch
, 201
270
.00%
(1.2
2) (0
.11)
NIL
n
il
30c
rom
pto
n G
reav
es H
old
ing
s M
aurit
ius
lim
ited
(w
.e.f
., 3r
d J
une,
201
1)31
st M
arch
, 201
210
0.00
% (0
.12)
-
NIL
n
il
31c
G in
tern
atio
nal H
old
ing
s s
ing
apo
re P
TE
lim
ited
(w
.e.f
., 6t
h Ju
ne, 2
011)
31st
Mar
ch, 2
012
100.
00%
(0.0
3) -
N
IL
nil
32c
G P
ow
er s
olu
tions
lim
ited
(w
.e.f
., 14
th M
arch
, 201
2)31
st M
arch
, 201
210
0.00
% (0
.02)
-
NIL
n
il
33c
G in
dus
tria
l Ho
ldin
gs
sw
eden
aB
31st
Mar
ch, 2
012
100.
00%
(1.4
7) -
N
IL
nil
34P
-EM
200
7 a
/s
31st
Mar
ch, 2
012
100.
00%
(1.8
2) -
N
IL
nil
35c
rom
pto
n G
reav
es H
old
ing
s s
wed
en a
B31
st M
arch
, 201
210
0.00
% 1
.37
-
NIL
n
il
36E
mo
tro
n H
old
ing
aB
31st
Mar
ch, 2
012
100.
00%
-
-
NIL
n
il
37c
G D
rives
and
aut
om
atio
n s
wed
en a
B31
st M
arch
, 201
210
0.00
% 1
5.72
-
N
IL
nil
38c
G D
rives
and
aut
om
atio
n n
ethe
rland
s B
.V.
31st
Mar
ch, 2
012
100.
00%
(0.8
8) -
NIL
nil
` cr
ore
ST
AT
EM
EN
T U
ND
ER
SE
CT
ION
212
OF
TH
E C
OM
PA
NIE
S A
CT
, 195
6
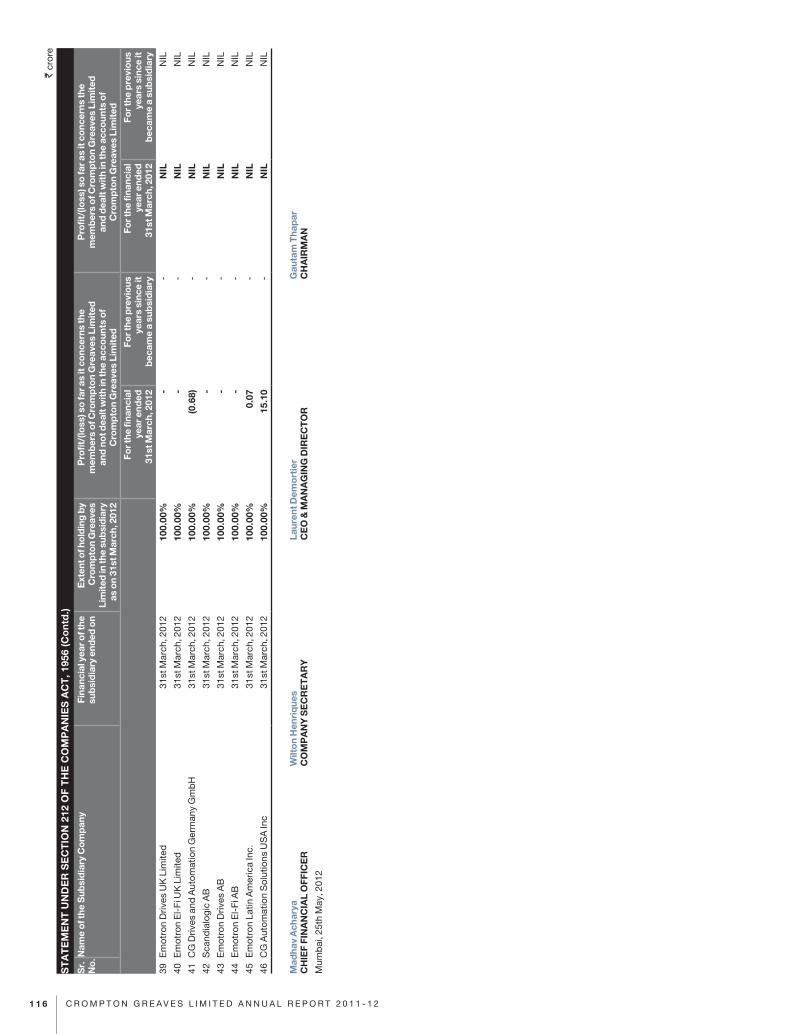
1 1 6 C R O M P T O N G R E A V E S L I M I T E D A N N U A L R E P O R T 2 0 1 1 - 1 2
Sr.
N
o.N
ame
of t
he S
ubsi
dia
ry C
om
pan
yFi
nanc
ial y
ear o
f the
su
bsi
dia
ry e
nded
on
Ext
ent o
f ho
ldin
g b
y C
rom
pto
n G
reav
es
Lim
ited
in th
e su
bsi
dia
ry
as o
n 31
st M
arch
, 201
2
Pro
fit/(
loss
) so
far a
s it
co
ncer
ns th
e
mem
ber
s o
f Cro
mp
ton
Gre
aves
Lim
ited
an
d n
ot d
ealt
wit
h in
the
acco
unts
of
Cro
mp
ton
Gre
aves
Lim
ited
Pro
fit/(
loss
) so
far a
s it
co
ncer
ns th
e
mem
ber
s o
f Cro
mp
ton
Gre
aves
Lim
ited
an
d d
ealt
wit
h in
the
acco
unts
of
Cro
mp
ton
Gre
aves
Lim
ited
For t
he fi
nanc
ial
year
end
ed
31st
Mar
ch, 2
012
For t
he p
revi
ous
ye
ars
sinc
e it
b
ecam
e a
sub
sid
iary
For t
he fi
nanc
ial
year
end
ed
31st
Mar
ch, 2
012
For t
he p
revi
ous
ye
ars
sinc
e it
b
ecam
e a
sub
sid
iary
39E
mo
tro
n D
rives
UK
lim
ited
31st
Mar
ch, 2
012
100.
00%
-
-
NIL
n
il
40E
mo
tro
n E
l-F
i UK
lim
ited
31st
Mar
ch, 2
012
100.
00%
-
-
NIL
n
il
41c
G D
rives
and
aut
om
atio
n G
erm
any
Gm
bH
31st
Mar
ch, 2
012
100.
00%
(0.6
8) -
N
IL
nil
42s
cand
ialo
gic
aB
31st
Mar
ch, 2
012
100.
00%
-
-
NIL
n
il
43E
mo
tro
n D
rives
aB
31st
Mar
ch, 2
012
100.
00%
-
-
NIL
n
il
44E
mo
tro
n E
l-F
i aB
31st
Mar
ch, 2
012
100.
00%
-
-
NIL
n
il
45E
mo
tro
n la
tin a
mer
ica
inc.
31st
Mar
ch, 2
012
100.
00%
0.0
7 -
N
IL
nil
46c
G a
uto
mat
ion
so
lutio
ns U
sa
inc
31st
Mar
ch, 2
012
100.
00%
15.
10
-
NIL
n
il
Mad
hav
Ach
arya
CH
IEF
FIN
AN
CIA
L O
FFIC
ER
Mum
bai
, 25t
h M
ay, 2
012
Wilt
on
Hen
riq
ues
CO
MP
AN
Y S
EC
RE
TA
RY
Laur
ent D
emo
rtie
r C
EO
& M
AN
AG
ING
DIR
EC
TO
RG
auta
m T
hap
arC
HA
IRM
AN
` cr
ore
ST
AT
EM
EN
T U
ND
ER
SE
CT
ION
212
OF
TH
E C
OM
PA
NIE
S A
CT
, 195
6 (C
on
td.)
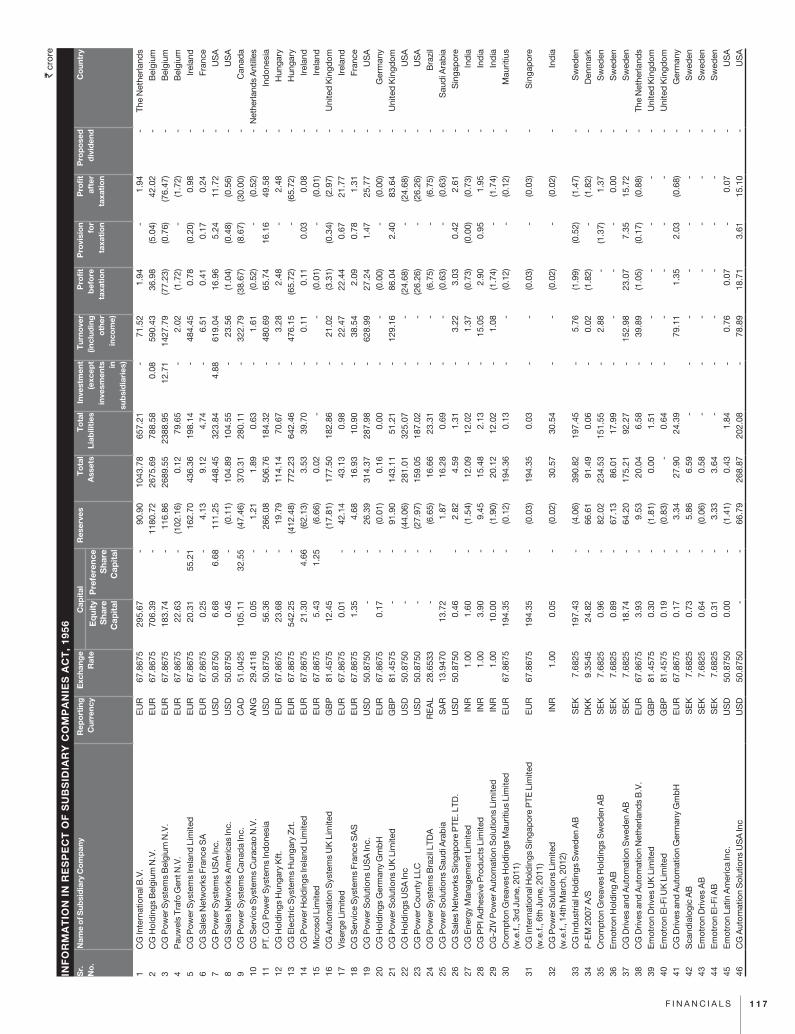
1 1 7F i n a n c i a l s
Sr.
No
.N
ame
of S
ubsi
dia
ry C
om
pan
yR
epo
rtin
gC
urre
ncy
Exc
hang
eR
ate
Cap
ital
Res
erve
sT
ota
lA
sset
sT
ota
lLi
abili
ties
Inve
stm
ent
(exc
ept
inve
smen
ts
in
sub
sid
iari
es)
Tur
nove
r(in
clud
ing
oth
erin
com
e)
Pro
fitb
efo
reta
xati
on
Pro
visi
on
for
taxa
tio
n
Pro
fitaf
ter
taxa
tio
n
Pro
po
sed
div
iden
dC
oun
try
Eq
uity
Sha
reC
apit
al
Pre
fere
nce
Sha
reC
apit
al
1c
G in
tern
atio
nal B
.V.
EU
R67
.867
529
5.67
-
90.9
010
43.7
865
7.21
-71
.52
1.94
-
1.94
-
The
net
herla
nds
2c
G H
old
ings
Bel
gium
n.V
.E
UR
67.8
675
706.
39 -
11
80.7
226
75.6
978
8.58
0.08
590.
43 3
6.98
(5
.04)
42.0
2 -
B
elgi
um
3c
G P
ower
sys
tem
s B
elgi
um n
.V.
EU
R67
.867
518
3.74
-
116.
8626
89.5
523
88.9
512
.71
1427
.79
(77.
23)
(0.7
6)(7
6.47
) -
B
elgi
um
4P
auw
els
Traf
o G
ent n
.V.
EU
R67
.867
522
.63
-
(102
.16)
0.12
79.6
5 -
2.
02(1
.72)
-
(1.7
2) -
B
elgi
um
5c
G P
ower
sys
tem
s ir
elan
d l
imite
dE
UR
67.8
675
20.3
1 5
5.21
16
2.70
436.
3619
8.14
-
484.
450.
78(0
.20)
0.98
-
irel
and
6c
G s
ales
net
wor
ks F
ranc
e s
aE
UR
67.8
675
0.25
-
4.13
9.12
4.74
-
6.51
0.41
0.17
0.24
-
Fran
ce
7c
G P
ower
sys
tem
s U
sa
inc.
Us
D50
.875
06.
68 6
.68
111.
2544
8.45
323.
84 4
.88
619.
0416
.96
5.24
11
.72
-
Us
a
8c
G s
ales
net
wor
ks a
mer
icas
inc.
Us
D50
.875
00.
45 -
(0
.11)
104.
8910
4.55
-
23.5
6(1
.04)
(0.4
8)(0
.56)
-
Us
a
9c
G P
ower
sys
tem
s c
anad
a in
c.c
aD
51.0
425
105.
11 3
2.55
(4
7.46
)37
0.31
280.
11 -
32
2.79
(38.
67)
(8.6
7)(3
0.00
) -
c
anad
a
10c
G s
ervi
ce s
yste
ms
cur
acao
n.V
.a
nG
29.4
118
0.05
-
1.21
1.89
0.63
-
1.61
(0.5
2) -
(0
.52)
-
net
herla
nds
ant
illes
11P
T. c
G P
ower
sys
tem
s in
don
esia
Us
D50
.875
056
.36
-
266.
0850
6.76
184.
32 -
48
0.69
65.7
416
.16
49.5
8 -
in
don
esia
12c
G H
old
ings
Hun
gary
Kft
.E
UR
67.8
675
23.6
8 -
19
.79
114.
1470
.67
-
3.28
2.48
-
2.48
-
Hun
gary
13c
G E
lect
ric s
yste
ms
Hun
gary
Zrt
.E
UR
67.8
675
542.
25 -
(4
12.4
8)77
2.23
642.
46 -
47
6.15
(65.
72)
-
(65.
72)
-
Hun
gary
14c
G P
ower
Hol
din
gs ir
elan
d l
imite
dE
UR
67.8
675
21.3
0 4
.66
(62.
13)
3.53
39.7
0-
0.1
1 0
.11
0.0
3 0.
08
-
irel
and
15M
icro
sol l
imite
dE
UR
67.8
675
5.43
1.25
(6.6
6)0.
02 -
-
-
(0
.01)
-
(0
.01)
-
ir
elan
d
16c
G a
utom
atio
n s
yste
ms
UK
lim
ited
GB
P81
.457
5 1
2.45
(1
7.81
)17
7.50
182.
86-
21.0
2(3
.31)
(0.3
4)(2
.97)
-
Uni
ted
Kin
gdom
17V
iser
ge l
imite
dE
UR
67.8
675
0.01
-
42.1
443
.13
0.98
-
22.4
722
.44
0.6
7 21
.77
-
irel
and
18c
G s
ervi
ce s
yste
ms
Fran
ce s
as
EU
R67
.867
51.
35 -
4.
6816
.93
10.9
0 -
38
.54
2.09
0.78
1.31
-
Fran
ce
19c
G P
ower
sol
utio
ns U
sa
inc.
Us
D50
.875
0 -
-
2
6.39
31
4.37
287.
98 -
62
8.99
27.
24
1.4
7 2
5.77
-
U
sa
20c
G H
old
ings
Ger
man
y G
mb
HE
UR
67.8
675
0.17
-
(0.0
1)0.
16 0
.00
-
-
(0.0
0) -
(0
.00)
-
Ger
man
y
21c
G P
ower
sol
utio
ns U
K l
imite
dG
BP
81.4
575
-
-
91.
90
143.
11 5
1.21
-
1
29.1
6 8
6.04
2
.40
83.
64
-
Uni
ted
Kin
gdom
22c
G H
old
ings
Us
a in
cU
sD
50.8
750
-
-
(44.
06)
281.
01 3
25.0
7 -
-
(24.
68)
- (2
4.68
) -
U
sa
23c
G P
ower
cou
nty
llc
Us
D50
.875
0 -
-
(2
7.97
)15
9.05
187
.02
-
-
(26.
26)
-
(26.
26)
-
Us
a
24c
G P
ower
sys
tem
s B
razi
l lTD
aR
Ea
l28
.653
3 -
-
(6
.65)
16.6
6 2
3.31
-
-
(6
.75)
-
(6.7
5) -
B
razi
l
25c
G P
ower
sol
utio
ns s
aud
i ara
bia
sa
R13
.947
013
.72
1.8
7 16
.28
0.6
9 -
-
(0.6
3)-
(0.6
3) -
s
aud
i ara
bia
26c
G s
ales
net
wor
ks s
inga
por
e P
TE. l
TD.
Us
D50
.875
0 0
.46
-
2.8
2 4
.59
1.3
1 -
3
.22
3.0
3 0
.42
2.61
-
s
inga
por
e
27c
G E
nerg
y M
anag
emen
t lim
ited
inR
1.00
1.60
-
(1.5
4)12
.09
12.0
2-
1.37
(0.7
3)(0
.00)
(0.7
3) -
in
dia
28c
G P
Pi a
dhe
sive
Pro
duc
ts l
imite
din
R1.
003.
90 -
9.
4515
.48
2.13
-
15.0
52.
900.
951.
95 -
in
dia
29c
G-Z
iV P
ower
aut
omat
ion
sol
utio
ns l
imite
din
R1.
0010
.00
-
(1.9
0)20
.12
12.0
2 -
1
.08
(1.7
4) -
(1
.74)
-
ind
ia
30c
rom
pto
n G
reav
es H
old
ings
Mau
ritiu
s li
mite
d
(w.e
.f., 3
rd J
une,
201
1)E
UR
67.8
675
194.
35 -
(0
.12)
194.
360.
13-
-
(0.1
2) -
(0
.12)
-
Mau
ritiu
s
31c
G in
tern
atio
nal H
old
ings
sin
gap
ore
PTE
lim
ited
(w
.e.f.
, 6th
Jun
e, 2
011)
EU
R67
.867
519
4.35
-
(0.0
3)19
4.35
0.03
- -
(0
.03)
-
(0.0
3) -
s
inga
por
e
32c
G P
ower
sol
utio
ns l
imite
d
(w.e
.f., 1
4th
Mar
ch, 2
012)
inR
1.00
0.05
-
(0.0
2)30
.57
30.5
4 -
-
(0
.02)
-
(0.0
2) -
in
dia
33c
G in
dus
tria
l Hol
din
gs s
wed
en a
Bs
EK
7.68
2519
7.43
-
(4.0
6)39
0.82
197.
45-
5.76
(1.9
9)(0
.52)
(1.4
7) -
s
wed
en
34P
-EM
200
7 a
/s
DK
K9.
3545
24.8
2 -
66
.61
91.4
90.
06-
0.02
(1.8
2) -
(1
.82)
-
Den
mar
k
35c
rom
pto
n G
reav
es H
old
ings
sw
eden
aB
sE
K7.
6825
0.96
-82
.02
234.
5315
1.55
-2.
88-
(1.3
7)1.
37
-
sw
eden
36E
mot
ron
Hol
din
g a
Bs
EK
7.68
250.
89 -
67.1
386
.01
17.9
9-
--
-0.
00
-
sw
eden
37c
G D
rives
and
aut
omat
ion
sw
eden
aB
sE
K7.
6825
18.7
4 -
64
.20
175.
2192
.27
-15
2.98
23.0
77.
3515
.72
-
sw
eden
38c
G D
rives
and
aut
omat
ion
net
herla
nds
B.V
.E
UR
67.8
675
3.93
-9.
5320
.04
6.58
-
39.8
9(1
.05)
(0.1
7)(0
.88)
-
The
net
herla
nds
39E
mot
ron
Driv
es U
K l
imite
dG
BP
81.4
575
0.30
-
(1.8
1)0.
001.
51 -
-
-
-
-
-
Uni
ted
Kin
gdom
40E
mot
ron
El-
Fi U
K l
imite
dG
BP
81.4
575
0.19
-
(0.8
3) -
0.
64 -
-
-
-
-
-
Uni
ted
Kin
gdom
41c
G D
rives
and
aut
omat
ion
Ger
man
y G
mb
HE
UR
67.8
675
0.17
-3.
3427
.90
24.3
979
.11
1.35
2.03
(0.6
8) -
G
erm
any
42s
cand
ialo
gic
aB
sE
K7.
6825
0.73
-
5.86
6.59
-
-
-
-
-
- -
s
wed
en
43E
mot
ron
Driv
es a
Bs
EK
7.68
250.
64 -
(0
.06)
0.58
-
-
-
-
-
- -
s
wed
en
44E
mot
ron
El-
Fi a
Bs
EK
7.68
250.
31 -
3.
333.
64 -
-
-
-
-
-
-
sw
eden
45E
mot
ron
latin
am
eric
a in
c.U
sD
50.8
750
0.00
-(1
.41)
0.43
1.84
-0.
760.
07-
0.07
-
U
sa
46c
G a
utom
atio
n s
olut
ions
Us
a in
cU
sD
50.8
750
-
-
66.7
926
8.87
202.
08 -
78
.89
18.7
1 3
.61
15.1
0 -
U
sa
` cr
ore
INF
OR
MA
TIO
N I
N R
ES
PE
CT
OF
SU
BS
IDIA
RY
CO
MP
AN
IES
AC
T,
19
56
Consolidated Financials
1 1 8 C R O M P T O N G R E A V E S L I M I T E D A N N U A L R E P O R T 2 0 1 1 - 1 2
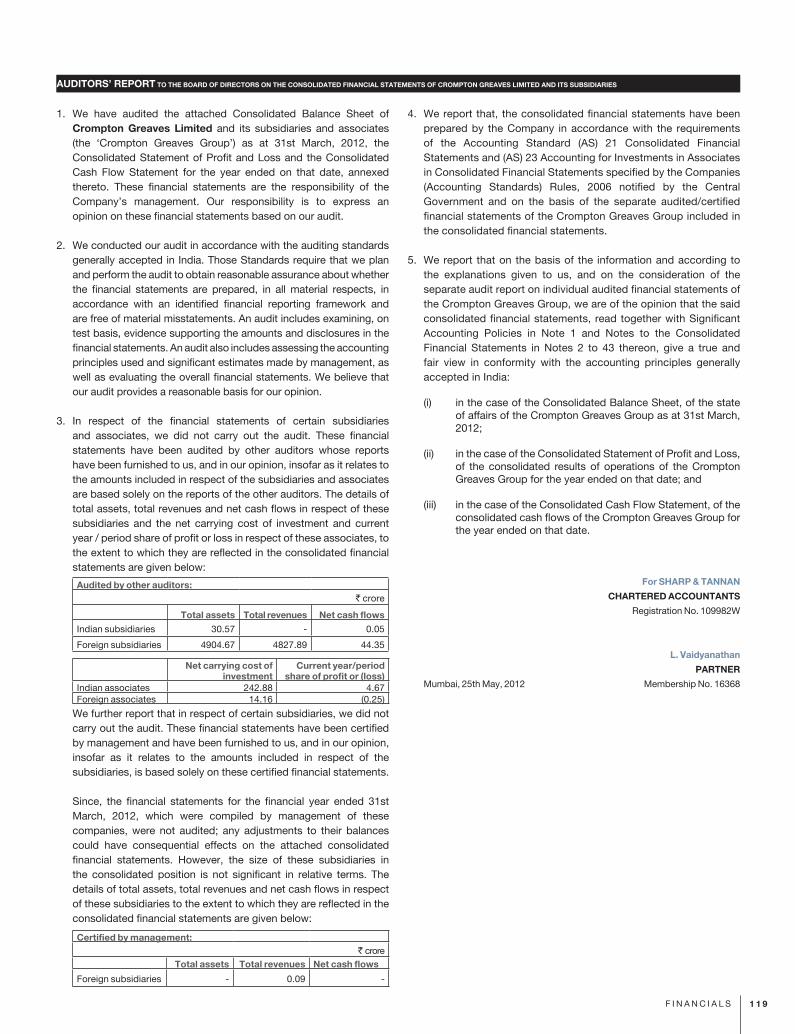
1 1 9F i n a nc i a l s
AUDITORS’ REPORT TO THE BOARD OF DIRECTORS ON THE CONSOLIDATED FINANCIAL STATEMENTS OF CROMPTON GREAVES LIMITED AND ITS SUBSIDIARIES
1. We have audited the attached consolidated Balance sheet ofCrompton Greaves Limited and its subsidiaries and associates(the ‘crompton Greaves Group’) as at 31st March, 2012, theconsolidatedstatementofProfitandlossandtheconsolidatedcash Flowstatement for the year ended on that date, annexedthereto. These financial statements are the responsibility of thecompany’s management. Our responsibility is to express anopiniononthesefinancialstatementsbasedonouraudit.
2. Weconductedourauditinaccordancewiththeauditingstandardsgenerallyacceptedinindia.Thosestandardsrequirethatweplanandperformtheaudittoobtainreasonableassuranceaboutwhetherthe financial statements are prepared, in allmaterial respects, inaccordance with an identified financial reporting framework andarefreeofmaterialmisstatements.anauditincludesexamining,ontestbasis,evidencesupportingtheamountsanddisclosuresinthefinancialstatements.anauditalsoincludesassessingtheaccountingprinciplesusedandsignificantestimatesmadebymanagement,aswellasevaluatingtheoverallfinancialstatements.Webelievethatourauditprovidesareasonablebasisforouropinion.
3. in respect of the financial statements of certain subsidiariesand associates, we did not carry out the audit. These financialstatements have been audited by other auditors whose reportshavebeenfurnishedtous,andinouropinion,insofarasitrelatestotheamountsincludedinrespectofthesubsidiariesandassociatesarebasedsolelyonthereportsoftheotherauditors.Thedetailsoftotalassets,totalrevenuesandnetcashflowsinrespectofthesesubsidiaries and the net carrying cost of investment and currentyear/periodshareofprofitorlossinrespectoftheseassociates,totheextenttowhichtheyarereflectedintheconsolidatedfinancialstatementsaregivenbelow:
Audited by other auditors:` crore
Total assets Total revenues Net cash flows
indiansubsidiaries 30.57 - 0.05
Foreignsubsidiaries 4904.67 4827.89 44.35
Net carrying cost of investment
Current year/period share of profit or (loss)
indianassociates 242.88 4.67Foreignassociates 14.16 (0.25)
Wefurtherreportthatinrespectofcertainsubsidiaries,wedidnotcarryouttheaudit.Thesefinancialstatementshavebeencertifiedbymanagementandhavebeenfurnishedtous,andinouropinion,insofar as it relates to the amounts included in respect of thesubsidiaries,isbasedsolelyonthesecertifiedfinancialstatements.
since, the financial statements for the financial year ended 31stMarch, 2012, which were compiled by management of thesecompanies,were not audited; any adjustments to their balancescould have consequential effects on the attached consolidatedfinancial statements. However, the size of these subsidiaries inthe consolidated position is not significant in relative terms. Thedetailsoftotalassets,totalrevenuesandnetcashflowsinrespectofthesesubsidiariestotheextenttowhichtheyarereflectedintheconsolidatedfinancialstatementsaregivenbelow:
Certified by management:` crore
Total assets Total revenues Net cash flows
Foreignsubsidiaries - 0.09 -
4. Wereportthat,theconsolidatedfinancialstatementshavebeenpreparedby thecompany inaccordancewith the requirementsof the accounting standard (as) 21 consolidated Financialstatementsand(as)23accountingforinvestmentsinassociatesinconsolidatedFinancialstatementsspecifiedbythecompanies(accounting standards) Rules, 2006 notified by the centralGovernment and on the basis of the separate audited/certifiedfinancialstatementsofthecromptonGreavesGroupincludedintheconsolidatedfinancialstatements.
5. Wereport thatonthebasisof the informationandaccordingtothe explanations given to us, and on the consideration of theseparateauditreportonindividualauditedfinancialstatementsofthecromptonGreavesGroup,weareoftheopinionthatthesaidconsolidatedfinancialstatements,readtogetherwithsignificantaccounting Policies in note 1 and notes to the consolidatedFinancial statements innotes 2 to 43 thereon, give a true andfair view in conformity with the accounting principles generallyacceptedinindia:
(i) inthecaseoftheconsolidatedBalancesheet,ofthestateofaffairsofthecromptonGreavesGroupasat31stMarch,2012;
(ii) inthecaseoftheconsolidatedstatementofProfitandloss,of the consolidated results of operationsof thecromptonGreavesGroupfortheyearendedonthatdate;and
(iii) inthecaseoftheconsolidatedcashFlowstatement,oftheconsolidatedcashflowsofthecromptonGreavesGroupfortheyearended onthatdate.
For SHARP & TANNAN
CHARTERED ACCOUNTANTS
Registrationno.109982W
L. Vaidyanathan
PARTNER
Mumbai,25thMay,2012 Membershipno.16368
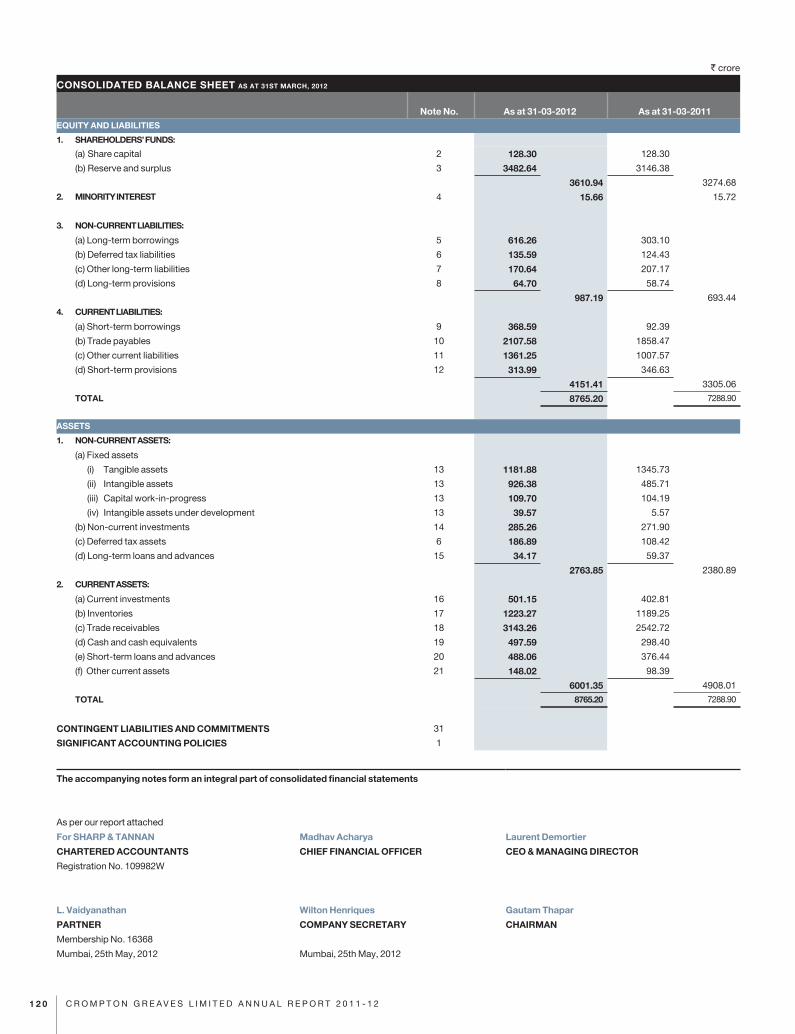
` crore
CONSOLIDATED BALANCE SHEET AS AT 31ST MARCH, 2012
1 2 0 C R O M P T O N G R E A V E S L I M I T E D A N N U A L R E P O R T 2 0 1 1 - 1 2
Note No. As at 31-03-2012 As at 31-03-2011EQUITY AND LIABILITIES
1. SHAREHOLDERS’ FUNDS:
(a)Sharecapital 2 128.30 128.30
(b)Reserveandsurplus 3 3482.64 3146.38
3610.94 3274.68
2. MINORITY INTEREST 4 15.66 15.72
3. NON-CURRENT LIABILITIES:
(a)Long-termborrowings 5 616.26 303.10
(b)Deferredtaxliabilities 6 135.59 124.43
(c)Otherlong-termliabilities 7 170.64 207.17
(d)Long-termprovisions 8 64.70 58.74
987.19 693.44
4. CURRENT LIABILITIES:
(a)Short-termborrowings 9 368.59 92.39
(b)Tradepayables 10 2107.58 1858.47
(c)Othercurrentliabilities 11 1361.25 1007.57
(d)Short-termprovisions 12 313.99 346.63
4151.41 3305.06
TOTAL 8765.20 7288.90
ASSETS
1. NON-CURRENT ASSETS:
(a)Fixedassets
(i) Tangibleassets 13 1181.88 1345.73
(ii) Intangibleassets 13 926.38 485.71
(iii) Capitalwork-in-progress 13 109.70 104.19
(iv)Intangibleassetsunderdevelopment 13 39.57 5.57
(b)Non-currentinvestments 14 285.26 271.90
(c)Deferredtaxassets 6 186.89 108.42
(d)Long-termloansandadvances 15 34.17 59.37
2763.85 2380.89
2. CURRENT ASSETS:
(a)Currentinvestments 16 501.15 402.81
(b)Inventories 17 1223.27 1189.25
(c)Tradereceivables 18 3143.26 2542.72
(d)Cashandcashequivalents 19 497.59 298.40
(e)Short-termloansandadvances 20 488.06 376.44
(f)Othercurrentassets 21 148.02 98.39
6001.35 4908.01
TOTAL 8765.20 7288.90
CONTINGENT LIABILITIES AND COMMITMENTS 31
SIGNIFICANT ACCOUNTING POLICIES 1
The accompanying notes form an integral part of consolidated financial statements
Asperourreportattached
For SHARP & TANNAN Madhav Acharya Laurent Demortier
CHARTERED ACCOUNTANTS CHIEF FINANCIAL OFFICER CEO & MANAGING DIRECTOR
RegistrationNo.109982W
L. Vaidyanathan Wilton Henriques Gautam Thapar
PARTNER COMPANY SECRETARY CHAIRMAN
MembershipNo.16368
Mumbai,25thMay,2012 Mumbai,25thMay,2012
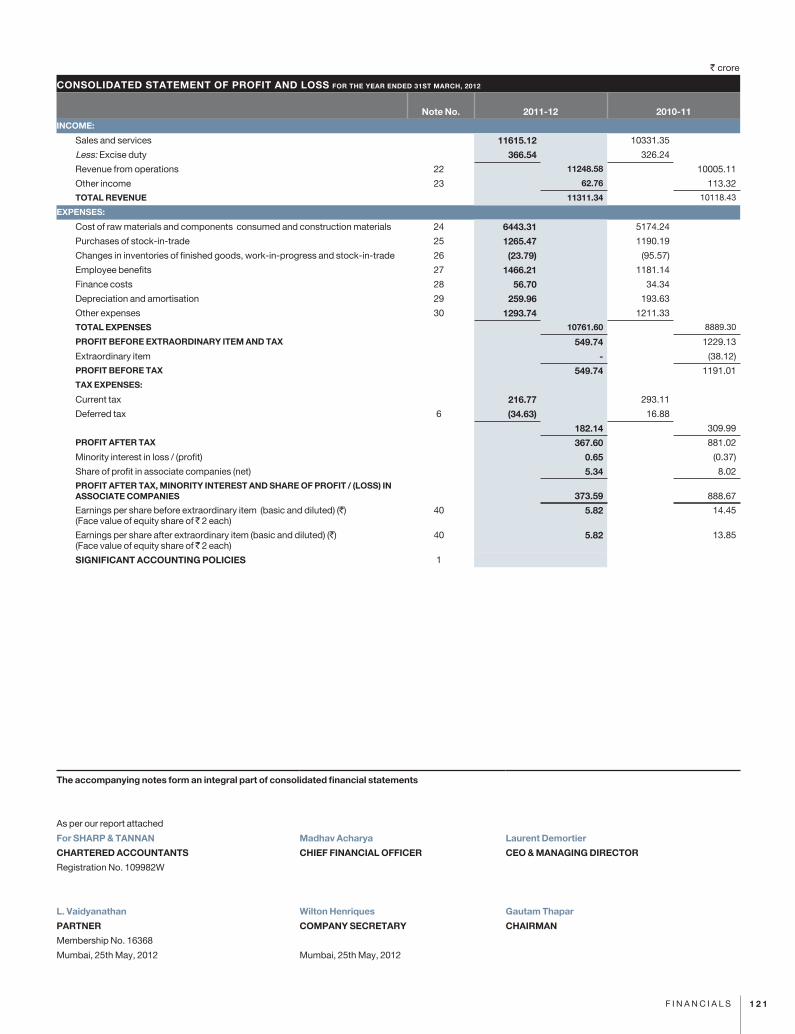
` crore
CONSOLIDATED STATEMENT OF PROFIT AND LOSS FOR THE YEAR ENDED 31ST MARCH, 2012
1 2 1F I N A NC I A L S
Note No. 2011-12 2010-11INCOME:
Salesandservices 11615.12 10331.35
Less:Exciseduty 366.54 326.24
Revenuefromoperations 22 11248.58 10005.11
Otherincome 23 62.76 113.32
TOTAL REVENUE 11311.34 10118.43
EXPENSES:
Costofrawmaterialsandcomponentsconsumedandconstructionmaterials 24 6443.31 5174.24
Purchasesofstock-in-trade 25 1265.47 1190.19
Changesininventoriesoffinishedgoods,work-in-progressandstock-in-trade 26 (23.79) (95.57)
Employeebenefits 27 1466.21 1181.14
Financecosts 28 56.70 34.34
Depreciationandamortisation 29 259.96 193.63
Otherexpenses 30 1293.74 1211.33
TOTAL EXPENSES 10761.60 8889.30
PROFIT BEFORE EXTRAORDINARY ITEM AND TAX 549.74 1229.13
Extraordinaryitem - (38.12)
PROFIT BEFORE TAX 549.74 1191.01
TAX EXPENSES:
Currenttax 216.77 293.11
Deferredtax 6 (34.63) 16.88
182.14 309.99
PROFIT AFTER TAX 367.60 881.02
Minorityinterestinloss/(profit) 0.65 (0.37)
Shareofprofitinassociatecompanies(net) 5.34 8.02
PROFIT AFTER TAX, MINORITY INTEREST AND SHARE OF PROFIT / (LOSS) IN ASSOCIATE COMPANIES 373.59 888.67
Earningspersharebeforeextraordinaryitem(basicanddiluted)(`)(Facevalueofequityshareof 2each)
40 5.82 14.45
Earningspershareafterextraordinaryitem(basicanddiluted)(`)(Facevalueofequityshareof 2each)
40 5.82 13.85
SIGNIFICANT ACCOUNTING POLICIES 1
The accompanying notes form an integral part of consolidated financial statements
Asperourreportattached
For SHARP & TANNAN Madhav Acharya Laurent Demortier
CHARTERED ACCOUNTANTS CHIEF FINANCIAL OFFICER CEO & MANAGING DIRECTOR
RegistrationNo.109982W
L. Vaidyanathan Wilton Henriques Gautam Thapar
PARTNER COMPANY SECRETARY CHAIRMAN
MembershipNo.16368
Mumbai,25thMay,2012 Mumbai,25thMay,2012
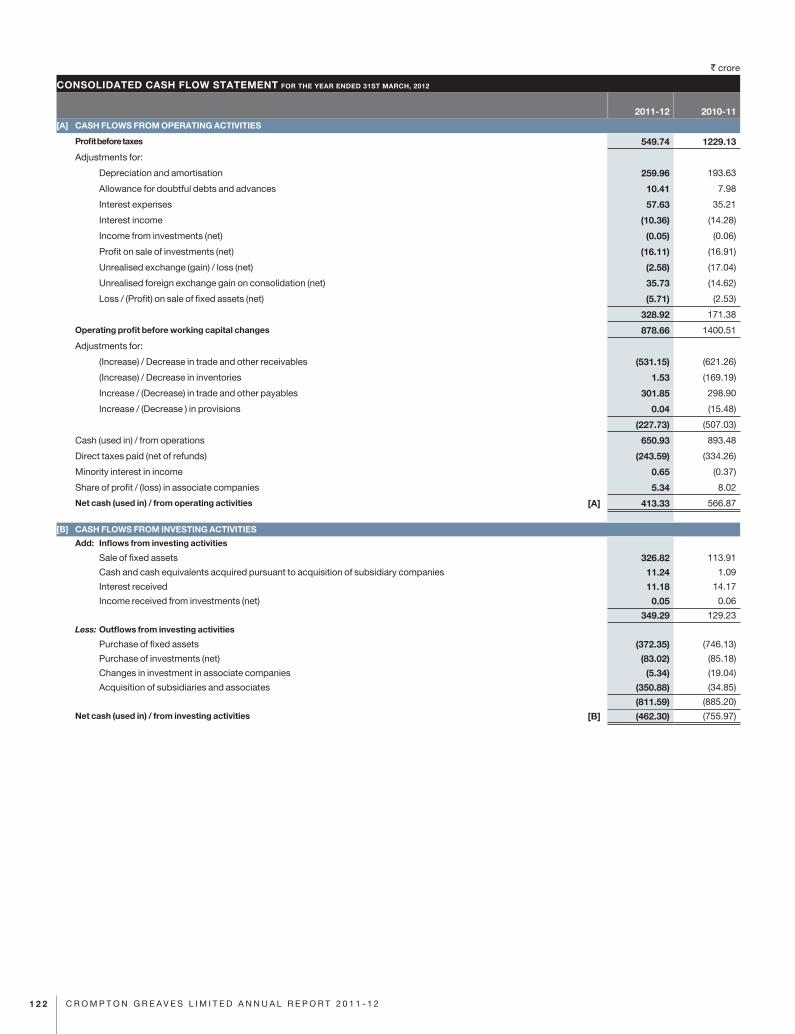
1 2 2 C R O M P T O N G R E A V E S L I M I T E D A N N U A L R E P O R T 2 0 1 1 - 1 2
` crore
CONSOLIDATED CASH FLOW STATEMENT FOR THE YEAR ENDED 31ST MARCH, 2012
2011-12 2010-11[A] CASH FLOWS FROM OPERATING ACTIVITIES
Profit before taxes 549.74 1229.13
Adjustmentsfor:
Depreciationandamortisation 259.96 193.63
Allowancefordoubtfuldebtsandadvances 10.41 7.98
Interestexpenses 57.63 35.21
Interestincome (10.36) (14.28)
Incomefrominvestments(net) (0.05) (0.06)
Profitonsaleofinvestments(net) (16.11) (16.91)
Unrealisedexchange(gain)/loss(net) (2.58) (17.04)
Unrealisedforeignexchangegainonconsolidation(net) 35.73 (14.62)
Loss/(Profit)onsaleoffixedassets(net) (5.71) (2.53)
328.92 171.38
Operating profit before working capital changes 878.66 1400.51
Adjustmentsfor:
(Increase)/Decreaseintradeandotherreceivables (531.15) (621.26)
(Increase)/Decreaseininventories 1.53 (169.19)
Increase/(Decrease)intradeandotherpayables 301.85 298.90
Increase/(Decrease)inprovisions 0.04 (15.48)
(227.73) (507.03)
Cash(usedin)/fromoperations 650.93 893.48
Directtaxespaid(netofrefunds) (243.59) (334.26)
Minorityinterestinincome 0.65 (0.37)
Shareofprofit/(loss)inassociatecompanies 5.34 8.02
Net cash (used in) / from operating activities [A] 413.33 566.87
[B] CASH FLOWS FROM INVESTING ACTIVITIES
Add: Inflows from investing activities
Saleoffixedassets 326.82 113.91
Cashandcashequivalentsacquiredpursuanttoacquisitionofsubsidiarycompanies 11.24 1.09
Interestreceived 11.18 14.17
Incomereceivedfrominvestments(net) 0.05 0.06
349.29 129.23
Less: Outflows from investing activities
Purchaseoffixedassets (372.35) (746.13)
Purchaseofinvestments(net) (83.02) (85.18)
Changesininvestmentinassociatecompanies (5.34) (19.04)
Acquisitionofsubsidiariesandassociates (350.88) (34.85)
(811.59) (885.20)
Net cash (used in) / from investing activities [B] (462.30) (755.97)
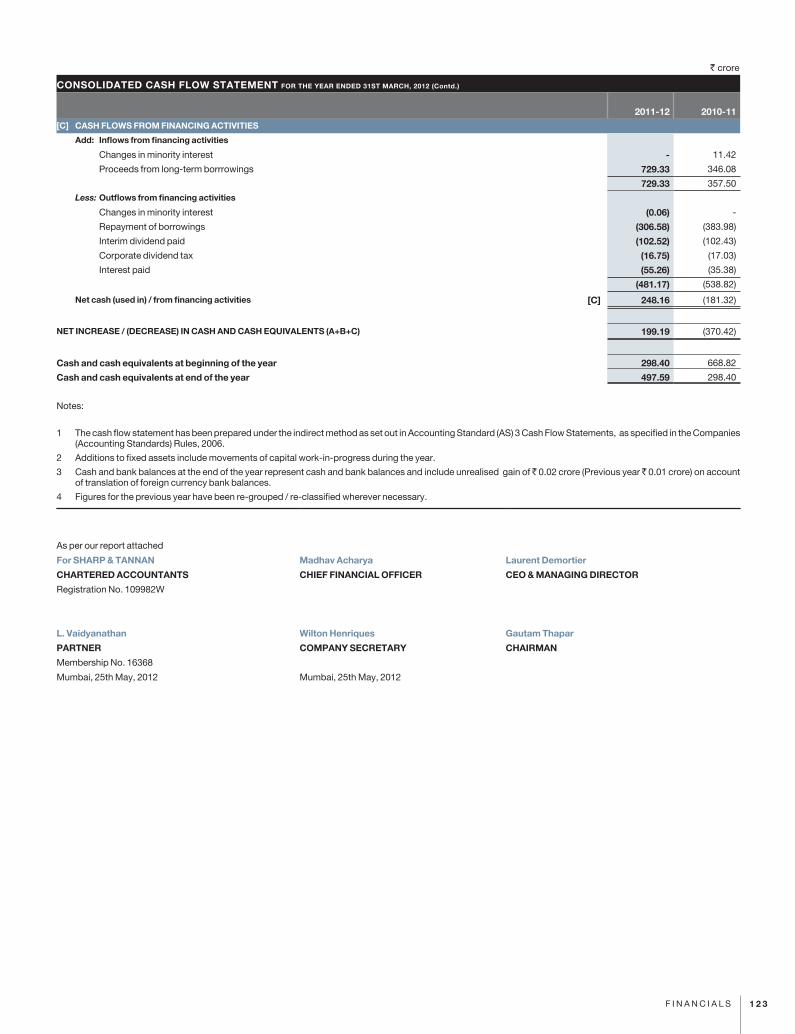
1 2 3F I N A NC I A L S
` crore
CONSOLIDATED CASH FLOW STATEMENT FOR THE YEAR ENDED 31ST MARCH, 2012 (Contd.)
2011-12 2010-11[C] CASH FLOWS FROM FINANCING ACTIVITIES
Add: Inflows from financing activities
Changesinminorityinterest - 11.42
Proceedsfromlong-termborrrowings 729.33 346.08
729.33 357.50
Less: Outflows from financing activities
Changesinminorityinterest (0.06) -
Repaymentofborrowings (306.58) (383.98)
Interimdividendpaid (102.52) (102.43)
Corporatedividendtax (16.75) (17.03)
Interestpaid (55.26) (35.38)
(481.17) (538.82)
Net cash (used in) / from financing activities [C] 248.16 (181.32)
NET INCREASE / (DECREASE) IN CASH AND CASH EQUIVALENTS (A+B+C) 199.19 (370.42)
Cash and cash equivalents at beginning of the year 298.40 668.82
Cash and cash equivalents at end of the year 497.59 298.40
Notes:
1 ThecashflowstatementhasbeenpreparedundertheindirectmethodassetoutinAccountingStandard(AS)3CashFlowStatements,asspecifiedintheCompanies(AccountingStandards)Rules,2006.
2 Additionstofixedassetsincludemovementsofcapitalwork-in-progressduringtheyear.
3 Cashandbankbalancesattheendoftheyearrepresentcashandbankbalancesandincludeunrealisedgainof 0.02crore(Previousyear 0.01crore)onaccountoftranslationofforeigncurrencybankbalances.
4 Figuresforthepreviousyearhavebeenre-grouped/re-classifiedwherevernecessary.
Asperourreportattached
For SHARP & TANNAN Madhav Acharya Laurent Demortier
CHARTERED ACCOUNTANTS CHIEF FINANCIAL OFFICER CEO & MANAGING DIRECTOR
RegistrationNo.109982W
L. Vaidyanathan Wilton Henriques Gautam Thapar
PARTNER COMPANY SECRETARY CHAIRMAN
MembershipNo.16368
Mumbai,25thMay,2012 Mumbai,25thMay,2012
NOTES ACCOMPANYING TO THE CONSOLIDATED FINANCIAL STATEMENTS
1 2 4 C R O M P T O N G R E A V E S L I M I T E D A N N U A L R E P O R T 2 0 1 1 - 1 2
1. Basisofaccounting
TheconsolidatedfinancialstatementsrelatetoCromptonGreavesLimited(theParentCompany),itssubsidiarycompaniesandassociates.TheParentCompanywithitssubsidiariesandassociatesconstitutetheGroup.
(a) ThefinancialstatementsofthesubsidiarycompaniesusedintheconsolidationaredrawnuptothesamereportingdateasthatoftheParentCompany,i.e.,yearended31stMarch,2012.
(b) TheGroupmaintainsitsaccountsonaccrualbasisfollowingthehistoricalcostconvention,exceptfortherevaluationofcertainfixedassets,inaccordancewiththeGenerallyAcceptedAccountingPrinciples(GAAP)andincompliancewiththeAccountingStandardsspecifiedintheCompanies(AccountingStandards)Rules,2006(asamended).However,certainescalationandotherclaimsareaccountedfor intermsofcontractswiththecustomers/admittedbytheappropriateauthorities.
(c) Thefinancialstatementsofall IndiansubsidiariesandassociatesarepreparedincompliancewiththeAccountingStandardsspecifiedintheCompanies(AccountingStandards)Rules,2006(asamended)andotherprovisionsoftheCompaniesAct,1956andthoseoftheforeignsubsidiariesandassociates,havebeenpreparedincompliancewiththelocallawsandapplicableaccountingstandards.
2. Useofestimates
The preparation of financial statements in conformitywithGAAP requires that themanagement of the Companymakes estimates andassumptionsthataffectthereportedamountsofincomeandexpensesoftheperiod,thereportedbalancesofassetsandliabilitiesandthedisclosuresrelatingtocontingentliabilitiesandcommitmentsasofthedateofthefinancialstatements.Examplesofsuchestimatesincludetheusefullifeoftangibleandintangiblefixedassets,allowancefordoubtfuldebts/advances,futureobligationsinrespectofretirementbenefitplans,etc.Difference,ifany,betweentheactualresultsandestimatesisrecognisedintheperiodinwhichtheresultsareknown.
3. Principlesofconsolidation
(a) ThefinancialstatementsoftheParentCompanyanditssubsidiarieshavebeenconsolidatedonalinebylinebasisbyaddingtogetherthebookvaluesoflikeitemsofassets,liabilities,incomesandexpensesaftereliminatingintra-groupbalances,intra-grouptransactionsandunrealisedprofitsresultingtherefromandarepresentedtotheextentpossible,inthesamemannerastheCompany’sindependentfinancialstatements.
(b) ThefinancialstatementsoftheParentCompanyanditssubsidiarieshavebeenconsolidatedusinguniformaccountingpoliciesforliketransactionsandothereventsinsimilarcircumstances.
(c) TheexcessofcosttotheParentCompanyofitsinvestmentineachofthesubsidiariesoveritsshareofequityintherespectivesubsidiary,ontheacquisitiondate,isrecognisedintheconsolidatedfinancialstatementsas‘goodwillonconsolidation’andcarriedinthebalancesheetasanasset.Wheretheshareofequityinthesubsidiarycompaniesasonthedateofinvestment,isinexcessofcostofinvestmentof thecompany, it is recognisedas ‘capital reserve’ and shownunder theheadReservesandSurplus, in theconsolidated financialstatements.
(d)Minorityinterestinthenetassetsofconsolidatedsubsidiariesconsistsoftheamountofequityattributabletotheminorityshareholdersatthedatesonwhichinvestmentsaremadebythecompanyinthesubsidiarycompaniesandfurthermovementsintheirshareintheequity,subsequenttothedatesofinvestments.
(e) Investments inassociatecompanieshavebeenaccountedunder theequitymethodasperAccountingStandard (AS)23Accountingfor Investments inAssociates inConsolidatedFinancialStatements.Under theequitymethodofaccounting, the investment is initiallyrecordedatcost,identifyinganygoodwill/capitalreservearisingatthetimeofacquisition.Thecarryingamountofinvestmentisadjustedthereafterforthepostacquisitionchangeintheinvestor’sshareofnetassetsoftheinvestee.Theconsolidatedstatementofprofitandlossreflectstheinvestor’sshareoftheresultsoftheoperationsoftheinvestee.
4. Fixedassets
(a) Fixedassetsarestatedatcostnetoftax/dutycreditavailed,ifany,exceptforlandandbuildingsaddedpriorto30thJune,1985whicharestatedatrevaluedcostasatthatdatebasedonthereportoftechnicalexpertlessaccumulateddepreciationandamortisation.
(b) Fixedassetsareeliminatedfromfinancialstatements,eitherondisposalorwhenretiredfromactiveuse.Theretiredassetsaredisposedoffimmediately.
(c) Administrativeandothergeneral overheadexpenses that are specifically attributable toconstructionor acquisitionof fixedassetsorbringingthefixedassetstoworkingconditionareallocatedandcapitalisedasapartofthefixedassets.
(d)Pre-operativeexpenses,includinginterestonborrowingsuptothedateofcommercialoperations,aretreatedaspartoftheprojectcostandcapitalised.
(e) Internallymanufactured/constructedfixedassetsarecapitalisedatfactorycost,includingexciseduty,whereapplicable.
(f) Capitalwork-in-progressincludescostoffixedassetsunderinstallation/underdevelopmentasatthebalancesheetdate.
(g) Capitalexpenditureonresearchanddevelopmentisclassifiedundertangibleassetsanddepreciatedonthesamebasisasotherfixedassets.
1. SIGNIFICANTACCOUNTINGPOLICIES
1 2 5F I n A nC I A L S
NOTESACCOMPANYINGTOTHECONSOLIDATEDFINANCIALSTATEMENTS(Contd. )
5. Impairmentofassets
Asateachbalancesheetdate,thecarryingamountofassetsistestedforimpairmentsoastodetermine:
(a)theprovisionforimpairmentloss,ifany;and
(b)thereversalofimpairmentlossrecognisedinpreviousperiods,ifany.
Impairmentlossisrecognisedwhenthecarryingamountofanassetexceedsitsrecoverableamount.
Recoverableamountisdetermined:
(a)inthecaseofanindividualasset,atthehigherofthenetsellingpriceandthevalueinuse;and
(b)inthecaseofacashgeneratingunit(agroupofassetsthatgeneratesidentified,independentcashflows),atthehigherofthecashgeneratingunit’snetsellingpriceandthevalueinuse.
(Valueinuseisdeterminedasthepresentvalueofestimatedfuturecashflowsfromthecontinuinguseofanassetandfromitsdisposalattheendofitsusefullife.)
6. Intangibleassetsandamortisation
Intangibleassetsare recognisedwhen it isprobable that the futureeconomicbenefits thatareattributable to theassetswill flow to theCompanyandthecostoftheassetcanbemeasuredreliably.
Intangibleassetsareamortisedasfollows:
(a) Goodwill :Overaperiodoftenyears;
(b)Specialisedsoftware :Overaperiodoffiveyears;
(c) Technicalknow-how :Overaperiodoffiveyearsfromthedateofcommercialproduction;
(d)Commercialrights :Overaperiodoftenyears;
(e) Brandnameandcustomerlists :Overaperiodoftenyears;
(f) Otherintangibleassets :Overaperiodoffiveyears;and
(g) Developmentcosts:
(1) Revenueexpenditureonresearchisexpensedunderrespectiveheadsofaccountintheperiodinwhichitisincurred.
(2) Developmentexpenditureonnewproductiscapitalisedasintangibleasset,ifallofthefollowingcanbedemonstrated:
(a) thetechnicalfeasibilityofcompletingtheintangibleassetsothatitwillbeavailableforuseorsale;
(b) theCompanyhasintentiontocompletetheintangibleassetanduseorsellit;
(c) theCompanyhasabilitytouseorselltheintangibleasset;
(d) themannerinwhichtheprobablefutureeconomicbenefitwillbegeneratedincludingtheexistenceofamarketforoutputoftheintangibleassetorintangibleassetitselforifitistobeusedinternally,theusefulnessoftheintangibleasset;
(e) theavailabilityofadequatetechnical,financialandotherresourcestocompletethedevelopmentandtouseorselltheintangibleasset;and
(f) theCompanyhasabilitytomeasuretheexpenditureattributabletotheintangibleassetsduringdevelopmentreliably.
Thedevelopmentexpenditurecapitalisedasintangibleassetisamortisedoverit’saperiodoffiveyears.
Otherdevelopmentcoststhatdonotmeetabovecriteriaareexpensedintheperiodinwhichtheyareincurred.
7. Investments
Eachcategory/itemofinvestmentisvaluedasfollows:
(a) Long-terminvestmentsarecarriedatcost,afterprovidingforanydiminutioninvalue,ifsuchdiminutionisotherthantemporaryinnature.
(b)Currentinvestmentsarecarriedatthelowerofcostandfairvalue.
Thedeterminationofcarryingamountofsuchinvestmentsisdoneonthebasisofweightedaveragecostofeachindividualinvestment.
1. SIGNIFICANTACCOUNTINGPOLICIES(Contd.)
1 2 6 C R O M P T O N G R E A V E S L I M I T E D A N N U A L R E P O R T 2 0 1 1 - 1 2
NOTESACCOMPANYINGTOTHECONSOLIDATEDFINANCIALSTATEMENTS(Contd. )
8. Inventories
Inventoriesarevaluedafterprovidingforobsolescenceasunder
(a) Rawmaterials,packingmaterials,constructionmaterials,storesandspares:
: At lower of cost, on weighted average basis and netrealisablevalue.
(b)Work-in-progress-Manufacturing : Atlowerofcostofmaterial,plusappropriateproductionoverheadsandnetrealisablevalue.
(c) Finishedgoods-Manufacturing : Atlowerofcostofmaterialplusappropriateproductionoverheads,includingexcisedutypaid/payableonsuchgoodsandnetrealisablevalue.
(d) Finishedgoods-Trading : At lower of cost, on weighted average basis and netrealisablevalue.
9. Cashandcashequivalents
(a) Cashcomprisescashonhandanddemanddepositswithbank.
(b)Cashequivalentsareshort-term,highlyliquidinvestmentthatarereadilyconvertibleintoknownamountsofcashandwhicharesubjecttoaninsignificantriskofchangesinvalue.
10.Foreigncurrencytransactions
(a) ThereportingcurrencyisIndianRupee.
(b) Foreigncurrency transactionsare recordedon initial recognition in thereportingcurrency,usingtheexchangerateat thedateof thetransaction.Ateachbalancesheetdate,foreigncurrencymonetaryitemsarereportedusingtheclosingrate.non-monetaryitemswhicharecarriedathistoricalcostdenominatedinaforeigncurrencyarereportedusingtheexchangerateatthedateofthetransaction.
(c) Exchangedifferencesthatariseonsettlementofmonetaryitemsoronreportingateachbalancesheetdateofthecompany’smonetaryitemsattheclosingratearerecognisedasincomeorexpensesintheperiodinwhichtheyarise.
(d) Financialstatementsofforeignoperationsaretreatedasintegraloperationsandtranslatedasinthesamemannerasforeigncurrencytransactions,asdescribedabove.Exchangedifferencesarisingonsuchtranslationsarerecognizedasincomeorexpensesoftheperiodinwhichtheyarise.
(e) Financialstatementsofforeignsubsidiariesaretreatedasnon-integraloperations,theirfinancialstatementsaretranslatedatthefollowingexchangerates:
(1) Sharecapital :Attheoriginalratewhenthecapitalwasinfused
(2) Fixedassets :Exchangerateprevailingattheendoftheyear
(3) Currentassetsandcurrentliabilities :Exchangerateprevailingattheendoftheyear
(4) Revenuesandexpenses :Attheaveragerateduringtheyear.
Theresultantexchangedifferenceisaccountedasforeigncurrencytranslationreserveuntilthedisposalofthenetinvestment.
11.Derivativecontracts
(a) Derivativecontractsenteredinto,tohedgeforeigncurrency/pricerisksonunexecutedfirmcommitmentsandhighlyprobableforecasttransactions,arerecognisedinthefinancialstatementsatfairvalueasonthebalancesheetdate.Thegainsorlossesarisingoutoffairvaluationofderivativecontractsarerecognisedinthestatementofprofitandlossorbalancesheet,asthecasemaybe,afterapplyingthetestofhedgeeffectiveness.Thegainsorlossesarerecognisedashedgereserveinthebalancesheetwhenthehedgeiseffectiveandwherethehedgeisineffectivethesameisrecognisedinthestatementofprofitandloss.
(b) Thepremiumordiscountonforwardcontractsisamortisedasexpenseorincomeovertheperiodofthecontract.
(c) Gainsandlossesonrolloverorcancellationofderivativecontractswhichqualifyaseffectivehedgearerecognisedinthestatementofprofitandlossinthesameperiodinwhichthehedgeditemisaccounted.
1. SIGNIFICANTACCOUNTINGPOLICIES
NOTES ACCOMPANYING TO THE CONSOLIDATED FINANCIAL STATEMENTS (Contd. )
1 2 7F I n A nC I A L S
12.Revenuerecognition
(a) Revenuefromsaleofgoodsisrecognised,whenallthesignificantrisksandrewardsofownershiparetransferredtothebuyer,underthetermsofcontractandnosignificantuncertaintyexistsregardingtheamountoftheconsiderationthatwillbederivedfromthesaleofthegoods.Salesincludeexcisedutyandpricevariationandexcludevalueaddedtax/salestax,brokerageandcommission.
(b)Serviceincomeisrecognisedasperthetermsofthecontractswiththecustomersonproportionatecompletionmethod.
(c) Revenue from contracts is recognised by applying percentage of completion method after providing for foreseeable losses, if any.Percentageof completion isdeterminedasaproportionof thecosts incurredupto the reportingdate to the total estimatedcost tocomplete.Foreseeableloss,ifany,onthecontractsisrecognisedasanexpenseintheperiodinwhichitisforeseen,irrespectiveofthestageofcompletionofthecontract.Whiledeterminingtheamountofforeseeableloss,allelementsofcostsandrelatedincidentalincomenotincludedincontractrevenueistakenintoconsideration.Contractisreflectedatcosttillsuchtimetheoutcomeofthecontractcannotbeascertainedreliablyandatrealisablevaluethereafter.
(d) Interestincomeondeposits,securitiesandloansisrecognisedattheagreedrateontimeproportionbasis.
(e) Dividendincomeisaccountedforwhentherighttoreceivethesameisestablished.
(f) Otheritemsofincomeareaccountedasandwhentherighttoreceivearises.
13.Employeebenefits
Employeebenefits includingcontributionstowardssocialsecurity, retirementbenefitschemesareaccounted forbasedontheregulatoryframeworkintherespectivecountriesandemploymentrules/contractsapplicabletothespecificcompanies.
14.Depreciation
(a) IndianCompanies
(1) Ownedassets
(a) Revaluedassets
Depreciation onBuilding of ParentCompany is provided on straight linemethod on the values and at the rates specified inScheduleXIVtotheCompaniesAct,1956.Thedifferencebetweendepreciationprovidedonrevaluedamountandonhistoricalcostisrecoupedoutofrevalutionreserve.
(b) Assetscarriedathistoricalcost
DepreciationonthefixedassetscarriedathistoricalcostisprovidedattheratesandinthemannerspecifiedinScheduleXIVtotheCompaniesAct,1956,onwrittendownvaluemethodotherthanonbuildingsandplantandequipmentswhicharedepreciatedonstraightlinemethod.
(2) Leasedassets
(a) Leaseholdlandareamortisedovertheperiodoflease.
(b) BuildingsconstructedonleaseholdlandaredepreciatedatnormalrateasprescribedinScheduleXIVtotheCompaniesAct,1956,wheretheleaseperiodoflandisbeyondthelifeofthebuilding.
(c) Inothercases,buildingsconstructedonleaseholdlandareamortisedovertheleaseperiodoftheland.
(b) ForeignCompanies
(a) Depreciationonfixedassetshasbeenprovidedattheratesrequired/permissiblebytheGAAPsoftherespectivecountries.However,thedepreciationratesarehigherthantheratesspecifiedintheScheduleXIVtotheCompaniesAct,1956.
(b) Vehiclesacquiredonfinanceleasesaredepreciatedovertheperiodofleaseagreementortheusefullife,whicheverisshorter.
15.Borrowingcosts
(a) Borrowingcosts thatareattributable to theacquisition,constructionorproductionofaqualifyingassetarecapitalisedaspartof thecostofsuchassettillsuchtimeastheassetisreadyforitsintendeduseorsale.Aqualifyingassetisanassetthatnecessarilyrequiresasubstantialperiodoftime(generallyovertwelvemonths)togetreadyforitsintendeduseorsale.
(b)Allotherborrowingcostsarerecognisedasexpenseintheperiodinwhichtheyareincurred.
1. SIGNIFICANTACCOUNTINGPOLICIES(Contd.)
NOTES ACCOMPANYING TO THE CONSOLIDATED FINANCIAL STATEMENTS
1 2 8 C R O M P T O N G R E A V E S L I M I T E D A N N U A L R E P O R T 2 0 1 1 - 1 2
16.Segmentaccounting
(a) Segmentaccountingpolicies
SegmentaccountingpoliciesareinlinewiththeaccountingpoliciesoftheCompany.Inaddition,thefollowingspecificaccountingpolicieshavebeenfollowedforsegmentreporting:
(1) Segmentrevenueincludessalesandotherincomedirectlyidentifiablewith/allocabletothesegmentincludinginter-segmentrevenue.
(2) Expensesthataredirectlyidentifiablewith/allocabletosegmentsareconsideredfordeterminingthesegmentresult.ExpenseswhichrelatetotheCompanyasawholeandnotallocabletosegmentsareincludedunderunallocableexpenditure.
(3) IncomewhichrelatestotheCompanyasawholeandnotallocabletosegmentsisincludedinunallocableincome.
(4) Segmentresultincludesmarginsoninter-segmentandsaleswhicharereducedinarrivingattheprofitbeforetaxofthecompany.
(5) Segment assets and liabilities include those directly identifiable with the respective segments. Unallocable assets and liabilitiesrepresenttheassetsandliabilitiesthatrelatetothecompanyasawholeandnotallocabletoanysegment.
(b) Inter-segmenttransferpricing
Segmentrevenueresultingfromtransactionswithotherbusinesssegmentsisaccountedonthebasisoftransferpriceagreedbetweenthesegments.Suchtransferpricesareeitherdeterminedtoyieldadesiredmarginoragreedonanegotiatedbasis.
17.Leases
(a) AssetsacquiredunderleaseswheretheGrouphassubstantiallyalltherisksandrewardsofownershipareclassifiedasfinanceleases.Suchassetsarecapitalisedattheinceptionoftheleaseatthelowerofthefairvalueandthepresentvalueofminimumleasepaymentsandtheliabilityiscreatedforanequivalentamount.Eachleaserentalpaidisallocatedbetweentheliabilityandtheinterestcost,soastoobtainaconstantperiodicrateofinterestontheoutstandingliabilityforeachperiod.
(b)Assets acquiredon leaseswhere a significantportionof the risks and rewardsof ownership are retainedby lessor are classifiedasoperatingleases.Leaserentalsarechargedtotheprofitandlossaccountonaccrualbasis.
18.Taxesonincome
(a) Taxonincomeforthecurrentperiodisdeterminedonthebasisofestimatedtaxableincomeandtaxcreditscomputedinaccordancewiththeprovisionsofrelevanttaxlawsandbasedontheexpectedoutcomeofassessments/appeals.
(b)Deferredtaxisrecognisedontimingdifferencesbetweentheaccountedincomeandthetaxableincomefortheyearandquantifiedusingthetaxratesandtaxlawsenactedorsubstantivelyenactedasonthebalancesheetdate.
(c) Deferredtaxassetsrelatingtounabsorbeddepreciation/businesslossesarerecongnisedandcarriedforwardtotheextentthereisvirtualcertaintythatsufficientfuturetaxableincomewillbeavailableagainstwhichsuchdeferredtaxassetscanberealised.
(d)Otherdeferredtaxassetsarerecognisedandcarriedforwardtotheextentthatthereisareasonablecertaintythatsufficientfuturetaxableincomewillbeavailableagainstwhichsuchdeferredtaxassetscanberealised.
(e) Thebreak-upofthemajorcomponentsofthedeferredtaxassetsandliabilitiesasatbalancesheetdatehasbeenarrivedataftersettingoffdeferredtaxassetsandliabilitieswheretherespectivecompanieshavealegallyenforceablerighttoset-offassetsagainstliabilitiesandwheresuchassetsandliabilitiesrelatetotaxesonincomeleviedbythesamegoverningtaxationlaws.
19.Provisions,Contingentliabilities,ContingentassetsandCommitments
(a) Provisionsarerecognisedforliabilitiesthatcanbemeasuredonlybyusingasubstantialdegreeofestimation,if
(1) theCompanyhasapresentobligationasaresultofapastevent;
(2) aprobableoutflowofresourcesisexpectedtosettletheobligation;and
(3) theamountoftheobligationcanbereliablyestimated.
(b)Reimbursementsbyanotherparty,expectedinrespectofexpenditurerequiredtosettleaprovision,isrecognisedwhenitisvirtuallycertainthatreimbursementwillbereceivedif,obligationissettled.
(c) Contingentliabilityisdisclosedinthecaseof:
(1) a present obligation arising frompast events,when it is not probable that an outflow of resourceswill be required to settle theobligation;
(2) apresentobligationwhennoreliableestimateispossible;
(3) apossibleobligationarisingfrompastevents,unlesstheprobabilityofoutflowofresourcesisremote.
(d)Contingentassetsareneitherrecognisednordisclosed.
(e) Commitmentsincludestheamountofpurchaseorder(netofadvance)issuedtopartiesforcompletionofasset.
(f) Provisions,contingentliabilities,contingentassetsandcommitmentsarereviewedateachbalancesheetdate.
NOTESACCOMPANYINGTOTHECONSOLIDATEDFINANCIALSTATEMENTS(Contd. )
1. SIGNIFICANTACCOUNTINGPOLICIES
NOTES ACCOMPANYING TO THE CONSOLIDATED FINANCIAL STATEMENTS (Contd. )
1 2 9F I n A nC I A L S
20.Governmentgrants/subsidy
(a) Capitalgrantsincaseofdepreciableassets,thecostoftheassetisshownatgrossvalueandgrantthereonistreatedascapitalgrantswhicharerecognisedasincomeintheprofitandlossaccountovertheperiodandinproportioninwhichdepreciationischarged.
(b)Revenuegrantsarerecognisedintheprofitandlossaccountinthesameperiodastherelatedcostwhichtheyareintendedtocompensateareaccountedfor.
21.Extraordinaryandexceptionalitems
Incomeorexpensesthatarisefromeventsortransactionsthatareclearlydistinctfromordinaryactivitiesofthecompanyareclassifiedasextraordinary items.Specificdisclosuresofsuchevents / transactionsaremade in thefinancialstatements.Similarly,anyexternaleventbeyondthecontrolofthecompany,significantlyimpactingincomeorexpenses,isalsotreatedasextraordinaryitemanddisclosedassuch.Certainoccasions,thesize,typeorincidenceofanitemofincomeorexpense,pertainingtotheordinaryactivitiesofthecompanyissuchthatitsdisclosureimprovesasunderstandingoftheperformanceofthecompany,suchincomeorexpenseisclassifiedasanexceptionalitemandaccordingly,disclosedinthenotesaccompanyingtothefinancialstatements.
1. SIGNIFICANTACCOUNTINGPOLICIES(Contd.)
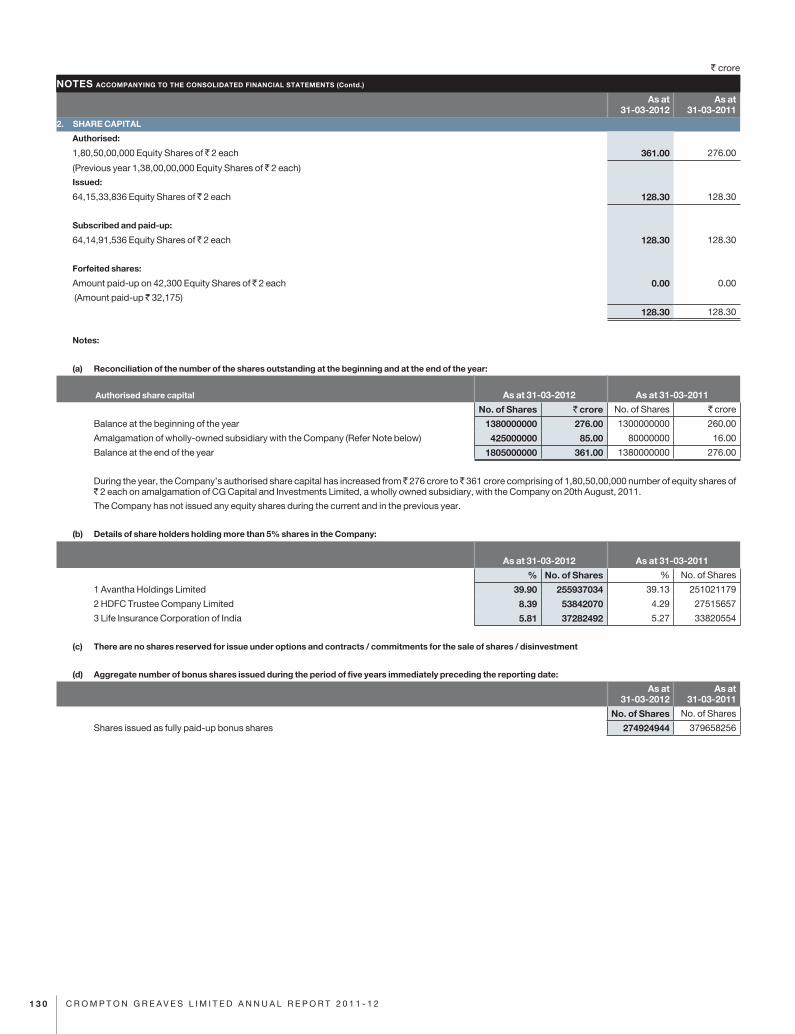
1 3 0 C R O M P T O N G R E A V E S L I M I T E D A N N U A L R E P O R T 2 0 1 1 - 1 2
` crore
As at 31-03-2012
As at 31-03-2011
2. SHARE CAPITAL
Authorised:
1,80,50,00,000 Equity Shares of 2 each 361.00 276.00
(Previous year 1,38,00,00,000 Equity Shares of 2 each)
Issued:
64,15,33,836 Equity Shares of 2 each 128.30 128.30
Subscribed and paid-up:
64,14,91,536 Equity Shares of 2 each 128.30 128.30
Forfeited shares:
Amount paid-up on 42,300 Equity Shares of 2 each 0.00 0.00
(Amount paid-up 32,175)
128.30 128.30
Notes:
(a) Reconciliation of the number of the shares outstanding at the beginning and at the end of the year:
Authorised share capital As at 31-03-2012 As at 31-03-2011
No. of Shares ` crore No. of Shares ` crore
Balance at the beginning of the year 1380000000 276.00 1300000000 260.00
Amalgamation of wholly-owned subsidiary with the Company (Refer Note below) 425000000 85.00 80000000 16.00
Balance at the end of the year 1805000000 361.00 1380000000 276.00
During the year, the Company’s authorised share capital has increased from 276 crore to 361 crore comprising of 1,80,50,00,000 number of equity shares of ` 2 each on amalgamation of CG Capital and Investments Limited, a wholly owned subsidiary, with the Company on 20th August, 2011.
The Company has not issued any equity shares during the current and in the previous year.
(b) Details of share holders holding more than 5% shares in the Company:
As at 31-03-2012 As at 31-03-2011
% No. of Shares % No. of Shares
1 Avantha Holdings Limited 39.90 255937034 39.13 251021179
2 HDFC Trustee Company Limited 8.39 53842070 4.29 27515657
3 Life Insurance Corporation of India 5.81 37282492 5.27 33820554
(c) There are no shares reserved for issue under options and contracts / commitments for the sale of shares / disinvestment
(d) Aggregate number of bonus shares issued during the period of five years immediately preceding the reporting date:
As at 31-03-2012
As at 31-03-2011
No. of Shares No. of Shares
Shares issued as fully paid-up bonus shares 274924944 379658256
NOTES ACCOMPANYING TO THE CONSOLIDATED FINANCIAL STATEMENTS (Contd.)
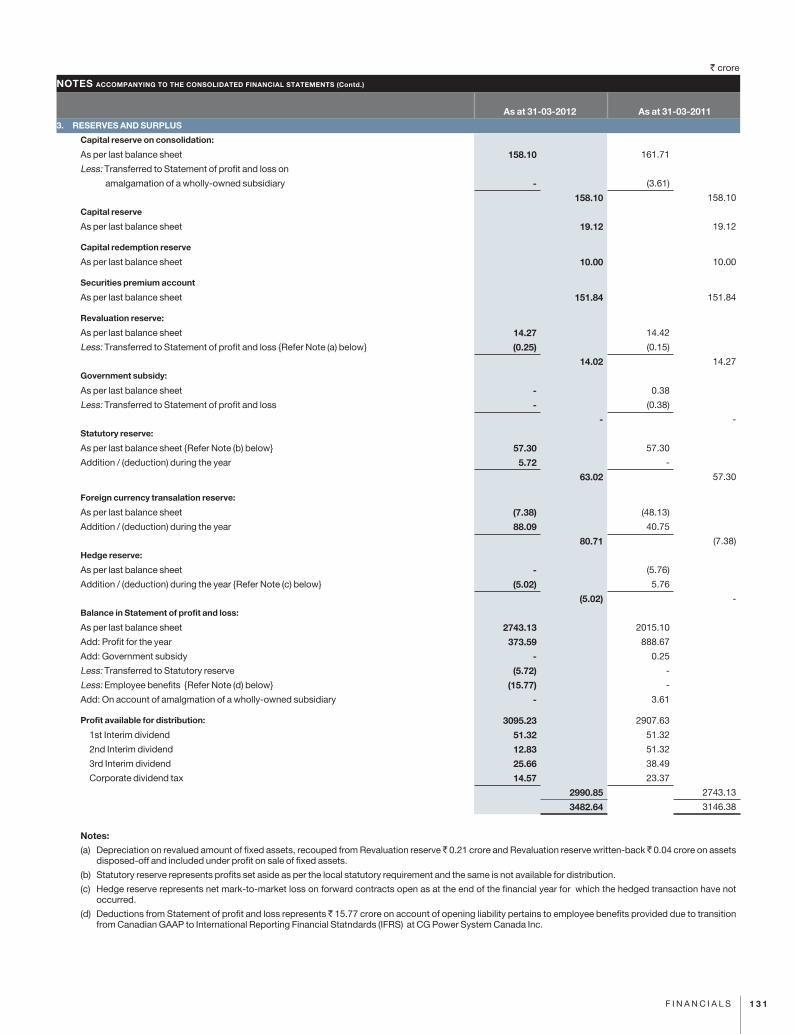
1 3 1F I N A N C I A L S
` crore
As at 31-03-2012 As at 31-03-20113. RESERVES AND SURPLUS
Capital reserve on consolidation:
As per last balance sheet 158.10 161.71
Less: Transferred to Statement of profit and loss on
amalgamation of a wholly-owned subsidiary - (3.61)
158.10 158.10
Capital reserve
As per last balance sheet 19.12 19.12
Capital redemption reserve
As per last balance sheet 10.00 10.00
Securities premium account
As per last balance sheet 151.84 151.84
Revaluation reserve:
As per last balance sheet 14.27 14.42
Less: Transferred to Statement of profit and loss {Refer Note (a) below} (0.25) (0.15)
14.02 14.27
Government subsidy:
As per last balance sheet - 0.38
Less: Transferred to Statement of profit and loss - (0.38)
- -
Statutory reserve:
As per last balance sheet {Refer Note (b) below} 57.30 57.30
Addition / (deduction) during the year 5.72 -
63.02 57.30
Foreign currency transalation reserve:
As per last balance sheet (7.38) (48.13)
Addition / (deduction) during the year 88.09 40.75
80.71 (7.38)
Hedge reserve:
As per last balance sheet - (5.76)
Addition / (deduction) during the year {Refer Note (c) below} (5.02) 5.76
(5.02) -
Balance in Statement of profit and loss:
As per last balance sheet 2743.13 2015.10
Add: Profit for the year 373.59 888.67
Add: Government subsidy - 0.25
Less: Transferred to Statutory reserve (5.72) -
Less: Employee benefits {Refer Note (d) below} (15.77) -
Add: On account of amalgmation of a wholly-owned subsidiary - 3.61
Profit available for distribution: 3095.23 2907.63
1st Interim dividend 51.32 51.32
2nd Interim dividend 12.83 51.32
3rd Interim dividend 25.66 38.49
Corporate dividend tax 14.57 23.37
2990.85 2743.13
3482.64 3146.38
Notes:
(a) Depreciation on revalued amount of fixed assets, recouped from Revaluation reserve 0.21 crore and Revaluation reserve written-back 0.04 crore on assets disposed-off and included under profit on sale of fixed assets.
(b) Statutory reserve represents profits set aside as per the local statutory requirement and the same is not available for distribution.
(c) Hedge reserve represents net mark-to-market loss on forward contracts open as at the end of the financial year for which the hedged transaction have not occurred.
(d) Deductions from Statement of profit and loss represents 15.77 crore on account of opening liability pertains to employee benefits provided due to transition from Canadian GAAP to International Reporting Financial Statndards (IFRS) at CG Power System Canada Inc.
NOTES ACCOMPANYING TO THE CONSOLIDATED FINANCIAL STATEMENTS (Contd.)
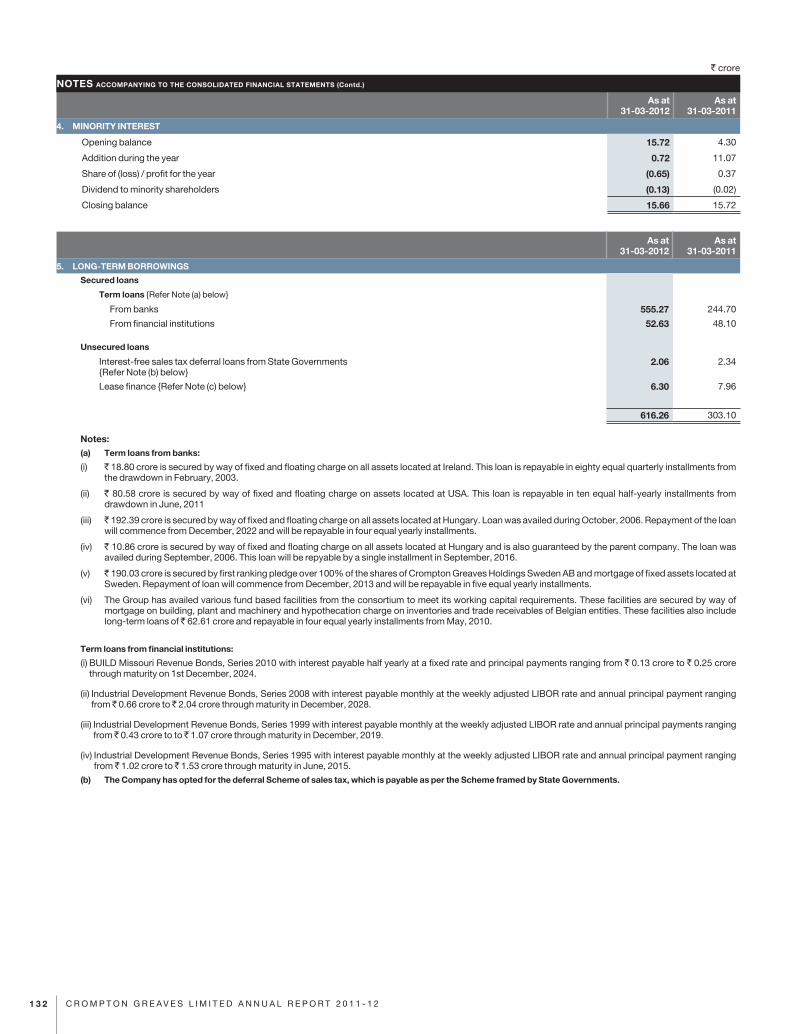
1 3 2 C R O M P T O N G R E A V E S L I M I T E D A N N U A L R E P O R T 2 0 1 1 - 1 2
` crore
As at 31-03-2012
As at 31-03-2011
4. MINORITY INTEREST
Opening balance 15.72 4.30
Addition during the year 0.72 11.07
Share of (loss) / profit for the year (0.65) 0.37
Dividend to minority shareholders (0.13) (0.02)
Closing balance 15.66 15.72
As at 31-03-2012
As at 31-03-2011
5. LONG-TERM BORROWINGS
Secured loans
Term loans {Refer Note (a) below}
From banks 555.27 244.70
From financial institutions 52.63 48.10
Unsecured loans
Interest-free sales tax deferral loans from State Governments {Refer Note (b) below}
2.06 2.34
Lease finance {Refer Note (c) below} 6.30 7.96
616.26 303.10
Notes: (a) Term loans from banks:
(i) 18.80 crore is secured by way of fixed and floating charge on all assets located at Ireland. This loan is repayable in eighty equal quarterly installments from the drawdown in February, 2003.
(ii) 80.58 crore is secured by way of fixed and floating charge on assets located at USA. This loan is repayable in ten equal half-yearly installments from drawdown in June, 2011
(iii) 192.39 crore is secured by way of fixed and floating charge on all assets located at Hungary. Loan was availed during October, 2006. Repayment of the loan will commence from December, 2022 and will be repayable in four equal yearly installments.
(iv) 10.86 crore is secured by way of fixed and floating charge on all assets located at Hungary and is also guaranteed by the parent company. The loan was availed during September, 2006. This loan will be repyable by a single installment in September, 2016.
(v) 190.03 crore is secured by first ranking pledge over 100% of the shares of Crompton Greaves Holdings Sweden AB and mortgage of fixed assets located at Sweden. Repayment of loan will commence from December, 2013 and will be repayable in five equal yearly installments.
(vi) The Group has availed various fund based facilities from the consortium to meet its working capital requirements. These facilities are secured by way of mortgage on building, plant and machinery and hypothecation charge on inventories and trade receivables of Belgian entities. These facilities also include long-term loans of 62.61 crore and repayable in four equal yearly installments from May, 2010.
Term loans from financial institutions:
(i) BUILD Missouri Revenue Bonds, Series 2010 with interest payable half yearly at a fixed rate and principal payments ranging from ` 0.13 crore to ` 0.25 crore through maturity on 1st December, 2024.
(ii) Industrial Development Revenue Bonds, Series 2008 with interest payable monthly at the weekly adjusted LIBOR rate and annual principal payment ranging from 0.66 crore to 2.04 crore through maturity in December, 2028.
(iii) Industrial Development Revenue Bonds, Series 1999 with interest payable monthly at the weekly adjusted LIBOR rate and annual principal payments ranging from 0.43 crore to to 1.07 crore through maturity in December, 2019.
(iv) Industrial Development Revenue Bonds, Series 1995 with interest payable monthly at the weekly adjusted LIBOR rate and annual principal payment ranging from 1.02 crore to 1.53 crore through maturity in June, 2015.
(b) The Company has opted for the deferral Scheme of sales tax, which is payable as per the Scheme framed by State Governments.
NOTES ACCOMPANYING TO THE CONSOLIDATED FINANCIAL STATEMENTS (Contd.)
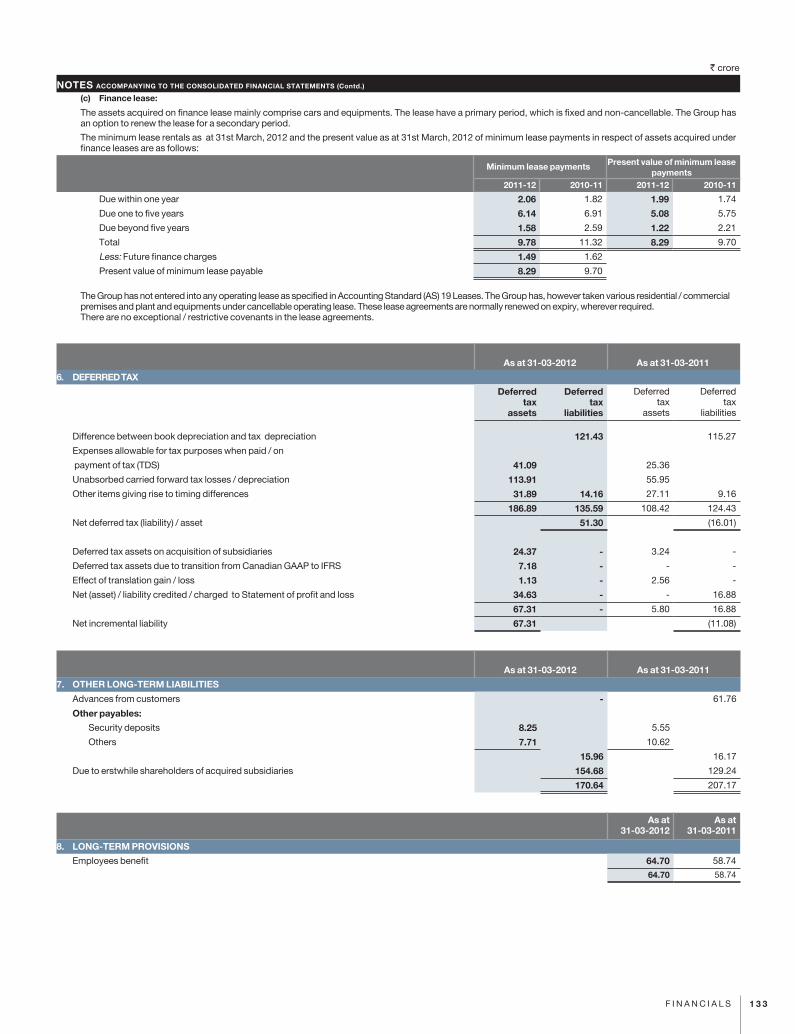
1 3 3F I N A N C I A L S
` crore
(c) Finance lease:
The assets acquired on finance lease mainly comprise cars and equipments. The lease have a primary period, which is fixed and non-cancellable. The Group has an option to renew the lease for a secondary period.
The minimum lease rentals as at 31st March, 2012 and the present value as at 31st March, 2012 of minimum lease payments in respect of assets acquired under finance leases are as follows:
Minimum lease payments Present value of minimum lease payments
2011-12 2010-11 2011-12 2010-11
Due within one year 2.06 1.82 1.99 1.74
Due one to five years 6.14 6.91 5.08 5.75
Due beyond five years 1.58 2.59 1.22 2.21
Total 9.78 11.32 8.29 9.70
Less: Future finance charges 1.49 1.62
Present value of minimum lease payable 8.29 9.70
The Group has not entered into any operating lease as specified in Accounting Standard (AS) 19 Leases. The Group has, however taken various residential / commercial premises and plant and equipments under cancellable operating lease. These lease agreements are normally renewed on expiry, wherever required.There are no exceptional / restrictive covenants in the lease agreements.
As at 31-03-2012 As at 31-03-2011
6. DEFERRED TAX
Deferred tax
assets
Deferred tax
liabilities
Deferred tax
assets
Deferred tax
liabilities
Difference between book depreciation and tax depreciation 121.43 115.27
Expenses allowable for tax purposes when paid / on
payment of tax (TDS) 41.09 25.36
Unabsorbed carried forward tax losses / depreciation 113.91 55.95
Other items giving rise to timing differences 31.89 14.16 27.11 9.16
186.89 135.59 108.42 124.43
Net deferred tax (liability) / asset 51.30 (16.01)
Deferred tax assets on acquisition of subsidiaries 24.37 - 3.24 -
Deferred tax assets due to transition from Canadian GAAP to IFRS 7.18 - - -
Effect of translation gain / loss 1.13 - 2.56 -
Net (asset) / liability credited / charged to Statement of profit and loss 34.63 - - 16.88
67.31 - 5.80 16.88
Net incremental liability 67.31 (11.08)
As at 31-03-2012 As at 31-03-2011
7. OTHER LONG-TERM LIABILITIES
Advances from customers - 61.76
Other payables:
Security deposits 8.25 5.55
Others 7.71 10.62
15.96 16.17
Due to erstwhile shareholders of acquired subsidiaries 154.68 129.24
170.64 207.17
As at 31-03-2012
As at 31-03-2011
8. LONG-TERM PROVISIONS
Employees benefit 64.70 58.74
64.70 58.74
NOTES ACCOMPANYING TO THE CONSOLIDATED FINANCIAL STATEMENTS (Contd.)
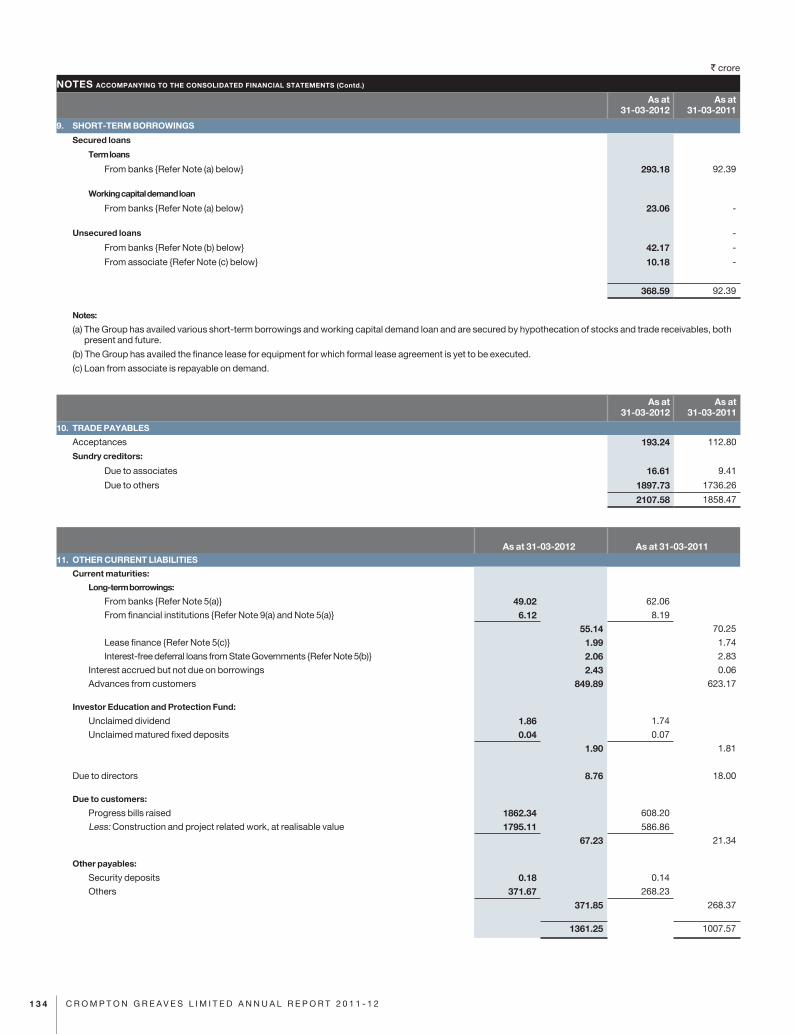
1 3 4 C R O M P T O N G R E A V E S L I M I T E D A N N U A L R E P O R T 2 0 1 1 - 1 2
` crore
NOTES ACCOMPANYING TO THE CONSOLIDATED FINANCIAL STATEMENTS (Contd.)
As at 31-03-2012
As at 31-03-2011
9. SHORT-TERM BORROWINGS
Secured loans
Term loans
From banks {Refer Note (a) below} 293.18 92.39
Working capital demand loan
From banks {Refer Note (a) below} 23.06 -
Unsecured loans -
From banks {Refer Note (b) below} 42.17 -
From associate {Refer Note (c) below} 10.18 -
368.59 92.39
Notes:
(a) The Group has availed various short-term borrowings and working capital demand loan and are secured by hypothecation of stocks and trade receivables, both present and future.
(b) The Group has availed the finance lease for equipment for which formal lease agreement is yet to be executed.
(c) Loan from associate is repayable on demand.
As at 31-03-2012
As at 31-03-2011
10. TRADE PAYABLES
Acceptances 193.24 112.80
Sundry creditors:
Due to associates 16.61 9.41
Due to others 1897.73 1736.26
2107.58 1858.47
As at 31-03-2012 As at 31-03-201111. OTHER CURRENT LIABILITIES
Current maturities:
Long-term borrowings:
From banks {Refer Note 5(a)} 49.02 62.06
From financial institutions {Refer Note 9(a) and Note 5(a)} 6.12 8.19
55.14 70.25
Lease finance {Refer Note 5(c)} 1.99 1.74
Interest-free deferral loans from State Governments {Refer Note 5(b)} 2.06 2.83
Interest accrued but not due on borrowings 2.43 0.06
Advances from customers 849.89 623.17
Investor Education and Protection Fund:
Unclaimed dividend 1.86 1.74
Unclaimed matured fixed deposits 0.04 0.07
1.90 1.81
Due to directors 8.76 18.00
Due to customers:
Progress bills raised 1862.34 608.20
Less: Construction and project related work, at realisable value 1795.11 586.86
67.23 21.34
Other payables:
Security deposits 0.18 0.14
Others 371.67 268.23
371.85 268.37
1361.25 1007.57
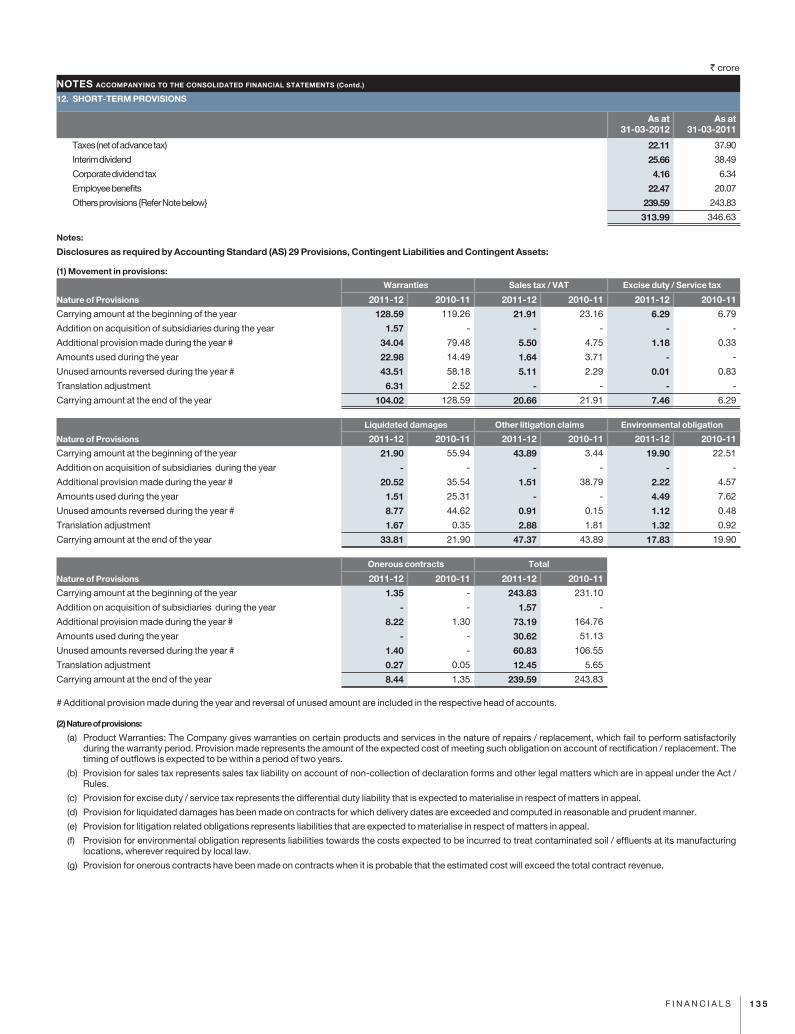
1 3 5F I N A N C I A L S
` crore
NOTES ACCOMPANYING TO THE CONSOLIDATED FINANCIAL STATEMENTS (Contd.)
12. SHORT-TERM PROVISIONS
As at 31-03-2012
As at 31-03-2011
Taxes (net of advance tax) 22.11 37.90
Interim dividend 25.66 38.49
Corporate dividend tax 4.16 6.34
Employee benefits 22.47 20.07
Others provisions {Refer Note below} 239.59 243.83
313.99 346.63
Notes:
Disclosures as required by Accounting Standard (AS) 29 Provisions, Contingent Liabilities and Contingent Assets:
(1) Movement in provisions:
Nature of Provisions
Warranties Sales tax / VAT Excise duty / Service tax
2011-12 2010-11 2011-12 2010-11 2011-12 2010-11
Carrying amount at the beginning of the year 128.59 119.26 21.91 23.16 6.29 6.79
Addition on acquisition of subsidiaries during the year 1.57 - - - - -
Additional provision made during the year # 34.04 79.48 5.50 4.75 1.18 0.33
Amounts used during the year 22.98 14.49 1.64 3.71 - -
Unused amounts reversed during the year # 43.51 58.18 5.11 2.29 0.01 0.83
Translation adjustment 6.31 2.52 - - - -
Carrying amount at the end of the year 104.02 128.59 20.66 21.91 7.46 6.29
Nature of Provisions
Liquidated damages Other litigation claims Environmental obligation
2011-12 2010-11 2011-12 2010-11 2011-12 2010-11
Carrying amount at the beginning of the year 21.90 55.94 43.89 3.44 19.90 22.51
Addition on acquisition of subsidiaries during the year - - - - - -
Additional provision made during the year # 20.52 35.54 1.51 38.79 2.22 4.57
Amounts used during the year 1.51 25.31 - - 4.49 7.62
Unused amounts reversed during the year # 8.77 44.62 0.91 0.15 1.12 0.48
Translation adjustment 1.67 0.35 2.88 1.81 1.32 0.92
Carrying amount at the end of the year 33.81 21.90 47.37 43.89 17.83 19.90
Nature of Provisions
Onerous contracts Total
2011-12 2010-11 2011-12 2010-11
Carrying amount at the beginning of the year 1.35 - 243.83 231.10
Addition on acquisition of subsidiaries during the year - - 1.57 -
Additional provision made during the year # 8.22 1.30 73.19 164.76
Amounts used during the year - - 30.62 51.13
Unused amounts reversed during the year # 1.40 - 60.83 106.55
Translation adjustment 0.27 0.05 12.45 5.65
Carrying amount at the end of the year 8.44 1.35 239.59 243.83
# Additional provision made during the year and reversal of unused amount are included in the respective head of accounts.
(2) Nature of provisions:
(a) Product Warranties: The Company gives warranties on certain products and services in the nature of repairs / replacement, which fail to perform satisfactorily during the warranty period. Provision made represents the amount of the expected cost of meeting such obligation on account of rectification / replacement. The timing of outflows is expected to be within a period of two years.
(b) Provision for sales tax represents sales tax liability on account of non-collection of declaration forms and other legal matters which are in appeal under the Act / Rules.
(c) Provision for excise duty / service tax represents the differential duty liability that is expected to materialise in respect of matters in appeal.
(d) Provision for liquidated damages has been made on contracts for which delivery dates are exceeded and computed in reasonable and prudent manner.
(e) Provision for litigation related obligations represents liabilities that are expected to materialise in respect of matters in appeal.
(f) Provision for environmental obligation represents liabilities towards the costs expected to be incurred to treat contaminated soil / effluents at its manufacturing locations, wherever required by local law.
(g) Provision for onerous contracts have been made on contracts when it is probable that the estimated cost will exceed the total contract revenue.
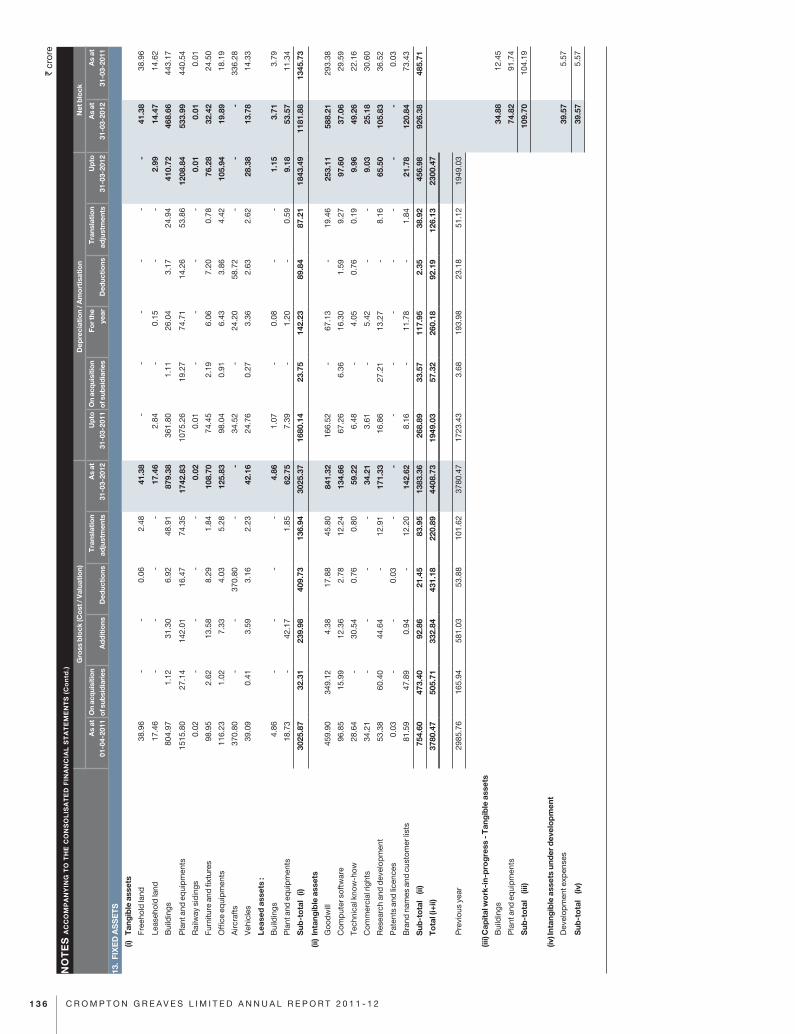
` cr
ore
Gro
ss b
lock
(Co
st /
Val
uati
on)
Dep
reci
atio
n / A
mo
rtis
atio
n N
et b
lock
As
at
01-
04-2
011
On
acq
uisi
tion
of s
ubsi
dia
ries
A
dd
itio
ns
Ded
ucti
ons
Tra
nsla
tio
n
adju
stm
ents
As
at
31-
03-2
012
Up
to
31-
03-2
011
On
acq
uisi
tion
of s
ubsi
dia
ries
Fo
r the
yea
r D
educ
tio
ns
Tra
nsla
tio
n
adju
stm
ents
Up
to
31-
03-2
012
As
at
31-
03-2
012
As
at
31-
03-2
011
13.
FIX
ED
AS
SE
TS
(i)
T
ang
ible
ass
ets
Free
hold
land
38.
96
-
-
0.0
6 2
.48
41.
38
-
-
-
-
-
-
41.
38
38.
96
Leas
ehol
d la
nd 1
7.46
-
-
-
-
1
7.46
2
.84
-
0.1
5 -
-
2
.99
14.
47
14.
62
Bui
ldin
gs 8
04.9
7 1
.12
31.
30
6.9
2 4
8.91
8
79.3
8 3
61.8
0 1
.11
26.
04
3.1
7 2
4.94
4
10.7
2 4
68.6
6 4
43.1
7
Pla
nt a
nd e
qui
pm
ents
151
5.80
2
7.14
1
42.0
1 1
6.47
7
4.35
1
742.
83
107
5.26
1
9.27
7
4.71
1
4.26
5
3.86
1
208.
84
533
.99
440
.54
Rai
lway
sid
ings
0.0
2 -
-
-
-
0
.02
0.0
1 -
-
-
-
0
.01
0.0
1 0
.01
Furn
iture
and
fixt
ures
98.
95
2.6
2 1
3.58
8
.29
1.8
4 1
08.7
0 7
4.45
2
.19
6.0
6 7
.20
0.7
8 7
6.28
3
2.42
2
4.50
Offi
ce e
qui
pm
ents
116
.23
1.0
2 7
.33
4.0
3 5
.28
125
.83
98.
04
0.9
1 6
.43
3.8
6 4
.42
105
.94
19.
89
18.
19
Airc
raft
s 3
70.8
0 -
-
3
70.8
0 -
-
3
4.52
-
2
4.20
5
8.72
-
-
-
3
36.2
8
Veh
icle
s 3
9.09
0
.41
3.5
9 3
.16
2.2
3 4
2.16
2
4.76
0
.27
3.3
6 2
.63
2.6
2 2
8.38
1
3.78
1
4.33
Leas
ed a
sset
s :
Bui
ldin
gs 4
.86
-
-
-
-
4.8
6 1
.07
-
0.0
8 -
-
1
.15
3.7
1 3
.79
Pla
nt a
nd e
qui
pm
ents
18.
73
-
42.
17
1.8
5 6
2.75
7
.39
-
1.2
0 -
0
.59
9.1
8 5
3.57
1
1.34
Sub
-to
tal
(i)
302
5.87
3
2.31
2
39.9
8 4
09.7
3 1
36.9
4 3
025.
37
168
0.14
2
3.75
1
42.2
3 8
9.84
8
7.21
1
843.
49
118
1.88
1
345.
73
(ii
) In
tang
ible
ass
ets
Goo
dw
ill 4
59.9
0 3
49.1
2 4
.38
17.
88
45.
80
841
.32
166
.52
-
67.
13
-
19.
46
253
.11
588
.21
293
.38
Com
put
er s
oftw
are
96.
85
15.
99
12.
36
2.7
8 1
2.24
1
34.6
6 6
7.26
6
.36
16.
30
1.5
9 9
.27
97.
60
37.
06
29.
59
Tech
nica
l kno
w-h
ow 2
8.64
-
3
0.54
0
.76
0.8
0 5
9.22
6
.48
-
4.0
5 0
.76
0.1
9 9
.96
49.
26
22.
16
Com
mer
cial
righ
ts 3
4.21
-
-
-
-
3
4.21
3
.61
-
5.4
2 -
-
9
.03
25.
18
30.
60
Res
earc
h an
d d
evel
opm
ent
53.
38
60.
40
44.
64
-
12.
91
171
.33
16.
86
27.
21
13.
27
-
8.1
6 6
5.50
1
05.8
3 3
6.52
Pat
ents
and
lice
nces
0.0
3 -
-
0
.03
-
-
-
-
-
-
-
-
-
0.0
3
Bra
nd n
ames
and
cus
tom
er li
sts
81.
59
47.
89
0.9
4 -
1
2.20
1
42.6
2 8
.16
-
11.
78
-
1.8
4 2
1.78
1
20.8
4 7
3.43
Sub
-to
tal
(ii)
754
.60
473
.40
92.
86
21.
45
83.
95
138
3.36
2
68.8
9 3
3.57
1
17.9
5 2
.35
38.
92
456
.98
926
.38
485
.71
To
tal (
i+ii)
378
0.47
5
05.7
1 3
32.8
4 4
31.1
8 2
20.8
9 4
408.
73
194
9.03
5
7.32
2
60.1
8 9
2.19
1
26.1
3 2
300.
47
Pre
viou
s ye
ar 2
985.
76
165
.94
581
.03
53.
88
101
.62
378
0.47
1
723.
43
3.6
8 1
93.9
8 2
3.18
5
1.12
1
949.
03
(ii
i) C
apit
al w
ork
-in-
pro
gre
ss -
Tan
gib
le a
sset
s
Bui
ldin
gs 3
4.88
1
2.45
Pla
nt a
nd e
qui
pm
ents
74.
82
91.
74
Sub
-to
tal
(iii
) 1
09.7
0 1
04.1
9
(iv
) Int
ang
ible
ass
ets
und
er d
evel
op
men
t
Dev
elop
men
t exp
ense
s 3
9.57
5
.57
Sub
-to
tal
(iv
) 3
9.57
5
.57
NO
TE
S A
CC
OM
PA
NY
ING
TO
TH
E C
ON
SO
LIS
AT
ED
FIN
AN
CIA
L S
TA
TE
ME
NT
S (
Co
ntd
.)
1 3 6 C R O M P T O N G R E A V E S L I M I T E D A N N U A L R E P O R T 2 0 1 1 - 1 2
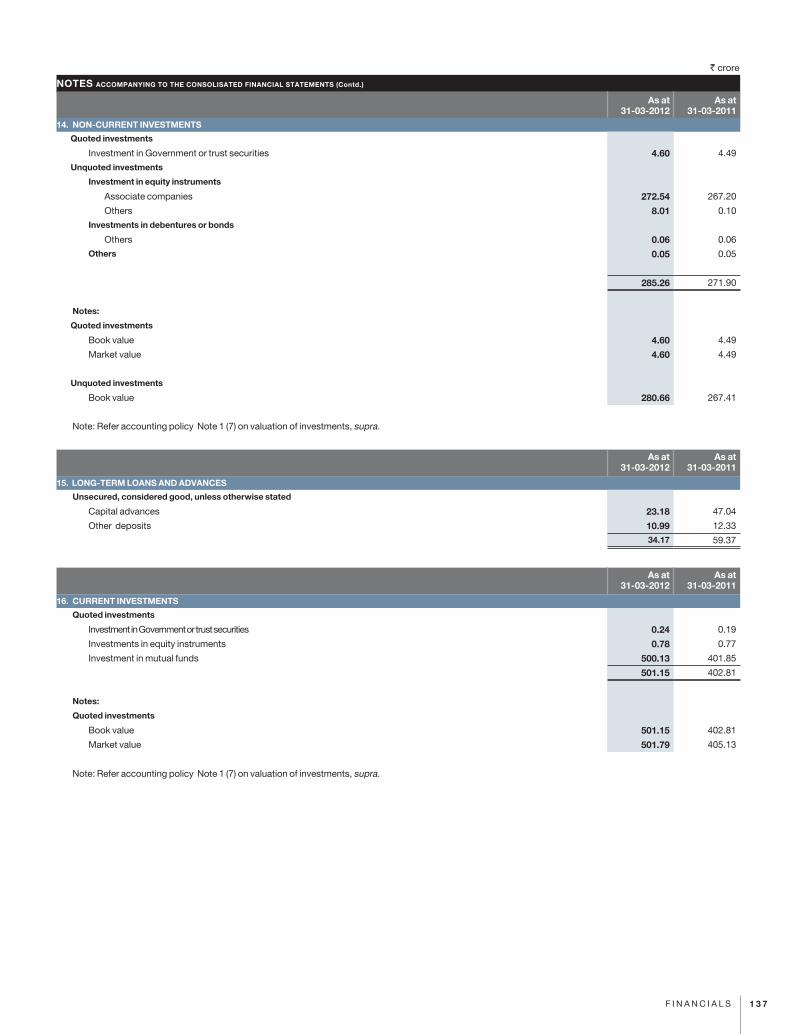
` crore
NOTES ACCOMPANYING TO THE CONSOLISATED FINANCIAL STATEMENTS (Contd.)
As at 31-03-2012
As at 31-03-2011
14. NON-CURRENT INVESTMENTS
Quoted investments
Investment in Government or trust securities 4.60 4.49
Unquoted investments
Investment in equity instruments
Associate companies 272.54 267.20
Others 8.01 0.10
Investments in debentures or bonds
Others 0.06 0.06
Others 0.05 0.05
285.26 271.90
Notes:
Quoted investments
Book value 4.60 4.49
Market value 4.60 4.49
Unquoted investments
Book value 280.66 267.41
Note: Refer accounting policy Note 1 (7) on valuation of investments, supra.
As at 31-03-2012
As at 31-03-2011
15. LONG-TERM LOANS AND ADVANCES
Unsecured, considered good, unless otherwise stated
Capital advances 23.18 47.04
Other deposits 10.99 12.33
34.17 59.37
As at 31-03-2012
As at 31-03-2011
16. CURRENT INVESTMENTS
Quoted investments
Investment in Government or trust securities 0.24 0.19
Investments in equity instruments 0.78 0.77
Investment in mutual funds 500.13 401.85
501.15 402.81
Notes:
Quoted investments
Book value 501.15 402.81
Market value 501.79 405.13
Note: Refer accounting policy Note 1 (7) on valuation of investments, supra.
1 3 7F I N A N C I A L S
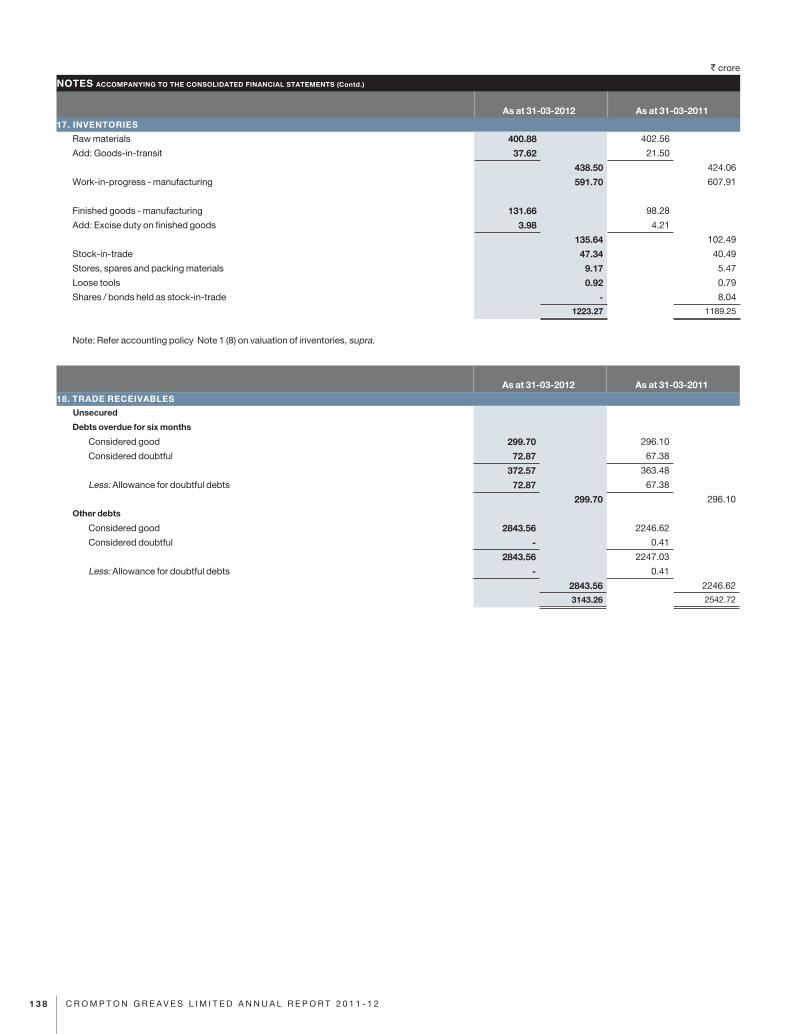
1 3 8 C R O M P T O N G R E A V E S L I M I T E D A N N U A L R E P O R T 2 0 1 1 - 1 2
` crore
As at 31-03-2012 As at 31-03-201117. INVENTORIES
Raw materials 400.88 402.56
Add: Goods-in-transit 37.62 21.50
438.50 424.06
Work-in-progress - manufacturing 591.70 607.91
Finished goods - manufacturing 131.66 98.28
Add: Excise duty on finished goods 3.98 4.21
135.64 102.49
Stock-in-trade 47.34 40.49
Stores, spares and packing materials 9.17 5.47
Loose tools 0.92 0.79
Shares / bonds held as stock-in-trade - 8.04
1223.27 1189.25
Note: Refer accounting policy Note 1 (8) on valuation of inventories, supra.
As at 31-03-2012 As at 31-03-201118. TRADE RECEIVABLES
Unsecured
Debts overdue for six months
Considered good 299.70 296.10
Considered doubtful 72.87 67.38
372.57 363.48
Less: Allowance for doubtful debts 72.87 67.38
299.70 296.10
Other debts
Considered good 2843.56 2246.62
Considered doubtful - 0.41
2843.56 2247.03
Less: Allowance for doubtful debts - 0.41
2843.56 2246.62
3143.26 2542.72
NOTES ACCOMPANYING TO THE CONSOLIDATED FINANCIAL STATEMENTS (Contd.)
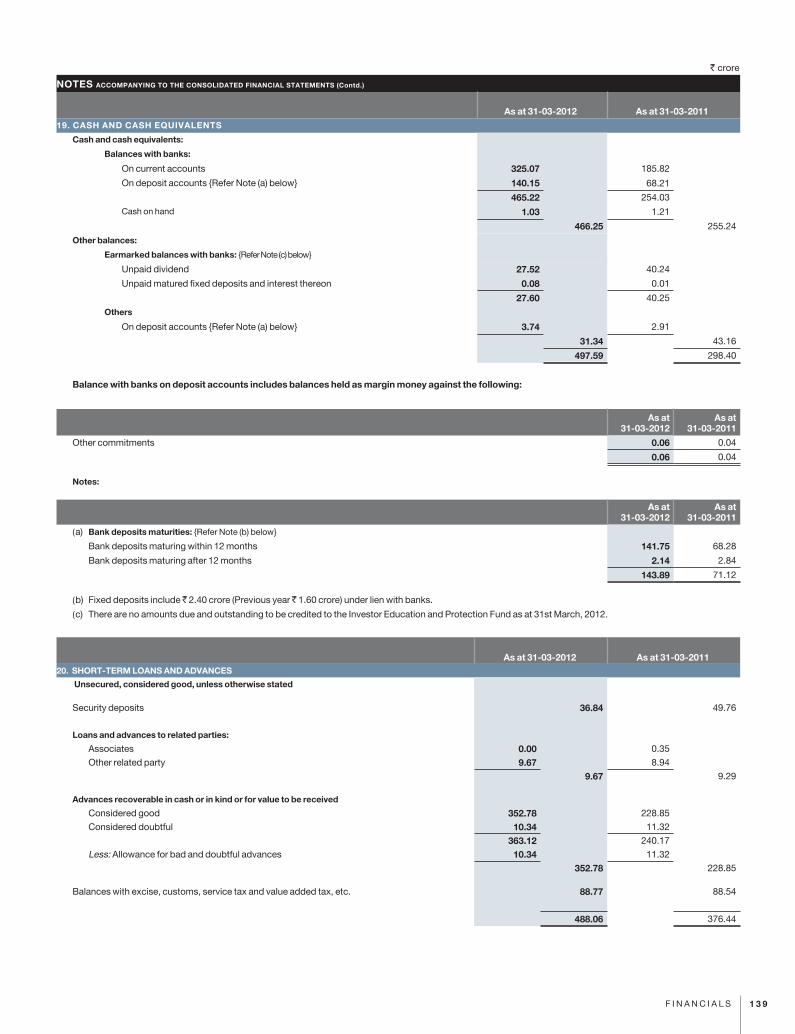
1 3 9F I N A N C I A L S
` crore
As at 31-03-2012 As at 31-03-201119. CASH AND CASH EQUIVALENTS
Cash and cash equivalents:
Balances with banks:
On current accounts 325.07 185.82
On deposit accounts {Refer Note (a) below} 140.15 68.21
465.22 254.03
Cash on hand 1.03 1.21
466.25 255.24
Other balances:
Earmarked balances with banks: {Refer Note (c) below}
Unpaid dividend 27.52 40.24
Unpaid matured fixed deposits and interest thereon 0.08 0.01
27.60 40.25
Others
On deposit accounts {Refer Note (a) below} 3.74 2.91
31.34 43.16
497.59 298.40
Balance with banks on deposit accounts includes balances held as margin money against the following:
As at 31-03-2012
As at 31-03-2011
Other commitments 0.06 0.04
0.06 0.04
Notes:
As at 31-03-2012
As at 31-03-2011
(a) Bank deposits maturities: {Refer Note (b) below}
Bank deposits maturing within 12 months 141.75 68.28
Bank deposits maturing after 12 months 2.14 2.84
143.89 71.12
(b) Fixed deposits include 2.40 crore (Previous year 1.60 crore) under lien with banks.
(c) There are no amounts due and outstanding to be credited to the Investor Education and Protection Fund as at 31st March, 2012.
As at 31-03-2012 As at 31-03-201120. SHORT-TERM LOANS AND ADVANCES
Unsecured, considered good, unless otherwise stated
Security deposits 36.84 49.76
Loans and advances to related parties:
Associates 0.00 0.35
Other related party 9.67 8.94
9.67 9.29
Advances recoverable in cash or in kind or for value to be received
Considered good 352.78 228.85
Considered doubtful 10.34 11.32
363.12 240.17
Less: Allowance for bad and doubtful advances 10.34 11.32
352.78 228.85
Balances with excise, customs, service tax and value added tax, etc. 88.77 88.54
488.06 376.44
NOTES ACCOMPANYING TO THE CONSOLIDATED FINANCIAL STATEMENTS (Contd.)
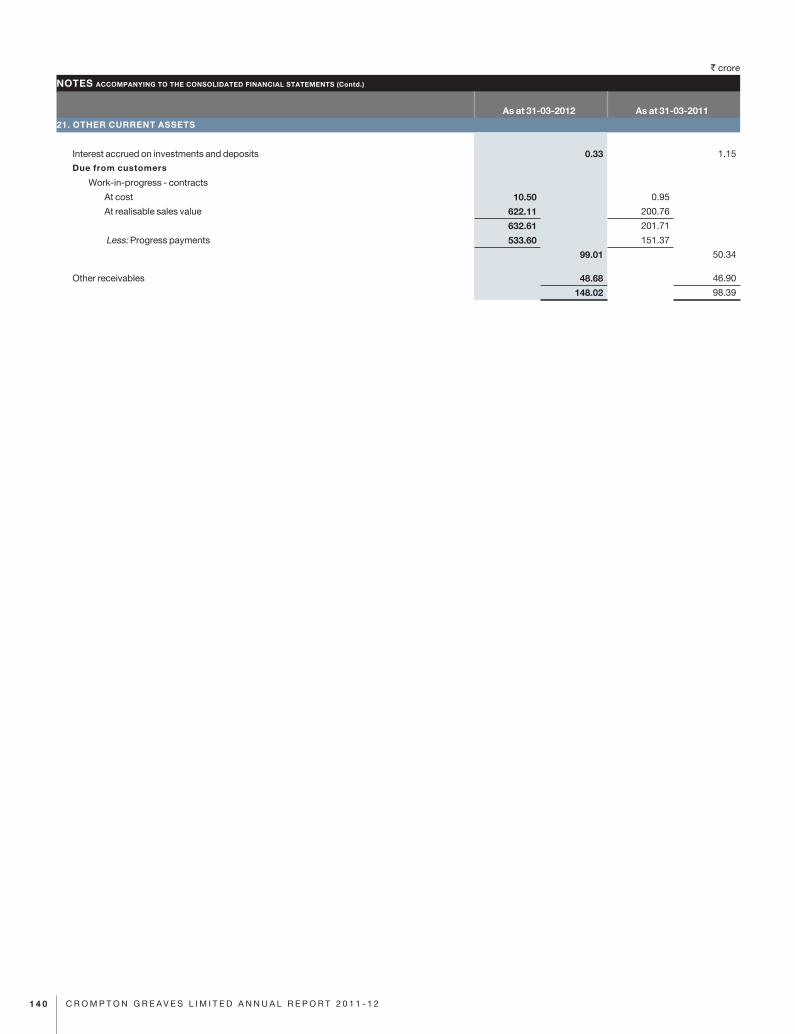
1 4 0 C R O M P T O N G R E A V E S L I M I T E D A N N U A L R E P O R T 2 0 1 1 - 1 2
` crore
As at 31-03-2012 As at 31-03-201121. OTHER CURRENT ASSETS
Interest accrued on investments and deposits 0.33 1.15
Due from customers
Work-in-progress - contracts
At cost 10.50 0.95
At realisable sales value 622.11 200.76
632.61 201.71
Less: Progress payments 533.60 151.37
99.01 50.34
Other receivables 48.68 46.90
148.02 98.39
NOTES ACCOMPANYING TO THE CONSOLIDATED FINANCIAL STATEMENTS (Contd.)
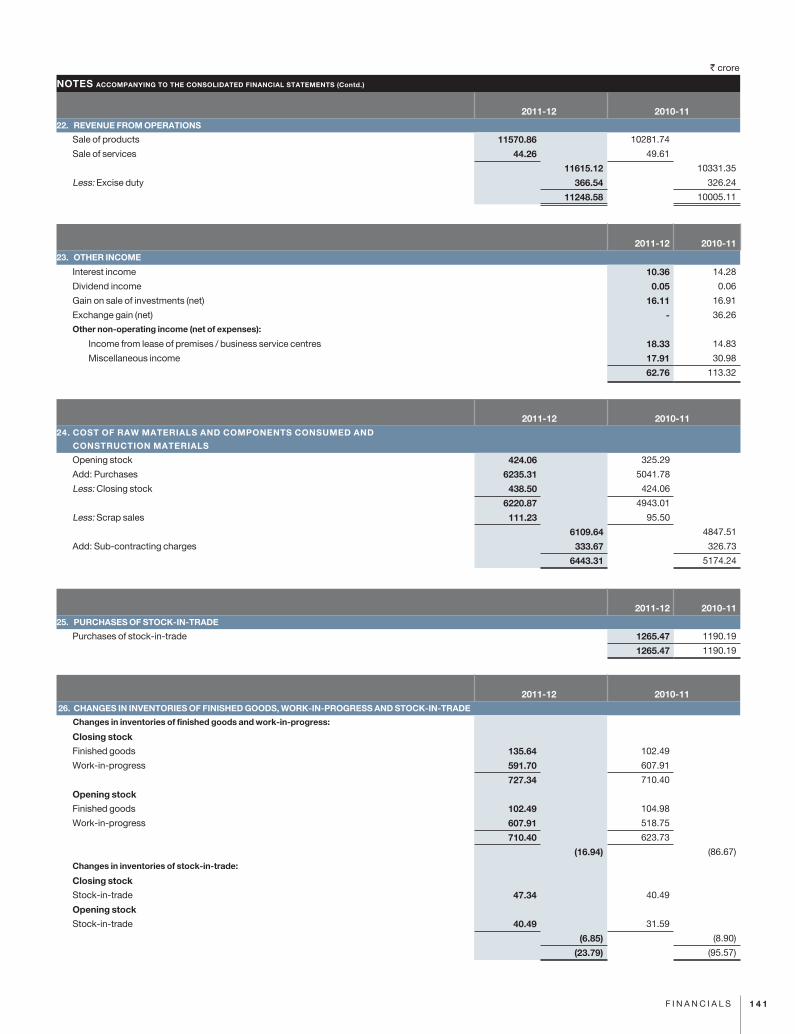
1 4 1F I N A N C I A L S
` crore
2011-12 2010-1122. REVENUE FROM OPERATIONS
Sale of products 11570.86 10281.74
Sale of services 44.26 49.61
11615.12 10331.35
Less: Excise duty 366.54 326.24
11248.58 10005.11
2011-12 2010-1123. OTHER INCOME
Interest income 10.36 14.28
Dividend income 0.05 0.06
Gain on sale of investments (net) 16.11 16.91
Exchange gain (net) - 36.26
Other non-operating income (net of expenses):
Income from lease of premises / business service centres 18.33 14.83
Miscellaneous income 17.91 30.98
62.76 113.32
2011-12 2010-1124. COST OF RAW MATERIALS AND COMPONENTS CONSUMED AND
CONSTRUCTION MATERIALS
Opening stock 424.06 325.29
Add: Purchases 6235.31 5041.78
Less: Closing stock 438.50 424.06
6220.87 4943.01
Less: Scrap sales 111.23 95.50
6109.64 4847.51
Add: Sub-contracting charges 333.67 326.73
6443.31 5174.24
NOTES ACCOMPANYING TO THE CONSOLIDATED FINANCIAL STATEMENTS (Contd.)
2011-12 2010-1125. PURCHASES OF STOCK-IN-TRADE
Purchases of stock-in-trade 1265.47 1190.19
1265.47 1190.19
2011-12 2010-11 26. CHANGES IN INVENTORIES OF FINISHED GOODS, WORK-IN-PROGRESS AND STOCK-IN-TRADE
Changes in inventories of finished goods and work-in-progress:
Closing stock
Finished goods 135.64 102.49
Work-in-progress 591.70 607.91
727.34 710.40
Opening stock
Finished goods 102.49 104.98
Work-in-progress 607.91 518.75
710.40 623.73
(16.94) (86.67)
Changes in inventories of stock-in-trade:
Closing stock
Stock-in-trade 47.34 40.49
Opening stock
Stock-in-trade 40.49 31.59
(6.85) (8.90)
(23.79) (95.57)
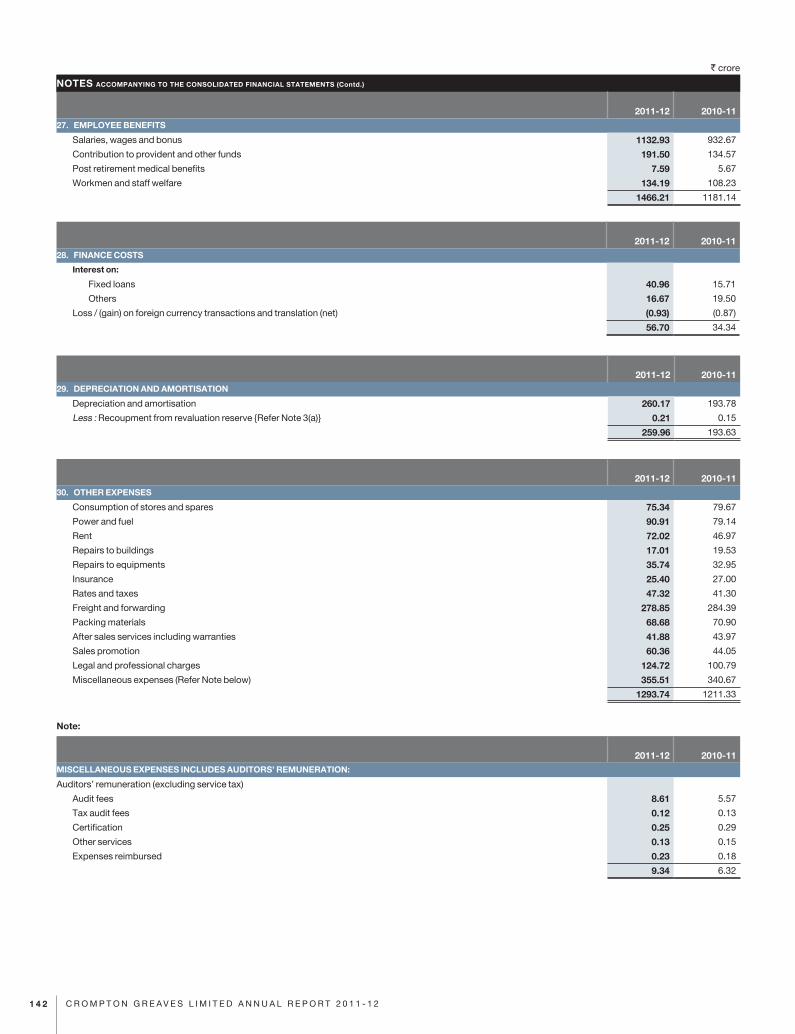
` crore
CONSOLIDATED BALANCE SHEET AS AT 31ST MARCH, 2012
1 4 2 C R O M P T O N G R E A V E S L I M I T E D A N N U A L R E P O R T 2 0 1 1 - 1 2
NOTES ACCOMPANYING TO THE CONSOLIDATED FINANCIAL STATEMENTS (Contd.)
2011-12 2010-1130. OTHER EXPENSES
Consumption of stores and spares 75.34 79.67
Power and fuel 90.91 79.14
Rent 72.02 46.97
Repairs to buildings 17.01 19.53
Repairs to equipments 35.74 32.95
Insurance 25.40 27.00
Rates and taxes 47.32 41.30
Freight and forwarding 278.85 284.39
Packing materials 68.68 70.90
After sales services including warranties 41.88 43.97
Sales promotion 60.36 44.05
Legal and professional charges 124.72 100.79
Miscellaneous expenses (Refer Note below) 355.51 340.67
1293.74 1211.33
Note:
2011-12 2010-11MISCELLANEOUS EXPENSES INCLUDES AUDITORS’ REMUNERATION:
Auditors’ remuneration (excluding service tax)
Audit fees 8.61 5.57
Tax audit fees 0.12 0.13
Certification 0.25 0.29
Other services 0.13 0.15
Expenses reimbursed 0.23 0.18
9.34 6.32
2011-12 2010-1127. EMPLOYEE BENEFITS
Salaries, wages and bonus 1132.93 932.67
Contribution to provident and other funds 191.50 134.57
Post retirement medical benefits 7.59 5.67
Workmen and staff welfare 134.19 108.23
1466.21 1181.14
2011-12 2010-1128. FINANCE COSTS
Interest on:
Fixed loans 40.96 15.71
Others 16.67 19.50
Loss / (gain) on foreign currency transactions and translation (net) (0.93) (0.87)
56.70 34.34
2011-12 2010-1129. DEPRECIATION AND AMORTISATION
Depreciation and amortisation 260.17 193.78
Less : Recoupment from revaluation reserve {Refer Note 3(a)} 0.21 0.15
259.96 193.63

` crore
1 4 3F I N A N C I A L S
NOTES ACCOMPANYING TO THE CONSOLIDATED FINANCIAL STATEMENTS (Contd.)
As at 31-03-2012
As at 31-03-2011
31. CONTINGENT LIABILITIES AND COMMITMENTS
(I) Contingent liabilities:
(to the extent not provided for)
(a) Claims against the Company not acknowledged as debts 9.26 1.35
(b) Sales tax liability that may arise in respect of matters in appeal 8.91 5.98
(c) Excise duty / service tax liability that may arise in respect of matters in appeal 7.08 10.40
(d) Income tax liability that may arise in respect of matters in appeal 1.90 14.37
(e) Bills discounted 87.17 100.87
(II) Commitments:
Estimated amount of contracts remaining to be executed on capital account and not provided for (net of advances) 71.27 36.88
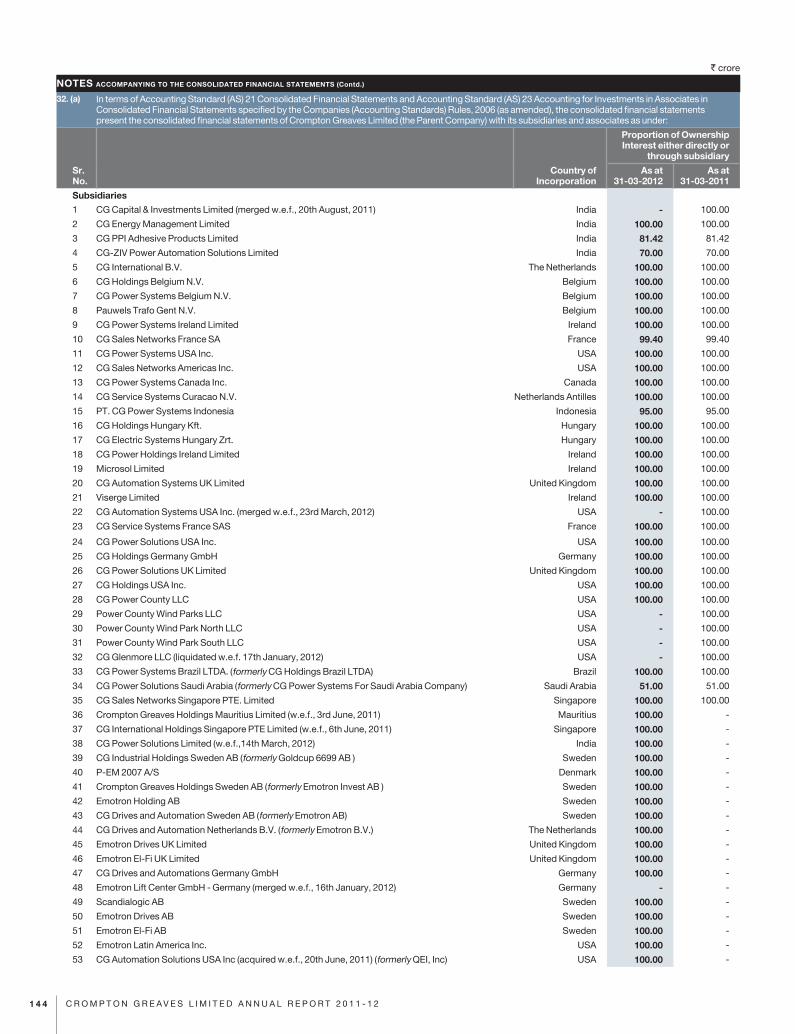
` crore
CONSOLIDATED BALANCE SHEET AS AT 31ST MARCH, 2012
1 4 4 C R O M P T O N G R E A V E S L I M I T E D A N N U A L R E P O R T 2 0 1 1 - 1 2
32. (a) In terms of Accounting Standard (AS) 21 Consolidated Financial Statements and Accounting Standard (AS) 23 Accounting for Investments in Associates in Consolidated Financial Statements specified by the Companies (Accounting Standards) Rules, 2006 (as amended), the consolidated financial statements present the consolidated financial statements of Crompton Greaves Limited (the Parent Company) with its subsidiaries and associates as under:
Sr. No.
Country of Incorporation
Proportion of Ownership Interest either directly or
through subsidiary
As at 31-03-2012
As at 31-03-2011
Subsidiaries
1 CG Capital & Investments Limited (merged w.e.f., 20th August, 2011) India - 100.00
2 CG Energy Management Limited India 100.00 100.00
3 CG PPI Adhesive Products Limited India 81.42 81.42
4 CG-ZIV Power Automation Solutions Limited India 70.00 70.00
5 CG International B.V. The Netherlands 100.00 100.00
6 CG Holdings Belgium N.V. Belgium 100.00 100.00
7 CG Power Systems Belgium N.V. Belgium 100.00 100.00
8 Pauwels Trafo Gent N.V. Belgium 100.00 100.00
9 CG Power Systems Ireland Limited Ireland 100.00 100.00
10 CG Sales Networks France SA France 99.40 99.40
11 CG Power Systems USA Inc. USA 100.00 100.00
12 CG Sales Networks Americas Inc. USA 100.00 100.00
13 CG Power Systems Canada Inc. Canada 100.00 100.00
14 CG Service Systems Curacao N.V. Netherlands Antilles 100.00 100.00
15 PT. CG Power Systems Indonesia Indonesia 95.00 95.00
16 CG Holdings Hungary Kft. Hungary 100.00 100.00
17 CG Electric Systems Hungary Zrt. Hungary 100.00 100.00
18 CG Power Holdings Ireland Limited Ireland 100.00 100.00
19 Microsol Limited Ireland 100.00 100.00
20 CG Automation Systems UK Limited United Kingdom 100.00 100.00
21 Viserge Limited Ireland 100.00 100.00
22 CG Automation Systems USA Inc. (merged w.e.f., 23rd March, 2012) USA - 100.00
23 CG Service Systems France SAS France 100.00 100.00
24 CG Power Solutions USA Inc. USA 100.00 100.00
25 CG Holdings Germany GmbH Germany 100.00 100.00
26 CG Power Solutions UK Limited United Kingdom 100.00 100.00
27 CG Holdings USA Inc. USA 100.00 100.00
28 CG Power County LLC USA 100.00 100.00
29 Power County Wind Parks LLC USA - 100.00
30 Power County Wind Park North LLC USA - 100.00
31 Power County Wind Park South LLC USA - 100.00
32 CG Glenmore LLC (liquidated w.e.f. 17th January, 2012) USA - 100.00
33 CG Power Systems Brazil LTDA. (formerly CG Holdings Brazil LTDA) Brazil 100.00 100.00
34 CG Power Solutions Saudi Arabia (formerly CG Power Systems For Saudi Arabia Company) Saudi Arabia 51.00 51.00
35 CG Sales Networks Singapore PTE. Limited Singapore 100.00 100.00
36 Crompton Greaves Holdings Mauritius Limited (w.e.f., 3rd June, 2011) Mauritius 100.00 -
37 CG International Holdings Singapore PTE Limited (w.e.f., 6th June, 2011) Singapore 100.00 -
38 CG Power Solutions Limited (w.e.f.,14th March, 2012) India 100.00 -
39 CG Industrial Holdings Sweden AB (formerly Goldcup 6699 AB ) Sweden 100.00 -
40 P-EM 2007 A/S Denmark 100.00 -
41 Crompton Greaves Holdings Sweden AB (formerly Emotron Invest AB ) Sweden 100.00 -
42 Emotron Holding AB Sweden 100.00 -
43 CG Drives and Automation Sweden AB (formerly Emotron AB) Sweden 100.00 -
44 CG Drives and Automation Netherlands B.V. (formerly Emotron B.V.) The Netherlands 100.00 -
45 Emotron Drives UK Limited United Kingdom 100.00 -
46 Emotron El-Fi UK Limited United Kingdom 100.00 -
47 CG Drives and Automations Germany GmbH Germany 100.00 -
48 Emotron Lift Center GmbH - Germany (merged w.e.f., 16th January, 2012) Germany - -
49 Scandialogic AB Sweden 100.00 -
50 Emotron Drives AB Sweden 100.00 -
51 Emotron El-Fi AB Sweden 100.00 -
52 Emotron Latin America Inc. USA 100.00 -
53 CG Automation Solutions USA Inc (acquired w.e.f., 20th June, 2011) (formerly QEI, Inc) USA 100.00 -
NOTES ACCOMPANYING TO THE CONSOLIDATED FINANCIAL STATEMENTS (Contd.)
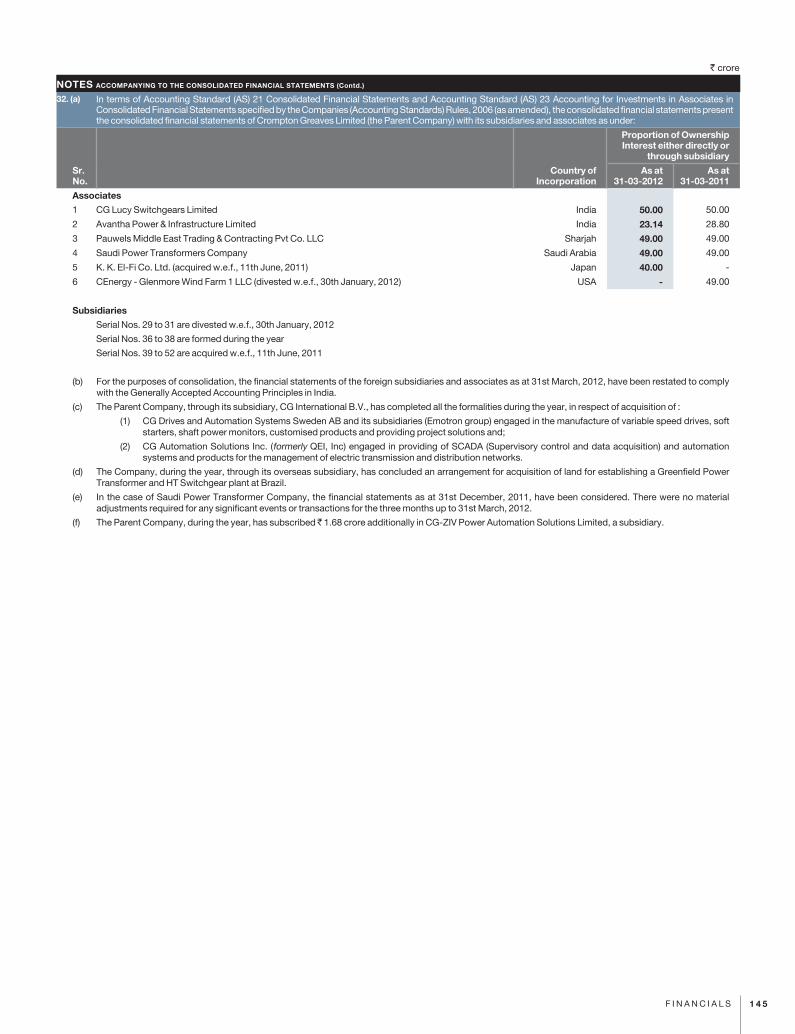
` crore
CONSOLIDATED STATEMENT OF PROFIT AND LOSS FOR THE YEAR ENDED 31ST MARCH, 2012
1 4 5F I N A N C I A L S
32. (a) In terms of Accounting Standard (AS) 21 Consolidated Financial Statements and Accounting Standard (AS) 23 Accounting for Investments in Associates in Consolidated Financial Statements specified by the Companies (Accounting Standards) Rules, 2006 (as amended), the consolidated financial statements present the consolidated financial statements of Crompton Greaves Limited (the Parent Company) with its subsidiaries and associates as under:
Sr. No.
Country of Incorporation
Proportion of Ownership Interest either directly or
through subsidiary
As at 31-03-2012
As at 31-03-2011
Associates
1 CG Lucy Switchgears Limited India 50.00 50.00
2 Avantha Power & Infrastructure Limited India 23.14 28.80
3 Pauwels Middle East Trading & Contracting Pvt Co. LLC Sharjah 49.00 49.00
4 Saudi Power Transformers Company Saudi Arabia 49.00 49.00
5 K. K. El-Fi Co. Ltd. (acquired w.e.f., 11th June, 2011) Japan 40.00 -
6 CEnergy - Glenmore Wind Farm 1 LLC (divested w.e.f., 30th January, 2012) USA - 49.00
Subsidiaries
Serial Nos. 29 to 31 are divested w.e.f., 30th January, 2012
Serial Nos. 36 to 38 are formed during the year
Serial Nos. 39 to 52 are acquired w.e.f., 11th June, 2011
(b) For the purposes of consolidation, the financial statements of the foreign subsidiaries and associates as at 31st March, 2012, have been restated to comply with the Generally Accepted Accounting Principles in India.
(c) The Parent Company, through its subsidiary, CG International B.V., has completed all the formalities during the year, in respect of acquisition of :
(1) CG Drives and Automation Systems Sweden AB and its subsidiaries (Emotron group) engaged in the manufacture of variable speed drives, soft starters, shaft power monitors, customised products and providing project solutions and;
(2) CG Automation Solutions Inc. (formerly QEI, Inc) engaged in providing of SCADA (Supervisory control and data acquisition) and automation systems and products for the management of electric transmission and distribution networks.
(d) The Company, during the year, through its overseas subsidiary, has concluded an arrangement for acquisition of land for establishing a Greenfield Power Transformer and HT Switchgear plant at Brazil.
(e) In the case of Saudi Power Transformer Company, the financial statements as at 31st December, 2011, have been considered. There were no material adjustments required for any significant events or transactions for the three months up to 31st March, 2012.
(f) The Parent Company, during the year, has subscribed 1.68 crore additionally in CG-ZIV Power Automation Solutions Limited, a subsidiary.
NOTES ACCOMPANYING TO THE CONSOLIDATED FINANCIAL STATEMENTS (Contd.)
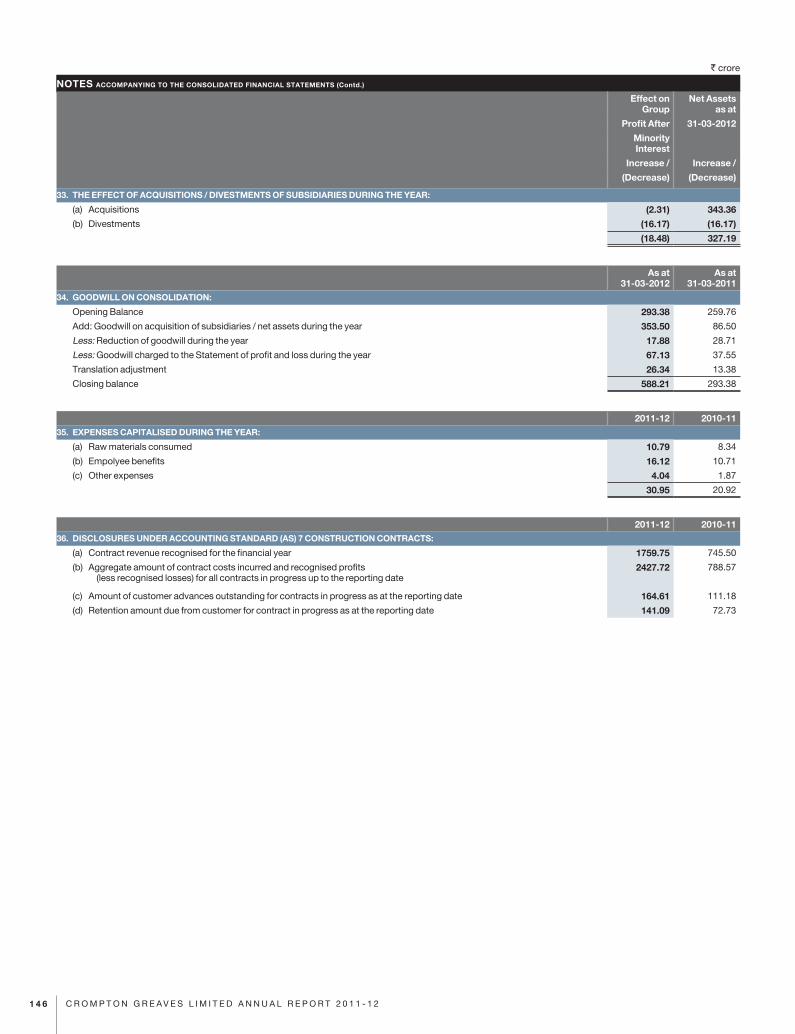
` crore
CONSOLIDATED BALANCE SHEET AS AT 31ST MARCH, 2012
1 4 6 C R O M P T O N G R E A V E S L I M I T E D A N N U A L R E P O R T 2 0 1 1 - 1 2
Effect on Group
Net Assets as at
Profit After 31-03-2012
Minority Interest
Increase / Increase /
(Decrease) (Decrease)
33. THE EFFECT OF ACQUISITIONS / DIVESTMENTS OF SUBSIDIARIES DURING THE YEAR:
(a) Acquisitions (2.31) 343.36
(b) Divestments (16.17) (16.17)
(18.48) 327.19
As at 31-03-2012
As at 31-03-2011
34. GOODWILL ON CONSOLIDATION:
Opening Balance 293.38 259.76
Add: Goodwill on acquisition of subsidiaries / net assets during the year 353.50 86.50
Less: Reduction of goodwill during the year 17.88 28.71
Less: Goodwill charged to the Statement of profit and loss during the year 67.13 37.55
Translation adjustment 26.34 13.38
Closing balance 588.21 293.38
2011-12 2010-1135. EXPENSES CAPITALISED DURING THE YEAR:
(a) Raw materials consumed 10.79 8.34
(b) Empolyee benefits 16.12 10.71
(c) Other expenses 4.04 1.87
30.95 20.92
2011-12 2010-1136. DISCLOSURES UNDER ACCOUNTING STANDARD (AS) 7 CONSTRUCTION CONTRACTS:
(a) Contract revenue recognised for the financial year 1759.75 745.50
(b) Aggregate amount of contract costs incurred and recognised profits (less recognised losses) for all contracts in progress up to the reporting date
2427.72 788.57
(c) Amount of customer advances outstanding for contracts in progress as at the reporting date 164.61 111.18
(d) Retention amount due from customer for contract in progress as at the reporting date 141.09 72.73
NOTES ACCOMPANYING TO THE CONSOLIDATED FINANCIAL STATEMENTS (Contd.)
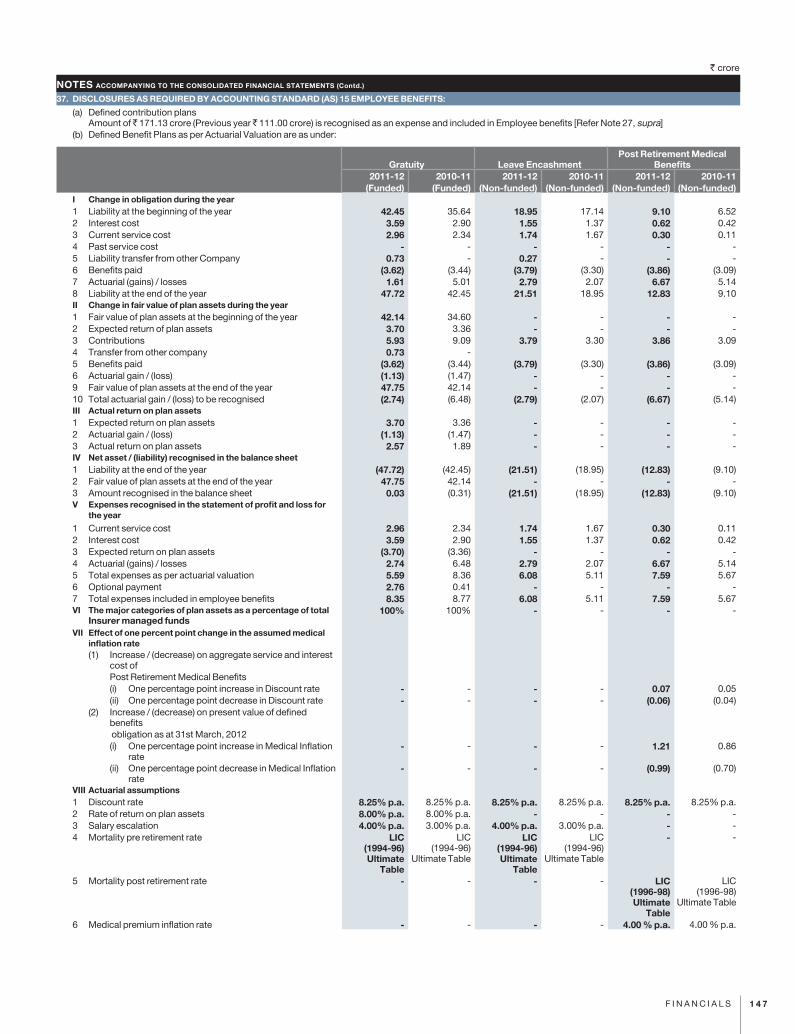
` crore
CONSOLIDATED STATEMENT OF PROFIT AND LOSS FOR THE YEAR ENDED 31ST MARCH, 2012
1 4 7F I N A N C I A L S
37. DISCLOSURES AS REQUIRED BY ACCOUNTING STANDARD (AS) 15 EMPLOYEE BENEFITS:
(a) Defined contribution plans Amount of 171.13 crore (Previous year 111.00 crore) is recognised as an expense and included in Employee benefits [Refer Note 27, supra]
(b) Defined Benefit Plans as per Actuarial Valuation are as under:
Gratuity Leave EncashmentPost Retirement Medical
Benefits2011-12 2010-11 2011-12 2010-11 2011-12 2010-11
(Funded) (Funded) (Non-funded) (Non-funded) (Non-funded) (Non-funded)I Change in obligation during the year1 Liability at the beginning of the year 42.45 35.64 18.95 17.14 9.10 6.52 2 Interest cost 3.59 2.90 1.55 1.37 0.62 0.42 3 Current service cost 2.96 2.34 1.74 1.67 0.30 0.11 4 Past service cost - - - - - - 5 Liability transfer from other Company 0.73 - 0.27 - - - 6 Benefits paid (3.62) (3.44) (3.79) (3.30) (3.86) (3.09)7 Actuarial (gains) / losses 1.61 5.01 2.79 2.07 6.67 5.14 8 Liability at the end of the year 47.72 42.45 21.51 18.95 12.83 9.10 II Change in fair value of plan assets during the year1 Fair value of plan assets at the beginning of the year 42.14 34.60 - - - - 2 Expected return of plan assets 3.70 3.36 - - - - 3 Contributions 5.93 9.09 3.79 3.30 3.86 3.09 4 Transfer from other company 0.73 - 5 Benefits paid (3.62) (3.44) (3.79) (3.30) (3.86) (3.09)6 Actuarial gain / (loss) (1.13) (1.47) - - - - 9 Fair value of plan assets at the end of the year 47.75 42.14 - - - - 10 Total actuarial gain / (loss) to be recognised (2.74) (6.48) (2.79) (2.07) (6.67) (5.14)III Actual return on plan assets1 Expected return on plan assets 3.70 3.36 - - - - 2 Actuarial gain / (loss) (1.13) (1.47) - - - - 3 Actual return on plan assets 2.57 1.89 - - - - IV Net asset / (liability) recognised in the balance sheet 1 Liability at the end of the year (47.72) (42.45) (21.51) (18.95) (12.83) (9.10)2 Fair value of plan assets at the end of the year 47.75 42.14 - - - - 3 Amount recognised in the balance sheet 0.03 (0.31) (21.51) (18.95) (12.83) (9.10)V Expenses recognised in the statement of profit and loss for
the year
1 Current service cost 2.96 2.34 1.74 1.67 0.30 0.11 2 Interest cost 3.59 2.90 1.55 1.37 0.62 0.42 3 Expected return on plan assets (3.70) (3.36) - - - - 4 Actuarial (gains) / losses 2.74 6.48 2.79 2.07 6.67 5.14 5 Total expenses as per actuarial valuation 5.59 8.36 6.08 5.11 7.59 5.67 6 Optional payment 2.76 0.41 - - - - 7 Total expenses included in employee benefits 8.35 8.77 6.08 5.11 7.59 5.67 VI The major categories of plan assets as a percentage of total
Insurer managed funds 100% 100% - - - -
VII Effect of one percent point change in the assumed medical inflation rate (1) Increase / (decrease) on aggregate service and interest
cost of Post Retirement Medical Benefits(i) One percentage point increase in Discount rate - - - - 0.07 0.05(ii) One percentage point decrease in Discount rate - - - - (0.06) (0.04)
(2) Increase / (decrease) on present value of defined benefits obligation as at 31st March, 2012(i) One percentage point increase in Medical Inflation
rate - - - - 1.21 0.86
(ii) One percentage point decrease in Medical Inflation rate
- - - - (0.99) (0.70)
VIII Actuarial assumptions1 Discount rate 8.25% p.a. 8.25% p.a. 8.25% p.a. 8.25% p.a. 8.25% p.a. 8.25% p.a.2 Rate of return on plan assets 8.00% p.a. 8.00% p.a. - - - - 3 Salary escalation 4.00% p.a. 3.00% p.a. 4.00% p.a. 3.00% p.a. - - 4 Mortality pre retirement rate LIC
(1994-96) Ultimate
Table
LIC (1994-96)
Ultimate Table
LIC (1994-96) Ultimate
Table
LIC (1994-96)
Ultimate Table
- -
5 Mortality post retirement rate - - - - LIC (1996-98) Ultimate
Table
LIC (1996-98)
Ultimate Table
6 Medical premium inflation rate - - - - 4.00 % p.a. 4.00 % p.a.
NOTES ACCOMPANYING TO THE CONSOLIDATED FINANCIAL STATEMENTS (Contd.)
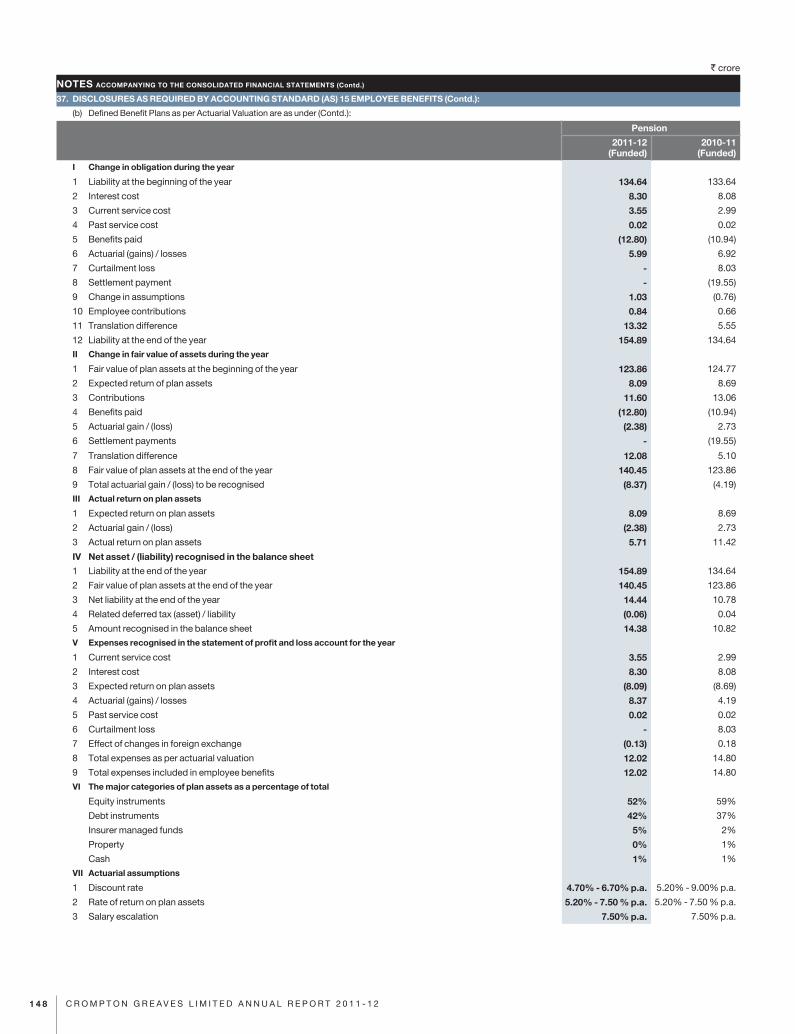
` crore
CONSOLIDATED BALANCE SHEET AS AT 31ST MARCH, 2012
1 4 8 C R O M P T O N G R E A V E S L I M I T E D A N N U A L R E P O R T 2 0 1 1 - 1 2
37. DISCLOSURES AS REQUIRED BY ACCOUNTING STANDARD (AS) 15 EMPLOYEE BENEFITS (Contd.):
(b) Defined Benefit Plans as per Actuarial Valuation are as under (Contd.):
Pension
2011-12 (Funded)
2010-11 (Funded)
I Change in obligation during the year
1 Liability at the beginning of the year 134.64 133.64
2 Interest cost 8.30 8.08
3 Current service cost 3.55 2.99
4 Past service cost 0.02 0.02
5 Benefits paid (12.80) (10.94)
6 Actuarial (gains) / losses 5.99 6.92
7 Curtailment loss - 8.03
8 Settlement payment - (19.55)
9 Change in assumptions 1.03 (0.76)
10 Employee contributions 0.84 0.66
11 Translation difference 13.32 5.55
12 Liability at the end of the year 154.89 134.64
II Change in fair value of assets during the year
1 Fair value of plan assets at the beginning of the year 123.86 124.77
2 Expected return of plan assets 8.09 8.69
3 Contributions 11.60 13.06
4 Benefits paid (12.80) (10.94)
5 Actuarial gain / (loss) (2.38) 2.73
6 Settlement payments - (19.55)
7 Translation difference 12.08 5.10
8 Fair value of plan assets at the end of the year 140.45 123.86
9 Total actuarial gain / (loss) to be recognised (8.37) (4.19)
III Actual return on plan assets
1 Expected return on plan assets 8.09 8.69
2 Actuarial gain / (loss) (2.38) 2.73
3 Actual return on plan assets 5.71 11.42
IV Net asset / (liability) recognised in the balance sheet
1 Liability at the end of the year 154.89 134.64
2 Fair value of plan assets at the end of the year 140.45 123.86
3 Net liability at the end of the year 14.44 10.78
4 Related deferred tax (asset) / liability (0.06) 0.04
5 Amount recognised in the balance sheet 14.38 10.82
V Expenses recognised in the statement of profit and loss account for the year
1 Current service cost 3.55 2.99
2 Interest cost 8.30 8.08
3 Expected return on plan assets (8.09) (8.69)
4 Actuarial (gains) / losses 8.37 4.19
5 Past service cost 0.02 0.02
6 Curtailment loss - 8.03
7 Effect of changes in foreign exchange (0.13) 0.18
8 Total expenses as per actuarial valuation 12.02 14.80
9 Total expenses included in employee benefits 12.02 14.80
VI The major categories of plan assets as a percentage of total
Equity instruments 52% 59%
Debt instruments 42% 37%
Insurer managed funds 5% 2%
Property 0% 1%
Cash 1% 1%
VII Actuarial assumptions
1 Discount rate 4.70% - 6.70% p.a. 5.20% - 9.00% p.a.
2 Rate of return on plan assets 5.20% - 7.50 % p.a. 5.20% - 7.50 % p.a.
3 Salary escalation 7.50% p.a. 7.50% p.a.
NOTES ACCOMPANYING TO THE CONSOLIDATED FINANCIAL STATEMENTS (Contd.)
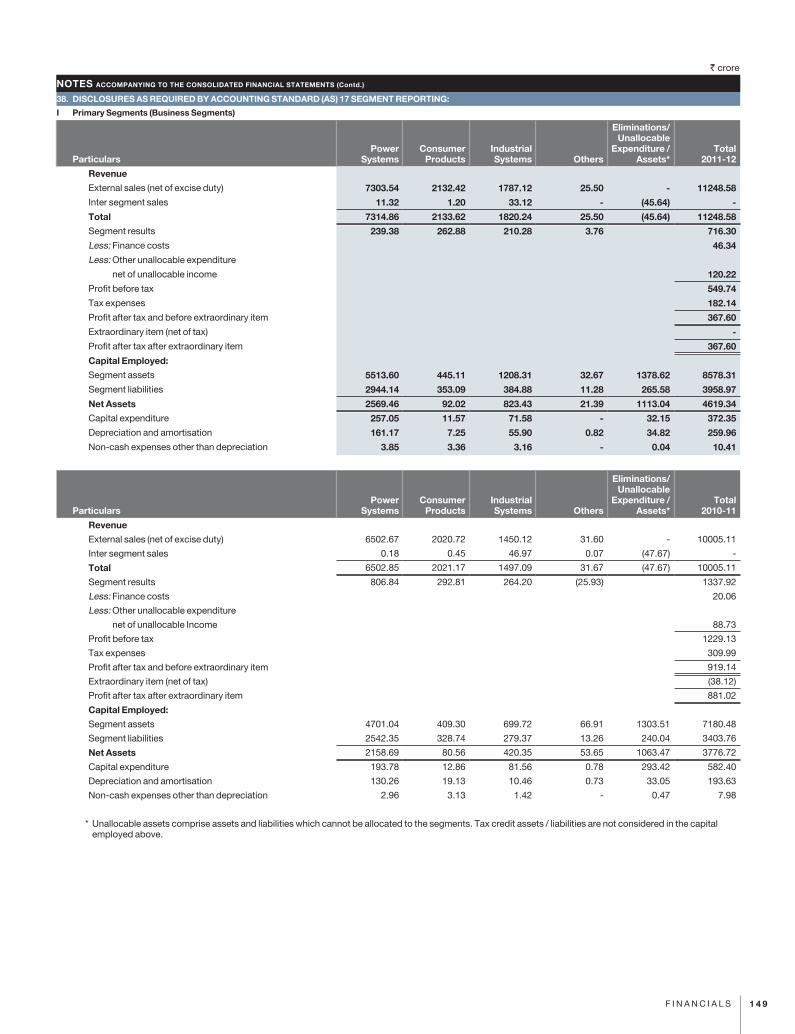
` crore
CONSOLIDATED STATEMENT OF PROFIT AND LOSS FOR THE YEAR ENDED 31ST MARCH, 2012
1 4 9F I N A N C I A L S
38. DISCLOSURES AS REQUIRED BY ACCOUNTING STANDARD (AS) 17 SEGMENT REPORTING:
I Primary Segments (Business Segments)
ParticularsPower
SystemsConsumer
ProductsIndustrialSystems Others
Eliminations/Unallocable
Expenditure /Assets*
Total2011-12
Revenue
External sales (net of excise duty) 7303.54 2132.42 1787.12 25.50 - 11248.58
Inter segment sales 11.32 1.20 33.12 - (45.64) -
Total 7314.86 2133.62 1820.24 25.50 (45.64) 11248.58
Segment results 239.38 262.88 210.28 3.76 716.30
Less: Finance costs 46.34
Less: Other unallocable expenditure
net of unallocable income 120.22
Profit before tax 549.74
Tax expenses 182.14
Profit after tax and before extraordinary item 367.60
Extraordinary item (net of tax) -
Profit after tax after extraordinary item 367.60
Capital Employed:
Segment assets 5513.60 445.11 1208.31 32.67 1378.62 8578.31
Segment liabilities 2944.14 353.09 384.88 11.28 265.58 3958.97
Net Assets 2569.46 92.02 823.43 21.39 1113.04 4619.34
Capital expenditure 257.05 11.57 71.58 - 32.15 372.35
Depreciation and amortisation 161.17 7.25 55.90 0.82 34.82 259.96
Non-cash expenses other than depreciation 3.85 3.36 3.16 - 0.04 10.41
Particulars Power
SystemsConsumer
ProductsIndustrialSystems Others
Eliminations/Unallocable
Expenditure /Assets*
Total2010-11
Revenue
External sales (net of excise duty) 6502.67 2020.72 1450.12 31.60 - 10005.11
Inter segment sales 0.18 0.45 46.97 0.07 (47.67) -
Total 6502.85 2021.17 1497.09 31.67 (47.67) 10005.11
Segment results 806.84 292.81 264.20 (25.93) 1337.92
Less: Finance costs 20.06
Less: Other unallocable expenditure
net of unallocable Income 88.73
Profit before tax 1229.13
Tax expenses 309.99
Profit after tax and before extraordinary item 919.14
Extraordinary item (net of tax) (38.12)
Profit after tax after extraordinary item 881.02
Capital Employed:
Segment assets 4701.04 409.30 699.72 66.91 1303.51 7180.48
Segment liabilities 2542.35 328.74 279.37 13.26 240.04 3403.76
Net Assets 2158.69 80.56 420.35 53.65 1063.47 3776.72
Capital expenditure 193.78 12.86 81.56 0.78 293.42 582.40
Depreciation and amortisation 130.26 19.13 10.46 0.73 33.05 193.63
Non-cash expenses other than depreciation 2.96 3.13 1.42 - 0.47 7.98
* Unallocable assets comprise assets and liabilities which cannot be allocated to the segments. Tax credit assets / liabilities are not considered in the capital employed above.
NOTES ACCOMPANYING TO THE CONSOLIDATED FINANCIAL STATEMENTS (Contd.)
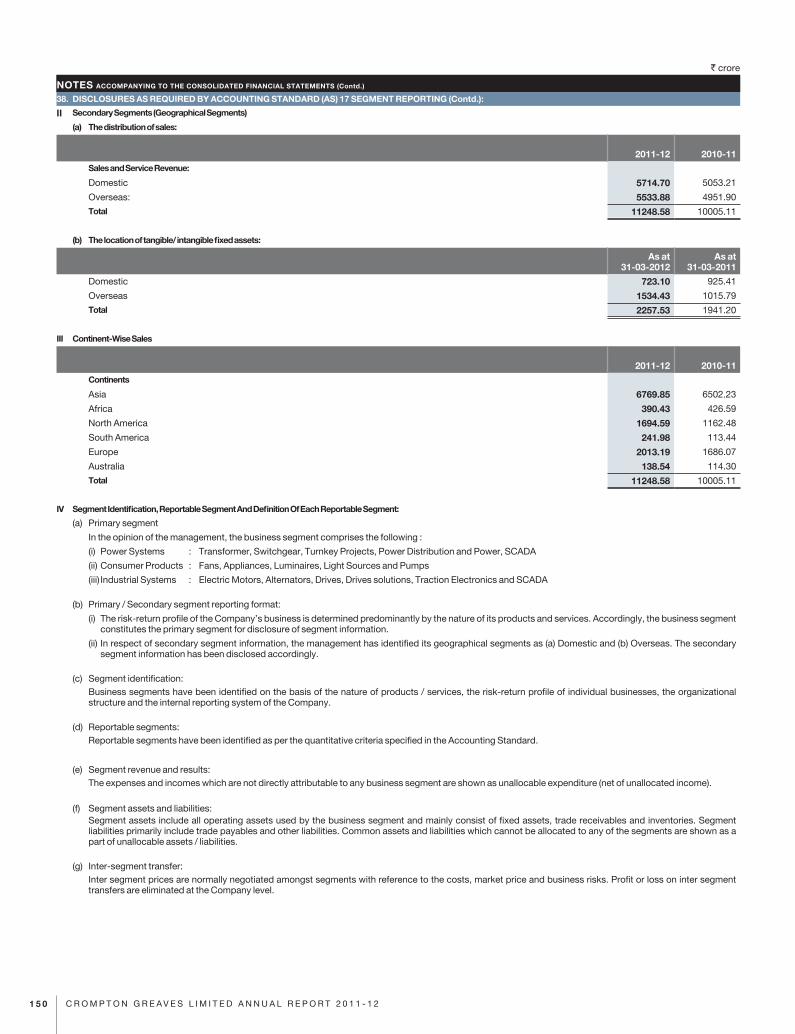
` crore
CONSOLIDATED BALANCE SHEET AS AT 31ST MARCH, 2012
1 5 0 C R O M P T O N G R E A V E S L I M I T E D A N N U A L R E P O R T 2 0 1 1 - 1 2
38. DISCLOSURES AS REQUIRED BY ACCOUNTING STANDARD (AS) 17 SEGMENT REPORTING (Contd.):
II Secondary Segments (Geographical Segments)
(a) The distribution of sales:
2011-12 2010-11Sales and Service Revenue:
Domestic 5714.70 5053.21
Overseas: 5533.88 4951.90
Total 11248.58 10005.11
(b) The location of tangible/ intangible fixed assets:
As at 31-03-2012
As at 31-03-2011
Domestic 723.10 925.41
Overseas 1534.43 1015.79
Total 2257.53 1941.20
III Continent-Wise Sales
2011-12 2010-11Continents
Asia 6769.85 6502.23
Africa 390.43 426.59
North America 1694.59 1162.48
South America 241.98 113.44
Europe 2013.19 1686.07
Australia 138.54 114.30
Total 11248.58 10005.11
IV Segment Identification, Reportable Segment And Definition Of Each Reportable Segment:
(a) Primary segment
In the opinion of the management, the business segment comprises the following :
(i) Power Systems : Transformer, Switchgear, Turnkey Projects, Power Distribution and Power, SCADA
(ii) Consumer Products : Fans, Appliances, Luminaires, Light Sources and Pumps
(iii) Industrial Systems : Electric Motors, Alternators, Drives, Drives solutions, Traction Electronics and SCADA
(b) Primary / Secondary segment reporting format:
(i) The risk-return profile of the Company’s business is determined predominantly by the nature of its products and services. Accordingly, the business segment constitutes the primary segment for disclosure of segment information.
(ii) In respect of secondary segment information, the management has identified its geographical segments as (a) Domestic and (b) Overseas. The secondary segment information has been disclosed accordingly.
(c) Segment identification:Business segments have been identified on the basis of the nature of products / services, the risk-return profile of individual businesses, the organizational structure and the internal reporting system of the Company.
(d) Reportable segments:Reportable segments have been identified as per the quantitative criteria specified in the Accounting Standard.
(e) Segment revenue and results:The expenses and incomes which are not directly attributable to any business segment are shown as unallocable expenditure (net of unallocated income).
(f) Segment assets and liabilities:Segment assets include all operating assets used by the business segment and mainly consist of fixed assets, trade receivables and inventories. Segment liabilities primarily include trade payables and other liabilities. Common assets and liabilities which cannot be allocated to any of the segments are shown as a part of unallocable assets / liabilities.
(g) Inter-segment transfer:Inter segment prices are normally negotiated amongst segments with reference to the costs, market price and business risks. Profit or loss on inter segment transfers are eliminated at the Company level.
NOTES ACCOMPANYING TO THE CONSOLIDATED FINANCIAL STATEMENTS (Contd.)
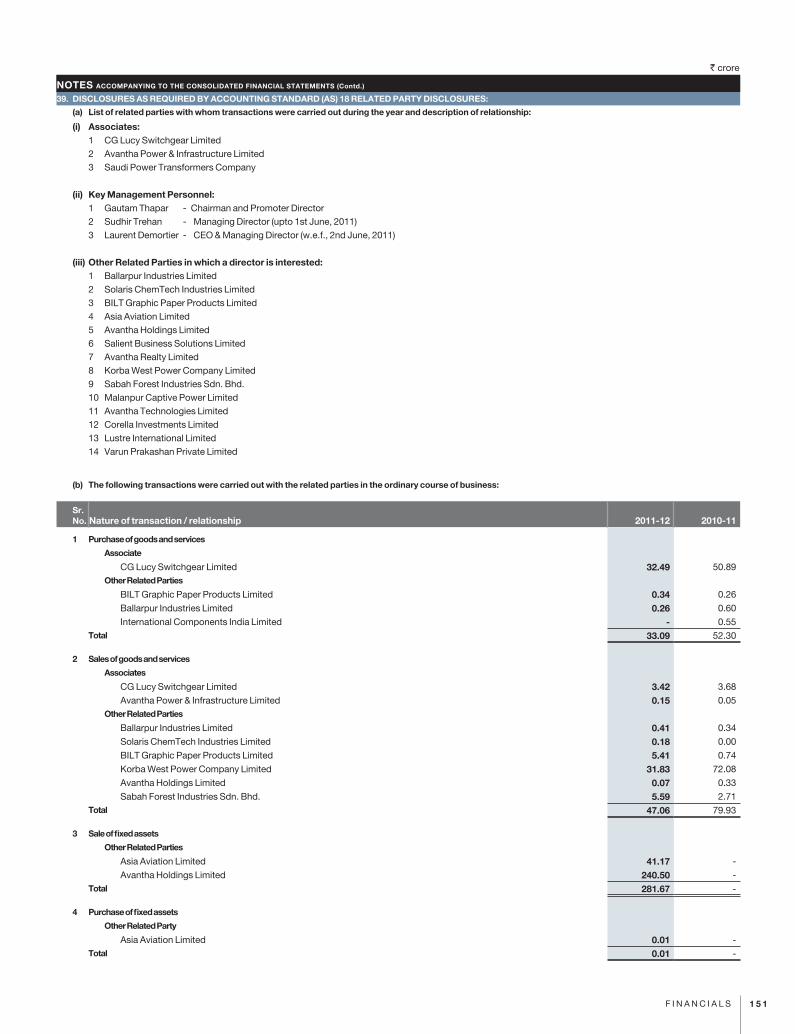
` crore
CONSOLIDATED STATEMENT OF PROFIT AND LOSS FOR THE YEAR ENDED 31ST MARCH, 2012
1 5 1F I N A N C I A L S
39. DISCLOSURES AS REQUIRED BY ACCOUNTING STANDARD (AS) 18 RELATED PARTY DISCLOSURES:
(a) List of related parties with whom transactions were carried out during the year and description of relationship:
(i) Associates:1 CG Lucy Switchgear Limited2 Avantha Power & Infrastructure Limited 3 Saudi Power Transformers Company
(ii) Key Management Personnel:1 Gautam Thapar - Chairman and Promoter Director2 Sudhir Trehan - Managing Director (upto 1st June, 2011)3 Laurent Demortier - CEO & Managing Director (w.e.f., 2nd June, 2011)
(iii) Other Related Parties in which a director is interested:1 Ballarpur Industries Limited2 Solaris ChemTech Industries Limited3 BILT Graphic Paper Products Limited4 Asia Aviation Limited5 Avantha Holdings Limited6 Salient Business Solutions Limited7 Avantha Realty Limited8 Korba West Power Company Limited9 Sabah Forest Industries Sdn. Bhd.10 Malanpur Captive Power Limited11 Avantha Technologies Limited12 Corella Investments Limited13 Lustre International Limited14 Varun Prakashan Private Limited
(b) The following transactions were carried out with the related parties in the ordinary course of business:
Sr. No. Nature of transaction / relationship 2011-12 2010-11
1 Purchase of goods and services
Associate
CG Lucy Switchgear Limited 32.49 50.89Other Related Parties
BILT Graphic Paper Products Limited 0.34 0.26
Ballarpur Industries Limited 0.26 0.60
International Components India Limited - 0.55Total 33.09 52.30
2 Sales of goods and services
Associates
CG Lucy Switchgear Limited 3.42 3.68
Avantha Power & Infrastructure Limited 0.15 0.05Other Related Parties
Ballarpur Industries Limited 0.41 0.34
Solaris ChemTech Industries Limited 0.18 0.00
BILT Graphic Paper Products Limited 5.41 0.74
Korba West Power Company Limited 31.83 72.08
Avantha Holdings Limited 0.07 0.33
Sabah Forest Industries Sdn. Bhd. 5.59 2.71Total 47.06 79.93
3 Sale of fixed assets
Other Related Parties
Asia Aviation Limited 41.17 -
Avantha Holdings Limited 240.50 - Total 281.67 -
4 Purchase of fixed assets
Other Related Party
Asia Aviation Limited 0.01 - Total 0.01 -
NOTES ACCOMPANYING TO THE CONSOLIDATED FINANCIAL STATEMENTS (Contd.)
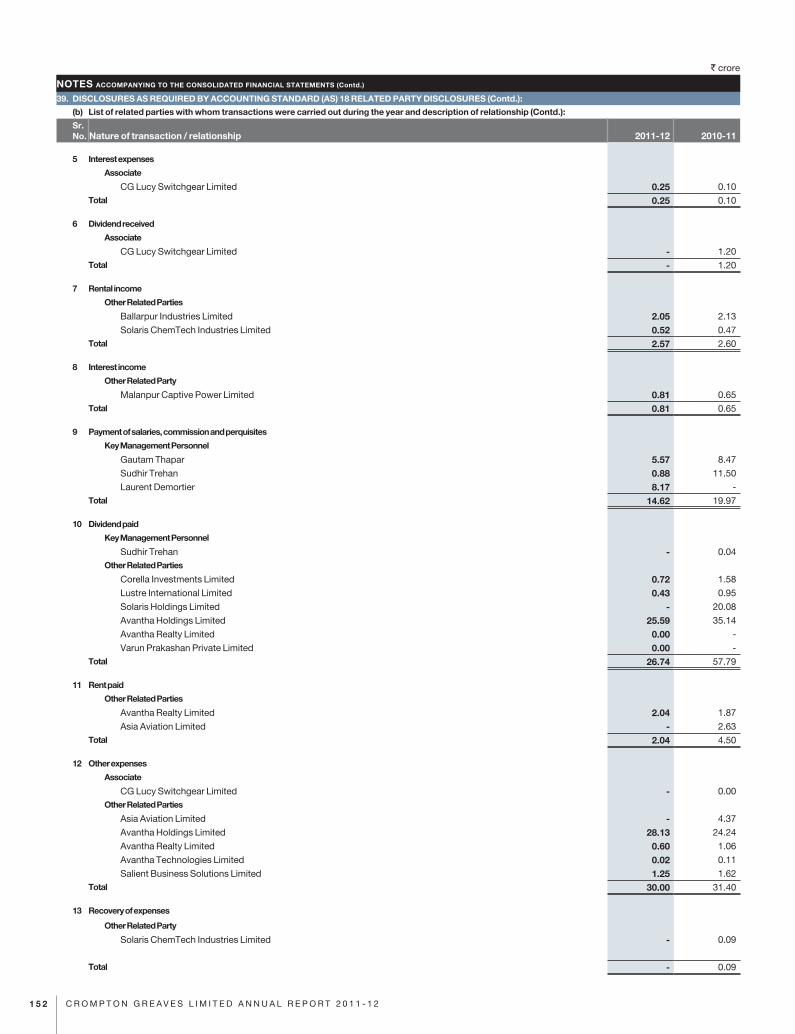
` crore
CONSOLIDATED BALANCE SHEET AS AT 31ST MARCH, 2012
1 5 2 C R O M P T O N G R E A V E S L I M I T E D A N N U A L R E P O R T 2 0 1 1 - 1 2
39. DISCLOSURES AS REQUIRED BY ACCOUNTING STANDARD (AS) 18 RELATED PARTY DISCLOSURES (Contd.):
(b) List of related parties with whom transactions were carried out during the year and description of relationship (Contd.):
Sr. No. Nature of transaction / relationship 2011-12 2010-11
5 Interest expenses
Associate
CG Lucy Switchgear Limited 0.25 0.10Total 0.25 0.10
6 Dividend received
Associate
CG Lucy Switchgear Limited - 1.20Total - 1.20
7 Rental income
Other Related Parties
Ballarpur Industries Limited 2.05 2.13
Solaris ChemTech Industries Limited 0.52 0.47Total 2.57 2.60
8 Interest income
Other Related Party
Malanpur Captive Power Limited 0.81 0.65Total 0.81 0.65
9 Payment of salaries, commission and perquisites
Key Management Personnel
Gautam Thapar 5.57 8.47
Sudhir Trehan 0.88 11.50
Laurent Demortier 8.17 - Total 14.62 19.97
10 Dividend paid
Key Management Personnel
Sudhir Trehan - 0.04Other Related Parties
Corella Investments Limited 0.72 1.58
Lustre International Limited 0.43 0.95
Solaris Holdings Limited - 20.08
Avantha Holdings Limited 25.59 35.14
Avantha Realty Limited 0.00 -
Varun Prakashan Private Limited 0.00 - Total 26.74 57.79
11 Rent paid
Other Related Parties
Avantha Realty Limited 2.04 1.87
Asia Aviation Limited - 2.63Total 2.04 4.50
12 Other expenses
Associate
CG Lucy Switchgear Limited - 0.00Other Related Parties
Asia Aviation Limited - 4.37
Avantha Holdings Limited 28.13 24.24
Avantha Realty Limited 0.60 1.06
Avantha Technologies Limited 0.02 0.11
Salient Business Solutions Limited 1.25 1.62Total 30.00 31.40
13 Recovery of expenses
Other Related Party
Solaris ChemTech Industries Limited - 0.09
Total - 0.09
NOTES ACCOMPANYING TO THE CONSOLIDATED FINANCIAL STATEMENTS (Contd.)
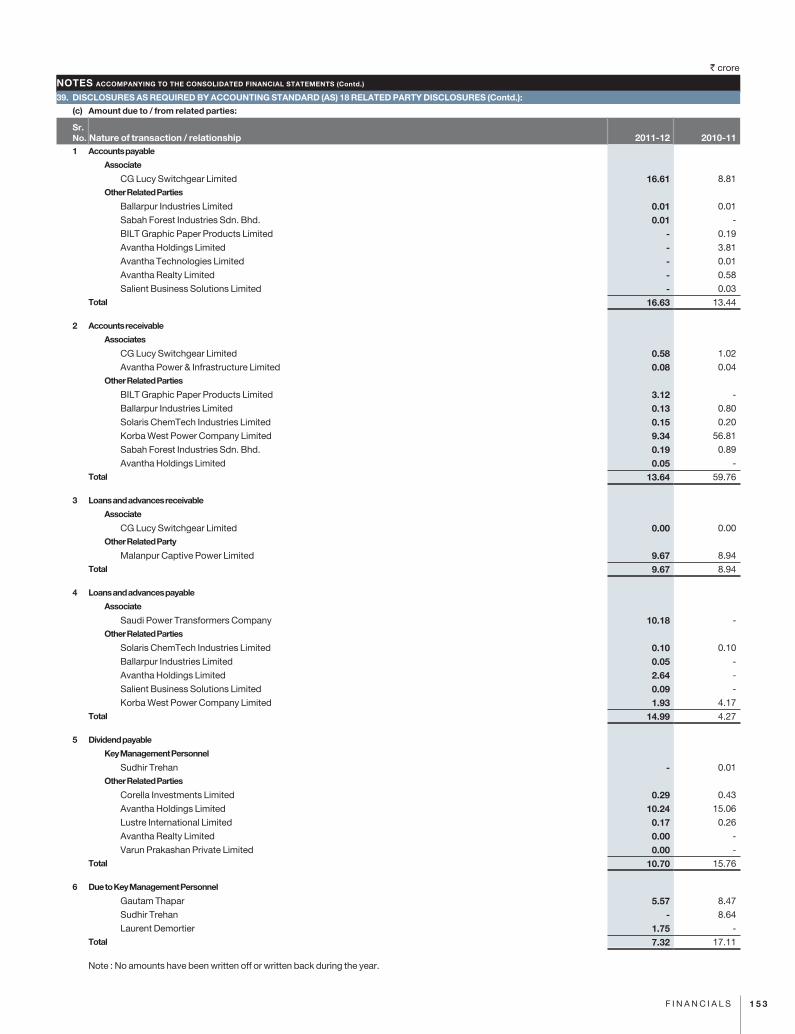
` crore
CONSOLIDATED STATEMENT OF PROFIT AND LOSS FOR THE YEAR ENDED 31ST MARCH, 2012
1 5 3F I N A N C I A L S
39. DISCLOSURES AS REQUIRED BY ACCOUNTING STANDARD (AS) 18 RELATED PARTY DISCLOSURES (Contd.):
(c) Amount due to / from related parties:
Sr. No. Nature of transaction / relationship 2011-12 2010-11 1 Accounts payable
Associate
CG Lucy Switchgear Limited 16.61 8.81Other Related Parties
Ballarpur Industries Limited 0.01 0.01
Sabah Forest Industries Sdn. Bhd. 0.01 -
BILT Graphic Paper Products Limited - 0.19
Avantha Holdings Limited - 3.81
Avantha Technologies Limited - 0.01
Avantha Realty Limited - 0.58
Salient Business Solutions Limited - 0.03Total 16.63 13.44
2 Accounts receivable
Associates
CG Lucy Switchgear Limited 0.58 1.02
Avantha Power & Infrastructure Limited 0.08 0.04Other Related Parties
BILT Graphic Paper Products Limited 3.12 -
Ballarpur Industries Limited 0.13 0.80
Solaris ChemTech Industries Limited 0.15 0.20
Korba West Power Company Limited 9.34 56.81
Sabah Forest Industries Sdn. Bhd. 0.19 0.89
Avantha Holdings Limited 0.05 - Total 13.64 59.76
3 Loans and advances receivable
Associate
CG Lucy Switchgear Limited 0.00 0.00Other Related Party
Malanpur Captive Power Limited 9.67 8.94Total 9.67 8.94
4 Loans and advances payable
Associate
Saudi Power Transformers Company 10.18 - Other Related Parties
Solaris ChemTech Industries Limited 0.10 0.10
Ballarpur Industries Limited 0.05 -
Avantha Holdings Limited 2.64 -
Salient Business Solutions Limited 0.09 -
Korba West Power Company Limited 1.93 4.17Total 14.99 4.27
5 Dividend payable
Key Management Personnel
Sudhir Trehan - 0.01Other Related Parties
Corella Investments Limited 0.29 0.43
Avantha Holdings Limited 10.24 15.06
Lustre International Limited 0.17 0.26
Avantha Realty Limited 0.00 -
Varun Prakashan Private Limited 0.00 - Total 10.70 15.76
6 Due to Key Management Personnel
Gautam Thapar 5.57 8.47
Sudhir Trehan - 8.64
Laurent Demortier 1.75 - Total 7.32 17.11
Note : No amounts have been written off or written back during the year.
NOTES ACCOMPANYING TO THE CONSOLIDATED FINANCIAL STATEMENTS (Contd.)
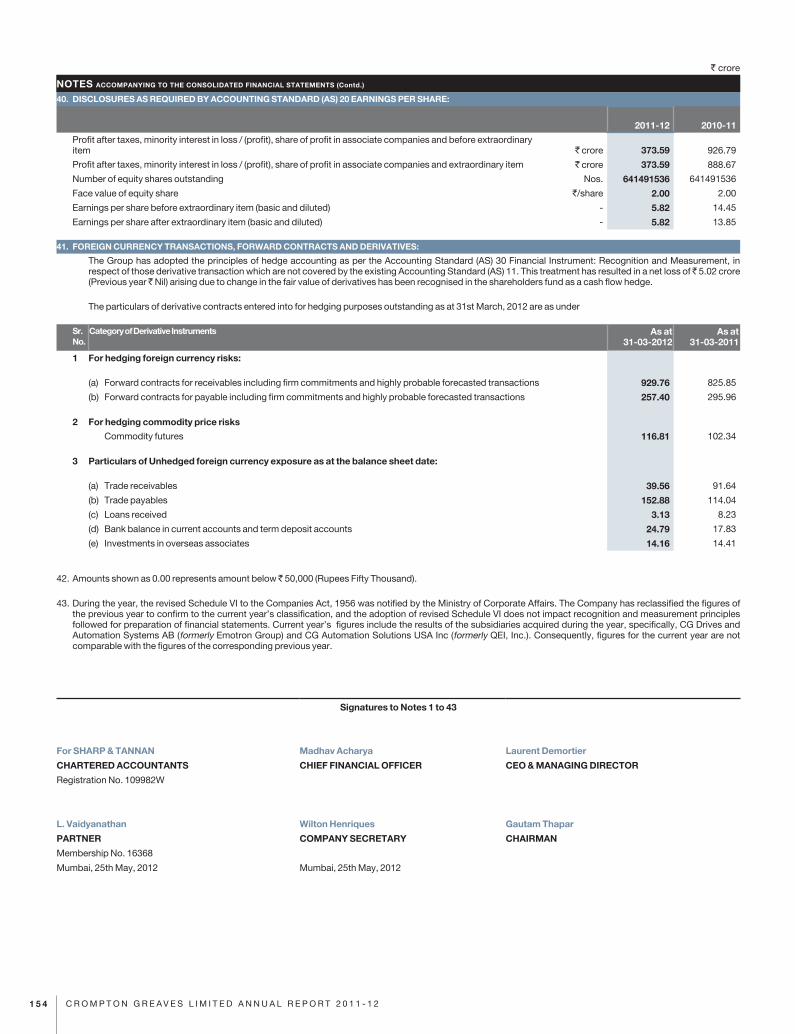
` crore
CONSOLIDATED BALANCE SHEET AS AT 31ST MARCH, 2012
1 5 4 C R O M P T O N G R E A V E S L I M I T E D A N N U A L R E P O R T 2 0 1 1 - 1 2
40. DISCLOSURES AS REQUIRED BY ACCOUNTING STANDARD (AS) 20 EARNINGS PER SHARE:
2011-12 2010-11
Profit after taxes, minority interest in loss / (profit), share of profit in associate companies and before extraordinary item ` crore 373.59 926.79
Profit after taxes, minority interest in loss / (profit), share of profit in associate companies and extraordinary item ` crore 373.59 888.67
Number of equity shares outstanding Nos. 641491536 641491536
Face value of equity share `/share 2.00 2.00
Earnings per share before extraordinary item (basic and diluted) - 5.82 14.45
Earnings per share after extraordinary item (basic and diluted) - 5.82 13.85
41. FOREIGN CURRENCY TRANSACTIONS, FORWARD CONTRACTS AND DERIVATIVES:
The Group has adopted the principles of hedge accounting as per the Accounting Standard (AS) 30 Financial Instrument: Recognition and Measurement, in respect of those derivative transaction which are not covered by the existing Accounting Standard (AS) 11. This treatment has resulted in a net loss of 5.02 crore (Previous year Nil) arising due to change in the fair value of derivatives has been recognised in the shareholders fund as a cash flow hedge.
The particulars of derivative contracts entered into for hedging purposes outstanding as at 31st March, 2012 are as under
Sr. No.
Category of Derivative Instruments As at 31-03-2012
As at 31-03-2011
1 For hedging foreign currency risks:
(a) Forward contracts for receivables including firm commitments and highly probable forecasted transactions 929.76 825.85
(b) Forward contracts for payable including firm commitments and highly probable forecasted transactions 257.40 295.96
2 For hedging commodity price risks
Commodity futures 116.81 102.34
3 Particulars of Unhedged foreign currency exposure as at the balance sheet date:
(a) Trade receivables 39.56 91.64
(b) Trade payables 152.88 114.04
(c) Loans received 3.13 8.23
(d) Bank balance in current accounts and term deposit accounts 24.79 17.83
(e) Investments in overseas associates 14.16 14.41
42. Amounts shown as 0.00 represents amount below 50,000 (Rupees Fifty Thousand).
43. During the year, the revised Schedule VI to the Companies Act, 1956 was notified by the Ministry of Corporate Affairs. The Company has reclassified the figures of the previous year to confirm to the current year’s classification, and the adoption of revised Schedule VI does not impact recognition and measurement principles followed for preparation of financial statements. Current year’s figures include the results of the subsidiaries acquired during the year, specifically, CG Drives and Automation Systems AB (formerly Emotron Group) and CG Automation Solutions USA Inc (formerly QEI, Inc.). Consequently, figures for the current year are not comparable with the figures of the corresponding previous year.
Signatures to Notes 1 to 43
For SHARP & TANNAN Madhav Acharya Laurent Demortier
CHARTERED ACCOUNTANTS CHIEF FINANCIAL OFFICER CEO & MANAGING DIRECTOR
Registration No. 109982W
L. Vaidyanathan Wilton Henriques Gautam Thapar
PARTNER COMPANY SECRETARY CHAIRMAN
Membership No. 16368
Mumbai, 25th May, 2012 Mumbai, 25th May, 2012
NOTES ACCOMPANYING TO THE CONSOLIDATED FINANCIAL STATEMENTS (Contd.)

Accounts in Foreign Currency
1 5 5a c c o u n t s i n f o r e i g n c u r r e n c y
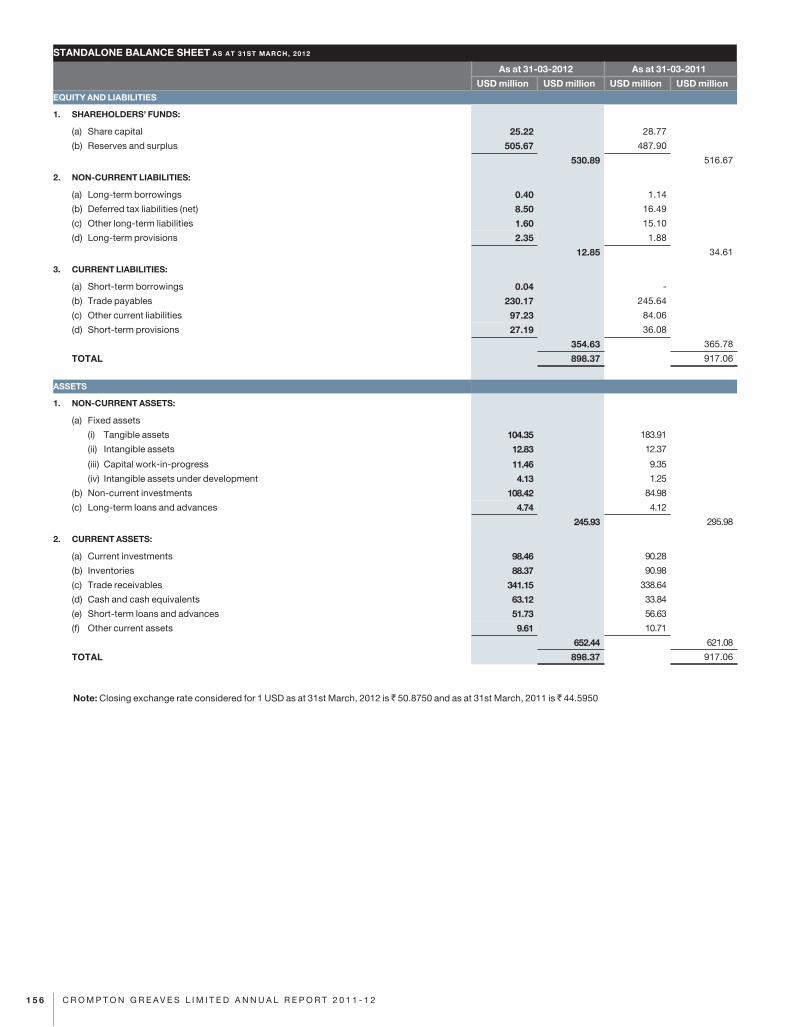
1 5 6 C R O M P T O N G R E A V E S L I M I T E D A N N U A L R E P O R T 2 0 1 1 - 1 2
STANDALONE BALANCE SHEET AS AT 31ST MARCH, 2012
As at 31-03-2012 As at 31-03-2011
USD million USD million USD million USD million EQUITY AND LIABILITIES
1. SHAREHOLDERS’ FUNDS:
(a) Sharecapital 25.22 28.77
(b) Reservesandsurplus 505.67 487.90
530.89 516.67
2. NON-CURRENT LIABILITIES:
(a) Long-termborrowings 0.40 1.14
(b) Deferredtaxliabilities(net) 8.50 16.49
(c) Otherlong-termliabilities 1.60 15.10
(d) Long-termprovisions 2.35 1.88
12.85 34.61
3. CURRENT LIABILITIES:
(a) Short-termborrowings 0.04 -
(b) Tradepayables 230.17 245.64
(c) Othercurrentliabilities 97.23 84.06
(d) Short-termprovisions 27.19 36.08
354.63 365.78
TOTAL 898.37 917.06
ASSETS
1. NON-CURRENT ASSETS:
(a) Fixedassets
(i) Tangibleassets 104.35 183.91
(ii) Intangibleassets 12.83 12.37
(iii) Capitalwork-in-progress 11.46 9.35
(iv) Intangibleassetsunderdevelopment 4.13 1.25
(b) Non-currentinvestments 108.42 84.98
(c) Long-termloansandadvances 4.74 4.12
245.93 295.98
2. CURRENT ASSETS:
(a) Currentinvestments 98.46 90.28
(b) Inventories 88.37 90.98
(c) Tradereceivables 341.15 338.64
(d) Cashandcashequivalents 63.12 33.84
(e) Short-termloansandadvances 51.73 56.63
(f) Othercurrentassets 9.61 10.71
652.44 621.08
TOTAL 898.37 917.06
Note: Closingexchangerateconsideredfor1USDasat31stMarch,2012is 50.8750andasat31stMarch,2011is 44.5950
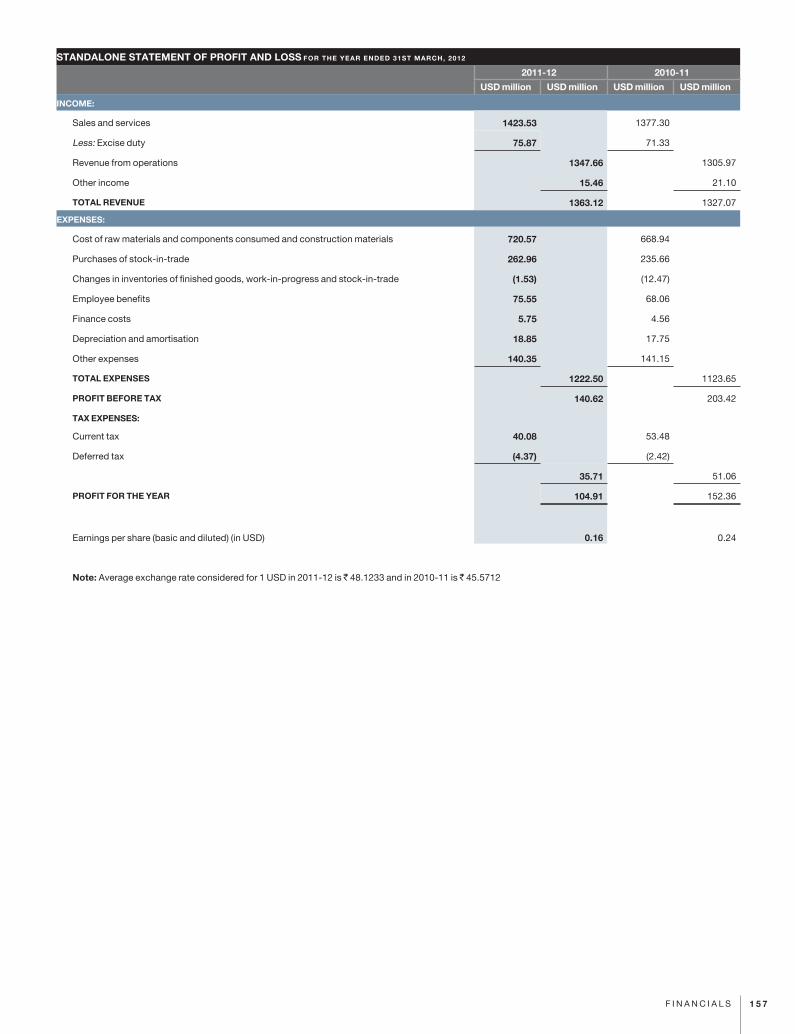
1 5 7F I N a NC I a L S
STANDALONE STATEMENT OF PROFIT AND LOSS FOR THE YEAR ENDED 31ST MARCH, 2012
2011-12 2010-11
USD million USD million USD million USD million
INCOME:
Salesandservices 1423.53 1377.30
Less:Exciseduty 75.87 71.33
Revenuefromoperations 1347.66 1305.97
Otherincome 15.46 21.10
TOTAL REVENUE 1363.12 1327.07
EXPENSES:
Costofrawmaterialsandcomponentsconsumedandconstructionmaterials 720.57 668.94
Purchasesofstock-in-trade 262.96 235.66
Changesininventoriesoffinishedgoods,work-in-progressandstock-in-trade (1.53) (12.47)
Employeebenefits 75.55 68.06
Financecosts 5.75 4.56
Depreciationandamortisation 18.85 17.75
Otherexpenses 140.35 141.15
TOTAL EXPENSES 1222.50 1123.65
PROFIT BEFORE TAX 140.62 203.42
TAX EXPENSES:
Currenttax 40.08 53.48
Deferredtax (4.37) (2.42)
35.71 51.06
PROFIT FOR THE YEAR 104.91 152.36
Earningspershare(basicanddiluted)(inUSD) 0.16 0.24
Note:averageexchangerateconsideredfor1USDin2011-12is 48.1233andin2010-11is 45.5712

1 5 8 C R O M P T O N G R E A V E S L I M I T E D A N N U A L R E P O R T 2 0 1 1 - 1 2
STANDALONE BALANCE SHEET AS AT 31ST MARCH, 2012
As at 31-03-2012 As at 31-03-2011
Euro million Euro million Euro million Euro million EQUITY AND LIABILITIES
1. SHAREHOLDERS’ FUNDS:
(a) Sharecapital 18.90 20.24
(b) Reservesandsurplus 379.06 343.28
397.96 363.52
2. NON-CURRENT LIABILITIES:
(a) Long-termborrowings 0.30 0.80
(b) Deferredtaxliabilities(net) 6.37 11.60
(c) Otherlong-termliabilities 1.20 10.63
(d) Long-termprovisions 1.76 1.33
9.63 24.36
3. CURRENT LIABILITIES:
(a) Short-termborrowings 0.03 -
(b) Tradepayables 172.55 172.83
(c) Othercurrentliabilities 72.89 59.15
(d) Short-termprovisions 20.38 25.38
265.85 257.36
TOTAL 673.44 645.24
ASSETS
1. NON-CURRENT ASSETS:
(a) Fixedassets
(i) Tangibleassets 78.22 129.40
(ii) Intangibleassets 9.62 8.70
(iii) Capitalwork-in-progress 8.59 6.57
(iv) Intangibleassetsunderdevelopment 3.10 0.88
(b) Non-currentinvestments 81.27 59.80
(c) Long-termloansandadvances 3.55 2.90
184.35 208.25
2. CURRENT ASSETS:
(a) Currentinvestments 73.81 63.52
(b) Inventories 66.25 64.01
(c) Tradereceivables 255.74 238.27
(d) Cashandcashequivalents 47.31 23.81
(e) Short-termloansandadvances 38.78 39.84
(f) Othercurrentassets 7.20 7.54
489.09 436.99
TOTAL 673.44 645.24
Note: Closingexchangerateconsideredfor1Euroasat31stMarch,2012is 67.8675andasat31stMarch,2011is 63.3825
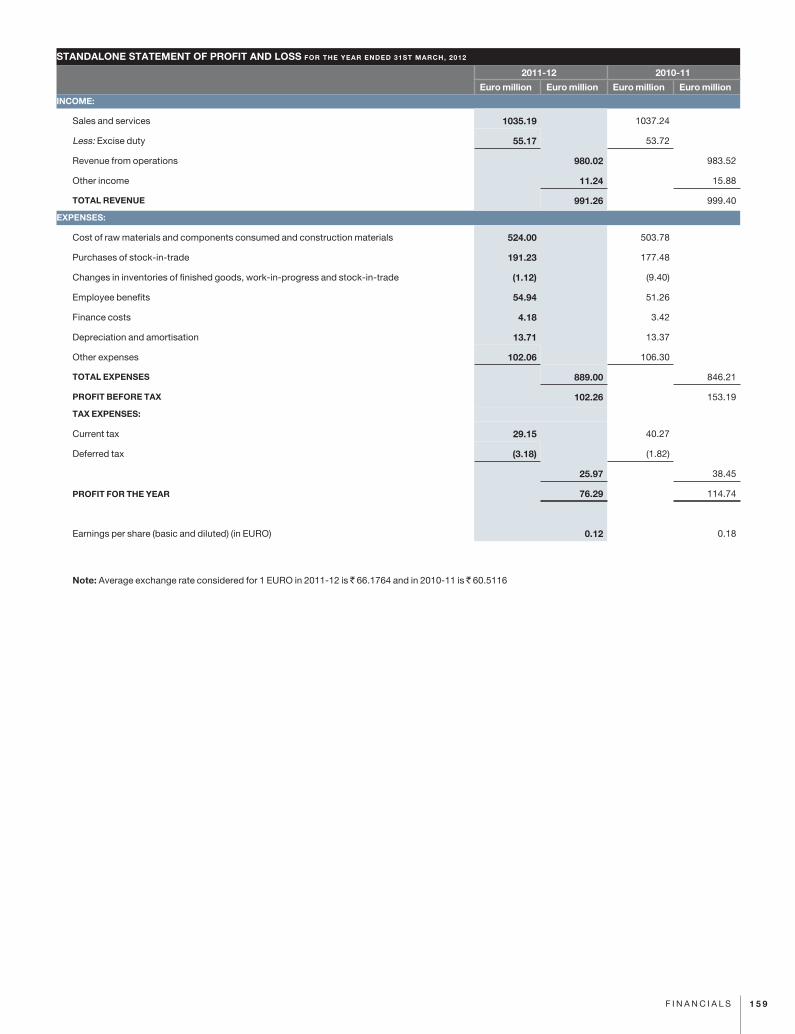
1 5 9F I N a NC I a L S
STANDALONE STATEMENT OF PROFIT AND LOSS FOR THE YEAR ENDED 31ST MARCH, 2012
2011-12 2010-11
Euro million Euro million Euro million Euro millionINCOME:
Salesandservices 1035.19 1037.24
Less:Exciseduty 55.17 53.72
Revenuefromoperations 980.02 983.52
Otherincome 11.24 15.88
TOTAL REVENUE 991.26 999.40
EXPENSES:
Costofrawmaterialsandcomponentsconsumedandconstructionmaterials 524.00 503.78
Purchasesofstock-in-trade 191.23 177.48
Changesininventoriesoffinishedgoods,work-in-progressandstock-in-trade (1.12) (9.40)
Employeebenefits 54.94 51.26
Financecosts 4.18 3.42
Depreciationandamortisation 13.71 13.37
Otherexpenses 102.06 106.30
TOTAL EXPENSES 889.00 846.21
PROFIT BEFORE TAX 102.26 153.19
TAX EXPENSES:
Currenttax 29.15 40.27
Deferredtax (3.18) (1.82)
25.97 38.45
PROFIT FOR THE YEAR 76.29 114.74
Earningspershare(basicanddiluted)(inEURO) 0.12 0.18
Note:averageexchangerateconsideredfor1EUROin2011-12is 66.1764andin2010-11is 60.5116
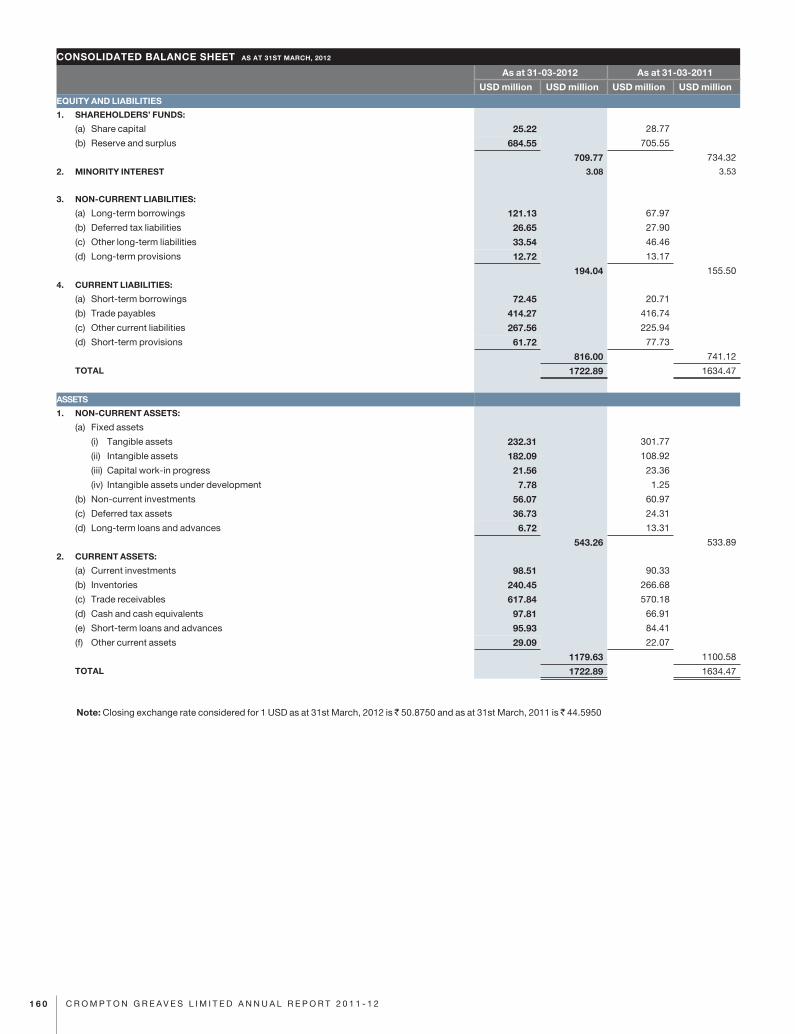
1 6 0 C R O M P T O N G R E A V E S L I M I T E D A N N U A L R E P O R T 2 0 1 1 - 1 2
As at 31-03-2012 As at 31-03-2011
USD million USD million USD million USD millionEQUITY AND LIABILITIES
1. SHAREHOLDERS’ FUNDS:
(a) Sharecapital 25.22 28.77
(b) Reserveandsurplus 684.55 705.55
709.77 734.32
2. MINORITY INTEREST 3.08 3.53
3. NON-CURRENT LIABILITIES:
(a) Long-termborrowings 121.13 67.97
(b) Deferredtaxliabilities 26.65 27.90
(c) Otherlong-termliabilities 33.54 46.46
(d) Long-termprovisions 12.72 13.17
194.04 155.50
4. CURRENT LIABILITIES:
(a) Short-termborrowings 72.45 20.71
(b) Tradepayables 414.27 416.74
(c) Othercurrentliabilities 267.56 225.94
(d) Short-termprovisions 61.72 77.73
816.00 741.12
TOTAL 1722.89 1634.47
ASSETS
1. NON-CURRENT ASSETS:
(a) Fixedassets
(i) Tangibleassets 232.31 301.77
(ii) Intangibleassets 182.09 108.92
(iii) Capitalwork-inprogress 21.56 23.36
(iv) Intangibleassetsunderdevelopment 7.78 1.25
(b) Non-currentinvestments 56.07 60.97
(c) Deferredtaxassets 36.73 24.31
(d) Long-termloansandadvances 6.72 13.31
543.26 533.89
2. CURRENT ASSETS:
(a) Currentinvestments 98.51 90.33
(b) Inventories 240.45 266.68
(c) Tradereceivables 617.84 570.18
(d) Cashandcashequivalents 97.81 66.91
(e) Short-termloansandadvances 95.93 84.41
(f) Othercurrentassets 29.09 22.07
1179.63 1100.58
TOTAL 1722.89 1634.47
Note: Closingexchangerateconsideredfor1USDasat31stMarch,2012is 50.8750andasat31stMarch,2011is 44.5950
CONSOLIDATED BALANCE SHEET AS AT 31ST MARCH, 2012
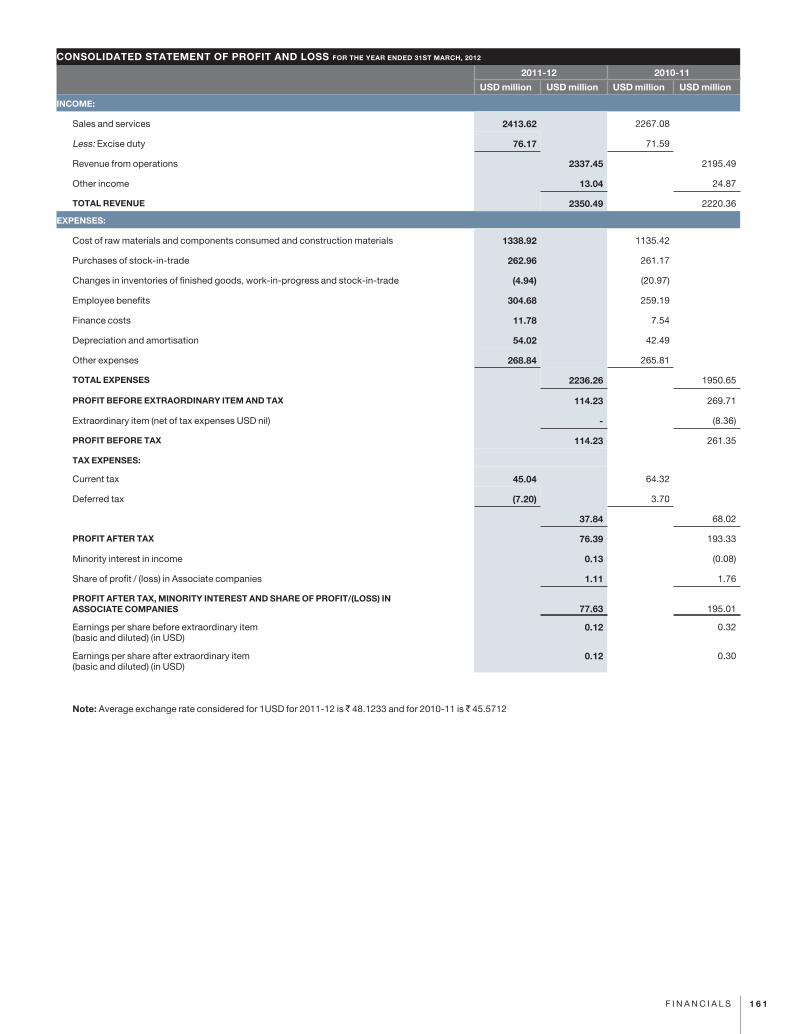
1 6 1F I N a NC I a L S
2011-12 2010-11
USD million USD million USD million USD million
INCOME:
Salesandservices 2413.62 2267.08
Less:Exciseduty 76.17 71.59
Revenuefromoperations 2337.45 2195.49
Otherincome 13.04 24.87
TOTAL REVENUE 2350.49 2220.36
EXPENSES:
Costofrawmaterialsandcomponentsconsumedandconstructionmaterials 1338.92 1135.42
Purchasesofstock-in-trade 262.96 261.17
Changesininventoriesoffinishedgoods,work-in-progressandstock-in-trade (4.94) (20.97)
Employeebenefits 304.68 259.19
Financecosts 11.78 7.54
Depreciationandamortisation 54.02 42.49
Otherexpenses 268.84 265.81
TOTAL EXPENSES 2236.26 1950.65
PROFIT BEFORE EXTRAORDINARY ITEM AND TAX 114.23 269.71
Extraordinaryitem(netoftaxexpensesUSDnil) - (8.36)
PROFIT BEFORE TAX 114.23 261.35
TAX EXPENSES:
Currenttax 45.04 64.32
Deferredtax (7.20) 3.70
37.84 68.02
PROFIT AFTER TAX 76.39 193.33
Minorityinterestinincome 0.13 (0.08)
Shareofprofit/(loss)inassociatecompanies 1.11 1.76
PROFIT AFTER TAX, MINORITY INTEREST AND SHARE OF PROFIT/(LOSS) IN ASSOCIATE COMPANIES 77.63 195.01
Earningspersharebeforeextraordinaryitem(basicanddiluted)(inUSD)
0.12 0.32
Earningspershareafterextraordinaryitem(basicanddiluted)(inUSD)
0.12 0.30
Note:averageexchangerateconsideredfor1USDfor2011-12is 48.1233andfor2010-11is 45.5712
CONSOLIDATED STATEMENT OF PROFIT AND LOSS FOR THE YEAR ENDED 31ST MARCH, 2012
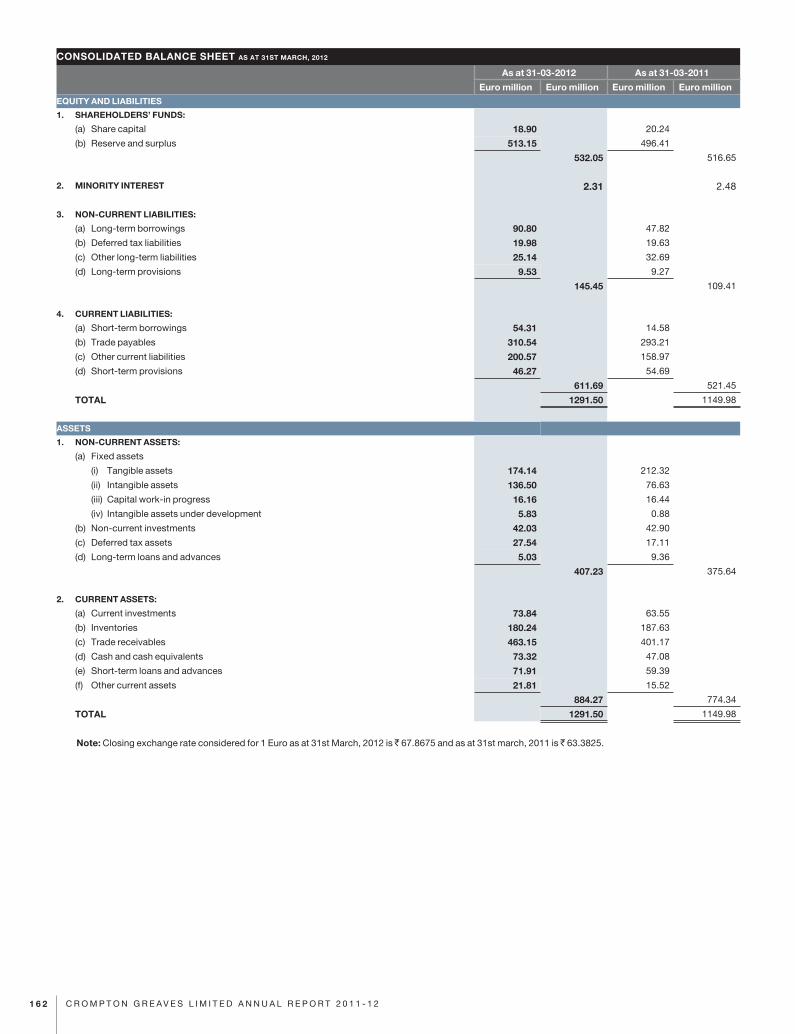
1 6 2 C R O M P T O N G R E A V E S L I M I T E D A N N U A L R E P O R T 2 0 1 1 - 1 2
As at 31-03-2012 As at 31-03-2011
Euro million Euro million Euro million Euro millionEQUITY AND LIABILITIES
1. SHAREHOLDERS’ FUNDS:
(a) Sharecapital 18.90 20.24
(b) Reserveandsurplus 513.15 496.41
532.05 516.65
2. MINORITY INTEREST 2.31 2.48
3. NON-CURRENT LIABILITIES:
(a) Long-termborrowings 90.80 47.82
(b) Deferredtaxliabilities 19.98 19.63
(c) Otherlong-termliabilities 25.14 32.69
(d) Long-termprovisions 9.53 9.27
145.45 109.41
4. CURRENT LIABILITIES:
(a) Short-termborrowings 54.31 14.58
(b) Tradepayables 310.54 293.21
(c) Othercurrentliabilities 200.57 158.97
(d) Short-termprovisions 46.27 54.69
611.69 521.45
TOTAL 1291.50 1149.98
ASSETS
1. NON-CURRENT ASSETS:
(a) Fixedassets
(i) Tangibleassets 174.14 212.32
(ii) Intangibleassets 136.50 76.63
(iii) Capitalwork-inprogress 16.16 16.44
(iv) Intangibleassetsunderdevelopment 5.83 0.88
(b) Non-currentinvestments 42.03 42.90
(c) Deferredtaxassets 27.54 17.11
(d) Long-termloansandadvances 5.03 9.36
407.23 375.64
2. CURRENT ASSETS:
(a) Currentinvestments 73.84 63.55
(b) Inventories 180.24 187.63
(c) Tradereceivables 463.15 401.17
(d) Cashandcashequivalents 73.32 47.08
(e) Short-termloansandadvances 71.91 59.39
(f) Othercurrentassets 21.81 15.52
884.27 774.34
TOTAL 1291.50 1149.98
Note:Closingexchangerateconsideredfor1Euroasat31stMarch,2012is 67.8675andasat31stmarch,2011is 63.3825.
CONSOLIDATED BALANCE SHEET AS AT 31ST MARCH, 2012
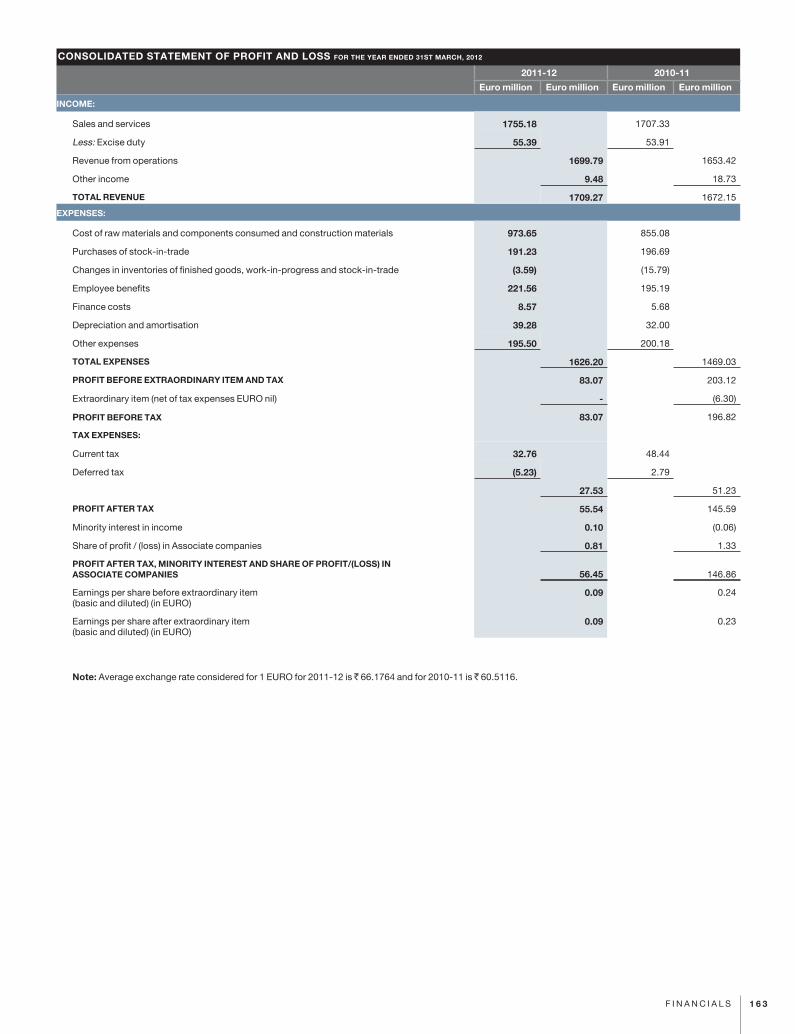
1 6 3F I N a NC I a L S
2011-12 2010-11
Euro million Euro million Euro million Euro million
INCOME:
Salesandservices 1755.18 1707.33
Less:Exciseduty 55.39 53.91
Revenuefromoperations 1699.79 1653.42
Otherincome 9.48 18.73
TOTAL REVENUE 1709.27 1672.15
EXPENSES:
Costofrawmaterialsandcomponentsconsumedandconstructionmaterials 973.65 855.08
Purchasesofstock-in-trade 191.23 196.69
Changesininventoriesoffinishedgoods,work-in-progressandstock-in-trade (3.59) (15.79)
Employeebenefits 221.56 195.19
Financecosts 8.57 5.68
Depreciationandamortisation 39.28 32.00
Otherexpenses 195.50 200.18
TOTAL EXPENSES 1626.20 1469.03
PROFIT BEFORE EXTRAORDINARY ITEM AND TAX 83.07 203.12
Extraordinaryitem(netoftaxexpensesEUROnil) - (6.30)
PROFIT BEFORE TAX 83.07 196.82
TAX EXPENSES:
Currenttax 32.76 48.44
Deferredtax (5.23) 2.79
27.53 51.23
PROFIT AFTER TAX 55.54 145.59
Minorityinterestinincome 0.10 (0.06)
Shareofprofit/(loss)inassociatecompanies 0.81 1.33
PROFIT AFTER TAX, MINORITY INTEREST AND SHARE OF PROFIT/(LOSS) IN ASSOCIATE COMPANIES 56.45 146.86
Earningspersharebeforeextraordinaryitem(basicanddiluted)(inEURO)
0.09 0.24
Earningspershareafterextraordinaryitem(basicanddiluted)(inEURO)
0.09 0.23
Note:averageexchangerateconsideredfor1EUROfor2011-12is 66.1764andfor2010-11is 60.5116.
CONSOLIDATED STATEMENT OF PROFIT AND LOSS FOR THE YEAR ENDED 31ST MARCH, 2012

Products & Services
1 6 4 C R O M P T O N G R E A V E S L I M I T E D A N N U A L R E P O R T 2 0 1 1 - 1 2
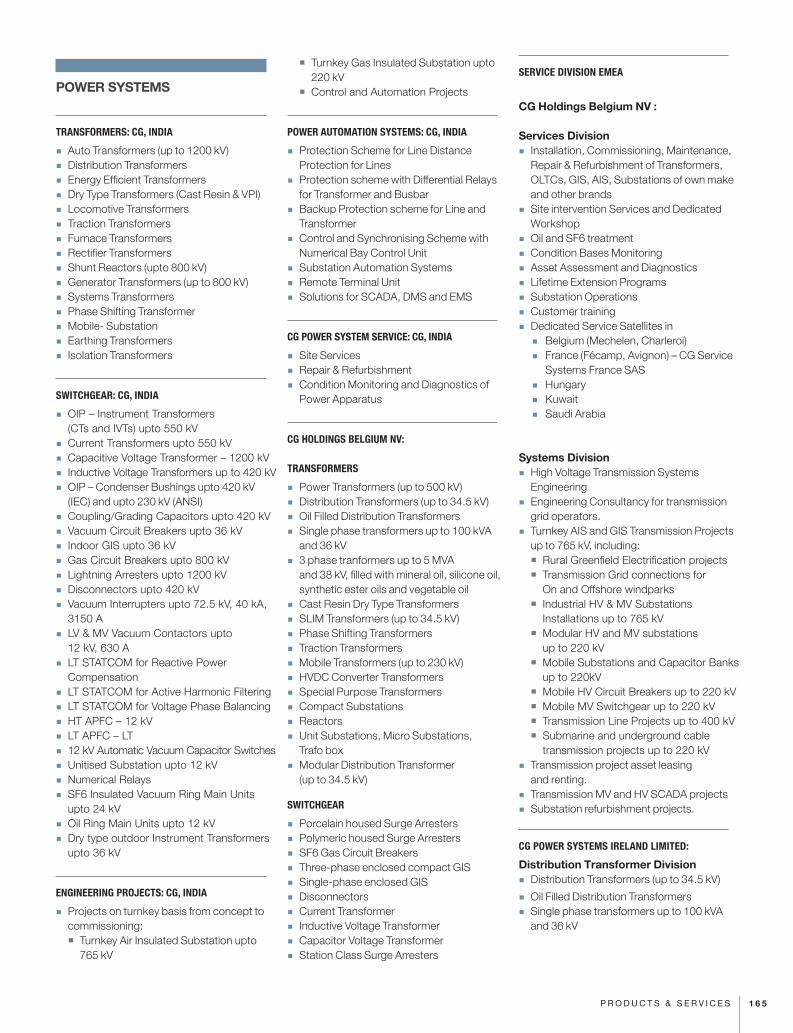
POWER SYSTEMS
TRANSFORMERS: CG, INDIA
� Auto Transformers (up to 1200 kV) � Distribution Transformers � Energy Efficient Transformers � Dry Type Transformers (Cast Resin & VPI) � Locomotive Transformers � Traction Transformers � Furnace Transformers � Rectifier Transformers � Shunt Reactors (upto 800 kV) � Generator Transformers (up to 800 kV) � Systems Transformers � Phase Shifting Transformer � Mobile- Substation � Earthing Transformers � Isolation Transformers
SWITCHGEAR: CG, INDIA
� OIP – Instrument Transformers (CTs and IVTs) upto 550 kV
� Current Transformers upto 550 kV � Capacitive Voltage Transformer – 1200 kV � Inductive Voltage Transformers up to 420 kV � OIP – Condenser Bushings upto 420 kV (IEC) and upto 230 kV (ANSI)
� Coupling/Grading Capacitors upto 420 kV � Vacuum Circuit Breakers upto 36 kV � Indoor GIS upto 36 kV � Gas Circuit Breakers upto 800 kV � Lightning Arresters upto 1200 kV � Disconnectors upto 420 kV � Vacuum Interrupters upto 72.5 kV, 40 kA, 3150 A
� LV & MV Vacuum Contactors upto 12 kV, 630 A
� LT STATCOM for Reactive Power Compensation
� LT STATCOM for Active Harmonic Filtering � LT STATCOM for Voltage Phase Balancing � HT APFC – 12 kV � LT APFC – LT � 12 kV Automatic Vacuum Capacitor Switches � Unitised Substation upto 12 kV � Numerical Relays � SF6 Insulated Vacuum Ring Main Units upto 24 kV
� Oil Ring Main Units upto 12 kV � Dry type outdoor Instrument Transformers upto 36 kV
ENGINEERING PROJECTS: CG, INDIA
� Projects on turnkey basis from concept to commissioning:� Turnkey Air Insulated Substation upto
765 kV
� Turnkey Gas Insulated Substation upto 220 kV
� Control and Automation Projects
POWER AUTOMATION SYSTEMS: CG, INDIA
� Protection Scheme for Line Distance Protection for Lines
� Protection scheme with Differential Relays for Transformer and Busbar
� Backup Protection scheme for Line and Transformer
� Control and Synchronising Scheme with Numerical Bay Control Unit
� Substation Automation Systems � Remote Terminal Unit � Solutions for SCADA, DMS and EMS
CG POWER SYSTEM SERVICE: CG, INDIA
� Site Services � Repair & Refurbishment � Condition Monitoring and Diagnostics of Power Apparatus
CG HOLDINGS BELGIUM NV:
TRANSFORMERS
� Power Transformers (up to 500 kV) � Distribution Transformers (up to 34.5 kV) � Oil Filled Distribution Transformers � Single phase transformers up to 100 kVA and 36 kV
� 3 phase tranformers up to 5 MVA and 38 kV, filled with mineral oil, silicone oil, synthetic ester oils and vegetable oil
� Cast Resin Dry Type Transformers � SLIM Transformers (up to 34.5 kV) � Phase Shifting Transformers � Traction Transformers � Mobile Transformers (up to 230 kV) � HVDC Converter Transformers � Special Purpose Transformers � Compact Substations � Reactors � Unit Substations, Micro Substations,Trafo box
� Modular Distribution Transformer (up to 34.5 kV)
SWITCHGEAR
� Porcelain housed Surge Arresters � Polymeric housed Surge Arresters � SF6 Gas Circuit Breakers � Three-phase enclosed compact GIS � Single-phase enclosed GIS � Disconnectors � Current Transformer � Inductive Voltage Transformer � Capacitor Voltage Transformer � Station Class Surge Arresters
SERVICE DIVISION EMEA
CG Holdings Belgium NV :
Services Division � Installation, Commissioning, Maintenance, Repair & Refurbishment of Transformers, OLTCs, GIS, AIS, Substations of own make and other brands
� Site intervention Services and Dedicated Workshop
� Oil and SF6 treatment � Condition Bases Monitoring � Asset Assessment and Diagnostics � Lifetime Extension Programs � Substation Operations � Customer training � Dedicated Service Satellites in
� Belgium (Mechelen, Charleroi) � France (Fécamp, Avignon) – CG Service
Systems France SAS � Hungary � Kuwait � Saudi Arabia
Systems Division � High Voltage Transmission Systems Engineering
� Engineering Consultancy for transmission grid operators.
� Turnkey AIS and GIS Transmission Projects up to 765 kV, including:� Rural Greenfield Electrification projects� Transmission Grid connections for
On and Offshore windparks � Industrial HV & MV Substations
Installations up to 765 kV� Modular HV and MV substations
up to 220 kV� Mobile Substations and Capacitor Banks
up to 220kV� Mobile HV Circuit Breakers up to 220 kV� Mobile MV Switchgear up to 220 kV� Transmission Line Projects up to 400 kV� Submarine and underground cable
transmission projects up to 220 kV � Transmission project asset leasing and renting.
� Transmission MV and HV SCADA projects � Substation refurbishment projects.
CG POWER SYSTEMS IRELAND LIMITED:
Distribution Transformer Division � Distribution Transformers (up to 34.5 kV)
� Oil Filled Distribution Transformers � Single phase transformers up to 100 kVA and 36 kV
1 6 5P r o d u c t s & s e r v i c e s

� 3 phase transformers up to 5 MVA and 38 kV, filled with mineral oil, silicone oil, synthetic ester oils and vegetable oil
� SLIM Transformers (up to 34.5 kV) � Special Purpose Transformers � Compact Substations: Concrete, Metal & GRP
� Unit Substations, Micro Substations, Trafo box & PRCS
� Three Very Low Loss Transformers � Refurbishment of Transformers
CG ELECTRIC SYSTEMS HUNGARY ZRT.:
Transformers Division
� High Voltage Power Transformers (up to 800 kV),
� Power Transformers filled with mineral oil (up to 500 MVA)
� Power Transformers filled with bio-degradable liquid
� Track side Transformers � Locomotive Transformers � Traction Transformers � Mobile Transformers � Furnace Transformers � Rectifier Transformers � Special Purpose Transformers � Phase Shifting Transformers
Switchgear Division � SF6 Gas Circuit Breakers � Gas Insulated Switchgear (GIS) up to 300 kV
� Dead Tank Breaker 72.5 kV
Systems Division � GIS and AIS Substations up to 750 kV � Industrial and Generation HV & MV Substations Installations up to 765 kV
� Transmission Line Projects up to 400 kV � Submarine and underground cable transmission projects up to 220 kV
� Transmission project asset leasing and renting.
� Transmission MV and HV SCADA projects � Substation refurbishment projects. � High Voltage Transmission Systems Engineering
� Engineering Consultancy for transmission grid operators
Service Division � Site erection and maintenance of Power transformers
AUTOMATION PRODUCTS: CG AUTOMATION SYSTEMS
� Turnkey Control and Protection Systems � Smart Grid Solutions � Substation Control and Automation Systems
� Distribution Automation Systems � Distribution Automation Controllers � Self-healing Networks � IEC61850 systems and IED integration � Substation gateways � SCADA Systems � Protection & Control Design Services � Remote Telemetry Units � Wind SCADA � MV Switchgear Actuator Mechanisms � Data concentrators � Protocol converters � Protocol Development � Bay Control Unit � Power System Analysis � IED integration units � Turnkey Automation Systems
CG POWER SOLUTIONS USA INC: SERVICES
� Engineering and EPC Projects for Transmission & Distribution Systems (5 – 765 kV)
� Substations � Flexible AC Transmission Systems (FACTS) � Harmonic Filters � Substation Automation � Protective Relay Systems � SCADA Systems � Aerial Lines � Underground Lines � Renewable Energy Systems (Wind, Solar, Hydro, Geothermal)
CG POWER SYSTEMS CANADA INC.
� HVDC Converter Transformers (up to 500 kV DC and 350 MVA)
� Generator Step-Up Transformers (up to 525 kV and 575 MVA)
� Power Transformers (up to 525 kV and 575 MVA)
� Auto Transformers (up to 525 kV and 700 MVA)
� Voltage Regulating Transformers (up to 230 kV and 450 MVA)
� Phase Shifting Transformers (up to 230 kV and 450 MVA)
� Grounding Transformers (up to 69 kV and 15 MVA)
� Mobile Substations (up to 230 kV and 60 MVA)
� Installation and Erection Services � Customer Training Services
CG POWER SOLUTIONS UK LIMITED: PRODUCTS & SERVICES
� Provide Project Management, Engineering, Installation, Commissioning and SAP Operations services for Transmission, Distribution, Generation, Renewables, Panel Manufacture and LV Contracting Sectors
� Servicing of Transmission & Distribution Equipment
� Turnkey solutions, from design through to commissioning, for industrial schemes and EPC contracts
� Manufacture of Protection & Control panels
INDUSTRIAL SYSTEMS
HT MOTORS: INDIA
� HT & LT Induction Motor including safe area, flame proof, increased safety and non sparking industrial duty machines power range upto 12 MW, Polarity upto 20 poles, Voltage up to 13.2 kV and in frame Size 315 to 1120 in horizontal frame & 740 to 2500 frame size in vertical frame, Squirrel Cage and Slip Ring Induction motors in enclosure type TEFC, CACA, CACW, SPDP & TETV.
� Synchronous machines from 1 MVA to 25 MVA in frame size 500 to 1120, upto 13.2 kV in enclosures type CACA,CACW & SPDP
� Industrial duty DC machines upto 2200 KW, in frame size from 315 to 710, Voltage upto 810 Volts, in enclosures type TEFC,CACA,CACW & SPDP
HT MOTORS: CG HUNGARY
� HT Slip Ring and Squirrel Cage Induction Motors power upto 25 MW, Polarity upto 24 pole, voltage upto 13.2 kV,
� Synchronous Generators power from 1 MVA upto 70MVA, Voltage upto 13.2 kV, Polarity upto 48 pole
� A.C & D.C Traction Motors � Traction Alternators � Generator refurbishment and overhaulung at site and factory upto 300 MVA.
� Stator and rotor rewinding, balancing, testing and complete diagnostic at site
RAIL TRANSPORTATION & TRACTION
� A.C & D.C Traction motors for AC Locos, Diesel Locos, EMUs & DEMUs
� Traction Alternators for Diesel Locos & DEMUs
� Electrical Traction Controls for Diesel Electric Tower Car and Multiple Units
� Brushless DC Carriage fans & Auxxiliary motors
� Power and Auxiliary converter for electric locomotives
� Coach Inverter � Train Control Electronics
1 6 6 C R O M P T O N G R E A V E S L I M I T E D A N N U A L R E P O R T 2 0 1 1 - 1 2
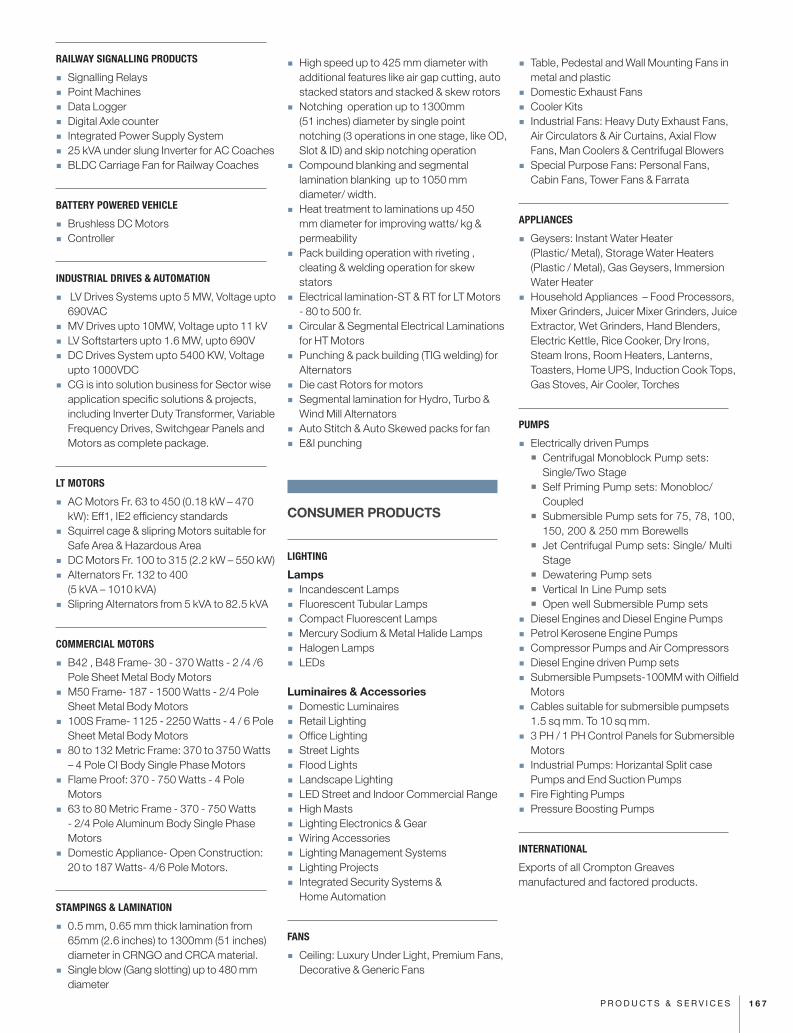
RAILWAY SIGNALLING PRODUCTS
� Signalling Relays � Point Machines � Data Logger � Digital Axle counter � Integrated Power Supply System � 25 kVA under slung Inverter for AC Coaches � BLDC Carriage Fan for Railway Coaches
BATTERY POWERED VEHICLE
� Brushless DC Motors � Controller
INDUSTRIAL DRIVES & AUTOMATION
� LV Drives Systems upto 5 MW, Voltage upto 690VAC
� MV Drives upto 10MW, Voltage upto 11 kV � LV Softstarters upto 1.6 MW, upto 690V � DC Drives System upto 5400 KW, Voltage upto 1000VDC
� CG is into solution business for Sector wise application specific solutions & projects, including Inverter Duty Transformer, Variable Frequency Drives, Switchgear Panels and Motors as complete package.
LT MOTORS
� AC Motors Fr. 63 to 450 (0.18 kW – 470 kW): Eff1, IE2 efficiency standards
� Squirrel cage & slipring Motors suitable for Safe Area & Hazardous Area
� DC Motors Fr. 100 to 315 (2.2 kW – 550 kW) � Alternators Fr. 132 to 400 (5 kVA – 1010 kVA)
� Slipring Alternators from 5 kVA to 82.5 kVA
COMMERCIAL MOTORS
� B42 , B48 Frame- 30 - 370 Watts - 2 /4 /6 Pole Sheet Metal Body Motors
� M50 Frame- 187 - 1500 Watts - 2/4 Pole Sheet Metal Body Motors
� 100S Frame- 1125 - 2250 Watts - 4 / 6 Pole Sheet Metal Body Motors
� 80 to 132 Metric Frame: 370 to 3750 Watts – 4 Pole CI Body Single Phase Motors
� Flame Proof: 370 - 750 Watts - 4 Pole Motors
� 63 to 80 Metric Frame - 370 - 750 Watts - 2/4 Pole Aluminum Body Single Phase Motors
� Domestic Appliance- Open Construction: 20 to 187 Watts- 4/6 Pole Motors.
STAMPINGS & LAMINATION
� 0.5 mm, 0.65 mm thick lamination from 65mm (2.6 inches) to 1300mm (51 inches) diameter in CRNGO and CRCA material.
� Single blow (Gang slotting) up to 480 mm diameter
� High speed up to 425 mm diameter with additional features like air gap cutting, auto stacked stators and stacked & skew rotors
� Notching operation up to 1300mm (51 inches) diameter by single point notching (3 operations in one stage, like OD, Slot & ID) and skip notching operation
� Compound blanking and segmental lamination blanking up to 1050 mm diameter/ width.
� Heat treatment to laminations up 450 mm diameter for improving watts/ kg & permeability
� Pack building operation with riveting , cleating & welding operation for skew stators
� Electrical lamination-ST & RT for LT Motors - 80 to 500 fr.
� Circular & Segmental Electrical Laminations for HT Motors
� Punching & pack building (TIG welding) for Alternators
� Die cast Rotors for motors � Segmental lamination for Hydro, Turbo & Wind Mill Alternators
� Auto Stitch & Auto Skewed packs for fan � E&I punching
CONSUMER PRODUCTS
LIGHTING
Lamps � Incandescent Lamps � Fluorescent Tubular Lamps � Compact Fluorescent Lamps � Mercury Sodium & Metal Halide Lamps � Halogen Lamps � LEDs
Luminaires & Accessories � Domestic Luminaires � Retail Lighting � Office Lighting � Street Lights � Flood Lights � Landscape Lighting � LED Street and Indoor Commercial Range � High Masts � Lighting Electronics & Gear � Wiring Accessories � Lighting Management Systems � Lighting Projects � Integrated Security Systems & Home Automation
FANS
� Ceiling: Luxury Under Light, Premium Fans, Decorative & Generic Fans
� Table, Pedestal and Wall Mounting Fans in metal and plastic
� Domestic Exhaust Fans � Cooler Kits � Industrial Fans: Heavy Duty Exhaust Fans, Air Circulators & Air Curtains, Axial Flow Fans, Man Coolers & Centrifugal Blowers
� Special Purpose Fans: Personal Fans, Cabin Fans, Tower Fans & Farrata
APPLIANCES
� Geysers: Instant Water Heater (Plastic/ Metal), Storage Water Heaters(Plastic / Metal), Gas Geysers, Immersion Water Heater
� Household Appliances – Food Processors, Mixer Grinders, Juicer Mixer Grinders, Juice Extractor, Wet Grinders, Hand Blenders, Electric Kettle, Rice Cooker, Dry Irons, Steam Irons, Room Heaters, Lanterns,Toasters, Home UPS, Induction Cook Tops, Gas Stoves, Air Cooler, Torches
PUMPS
� Electrically driven Pumps� Centrifugal Monoblock Pump sets:
Single/Two Stage� Self Priming Pump sets: Monobloc/
Coupled� Submersible Pump sets for 75, 78, 100,
150, 200 & 250 mm Borewells� Jet Centrifugal Pump sets: Single/ Multi
Stage� Dewatering Pump sets� Vertical In Line Pump sets� Open well Submersible Pump sets
� Diesel Engines and Diesel Engine Pumps � Petrol Kerosene Engine Pumps � Compressor Pumps and Air Compressors � Diesel Engine driven Pump sets � Submersible Pumpsets-100MM with Oilfield Motors
� Cables suitable for submersible pumpsets 1.5 sq mm. To 10 sq mm.
� 3 PH / 1 PH Control Panels for Submersible Motors
� Industrial Pumps: Horizantal Split case Pumps and End Suction Pumps
� Fire Fighting Pumps � Pressure Boosting Pumps
INTERNATIONAL
Exports of all Crompton Greaves manufactured and factored products.
1 6 7P r o d u c t s & s e r v i c e s
REGISTERED OFFICE
CG House, 6th Floor Dr. Annie Besant Road, Worli Mumbai 400030, Maharashtra, IndiaTEL +91 022 24237777, 24237764, 24237765FAX +91 022 24237733
INTERNATIONAL DIVISION
“Jagruti”, 2nd Floor, Kanjur Marg (East)Mumbai 400042, Maharashtra, IndiaTEL +91 022 67558955, 67558949, 67558944FAX +91 022 25774066EMAIL [email protected]
POWER SYSTEMS
TRANSFORMER DIVISION
Kanjur Marg (East) Mumbai 400042, Maharashtra, IndiaTEL +91 022 25782974, 67558000, 67558202, 67558211, 67558372, 25798214FAX +91 022 67558305, 25783271EMAIL [email protected]
Plot No. T1-T5 MPAKVN Industrial Area Malanpur (Dist. Bhind) 477116 Madhya Pradesh, India TEL +91 07539 301200, 301254, 301260 FAX +91 07539 283585, 301242 EMAIL [email protected]
Plot No. 29, 31& 32 New Industrial Area No.1AKVN, District RaisenMandideep 462046, Madhya Pradesh, IndiaTEL +91 07480 408285/6, 408201FAX +91 07480 408208, 408255EMAIL [email protected]
SWITCHGEAR DIVISION
A 3, M.I.D.C., Ambad,Nashik 422010, Maharashtra, IndiaTEL +91 0253 2382271-75FAX +91 0253 2381247EMAIL [email protected]
S6 & POWER QUALITY
Vacuum Interrupters & Instrument Transformer Division, D2 MIDC, Waluj, Aurangabad 431136, Maharashtra, IndiaTEL +91 0240 2558000, 2558081, 2558001, 2558031FAX +91 0240 2554697EMAIL [email protected]
SWITCHGEAR (S2 EM) – ENERGY METERS UNIT
10A, Jigani Industrial Area Jigani, Anekal Taluk,Bangalore Rural Bangalore 562106, Karnataka, IndiaTEL +91 08110 413400, 413498FAX +91 08110 413430EMAIL [email protected]
ENGINEERING PROJECTS DIVISION
3rd Floor, Tower A, Cyber Greens DLF Cyber City, Sector 25 A, DLF Phase III Gurgaon 122002, Haryana, IndiaTEL +91 0124 3047700, 3047999FAX +91 0124 3047777, 3047888EMAIL [email protected]
INDUSTRIAL SYSTEMS
MACHINES 7 DIVISION
D 5, Industrial Area, MPAKVN,Mandideep 462046, Madhya Pradesh, IndiaTEL +91 07480 400000, 403238, 400181/2FAX +91 07480 403119EMAIL [email protected]
DRIVES & AUTOMATION DIVISION
Plot No. 9, Phase II, New Industrial AreaMandideep 462046, Madhya Pradesh, IndiaTEL +91 7480 426401FAX +91 7480 426432EMAIL [email protected]
RAILWAY SIGNALLING DIVISION
11 B, Industrial Area No1, Pithampur 454775,District Dhar, Madhya Pradesh, IndiaTEL +91 07292 410000, 403095FAX +91 07292 253211EMAIL [email protected]
STAMPINGS DIVISION
Kanjur Marg (East) Mumbai 400042, Maharashtra, IndiaTEL +91 022 67558715/6, 25796866FAX +91 022 25787970, 67558721EMAIL [email protected]
B 110, MIDC Industrial Area Ahmednagar 414111, Maharashtra, IndiaTEL +91 0241 6610531/32/34FAX +91 0241 6610511EMAIL [email protected]
LT MOTORS DIVISION
A/6 2, MIDC Industrial Area Ahmednagar 414111, Maharashtra, IndiaTEL +91 0241 2777500, 2777372, 2776102FAX +91 0241 2777508, 2776103, 2777800EMAIL [email protected]
B 108/109, MIDC Industrial Area Ahmednagar 414111, Maharashtra, IndiaTEL +91 0241 2777145,FAX +91 0241 2777162, 2778534 EMAIL [email protected]
S 14–15, Colvale Industrial Estate Colvale, Bardez, Goa 403513, IndiaTEL +91 0832 2404000, 2404001, 2404002, 2404003, 2404012FAX +91 0832 2404011EMAIL [email protected]
COMMERCIAL MOTORS DIVISION
196–198, Kundaim Industrial Estate Kundaim, Ponda, Goa 403115, IndiaTEL +91 0832 3983200, 3983205, 2395954FAX +91 0832 2395377, 3983299EMAIL [email protected]
CONSUMER PRODUCTS
FANS DIVISION
Plot No. 1 Goa IDC Industrial Estate Bethora, Ponda, Goa 403409, IndiaTEL +91 0832 2331200, 2331256FAX +91 0832 2330155EMAIL [email protected]
Plot No. 214 A Kundaim Industrial Estate Kundaim, Goa 403115, IndiaTEL +91 0832 2395305, 2395902FAX +91 0832 2395305EMAIL [email protected]
Plot No. 81, HPSIDC Indl. Area Baddi, District Solan 173205 Himachal Pradesh, IndiaTEL +91 01795 320141, 322140, 310142, 310143, 245664FAX +91 01795 245665EMAIL [email protected]
1 6 9e s ta b l i s h m e n t s
Plot No. 148 - 150 & 157 – 159 HPSIDC Industrial Area, Baddi, District Solan 173205Himachal Pradesh, IndiaTEL +91 01795 310144, 310148, 324148EMAIL [email protected]
APPLIANCES DIVISION
Kanjur Marg (East)Mumbai 400042, Maharashtra, IndiaTEL +91 022 67558820, 67558826, 67558822FAX +91 022 67558025, 67558828EMAIL [email protected]
LIGHTING DIVISION
Kanjur Marg (East)Mumbai 400042, Maharashtra, IndiaTEL +91 022 67558000, 67558501/8500FAX +91 022 25787283EMAIL [email protected]
Baroda Lamp Works, Kural VillagePadra Taluka, Padra Jambusar RoadDistrict Baroda 391430, Gujarat, IndiaTEL +91 02662 245245, 245001, 245004FAX +91 02662 245003EMAIL [email protected]
PUMPS DIVISION
A 28, MIDCAhmednagar 414111, Maharashtra, IndiaTEL +91 0241 6606500, 6606501, 2777262FAX +91 0241 6606550, 6606560EMAIL [email protected]
C-19, MIDCAhmednagar 414111, Maharashtra, IndiaTEL +91 0241 6450308FAX +91 0241 2777893EMAIL [email protected]
BRANCH & MARKETING OFFICES
NORTHERN REGION
Regional Head Office: New DelhiCrompton Greaves Ltd3rd Floor, Express Building,9 –10, Bahadur Shah Zafar MargNear ITO CrossingNew Delhi 110002, IndiaTEL +91 11 23460700 – 23460954, 23460901, 23354879FAX +91 11 23324360, 23725661,23737617EMAIL [email protected]
JaipurChurch Road, PO BOX 173 Jaipur 302001, Rajasthan, IndiaTEL +91 0141 3018800/01FAX +91 0141 2365371EMAIL [email protected]
JalandharBXII 407, 2nd FloorNear BSF Chowk, Ladowali RoadJalandhar 144001 , Punjab, IndiaTEL +91 0181 3051301/95, 2225410FAX +91 0181 2226342EMAIL [email protected]
LucknowSaran Chambers II, 3rd Floor5 Park Road, Lucknow 226001Uttar Pradesh, IndiaTEL +91 0522 4152150/56, 415265FAX +91 0522 4152158EMAIL [email protected]
RAIL TRANSPORTATION SYSTEMS
Crompton Greaves Ltd3rd Floor, Express Building9 –10, Bahadur Shah Zafar MargNear ITO CrossingNew Delhi 110002, IndiaTEL +91 11 23460700, 23460922/23/24FAX +91 11 23324360, 23352134EMAIL [email protected]
EASTERN REGION
Regional Head Office: Kolkata 50 Chowringhee RoadKolkata 700071, West Bengal, India TEL : +91 033 22829681– 85 FAX : +91 033 22829942 EMAIL [email protected]
Bhubaneshwar Janpath Tower, 3rd Floor, Ashok Nagar Unit II Bhubaneshwar 751009, Odisha, India TEL +91 0674 2531128, 2531429 FAX +91 00674 2533521 EMAIL [email protected]
Guwahati Assam Investment & Construction Co. G.S. Road, Dispur, Near Car Ghar Ganeshguri, Guwahati 781005Assam, India TEL 0361 2340709, 0361 2341221
Ranchi 3, Westend Park, Kaju Bagan (Near DAV Junior School) Hehal, Ratu RoadRanchi 834005, Jharkhand, India TEL 0651 2512095EMAIL [email protected]
PatnaEastern LogisticsC/o. Crompton Greaves LimitedSahayogi Press Marg, Exhibition RoadPatna 800001, Bihar, IndiaTEL +91 612 3261594, 3261595, 3263209
WESTERN REGION
Regional Head Office: Mumbai Kanjur Marg (East)Mumbai 400042, Maharashtra, IndiaTEL +91 022 67558000, 25780234, 67558600/01FAX +91 022 25795158, 67558669EMAIL [email protected]
Ahmedabad909 916, Sakar II, Near Ellis Bridge, Ahmedabad 380006, Gujarat, IndiaTEL +91 079 40012000, 40012201FAX +91 079 40012222EMAIL [email protected]
Baroda (Satellite Office)10 A, Vrundavan ColonyNear Harinagar Water Tank, Gotri RoadBaroda 390 007, Gujarat, IndiaTEL +91 0265 2332460FAX +91 0265 2332458EMAIL [email protected]
Indore103 B, Apollo Trade Centre2B, Rajgarh Kothi, Mumbai Agra RoadIndore 452001, Madhya Pradesh, IndiaTEL +91 0731 2498269, 2498271, 2495531, 4201231, 4232600FAX +91 0731 4232628EMAIL [email protected]
PunePremium Point Building, 4th FloorOpp Modern High SchoolJ M Road, ShivajinagarPune 411005, Maharashtra, IndiaTEL +91 020 25534675-77, 25534685FAX +91 020 25534684EMAIL [email protected]
Nagpur (Satellite Office)3, West High Court RoadLal Bahadur Shastri Chowk, Dharampeth Nagpur 440010, Maharashtra, IndiaTEL +91 0712 2531271, 2560870, 2560871
1 7 0 C R O M P T O N G R E A V E S L I M I T E D A N N U A L R E P O R T 2 0 1 1 - 1 2
FAX +91 0712 2537196EMAIL [email protected]
Raipur5, New Tilak NagarBesides Sai Care Hospital, Avanti ViharRaipur 493 001, Chattisgarh, IndiaTEL : 0771 4019201/ 4072216FAX : 0771–2444577EMAIL [email protected]
SOUTHERN REGION
Regional Head Office: Chennai Crompton House 3, Dr. MGR Salai, (Kodambakkam High Road)NungambakkamChennai 600034, Tamil Nadu, IndiaTEL +91 044 42247500, 28235533, 28257375. 42247575FAX +91 044 28281596, 28231973EMAIL [email protected]
BangaloreJanardhana Towers, 1st Floor562/640 Bannerghatta Road, BilekahalliBangalore 560076, Karnataka, IndiaTEL +91 080 41391908, 41391909, 41391901FAX +91 080 41391900EMAIL [email protected]
CochinCherupushpam Building, 5th Floor300-6, Shanmugham Road, ErnakulamCochin 682031, Kerala, IndiaTEL +91 0484 2370860-63, 2360240, 2382340FAX +91 0484 2373738EMAIL [email protected]
SecunderabadMinerva Complex, 4th Floor94, Sarojni Devi RoadSecunderabad 500003 Andhra Pradesh, IndiaTEL +91 040 40002300, 40002347, 40002345FAX +91 040 40002340EMAIL [email protected]
SERVICE CENTRES
NORTHERN REGION
New DelhiCrompton Greaves Ltd3rd Floor, Express Building9–10, Bahadur Shah Zafar MargNear ITO CrossingNew Delhi 110002, IndiaTEL +91 11 23460700, 23460710, 23460714FAX +91 11 23324360, 23725661EMAIL [email protected]
JaipurChurch Road, P.O. Box 173, Jaipur 302001, Rajasthan, IndiaTEL +91 0141 3018800, 3018806FAX +91 0141 2365371EMAIL [email protected]
JalandharKhasra No 151/99Village Khajurla, Near Octroi PostTehsil Phagwara, Distt. KapurthalaJalandhar 144001, Punjab, IndiaTEL +91 0181 2632187, 2632199FAX +91 0181 2226342EMAIL [email protected]
LucknowC1/39, Transport NagarLucknow 226012, Uttar Pradesh, IndiaTEL +91 0522 2432922/2431855FAX +91 0522 4152558EMAIL [email protected]
EASTERN REGION
Kolkata 21, R.N. Mukherjee RoadKolkata 700001, West Bengal, India TEL +91 033 22489160, 22488911 FAX +91 033 22489737 EMAIL [email protected]
Bhubaneshwar Janpath Tower (Basement)Ashok Nagar, Unit II, Bhubaneshwar 751009, Odisha, India TEL +91 0674 2531128, 2531429, 2531592 FAX +91 0674 2531592 EMAIL [email protected]
Patna Vishwasadan,Behind Jeevan Deep Building, East of Narmada Apartment, Exhibition RoadPatna 800001, Bihar, India TEL +91 0612 6453160 / 6453161 EMAIL [email protected]
Ranchi3, Westend ParkKaju Bagan (Near DAV Junior School)Hehal, Ratu RoadRanchi 834005, Jharkhand, IndiaTEL +91 651 2512095EMAIL [email protected]
GuwahatiAssam Investment & Construction Co.G.S. Road, DispurNear Car Ghar, Ganesh GuriGuwahati 781005, Assam, IndiaTEL +91 361 2340709 / 2341221EMAIL [email protected]
WESTERN REGION
MumbaiKanjur Marg (East)Mumbai 400042, Maharashtra, IndiaTEL. +91 022 67558603, 67558694FAX +91 022 67558669EMAIL [email protected]
Ahmedabad909-916, Sakar II, Near Ellis BridgeAhmedabad 380006, Gujarat, IndiaTEL +91 079 40012244, 40012201FAX +91 079 40012222EMAIL [email protected]
Indore103 B, Apollo Trade Centre1st Floor, 2B Rajgarh KothiMumbai-Agra RoadIndore 452001Madhya Pradesh, IndiaTEL +91 0731 2498269, 2498271FAX +91 0731 4065621EMAIL [email protected]
PunePremium Point Building4th Floor, Opp Modern High SchoolJ M Road, ShivajinagarPune 411005Maharashtra, IndiaTEL +91 020 25534675-77FAX +91 020 25534684EMAIL [email protected]
1 7 1e s ta b l i s h m e n t s
Nagpur3, West High Court RoadLal Bahadur Shastri Chowk, Dharampeth Nagpur 440010, Maharashtra, IndiaTEL +91 0712 2531271, 2560870FAX +91 0712 2537196EMAIL [email protected]
Raipur 5, New Tilak NagarBesides Sai Care Hospital, Avanti Vihar, Raipur 493001, Chattisgarh, IndiaTEL 0771 4022214/ 15FAX 0771 – 2444577EMAIL [email protected]
SOUTHERN REGION
ChennaiA.G. Enterprises37 NSK Salai, VadapalaniChennai 600026, Tamil Nadu, IndiaTEL +91 044 23651369EMAIL [email protected]
[email protected]@cgglobal.com
BangaloreSS AgenciesNo. 20, New Timber Yard LayoutMysore RoadBangalore 560026, Karnataka, IndiaTEL +91 080 26755727FAX +91 080 26755723EMAIL [email protected]
[email protected]@cgglobal.com
HyderabadSri Lakshmi EnterprisesPlot No. B 12Industrial Development Area, Uppal, Hyderabad 500039, Andhra Pradesh, IndiaTEL +91 040 27207538, 27207539FAX +91 040 27207539EMAIL sandeep.bhattacharya @cgglobal.com
CochinVishnu Traders, 35/1872 ASouth Janata Road, PalarivattomCochin 682025, Kerala,, IndiaTEL. 91 0484 2338102, 2338856FAX 91 0484 2373738EMAIL [email protected]
CoimbatoreParam Enterprises, 658-664, Rajalakshmi Plaza, 100 ft Road, GandhipuramCoimbatore 641 012, Tamil Nadu, IndiaTEL +91 0422 2526453FAX +91 0422 2525334
EMAIL [email protected]@cgglobal.com
MaduraiExcel Typres & Agencies Pvt. Ltd.No. 2, Mangayar Karasi College Road, ParavaiMadurai 625402, Tamil Nadu, IndiaTEL 0452 2667771EMAIL [email protected]
REGION EMEA
CORPORATE OFFICES
CG Holdings Belgium NVRegistered OfficeAntwerpsesteenweg 167B 2800 Mechelen, BelgiumTEL+32 15 283 333 FAX +32 15 283 300
CG Electric Systems Hungary Zrt.Mariassy Street 7H 1095 Budapest, HungaryTEL+36 1 483 66 00 FAX +36 1 266 66 13
CG Power Holdings Ireland LimitedRegistered OfficeHerbert House, Harmony RowDublin 2, Republic of IrelandTEL +353 1 415 3700 FAX +353 1 6787913
CG Drives & Automation Sweden ABMorsaregatan 12, Box 22225,SE-25024 Helsingborg SwedenTEL +46 42 169957 FAX +46 42 169949
BUSINESS UNITS
CG Power Systems Belgium NVDistribution Transformer Division, Power Transformer DivisionAntwerpsesteenweg 167B 2800 Mechelen, BelgiumTEL +32 15 283 333 FAX +32 15 283 300
CG Power Systems Ireland Limited Distribution Transformer DivisionDublin Road, Cavan, Ireland TEL +353 49 433 1588
CG Power Systems Ireland LimitedAutomation Systems DivisionHerbert House, Harmony Row
Dublin 2, Republic of Ireland TEL +353 1 415 3700 FAX +353 1 678 7913
CG Holdings Belgium NVSystems DivisionAntwerpsesteenweg 167, B 2800 Mechelen, BelgiumTEL +32 15 283 621FAX +32 15 283 491
CG Holdings Belgium NVServices DivisionRue Vital Francoisse 220, B.P. 1581B 6000 Charleroi, BelgiumTEL +32 71 44 10 20 FAX +32 71 47 01 89
CG Service Systems France SASParc d’Activite des Hautes FalaisesAvenue Jean YorkF 76400 Saint Leonard, FranceTEL +33 2 35 10 31 57FAX +33 2 35 29 23 51
CG Electric Systems Hungary Zrt.Gyorgyei ut 14H 2766 Tapioszele, HungaryTEL +36 1 483 6600FAX +36 1 483 6855
CG Automation Systems UK Ltd.Unit F, Network Business CentreJarrow, Tyne & WearNE31 1SF, United KingdomTEL +44 191 425 5200 FAX +44 191 425 5202
CG Power Solutions UK LimitedConcepts House3 WatchgateNewby Road Industrial EstateHazel Grove, Stockport SK7 5DB, United KingdomTEL +44 845 634 11 33 FAX +44 845 634 11 32
SALES OFFICES
CG Sales Networks France S.A.41, Boulevard VaubanImmeuble Arago 1F 78280 Guyancourt, FranceTEL +33 1 34 52 10 80 FAX +33 1 34 52 27 30
CG Holdings Belgium NVUK Representative Office, Suite 11Epoch House, Falkirk RoadGrangemouth FK3 8WW, United KingdomTEL +44 1324 486100 FAX +44 1324 486020
1 7 2 C R O M P T O N G R E A V E S L I M I T E D A N N U A L R E P O R T 2 0 1 1 - 1 2
CG Holdings Belgium NVSaudi Arabia Representative OfficeP.O. Box 59276Riyadh 11525, Saudi ArabiaTEL +966 1 405 24 31FAX +966 1 405 48 25
CG Sales Networks UAE Limited P.O. Box 5730Sharjah, United Arab EmiratesTEL +971 6 574 03 13 FAX +971 6 574 01 31
CG Electric Systems Abu DhabiP.O. Box 45568, Abu Dhabi, UAETEL +97 12 645 5994
CG Electric Systems Kuwait Branch OfficeP.O. Box 36673, 24757 Salmiya Ras, KuwaitTEL +96 52 5329340FAX +96 52 5329370
REGION AMERICAS
BUSINESS UNITS
CG Power Systems USA IncDistribution Transformer DivisionOne Pauwels Drive, WashingtonMissouri 63090, USATEL +1 636 239 9300 FAX +1 636 239 9398
CG Power Systems USA IncPower Transformer Division6349 Avantha Drive, WashingtonMissouri 63090, USATEL +1 636 239 9300 FAX +1 636 239 9396
CG Power Systems Canada Inc101 Rockman StreetWinnipeg, MB R3T 0L7, CanadaTEL +1 204 452 7446 FAX +1 204 453 8644
CG Automation Systems USA Inc.92 Cogwheel LaneSeymour, CT 06483, USATEL +1 203 888 3002 FAX +1 203 888 7640
CG Automation Systems USA Inc.1251 E. Iron Eagle Drive, Suite #150Eagle, Idaho 83616, USATEL +1 208 938 5542 FAX +1 208 938 5582
CG Power Solutions USA Inc403 New Karner Road, AlbanyNY 12205, USATEL +1 518 452 7718 FAX +1 518 452 7716
CG Power Solutions USA Inc 609 West Cottonwood Lane, Suite 3, Casa Grande, AZ 85122, USATEL +1 520 426 1933 FAX +1 520 582 1984
CG Power Solutions USA Inc 1110 NASA Parkway, Suite 503Houston, TX 77058, USATEL +1 713 782 3220 FAX +1 713 782 5490
CG Power Solutions USA Inc 24 Hemingway DriveRiverside, RI 02915 USATEL +1 401 223 3161 FAX +1 401 223 3160
CG Power Solutions USA Inc 100 Springhouse Drive, Suite 100Collegeville, PA 19426, USATEL +1 610 489 8250 FAX +1 610 489 8253
CG Power Solutions USA Inc 700 West Hillsboro Blvd., Bldg #3, Suite 3-204, Deerfield Beach, FL 33441, USATEL +1 954 6399579
CG Power Solutions USA Inc 12321 Middlebrook Road, Suite 290Germantown, MD 20874, USATEL +1 518 452 7718 FAX +1 518 452 7716
CG Automation Solutions USA Inc60 Fadem Road, Springfield NJ 07081, USATEL +1 973 346 5250 FAX +1 973 379 4108
SALES OFFICE
CG Sales Networks Americas Inc6349 Avantha Drive, Washington Missouri 63090, USATEL +1 636 239 9300 FAX +1 636 239 9396
REGION ASIA PACIFIC
MANUFACTURING PLANTS
PT CG Power Systems IndonesiaPower Transformer DivisionKawasan Industri Menara Permai Kav. 10Jl. Raya Narogong, CileungsiBogor 16820, IndonesiaTEL +62 21 823 04 30/36 FAX +62 21 823 02 68/42
SYSTEMS DIVISION
PT CG Power Systems Indonesia Menara FIF 12th FloorJl. TB. Simatupang Kav 15Lebak Bulus, CilandakJakarta 12440, IndonesiaTEL +62 21 290 45 195FAX +62 21 290 45 196
SALES OFFICES
CG Power Systems IndonesiaBranch Office, 31 Stevens Street, WalthamChristchurch 8011, New ZealandTEL +64 3 377 82 90 FAX +64 3 377 82 72
CG Power Systems Indonesia Branch Office, 7 Brumby Circuit, Sumner , Queensland 4074, Australia TEL +61 73279 0923 M +61 4279 03488
CG Power Systems Indonesia Branch Office, Unit No. B 1 21, Block B,Jalan Sungai Jernih 8/1, Pusat Perniagaan Seksyen 8, Petaling Jaya 46050, Malaysia TEL +60 3 79544766 FAX +60 3 79542766
CG Sales Networks Singapore PTE Ltd. 6,Temasek Boulevard #09-05, Suntec Tower Four, Singapore 038986 TEL +65 64960496 FAX +65 65386585
PT CG Power Systems IndonesiaNew Zealand Branch, 31 Steven Street, Waltham, Christchurch 8011, New ZealandTEL +64 3 377 8290 FAX +64 3 377 8272
1 7 3e s ta b l i s h m e n t s


