32
Crop Advantage Series Proceedings | 2017

Crop Advantage
Series Proceedings | 2017

2 Iowa State University Extension and Outreach – 2017 Crop Advantage Series
CropAdvantage
Planning committeeMeaghan Anderson, Joel DeJong, Erin Hodgson, Mark Licht, John Sawyer, Kristine Schaefer
Proceedings production Brent Pringnitz, ANR Program Services
Crop Advantage Series 1151 NSRIC, 1029 N University BlvdAmes, Iowa 50011-3611 (515) 294-6429, [email protected] www.cropadvantage.orgJanuary 2017 | AEP 0200
Extension Store Order at store.extension.iastate.eduExtension Store: https://store.extension.iastate.edu
Iowa State University Extension Store sells and distributes printed publications and digital content written by the faculty and staff of Iowa State University Extension and Outreach.
Visit the Extension Store today to order printed publications, scouting cards and field guides on: }Insect management}Plant diseases}Scouting information}Weed identification}Soil management and fertility}Grain handling and storage}Equipment and machinery}Pesticide safety}Water quality Many available instantly as digital downloads
Contact: 119 Printing/Publications Building (515) 294-5247 [email protected] https://store.extension.iastate.edu
Integrated Crop ManagementNews • Crops Blog
crops.extension.iastate.edu
The latest crop, pest and soil management information from Extension specialists and field agronomists.
Subscribe to receive updates as articles are posted.

Iowa State University Extension and Outreach – 2017 Crop Advantage Series 3
Supported by a grant from North Central SARE
SARE’s mission is to advance innovations that improve profitability,
stewardship and quality of life by investing in ground breaking research and education. To learn more visit www.northcentralsare.org
ContentsCrop managementUnderstanding the 2016 yields and interactions between soils, crops, climate and management . . . . . . . . . . . . . . . . . . . . . . . . . . . . . . . . . . . . . . . 4
Financial erosion: Dealing with economic challenges . . . . . . . . . . . . . . . . . . . . . . . 6
Crop market outlook 2017 . . . . . . . . . . . . . . . . . . . . . . . . . . . . . . . . . . . . . . . . . . . . 8
Making sure planter technology accomplishes the basics . . . . . . . . . . . . . . . . . . . 9
Pest managementPalmer amaranth: Preventing movement onto your farm . . . . . . . . . . . . . . . . . . . 10
Weed management update: Changes and improvements for 2017 . . . . . . . . . . . 12
Resistance management plan for soybean aphid . . . . . . . . . . . . . . . . . . . . . . . . . 14
Sudden death syndrome and emerging corn disease management . . . . . . . . . . . 15
Pesticide resistance: A threat to Midwestern crop production . . . . . . . . . . . . . . . 16
Spray equipment operation for emerging herbicide technology . . . . . . . . . . . . . . 17
Nutrient managementPotassium effect on yield, corn response to nitrogen, and soybean diseases . . . 18
Nitrogen dynamics with a rye cover crop . . . . . . . . . . . . . . . . . . . . . . . . . . . . . . . 20
Soil and water managementIowa Nutrient Reduction Strategy . . . . . . . . . . . . . . . . . . . . . . . . . . . . . . . . . . . . . 22
Extending field scale 4R nutrient management and wetland performance to watershed scale outcomes . . . . . . . . . . . . . . . . . . . . . . . . . . . . . 24
Drainage design for profits and water quality . . . . . . . . . . . . . . . . . . . . . . . . . . . . 25
Long-term tillage and crop rotation effects on soil, yield and economic return in Iowa . . . . . . . . . . . . . . . . . . . . . . . . . . . . . . . . . . . . . . . . . . . . 26
Iowa Cover Crop Working Group demonstration and research projects . . . . . . . . 28
Field staff directory . . . . . . . . . . . . . . . . . . . . . . . . . . . . . . . . . . . . . . . . . . . . . 30
Presenter contacts . . . . . . . . . . . . . . . . . . . . . . . . . . . . . . . . . . . . . . . . . . . . . 31
Supported by the Soybean Checkoff. The Iowa Soybean Association is proud to partner with Iowa State University Extension and Outreach in providing valuable crop production information that benefits Iowa producers. Printing of the 2017 Crop Advantage proceedings was supported by the Iowa Soybean Association.
All trademarks, service marks, registered marks, or registered service marks contained in this document are the property of their respective owners, and their use does not imply endorsement by Iowa State University. Mention of trade names does not imply endorsement of one product over another, nor is discrimination intended against any similar product not named.
Iowa State University Extension and Outreach does not discriminate on the basis of age, disability, ethnicity, gender identity, genetic information, marital status, national origin, pregnancy, race, religion, sex, sexual orientation, socioeconomic status, or status as a U.S. veteran. (Not all prohibited bases apply to all programs.) Inquiries regarding non-discrimination policies may be directed to Ross Wilburn, Diversity Officer, 2150 Beardshear Hall, 515 Morrill Road, Ames, Iowa 50011, 515-294-1482, [email protected].
Acknowledgements

4 Iowa State University Extension and Outreach – 2017 Crop Advantage Series
CropAdvantage
2016 weather implicationsThe weather in 2016 could be split into two periods with warmer and drier weather conditions during late May and June followed by cooler and wetter weather in July and August (Table 1). Precipitation from November 2015 to April of 2016 provided a full to nearly full soil moisture profile going into planting. This available soil moisture kept both the corn and soybean crop from experiencing moisture stress because root growth was able to follow the soil moisture depletion zone during the dry June conditions. Higher temperatures and more radiation resulted in pollination occurring about 7 days earlier with less vegetative biomass than in 2015.
During July and August temperatures subsided and rainfall was received in time for pollination and grain filling to occur. This provided non-limiting soil moisture and minimized potential crop stress during pollination. Cooler temperatures helped extend the grain filling period allowing kernel size and weight to achieve full potential.
In contrast to corn, the soybean crop benefited more than corn from the higher temperature and radiation in June and this resulted in more vegetative biomass. Also, soybean has higher thermal requirement than corn. This higher thermal requirement means that the higher temperatures in June promoted faster canopy closure and thus more light interception occurred.
FACTS prediction compared to actual in-field harvestFACTS (Forecast and Assessment of Cropping sysTemS) corn yields ranged from 200 to 240 bushels per acre and our soybean yields ranged from 55 to 75 bushels per acre. On average across 10 corn systems and 10 soybean systems FACTS predictions were 2.3% lower than actual corn yields and 3.1% greater than actual soybean yields. In most cases the prediction error was ± 5-10%. The reasons for under-prediction and over-prediction was mostly due to uncertainties of the initial soil moisture profile at planting, cultivar characteristics and biotic factors.
For example, in central and southeast Iowa corn yield was under-predicted because of underestimating the influence of the groundwater table and soil moisture. In northeast Iowa, corn yield over-prediction was due to excessive rain near maturity causing an environment conducive for in-field ear drop and yield loss.
We found that yield predictions at the time of planting are a good proxy for final actual yield by using accurate field management, 35-year historical weather conditions, and accounting for soil moisture and nitrate at planting. The prediction error is still within ± 5-10% with a few exceptions. This may be hard to believe but is supported by our FACTS results in both 2015 and 2016.
In summary, the key point for reaching record corn yield and production levels can be attributed to a full soil moisture profile at planting, more solar radiation and higher temperatures in June, and a cooler wetter grain filling period.
ObjectivesUnderstand how temperature, rainfall, and radiation influence yield potential.
Develop confidence in crop forecasting through companion in-field data.
Learn how FACTS (crop forecasting) can be utilized to inform management decisions.
Understanding the 2016 yields and interactions between soils, crops, climate and management
Mark LichtAssistant professor and Extension cropping systems agronomist
[email protected] @marklicht
Sotirios ArchontoulisAssistant professor, Agronomy
[email protected] @SArchontoulis

Iowa State University Extension and Outreach – 2017 Crop Advantage Series 5
Figure 1. Actual FACTS corn and soybean yields at 6 locations for 10 corn systems and 10 soybean systems. The red triangle represents the FACTS predictions at the last forecast of 12 September 2016. The asterisk represents sites with tile drainage.
Resources @IowaState_FACTS
Forecast and Assessment of Cropping sysTemS (FACTS) crops.extension.iastate.edu/facts

6 Iowa State University Extension and Outreach – 2017 Crop Advantage Series
CropAdvantage
ObjectivesIdentify strategies to protect working capital.
Identify strategies to improve cash flow.
Discuss impact of ARC-CO payments.
Resources @ISU_AgDM
Ag Decision Maker www.extension.iastate.edu/agdm
Understanding Cash Flow Analysis www.extension.iastate.edu/agdm/wholefarm/html/c3-14.html
2014 Farm Bill resources www.extension.iastate.edu/agdm/info/farmbill.html
Financial erosion: Dealing with economic challenges
In recent years we have seen farm income levels drop as a result of lack of profitability. We are seeing some farmers experience cash flow problems. If these continue we will see what has started out as a lack of profit become a significant cash flow challenge that will eventually become a net worth problem for producers. This is true for both the crop as well as livestock sectors. (Figures 1 and 2)
Working capital is the measure of the amount of funds available to purchase inputs and inventory items after the sale of all current farm assets and the payment of all current liabilities. The amount of working capital considered adequate is related to the size of the farm business. Working capital is impacted by many factors such as: capital purchases, prepaid expenses, loans, debt repayment and profitability.
Working capital is one of the key indicators that lenders focus on. Lenders will look at working capital in different ways. One is just the amount. Another is the amount of working capital per unit such as per acre or per head of livestock. Others use percent of gross revenue or percentage of input costs.
You may be able to protect your working capital by reducing new asset purchases or downsizing the size of the operation. Restructuring debt to obtain lower interest rates or stretch out the number of payments. You need to anticipate any cash shortages and set up loan programs to deal with them ahead of time. Maintain cash reserves and have a line of credit in place to cover potential operating loan requirements.
By looking at your expenses you can determine your biggest categories. For many operations that would be cash rent or feed costs. Go after potential savings in these large areas first. Find opportunities to reduce costs without hurting the overall economic situation. Reducing inputs brings additional risks such as lower yields and additional costs such as rescue treatments for pests. Are there opportunities to improve production? Is your investment in technology being fully utilized?
Lenders are also taking a critical look at family living expenses. Large expenses such as health insurance are unavoidable, but expenses such as vacation homes, entertainment or extensive house remodeling will need to be curtailed. Can you calculate the cost of family living, the major components? How much off farm income is available to potentially offset those costs?
Develop a comprehensive marketing plan that you can share with your lender. Start by calculating your breakeven price based on a range of yield outcomes. Include all of your overhead costs, family living costs and off-farm income. Set selling targets based on price, time of year and the tools you will use to accomplish your plan. Does your crop insurance plan and your marketing plan work together?
Understand how ARC-CO payments impact your cash flow with the payments a year in arrears. Understand how the current crop year payment will impact this year’s profit. This is another opportunity to educate landowners. (Figure 3)
Look for opportunities to bring in extra income from either the farm related or non-farm activities. Can you add custom farming work, snow removal, trucking, mechanical repairing or other activities to your revenue generation? Are there off-farm income opportunities for you or a spouse? Be cautious in adding activities that require substantial capital investment with uncertain returns as this may increase your risks. Off-farm opportunities may decrease available labor on the farm, and bring unforeseen expenses. A careful review is necessary to ensure the benefits outweigh the costs.
Many lenders are looking to “cash flow statements” as they review “lines of credit”. Cash inflow comes from four general categories: operating, investing, borrowing, and non-farm. Operating inflow comes from the sale of grain, livestock, services, etc. Operating outflows go to pay for inputs, wages, repair, etc. Cash inflow from investing comes from selling land, machinery, breeding stock and other capital assets. Investment outflows go to purchasing land, breeding livestock and machinery. Outflows from borrowing is debt repayment while inflows are from new loans. Non-farm inflows are from off-farm wages, rents, dividends or interest. Non-farm outflows are for living expenses, savings and taxes.

Iowa State University Extension and Outreach – 2017 Crop Advantage Series 7
Producers can improve cash flow by improving production efficiency, improved marketing, and better cost control. Increasing profitability will improve cash flow in the long run. Some operations will need to improve cash flow by taking on more debt or stretching out debt payments. Others may decide to liquidate assets such as machinery, breeding livestock or even land. This may be a time when we need to tap into equity to maintain the operation.
Kelvin Leibold Farm management field specialist
Charles Brown Farm management field specialist
Gary Wright Farm management field specialist
Figure 1. Iowa Cost of Production versus Prices (2017 Projected). Source: Ag Decision Maker, File A1-21, Historical Costs of Production and File A2-11, Iowa Cash Corn and Soybean Prices
Figure 2. Estimated returns to finishing yearling steers in Iowa. Historical and projected with basis adjusted futures. Source: Lee Schulz, Iowa State University.
Figure 3. ARC-CO and PLC payment per acre estimator, 2014-2018. Source: Ag Decision Maker, File A1-33, 2014 Farm Bill Analyzer

8 Iowa State University Extension and Outreach – 2017 Crop Advantage Series
CropAdvantage
Just as we have seen a tremendous surge in corn and soybean production over the past several years, we have also seen crop usage soar. Over the past 12 years, corn and soybean usage has increased by roughly 50 percent. That growth nearly matches the trend in crop production. And it is that growth that offers the opportunities for higher prices in the future.
The strength in crop usage has provided some protection against significant price erosion. While prices are low, they have not dropped as sizably as one would expect given the record large supplies. Crop margins have also been helped by the extra bushels raised this year. The bushels above trend help in two ways. First, more bushels grown translate into more bushels to sell and more revenue. Second, more bushels grown implies more bushels to spread over costs, lowering costs per bushel. Based on some rough average calculations, the extra bushels above trend in 2016 added about $60 per acre to crop margins for both corn and soybeans. That was enough to bring soybeans to breakeven levels (using ISU production costs) and lift corn partway back to breakeven, turning triple-digit losses to double-digit ones.
But we will need a similar rally for next year’s crops to approach breakeven again. The usage thus far, from the livestock, export, and biofuel industries, suggests demand will continue to grow over the 12-18 months. That demand, combined with hints of any weather issues as we approach planting next year, would create the factors needed to drive that rally. However, with each passing year of record production and building stocks, the price rallies will likely be shorter and smaller, until those weather issues become true weather problems. The markets have already factored in more acres shifting into soybeans for the coming year, some of which are coming from corn, but wheat and other crops will provide new soybean area as well.
-125
-100
-75
-50
-25
0
25
1/4/
2016
2/4/
2016
3/4/
2016
4/4/
2016
5/4/
2016
6/4/
2016
7/4/
2016
8/4/
2016
9/4/
2016
10/4
/201
6
11/4
/201
6
$ pe
r acr
e
Corn Soy
Figure 1. 2017–2018 projected crop margins.
Early estimates from USDA indicate plantings of 90 million acres for corn and 85.5 million acres for soybeans. With trend-line yields, that acreage would produce 14 billion bushels of corn and 4 billion bushels of soybeans. Those totals are slightly below demand estimates for the 2017 crops, so 2017-2018 ending stocks would fall and the potential for price increases would rise.
So the crop margin picture is better than it was last year. The current crops are providing better margins than last year. Projected margins on the next year’s crops are still below breakeven, but closer to breakeven than they were at this time last year. Cost control and timely marketing will still be key to reaching profitability. But as the events of this past year show, it can be done.
Crop market outlook 2017
ObjectivesExplore the factors currently shaping crop markets.
Investigate projected crop prices for the 2017 marketing year.
Discuss potential profitability and marketing opportunities.
Resources @ISU_AgDM
Ag Decision Maker www.extension.iastate.edu/agdm
Iowa Farm Outlook www2.econ.iastate.edu/ifo
USDA World Ag Supply & Demand www.usda.gov/oce/commodity/wasde
Chad Hart Associate professor and Extension ag economist

Iowa State University Extension and Outreach – 2017 Crop Advantage Series 9
CropAdvantage
Keeping uniform seed depth depends on planter depth gauge wheels maintaining contact with the soil surface. This is accomplished by transferring planter frame weight to individual row units. If excessive down force is used on depth wheels, soil can be overly compacted in the seed furrow inhibiting early root growth. Down force is manually adjusted by attempting to “slip” wheels by hand after operating for a short distance. Force is adjusted a moderate amount beyond the point at which wheels can be slipped.
Contact force of depth wheels on a field soil surface constantly varies, particularly as travel speed increases (similar to vehicle “bounce” as you drive a pick-up truck or lighter weight vehicle across a field surface). Figure 1 shows an example of load force measured on planter depth wheels over about 30 ft of travel with the planter operating at 5 mi/h. A planter travels this distance in 4 seconds at 5 mi/h or 3 seconds at 7 mi/h. Rapid variation in contact force of depth wheels on the soil surface creates potential for no (zero) load resulting in shallower than desired seed depth unless average force is set high enough to maintain a minimal (non-zero) load much of the time during operation.
On-the-go systems measure both down force load and wheel contact time or “ride”. Maintain enough contact load for a stable ride to avoid excessive bounce in the seed tube and meter, but avoid using excessive surface load (i.e., more than required) from down force on the depth wheels as this increases potential for soil compaction. Similar to manual adjustment, proper down force setting transfers enough weight from the planter frame to maintain firm, but not excessive contact of depth wheels on the soil surface. Operators should monitor wheel contact and adjust load to maintain contact, but avoid excessive overload that can compact soil.
For either manual or automated systems, consciously evaluate soil conditions (moisture, tillage, texture) at the beginning of each field to set adjustments, then stop initially to check seed depth, seed-to-soil contact, and furrow coverage or whenever soil conditions change significantly. Maintaining soil contact with depth-gauge wheels, but avoiding compaction are somewhat conflicting goals, thus requiring a conscious decision by the operator for the set of field conditions encountered.
0
50
100
150
200
250
0.00 5.00 10.00 15.00 20.00 25.00 30.00
Mea
sure
d l
oad
, lb
Distance, ft
Figure 1. Contact force of depth wheels on soil during 30 ft of travel (about 4 sec at 5 mi/h or 3 sec at 7 mi/h.)
ObjectivesContact load of depth wheels on soil surface varies.
Adequate load maintains contact, but excessive load compacts soil.
Use load and wheel contact information to adjust automated systems.
Stop planter to check seed depth, soil contact, and furrow coverage, making adjustments as necessary (manual or automated systems).
ResourcesAgricultural Machinery Publications from Iowa State University goo.gl/sWk77p
Making sure planter technology covers the basics 2016 ICM Conference proceedings, p. 41 store.extension.iastate.edu/Product/14872
Making sure planter technology accomplishes the basics
Mark HannaExtension agricultural engineer

10 Iowa State University Extension and Outreach – 2017 Crop Advantage Series
CropAdvantage
Palmer amaranth and waterhemp are two dioecious pigweed species native to North America. Waterhemp’s original range was the western Corn Belt, including Iowa, whereas Palmer amaranth originally inhabited the southwestern United States. Palmer amaranth began to spread to the southeastern United States early in the 20th century but was not listed among the most troublesome weeds of the Southeast until the late 1980s. In the past ten years it has been moving into the Corn Belt.
The first report of Palmer amaranth in Iowa was in Harrison County in August 2013. Later that year it was found in four additional counties in the southern part of the state and along the Mississippi River. No new counties were identified with Palmer amaranth at the start of 2016, but by the end of the year 48 counties were known to have Palmer amaranth infestations. The majority of the new findings were associated with the planting of native seed mixes used for conservation plantings that were contaminated with Palmer amaranth seed, but at least six counties were identified where Palmer amaranth was introduced by traditional ag practices (import of animal feed or bedding, movement of contaminated equipment, etc.).
Figure 1. Distribution of Palmer amaranth in the Midwestern United States. Source: University of Illinois.
Palmer amaranth has gained notoriety for two main reasons: 1) its ability to evolve resistance to herbicides, and 2) its rapid growth and high level of competitiveness. In terms of herbicide resistance, Palmer is nearly identical to waterhemp. We have learned the hard way that both of these species can rapidly develop resistance to any herbicide that is heavily relied on for management. Both species have biotypes that are resistant to herbicide groups 2 (ALS), 5 (triazines), 9 (glyphosate), 14 (PPO), and 27 (HPPD). Waterhemp also has resistant biotypes to group 4 (growth regulators), whereas there are Palmer amaranth biotypes resistant to group 3 herbicides (dinitroanilines). Both species accumulate multiple resistances within biotypes, in Iowa we have identified populations resistant to five different herbicide groups. The resistance profiles of the Palmer amaranth populations found in Iowa are unknown.
Palmer amaranth is a much more competitive than waterhemp. A common sight across the Iowa landscape in September and October are soybean fields with scattered infestations of waterhemp. Farmers have learned that these infestations are not affecting yields and have come to accept late-emerging waterhemp escapes. Adopting this strategy when Palmer amaranth becomes established in a field will result in significant yield losses.
People involved in management of invasive weeds of natural areas adopt the tactic of early detection and eradication. It is much less expensive in the long run to invest resources to prevent a new weed from becoming established rather than accept it and deal with it in the future. Eradication is only economically feasible when a weed is found within two or
ObjectivesKnow how to identify Palmer amaranth.
Recognize the threat Palmer amaranth poses to their operation.
Prioritize areas at risk for Palmer amaranth.
Develop effective management programs for Palmer amaranth.
ResourcesPalmer Amaranth Identification, CROP-3105 store.extension.iastate.edu/Product/14794
University of Illinois Weed Science weeds.cropsci.illinois.edu
ISU Integrated Crop Management: Weeds crops.extension.iastate.edu/pests/weeds
2017 Herbicide Guide for Iowa Corn and Soybean Production store.extension.iastate.edu/Product/12150
Palmer amaranth: Preventing movement onto your farm

Iowa State University Extension and Outreach – 2017 Crop Advantage Series 11
Aaron HagerAssociate professor and Extension weed specialist, University of Illinois
three years of introduction. This is why it is so important to carefully scout fields in 2017 to identify Palmer amaranth when if first moves into an area.
The widespread introduction of Palmer amaranth in Iowa in 2016 will undoubtedly reduce the time required for this weed to become a widespread problem in the state. However, we have one thing working in our favor in terms of reducing the spread of Palmer amaranth. Since Palmer amaranth and waterhemp are both pigweed species, they respond similarly to management programs. Nearly every field in Iowa is infested with waterhemp, so management programs are developed to control pigweeds. This will reduce the ability of Palmer amaranth to quickly overwhelm the state. But as mentioned previously, the acceptance of marginal waterhemp control provides an opportunity for Palmer amaranth to replace waterhemp as our number one weed problem.
Developing integrated weed management programs will be essential in reducing the impact of Palmer amaranth. Full rates of effective preemergence herbicides are the foundation of programs targeting Palmer amaranth. Full rates are essential since Palmer amaranth has a prolonged emergence pattern, cutting rates allows the late emerging individuals to escape due to degradation of the chemical. A large number of products are available in the following herbicide groups: 3, 5, 14, 15 and 27. There are several effective postemergence herbicides in both corn and soybean, although resistance is reducing the number of options, especially in soybean. Timely application is critical since the effectiveness of herbicides diminishes rapidly as Palmer amaranth gets beyond 2 or 3 inches in height. The more rapid growth rate of Palmer amaranth compared to waterhemp results in a narrower application window for postemergence herbicides. This reinforces the need for full rates of preemergence herbicides. Late flushes of Palmer amaranth make it difficult to achieve full season control. Including preemergence herbicides in early postemergence applications is an excellent method of extending control until the crop canopy develops, especially in 30” crop rows.
Including non-chemical control strategies where they fit is important. Eliminating seed production (zero thresholds) is essential when attempting to eradicate a new infestation. Hand rogueing has become a standard practice in the south to deal with Palmer amaranth, and it has a fit in Iowa – especially with new infestations. Most farms don’t have the ability to use mechanical weed control on all acres, but cultivation could be a viable option for problem areas in fields. Finally, preventing movement of Palmer amaranth seed from infested fields to clean fields via equipment is critical.
Palmer amaranth is a formidable foe. The key step to minimizing its impact on Iowa agriculture is detecting infestations early and taking the steps needed to prevent establishment of a permanent seedbank. Failing to prevent the spread of Palmer amaranth in the state will result in increased weed management costs for everyone and threats of reduced yields.
The Davenport and Burlington Crop Advantage meetings were presented in partnership with University of Illinois Extension.
Bob Hartzler Professor and Extension weed specialist, Iowa State University
[email protected] @ISUweeds

12 Iowa State University Extension and Outreach – 2017 Crop Advantage Series
CropAdvantage
IntroductionIt has been approximately 30 years since the last new herbicide mechanism of action (MOA) was introduced and it is unlikely that a new MOA will be introduced in the near future. Furthermore, weed management issues continue to escalate, particularly the increasing number of herbicide-resistant weed populations and the increasing population densities in fields with herbicide-resistant weeds. For example, in Iowa, multiple resistance in waterhemp is the norm rather than the exception and the rate of spread is accelerating. The recent wide spread introduction of Palmer amaranth in Iowa further contributes to future weed problems. Iowa farmers expressed concerns that new resistances in weeds are inevitable with the anticipated new herbicides but that the future new herbicides are essentially the only option for effective weed control.
Herbicide resistanceWaterhemp continues to be a major problem in Iowa and waterhemp populations with multiple resistances increasing. A population of giant ragweed was recently discovered that is resistant to both HG2 and HG9, and initial results support putative resistance to HG27. The recent discovery of Palmer amaranth across Iowa brings in the possibility that this “new” weed problem will further contribute to the herbicide resistance issues.
New herbicide resistance traits and weed managementRoundup Ready2 Xtend (dicamba resistant) soybean cultivars were widely planted in 2016 and now Xtendimax with VaporGrip Technology is registered. Enlist (2,4-D resistant) soybean is not widely available due to a decision by Dow AgroSciences to curtail availability until the crop is deregulated globally. However, the 2,4-D and glyphosate herbicide combination (Enlist Duo) specifically formulated and registered for the new trait is approved by EPA, albeit not widely applied by farmers at this time.
A primary concern for these new herbicide-resistant crops and the new HG4 herbicide formulations is the issue of off-target movement and injury. The three avenues for off-target injury include movement by herbicide volatilization, movement by the drift of the spray droplets during application, and the movement onto sensitive crops via the contamination of sprayers and support equipment.
Research conducted by Iowa State University characterized the impact of the two HG4 herbicides applied to susceptible soybean at the V3 stage of development with quantities of 1/10 to 1/5000 of the anticipated label rates that mimic the amount of the HG4 herbicides in a drift situation (Figures 1 and 2).
Figure 1. Soybean injury response to V3 applications of dicamba and 2,4-D. Data averaged for 6 experiments conducted in 2013 and 2014.
Key pointsHerbicide resistance continues to increase and improved scouting and management of escaped weeds it critically important to keep resistance from exploding.
While the “new” weed management system focusing on dicamba is registered, it does not represent the answer to weed management or herbicide-resistant weed management.
Unless proper stewardship and observance of the label are implemented, the risks from “new” weed management based on dicamba may outweigh the benefits.
Weed management update: Changes and improvements for 2017
Mike OwenUniversity Professor and Extension weed specialist

Iowa State University Extension and Outreach – 2017 Crop Advantage Series 13
ResourcesISU Integrated Crop Management: Weeds crops.extension.iastate.edu/pests/weeds
2017 Herbicide Guide for Iowa Corn and Soybean Production store.extension.iastate.edu/Product/12150
Non-dicamba soybeans are more sensitive to dicamba than 2,4-D. Dicamba caused greater yield reduction at lower relative rates than 2,4-D. Foliar injury was observed at herbicide rates that did not cause a reduction in yield. Also, exposure that occurs during the reproductive development of sensitive soybeans has a greater negative impact on soybean yield.
Figure 2. Effect of dicamba and 2,4-D applied to V3 soybeans. Data averaged for 6 experiments conducted in 2013 and 2014.
Research conducted at Iowa State University demonstrates that when specified procedures are followed, tank contamination can be significantly reduced and should minimize off-target issues. However, the studies did not assess the potential for contamination in spray lines, booms and reservoirs where herbicide residues result in serious off-target problems if these are not appropriately cleaned. It will be crucial for farmers and applicators to observe all equipment cleanout processes.
Overall, the important considerations to reduce off-target movement of the new HG 4 herbicides are to follow the stewardship programs provided by the companies. Physical drift and injury attributable to sprayer and nurse tank contamination can be minimized by appropriate decisions by the applicator. While the HG4 herbicides can provide relatively good control of many important herbicide-resistant weeds, they do not represent the answer to this burgeoning problem.

14 Iowa State University Extension and Outreach – 2017 Crop Advantage Series
CropAdvantage
Insecticide resistance issueWith any pest and pesticide interaction, exposures will eventually lead to resistance developing in the population. In 2016, a commercial field in northwest Iowa was suspected to have bifenthrin resistance to soybean aphid after being treated twice within two weeks and no response. Vial assays noted increased resistance ratios of a soybean aphid population collected from the problem field. A combination of integrated pest management (IPM) and insect resistance management (IRM) tactics will be needed to manage soybean aphid and prolong existing and emerging insecticide efficacy. Recent regulatory concerns may further complicate field crop pest management, especially for soybean aphid.
Management recommendationsPopulation fluctuations between locations and years are typical soybean aphid dynamics for Iowa. The odds of making a profitable treatment decision are increased with regular scouting and applications made after exceeding the economic threshold. The economic threshold is validated annually at Iowa State University and is recommended regardless of fluctuating market values. My recommendation for sustainable soybean aphid management in Iowa is to:
• Consider using host plant resistant varieties if soybean aphid populations are persistent and the genetic traits are appropriate for the area. The use of a single resistant gene will result in lower cumulative aphid exposure and the use of a resistant pyramid (i.e., two or more genes) will greatly reduce the likelihood of needing foliar insecticides.
• Plant early if the field is in an area with persistent soybean aphid populations.
• Scout for soybean aphid, especially during R1–R5, and use a foliar insecticide if aphids exceed the economic threshold of 250 per plant. Take note of natural enemies and other potential plant pests in addition to soybean aphid.
• Use a product labeled for soybean aphid, and use high volume and pressure so that droplets make contact with aphids on the undersides of leaves. Check aphid populations three days after application to assess product efficacy.
• Alternate the mode of action if soybean aphid populations need to be treated twice in a single growing season (e.g., organophosphates and pyrethroids).
• Understand that late-season accumulation of aphids, particularly after R5, may not impact yield like it does in early reproductive growth. A foliar insecticide applied after seed set may not be an economically profitable choice.
Before assuming insecticide resistance development in the field, rule out other possible factors, such as: misapplication of the product (incorrect rate, poor coverage, etc.), unfavorable weather conditions around the time of application (wind, rain, temperature), and pest recolonization. The overwintering and migratory behavior of soybean aphid is not fully understood. The magnitude of pyrethroid resistance for soybean aphid in the north central region is also not well characterized yet. In other words, the aphids that colonize soybean can come from different overwintering sites each year and the populations will have a range of susceptibly to insecticides.
Figure 1. Soybean aphid on soybean.
ObjectivesUnderstand how insecticide resistance can occur
Provide research-based insecticide efficacy for soybean aphid
Offer sustainable management recommendations for soybean aphid
ResourcesISU Integrated Crop Management: Insects crops.extension.iastate.edu/pests/insects
ISU Entomology Soybean Research www.ent.iastate.edu/soybeanresearch/content/extension
Resistance management plan for soybean aphid
Erin HodgsonAssociate professor and Extension entomologist
[email protected] @erinwhodgson

Iowa State University Extension and Outreach – 2017 Crop Advantage Series 15
CropAdvantage
There were several diseases that appeared in soybean and corn fields in 2016. While diseases were not common early in the season, by late July they became more prevalent. This talk will focus on identification and management of diseases.
Soybean diseases
Bacterial pustuleAlthough bacterial pustule is fairly uncommon, it was one of the most often observed foliar diseases in 2016. The appearance of this disease was likely associated with the warmer-than-normal temperatures and heavy rainfall. Some fields had enough bacterial pustule to cause defoliation in localized areas, which caused it to be confused with soybean rust.
Frogeye leaf spotFrogeye leaf spot is a commonly observed foliar disease, but is often not yield-limiting in Iowa. In 2016, this disease was easy to find in many fields in the middle of August. As we evaluated disease in fungicide research trials across Iowa, we found that frogeye leaf spot was the most prevalent disease found in the upper canopy. All foliar fungicides were effective at managing frogeye leaf spot in our trials in 2016, and many resulted in higher yields compared to the untreated control.
Sudden death syndromeSDS was once again the most common soilborne disease in Iowa in 2016. The disease appeared early in some parts of the state, but others did not observe SDS in fields until later in the season. We evaluated several different management strategies in 2016, including corn residue management, cover crops, tillage, and seed treatments.
New and re-emerging diseases of cornBacterial leaf streakIn 2016, bacterial leaf streak (BLS) in corn was identified in Iowa and in several other states. Bacterial leaf streak is characterized by narrow leaf lesions with wavy-edges, ranging from less than an inch to several inches in length. The lesions may be yellow, tan, brown or orange and occur between the veins of the corn leaf. Lesions are more noticeable when backlit because of bright yellow halos that extend from the ends of the lesion. There are numerous diseases and disorders that may be mistaken for bacterial leaf streak, for example, gray leaf spot. Little is known about the epidemiology of bacterial leaf streak and the impact it may have on grain yield and quality.
Tar spotTar spot was first reported in the United States in 2015 in Indiana and Illinois. In 2016, the disease was also observed in Iowa, Michigan and Florida. Tar spot is recognized as small, raised, irregularly shaped black spots that occur scattered across the leaf surface. Tar spot may be confused with common rust or southern rust late in the season. It is unlikely that tar spot will cause any yield loss in eastern Iowa where it was detected. Severity of the disease was very low and was detected late in grain fill. However, the fact that the disease is present in the U.S. for a second year suggests that we may see it again in the future.
Physoderma brown spot and node rotWithin the past decade, the prevalence of Physoderma brown spot in Iowa has increased. Reports of node rot caused by the same pathogen have also become more common. Symptoms of Physoderma brown spot are very characteristic. Infected leaves have numerous very small round or oval spots that are yellowish to brown and usually occur in broad bands across the leaf and dark purplish to black oval spots on the midrib of the leaf. Infected nodes are rotted and snap easily when gently pushed, for example while walking across rows. It is unclear what yield loss can occur with Physoderma brown spot. Node rot can result in standability issues and consequently reduced yields.
Twitter campaignIn 2016, we started a Twitter campaign to encourage farmers and agronomists to use social media for disease tracking and information collection purposes. People were asked to include the name of the disease (or what they suspected it was), their county, state and use the Twitter handle @soydisease or @corndisease. The goal of the social media postings was to help us track specific diseases and see where they were showing up in the U.S.
Key pointsWeather events play a primary role in what crop diseases occur each year.
SDS needs to be managed using multiple practices.
New corn diseases have been found in Iowa, be sure to learn how to identify them.
ResourcesISU Integrated Crop Management: Diseases crops.extension.iastate.edu/pests/diseases
Crop Protection Network www.cropprotectionnetwork.org
Regional Twitter accounts @soydisease and @corndisease
Sudden death syndrome and emerging corn disease management
Alison RobertsonAssociate professor and Extension crop plant pathologist
[email protected] @alisonrISU
Daren MuellerAssistant professor and Extension crop plant pathologist
[email protected] @dsmuelle

16 Iowa State University Extension and Outreach – 2017 Crop Advantage Series
CropAdvantage
Pesticide resistance is a topic of growing importance in Midwestern agriculture. Problem weeds, insects, and diseases are adapting to management tactics, in some cases, faster than new management options can be developed.
Pesticide resistance occurs when pest populations initially controlled by a pesticide are no longer susceptible to that pesticide. Inherited changes, due to natural selection, can lead to pests with decreased susceptibility to pesticides that were previously very effective at controlling the pests of concern. Often, a very small number of pests initially survive the pesticide application. These pests reproduce and when exposed to application of the same pesticide, populations of resistant individuals quickly increase.
Some pests are naturally immune to a particular pesticide when applied at its label rate. These pests are called “tolerant” to those pesticides. For example, atrazine can provide control of many annual grass and broadleaf weeds but causes no injury to grain sorghum or corn. Grain sorghum and corn are tolerant to the atrazine.
Pesticide resistance is of great concern to Midwestern crop production due to the possibility of failed control of insects, weeds, and pathogens causing yield loss and economic loss. The limited number of current pesticides, fast evolution of resistance, and lack of new tools to manage pest problems creates challenges for farmers that will continue into the future.
For example, unique cases of herbicide resistance are increasing globally, nearing 500 cases worldwide by 2015 (Figure 1). A United States Department of Agriculture (USDA) Economic Research Service (ERS) 2015 report entitled “The Economics of Glyphosate Resistance Management in Corn and Soybean Production” stated that farms with glyphosate-resistant weeds made over $67 less in returns than farms without glyphosate-resistant weeds. This is just one example of the cost of pesticide resistance issues across the world. While herbicide resistance is common and easy to relate, many of the same principles apply to insecticide and fungicide resistance as well.
Delaying pesticide resistance will require good stewardship of current pesticides to prevent a loss of these tools. This session will cover the principles of pesticide resistance, how it develops in a population, and how to choose appropriate management tactics for slowing the spread of these issues.
Figure 1. Global increase in unique cases of herbicide-resistant weeds. Source: Heap, 2016. www.weedscience.org
Pesticide resistance: A threat to Midwestern crop production
ObjectivesDefine pesticide resistance.
Describe how pesticide resistance occurs.
Recognize the importance of pesticide resistance to crop producers.
Identify strategies to delay pesticide resistance.
ResourcesThe Economics of Glyphosate Resistance Management in Corn and Soybean Production www.ers.usda.gov/publications/pub-details/?pubid=45357
Rebecca VittetoeExtension field agronomist
[email protected] @rkvittetoe
Meaghan AndersonExtension field agronomist
[email protected] @mjanders1
Iowa State University Extension and Outreach – 2017 Crop Advantage Series 17
CropAdvantage
Applicators are using an expanding list of herbicides. GMO herbicide resistance traits are in use and emerging herbicide technology traits are anticipated. A herbicide label is published for emerging 2,4-D/glyphosate technology (Enlist Duo). A supplemental label had just been released for one dicamba technology (Xtendimax, dicamba product currently without glyphosate allowed in tank mix) but another expected dicamba label (Engenia) related to dicamba-resistant crops had not been released as of this writing.
Applicators are cautioned to refer to the final published applicable label for instructions on specific products following regulatory approval. Points discussed are based on currently labeled products and suggested labeling used for discussion with new dicamba technology. Points are used for educational purposes and not intended to promote sale of a particular product.
New technology is vigorously evaluated with specific nozzles in wind tunnel tests. Spray quality (e.g., very coarse, extremely coarse, ultra coarse) is helpful, but expect to see specific nozzle styles (such as Turbo Teejet Induction, TTI, for new dicamba technology) and more information about allowable operating pressure with specific nozzles listed on the label. A web site may be listed on the label for updates on currently allowable nozzles tested. Because varying travel speed affects boom pressure, check the effect of slower or faster travel speed on operating pressure and resulting spray quality of the nozzle selected for each product applied. Glufosinate (e.g. LibertyLink products) has contact mode-of-action suggesting a spray quality with smaller droplets (e.g., medium) while other systemic herbicides use larger droplets.
Adjuvants and tank mix partners can affect droplet size and drift potential. The only products allowable for tank mixing with new 2,4-D and dicamba resistance systems are specifically listed on websites found on the herbicide label. Ammonium sulfate (AMS) is not allowed to be mixed with new dicamba technology. Detailed recommendations on sprayer and equipment clean-out for new technology are on the label including number of rinses, acceptable cleaning products, and minimum time requirements for circulation, cleaning and drainage.
Boom height over the target should only be high enough for proper nozzle overlap. Maximum boom height for new dicamba technology is not greater than 24 inches. Maximum travel speed (e.g. 15 mi/h) may be listed along with buffer zone distances if wind is blowing toward specific sensitive areas. Requirements on buffer distances are more specific than those used for earlier herbicide products and require evaluation of wind direction in respect to sensitive areas. Beside maximum wind speed, specific guidance on minimum speed may be given as well as avoiding temperature inversions. Increased droplet size may be recommended on the label during periods of low relative humidity and warm air temperature (to compensate for evaporation effects).
Allocate time during the off-season to assess potential herbicides that may be used and consult the label for application requirements. Pay particular attention to GMO-linked herbicide use with new product technology or any products that you may be unfamiliar with.
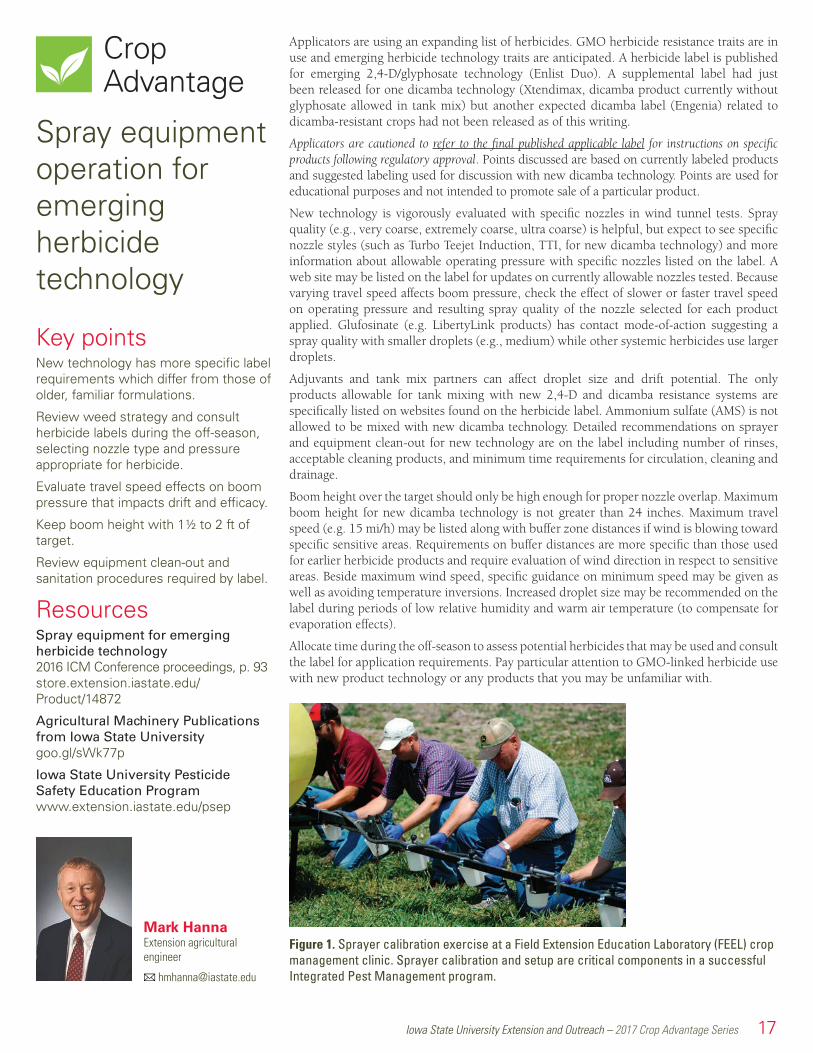
Figure 1. Sprayer calibration exercise at a Field Extension Education Laboratory (FEEL) crop management clinic. Sprayer calibration and setup are critical components in a successful Integrated Pest Management program.
Spray equipment operation for emerging herbicide technology
Key pointsNew technology has more specific label requirements which differ from those of older, familiar formulations.
Review weed strategy and consult herbicide labels during the off-season, selecting nozzle type and pressure appropriate for herbicide.
Evaluate travel speed effects on boom pressure that impacts drift and efficacy.
Keep boom height with 1½ to 2 ft of target.
Review equipment clean-out and sanitation procedures required by label.
ResourcesSpray equipment for emerging herbicide technology 2016 ICM Conference proceedings, p. 93 store.extension.iastate.edu/Product/14872
Agricultural Machinery Publications from Iowa State University goo.gl/sWk77p
Iowa State University Pesticide Safety Education Program www.extension.iastate.edu/psep
Mark HannaExtension agricultural engineer
18 Iowa State University Extension and Outreach – 2017 Crop Advantage Series
CropAdvantage
Potassium for crop production in IowaPotassium fertilization effects on corn and soybean grain yield have been studied for many years in Iowa. The research results summarized for this and other conferences included calibration of soil-test methods and study of soil-test K spatial and temporal variability, recycling with crop residues, K placement methods for various tillage systems, soil sampling methods, and variable-rate fertilization. The research has shown the importance of proper K fertilization practices for profitable to crop production, which mainly include appropriate use of soil sampling and testing, fertilizing low-testing soils, maintaining soil-test K levels in the Optimum interpretation category, and avoiding fertilization of high-testing soils.
However, recent or ongoing significant research with K has not been shared. This research relates to interactions of K fertilization with other inputs or growing conditions. An interaction exists when the crop response to one growth factor influences the response to another. This article summarizes results of research on the interaction of K and nitrogen (N) fertilization in corn and between K fertilization and incidence of soybean diseases.
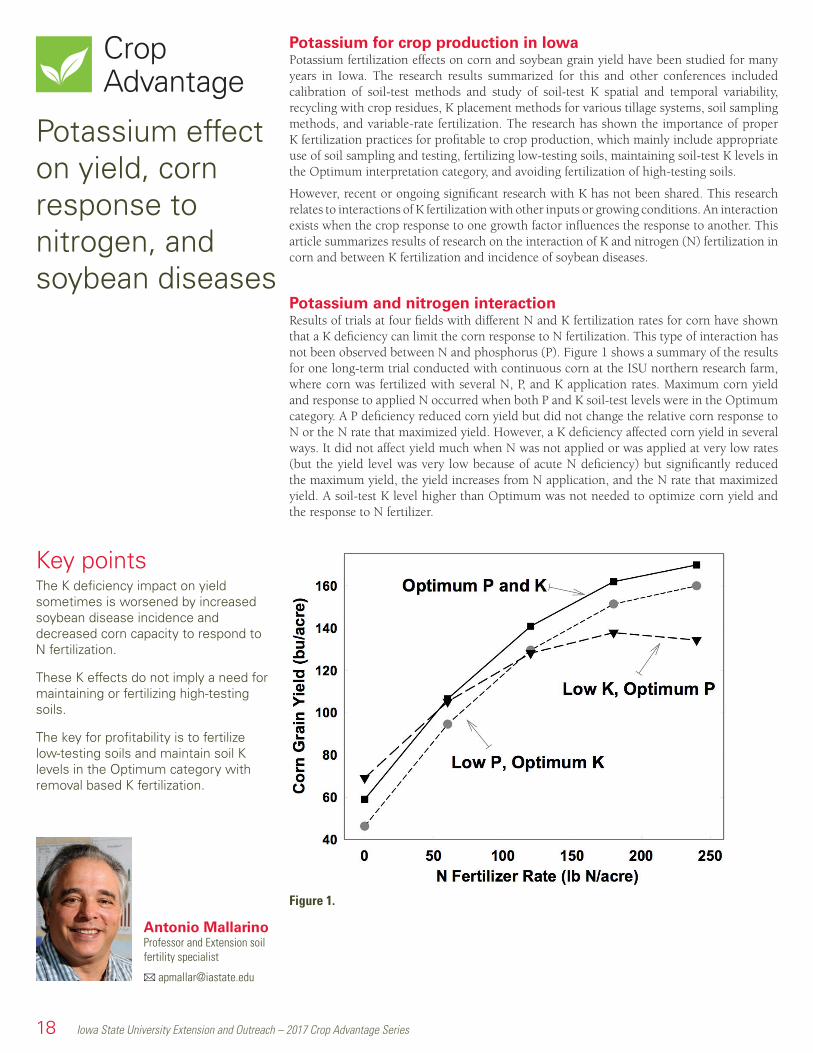
Potassium and nitrogen interactionResults of trials at four fields with different N and K fertilization rates for corn have shown that a K deficiency can limit the corn response to N fertilization. This type of interaction has not been observed between N and phosphorus (P). Figure 1 shows a summary of the results for one long-term trial conducted with continuous corn at the ISU northern research farm, where corn was fertilized with several N, P, and K application rates. Maximum corn yield and response to applied N occurred when both P and K soil-test levels were in the Optimum category. A P deficiency reduced corn yield but did not change the relative corn response to N or the N rate that maximized yield. However, a K deficiency affected corn yield in several ways. It did not affect yield much when N was not applied or was applied at very low rates (but the yield level was very low because of acute N deficiency) but significantly reduced the maximum yield, the yield increases from N application, and the N rate that maximized yield. A soil-test K level higher than Optimum was not needed to optimize corn yield and the response to N fertilizer.
Figure 1.
Key pointsThe K deficiency impact on yield sometimes is worsened by increased soybean disease incidence and decreased corn capacity to respond to N fertilization.
These K effects do not imply a need for maintaining or fertilizing high-testing soils.
The key for profitability is to fertilize low-testing soils and maintain soil K levels in the Optimum category with removal based K fertilization.
Potassium effect on yield, corn response to nitrogen, and soybean diseases
Antonio MallarinoProfessor and Extension soil fertility specialist

Iowa State University Extension and Outreach – 2017 Crop Advantage Series 19
ResourcesA General Guide for Crop Nutrient and Limestone Recommendations in Iowa store.extension.iastate.edu/Product/5232
Making rational adjustments to phosphorus, potassium, and lime application rates when crop prices are low and producers want to cut inputs 2015 ICM Conference, page 149. store.extension.iastate.edu/Product/14430
Iowa State University Extension Soil Fertility extension.agron.iastate.edu/soilfertility
Potassium and soybean diseasesThe literature shows that K deficiency sometimes causes physiological changes in plants that facilitate disease infection, and that chloride (Cl) included in potash fertilizer can reduce fungal diseases. However, this type of research has been conducted only recently in Iowa. Several field trials have shown that when there is high disease pressure, the disease incidence is greater with K deficiency than when soil K is Optimum or higher or when low-testing soils are fertilized. Figure 2 shows, as an example, results for one study in a soil initially low in P and K managed with no-till that was fertilized with four rates of potash fertilizer before planting soybean. Diseases evaluated were frogeye leaf spot, Septoria brown spot, and Cercospora. Soybean yield responded greatly to the lowest K rate, and small increases (less than one bu) did not pay for the higher rates. Potassium application decreased the incidence of the three diseases. The lowest K rate was sufficient to eliminate incidence of Cercospora. Higher K rates, which did not increase yield economically, further decreased the incidence of brown spot and frogeye spot. Therefore, the K effect at increasing yield can be explained by the elimination of K deficiency and by a decreased disease incidence when there is disease pressure.
Figure 2.

20 Iowa State University Extension and Outreach – 2017 Crop Advantage Series
CropAdvantage
Rye cover crop for reducing nitrate lossWinter cereal rye as a cover crop in Iowa has potential for large reduction in nitrate-N loss through tile drainage (average 31% nitrate-N concentration, Iowa Nutrient Reduction Strategy). As the soil system is open to drainage, it is not possible to retain nitrate in the soil between annual crops when soil moisture is in excess of holding capacity and free drainage occurs. The main effect of a cover crop is uptake of inorganic-N (predominantly nitrate-N) from the soil profile in the “off-season” that otherwise could move to surface water.
Rye cover crop nitrogen uptake and recyclingThe amount of post-harvest residual profile nitrate-N is not large with optimally fertilized corn or following soybean. However, if corn is over-fertilized, then more residual nitrate-N will be present and hence a greater opportunity for rye cover crop uptake. The rye N uptake effect is significant enough to reduce nitrate loss with drainage, however, the agronomic significance is much less because the total N amount accumulated is generally low; most often less than 40 lb N/acre and much less when rye growth is limited with dry/cold conditions or termination when small. In no-till with terminated rye left on the soil surface, approximately 77% of N in rye following soybean and 60% following corn has been measured to be recycled at 105 days following termination. Therefore, expected total net N release from degraded rye across the growing season would be low.
Rye cover crop plant componentsMeasure of rye cover crop plant shoot and root material at termination (Table 1) has shown only 20% of total rye plant N in roots (with a carbon:nitrogen (C:N) ratio of approximately 50:1 which is high enough for N immobilization to occur, that is, inorganic-N from the soil system used by microbes during degradation of the root material); and 80% of rye N in shoots (with approximately 20:1 C:N ratio, about where there is a net balance of immobilization/mineralization, meaning no net gain of inorganic-N with degradation). Agronomically, the N recycling is about at a balance. This has been shown in research where there is no mean effect of a rye cover crop proceeding corn on either decreasing or increasing the optimal N fertilization rate required for the corn crop (Figure 1).
Table 1. Rye cover crop plant components at termination in spring 2015 at Ames (S. Patel, J. Sawyer, J. Lundvall, and J. Hall).
N rate to corn
Biomass DM Nitrogen
Shoot Root Shoot Root
- - - - - - - - - - - - - - lb/acre - - - - - - - - - - - - - -Following corn
0 878 486 15 4120 1,030 463 19 4200 1,041 438 19 4Mean 983a 462b 18a 4b
Following soybean
Mean 1,096 573 26a 5b
Crop yieldsFor corn and soybean crops in Iowa following a rye cover crop, soybean yields are most often not affected and corn yield has a small average yield decrease (6% in the Iowa Nutrient Reduction Strategy and the same amount found in our research, Figure 1). The rye effect on corn yield varies, has been infrequent for a yield increase, sometimes a large reduction, and generally follows a linear decrease in corn yield as the rye biomass amount increases. In an attempt to help alleviate the lower corn yield, our research has looked at tillage (chisel plow
ObjectivesEffect of rye cover crop N recycling on corn optimal N fertilization rate.
Fraction of rye cover crop N recycled after termination.
Distribution of rye cover crop N in roots and shoots.
Rye cover crop root and shoot C:N ratio, and relation to N cycling.
Tillage and high starter N rate for alleviating rye cover crop effects on corn yield.
ResourcesCorn nitrogen rate response and crop yield in a rye cover crop system.goo.gl/6UhHU4
Root and shoot biomass and nutrient composition in a winter rye cover cropgoo.gl/x5yNQg
Enhancing corn yield in a rye cover cropping systemgoo.gl/hwRFvT
Iowa State University Extension Soil Fertility www.agronext.iastate.edu/soilfertility
Nitrogen dynamics with a rye cover crop

Iowa State University Extension and Outreach – 2017 Crop Advantage Series 21
following corn and spring disk/field cultivate following soybean compared to no-till), high starter N rate for corn (30 lb N/acre 2x2 placed compared to no starter, with the main N injected sidedress), and with the rye cover crop termination when small (6-8 inch height). Both tillage and the high starter N rate helped improve corn yield, to within 2% of the yield without the rye cover crop.
SummaryRye as a cover crop has good success in Iowa at reducing nitrate-N loss with tile drainage. Cover crop N cycling is therefore important for water quality, but has not had a similar positive influence on corn N fertilization requirement within the corn-soybean system.
John SawyerProfessor and Extension soil fertility specialist
0
40
80
120
160
200
0 40 80 120 160 200
Co
rn Y
ield
(b
u/a
cre)
Fertilizer N Rate (lb N/acre)
With Rye
No Rye
Figure 1. Corn grain yield response to N rate (open symbols indicate economic optimum N rate) with and without a rye cover crop (J. Sawyer, J. Pantoja, and D. Barker, 2009-2013).

22 Iowa State University Extension and Outreach – 2017 Crop Advantage Series
CropAdvantage
The Iowa Nutrient Reduction Strategy (INRS) is a science and technology-based framework developed to assess and reduce nutrient loss to Iowa waters and the Gulf of Mexico. The strategy includes efforts to reduce the total load of nitrogen and phosphorus from point and nonpoint sources by 45%. The practice-based approach was developed in response to the 2008 Gulf Hypoxia Action Plan that calls for Iowa and eleven other states along the Mississippi and Ohio Rivers to develop strategies to reduce nutrient loadings to the Gulf of Mexico and ultimately reduce the size of the gulf hypoxic zone.
The INRS development was led by the Iowa Department of Agriculture and Land Stewardship, the Iowa Department of Natural Resources and the College of Agriculture and Life Sciences at Iowa State University and included an assessment of recent research to identify agricultural practices that reduce nitrogen and phosphorus loss. An assessment of nitrogen and phosphorus discharge from the state’s largest wastewater treatment plants was conducted by the Iowa Department of Natural Resources. Through these assessments, the point source reduction goals were established at 4% for nitrate-nitrogen and 16 % for phosphorus and non-point source reduction goals were set at 41 % for nitrate-nitrogen and 29% for phosphorus.
Measuring progress of the Iowa Nutrient Reduction StrategyTo measure progress of the INRS, a logic model approach is employed (Figure 1). The logic model organizes measurable indicators of desirable change that can be quantified, and represents a progression towards goals for achieving a 45 percent reduction in nitrogen and phosphorus loads. In order to affect change in water quality and nutrient loss, there is a need for increased inputs, measured as funding, staff, and resources. Inputs affect change in outreach efforts and human behavior, leading toward a shift to more conservation-conscious attitudes in agricultural communities. This shift may result in changes on the land, measured as conservation practice adoption. Finally, these changes on the land may result in improved water quality and reduced nutrient loss. This logic model approach helps track progress toward NRS goals.
Measuring INRS progress is a complex undertaking that is accompanied by a variety of challenges. For example, current analyses rely on public cost-share data to evaluate conservation practice adoption on agricultural land. There is limited knowledge of the extent to which farmers employ conservation without public financial assistance, but efforts are currently underway to capture this critical information. Efforts are continually evaluated and improved, including a current public-private partnership between ISU and the Iowa Nutrient Research and Education Council. This effort will build on relationships with agricultural retailers with a goal of gaining more insight into farmers’ in-field nutrient management decision-making. These efforts will aim to address the challenges associated with reliable tracking of farmers’ efforts with in-field practices, such as cover crops and fertilizer management.
Meeting the nitrate reduction goalA high rate of adoption of a combination of the in-field, edge of field and land use change practices is needed to meet the nitrate reduction goal. The Iowa State University Extension publication Reducing Nutrient Loss: Science Shows What Works, further describes the practices and nitrate-nitrogen reduction effectiveness for each practice. The science team created eight scenarios to illustrate the combination of practices and rates of adoption to achieve this goal. Table 28 in the INRS science assessment includes the description of each scenario, the load reduction from the calculated baseline, and the cost estimate for each scenario per pound of nitrate reduced and per acre average statewide.
ObjectivesSummarize the Iowa Nutrient Reduction Strategy and the identified nitrate and phosphorus reduction practice options.
Recognize the Logic Model approach to measuring progress of the Iowa Nutrient Reduction Strategy, progress made to date, and explore new ways that farmers’ and landowners’ conservation activities are being documented.
Through a facilitated small group discussion, participants will demonstrate their understanding of nitrate reduction practices and the level of implementation needed to reach the INRS goal by creating scenarios and calculating watershed and field-scale nitrate reductions.
ResourcesIowa Nutrient Reduction Strategy: A Science and Technology-Based Framework to Assess and Reduce Nutrients to Iowa Waters and the Gulf of Mexico www.nutrientstrategy.iastate.edu/documents.
Reducing Nutrient Loss: Science Shows What Works store.extension.iastate.edu/Product/13960
ISU Extension Water Quality www.extension.iastate.edu/waterquality
Iowa Nutrient Reduction Strategy

Iowa State University Extension and Outreach – 2017 Crop Advantage Series 23
Scenario Building and Facilitated DiscussionParticipants attending this presentation will review the nitrate reduction practice options identified in the Nutrient Reduction Strategy. Using practice descriptions, effectiveness information, landscape qualities, and cropping system characteristics, participants will discuss and select practices to build a scenario to meet the nitrate reduction goal for an Iowa Hydrologic Unit Code (HUC) 12 watershed. Watershed characteristics to aid in decision making and scenario building including land use, crop rotation acreage and fertilizer inputs, drainage, livestock numbers, and acres that receive manure will be provided. The participants will work in small groups to discuss and select practices and levels of adoption to complete their watershed scenario. Each group will appoint a leader to present their scenario to the larger group and the nitrate load reduction will be calculated using the Nitrate Load Estimate Calculator. The groups will have the opportunity to adjust their scenario and recalculate the load reduction estimate. Through this facilitated discussion, participants will demonstrate their understanding of nitrate reduction practices and the level of adoption needed to meet nitrate reduction goals for a HUC 12 watershed.
Figure 2. Jyotsna Acharya (left), Tom Kaspar, USDA-ARS (right) and a student evaluate cover crop growth in a test plot.
Figure 1. The Logic Model of the Iowa Nutrient Reduction Strategy, guided by measurable indicators of desirable change.
Laurie NowatzkeMeasurement coordinator
Jamie BenningWater quality program manager
[email protected] @jlbenning

24 Iowa State University Extension and Outreach – 2017 Crop Advantage Series
CropAdvantage
Much of the U.S. Corn Belt is characterized by relative flat, poorly-drained areas which with extensive subsurface drainage, have become some of the most valuable and productive agricultural land in the world. However, this is not without consequences. Nitrate-N loss from these systems is of particular concern due to its potential adverse impacts on both public health and ecosystem function. In addition to the potential local impacts on receiving waters in the Corn Belt, nitrogen loads from the region are suspected as a primary contributor to hypoxia in the Gulf of Mexico. Iowa has long been a leader in balancing agricultural production and water quality concerns and in 2013 the Iowa Department of Agriculture and Land Stewardship released a nutrient reduction strategy in response the 2008 Gulf of Mexico Hypoxia Task Force Action Plan. The statewide assessment used aggregated nitrogen management information but there is a need to better understand nitrogen management to assess potential water quality and profitability benefits of improved nitrogen management. Toward that end, we are collecting field-scale management information on five drainage districts in northwest Iowa where drainage has been improved. In addition, wetlands have been installed at the exit of these drainage districts so by examining monitoring we can assess overall impact of in-field management which is the in-flow to the wetland and then performance of the wetland with wetland outlet monitoring.
Results and discussionFrom reported information in 2015, the area-weighted N application rate for corn following beans was 161 lb-N/acre and the area-weighted N application rate for corn following corn is 238 lb-N/acre. The N application rate ranged from 109 to 190 lb-N/acre for corn following soybeans and 182 to 280 lb-N/acre to corn following corn. From this it seems there are at least some of the producers that have potential to improve profitability and water quality by examining nitrogen application rate. From water quality monitoring in 2015, the flow-weighted nitrate-N concentration ranged from 16 mg/L to 23 mg/L for the five drainage districts. The nitrate-N load reduction by the wetlands was about 30% in 2015 since thus was a fairly wet year in this area.
AcknowledgementsThis project is funded by the Iowa Corn Promotion Board, Iowa Department of Agriculture and Land Stewardship, and USDA-NRCS under an Iowa Conservation Innovation Grant.
Extending field scale 4R nutrient management and wetland performance to watershed scale outcomes
Key pointsThe Iowa Nutrient Reduction Strategy calls for in-field and edge-of-field practices.
In-field nitrogen management is the first place to start in reduce nitrate-N loss.
Wetlands integrated with drainage has potential to dramatically decrease nitrate-N loss.
ResourcesIowa Nutrient Reduction Strategy www.nutrientstrategy.iastate.edu
Matthew HelmersProfessor and Extension agricultural engineer
[email protected] @ISUAgWaterMgmt

Iowa State University Extension and Outreach – 2017 Crop Advantage Series 25
CropAdvantage
Subsurface drainage systems are an important component of agricultural production systems in many areas of Iowa. However, improperly designed drainage systems can provide less than desired results for the investment in the system. Also, these drainage systems have been shown to deliver nitrate-N to downstream waterbodies. So, while subsurface drainage is important for crop production we also need to consider the design of these systems for proper function as well as to minimize nitrate-N.
Drainage systems need to be designed for efficient collection of excess soil water as well as adequately transporting that water to the outlet. The efficient collection of water involves proper depth and spacing of drain lines for the soil they are installed in. Selecting the correct size, type and grade of the main lines is required for providing adequate water transport.
Depending on the soils and topography, there are design considerations that can be used to reduce nitrate-N loss. These include the use of drainage water management as well as designing for installation of edge of field nitrate reduction practices.
Since 2007, a study has been conducted at the SE Iowa Research and Demonstration Farm to determine the impact of shallow, controlled, conventional, and no drainage on crop yields, subsurface drainage volumes, and nitrate loss through subsurface drainage. There are two replications for each drainage treatment with corn and soybean planted in each year.
Conventional plot tile lines are installed at a depth of 4 ft. with a spacing of 60 ft. Shallow and controlled drainage plots represent drainage water management. Controlled tile lines are the same design as the conventional. Controlled drainage plots are kept undrained following harvest until early spring. Shallow plot tile lines are installed at a depth of 2.5 ft. with a spacing of 40 ft.
Over the nine year study period, the controlled and shallow drainage plots reduced drainage by 48 and 50%, respectively as compared to the conventional drainage plots. Since the drainage water management treatments had little impact on nitrate-N concentration the overall loss of nitrate-N was reduced by 51% and 40% by controlled and shallow drainage, respectively.
Figure 1. Annual nitrate-N loss from 2007-2015 for drainage treatments.
In general, no significant differences were observed in corn grain yields between drainage treatments but there were overall yield benefits of the drainage treatments compared to the undrained treatments. Over the nine years there was approximately a 13 bushel/acre increase in corn yield between the undrained treatment and the conventional drainage treatment. Consistent with corn yield increases with drainage, soybeans yields increased about 6 bushel/acre with conventional drainage compared to undrained. Because the undrained plots were adjacent to drainage plots and all of the plots were planted on the same date, potential yield benefits of the drainage systems are likely conservative.
While subsurface drainage is important for crop production in Iowa, there is a need for implementation of practices that can reduce the downstream delivery of nitrate-N. This nine-year study found that shallow and controlled drainage practices have potential to reduce downstream nitrate-N loss. These drainage water management systems had minimal impact on crop yield.
Key pointsProperly designed drainage systems involve proper depth and spacing of tile drains as well as correctly sizing drainage mains.
Nine years of research show drainage water management systems reducing drainage volume about 50% with a 40 to 50% reduction in nitrate discharge.
Drainage water management systems had similar crop yields to conventional drainage systems which conservatively improved corn yields 13 bu/A and soybean yields 6 bu/a over non drained plots.
ResourcesIowa Drainage Guide store.extension.iastate.edu/Product/6064
Drainage Water Management in the Corn Belt store.extension.iastate.edu/Product/14348
Ag Water Management Research Group agwatermgmt.ae.iastate.edu
Drainage design for profits and water quality
Greg BrennemanAgricultural engineering field specialist

26 Iowa State University Extension and Outreach – 2017 Crop Advantage Series
CropAdvantage
IntroductionCorn and soybeans are major annual crops grown in yearly rotation in Iowa. The economic returns of both crops with different tillage systems and crop rotations are highly influenced by regional soil and climate conditions. Factors including different tillage systems impact corn and soybean yields through changes in the soil water content and recharge (Figure 1). In a long-term study across the state we evaluated yield and economic return of corn and soybean from 2003 to 2013 using 5 tillage systems (NT, ST, CP, DR, and MP) and three crop rotations (C-S, C-C-S, and C-C).
Tillage and crop rotation effects on yield and economic returnYield and economic returns advantage for corn across all tillage systems of the three rotations systems are as follow: C-S> C-C-S> C-C (Figure 2). Corn yield and economic return penalty with NT were greater than conventional tillage, especially in the northern locations with poorly-drained soils as compared to the southern locations with well-drained soils and warmer temperatures. In this long-term tillage and crop rotation study we found corn yield penalty associated with C-C was location specific and varied from 11 to 28% across the state. Also, we found the input cost for corn production for conventional tillage systems (CP, DR, and MP) was greater than that associated with NT and ST by 7.5 and 5.7%, respectively. However, Soybean yields show no significant response to different tillage systems at different locations and the economic return with NT ($509/acre) exceeded that with conventional tillage ($502/acre). Input cost associated with soybean with NT was lower ($187/acre) than that with conventional tillage ($207/acre). The C-C-S rotation resulted in greater soybean yields (9%) and economic returns (11%) than those with the C-S rotation in five out of the seven locations across Iowa. Site specific effect of rotation on soybean yield was more dominant than the effect of tillage system on soybean yield where differences in soybean yields were not significant.
Time (min)
0 5 10 15 20 25 30
Cum
ulat
ive
infil
trat
ion
(inch
)
0.0
0.2
0.4
0.6
0.8
1.0
1.2
1.4
NT ST DR CP MP
Figure 1. Cumulative water infiltration under five tillage systems (NT and ST increased water recharge by 50-70% over conventional tillage systems). NT=no-till; ST=strip-tillage; CP=chisel plow; DR=deep rip; MP=moldboard plow.
Key pointsInput cost with conventional tillage was 8% and 6% more than NT and ST, respectively.
Yield decline with C-C range between 11 to 28%.
No soybean yield difference across all tillage systems.
Long-term tillage and crop rotation effects on soil, yield and economic return in Iowa
Mahdi Al-KaisiProfessor and Extension soil management specialist
[email protected] @soilmgt

Iowa State University Extension and Outreach – 2017 Crop Advantage Series 27
Location
NW NC NE C SW SC SE
Econ
omic
retu
rn ($
/acr
e)
-200
0
200
400
600
800
1000
1200
CS CCS CC
(a) Corn
p value0.0056 0.0005 0.0001 0.14670.005 0.0006 0.006
Location
NW NC NE C SW SC SE0
200
400
600
800
1000
1200
C-S C-C-S (b) Soybean
p value0.132 0.534 0.001 0.044 0.020 0.007 0.001
Location
NW NC NE C SW SC SE
Econ
omic
retu
rn ($
/acr
e)
-200
0
200
400
600
800
1000
1200
CS CCS CC
(a) Corn
p value0.0056 0.0005 0.0001 0.14670.005 0.0006 0.006
Location
NW NC NE C SW SC SE0
200
400
600
800
1000
1200
C-S C-C-S (b) Soybean
p value0.132 0.534 0.001 0.044 0.020 0.007 0.001
Location
NW NC NE C SW SC SE
Econ
omic
retu
rn ($
/acr
e)
-200
0
200
400
600
800
1000
1200
CS CCS CC
(a) Corn
p value0.0056 0.0005 0.0001 0.14670.005 0.0006 0.006
Location
NW NC NE C SW SC SE0
200
400
600
800
1000
1200
C-S C-C-S (b) Soybean
p value0.132 0.534 0.001 0.044 0.020 0.007 0.001
Figure 2. Corn (a) and soybean (b) economic return as affected by crop rotation across seven Iowa locations. Rotations: corn–soybean (C-S) and corn–corn–soybean (C-C-S); locations: northwest (NW), north-central (NC), northeast (NE), central (C), southwest (SW), southcentral (SC), and southeast (SE). Corn and soybean yields occurred in the same year in different rotations.
ResourcesSoil Management and Environment www.agronext.iastate.edu/smse
Iowa Soil Health Field Guide store.extension.iastate.edu/Product/14680
Iowa Soil Health Management Manual store.extension.iastate.edu/Product/14682
Iowa Soil Health Assessment Card store.extension.iastate.edu/Product/14681

28 Iowa State University Extension and Outreach – 2017 Crop Advantage Series
CropAdvantage
The Iowa Cover Crop Working Group is under the leadership of the Iowa Learning Farms program and includes core members from the following agencies and organizations: Practical Farmers of Iowa, Iowa State University Extension and Outreach, USDA-Agricultural Research Service-National Laboratory for Agriculture and the Environment, Leopold Center for Sustainable Agriculture, and the Iowa Department of Agriculture and Land Stewardship (IDALS).
Long-term demonstration of cover crops on Iowa farmland: Management, soil health and water quality benefitsFunded by: State Soil Conservation Committee, IDALS (2008-2015), Leopold Center
Time frame: 2008-Present
Summary: The goal of the project is to evaluate the effect of winter rye cover crop on cash crop yields in Iowa using strips to compare plots with and without rye within the same field. The project began with six sites established in 2008, with another six established in 2009. In 2016, six sites completed year 8 of the project and five famer-partner agreed to continue with the goal of reaching ten years.
• The twelve initial sites were in Shelby, Adair, Butler, Greene, Grundy, Guthrie, Ida, Tama, Taylor, Washington (two farmer partners) and Webster counties.
• Cereal rye above-ground biomass will be sampled at each demonstration site near the date of termination and corn/soybean yields are collected each fall.
• Bulk density and total nitrogen, total carbon, organic matter and pH soil samples and infiltration test data were collected in year one and year five.
Earthworms and cover crops: Unlocking the secrets of soil health through early biological indicatorsFunded by: USDA-NRCS State Conservation Innovation Grant (2015-2018), Leopold Center for Sustainable Agriculture (2014-2015)
Time frame: September 2015 - September 2018
Summary: A common earthworm found in many Iowa crop fields, the nightcrawler (Lumbricus terrestris) is a deep-burrowing earthworm, building large vertical tunnels than can extend 5-6 feet in depth. While an introduced earthworm species and not present in all fields, it has numerous qualities that make it a beneficial biological indicator of soil health in agricultural systems. The goal of this project is to evaluate the presence and abundance of earthworm middens in replicated strip trials with and without cover crops (6 long-term rye on-farm sites, 1 long-term rye research site near Ames).
Evaluating planting techniques for the successful establishment of cover crop mixtures and single species in IowaFunded by: USDA-NRCS State of Iowa Conservation Innovation Grant; Leopold Center
Time Frame: October 2013 - September 2016
Summary: The goal of the project is to evaluate planting techniques for the successful establishment of cover crop mixtures and single species in Iowa. The project created three two-year demonstration sites to assess different planting techniques in the Des Moines Lobe soil region. This project collaborates with Hagie Manufacturing Company to test and evaluate three different seeding practices in on-farm demonstrations:
1) Seed delivered under cash crop canopy
2) Seed broadcast above cash crop canopy
3) Seed soil incorporated after cash crop harvest
Iowa Cover Crop Working Group demonstration and research projects
Liz JuchemsEvents coordinator Iowa Learning Farms
[email protected] @LizJuchems
Key pointsCereal rye and oats produce the greatest amount of biomass in an Iowa corn/soybean system and help retain land value through reduced erosion.
After 7 years, farmer partners report yield neutral results for corn and soybean following cereal rye.
Measured results indicate 38% more earthworms, a positive indicator of soil health, in the cereal rye strips versus no cover.

Iowa State University Extension and Outreach – 2017 Crop Advantage Series 29
Figure 1. Cover crop research and demonstration sites.
Economic exploration of cover crop benefits to crop and livestock systemsFunded by: State Soil Conservation Committee, IDALS
Time frame: July 2014 - June 2016
Summary: The goals of this project are to estimate the economic value of reduced erosion from cover crop use and to evaluate the value of cover crops for grazing and forage in a livestock operation. Cover crop economics often consider just the additional input costs and yield impacts without considering the benefits of reducing soil and nutrient loss. Livestock producers have the opportunity to gain additional benefits beyond the cropping system through adding additional feed and grazing potential.
Demonstrating cover crop mixtures on Iowa farmland: Management, soil health and water quality benefitsFunded by: USDA-NRCS Conservation Innovation Grant
Time frame: October 2013 thru September 2017
Summary: The goal of the project is to evaluate management techniques that will increase growth and improve the overall environmental benefits of cover crops: improving soil health and reducing nutrient losses. The project has established replicated plots at six regional farmer association research farms and was expanded in 2014 to include 9 farmer-partner sites to evaluate management of cover crop mixtures.
• The association research plots compare three treatments: no cover crop, single species cover crop, and a mixture cover crop. Each treatment is replicated four times at each site, for a total of 24 plots at each farm. The plots range from six to twelve rows wide and are all 50 ft in length.
• The farmer partner plots will demonstrate two treatments: no cover crop and a mixture cover crop (mixture is determined by the upcoming cash crop). Each treatment is replicated four times at each site, for a total of 8 plots at each farm (8-24 acres).
• Preceding the corn crop, the single species is oats and the mix contains hairy vetch, oats, and radish. Preceding the soybean crop, the single species is rye and the mix contains rapeseed, rye, and radish.
ResourcesIowa Learning Farms cover crop resources www.iowalearningfarms.org/ cover-crops
Iowa Learning Farms www.iowalearningfarms.org
Practical Farmers of Iowa www.practicalfarmers.org/
Tips and Considerations for Getting Started with Cover Crops goo.gl/uQyjZV
Midwest Cover Crops Council www.mccc.msu.edu

30 Iowa State University Extension and Outreach – 2017 Crop Advantage Series
CropAdvantage
Angie Rieck-Hinz210 1st Street SWClarion, IA 50525(515) 231-2830
[email protected] @nciacrops
Mark Johnson220 H Ave, PO Box 118Nevada, IA 50201(515) 979-9578
[email protected] @msjagron
Brian Lang325 Washington, Ste BDecorah, IA 52101(563) 382-2949
Virgil Schmitt1514 Isett AvenueMuscatine, IA 52761(563) 263-5701
[email protected] @VirgilSchmitt
Joel DeJong251 12th St SELeMars, IA 51031(712) 546-7835
[email protected] @joel_dejong
Paul Kassel110 West 4th StreetSpencer, IA 51301(712) 262-2264
[email protected] @PaulKassel
Aaron Saeugling53020 Hitchcock Ave.Lewis, IA 51544(712) 769-2650
Rebecca Vittetoe2223 250th StWashington, IA 52353(319) 653-4811
[email protected] @rkvittetoe
Terry BasolBorlaug Learning Center3327 290th StreetNashua, IA 50628-9270(641) 435-4864
Mike Witt212 State StreetGuthrie Center, IA 50115(641) 430-2600
Meaghan Anderson3109 Old Highway 218 SIowa City, IA 52246(319) 337-2145
[email protected] @mjanders1
Field agronomistsIowa State University Extension and Outreach Field Agronomists are located throughout Iowa to assist farmers with current crop production and protection information. They serve as a vital link in delivering current, relevant and research-based information to the citizens of Iowa.
1
2
3
4
5
6
7
8
9
10
11
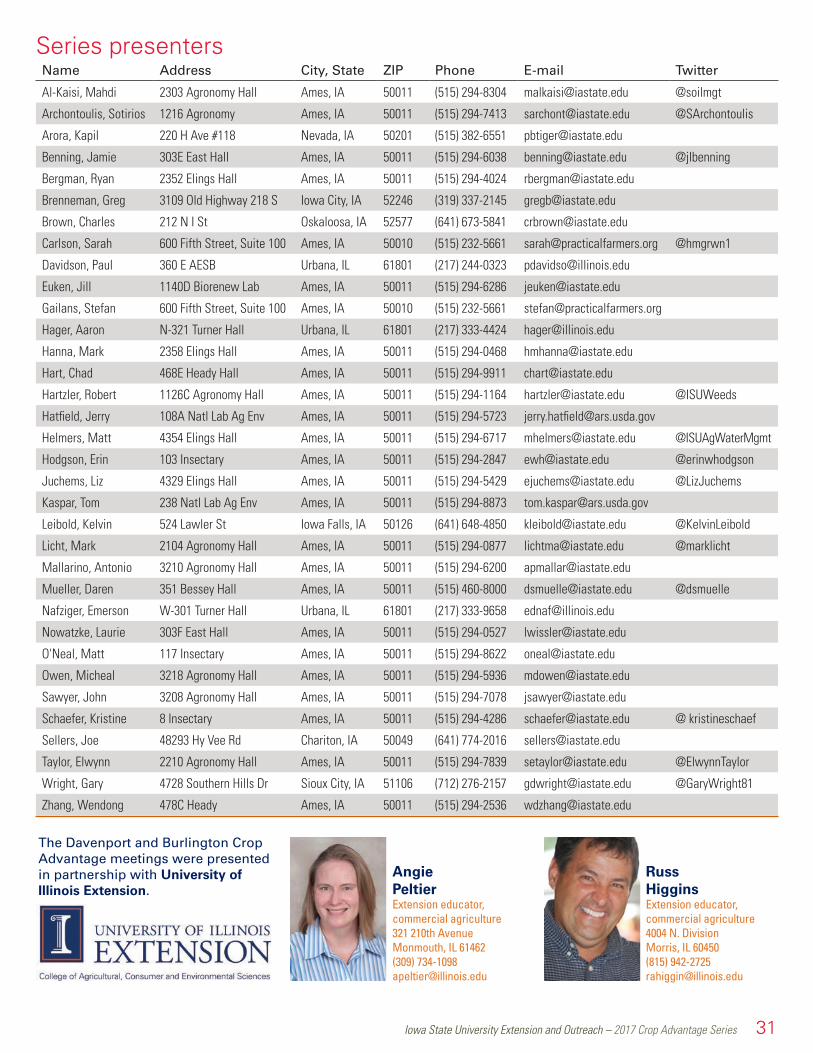
Iowa State University Extension and Outreach – 2017 Crop Advantage Series 31
Series presentersName Address City, State ZIP Phone E-mail Twitter
Al-Kaisi, Mahdi 2303 Agronomy Hall Ames, IA 50011 (515) 294-8304 [email protected] @soilmgt
Archontoulis, Sotirios 1216 Agronomy Ames, IA 50011 (515) 294-7413 [email protected] @SArchontoulis
Arora, Kapil 220 H Ave #118 Nevada, IA 50201 (515) 382-6551 [email protected]
Benning, Jamie 303E East Hall Ames, IA 50011 (515) 294-6038 [email protected] @jlbenning
Bergman, Ryan 2352 Elings Hall Ames, IA 50011 (515) 294-4024 [email protected]
Brenneman, Greg 3109 Old Highway 218 S Iowa City, IA 52246 (319) 337-2145 [email protected]
Brown, Charles 212 N I St Oskaloosa, IA 52577 (641) 673-5841 [email protected]
Carlson, Sarah 600 Fifth Street, Suite 100 Ames, IA 50010 (515) 232-5661 [email protected] @hmgrwn1
Davidson, Paul 360 E AESB Urbana, IL 61801 (217) 244-0323 [email protected]
Euken, Jill 1140D Biorenew Lab Ames, IA 50011 (515) 294-6286 [email protected]
Gailans, Stefan 600 Fifth Street, Suite 100 Ames, IA 50010 (515) 232-5661 [email protected]
Hager, Aaron N-321 Turner Hall Urbana, IL 61801 (217) 333-4424 [email protected]
Hanna, Mark 2358 Elings Hall Ames, IA 50011 (515) 294-0468 [email protected]
Hart, Chad 468E Heady Hall Ames, IA 50011 (515) 294-9911 [email protected]
Hartzler, Robert 1126C Agronomy Hall Ames, IA 50011 (515) 294-1164 [email protected] @ISUWeeds
Hatfield, Jerry 108A Natl Lab Ag Env Ames, IA 50011 (515) 294-5723 [email protected]
Helmers, Matt 4354 Elings Hall Ames, IA 50011 (515) 294-6717 [email protected] @ISUAgWaterMgmt
Hodgson, Erin 103 Insectary Ames, IA 50011 (515) 294-2847 [email protected] @erinwhodgson
Juchems, Liz 4329 Elings Hall Ames, IA 50011 (515) 294-5429 [email protected] @LizJuchems
Kaspar, Tom 238 Natl Lab Ag Env Ames, IA 50011 (515) 294-8873 [email protected]
Leibold, Kelvin 524 Lawler St Iowa Falls, IA 50126 (641) 648-4850 [email protected] @KelvinLeibold
Licht, Mark 2104 Agronomy Hall Ames, IA 50011 (515) 294-0877 [email protected] @marklicht
Mallarino, Antonio 3210 Agronomy Hall Ames, IA 50011 (515) 294-6200 [email protected]
Mueller, Daren 351 Bessey Hall Ames, IA 50011 (515) 460-8000 [email protected] @dsmuelle
Nafziger, Emerson W-301 Turner Hall Urbana, IL 61801 (217) 333-9658 [email protected]
Nowatzke, Laurie 303F East Hall Ames, IA 50011 (515) 294-0527 [email protected]
O'Neal, Matt 117 Insectary Ames, IA 50011 (515) 294-8622 [email protected]
Owen, Micheal 3218 Agronomy Hall Ames, IA 50011 (515) 294-5936 [email protected]
Sawyer, John 3208 Agronomy Hall Ames, IA 50011 (515) 294-7078 [email protected]
Schaefer, Kristine 8 Insectary Ames, IA 50011 (515) 294-4286 [email protected] @ kristineschaef
Sellers, Joe 48293 Hy Vee Rd Chariton, IA 50049 (641) 774-2016 [email protected]
Taylor, Elwynn 2210 Agronomy Hall Ames, IA 50011 (515) 294-7839 [email protected] @ElwynnTaylor
Wright, Gary 4728 Southern Hills Dr Sioux City, IA 51106 (712) 276-2157 [email protected] @GaryWright81
Zhang, Wendong 478C Heady Ames, IA 50011 (515) 294-2536 [email protected]
Russ HigginsExtension educator, commercial agriculture4004 N. DivisionMorris, IL 60450(815) 942-2725 [email protected]
The Davenport and Burlington Crop Advantage meetings were presented in partnership with University of Illinois Extension.
Angie PeltierExtension educator, commercial agriculture321 210th Avenue Monmouth, IL 61462 (309) 734-1098 [email protected]

Funded in part by the soybean checkoff
COLLABORATION + COMMUNICATION =
We’re committed to improving the profitability of Iowa’s soybean farmers. And it shows.Over the last 50 years, the ISA has invested more than $50 million in checkoff funding to basic and applied
research conducted by Iowa State University. That research is helping farmers increase yields and develop
better disease, pest and weed management in an environmentally sustainable way. To see the results of
checkoff investments in soybean research, visit www.iasoybeans.com or www.soybeanresearchinfo.com.
It’s a winning formula. And one that’s embraced by the Iowa Soybean Association and Iowa State University.
SUCCESS
ISA16_CropAdvantage_ad.indd 1 12/13/16 11:45 AM


