International Journal of Scientific and Research Publications, Volume 3, Issue 3, March 2013 1 ISSN 2250-3153 www.ijsrp.org Crop Assessment and Monitoring for Sugar Cane Crop, Sudan, (New Halfa Case Study) Using Remote Sensing and GIS Techniques Abbass, H, M * , El_Hag, A. M. H ** * Remote Sensing Authority (RSA), National Center for Research (NCR), Ministry of Sciences and Technology (MOST) ** University of Bahri, Faculty of Natural Resources, Basic Science Department, Ministry of Higher Education and Scientific Research, Khartoum North ( Al- Kadaro) Sudan Abstract- There is shortage of information about sugar cane crop in Sudan; therefore, it is necessary to adopt a new technology for carrying out inventory or estimation of this crop-space technology (Remote Sensing, GIS, and GPS) can offer an invaluable assistance in this regard. In this research, space technologies were applied for sugar cane crop estimation in New Halfa sugar cane scheme.IRS- 5m resolution image was used for this purpose. Two areas were selected as the study area (area three and area six). Two sets of image were used (October, 2006 and December, 2007). The Supervised classification technique was adapted for the study. The results showed clear variations between the sugar cane fields. To continue close monitoring of the sugar cane yield, satellite images captured at different dates during the growing period of sugar cane should be available. The research results revealed the importance of integrating RS and GIS as effective tools for the assessment, detection, monitoring and mapping of the various features on the earth's surface such as land degradation. Moreover, RS & GIS assist in the study of vegetation cover. Etc. This leads to saving effort, time and cost. I. INTRODUCTION here is an urgent need for interest in improved management of natural resources. As the supplies of commodities reduce and the number of environmental incidents grows, it becomes evident that better information is needed to enable humans to use their resources expertly. The need for resources data has out-paced the capabilities of conventional survey and monitoring techniques. This need is particularly essential in developing countries. One method of meeting this challenge is through an integrated information system for resources management that could provide higher quality of information in a more timely fashion than current systems. Crop yield estimation, in many countries is based on conventional techniques, of data collection based on ground field visits and reports. Such reports are often subjective, costly, time consuming and erroneous, leading to poor crop yield assessment and estimations. Sudan is multi agricultures of crop like sorghum comes first by area and volume of crop. Such as wheat cultivation has been known in northern Sudan between latitudes 17 & 27 north for thousands of years. To meet this demand wheat cultivation was introduced into central Sudan between latitudes 15 & 13 north with temperature higher than the optimum that suits the crop. Moreover, the winter season is relatively short. Sugar cane is one of the most agricultural crop in terms of economic returns and for that, in addition to sugar production enjoyed that allows many products such as molasses and its derivatives as well as feed and paper and cardboard industry and with the rise in population in the world rises the for the consumption of sugar in the world. In Sudan due to the integration of many factors, such as, appropriate climate, fertile soils, labor and reasonable infrastructures. Sugar production in Sudan started in 1962, with the establishment of the Guneid Sugar Factory in the Gazera province. There are now five sugar factories in the country. Guneid Sugar Company (GSC).- New Halfa Sugar Company (NHSC).- Assalaya Sugar Company (ASC).- Sennar Sugar Company (SSC) and.- Kenana Sugar Company (KSC).As shown in figure (1) . II. STUDY AREA New halfa is located in the lining plain on the west bank of the River Atbara between latitude (15° 20΄ – 15˚ 30΄ N) and longitude (33˚ 25΄– 33˚ E). About 360 kilometers in the direction of the east and 50 kilometers west of the town of Kassala, and mediates many of the most important cities Gedaref T
Transcript
International Journal of Scientific and Research Publications, Volume 3, Issue 3, March 2013 1 ISSN 2250-3153
www.ijsrp.org
Crop Assessment and Monitoring for Sugar Cane Crop,
Sudan, (New Halfa Case Study) Using Remote Sensing
and GIS Techniques
Abbass, H, M*, El_Hag, A. M. H
**
* Remote Sensing Authority (RSA), National Center for Research (NCR), Ministry of Sciences and Technology (MOST)
** University of Bahri, Faculty of Natural Resources, Basic Science Department, Ministry of Higher Education and Scientific Research, Khartoum
North ( Al- Kadaro) Sudan
Abstract- There is shortage of information about sugar cane crop
in Sudan; therefore, it is necessary to adopt a new technology for
carrying out inventory or estimation of this crop-space
technology (Remote Sensing, GIS, and GPS) can offer an
invaluable assistance in this regard.
In this research, space technologies were applied for
sugar cane crop estimation in New Halfa sugar cane scheme.IRS-
5m resolution image was used for this purpose. Two areas were
selected as the study area (area three and area six). Two sets of
image were used (October, 2006 and December, 2007). The
Supervised classification technique was adapted for the study.
The results showed clear variations between the sugar
cane fields. To continue close monitoring of the sugar cane yield,
satellite images captured at different dates during the growing
period of sugar cane should be available. The research results
revealed the importance of integrating RS and GIS as effective
tools for the assessment, detection, monitoring and mapping of
the various features on the earth's surface such as land
degradation. Moreover, RS & GIS assist in the study of
vegetation cover. Etc. This leads to saving effort, time and cost.
I. INTRODUCTION
here is an urgent need for interest in improved management
of natural resources. As the supplies of commodities reduce
and the number of environmental incidents grows, it becomes
evident that better information is needed to enable humans to use
their resources expertly.
The need for resources data has out-paced the capabilities
of conventional survey and monitoring techniques. This need is
particularly essential in developing countries. One method of
meeting this challenge is through an integrated information
system for resources management that could provide higher
quality of information in a more timely fashion than current
systems.
Crop yield estimation, in many countries is based on
conventional techniques, of data collection based on ground field
visits and reports. Such reports are often subjective, costly, time
consuming and erroneous, leading to poor crop yield assessment
and estimations.
Sudan is multi agricultures of crop like sorghum comes
first by area and volume of crop. Such as wheat cultivation has
been known in northern Sudan between latitudes 17 & 27 north
for thousands of years. To meet this demand wheat cultivation
was introduced into central Sudan between latitudes 15 & 13
north with temperature higher than the optimum that suits the
crop. Moreover, the winter season is relatively short.
Sugar cane is one of the most agricultural crop in terms of
economic returns and for that, in addition to sugar production
enjoyed that allows many products such as molasses and its
derivatives as well as feed and paper and cardboard industry and
with the rise in population in the world rises the for the
consumption of sugar in the world.
In Sudan due to the integration of many factors, such as,
appropriate climate, fertile soils, labor and reasonable
infrastructures. Sugar production in Sudan started in 1962, with
the establishment of the Guneid Sugar Factory in the Gazera
province.
There are now five sugar factories in the country.
Guneid Sugar Company (GSC).- New Halfa Sugar
Company (NHSC).- Assalaya Sugar Company (ASC).- Sennar
Sugar Company (SSC) and.- Kenana Sugar Company (KSC).As
shown in figure (1) .
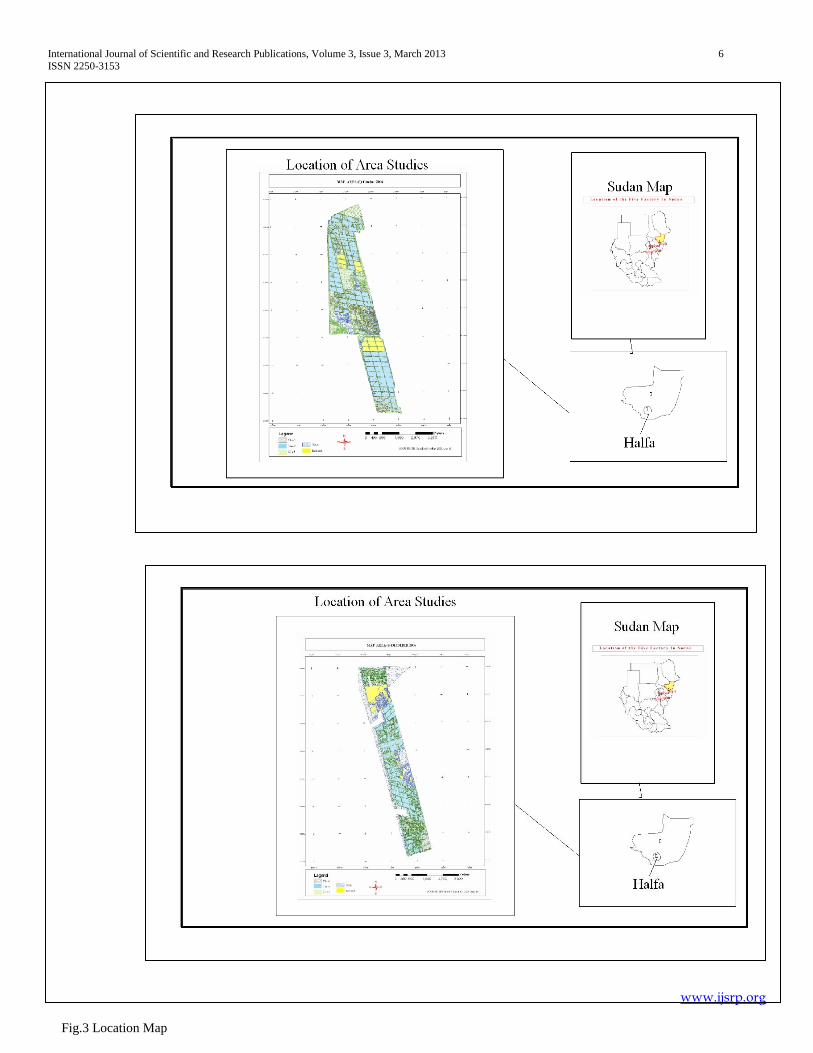
II. STUDY AREA
New halfa is located in the lining plain on the west bank of
the River Atbara between latitude (15° 20΄ – 15˚ 30΄ N) and
longitude (33˚ 25΄– 33˚ E). About 360 kilometers in the
direction of the east and 50 kilometers west of the town of
Kassala, and mediates many of the most important cities Gedaref
T
International Journal of Scientific and Research Publications, Volume 3, Issue 3, March 2013 2
ISSN 2250-3153
www.ijsrp.org
- Kassala - Atbara - Shendi. (Sawsan 2005).The study area lies in
eastern Sudan within Kassala State in area of about 50km².
It is considered of important stabilization of New Halfa
Sugar factory that brings success to the process of sugar
production. The gross area of the scheme is about 42,000 acres.
The New Halfa project scheme was developed in the 1960s in the
context of the resettlement of people who were displaced when
Lake Nasser was formed. In later years, agriculture in the area
had been decrease and was increasingly weakness to meet
production demands. The rehabilitation project set out to increase
sustainable agricultural production through the efficient use of
available land, water and human resources. Improving
agricultural production and cropping patterns.
The study area covered 8 divided areas from new halfa
factory for administrative purposes.
III. METHODOLOGY
Two sub images from IRS (Indian Remote Sensing)
covering the study area (42,000 acres) were used in this study.
The two images are a False Color Composite (FCC).The
Composed of three bands each of wavelength of the
electromagnetic spectrum. The image used in this studied were
collected October 2006 and December 2007, the specifics of
images from Indian Remote Sensing (IRS) with resolution 5m.
The two sub images was Georeferenced and used as a high
resolution data based on landsat band chromatic (band 8, 15 m
spatial resolution). Global and Linear Enhancement was
conducted, in addition to radiometric and geometric correction
with Georeferencing images to ground control points and first
order transformation with error < 1.0 pixel. Contrast
enhancement, called global enhancement, was used for
Transformation of raw data using the statistics computed over the
whole data set. Linear stretching and histogram equalization was
used to enhance specific data ranges. Special enhancement
procedures that result in image pixel value modification, (based
on the pixel values) in its immediate vicinity (local enhancement)
was used to emphasize low frequency features and to suppress
the high frequency component of an image using low paths
filters. High pass filter do just the reverse.
Georeferencing was used to correct and adapt the maps
geometrically; image to image keyboard model through Erdas
imagine 9.1 was used to correct the other maps and Global
Positioning System (GPS) garmin 60 was used to locate the
position. Supervised, unsupervised classification and visual
interpretation was carried out. Areas and percentage of the areas
that was covered by different types of vegetation, and then post
classification change detection approach was adopted based on
map calculation which was applied to determine the dynamic of
change in landcover. Geographical Information System (GIS)
was used for data capture, input, manipulation, transformation,
visualization, combination, query, analysis, modeling and output,
An intersection was performed between the classified image and
the soil map of the study area in order to improve the
classification results.
IV. RESULTS AND DISCUSSION
Based on Visual, digital image interpretation and field survey 5
major classes were recognized as:
Class I.
Class II.
Class III.
Water bodies.
Bare land.
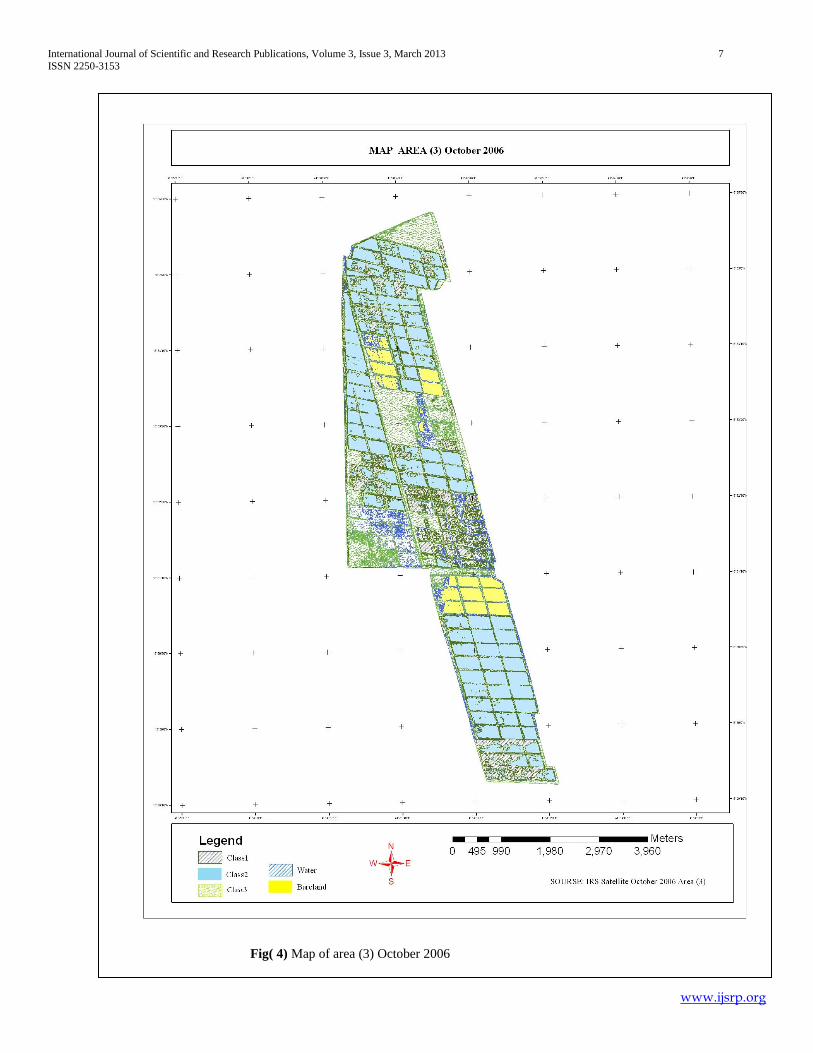
The Comparison between the two images (Year 2006 and
2007) interpreted Map and Filed survey data showed that class1
covered small area (367.865fadan), which estimated to 16.794%
of the total area of area 3. Most of the area showed homogeneity
expect in the north part of the area (as shown table 1,2 and 3).
Class 11 covered bigger are than class 1 with the area
(878.385fadan) and 40.099% of the total study area both classes
1and 11 showed some mixing in the same parts of the field.
Classes III considered to be distributed among field and
estimate at 17.758% of the total area and covered
(388.9975fadan). This class scattered and mixes with some bare
area and also some part of water exist inside the field. The
existence of the water inside the field indicated that some
problems of land leveling.
The rest of the tow classes water and bare land (No care)
considered being estimated more the 50% of the total area and
covered (360.1475fadan) and bare land covered (195.1225fadan)
and estimate 8.908% of the total area for water with bare land
and classes, respectively. (Figure 4, 5, 6 and 7).
International Journal of Scientific and Research Publications, Volume 3, Issue 3, March 2013 3
ISSN 2250-3153
www.ijsrp.org
Table .1 Show five classes in area (3) year 2006
Classes F_AREA Area (%)
Class(I) 367.865 16.794%
Class(II) 878.385 40.099%
Class(III) 388.997 17.758%
Water 360.1475 16.441%
Bare land 195.1225 8.908%
Total Area 2190.5175 100%
In year 2007 and during the Images analysis and
Interpretation the result showed that that class1 was increase
compared to its area in 2006 was covered (621.5724fadan) Parts
of this class were found distributed among class (II) this class
was estimated at 27.910% of the total study area and this increase
confirmed that the irrigation system had been improved during
2007 than 2006.
Class 11which was large covering (452.0575fadan), was
estimated at 20.99% of the total study area. Both classes 11 and
class1 showed some mixing in some parts of the field. This
reflects on found of organized irrigation and improved
environmental factors.
Class III considered being distributed mange all the field
and covered (328.1150fadan) and estimate at14.733%. This class
scattered with water and mixed with bare land, and also part with
class1, and clas11 Showed that the water, was decreased due to
the improvement of water distribution system. Water covered an
area of (5370124.fadan) and estimated at 24.113% of the total
study area. This requires to the improvement of the water
direction of run and the slope, while the bare land increased
compared to 2006 and covered an area of (288.2724fadan) which
it estimated at 12.944 %. This class was related to water
distribution and level of slope. (Figure 4,5,6 and 7)
Table 2: Show five classes in area (3) period 2007.
Classes F_AREA Area (%)
Class(I) 621.5724 27.910
Class(II) 452.0575 20.299
Class(III) 328.1150 14.733
Water 537.0124 24.113
Bare land 288.2724 12.944
Total Area 2227.0299 100%
Table (.3) change in the area3 through2006 and 2007
International Journal of Scientific and Research Publications, Volume 3, Issue 3, March 2013 4
ISSN 2250-3153
www.ijsrp.org
Table 4: Show five classes in area (6) year 2006
Figure 2 showed the five classes in area (6) year 2007
V. CONCLUSIONS AND RECOMMENDATION
Sudan is consider the food basket of the world in the
future that need to crop assessment and monitoring purpose
increasing productivity. this required highest using technology
like Remote Sensing (RS) and Geographic Information System
(GIS).
This study is one from the studies to apply using new
technology and was apply for sugar cane crop (halfa case study)
considering very important agriculture export.
The result of study in compared different time in 2006-
2007 explain increased and decreased in some fields effect
environmental factor, slope, water distribution system and
agriculture cycles. Although this studies using unsupervised
classification (Software, GIS methods) the result classified for
five classes: class I, class II, class III, water and bare land. In
2006 this classes shown in area (3), class I, class II and bare land
increasing while class III and water decreased compared with the
total area in 2007, it might be because of improvement of the
irrigation system in 2007.
Comparing the classes of area (6) in 2007 and 2006
shown class I, class III and water increased might be because of
slope enhancement, while class II and bare land decrease was
observed might be because it was mixed with other classes and
improve water distribution system.
The last result helped to make the layout of the four maps
for each area produced by applying unsupervised classification
without actually being in contact with the study area. Based on
the findings of this study, some measures may be considered to
mitigate the problem in the study area. These include the
following:
Need to apply for a new Remote Sensing (RS)
technique and Geographic information system (GIS) in
assessment and monitoring sugar cane in study area
(New halfa factory) requirement increasing in
productivity.
Establish especial complete unit (computer unit,
different department of following remote sensing and
use different GIS software)
Training for all employees in factory.
Class F_AREA Area (%)
Class(I) 232.7924 13.930%
Class(II) 503.9099 30.154%
Class(III) 252.5750 15.114%
Water 194.2625 11.624%
Bare land 487.5899 29.177%
Total Area 1671.1297 100%
International Journal of Scientific and Research Publications, Volume 3, Issue 3, March 2013 5
ISSN 2250-3153
www.ijsrp.org
Use GPS in vehicles harvesting sugar cane.
Get use of waste of sugarcane for energy produce
(Ethanol, paper making).
Use national and international experiences.
Increase individual income and increase awareness of
stability that push to increasing sustainable
development.
REFERENCES
[1] Rao, U.R., 1991. Remote Sensing for National Development, Current Science, 61 (3&4): 121-128.
[2] Jay Raman, V., and Chandrasekhar, M.G., 1992. Second Generation Indian Remote Sensing Satellites - IRS-IC &ID, Presented at 43rd Congress of the IAF, Aug. 28-Sep. 5. 1992, Washington. D.C.
[3] Jay Raman, V., Chandrasekhar, M.G., and Rao, U.R., 1993. Remote Sensing for National Development: Implementing results achieved is th4 National Indian Satellite Programmer. Presented at the UN/IAF Workshop on "Organizing Space Activities in Developing Countries: Resources and Mechanics on 16/3/193 during 44th IAF Congress at Graz, Austria.
[4] Agricultural and Industrial Production Annual Report 2000.
[5] Agricultural Biotechnology - Sugar Production Sudan Development program SDP AGRI 2042Y (3).
[6] BLaU and Göttingen, post-market monitoring II: Selection of sites in agricultural.
[7] BioMath and Rostock. Post-market monitoring III: Development of a statistical instrument for data evaluation.
[8] Development Studies and Research Centre, University of Khartoum, New Halfa Agricultural Corporation. 1978. Evaluation of Productivity for 1976/77 (in Arabic). New Halfa, Sudan, 1977. How to survive development the story of New Halfa.
[9] FAO Disclaimer Geography, climate and population Aquastat food and agriculture organization of the United Nations Source.
[10] Federal Biological Research Centre for Agriculture and Forestry (BBA), Institute for Plant Virology (2005 - 2008), Post-market monitoring I: Data collection from farmers and through crop protection agencies (project group coordination) Microbiology and Biosafety, Braunschweig.
[11] Johnson, R.M. and Richard Jar, E.P. 2005, Precision Agriculture Applications in Louisiana Sugarcane Production Systems, International Society of Sugar Cane Technologists Proceedings. 25:351-356PRODUCTION SYSTEMS
[12] Jacobsen, K and IGARSS IGARSS epos Geosciences and Remote Sensing Symposium, Pro- Geometric and information potential of IRS-1C PAN-images.
[13] John Weier and David Herring Measuring vegetation (NDVI&EVI) David Herring Responsible NASA official: Dr. Michael D. King We’re a part of the Science Mission Directorate Privacy Policy and Important Notices .
[14] IEEE 1999 International Volume 1, Issue, 1999 Page(s):428 – 43 vol.1, Digital -IGARSS epos 1999 and IEEE 1999 International Geosciences and Remote Sensing Symposium, Proceedings. Volume 1, Issue, 1999 Page(s):428 - 430 vol.1.
[15] L.J.C. Autrey ( [email protected]), S. Ramasamy and K.F. Ng Kee Kwong are working at the Mauritius Sugar Industry Research Institute, Mauritius. Mauritius: Reforming the sugar cane industry For further information, visit http://www.lsuagcenter.com/archive.
[16] Richard Jar and Johnson, R.M Protection, E.P. 2004, a survey of temporal and spatial variability in Louisiana sugarcane production systems [abstract], Journal of the American Society of Sugar Cane Technologists, 24:113.
[17] Sugar Cane Agronomy AGRI 1031Y (1).
[18] http://www.usyd.edu.au/agric/acpa/articles.
[19] Monitoring the length of the growing season with NOAA.
[22] New Halfa Irrigation Rehabilitation product (http://sudagric.gov.sd/largeirrig.htm).
[23] Peer Reviewed Journal. Publication Acceptance Date: June 24, 2004 Publication Date: January 30, 2005 Precision Agriculture Applications in Louisiana Sugarcane Submitted to: International Society of Sugar Cane Technologists Proceedings Publication Type.
AUTHORS
First Author – Abbass, H, M, Remote Sensing Authority (RSA),
National Center for Research (NCR), Ministry of Sciences and