sustainability Article Crop Diversity and Common Agricultural Policy—The Case of Slovakia Jarmila Lazíková 1, *, Anna Bandlerová 1 , L’ubica Rumanovská 2 , Ivan Taká ˇ c 2 and Zuzana Lazíková 1 1 Department of Law, Slovak University of Agriculture in Nitra, 94976 Nitra, Slovakia; [email protected] (A.B.); [email protected] (Z.L.) 2 Department of European Policies, Slovak University of Agriculture in Nitra, 94976 Nitra, Slovakia; [email protected] (L’.R.); [email protected] (I.T.) * Correspondence: [email protected]Received: 13 February 2019; Accepted: 1 March 2019; Published: 7 March 2019 Abstract: Crop diversity has an important role in sustainable agroecosystems. This study analyzed the crop diversity of agricultural holdings in particular regions (NUTS III) in Slovakia and identified the impact of Common Agricultural Policy (CAP) payments on the crop diversity of agricultural holdings. There are regional disparities in crop diversity in Slovakia. The highest crop diversity is typical for the regions with the best soil quality. From the results of econometric models, it was found that some of the CAP payments have an effect on crop diversity, mainly single area payment scheme (SAPS) payments, which had a negative effect, and payments for areas facing natural constraints (ANC) and animal welfare, which were found to have positive effects. It can be concluded that the second pillar of the CAP is able to improve or at least maintain crop diversity in Slovakia. Other important factors found to influence crop diversity are irrigation, total crop area corresponding with the farm size, geographical location including the soil quality, and the legal structure of agricultural holdings. However, the distance of the farm from the city, the education of managers, and membership in farmers’ associations are not important factors for crop diversity in Slovakia. Keywords: crop diversity; sustainability; agricultural holdings; Common Agricultural Policy; Slovakia 1. Introduction The quality and diversity of European landscapes constitute a common resource and it is important to co-operate toward their protection, management, and planning [1]. The Convention defines a landscape as an area with a character that is the result of the action and interaction of natural and/or human factors [1], which provides semi-natural habitats for many endangered and rare species that are dependent on continued management for their preservation [2–5]. Agriculture is both a large-scale user of land and a provider of landscapes [6]. Many species and ecosystems of conservation concern in Europe depend on agricultural management [7]. In agricultural systems, crop biodiversity may provide the link between stress and resilience, as resilient agroecosystems are characterized by a high degree of crop diversity [8]. Crop diversification improves the capacity of agricultural systems and provides insurance or a buffer against environmental fluctuations because different species respond differently to change, leading to more predictable aggregate community or ecosystem properties [9]. More diverse cropping systems tune agroecosystem performance rather than less diverse systems [10]. Diversification is the sign of a progressive reorientation of agriculture toward a multifunctional activity that combines producing quality food, maintaining rural livelihoods and landscapes, promoting environmental stewardship, preserving biodiversity, and establishing improved agroecosystem function [11]. Moreover, diversification of Sustainability 2019, 11, 1416; doi:10.3390/su11051416 www.mdpi.com/journal/sustainability
Transcript
sustainability
Article
Crop Diversity and Common AgriculturalPolicy—The Case of Slovakia
Jarmila Lazíková 1,*, Anna Bandlerová 1, L’ubica Rumanovská 2, Ivan Takác 2
and Zuzana Lazíková 1
1 Department of Law, Slovak University of Agriculture in Nitra, 94976 Nitra, Slovakia;[email protected] (A.B.); [email protected] (Z.L.)
2 Department of European Policies, Slovak University of Agriculture in Nitra, 94976 Nitra, Slovakia;[email protected] (L’.R.); [email protected] (I.T.)
Received: 13 February 2019; Accepted: 1 March 2019; Published: 7 March 2019�����������������
Abstract: Crop diversity has an important role in sustainable agroecosystems. This study analyzed thecrop diversity of agricultural holdings in particular regions (NUTS III) in Slovakia and identified theimpact of Common Agricultural Policy (CAP) payments on the crop diversity of agricultural holdings.There are regional disparities in crop diversity in Slovakia. The highest crop diversity is typical forthe regions with the best soil quality. From the results of econometric models, it was found that someof the CAP payments have an effect on crop diversity, mainly single area payment scheme (SAPS)payments, which had a negative effect, and payments for areas facing natural constraints (ANC)and animal welfare, which were found to have positive effects. It can be concluded that the secondpillar of the CAP is able to improve or at least maintain crop diversity in Slovakia. Other importantfactors found to influence crop diversity are irrigation, total crop area corresponding with the farmsize, geographical location including the soil quality, and the legal structure of agricultural holdings.However, the distance of the farm from the city, the education of managers, and membership infarmers’ associations are not important factors for crop diversity in Slovakia.
Keywords: crop diversity; sustainability; agricultural holdings; Common Agricultural Policy; Slovakia
1. Introduction
The quality and diversity of European landscapes constitute a common resource and it isimportant to co-operate toward their protection, management, and planning [1]. The Conventiondefines a landscape as an area with a character that is the result of the action and interaction of naturaland/or human factors [1], which provides semi-natural habitats for many endangered and rare speciesthat are dependent on continued management for their preservation [2–5].
Agriculture is both a large-scale user of land and a provider of landscapes [6]. Many speciesand ecosystems of conservation concern in Europe depend on agricultural management [7].In agricultural systems, crop biodiversity may provide the link between stress and resilience, as resilientagroecosystems are characterized by a high degree of crop diversity [8]. Crop diversification improvesthe capacity of agricultural systems and provides insurance or a buffer against environmentalfluctuations because different species respond differently to change, leading to more predictableaggregate community or ecosystem properties [9]. More diverse cropping systems tune agroecosystemperformance rather than less diverse systems [10]. Diversification is the sign of a progressivereorientation of agriculture toward a multifunctional activity that combines producing quality food,maintaining rural livelihoods and landscapes, promoting environmental stewardship, preservingbiodiversity, and establishing improved agroecosystem function [11]. Moreover, diversification of
the crops that the farmer produces may be an effective tool to help farmers deal with several typesof risk [12]. Furthermore, crop diversity could play an important role in ecosystem resilience andin the agroecosystem; when rainfall is scarce, crop diversity can act as a catalyst for agriculturalproduction [13].
At the end of the 20th century, many experts warned against the intensive form of agriculturalproduction which caused many previously common species to become scarce or to disappear andcaused a decline in semi-natural landscape elements [14–16]. The loss of biodiversity in agriculturallandscapes reflected the strong environmental impact of European Union (EU) agricultural policy [3].As a consequence, the priorities of the Common Agricultural Policy changed and measures wereadopted to support the environmental aspects of land use (e.g., greening, agri-environmental–climatemeasures, and payments for ecological agriculture, including animal welfare), resulting from thefact that certain farming systems are particularly favorable for the environment such as extensivelivestock, mixed systems, traditional permanent crop systems, or organic farming [17].The reformedCommon Agricultural Policy (CAP) (2014–2020) promotes environmental conservation through threeroutes: cross compliance, greening payments, and agri-environmental schemes [18]. It includes threeobligatory greening measures: ecological focus areas, maintaining permanent grassland, and cropdiversification [19]. On the one hand, some hold a skeptical view of the CAP because the newenvironmental prescriptions are so diluted that they are unlikely to benefit biodiversity [20]. On theother hand, there is a hope that the agri-environmental schemes of the CAP will be central to theconservation of farmland biodiversity [21]. Moreover, they can be effective for conserving wildlife onfarmland, but they are expensive and need to be carefully designed and targeted [7].
Capitanio et al. took into account the CAP variable as a ratio of the European first pillar of CAPsupport to total units of labor and dummy variables for the regimes of 2004–2006 and 2007–2010,demonstrating the existence of a positive relationship between CAP payments and diversity in Italy [22].Chiron et al. created a model to describe the most likely changes in crop areas and included regionalbird population data from the French Breeding Bird Survey. The authors concluded that farmland areaand crop composition are important variables that drive bird abundance [23]. Renwick et al. analyzedagricultural and trade reform on land use across Europe, focusing on the issue of land abandonment.They noted that the overall impact of agriculture and trade reform on production within the EU is likelyto be relatively small; however, a more disaggregated analysis highlighted more significant declinesin particular countries, regions, and farm types, and showed that a loss of semi-natural farmlandleads to a further decline in farmland biodiversity [24]. Reger et al. concluded that transfer paymentsare able to prevent the cessation of agricultural production; however, they have a tendency towardhomogenization of the landscape [25]. Piorr et al. confirmed that, without direct payments, arablefarming in marginal areas could not be maintained at all, and a loss of landscape and habitat diversityis contrary to the objectives of Natura 2000 [26]. According to Jambor and Harvey, the direct paymentsare not effective or justified and should be reduced or completely phased out. They should at least beconverted into a safety net, while more radical reform requires greater conditionality on the practical“services” rendered by farmers to society. This implies that direct payments should be converted intoa general contractual scheme, under which payments are made only to those delivering clear andmeasurable outcomes [27].
However, there are other factors affecting land-use intensity and diversity. Van der Sluis et al.showed the results of a logistic regression which underpins the importance of geographical context,farm size, and farmer type in the motivation for intensification or extensification. They added that thedominant pattern of stabilization which occurred over the past 10 years may also partly be a result ofeffective EU and national environmental and agricultural policies, which are increasingly concernedwith improving environmental conditions in rural areas [28]. There is no expert common opinion withregard to how farm size affects production diversity. White and Irwin found that larger farms are morespecialized [29]. However, other experts found strong indications of a positive relationship betweendiversification and farm size [30–34].
Sustainability 2019, 11, 1416 3 of 14
Moreover, Sichoongwe et al. identified other factors, such as technology, distance to the market,fertilizer quantity, and the geographical location of the farm, which affect the crop diversificationin Zambia. On the other hand, factors such as gender, education, or the age of farmers, householdsize, the number of fields, and hired labor were not found to be statistically significant for cropdiversification [34]. The research of similar crop diversification factors in Ethiopia proved that farm size,livestock assets, households with more male labor, and more fragmented farms with a larger number ofdifferent plots, the distance of the plot from the farm household, access to the market, and geographicallocation had significant effects on the diversification of cereal crops. On the other hand, age, gender,and the education of farmers had no significant relationship with the diversity of cereal crops [35].However, Weiss and Briglauer argued that a significantly lower degree of diversification, as well as astronger reduction in diversification over time, is also associated with businesses operated by older,less educated, part-time farm operators [33]. Farmers who participate in off-farm work, farms locatednear urban areas, and farms with higher debt-to-asset ratios are less likely to be diversified; on theother hand, there is a significant positive relationship between diversification and whether the farmbusiness has crop insurance, is organized as a sole proprietorship, or receives any direct payments fromcurrent farm commodity programs [36]. Banerjee and Bhattachary argued that crop diversificationhelps maximize the utilization of scarce land resources, increase productivity, and reduce risk inagriculture [37]. Crop diversification is influenced by a number of infrastructural and technologicalfactors such as the sustained supply of irrigation water, markets, fertilizer availability, proper roads,and transportation [38].
The main objective of this paper was to identify the impact of particular CAP payments oncrop diversity in Slovakia. This study’s econometric models were estimated from a survey of530 agricultural holdings including family farms scattered throughout all regions (NUTS III) ofSlovakia. The paper is organized as follows: the first section describes the development of landscapediversity and crop diversity in Slovakia after its accession to the EU. The second section includes ananalysis of the crop diversity of agricultural holdings in particular regions (NUTS III) in Slovakia.The third section describes the three econometric models used to identify the impact of CAP payments(e.g., single area payment scheme (SAPS) payments, greening, payments for areas facing naturalconstraints (ANC), agri-environmental scheme payments, organic agriculture payments, and animalwelfare payments) on the crop diversity of agricultural holdings in Slovakia.
2. Data and Methods
This study used data collected by the Ministry of Agriculture and Rural Development of SlovakRepublic concerning agricultural holdings in 2015–2016. More than 600 agricultural holdings wereassessed; however, only 527 were integrated into the model. The rest were excluded for various reasons(e.g., missing crop production or animal production data, data errors, missing data, or data outliers).
The crop diversity in Slovakia was quantified by calculating Shannon’s equitability index for eachagricultural business in our database. The Shannon’s index is expressed as [39].
H = −s
∑i=1
pi ln(pi), (1)
where s is the number of crop species, and pi is the proportion of hectares of one particular species (n)divided by the total hectares of crop production (N). Shannon’s equitability index (EH) is computed as
EH =H
Hmax, (2)
where H is Shannon’s diversity index, and Hmax is calculated as ln (s). Shannon’s equitability indexassumes a value between 0 and 1, with 1 being complete evenness.
Sustainability 2019, 11, 1416 4 of 14
GRETL software was used to estimate the coefficients of the model by ordinary least squares (OLS)with heteroskedasticity assessed by the Breusch–Pagan test and censored regression model (TOBITmodel) because of the censured dependent variable bordered by 0 and 1. However, the estimatedparameter results were changed minimally by using OLS and the TOBIT model.
where yj is the crop diversity index (EH) of agricultural holding j as a dependent variable, α is theintercept, x1j is a single farm payment (SAPS), x2j is a payment for greening, x3j is a payment forless favorable areas (ANC), x4j is an agri-environmental scheme (AES) payment, x5j is a payment fororganic agriculture (ECO), x6j is a payment for animal welfare (WELFARE), β1–6 express how manypercentage points the crop diversity index changes by if a particular payment increases by one euro,x is a vector of the control variables in the model with particular regression coefficients expressed asvector γ, and εj represents residuals independent and identically distributed.
The vector of control variables consists of independent (explanatory) variables: region,legal structure of the holding, education of the manager, membership in farmers’ associations, distancefrom the city, irrigated agricultural land, land used for ecological agriculture, the number of employees,total crop area, the share of revenue from agricultural (crops and animal) production in total revenue,the share of revenue from ecological agriculture in total revenue, total revenue share in the totalcosts, stock share in total costs, stock share in total revenue, and the share of revenue from the animalproduction share in the agricultural production revenue. The descriptive statistics of the describedvariables are shown in Table 1.
Table 1. Descriptive statistics.
Variable Description Unit Mean StandardDeviation Min Max
Distance from the cityDistance of the agricultural holdings
from the district city(LAU 1)
km 12.797 13.764 1.000 67.300
Irrigated agricultural land Surface of irrigated agricultural landarea ha 15.890 91.112 0.000 960.000
Land used for the organicagriculture
Agricultural land used for organicfarming ha 44.933 230.906 0.000 2950.740
Number of employees Number of employees 13.448 27.130 0.000 236.000
Total crop area Agricultural land used for cropproduction ha 480.845 689.378 5.000 4585.830
Revenues fromagricultural (crops and
animal) production sharein total revenues
Share of revenues from agriculturalproduction in total revenues 2015 % 57.342 25.962 0.116 100.000
Revenues from theorganic agriculture share
in total revenues
Share of revenues from organicfarming in total revenues 2015 % 0.188 1.624 0.000 22.447
Total revenues share intotal costs
Share of total revenues in total costs2015 % 70.027 146.123 0.000 2508.091
Stocks share in total costs Share of stocks in total costs 2015 % 37.949 177.455 0.000 2752.598Stocks share in total
revenues Share of stocks in total revenues 2015 % 26.913 50.904 0.000 998.472
Revenues from theanimal production share
in revenues of theagricultural production
Share of revenues from animalproduction in revenues fromagricultural production 2015
% 16.280 29.766 0.000 100.000
Sustainability 2019, 11, 1416 5 of 14
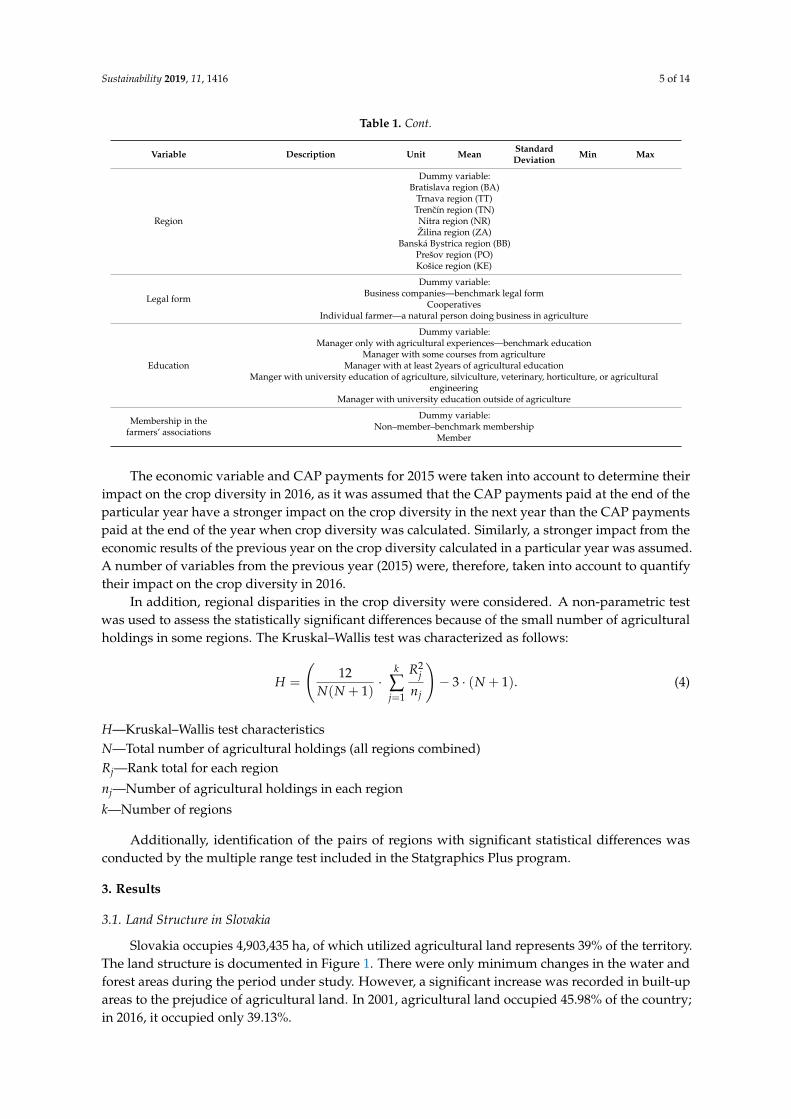
Table 1. Cont.
Variable Description Unit Mean StandardDeviation Min Max
Region
Dummy variable:Bratislava region (BA)
Trnava region (TT)Trencín region (TN)Nitra region (NR)Žilina region (ZA)
Banská Bystrica region (BB)Prešov region (PO)Košice region (KE)
Legal form
Dummy variable:Business companies—benchmark legal form
CooperativesIndividual farmer—a natural person doing business in agriculture
Education
Dummy variable:Manager only with agricultural experiences—benchmark education
Manager with some courses from agricultureManager with at least 2years of agricultural education
Manger with university education of agriculture, silviculture, veterinary, horticulture, or agriculturalengineering
Manager with university education outside of agriculture
Membership in thefarmers’ associations
Dummy variable:Non–member–benchmark membership
Member
The economic variable and CAP payments for 2015 were taken into account to determine theirimpact on the crop diversity in 2016, as it was assumed that the CAP payments paid at the end of theparticular year have a stronger impact on the crop diversity in the next year than the CAP paymentspaid at the end of the year when crop diversity was calculated. Similarly, a stronger impact from theeconomic results of the previous year on the crop diversity calculated in a particular year was assumed.A number of variables from the previous year (2015) were, therefore, taken into account to quantifytheir impact on the crop diversity in 2016.
In addition, regional disparities in the crop diversity were considered. A non-parametric testwas used to assess the statistically significant differences because of the small number of agriculturalholdings in some regions. The Kruskal–Wallis test was characterized as follows:
H =
(12
N(N + 1)·
k
∑j=1
R2j
nj
)− 3 · (N + 1). (4)
H—Kruskal–Wallis test characteristicsN—Total number of agricultural holdings (all regions combined)Rj—Rank total for each region
nj—Number of agricultural holdings in each region
k—Number of regions
Additionally, identification of the pairs of regions with significant statistical differences wasconducted by the multiple range test included in the Statgraphics Plus program.
3. Results
3.1. Land Structure in Slovakia
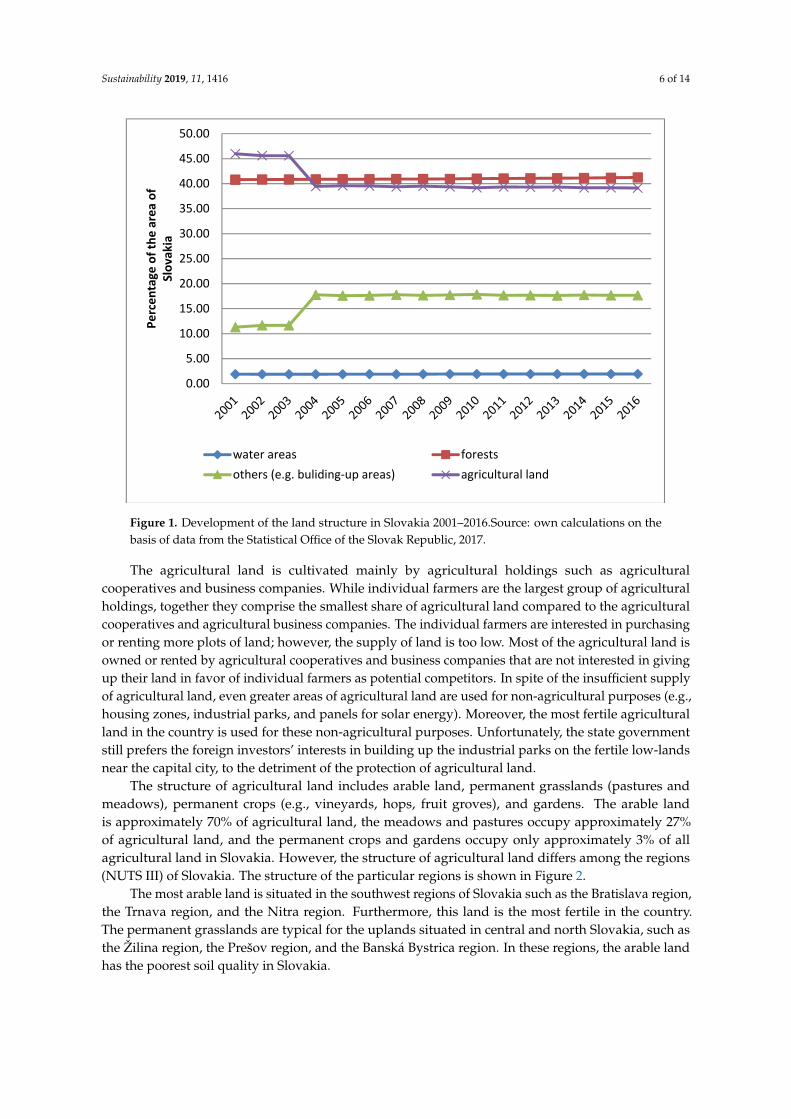
Slovakia occupies 4,903,435 ha, of which utilized agricultural land represents 39% of the territory.The land structure is documented in Figure 1. There were only minimum changes in the water andforest areas during the period under study. However, a significant increase was recorded in built-upareas to the prejudice of agricultural land. In 2001, agricultural land occupied 45.98% of the country;in 2016, it occupied only 39.13%.
Sustainability 2019, 11, 1416 6 of 14
Sustainability 2019, 11, x FOR PEER REVIEW 6 of 14
nj—Number of agricultural holdings in each region k—Number of regions
Additionally, identification of the pairs of regions with significant statistical differences was conducted by the multiple range test included in the Statgraphics Plus program.
3. Results
3.1. Land Structure in Slovakia
Slovakia occupies 4,903,435 ha, of which utilized agricultural land represents 39% of the territory. The land structure is documented in Figure 1. There were only minimum changes in the water and forest areas during the period under study. However, a significant increase was recorded in built-up areas to the prejudice of agricultural land. In 2001, agricultural land occupied 45.98% of the country; in 2016, it occupied only 39.13%.
Figure 1. Development of the land structure in Slovakia 2001–2016.Source: own calculations on the basis of data from the Statistical Office of the Slovak Republic, 2017.
The agricultural land is cultivated mainly by agricultural holdings such as agricultural cooperatives and business companies. While individual farmers are the largest group of agricultural holdings, together they comprise the smallest share of agricultural land compared to the agricultural cooperatives and agricultural business companies. The individual farmers are interested in purchasing or renting more plots of land; however, the supply of land is too low. Most of the agricultural land is owned or rented by agricultural cooperatives and business companies that are not interested in giving up their land in favor of individual farmers as potential competitors. In spite of the insufficient supply of agricultural land, even greater areas of agricultural land are used for non-agricultural purposes (e.g., housing zones, industrial parks, and panels for solar energy). Moreover, the most fertile agricultural land in the country is used for these non-agricultural purposes. Unfortunately, the state government still prefers the foreign investors’ interests in building up the industrial parks on the fertile low-lands near the capital city, to the detriment of the protection of agricultural land.
0.00
5.00
10.00
15.00
20.00
25.00
30.00
35.00
40.00
45.00
50.00Pe
rcen
tage
of t
he a
rea
ofSl
ovak
ia
water areas forestsothers (e.g. buliding-up areas) agricultural land
Figure 1. Development of the land structure in Slovakia 2001–2016.Source: own calculations on thebasis of data from the Statistical Office of the Slovak Republic, 2017.
The agricultural land is cultivated mainly by agricultural holdings such as agriculturalcooperatives and business companies. While individual farmers are the largest group of agriculturalholdings, together they comprise the smallest share of agricultural land compared to the agriculturalcooperatives and agricultural business companies. The individual farmers are interested in purchasingor renting more plots of land; however, the supply of land is too low. Most of the agricultural land isowned or rented by agricultural cooperatives and business companies that are not interested in givingup their land in favor of individual farmers as potential competitors. In spite of the insufficient supplyof agricultural land, even greater areas of agricultural land are used for non-agricultural purposes (e.g.,housing zones, industrial parks, and panels for solar energy). Moreover, the most fertile agriculturalland in the country is used for these non-agricultural purposes. Unfortunately, the state governmentstill prefers the foreign investors’ interests in building up the industrial parks on the fertile low-landsnear the capital city, to the detriment of the protection of agricultural land.
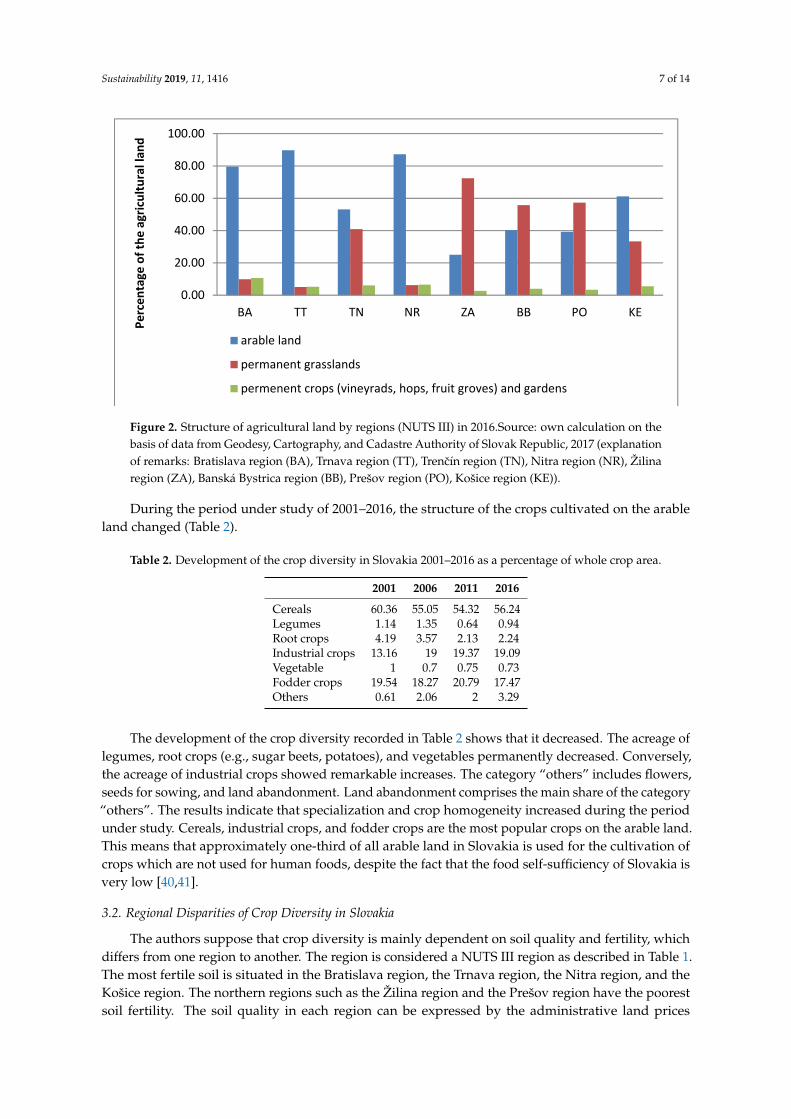
The structure of agricultural land includes arable land, permanent grasslands (pastures andmeadows), permanent crops (e.g., vineyards, hops, fruit groves), and gardens. The arable landis approximately 70% of agricultural land, the meadows and pastures occupy approximately 27%of agricultural land, and the permanent crops and gardens occupy only approximately 3% of allagricultural land in Slovakia. However, the structure of agricultural land differs among the regions(NUTS III) of Slovakia. The structure of the particular regions is shown in Figure 2.
The most arable land is situated in the southwest regions of Slovakia such as the Bratislava region,the Trnava region, and the Nitra region. Furthermore, this land is the most fertile in the country.The permanent grasslands are typical for the uplands situated in central and north Slovakia, such asthe Žilina region, the Prešov region, and the Banská Bystrica region. In these regions, the arable landhas the poorest soil quality in Slovakia.
Sustainability 2019, 11, 1416 7 of 14
Sustainability 2019, 11, x FOR PEER REVIEW 7 of 14
The structure of agricultural land includes arable land, permanent grasslands (pastures and meadows), permanent crops (e.g., vineyards, hops, fruit groves), and gardens. The arable land is approximately 70% of agricultural land, the meadows and pastures occupy approximately 27% of agricultural land, and the permanent crops and gardens occupy only approximately 3% of all agricultural land in Slovakia. However, the structure of agricultural land differs among the regions (NUTS III) of Slovakia. The structure of the particular regions is shown in Figure 2.
Figure 2.Structure of agricultural land by regions (NUTS III) in 2016.Source: own calculation on the basis of data from Geodesy, Cartography, and Cadastre Authority of Slovak Republic, 2017 (explanation of remarks: Bratislava region (BA), Trnava region (TT),Trenčín region (TN), Nitra region (NR),Žilina region (ZA), Banská Bystrica region (BB), Prešov region (PO), Košice region (KE)).
The most arable land is situated in the southwest regions of Slovakia such as the Bratislava region, the Trnava region, and the Nitra region. Furthermore, this land is the most fertile in the country. The permanent grasslands are typical for the uplands situated in central and north Slovakia, such as the Žilina region, the Prešov region, and the Banská Bystrica region. In these regions, the arable land has the poorest soil quality in Slovakia.
During the period under study of 2001–2016, the structure of the crops cultivated on the arable land changed (Table 2).
Table 2. Development of the crop diversity in Slovakia 2001–2016 as a percentage of whole crop area.
The development of the crop diversity recorded in Table 2 shows that it decreased. The acreage of legumes, root crops (e.g., sugar beets, potatoes), and vegetables permanently decreased. Conversely, the acreage of industrial crops showed remarkable increases. The category “others” includes flowers, seeds for sowing, and land abandonment. Land abandonment comprises the main share of the category “others”. The results indicate that specialization and crop homogeneity increased during the period under study. Cereals, industrial crops, and fodder crops are the most
0.00
20.00
40.00
60.00
80.00
100.00
BA TT TN NR ZA BB PO KE
Perc
enta
ge o
f the
agr
icultu
ral l
and
arable land
permanent grasslands
permenent crops (vineyrads, hops, fruit groves) and gardens
Figure 2. Structure of agricultural land by regions (NUTS III) in 2016.Source: own calculation on thebasis of data from Geodesy, Cartography, and Cadastre Authority of Slovak Republic, 2017 (explanationof remarks: Bratislava region (BA), Trnava region (TT), Trencín region (TN), Nitra region (NR), Žilinaregion (ZA), Banská Bystrica region (BB), Prešov region (PO), Košice region (KE)).
During the period under study of 2001–2016, the structure of the crops cultivated on the arableland changed (Table 2).
Table 2. Development of the crop diversity in Slovakia 2001–2016 as a percentage of whole crop area.
The development of the crop diversity recorded in Table 2 shows that it decreased. The acreage oflegumes, root crops (e.g., sugar beets, potatoes), and vegetables permanently decreased. Conversely,the acreage of industrial crops showed remarkable increases. The category “others” includes flowers,seeds for sowing, and land abandonment. Land abandonment comprises the main share of the category“others”. The results indicate that specialization and crop homogeneity increased during the periodunder study. Cereals, industrial crops, and fodder crops are the most popular crops on the arable land.This means that approximately one-third of all arable land in Slovakia is used for the cultivation ofcrops which are not used for human foods, despite the fact that the food self-sufficiency of Slovakia isvery low [40,41].
3.2. Regional Disparities of Crop Diversity in Slovakia
The authors suppose that crop diversity is mainly dependent on soil quality and fertility, whichdiffers from one region to another. The region is considered a NUTS III region as described in Table 1.The most fertile soil is situated in the Bratislava region, the Trnava region, the Nitra region, and theKošice region. The northern regions such as the Žilina region and the Prešov region have the poorestsoil fertility. The soil quality in each region can be expressed by the administrative land prices
Sustainability 2019, 11, 1416 8 of 14
stipulated by natural indicators, including the indicators of soil quality and fertility. The averageadministrative land prices indicating the soil quality and fertility of each region are described inFigure 3.
Sustainability 2019, 11, x FOR PEER REVIEW 8 of 14
popular crops on the arable land. This means that approximately one-third of all arable land in Slovakia is used for the cultivation of crops which are not used for human foods, despite the fact that the food self-sufficiency of Slovakia is very low [40,41].
3.2. Regional Disparities of Crop Diversity in Slovakia
The authors suppose that crop diversity is mainly dependent on soil quality and fertility, which differs from one region to another. The region is considered a NUTS III region as described in Table 1. The most fertile soil is situated in the Bratislava region, the Trnava region, the Nitra region, and the Košice region. The northern regions such as the Žilina region and the Prešov region have the poorest soil fertility. The soil quality in each region can be expressed by the administrative land prices stipulated by natural indicators, including the indicators of soil quality and fertility. The average administrative land prices indicating the soil quality and fertility of each region are described in Figure 3.
Figure 3. Average administrative land prices in particular regions of Slovakia.Source: own calculation on the basis of data from the Act no. 528/2004 Coll. on local taxes and fees for communal waste (explanation of remarks: Bratislava region (BA), Trnava region (TT), Trenčín region (TN), Nitra region (NR), Žilina region (ZA), Banská Bystrica region (BB), Prešov region (PO), Košice region (KE)).
Significant differences in crop diversity were, therefore, expected between the regions of Slovakia. Crop diversity was quantified by Shannon’s equitability index as described in the methodology of this paper. The means and standard deviation of Shannon’s equitability crop diversity index (the “crop diversity index”) in the different regions of Slovakia are documented in Table 3. In addition, the table lists changes in the crop diversity index in 2011 (a year selected from the CAP period of 2007–2013), 2014 (the year when the new program period of 2014–2020 was implemented), and 2016 (a year selected from the CAP period of 2014–2020).
Table 3. Crop diversity index in the particular regions (NUTS III) of Slovakia in 2011–2016.
Year 2011 2014 2016
Descriptive Statistics Mean Standard Deviation Mean Standard
Deviation Mean Standard Deviation
Bratislava 0.46 0.06 0.47 0.06 0.43 0.05 Banská Bystrica 0.40 0.06 0.33 0.06 0.36 0.05 Košice 0.42 0.04 0.43 0.04 0.40 0.04 Nitra 0.51 0.04 0.50 0.04 0.50 0.03 Prešov 0.30 0.06 0.27 0.05 0.29 0.06
0
0.1
0.2
0.3
0.4
0.5
0.6
0.7
0.8
0.9
BA TT NR KE TN BB PO ZA
adm
inist
rativ
e la
nd p
rices
EUR
per
1
m2
regions
Figure 3. Average administrative land prices in particular regions of Slovakia.Source: own calculationon the basis of data from the Act no. 528/2004 Coll. on local taxes and fees for communal waste(explanation of remarks: Bratislava region (BA), Trnava region (TT), Trencín region (TN), Nitra region(NR), Žilina region (ZA), Banská Bystrica region (BB), Prešov region (PO), Košice region (KE)).
Significant differences in crop diversity were, therefore, expected between the regions of Slovakia.Crop diversity was quantified by Shannon’s equitability index as described in the methodology of thispaper. The means and standard deviation of Shannon’s equitability crop diversity index (the “cropdiversity index”) in the different regions of Slovakia are documented in Table 3. In addition, the tablelists changes in the crop diversity index in 2011 (a year selected from the CAP period of 2007–2013),2014 (the year when the new program period of 2014–2020 was implemented), and 2016 (a year selectedfrom the CAP period of 2014–2020).
Table 3. Crop diversity index in the particular regions (NUTS III) of Slovakia in 2011–2016.
Year 2011 2014 2016
Descriptive Statistics Mean StandardDeviation Mean Standard
The highest crop diversity index was recorded in the regions with the most fertile land: the Trnavaregion, the Bratislava region, and the Nitra region. The regions with the poorest soil quality had
Sustainability 2019, 11, 1416 9 of 14
on average the smallest crop diversity indexes. The differences among the regions are statisticallysignificant (with a p-value < 0.05).
In most of the regions, the crop diversity index decreased in the period under study. There wereonly two exceptions: the Trnava region and the Trencín region; however, there was also stagnation ordecline of the crop diversity index in the last two years (2014 and 2016).
In addition, the statistically significant differences among regional crop diversity were tested.The Kruskal–Wallis test was used due to the smaller groups of observed units in some regions.The statistically significant differences are documented in Table 4.
Table 4. Statistically significant differences of crop diversity in the regions of Slovakia in 2016.
Region Multiple Range Test
Žilina XPrešov X XBanskáBystrica XTrencín X XKošice XBratislava XTrnava XNitra X
According to the obtained results, it was possible to create three groups of regions which includedsimilar intra-groups and statistically different inter-groups in relation to the crop diversity. The firstgroup comprised the regions with the highest crop diversity index: the Nitra region and the Trnavaregion. The second group included the Bratislava region, the Banská Bystrica region, the Košice region,and the Trencín region. The third group included the regions with the poorest soil quality: the Prešovregion and the Žilina region. The results confirm that the geographical location of an agriculturalholding is an important factor of crop diversity. Geographical location was, therefore, included withinthe econometric model as a dummy variable. The benchmark dummy variable was the first group ofregions. These groups were used due to the similarities within them and to decrease the number ofdummy variables (eight regions).
3.3. Impact of CAP Payments on Crop Diversity in Slovakia
The CAP payments were the main variable of interest in the econometric models used in thispaper. The positive regressive coefficient should indicate that the crop diversity increases with higherCAP payments. Other variables of particular interest were the legal structure of the farm, the distancefrom the big city, the crop area acreage, the education of the manager, and membership in farmers’associations. The remaining variables were included due to the higher predictability of the models.
The results of the four estimated models are presented in Table 5 for the OLS regression andTOBIT regression. We focused on the interpretation of the parameters of the first model specification,while the remaining models were used to help compare the results to confirm or refute the results ofthe first model. All models were created in GRETL. Model 1 represents the OLS regression where theheteroskedasticity of model was assessed by the Breusch–Pagan test. Model 2 represents the TOBITmodel due to the censured dependent variable. The remaining models are variations of Model 1 andModel 2. They are different in that they include only the significant variables from the previous models.
Sustainability 2019, 11, 1416 10 of 14
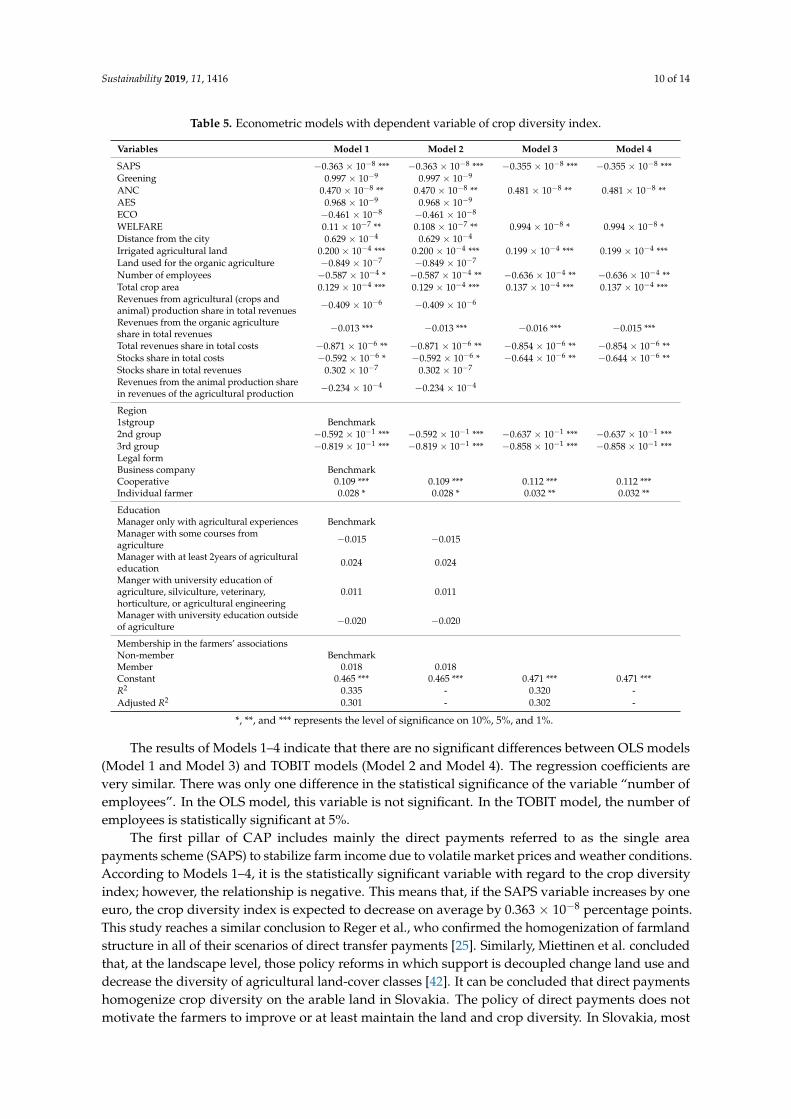
Table 5. Econometric models with dependent variable of crop diversity index.
*, **, and *** represents the level of significance on 10%, 5%, and 1%.
The results of Models 1–4 indicate that there are no significant differences between OLS models(Model 1 and Model 3) and TOBIT models (Model 2 and Model 4). The regression coefficients arevery similar. There was only one difference in the statistical significance of the variable “number ofemployees”. In the OLS model, this variable is not significant. In the TOBIT model, the number ofemployees is statistically significant at 5%.
The first pillar of CAP includes mainly the direct payments referred to as the single areapayments scheme (SAPS) to stabilize farm income due to volatile market prices and weather conditions.According to Models 1–4, it is the statistically significant variable with regard to the crop diversityindex; however, the relationship is negative. This means that, if the SAPS variable increases by oneeuro, the crop diversity index is expected to decrease on average by 0.363 × 10⁻⁸ percentage points.This study reaches a similar conclusion to Reger et al., who confirmed the homogenization of farmlandstructure in all of their scenarios of direct transfer payments [25]. Similarly, Miettinen et al. concludedthat, at the landscape level, those policy reforms in which support is decoupled change land use anddecrease the diversity of agricultural land-cover classes [42]. It can be concluded that direct paymentshomogenize crop diversity on the arable land in Slovakia. The policy of direct payments does notmotivate the farmers to improve or at least maintain the land and crop diversity. In Slovakia, most
Sustainability 2019, 11, 1416 11 of 14
farmers cultivate a maximum three or four crops such as wheat, barley, maize, or oilseeds (Brassicanapus or sunflower). The most preferred crop is wheat, with associated crop areas still increasingyearly (in 2011, wheat occupied 28, 60% of arable land (404877 hectares of wheat); in 2016, the wheat iscultivated on 35, 95% of arable land (506815 hectares of wheat)). On the other hand, Capitanio et al.found a positive relationship between direct payments and the crop diversity of cereal-producing farmsin Italy over the period 2004–2010 that was decoupled from production (single farm payments) [22].However, in Slovakia, the SAPS still applies.
The second pillar of the CAP is related to rural development with the aim of achieving balancedrural development and sustaining the agricultural holdings that are environmentally friendly andcompetitive on the agricultural market. There are relatively very few studies that evaluate the effectsof the second pillar on crop diversity. Capitanio et al. concluded that the coefficient on the amount ofsupport received by farmers from the second pillar was not statistically significant over the period2004–2010 in Italy [22]. In Slovakia, this study found that the second pillar of the CAP payments,particularly payments for less favorable areas and animal welfare, represents the most importantpayments with positive effects on the crop diversity in Slovakia over the period 2015–2016. This meansthat, if the variables ANC or WELFARE increase, the crop diversity index is also expected to increase(Table 5). The estimate of the variable ANC is slightly higher than the estimate of the SAPS variable inabsolute values; however, the estimate of the WELFARE variable is much lower than the estimate ofSAPS or ANC variables in absolute values. It seems that the second pillar is more important for thesustainability of crop diversity.
Other statistically significant indicators are irrigated area of land, total crop area, revenues fromthe organic farming, geographical location, and the legal structure of agricultural holdings with positiveor negative relationships. In the last few decades, the southern regions of Slovakia suffered from alack of rainfall. Accordingly, the irrigation of the agricultural land became increasingly important.Models 1–4 indicate that irrigated areas of agricultural land help increase or at least maintain cropdiversity. This is a trend not only in Slovakia, but also in other countries; for instance, Monteleone et al.stated that it seems to be established that crop diversity is a feasible target only if a sufficient watersupply for irrigation is available [11].
Total crop area is a variable which substitutes farm size. Models 1–4 provide evidence that farmsize expressed by the total crop area has a positive relationship with crop diversity. The estimate oftotal crop area is slightly lower than the estimate of irrigation. According to the literature review,there is no consensus on the effects of this variable. Our results confirm the results of studies [30–34]that there is strong indication of a positive relationship between diversification and farm size.
It was found that geographical location was one of the statistically significant variables in themodel. The previous section indicates the statistically significant differences of crop diversity betweenthe regions of Slovakia. The regions (NUTS III) were divided into three groups (Group 1: the Nitraregion and the Trnava region; Group 2: the Bratislava region, the Banská Bystrica region, the Košiceregion, and the Trencín region; Group 3: the Prešov region and the Žilina region). The three groupsof regions also indicate the soil quality. The third group comprises the regions with the poorest soilquality, and the first group comprises the regions with the best soil quality. Models 1–4 provideevidence that the regions of the second and third group decrease the crop diversity depending onthe soil quality. If a land plot is located in the regions of the third group, the crop diversity index issmaller than a land plot located in the regions of the second group. The statistically significant effectsof geographical location were confirmed in the studies of van der Sluis et al. [28], Sichoongwe et al. [34]and Benin et al. [35].
A statistically significant relationship was also demonstrated between crop diversity and the legalstructure of the agricultural holdings. There are typically three legal structures of agricultural holdingsin Slovakia. Businesses predominantly in the form of limited liability companies are the most popularlegal structure, and they were stipulated as a benchmark legal structure of agricultural holdings.The highest level of crop diversity is achieved by cooperatives as a legal structure of agricultural
Sustainability 2019, 11, 1416 12 of 14
holdings that are both traditional and typical in Slovakia. Individual farmers as ordinary peopledoing business in agriculture are more diversified than business companies; however, the regressioncoefficient is statistically significant only in Models 3 and 4 at 5%. There are specific legal structures ofagricultural holdings in Slovakia and, as such, it is possible to compare our analysis with the resultsobtained in the literature.
Based on the research mentioned in the literature overview, a statistically significant effect ofmany other variables on crop diversity was expected, such as the distance from the city, the educationof the manager, the number of employees, or membership in farmers’ associations. The obtainedregression coefficients are not statistically significant in any model with the one exception related tothe number of employees. There is a negative relationship between crop diversity and the number ofemployees. This factor was determined to be statistically significant by the TOBIT model (Models 2and 4) and OLS Model 3, while all models confirmed the negative relationship.
4. Conclusions
Crop diversity has an important role in sustainable agro-ecosystems. Moreover, it helps diversifythe risks associated with agricultural business. In this study, the crop diversity of agricultural holdingsin particular regions (NUTS III) in Slovakia was analyzed, and the impact of the CAP payments (e.g.,SAPS, greening, ANC, agri-environmental schemes, payments for organic agriculture, and paymentsfor animal welfare) on crop diversity was identified. From the results of the regional comparisonof crop diversity, it can be concluded that there are regional disparities. The highest crop diversityis typical for the regions with the best soil quality. The regions were segmented into three groups.The first group was created by the regions with the highest crop diversity index: the Nitra regionand the Trnava region. The second group included the Bratislava region, the Banská Bystrica region,the Košice region, and the Trencín region. The third group included the regions with the poorest soilquality: the Prešov region and the Žilina region. The results confirm that the geographical locationof an agricultural holding is an important factor with regard to crop diversity. Geographical locationwas accordingly included within the econometric model as a dummy variable. The results of theeconometric models demonstrate that some of the CAP payments have an impact on the crop diversity;these were predominantly the SAPS payments, which were found to have a negative effect on cropdiversity, and ANC payments and animal welfare payments, which were found to have positiveeffects. It can be concluded that the second pillar of the CAP is able to improve or at least maintaincrop diversity in Slovakia. Other factors affecting crop diversity are irrigation, the total crop areacorresponding to the farm size, and geographical location, including the soil quality and the legalstructure of agricultural holdings. Conversely, distance from the city, the education of the manager,and membership in farmers’ associations are not important factors for crop diversity in Slovakia.
Author Contributions: Conceptualization, J.L.; methodology, J.L. and Z.L.; validation, L’.R. and I.T.; formalanalysis, J.L.; investigation, L’.R. and A.B.; resources, L’.R. and A.B.;data curation, Z.L.; writing—original draftpreparation, J.L.; writing—review andediting, L’.R., I.T., Z.L., and A.B.; project administration, L’.R.; fundingacquisition, L’.R.
Funding: This research received no external funding.
Acknowledgments: This work was supported by the Grant Agency FESRD projects No. 7/2017, “The impact ofCAP supportive mechanism on the market with agricultural land in Slovakia”.
Conflicts of Interest: The authors declare no conflict of interest.
References
1. Council of Europe. European Landscape Convention, Florence, 20.X. 2000; Council of Europe: Strasbourg,France, 2000; p. 7. Available online: https://rm.coe.int/1680080621 (accessed on 10 May 2018).
2. Brady, M.; Sahrbacher, C.; Kellermann, K.; Happe, K. An agent-based approach to modeling impacts ofagricultural policy on land use, biodiversity and ecosystem services. Landsc. Ecol. 2012, 27, 1363–1381.[CrossRef]
3. Billeter, R.; Liira, J.; Bailey, D.; Arens, P.; Augenstein, I.; Aviron, S.; Baudry, J.; Bukacek, R.; Burel, F.;Cerny, M.; et al. Indicators for biodiversity in agricultural landscapes: A pan-European study. J. Appl. Ecol.2008, 45, 141–150. [CrossRef]
4. Kleijn, D.; Hohler, F.; Báldi, A.; Batáry, P.; Concepción, E.D.; Clough, Y.; Díaz, M.; Gabriel, D.; Holzschuh, A.;Knop, E.; et al. On the relationship between farmland biodiversity and land-use intensity in Europe. Proc. R.Soc. B 2009, 276, 903–909. [CrossRef] [PubMed]
5. Fehér, A.; Konceková, L.; Glemnitz, M.; Berger, G.; Holger, P.; Herzon, I. Maintaining and PromotingBiodiversity. In Sustainable Agriculture; Baltic University Press: Uppsala, Sweden, 2012; pp. 371–387.
6. Lefebvre, M.; Espinosa, M.; Gomez y Paloma, S. The Influence of the Common Agricultural Policy on AgriculturalLandscapes; JRC Scientific and policy reports; European Commission, Joint Research Centre: Brussels,Belgium, 2012.
7. Batáry, P.; Dicks, L.V.; Kleijn, D.; Sutherland, W.J. The role ofagri-environment schemes in conservation andenvironmental management. Conserv. Biol. 2015, 29, 1006–1016. [CrossRef] [PubMed]
8. Heal, G. Nature and the Marketplace: Capturing the Value of Ecosystem Services; Island Press: Washington, DC,USA, 2000; pp. 203–2000.
9. Lin, B.B. Resilience in agriculture through crop diversification: Adaptive management for environmentalchange. BioScience 2011, 61, 183–193. [CrossRef]
10. Davis, A.S.; Hill, J.D.; Chase, C.A.; Johanns, A.M.; Liebman, M. Increasing cropping system diversity balancesproductivity, profitability and environmental health. PLoS ONE 2012, 7, e47149. [CrossRef] [PubMed]
11. Monteleone, M.; Cammerino, A.R.B.; Libutti, A. Agricultural “greening” and cropland diversification trends:Potential contribution of agroenergy crops in Capitanata (South Italy). Land Use Policy 2018, 70, 591–600.[CrossRef]
13. Donfouet, H.P.P.; Barczak, A.; Détang-Dessendre, C.; Maigné, E. Crop Production and Crop Diversity inFrance: A Spatial Analysis. Ecol. Econ. 2017, 134, 29–39. [CrossRef]
14. Robinson, R.A.; Sutherland, W.J. Post-war changes in arable farming and biodiversity in Great Britain.J. App. Ecol. 2002, 39, 157–176. [CrossRef]
15. Petit, S.; Elbersen, B. Assessing the risk of impact of farming intensification on calcareous grasslands inEurope: A quantitative implementation of the MIRABEL framework. AMBIO 2006, 35, 297–303. [CrossRef][PubMed]
16. Fehér, A. VegetationHistory and CulturalLandscapes: CaseStudiesfromSouth.-West Slovakia; Springer InternationalPublishing: Cham, Germany, 2018; 306p.
17. European Commission. The Reform of the Cap Towards 2020. Consultation Document for Impact Assessment;European Commission: Brussels, Belgium, 2013; 18p. Available online: https://ec.europa.eu/agriculture/sites/agriculture/files/cap-post-2013/consultation/consultation-document_en.pdf (accessed on 11 May 2018).
18. Leventon, J.; Schaal, T.; Velten, S.; Dänhardt, J.; Fischer, J.; Abson, D.J.; Newig, J. Collaboration orfragmentation. Biodiversity management through the common agricultural policy. Land Use Policy 2017, 64,1–12. [CrossRef]
19. Hauck, J.; Schleyer, C.; Winkler, K.J.; Maes, J. Shades of greening: Reviewingthe impact of the new EUagricultural policy on ecosystem services. Chang. Adapt. Socioecol. Syst. 2014, 1, 51–62. [CrossRef]
22. Capitanio, F.; Gatto, E.; Millemaci, E. CAP payments and spatial diversity in cereal crops: An analysis ofItalian farms. Land Use Policy 2016, 54, 574–582. [CrossRef]
23. Chiron, F.; Princé, K.; Paracchini, M.L.; Bulgheroni, C.; Jiguet, F. Forecasting the potential impacts ofCAP-associated land use changes on farmland birds at the national level. Agric. Ecosyst. Environ. 2013, 176,17–23. [CrossRef]
24. Renwick, A.; Janson, T.; Verburg, P.H.; Revoredo-Giha, C.; Britz, W.; Gocht, A.; McCracken, D. Policy reformand agricultural land abandonment in the EU. Land Use Policy 2013, 30, 446–457. [CrossRef]
25. Reger, B.; Sheridan, P.; Simmering, D.; Otte, A.; Waldhardt, R. Potential effects of direct transfer paymentson farmland habitat diversity in a marginal European landscape. Environ. Manag. 2009, 43, 1026–1038.[CrossRef] [PubMed]
26. Piorr, A.; Ungaro, F.; Ciancaglini, A.; Happe, K.; Sahrbacher, A.; Sattler, C.; Uthes, S.; Zander, P. Integratedassessment of future CAP policies: Land use changes, spatial patterns and targeting. Environ. Sci. Policy2009, 12, 1122–1136. [CrossRef]
27. Jambor, A.; Harvey, D. Review of the Challenges of CAP Reform; Report Discussion Paper Series; Centrefor Rural Economy, School of Natural and Environmental Sciences, Newcastle University: Newcastleupon Tyne, UK, 2010; 27p, Available online: http://www.ncl.ac.uk/cre/publish/discussionpapers/pdfs/dp27JamborHarvey.pdf (accessed on 14 September 2018).
28. Van der Sluis, T.; Pedroli, B.; Kristensen, S.B.P.; Cosor, G.L.; Pavlis, E. Changing land use intensity inEurope—Recent processes in selected case studies. Land Use Policy 2016, 57, 777–785. [CrossRef]
29. White, T.; Irwin, G. Farm size and specialization. In Size Structure and Future of Farms Ames; Ball, G.,Heady, E., Eds.; Iowa State University Press: Iowa, IA, USA, 1972.
30. Pope, R.D.; Prescott, R. Diversification in relation to farm size and other socioeconomic characteristics. Am. J.Agric. Econ. 1980, 62, 554–559. [CrossRef]
31. McNally, S. Farm diversification in England and wales-what can we learn from farm business survey.J. Rural Stud. 2001, 17, 247–257. [CrossRef]
32. Culas, R. Causes of farm diversification over time: An Australian perspective on an Eastern Norway model.AFMB J. 2006, 3, 1.
33. Weiss, C.R.; Bringlauer, W. Determinants and Dynamics of Farm. Diversification; FE Working Paper; Universityof Kiel: Kiel, Germany, 2000; 15p. Available online: https://ageconsearch.umn.edu/record/24929/files/cp02we35.pdf (accessed on 14 September 2018).
34. Sichoongwe, K.; Mapemba, L.; Ng’ong’ola, D.; Tembo, G. The Determinants and Extent of CropDiversification among Smallholder Farmers. A Case Study of Southern Province Zambia. J. Agric. Sci. 2014,6, 150–159. [CrossRef]
35. Benin, S.; Smale, M.; Gebremedhin, B.; Pender, J.; Ehui, S. The economic determinants of cereal crop diversityon farms in the Ethiopian Highlands. Agric. Econ. 2004, 31, 197–208. [CrossRef]
37. Banerjee, D.; Bhattacharyya, R. Problems of crop diversification in West Bengal. In Diversification of Agriculturein Eastern India; Ghosh, M., Sarkar, D., Roy, B.C.H., Eds.; Springer: New Delphi, India, 2015; pp. 155–165.
39. Shannon, C.E.A. Mathematical theory of communication. Bell Syst. Tech. J. 1948, 27, 379–423. [CrossRef]40. Krížová, S.; Buday, Š. Socio-economic aspects of food consumption in Slovakia: Overview of contemporary
issues. J. Food Nutr. Res. 2015, 54, 21–30.41. Slaboch, J.; Kotyza, P. Comparison of self-sufficiency of selected types ofmeat in the Visegrad countries.
J. Cent. Eur. Agric. 2016, 17, 793–814. [CrossRef]42. Miettinen, A. On diversity effects of alternative agricultural policy reforms in Finland: An agricultural sector