30
CROP-LIVESTOCK CROP-LIVESTOCK INTEGRATION INTEGRATION
| Date post: | 18-Dec-2015 |
| Category: |
Documents |
| Upload: | neal-stephens |
| View: | 221 times |
| Download: | 0 times |

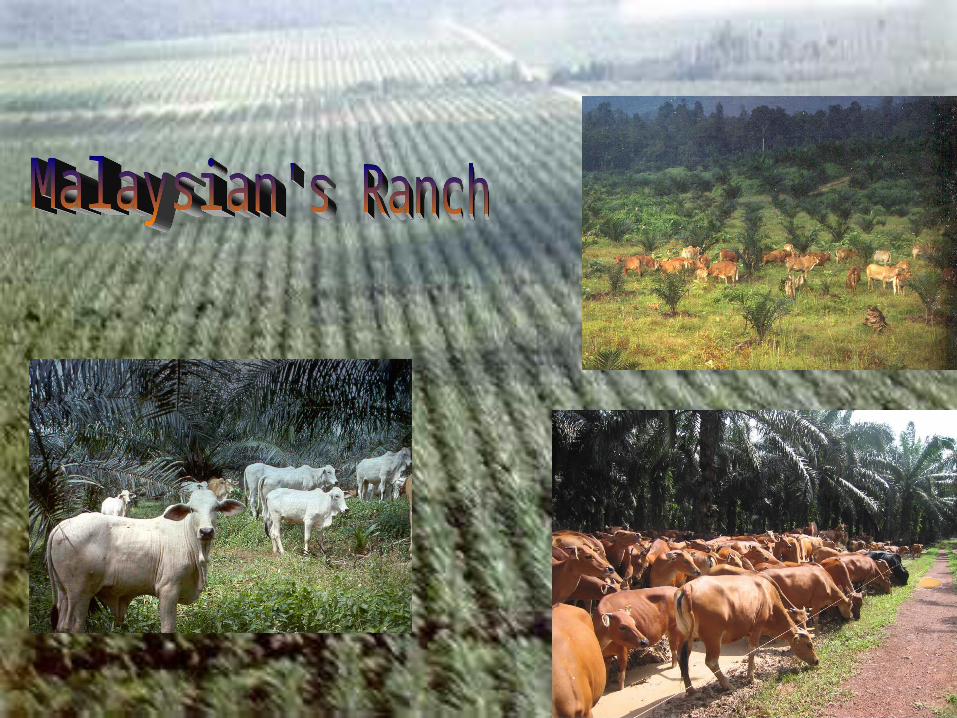
CROP-LIVESTOCK CROP-LIVESTOCK INTEGRATIONINTEGRATION

Rationale for Rationale for integrationintegration Establishment of open pastures is Establishment of open pastures is
expensive (RM 2000/ha)expensive (RM 2000/ha) Large area of oil palm (4.6 m ha), Large area of oil palm (4.6 m ha),
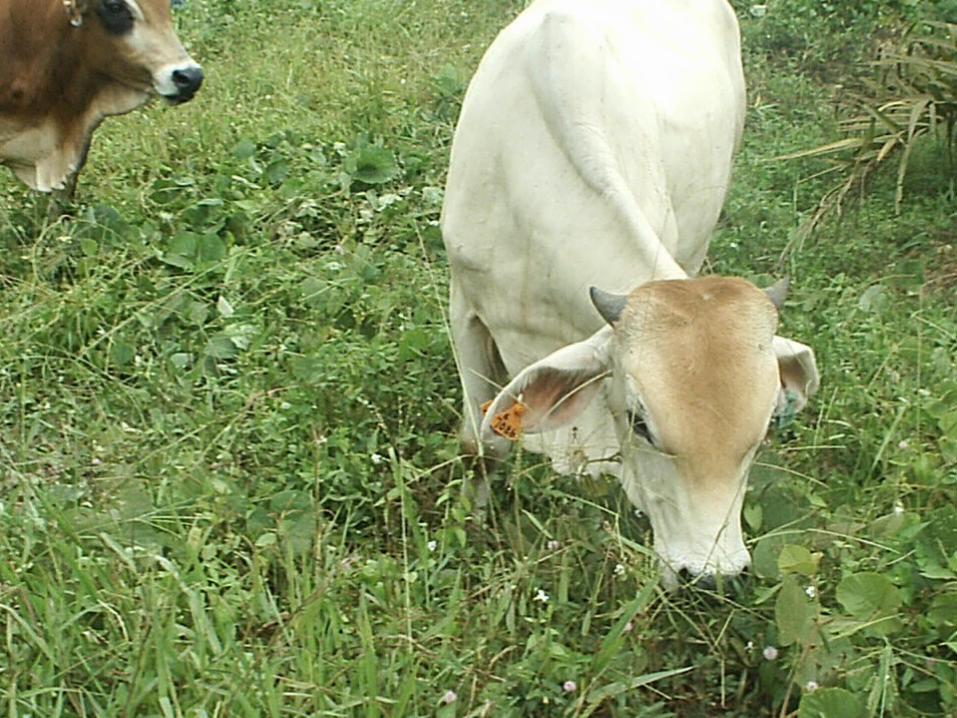
rubber (1 m ha), coconuts (0.14 m ha)rubber (1 m ha), coconuts (0.14 m ha) Immature crops (~10%) have plenty of Immature crops (~10%) have plenty of
herbaceous plants growing between herbaceous plants growing between rowsrows
Presence of grazing livestock reduces Presence of grazing livestock reduces weeding costs (by 25%)weeding costs (by 25%)
Additional income Additional income

Integration systemsIntegration systems
Cattle under coconuts
Sheep under rubber

National Agricultural National Agricultural Policy 3Policy 3
BeefBeef21. Beef production will be 21. Beef production will be increased through increased through further further integration of cattle with integration of cattle with plantation crops such as oil palm plantation crops such as oil palm in smallholdings and plantationsin smallholdings and plantations and through the expansion of and through the expansion of feedlot activities. feedlot activities.


Benefits of integrationBenefits of integration
Reduce cost of weeding – Reduce cost of weeding – estimates show that cost of estimates show that cost of weeding can be cut to 25%weeding can be cut to 25%
Increase and diversify incomeIncrease and diversify income Increase soil fertility by recycling Increase soil fertility by recycling
nutrientsnutrients

Problems in Problems in integrationintegration Light levels decline with canopy Light levels decline with canopy
closure, after 5 years inadequate light closure, after 5 years inadequate light for undergrowthfor undergrowth
Damage to crops if livestock is Damage to crops if livestock is introduced early (< 2 years)introduced early (< 2 years)
Livestock obstructs farm operations Livestock obstructs farm operations e.g. fertilizer application, rat poisoninge.g. fertilizer application, rat poisoning
Humid environment may be Humid environment may be detrimental to livestockdetrimental to livestock


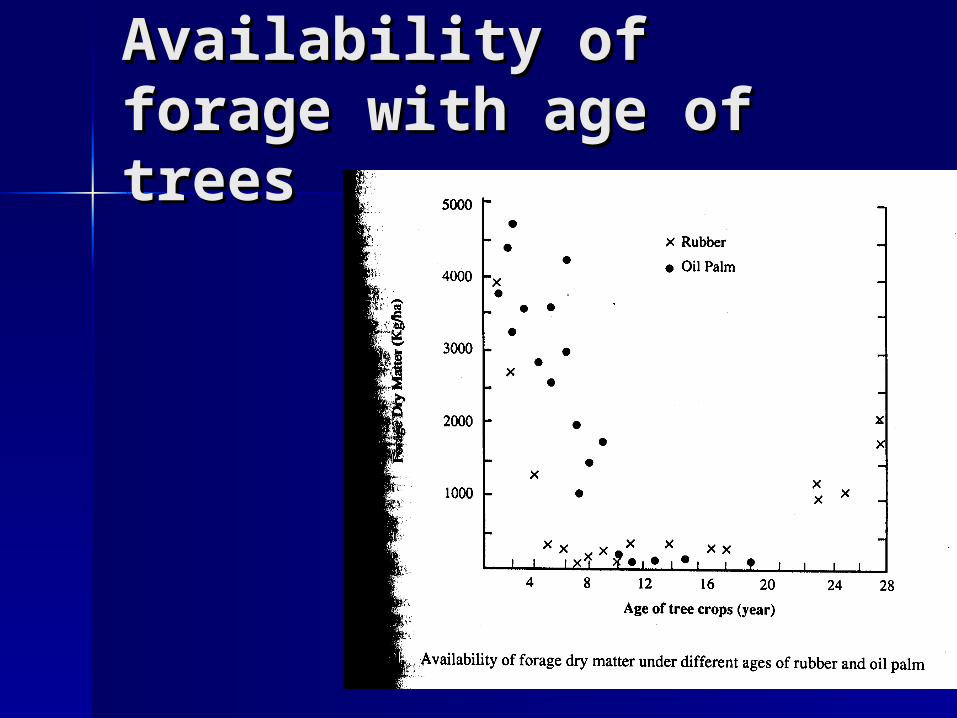
Availability of forage Availability of forage with age of treeswith age of trees
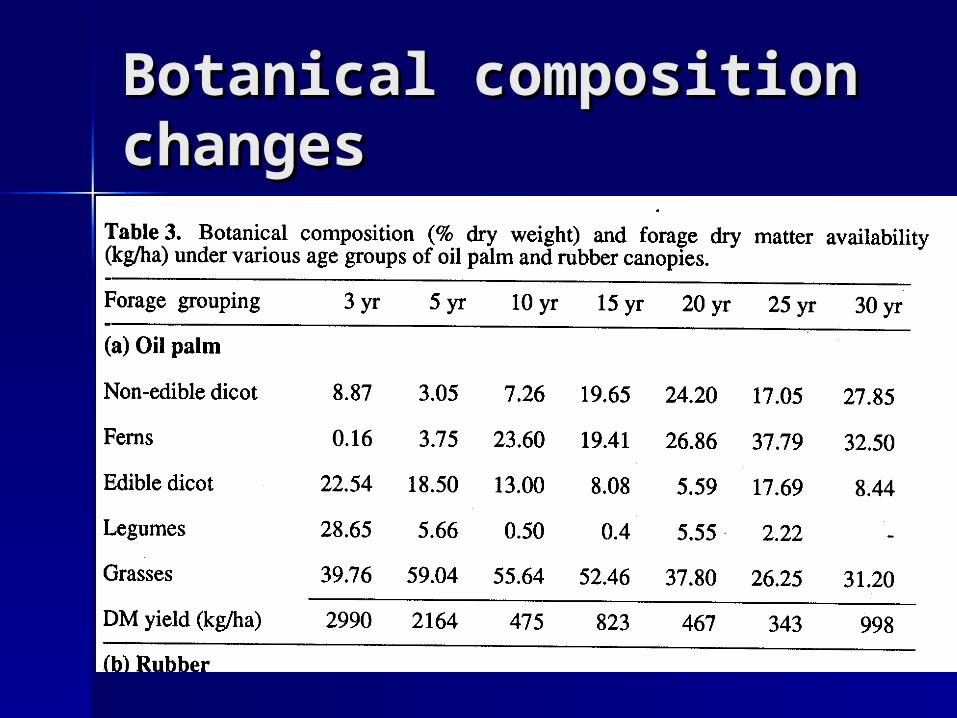
Botanical composition Botanical composition changeschanges

Modifying planting Modifying planting pattern to suit pattern to suit integrationintegrationTraditional planting Traditional planting
system in rubber system in rubber plantationplantation
Planting Planting distance distance (m)(m)
Trees/haTrees/ha
6.0 x 4.0 6.0 x 4.0 416416
9.0 x 2.59.0 x 2.5 444444
4.8 x 4.54.8 x 4.5 462462
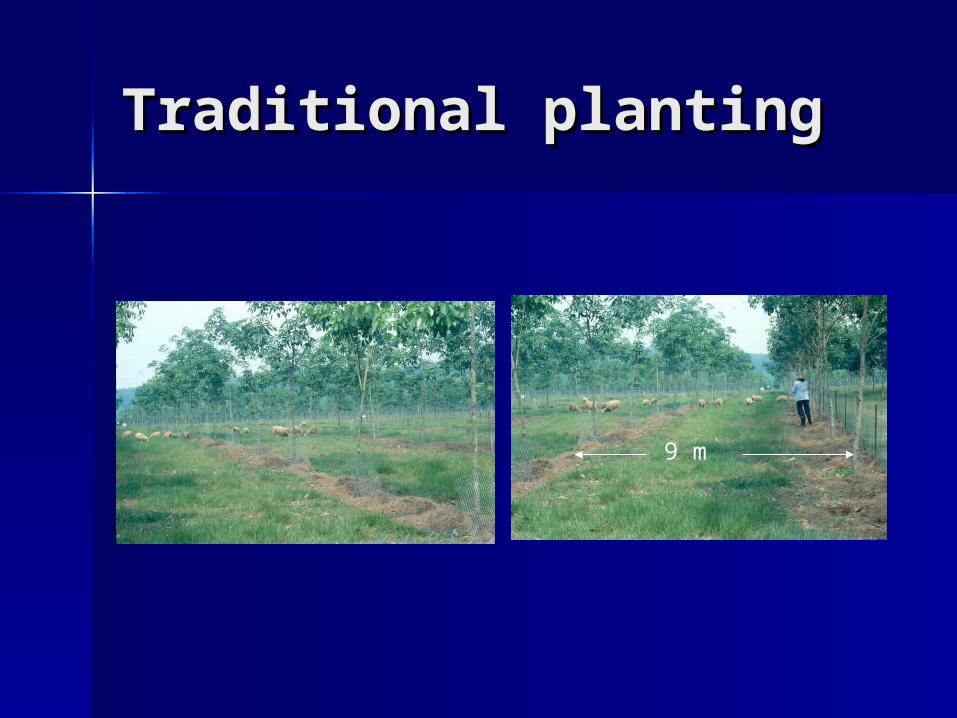
Traditional plantingTraditional planting
9 m
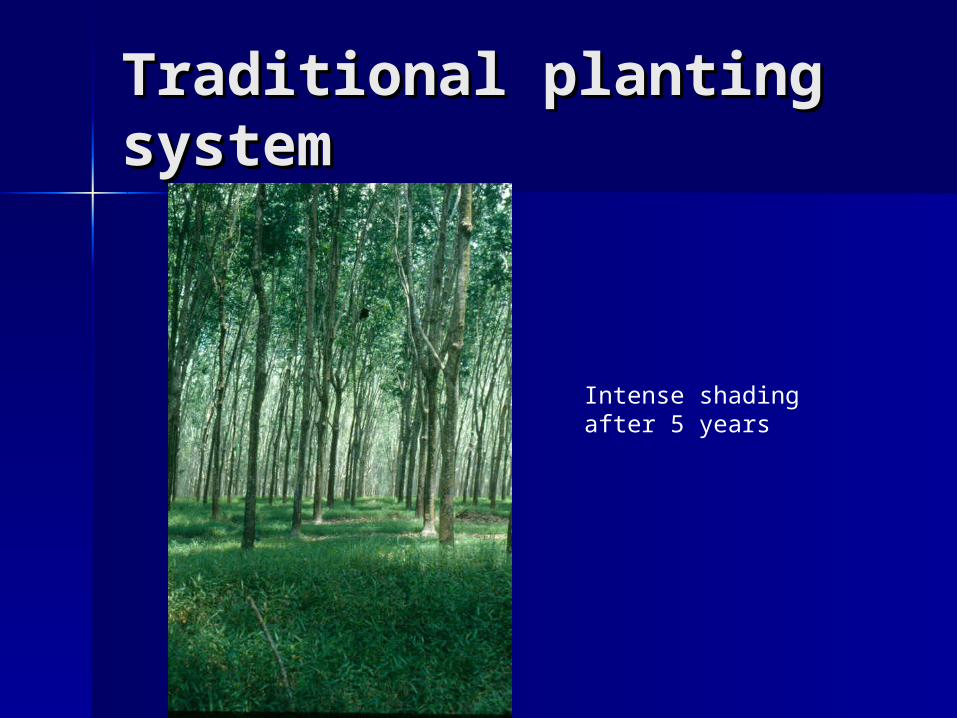
Traditional planting Traditional planting systemsystem
Intense shading after 5 years

Double hedgerow Double hedgerow planting systemplanting system
Grazing AreaGrazing Area
o o o o o o o o o o o o
o o o o o o
o o o o o o
22m
3m
2m

Double hedgerow Double hedgerow planting systemplanting system
22 m

Double hedgerow Double hedgerow planting systemplanting system
CharacteristicsCharacteristics BenefitsBenefits
Inter-rows spacing Inter-rows spacing 22 m wide22 m wide
Access to sunlight Access to sunlight over a longer termover a longer term
East-West East-West orientationorientation
Ensures high daily Ensures high daily light incidencelight incidence
Tree density 400-Tree density 400-420 trees/ha420 trees/ha
Only small Only small reduction reduction compared to compared to traditional (4%)traditional (4%)

POTENTIAL FORAGE YIELD AND ANIMAL PRODUCTION IN TRADITIONAL PLANTING DISTANCE OF RUBBER
Parameters Age of Rubber (years)
1-3 3-5 5-10
Light (% PAR) 95-65 64-20 <20
DM Yield of forage (t/ha)
2.6 1.2 0.5
Botanical Composition (%)
Legumes 79 37 10
Grass 14 31 37
Other edible species
2 22 5
Inedible species 0 3 44
Stocking rate (sheep/ha)
17-14 14-4 4-2
Average Daily Gain (g/day)
- 84-106 26-99
ADG (kg/ha per year) - 429-155 38-72
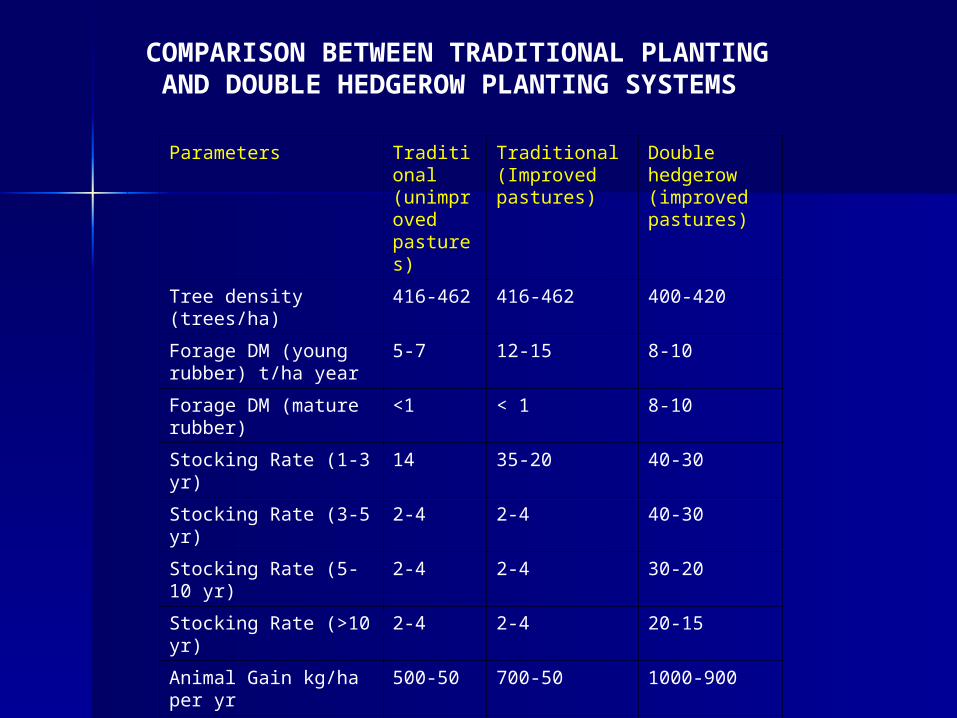
COMPARISON BETWEEN TRADITIONAL PLANTING AND DOUBLE HEDGEROW PLANTING SYSTEMS
Parameters Traditional (unimproved pastures)
Traditional (Improved pastures)
Double hedgerow (improved pastures)
Tree density (trees/ha) 416-462 416-462 400-420
Forage DM (young rubber) t/ha year
5-7 12-15 8-10
Forage DM (mature rubber)
<1 < 1 8-10
Stocking Rate (1-3 yr) 14 35-20 40-30
Stocking Rate (3-5 yr) 2-4 2-4 40-30
Stocking Rate (5-10 yr) 2-4 2-4 30-20
Stocking Rate (>10 yr) 2-4 2-4 20-15
Animal Gain kg/ha per yr 500-50 700-50 1000-900
Savings in weeding costs 15-25% 15-25% >50%
Estimate of returns from sheep (RM/ha per yr)
62 138-147 114-245

PINTARPINTAR
PProjek rojek InIntegrasi tegrasi TTernernaakan kan RRuminan dengan Tanaman Kekaluminan dengan Tanaman Kekal– Jabatan Perkhidmatan HaiwanJabatan Perkhidmatan Haiwan
(Integration of Ruminants with (Integration of Ruminants with Perennial Crops)Perennial Crops)

KAPASITI LADANG 100 induk / unit
KEPERLUAN TANAH
400 hektar kelapa sawit
OUTPUT6-7 ton daging / thn
PENDAPATAN RM 80,000 / thn
PELABURAN RM 220,000
IRR 17 %
INTEGRASI LEMBU
PEDAGING DI LADANG
KELAPA SAWIT

CharacteristicsCharacteristics
Low Input – animals use weeds as Low Input – animals use weeds as feedfeed
Stock numbers depend on feed Stock numbers depend on feed availabilityavailability

Grazing systemGrazing system
Rotational grazing systemRotational grazing system A 400 ha area is grazed A 400 ha area is grazed
completely within 90 days (3 completely within 90 days (3 months)months)

Characteristics of Characteristics of suitable areasuitable area Minimum 400 haMinimum 400 ha Oil palm between 5 and 15 yearsOil palm between 5 and 15 years Not Not hillyhilly, slope < 45, slope < 45oo
Not Not peatpeat soil soil Not bordering forestsNot bordering forests

Rotational Grazing Rotational Grazing SystemSystem 100 cattle graze 5 ha in 1 day100 cattle graze 5 ha in 1 day One cycle completed within 80-90 One cycle completed within 80-90
daysdays Stocking rate? 400 ha, 100 cattle Stocking rate? 400 ha, 100 cattle
= 0.25 cattle/ha or 4 ha/cattle= 0.25 cattle/ha or 4 ha/cattle
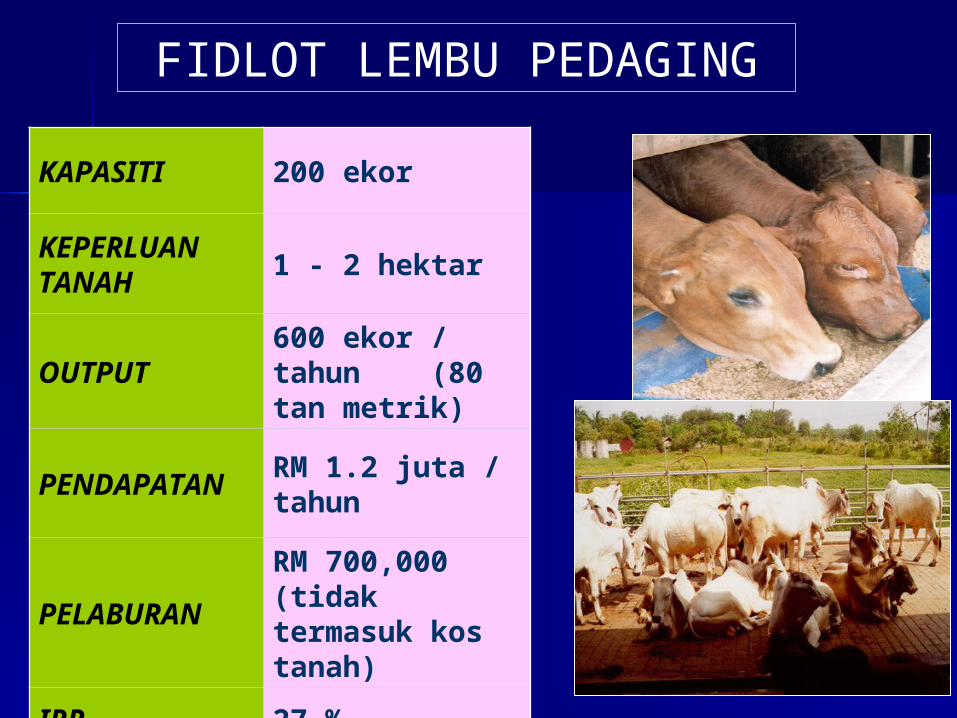
FIDLOT LEMBU PEDAGING
KAPASITI 200 ekor
KEPERLUAN TANAH
1 - 2 hektar
OUTPUT600 ekor / tahun (80 tan metrik)
PENDAPATAN
RM 1.2 juta / tahun
PELABURANRM 700,000 (tidak termasuk kos tanah)
IRR 27 %
2929
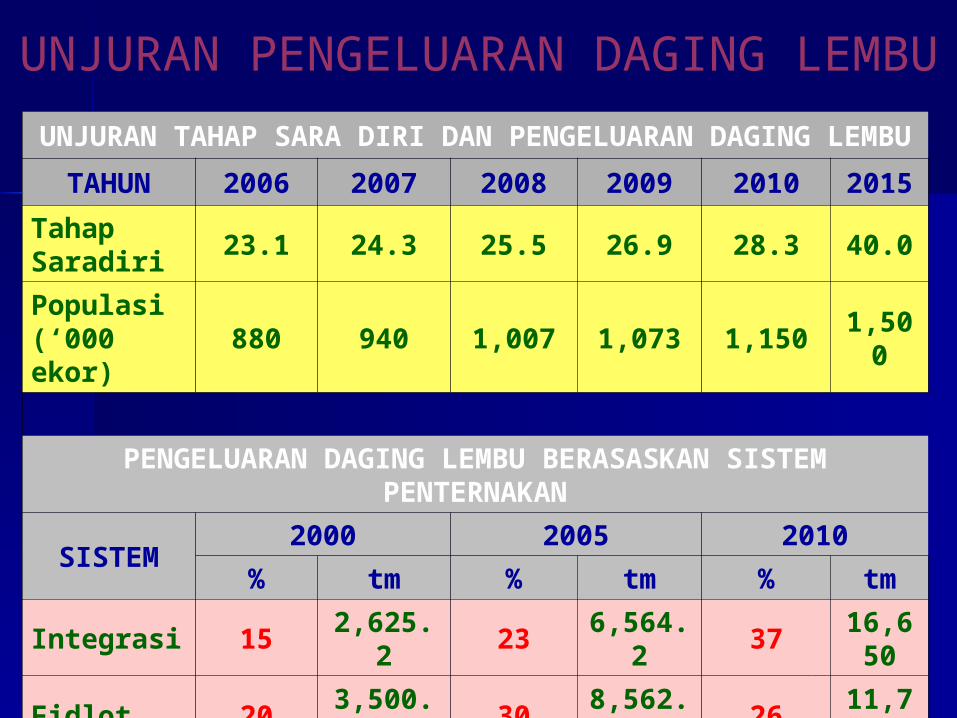
UNJURAN PENGELUARAN DAGING LEMBU
UNJURAN TAHAP SARA DIRI DAN PENGELUARAN DAGING LEMBU
TAHUN 2006 2007 2008 2009 2010 2015
Tahap Saradiri
23.1 24.3 25.5 26.9 28.3 40.0
Populasi(‘000 ekor)
880 940 1,007 1,073 1,150 1,500
PENGELUARAN DAGING LEMBU BERASASKAN SISTEM PENTERNAKAN
SISTEM2000 2005 2010
% tm % tm % tm
Integrasi 15 2,625.2 23 6,564.2 37 16,650
Fidlot 20 3,500.2 30 8,562.0 26 11,700
Tradisional 65 11,375.6 47 13,413.8 37 16,650
Jumlah (tm) 100 17,500.0 100 28,540.0 100 45,000


