33
Crop models for DSSs Simone Orlandini Department of Plant, Soil and Environmental Science University of Florence (Italy) [email protected]
| Date post: | 11-Apr-2018 |
| Category: |
Documents |
| Upload: | truongdang |
| View: | 218 times |
| Download: | 4 times |
Crop models for DSSs
Simone Orlandini
Department of Plant, Soil and Environmental ScienceUniversity of Florence (Italy)

What is a Model ?
A mathematical model is a simplified representation of a limited part of reality that contains interrelated elements (System)
A mathematical model consists of an equation or a set of equations that allow to reproduce the behaviour of the system by the implementation of software procedures (e.g. simple spreadsheets, programs)
The most important feature of a model is to understand and describe easily the real system
The system is identified by the users on the basis of objectives. For an agrometeorologist a system may be a rice crop with its elements, plant organs (leaf, stem and root) and processes (growth, transpiration, photosynthesis) that strongly interact
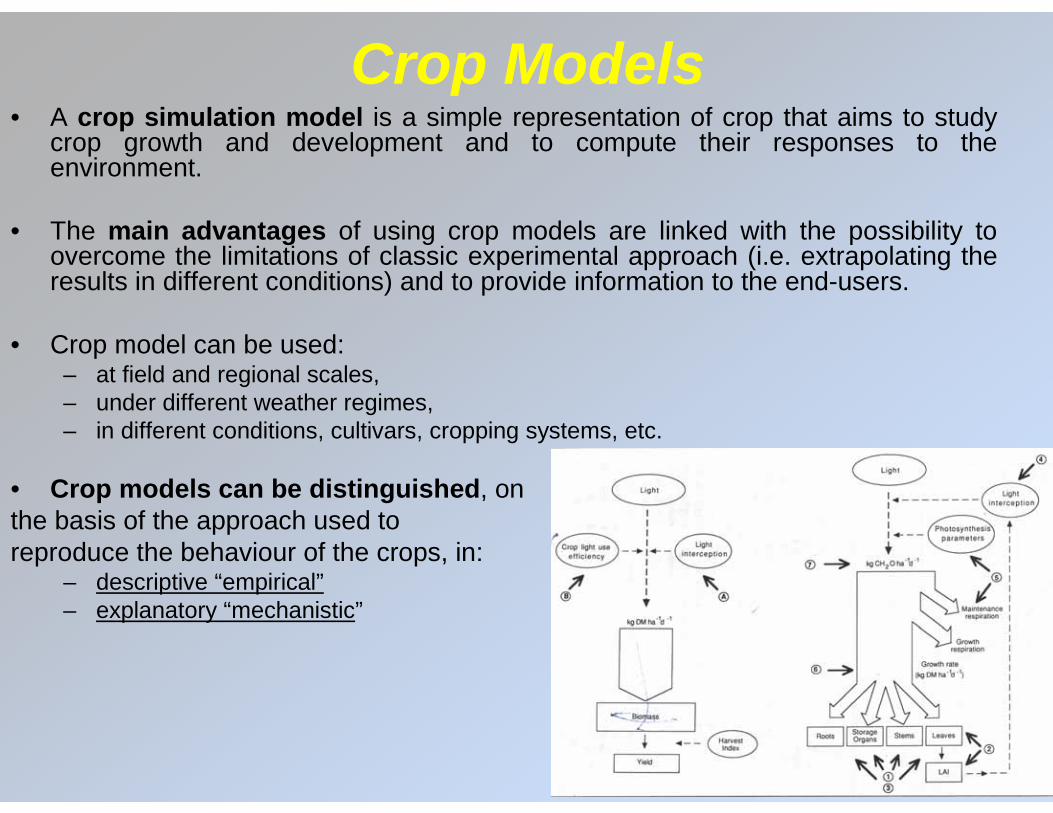
Crop Models• A crop simulation model is a simple representation of crop that aims to study
crop growth and development and to compute their responses to the environment.
• The main advantages of using crop models are linked with the possibility to overcome the limitations of classic experimental approach (i.e. extrapolating the results in different conditions) and to provide information to the end-users.
• Crop model can be used:– at field and regional scales,– under different weather regimes,– in different conditions, cultivars, cropping systems, etc.
• Crop models can be distinguished, on the basis of the approach used to reproduce the behaviour of the crops, in:
– descriptive “empirical”– explanatory “mechanistic”

Selection of the modeling approachThe model approach is selected on the basis:• purpose of model application• experimental data available for developing and/or testing the model
Purpose of application and types of models– Empirical: for summarizing data (SM) and interpolative prediction (IP) (i.e.
predicting within the range of the data base)– Mechanistic: for extrapolative prediction (EP) and research management
(RM) (i.e. predicting outside the range of the data base, identify gaps in knowledge)
– Mechanistic and Comprehensive: for interpretation (IN)
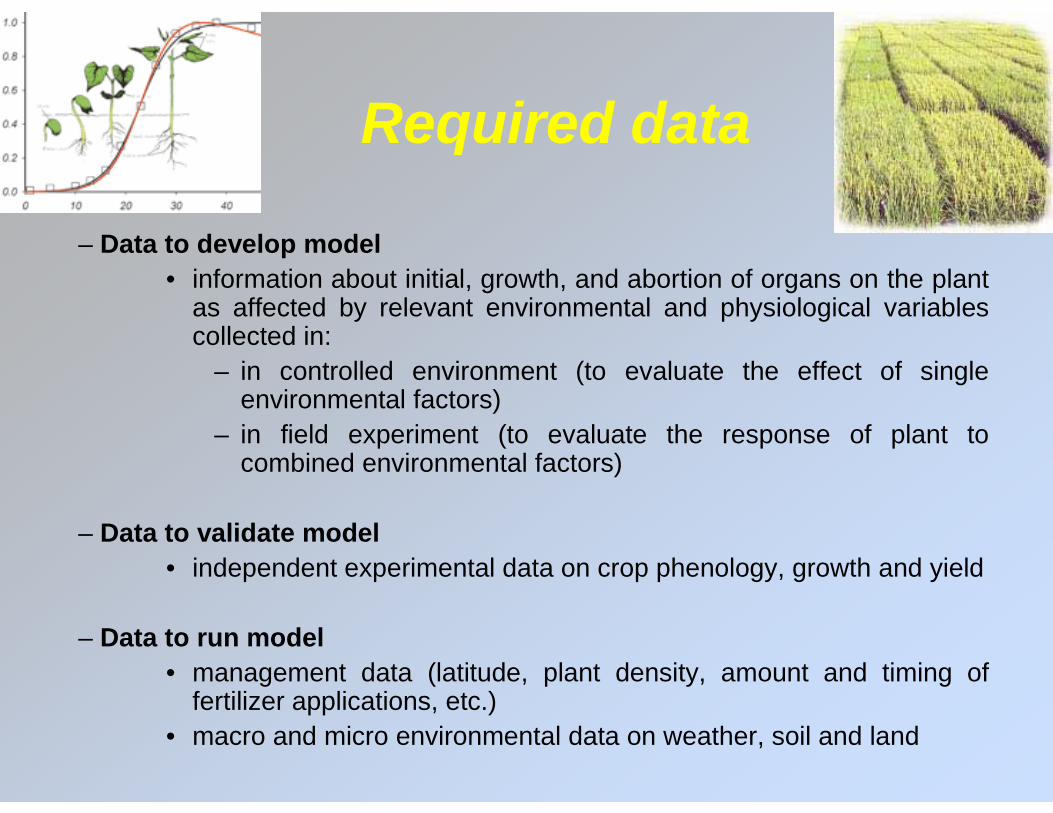
Required data
– Data to develop model• information about initial, growth, and abortion of organs on the plant
as affected by relevant environmental and physiological variables collected in:
– in controlled environment (to evaluate the effect of single environmental factors)
– in field experiment (to evaluate the response of plant to combined environmental factors)
– Data to validate model• independent experimental data on crop phenology, growth and yield
– Data to run model• management data (latitude, plant density, amount and timing of
fertilizer applications, etc.)• macro and micro environmental data on weather, soil and land

Production levels
(Rotter, 2008)

Potential production
Effect of water and nutrient elementsThree levels of plant production can be distinguished on the basis
of the growth-limiting factors
– Production Level 2: the crop production is limited by the availability of water
– Production Level 3: crop production is restricted by nitrogen and water shortage
– Production Level 4: crop production is limited by nutrient elements (N, K, P) and water shortage
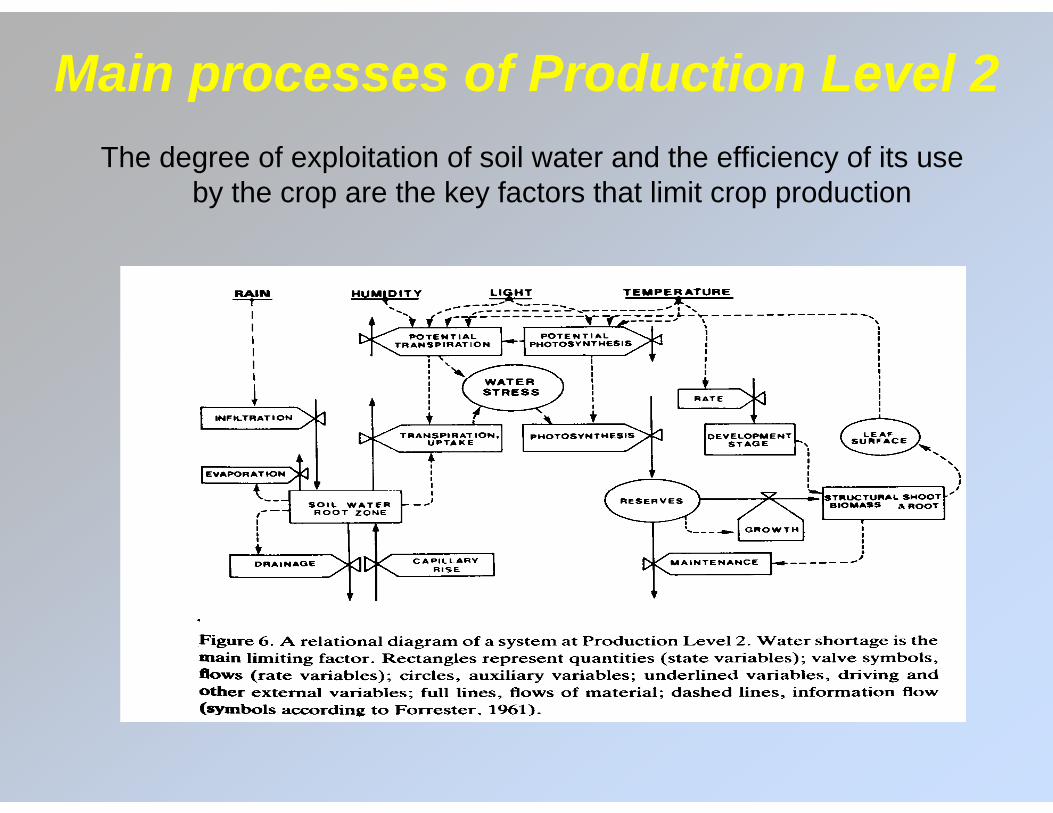
Main processes of Production Level 2 The degree of exploitation of soil water and the efficiency of its use
by the crop are the key factors that limit crop production

Main processes of Production Level 3 and 4
The nutrient availability (N and P) in soil and plant tissues and water shortage are the main limiting factors of crop production
0
500
1000
1500
2000
2500
3000
100 150 200 250DOY
Dry
mat
ter
per
plan
t (gp
lant
-1)
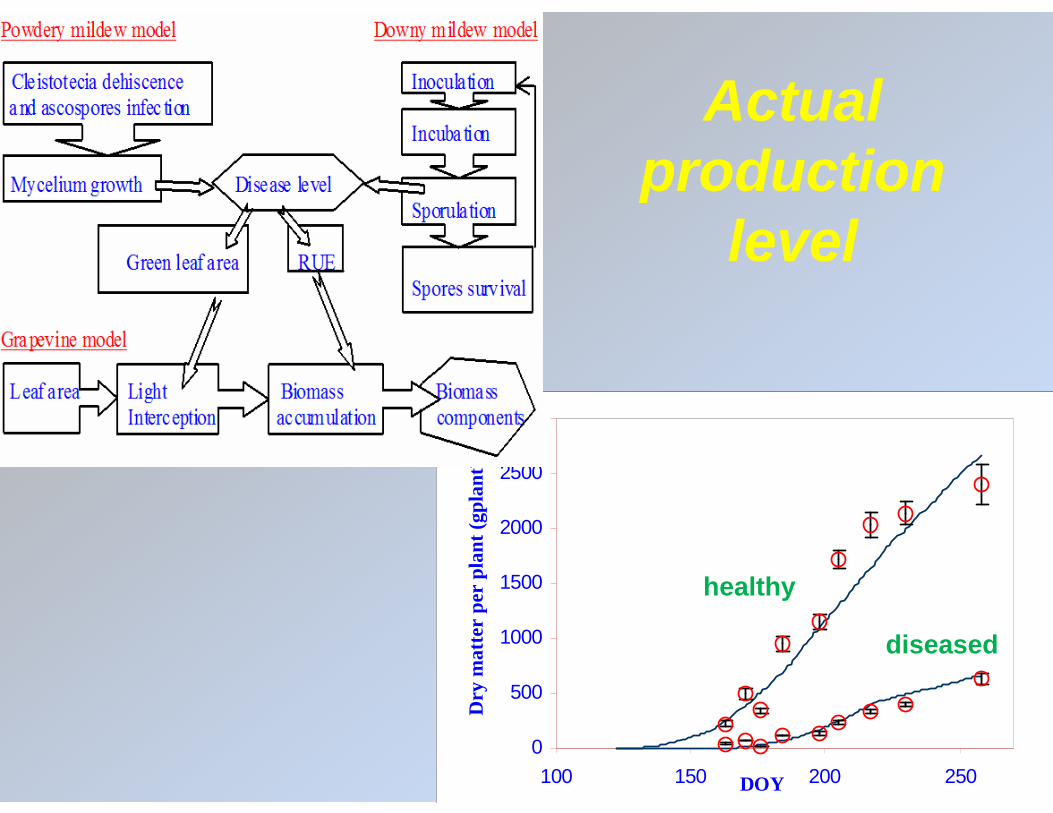
Actual production
level
healthy
diseased

Fields of applicationResearch• Resarch understanding• Integration of knowledge across disciplines• Improvement in experiment documentation and data organisation• Genetic improvement• Yield analysisCrop system management• Cultural and input management• Risk assessment and investment support• Site specific farmingPolicy analysis• Best management practices• Yield forecasting• Introduction of a new crop• Global climate change and crop production
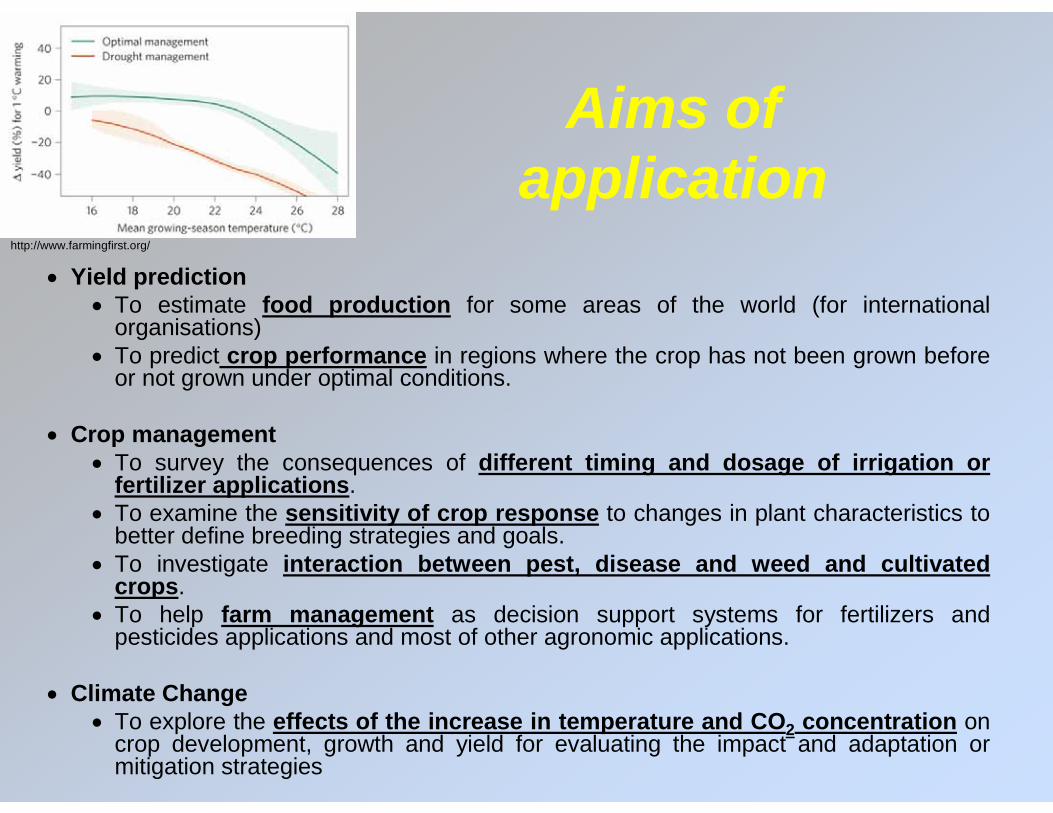
Aims of application
Yield prediction To estimate food production for some areas of the world (for international
organisations) To predict crop performance in regions where the crop has not been grown before
or not grown under optimal conditions.
Crop management To survey the consequences of different timing and dosage of irrigation or
fertilizer applications. To examine the sensitivity of crop response to changes in plant characteristics to
better define breeding strategies and goals. To investigate interaction between pest, disease and weed and cultivated
crops. To help farm management as decision support systems for fertilizers and
pesticides applications and most of other agronomic applications.
Climate Change To explore the effects of the increase in temperature and CO2 concentration on
crop development, growth and yield for evaluating the impact and adaptation or mitigation strategies
http://www.farmingfirst.org/

Name Crop and goalSLAM II Forage harvesting operationSPICE Whole plant water flowREALSOY SoyabeanMODVEX Model development and validation systemIRRIGATE Irrigation scheduling modelCOTTAM CottonAPSIM Modelling framework for a range of cropsGWM General weed model in row cropsMPTGro Acacia spp.and Leucaena Spp.GOSSYM-COMAX CottonCROPSYST Wheat & other cropsSIMCOM Crop (CERES crop modules) & economicsLUPINMOD LupinTUBERPRO Potato & diseaseSIMPOTATO PotatoWOFOST Wheat & maize, Water and nutrientWAVE Water and agrochemicalsSUCROS Crop modelsORYZA1 Rice, waterSIMRIW Rice, waterSIMCOY CornGRAZPLAN Pasture, water, lambEPIC Erosion Productivity Impact CalculatorCERES Series of crop simulation modelsDSSAT Framework of crop simulation models including modules of CERES, CROPGRO and CROPSIMPERFECTQCANE Sugarcane, potential conditionsAUSCANE Sugarcane, potential & water stress conds., erosionCANEGRO Sugarcane, potential & water stress condsNTKenaf Kenaf, potential growth, water stress
Example of crop models
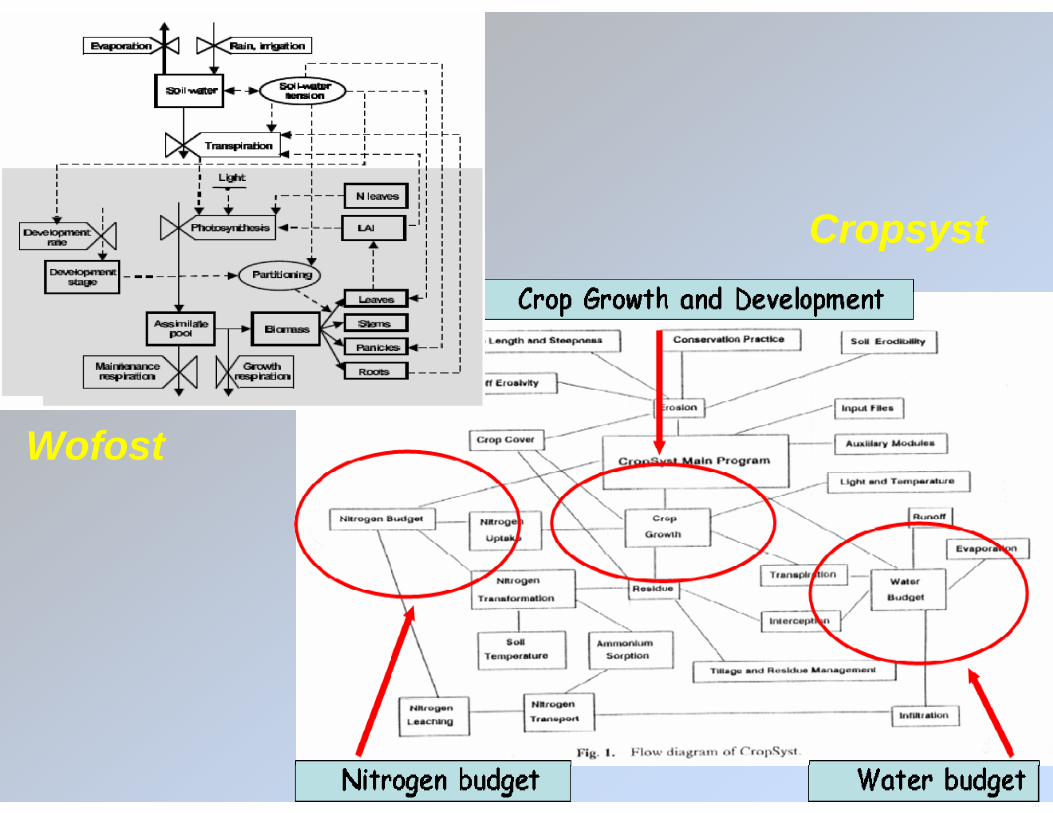
Cropsyst
Wofost
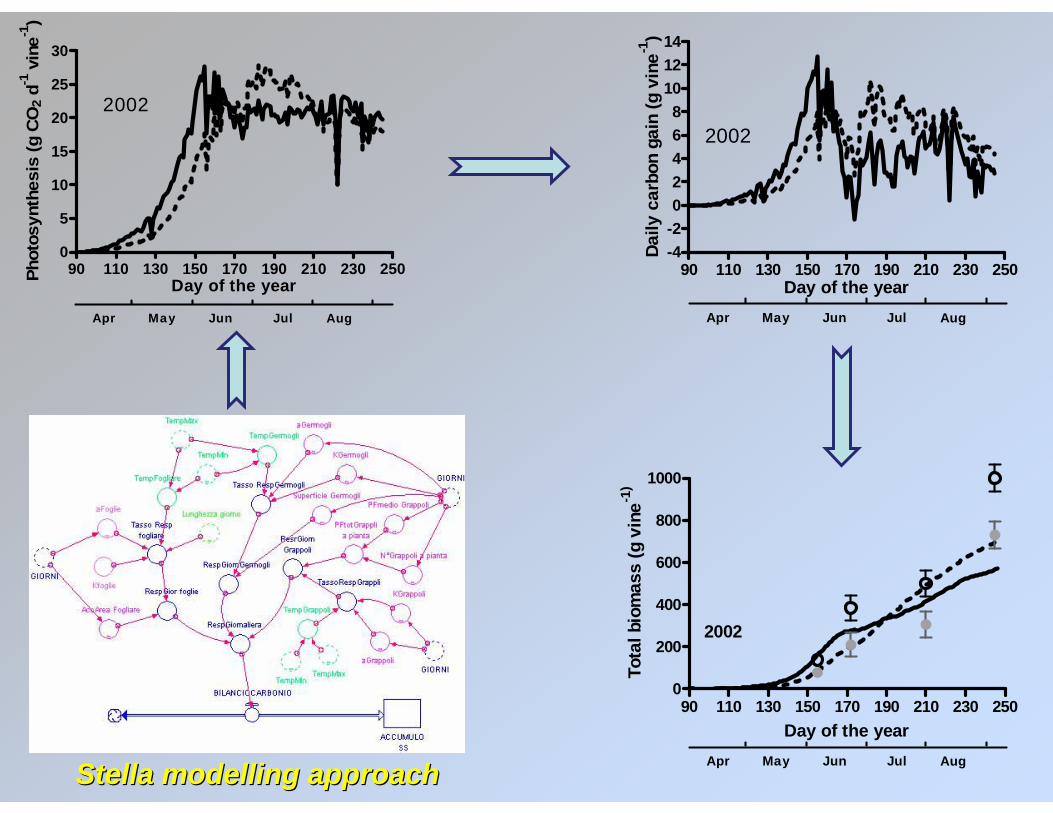
90 110 130 150 170 190 210 230 2500
200
400
600
800
1000
2002
May AugJun JulApr
Day of the year
Tota
l bio
mas
s (g
vin
e-1)
90 110 130 150 170 190 210 230 250-4-202468
101214
2002
May AugJun JulApr
Day of the year
Daily
car
bon
gain
(g v
ine-1
)
Stella modelling Stella modelling approachapproach
90 110 130 150 170 190 210 230 2500
5
10
15
20
25
30
2002
May AugJun JulApr
Day of the yearPhot
osyn
thes
is (g
CO
2 d-1
vin
e-1)
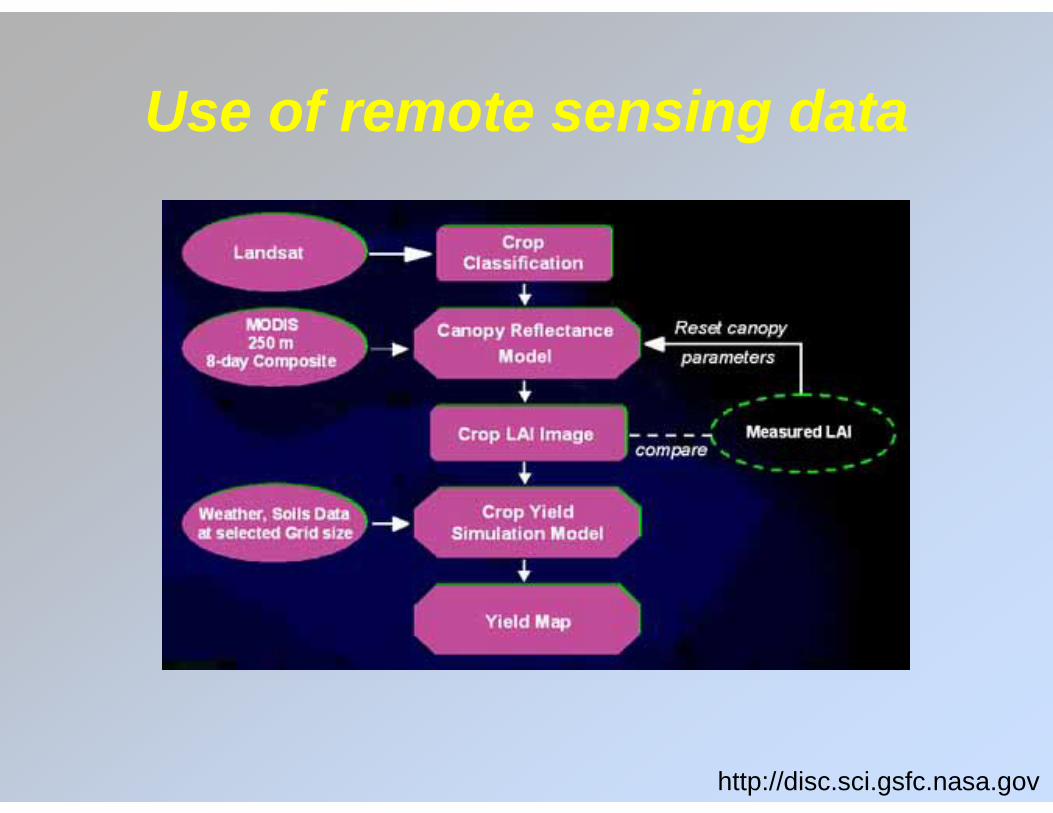
Use of remote sensing data
http://disc.sci.gsfc.nasa.gov

Simple growth model
Daily weatherTmxTmnRad
Shoot leaf no
Shoot leaf areaSLA=a * SLN^b
LAI=SLA*NS/(Cov*PLA)
SLN>17
ADUR = ADUR +TU EFF=EFF(1-0.0025(0.25Tmn+0.75Tmx-25)
PHO=Rad*EFF*(1-exp(-0.5*LAI))
BIO=BIO + PHO
ADUR < LAG
FRU = BIO * HI
SDUR > MAT
END
SLN = SLN + RLFRLF = (a+b*Tmd)*(1+c*SLN)
NO
YES
YESNO
YESNO
HI
Days
SLOPE
2
4
3
12

DSSAT settingsSOFTWAREDSSAT – Ceres ‐Maize
CLIMATIC DATATEMPERATURE and RAINFALL from a historical series of homogenized daily data, from 1955 to 2009, coming from 10 weather stationsSOLAR GLOBAL RADIATION calculated by means of ETo Calculator (FAO)
SOIL DATAThe soil was 1.50 m deep with a standard texture (sand 42%, clay 22%, silt 36%) Organic carbon 0.8%Total nitrogen 0.08%
IRRIGATIONWhen AWC < 35%
NITROGEN FERTILIZATION90 kg/ha at sowing90 kg/ha at beginning of stem elongation

YIELDSite R2 slope sig
Are 0.681 -36.95***Cdp 0.394 -24.15***Cng 0.402 -17.34***Gro 0.592 -13.55***Liv 0.843 -12.06***
Mama 0.406 -14.82***Per 0.556 -14.68***Pis 0.762 -19.62***Sie 0.421 -4.76***
Volt 0.500 -13.82***
Yield reduction over the last 55 years
This effect is mainly due to temperature through its role in determining the duration of phenological phases.
Trend of maize productivity

WF TRENDSWF TRENDS
y = ‐ 0.2049x + 67.524 R²= 0.4733
y = 0.0992x + 28.583 R²= 0.7075
y = ‐ 0.3498x + 27.969 R²= 0.4607
The WF of an agricultural product is the volume of water used during the crop growing period for producing a unit of product, and it has three components:
• GREEN: the ratio of effective rainfall (Reff) to the crop yield
• BLUE: the ratio of effective irrigation (Reff) to the crop yield
• GRAY: volume of water that is required to dilute pollutants to restore the quality standards of water. In this study, the water pollution was associated to the leaching of nitrogen (Nlea) caused by the use of inorganic fertilizers and the dilution factor (DF) used was 10 mg/l
Water footprint

2222
Crop model comparisons
To compare crop growth simulation models for predicting yield and yield variability in response to climatic factors and possible adaptation options (shift in sowing, irrigation, nitrogen management, cultivar changes)
APES
020
0040
0060
0080
0012
000
CROPSYST DAISY
DSSAT
020
0040
0060
0080
0012
000
FASSET HERMES
STICS
020
0040
0060
0080
0012
000
0 2000 6000 10000
WOFOST
0 2000 6000 10000
LedniceVerovanyBratislavaMüncheberg rainfedMüncheberg irrigatedFlakkebjergJyndevadFoulumKirklareli
Obs
erve
d gr
ain
yiel
d [k
g h
a−1
, dry
mat
ter]
Simulated grain yield [kg ha−1, dry matter]
Winter wheat Barley
Number of study sites 8 7
Total number of growing seasons 49 45
Number of models included 8 9
APES, CROPSYST, DAISY, DSSAT-CERES, FASSET, HERMES, MONICA,
STICS, WOFOST
02468
1012141618
DR
OU
GH
T
HE
AT
STR
ES
S
EX
CE
SS
RA
IN
FRO
ST
SN
OW
CO
VE
R
CR
OP
RE
SP
.
P&D
OTH
ER
Event
Nb. o
f cou
ntrie
s
02468
1012141618
DR
OU
GH
T
HE
ST
STR
ES
S
EX
CE
SS
RA
IN
FRO
ST
SN
OW
CO
VE
R
CR
OP
RE
SP
.
P&
D
OTH
ER
Event
Nb. o
f cou
ntrie
s
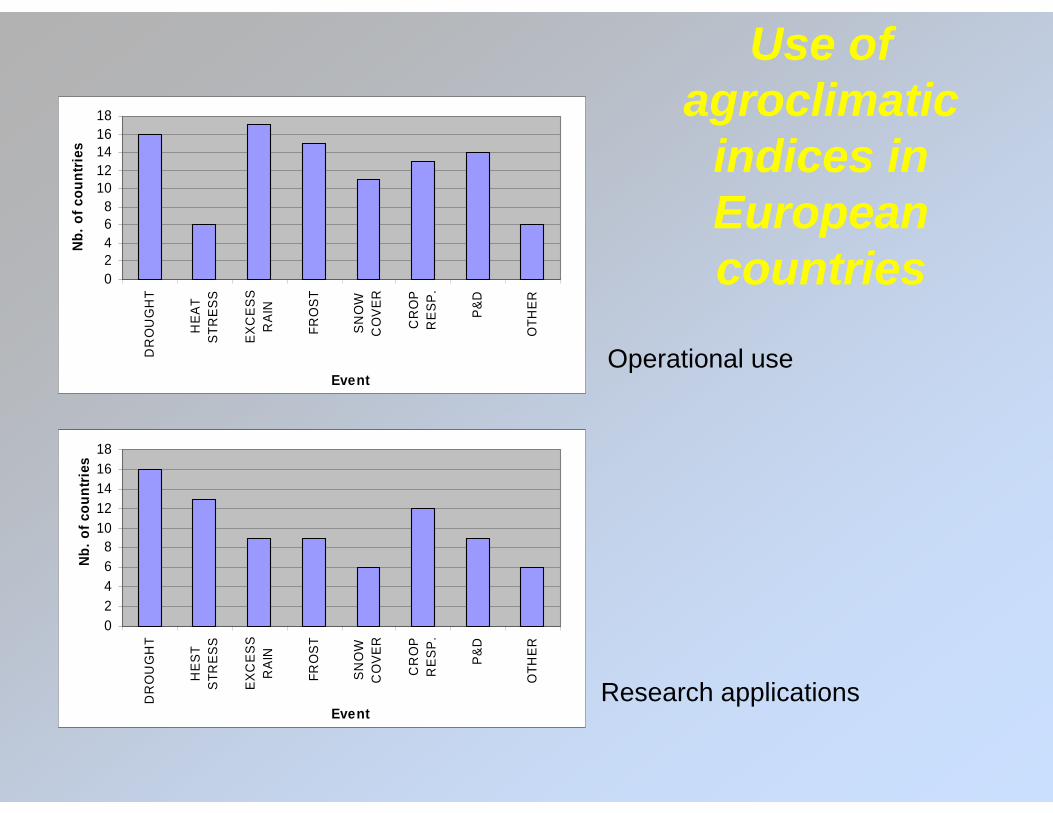
Operational use
Research applications
Use of agroclimatic
indices in European countries
2424
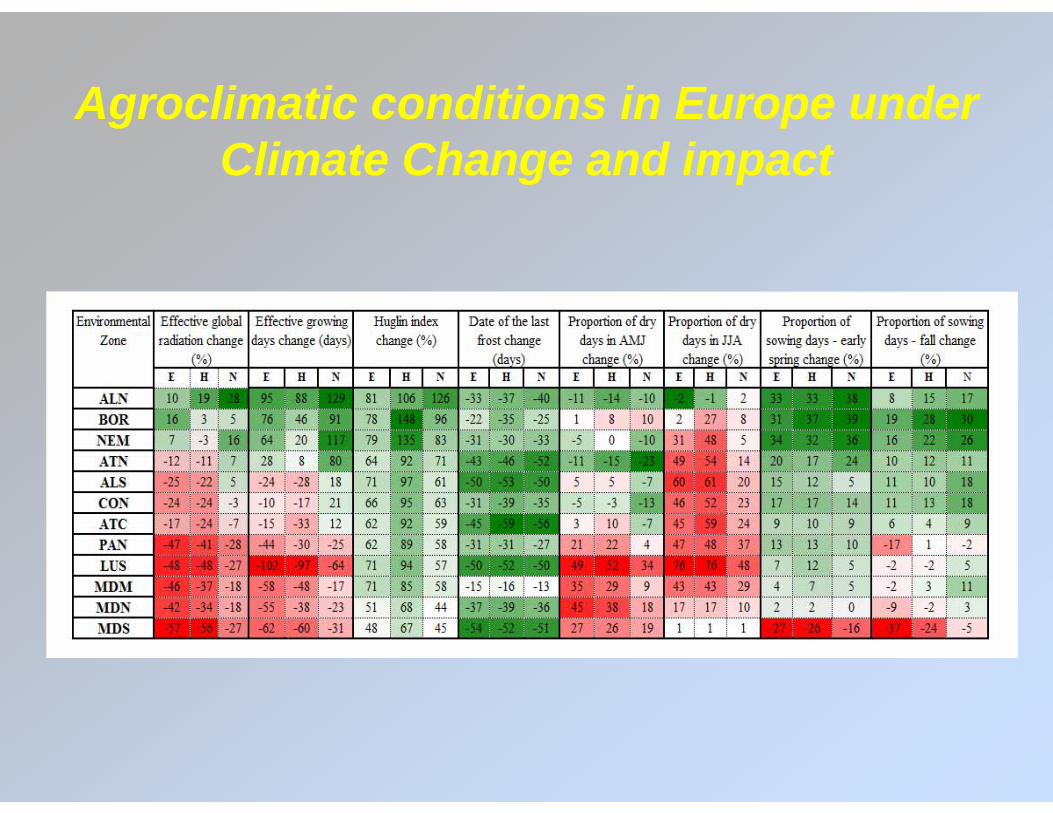
Agroclimatic conditions in Europe under Climate Change and impact

Moving mean (blue) and standard deviations (green) of the STA index. The mean (1955-1959) is about 1959 °C. The R2 shows a significant trend (p<0.01).
Degree day accumulation – interannual variability

Durum wheat protein content

Correlation maps

Other model application areas in agriculture
• Crop protection: pathogens, insects, frosts
• Water balance and irrigation
• Soil erosion

Main epidemiological
models
Coltura Malat. Mod.ABETE 3 3AGRUMI 1 1AVENA 2 2AVOCADO 1 1BANANA 2 4BARBABIET. 2 2BEGONIA 1 1CACAO 1 1CAFFÈ 1 1CANNA ZUC. 1 1CAROTA 2 2CASTAGNO 1 1CAUCCIÙ’ 2 3CAVOLO 2 3CEREALI 4 6CILIEGIO 2 2CIPOLLA 2 2COCOMERO 1 1COTICO ERB. 1 1COTONE 3 4CRESCIONE 1 1DUGLASIA 1 1FAGIOLO 4 4FRAGOLA 4 5GINEPRO 1 1GIRASOLE 2 2WHEAT 10 58LUPPOLO 1 3
Coltura Malat. Mod.MAIS 4 4MANDORLO 1 1MANGO 1 1MEDICA 2 3APPLE 4 18MELONE 1 1PEANUT 5 13NOCCIOLO 1 1OLMO 1 1BARLEY 5 13POTATO 4 21PESCO 1 1PINO 4 4PIOPPO 3 3PISELLO 1 1POMODORO 4 6QUERCIA 1 1RAPA 2 4RICE 4 17SEDANO 1 1SEGALE 1 1SOIA 5 9SORGO 7 7SPINACI 1 1SUSINO 1 1TABACCO 2 2TRIFOGLIO 1 1GRAPEVINE 4 17

To treatTo treat
Not to treatNot to treat
Crop protection

Irrigation management
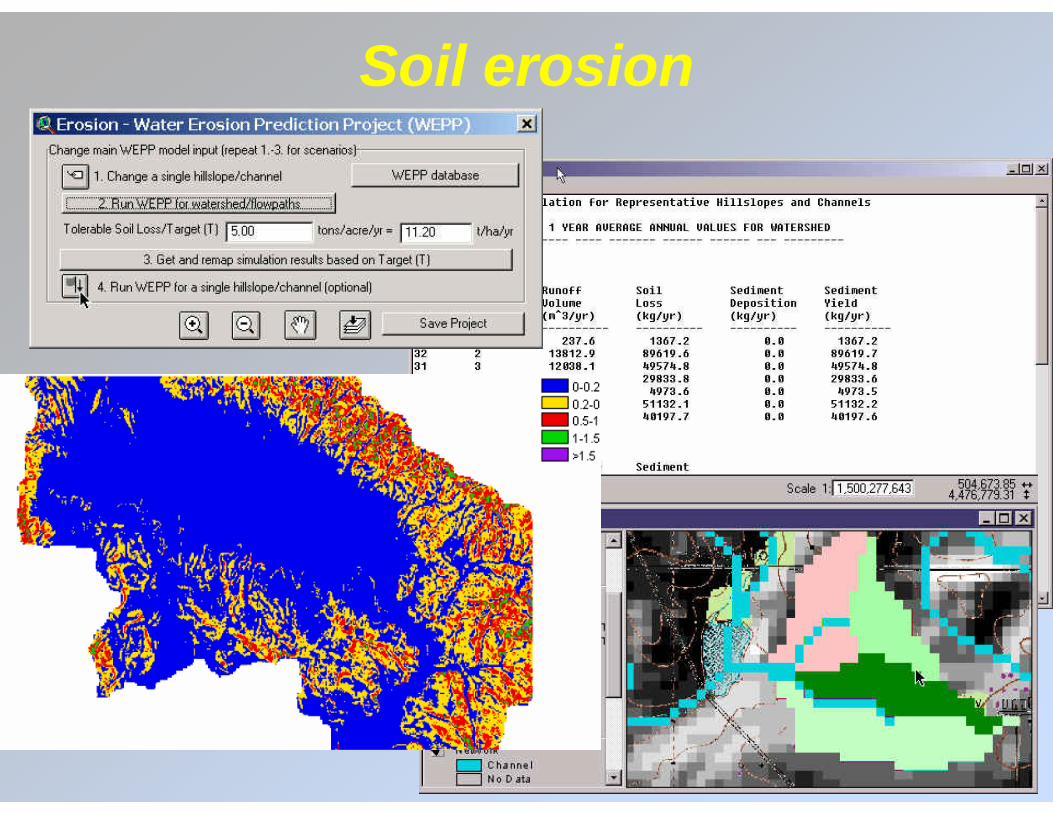
Soil erosion