C rop P rospects and F ood S ituation No. 4 n December 2016 n Global cereal production in 2016 received a further boost, owing to generally favourable growing conditions for the crops harvested later in the season. n COUNTRIES IN NEED OF EXTERNAL ASSISTANCE: FAO estimates that 39 countries, including 28 in Africa, are in need of external assistance for food, six more than the corresponding period in 2015. Continued conflicts and weather‑related shocks are the main causes of intensified food insecurity in 2016. n AFRICA: Dry‑weather‑reduced outputs in North and Southern Africa more than outweighed production gains in East and West Africa, resulting in an overall reduced aggregate cereal production in 2016. The low harvests in Southern Africa severely stressed food security conditions, while conflicts, notably in Nigeria and in South Sudan, continued to severely erode productive capacities and acutely intensified food insecurity in the affected areas. n ASIA: A sharp recovery in India’s output is mostly behind the strong 2016 production rebound in the Far East, while beneficial weather also boosted the production of the Asian CIS subregion. Several Near Eastern countries continued to be severely affected by the negative impact of conflicts on agriculture, livelihoods and food security, which adversely impacted the outcomes of the 2016 cereal harvest despite generally beneficial weather. n LATIN AMERICA AND THE CARIBBEAN: Drought‑reduced crops in Bolivia (Plurinational State of), Brazil and Paraguay caused a sharp cut in the 2016 aggregate South American cereal output, while production recoveries are expected in most Central American countries, following last year’s drought‑reduced harvests. Early prospects for the 2017 crop in South America are positive, based on expectations of an expansion in plantings and a favourable start to the cropping season. HIGHLIGHTS CONTENTS Countries Requiring External Assistance for Food 2 Global Production Overview 6 LIFDC Food Situation Overview 9 Regional Reviews Africa 11 Asia 21 Latin America and the Caribbean 27 North America, Europe and Oceania 30 Statistical Appendix 33 GIEWS global information and early warning system on food and agriculture (+1.7%) 2000 2100 2200 2300 2400 2500 2600 2016 2014 2012 2010 2008 2006 Million tonnes World cereal production World cereal utilization Global cereal production in 2016 received a further boost after better than expected outputs of later harvested crops 300 350 400 450 500 2016 2014 2012 2010 2008 2006 Million tonnes LIFDC cereal production LIFDC cereal utilization Larger crops in India and West Africa drive up LIFDC cereal production in 2016 (+2.8%) (+4.6%)
Transcript
Crop Prospects and Food Situation
No. 4 n December 2016
n Global cereal production in 2016 received a further boost, owing to generally favourable growing conditions for the crops harvested later in the season.
n COUNTRIES IN NEED OF EXTERNAL ASSISTANCE: FAO estimates that 39 countries, including 28 in Africa, are in need of external assistance for food, six more than the corresponding period in 2015. Continued conflicts and weather‑related shocks are the main causes of intensified food insecurity in 2016.
n AFRICA: Dry‑weather‑reduced outputs in North and Southern Africa more than outweighed production gains in East and West Africa, resulting in an overall reduced aggregate cereal production in 2016. The low harvests in Southern Africa severely stressed food security conditions, while conflicts, notably in Nigeria and in South Sudan, continued to severely erode productive capacities and acutely intensified food insecurity in the affected areas.
n ASIA: A sharp recovery in India’s output is mostly behind the strong 2016 production rebound in the Far East, while beneficial weather also boosted the production of the Asian CIS subregion. Several Near Eastern countries continued to be severely affected by the negative impact of conflicts on agriculture, livelihoods and food security, which adversely impacted the outcomes of the 2016 cereal harvest despite generally beneficial weather.
n LATIN AMERICA AND THE CARIBBEAN: Drought‑reduced crops in Bolivia (Plurinational State of), Brazil and Paraguay caused a sharp cut in the 2016 aggregate South American cereal output, while production recoveries are expected in most Central American countries, following last year’s drought‑reduced harvests. Early prospects for the 2017 crop in South America are positive, based on expectations of an expansion in plantings and a favourable start to the cropping season.
HIGHLIGHTS CONTENTSCountries Requiring External Assistance for Food 2
Global Production Overview 6
LIFDC Food Situation Overview 9
Regional Reviews Africa 11 Asia 21 Latin America and the Caribbean 27 North America, Europe and Oceania 30
Statistical Appendix 33
GIEWS global information and early warning system on food and agriculture
(+1.7%)
2000
2100
2200
2300
2400
2500
2600
201620142012201020082006
Million tonnes
World cereal production
World cereal utilization
Global cereal production in 2016 received a furtherboost after better than expected outputs of laterharvested crops
300
350
400
450
500
201620142012201020082006
Million tonnes
LIFDC cereal production
LIFDC cereal utilization
Larger crops in India and West Africa drive up LIFDC cereal production in 2016
(+2.8%)
(+4.6%)
No. 4 December n 20162
Crop Prospects and Food Situation
WIDESPREAD LACK OF ACCESS
BurundiCivil insecurity and economic downturn • Disruptions to markets, farming activities and
livelihoods, coupled with limited humanitarian assistance and declining food import capacity, continue to seriously affect food security conditions of households, especially in Kirundo, Muyinga, Rutada and Makamba provinces, as well as rural areas near Bujumbura.
• About 1.46 million people are estimated to be severely food insecure.
ChadPopulation displacements and civil insecurity• Approximately 388 000 refugees, 112 000 IDPs, as well
as an estimated 95 000 Chadian returnees, continue to add pressure on local food supplies, negatively affecting food security.
• About 456 000 people are estimated to be in need of food assistance according to the latest “Cadre Harmonisé” analysis.
Democratic Republic of the CongoConflict and displacements in eastern provinces, influx of refugees putting strain on host communities• As of late September 2016, the IDP caseload was
estimated at 1.9 million, 100 000 more than the previous estimates in late April. An estimated 6 million people are in acute food insecurity and livelihood crisis (IPC Phase 3: “Crisis” and IPC Phase 4: “Emergency”). The country hosts 96 500 refugees from the Central African Republic, 60 300 from South Sudan and 33 900 from Burundi.
AFRICA (28 countries)
EXCEPTIONAL SHORTFALL IN AGGREGATE FOOD PRODUCTION/SUPPLIES
Central African RepublicConflict, displacements and food supply constraints• The Internally Displaced Person (IDP) caseload,
which declined earlier in 2016 following a relative improvement of the security situation in some areas of the country, increased by about 36 000 in October, and was estimated at about 421 000. About 2 million people (40 percent of the total population) are in need of urgent assistance (IPC Phase 3: “Crisis” and IPC Phase 4: “Emergency”) as a result of three consecutive years of reduced harvests and food access constraints due to market disruptions and declining purchasing power.
MalawiSignificant cereal production decline in 2016 and higher food price • An estimated 6.5 million people are in need of
humanitarian assistance, on account of the sharply reduced maize harvest in 2016 and higher food prices.
ZimbabweSteep declines in cereal production in 2016 • An estimated 33 percent (approximately 3 million
people) of the rural population are food insecure, and this number is projected to rise to 44 percent (4.07 million people) during the peak of the lean period between January and March 2017, approximately 44 percent higher than the corresponding period in the first quarter of 2016.
• The worsening food security situation reflects the impact of the El Niño‑induced drought that caused a sharp reduction in the 2016 agricultural output.
Countries requiring external assistance for food1
country requiring external assistance for food
World: 39 countries
No. 4 n December 2016 3
Crop Prospects and Food Situation
DjiboutiLingering effects of unfavourable rainy seasons on pastoral livelihoods• About 194 000 people are severely food insecure,
down from the previous estimate, mainly concentrated in pastoral inland areas of Dikhil Region.
EritreaEconomic constraints have increased the population’s vulner-ability to food insecurity
EthiopiaLingering effects of the previous year’s severe drought on local livelihood systems • About 9.7 million people are severely food insecure,
mainly in eastern areas of Oromia, Amhara and Tigray regions as well as in Afar and northern Somali regions.
LesothoDrought-reduced 2016 production and higher food prices• An estimated 709 394 people are food insecure,
reflecting the impact of the cereal production decline in 2016 and higher prices.
MozambiqueDrought-affected 2016 production and higher food prices• Drought conditions resulted in lower cereal outputs in
southern provinces and in parts of central provinces, while higher prices are adversely impacting food access.
• Nearly 2 million people are food insecure and require humanitarian assistance.
NigerPopulation displacements and civil insecurity • More than 833 000 people are estimated to be in
Phase 3: “Crisis” and above according to the last “Cadre Harmonisé” analysis.
• Approximately 61 000 Malian refugees are estimated to be living in the country.
• Almost 327 000 people, mostly in the southeast Diffa Region have been displaced due to fear of attacks.
NigeriaEconomic downturn, steep depreciation of the local currency, population displacements and severe insecurity in northern areas• More than 8 million people are estimated to be
food insecure, of which a significant number are in need of emergency food assistance, according to the latest “Cadre Harmonisé” analysis. Despite the generally favourable crop prospects in the key‑producing regions of the north, the sharp depreciation of the Naira, coupled with persisting civil conflict in northern states has continued to disrupt market activities and keep prices at near record highs.
South SudanConflict, civil insecurity and severe economic downturn• Over 3.4 million people are severely food insecure,
mainly in the conflict‑affected states of Jonglei, Unity and Upper Nile, but also in traditional surplus‑producing areas of Greater Bahr el Ghazal and Greater Equatoria regions due to insecurity, trade disruptions and high prices.
SwazilandReduced cereal output following drought conditions• An estimated 638 251 people in need of assistance,
reflecting the impact of the drought‑reduced 2016 harvest and livestock losses. Higher food prices are further affecting the food security conditions.
SEVERE LOCALIZED FOOD INSECURITY
Burkina FasoRefugees putting strain on host communities and lingering impact of reduced 2015 harvest • Over 32 000 Malian refugees are estimated to be living
in the country.• About 153 000 people are estimated to be in
need of food assistance according to the last “Cadre Harmonisé” analysis.
CameroonInflux of refugees putting strain on host communities, displacements • The number of refugees from the Central African
Republic, who mainly entered East, Adamaoua and North regions, was estimated in October at 274 000. In addition, about 86 000 refugees from Nigeria have entered the Far North and North regions since May 2013. Insecurity along the borders with Nigeria also led to the internal displacement of 200 000 individuals.
• The number of food insecure people is currently estimated at 2.6 million, more than twice the level in June 2015.
CongoInflux of refugees straining the already limited resources of host communities • As of late October 2016, about 29 300 refugees from the
Central African Republic are sheltering in the country.
GuineaLingering impact of the Ebola Virus Disease (EVD) outbreak • All neighbouring countries have re‑opened their borders with
Guinea, which has led to a significant increase in trade flows.
• About 51 000 people are estimated to be in need of food assistance according to the last “Cadre Harmonisé” analysis.
KenyaAdverse weather on crops production during the first semester of 2016 • About 1.25 million people are severely food
insecure, mainly located in southeastern and coastal areas, following the negative impact of poor 2016 “long‑rains” on crops production.
LiberiaLingering impact of the Ebola Virus Disease (EVD) outbreak • The country is hosting more than 20 000 refugees as of
end‑May 2016, most of them from Côte d’Ivoire.• About 53 000 people are estimated to be in
need of food assistance according to the latest “Cadre Harmonisé” analysis.
MadagascarSevere drought conditions in southern areas • Drought conditions in southern regions caused a sharp
decrease in the 2016 cereal harvest from an already below‑average 2015 output, resulting in severe food insecurity conditions; approximately 850 000 people require humanitarian assistance in Androy, Anosy and Astimo Andrefana. Higher food prices have also exacerbated the situation.
• At the national level, rice production in 2016 was estimated to have remained below average, but marginally up on last year’s level.
MaliPopulation displacements and civil insecurity in northern areas• An estimated 37 000 people have been internally
displaced in the country mostly residing in Timbuktu, the most affected region.
• About 177 000 people, located mostly in Timbuktu, Mopti and Bamako regions, are estimated to be in Phase 3: “Crisis” and above, according to the last “Cadre Harmonisé” analysis.
No. 4 December n 20164
Crop Prospects and Food Situation
MauritaniaRefugee caseload continues to put additional pressure on local food supplies• About 42 000 Malian refugees remain in southeastern
Mauritania in the Mbeera camp. • Over 119 000 people are estimated to be in
Phase 3: “Crisis” and above, according to the last “Cadre Harmonisé” analysis.
Sierra LeoneLingering impact of the Ebola Virus Disease (EVD) outbreak• About 159 000 people are estimated to be in
need of food assistance according to the latest “Cadre Harmonisé” analysis.
SomaliaConflict, civil insecurity and localized drought conditions
• About 1.1 million people are estimated to be in need of emergency assistance, mainly IDPs and drought affected agro‑pastoral communities in northern regions.
SudanConflict and civil insecurity • An estimated 3.6 million people are in need of
humanitarian assistance, mainly IDPs and host communities in conflict affected areas.
UgandaBelow-average crop production• About 393 000 people in Karamoja region are
estimated to be severely food insecure following consecutive seasons of reduced agricultural outputs.
ASIA (9 countries)
EXCEPTIONAL SHORTFALL IN AGGREGATE FOOD PRODUCTION/SUPPLIES
Syrian Arab RepublicWorsening civil conflict• Agricultural production is significantly affected by
conflict; the 2016 wheat production estimated at 1.5 million tonnes, 55 percent less that the pre‑crisis average (2007‑2011).
• About 9.4 million people continue to require food assistance.
• Although some international food assistance is being provided, Syrian refugees are also putting strain on other host communities in neighbouring countries.
WIDESPREAD LACK OF ACCESS
Democratic People’s Republic of KoreaLow agricultural output and economic downturn• Heavy rains in late August and early September 2016
reportedly caused localized floods across northeastern parts of the country, resulting in damage to arable land, housing and infrastructure. These areas were also negatively impacted by the floods in August 2015.
• Despite an expected partial recovery in the 2016 aggregate food production, supplies remain tight and 18 million people remain dependent on Government‑distributed food rations.
• Given the overall tight supply situation, most households are anticipated to continue to experience borderline or poor food consumption rates.
YemenConflict, poverty, and high food and fuel prices• According to the IPC analysis of June 2016, out of
the 14.12 million food insecure people (9.4 percent higher than the previous year), about 7 million were in IPC Phase: 4 “Emergency”, while 7.1 million were in IPC Phase: 3 “Crisis”. The current numbers are likely to be higher.
• A below‑average cereal harvest expected in 2016 but abundant rainfall had positive effects on livestock production.
SEVERE LOCALIZED FOOD INSECURITY
AfghanistanContinuing conflict and population displacement• According to the IPC analysis of April 2016, 8.4 million
people are classified in an acute food insecurity crisis and emergency situation. The most food insecure population are in Ghor, Badakhshan, Nuristan and Nangarhar provinces.
• Changes in refugee policies in Pakistan have led to steep increases in returnees: up to 400 000 undocumented returnees and around 200 000 documented returnees will arrive in Afghanistan by the end of 2016 putting strain on the limited local resources, particularly in the eastern province of Nangarhar.
IraqSecurity related uncertainties disrupt distribution systems• Over 2 million people have been displaced since
January 2014.• Some 1.8 million beneficiaries (IDPs, non‑displaced
food insecure in conflict areas and food insecure host families) are receiving food assistance.
Libya +Security related uncertainties disrupt distribution systems• The number of people in need of food assistance
is estimated at 0.4 million, with refugees, asylum seekers and internally displaced among the most vulnerable.
• Food shortages are reported mostly in the south and east where basic food items, including wheat, bread, flour, pasta, oil, milk and fortified blended foods for children are in short supply. Access to subsidized food among the affected population is limited.
MyanmarImpact of floods for a second consecutive year and renewed conflict in northern parts of Rakhine State• Floods in 2016 severely affected an estimated
500 000 people.• Households in Chin and Rakhine states still remain
highly vulnerable, as they have not yet recovered from the impact of last year’s floods.
• Around 30 000 people are estimated to have been displaced following the escalation of the conflict in northern parts of Rakhine State since early October 2016. Around 162 000 people are estimated to be food insecure with at least 78 000 in urgent need of food.
No. 4 n December 2016 5
Crop Prospects and Food Situation
Key ‑ New Entry +
Terminology1 Countries requiring external assistance for food are expected to lack the resources to deal with reported critical problems of food insecurity. Food crises are nearly always due to a combination of factors but for the purpose of response planning, it is important to establish whether the nature of food crises is predominantly related to lack of food availability, limited access to food, or severe but localized problems. Accordingly, the list of countries requiring external assistance is organized into three broad, not mutually exclusive, categories:
•Countries facing an exceptional shortfall in aggregate food production/supplies as a result of crop failure, natural disasters, interruption of imports, disruption of distribution, excessive post‑harvest losses, or other supply bottlenecks.
•Countrieswithwidespread lack of access, where a majority of the population is considered to be unable to procure food from local markets, due to very low incomes, exceptionally high food prices, or the inability to circulate within the country.
•Countrieswithsevere localized food insecurity due to the influx of refugees, a concentration of internally displaced persons, or areas with combinations of crop failure and deep poverty.
2 Countries facing unfavourable prospects for current crops are countries where prospects point to a shortfall in production of current crops as a result of a reduction of the area planted and/or yields due to adverse weather conditions, plant pests, diseases and other calamities.
Countries with unfavourable prospects for current crops2 (total: 4 countries)
AFRICA (3 countries)
Central African RepublicWidespread conflict, which caused large-scale displacements, the loss and depletion of households’ productive assets and input shortages, continues to weigh on 2016 production prospects
Kenya +Late and erratic October-to-December rains severely affected prospects for 2016 “short-rains” season crops in southern and coastal lowland areas
Somalia +Late and erratic October-to-December rains severely affected prospects for 2016 “deyr” season crops in most southern and central areas
ASIA (1 country)
Timor-LesteCereal production prospects indicate a reduced 2016 crop for the second consecutive year
NepalLingering impact of the 2015 earthquake and localized floods in 2016• An earthquake struck the country in April 2015, mostly
impacting central and western parts and resulting in the loss of nearly 9 000 lives.
• Despite overall improved prospects for 2016 cereal production, localized flooding in several locations have caused some damage to the summer crops.
Pakistan +Population displacement and localized cereal production shortfalls• As of October 2016 an estimated 1.3 million Afghan
refugees remain displaced in northern Pakistan, due to recurrent insecurity.
• In Tharparkar District and the surrounding areas of Sindh Province, the drought‑affected cereal production and the loss of livestock for the third consecutive year has aggravated food insecurity and caused acute malnutrition.
LATIN AMERICA AND THE CARIBBEAN (1 country)
SEVERE LOCALIZED FOOD INSECURITY
Haiti +An estimated 1.4 million people are in need of immediate humanitarian assistance, due to the impact of Hurricane Matthew that struck the country in early October 2016 • Grand’Anse, Nippes and Sud were the most affected
departments.
OCEANIA (1 country)
SEVERE LOCALIZED FOOD INSECURITY
Papua New GuineaLingering impact of weather events on agricultural production • Severe localized staple food production shortfalls in
2016, following the prolonged drought linked to the 2015/16 El Niño episode, are expected to worsen the food insecurity situation of vulnerable groups, particularly in the Highlands Region.
No. 4 n December 20166
Crop Prospects and Food Situation
Global Production Overview1
CEREALS 2016FAO’s latest forecast for 2016 world
cereal production stands at 2 578 million
tonnes, 1.7 percent (44 million tonnes)
above last year’s output, mainly resting
on larger maize and, to a lesser extent,
wheat crops.
COARSE GRAINS 2016Global coarse grains production in 2016
is forecast at 1 330 million tonnes,
1.7 percent (22.7 million tonnes) higher
than the previous year. Most of this year’s
rise is accounted for by a larger global
maize output, forecast at 1 027 million
tonnes, 2.1 percent (21.4 million tonnes)
above the level in 2015. The bulk of this
increase is reflective of yield‑driven growth
for the United States of America’s
output, estimated at a record high.
Notable year‑on‑year production gains are
also estimated in the European Union,
India and Ukraine, largely resulting from
improved weather conditions that boosted
yields. These increases more than offset
reductions in Brazil and Southern African
countries due to El Niño‑related dry
weather, as well as in China (Mainland),
where the removal of high support prices
prompted farmers to shift away from
maize cultivation.
Global production of barley in
2016 is forecast at 145 million tonnes,
1.7 percent (2.5 million tonnes) down on
the previous year. The decrease is almost
entirely on account of lower productions
in Morocco and Turkey resulting from
dry weather. Contractions in output
are also expected in Argentina and
the United States of America. These
reductions are expected to more than
outweigh the small production gains
estimated in Australia, the Russian
Federation and Ukraine.
The forecast for world sorghum
production stands at 63.8 million tonnes
in 2016, virtually unchanged from the
previous year. Larger outputs in India
and the Sudan are anticipated to offset a
near 3.4‑million‑tonne cut in the forecast
for the United States of America’s
production.
WHEAT 2016With the bulk of the wheat crop already
harvested, FAO’s forecast for world wheat
production in 2016 stands at 749 million
tonnes, 1.9 percent (14 million tonnes)
more than in 2015. The larger output
mostly reflects production gains in North
America, where favourable weather
boosted yields in the United States
of America and Canada, resulting in a
combined 10‑million‑tonne year‑on‑year
increase. Large production gains are also
GLO
BA
L PR
OD
UC
TIO
N O
VER
VIE
W
1 For further information please see FAO’s latest global Cereal Supply and Demand Brief and the Food Price Monitoring and Analysis Bulletin.
Table 1. World cereal production1 (million tonnes)
20142015
estimate2016
forecastChange: 2016 over 2015 (%)
Asia 1 116.1 1 118.6 1 128.2 0.9Far East 1 019.8 1 014.2 1 023.9 1.0Near East 64.4 70.5 67.5 -4.2CIS in Asia 32.0 33.9 36.7 8.4
Africa 175.9 168.9 161.6 -4.3North Africa 33.1 37.3 28.7 -23.0West Africa 52.6 54.1 56.3 3.9Central Africa 4.7 4.5 4.5 1.1East Africa 51.6 46.1 48.7 5.5Southern Africa 34.0 26.8 23.4 -12.6
Central America and Caribbean 42.0 40.4 42.9 6.4
South America 179.1 186.4 169.6 -9.0
North America 491.3 482.9 531.7 10.1
Europe 523.7 498.3 500.9 0.5European Union 330.6 313.3 299.5 -4.4CIS in Europe 178.5 172.4 188.6 9.4
Oceania 36.9 38.4 43.0 11.9
World 2 565.0 2 533.8 2 577.9 1.7Developing countries 1 454.8 1 458.8 1 446.3 -0.9Developed countries 1 110.1 1 075.0 1 131.6 5.3
RICE 2016FAO’s forecast of world rice production in
2016 now stands at an all‑time high of
498.5 million tonnes (milled basis). This
level would represent a 7.2‑million‑tonne
annual upturn, marking the first global
production expansion since 2013.
Much of the expected growth would
reflect a 1.5 percent recovery in Asia’s
production to 450.7 million tonnes,
mirroring the positive impact of the more
normal weather patterns that followed
the dissipation of the El Niño weather
phenomenon midway through the year.
The bulk of the growth would rest on
an increase in India, although sizeable
contributions are also likely to come
from China (Mainland), Nepal, the
Philippines and Thailand.
Despite some flooding problems,
growing conditions have also proven
conducive across Northern Hemisphere
Africa, where the rice output is seen
at a fresh peak of 19.8 million tonnes.
By contrast generally poor results were
estimated in southern parts of Africa,
where crops were adversely impacted by
poor rains. The outlook is more subdued
for Latin America and the Caribbean,
as a combination of unfavourable
weather and prospects of reduced
margins depressed output in several
South American producers, most notably
Brazil. As a result, 2016 production in
the region is seen at a five‑year low of
17.7 million tonnes. In North America,
notwithstanding disruptions posed by
extensive August floods, production
in the United States of America is
set to rebound to its second highest on
record, as poor margins for competing
crops instigated a surge in plantings.
Elsewhere in the world, prospects are
positive for the European Union and
the Russian Federation, owing to a
generally conducive growing climate,
which would more than compensate for a
slump in production in Australia linked to
insufficient and costly water supplies for
irrigation.
CEREALS 2017Looking further ahead, in the Northern
Hemisphere, planting of the 2017 winter
wheat crop in the European Union is
nearly complete under generally good
conditions, with the crop entering
dormancy in northern parts. In the
United States of America, although
beneficial weather has improved crop
conditions compared to the same period
last year, low price prospects are likely
to have resulted in a contraction in area
planted. In the Russian Federation
and Ukraine, the 2017 production
outlook is mostly favourable on account
of beneficial weather and increased
plantings. In India and Pakistan, early
projections point to a larger 2017 crop,
as improved water availability for the
mainly irrigated wheat crop is expected
to have instigated an expansion in
plantings. The outlook in China
(Mainland) is similarly positive, as good
weather conditions facilitated fieldwork
and benefited the establishment of the
early‑planted wheat crop.
Table 2. Basic facts of world cereal situation (million tonnes)
2014/152015/16 estimate
2016/17 forecast
Change: 2016/17 over 2015/16 (%)
PRODUCTION 1
World 2 565.0 2 533.8 2 577.9 1.7Developing countries 1 454.8 1 458.8 1 446.3 -0.9Developed countries 1 110.1 1 075.0 1 131.6 5.3
TRADE 2
World 378.7 396.2 388.5 -2.0Developing countries 115.4 132.0 118.6 -10.2Developed countries 263.3 264.2 269.9 2.1
UTILIZATION
World 2 498.6 2 518.4 2 565.9 1.9Developing countries 1 607.9 1 634.3 1 655.6 1.3Developed countries 890.7 884.1 910.2 2.9
Per caput cereal food use (kg per year) 148.8 148.7 148.8 0.1
STOCKS 3
World 655.8 661.2 670.4 1.4Developing countries 490.5 494.7 476.6 -3.6Developed countries 165.3 166.5 193.7 16.3
WORLD STOCK-TO-USE RATIO (%) 26.0 25.8 25.6 -0.8
Note: Totals and percentage change computed from unrounded data.1 Data refer to calendar year of the �rst year shown and include rice in milled terms.2 For wheat and coarse grains, trade refers to exports based on July/June marketing season. For rice, trade refers to exports based on the calendar year of the second year shown. 3 Data are based on an aggregate of carryovers level at the end of national crop years and, therefore, do not represent world stock levels at any point in time.
No. 4 n December 20168
Crop Prospects and Food Situation
In the Southern Hemisphere, the
2017 summer cereal crop is being
sown. Maize plantings in Argentina
and Brazil are forecast to increase, as
prospects of improved returns have
encouraged farmers to expand sowings,
with favourable weather further boosting
the production outlook. In South
Africa, favourable weather conditions
continue to point to a strong production
rebound from the drought‑reduced
2016 maize harvest, with 2017 maize
plantings forecast to increase by nearly
one‑third over last year’s level. With a
few exceptions, sowing operations of
the 2017 paddy crops have similarly
progressed favourably across the
Southern Hemisphere, with expectations
of increased area and yield improvements
relative to last year’s El Niño depressed
levels.
GLO
BA
L PR
OD
UC
TIO
N O
VER
VIE
W
No. 4 n December 2016 9
Crop Prospects and Food Situation
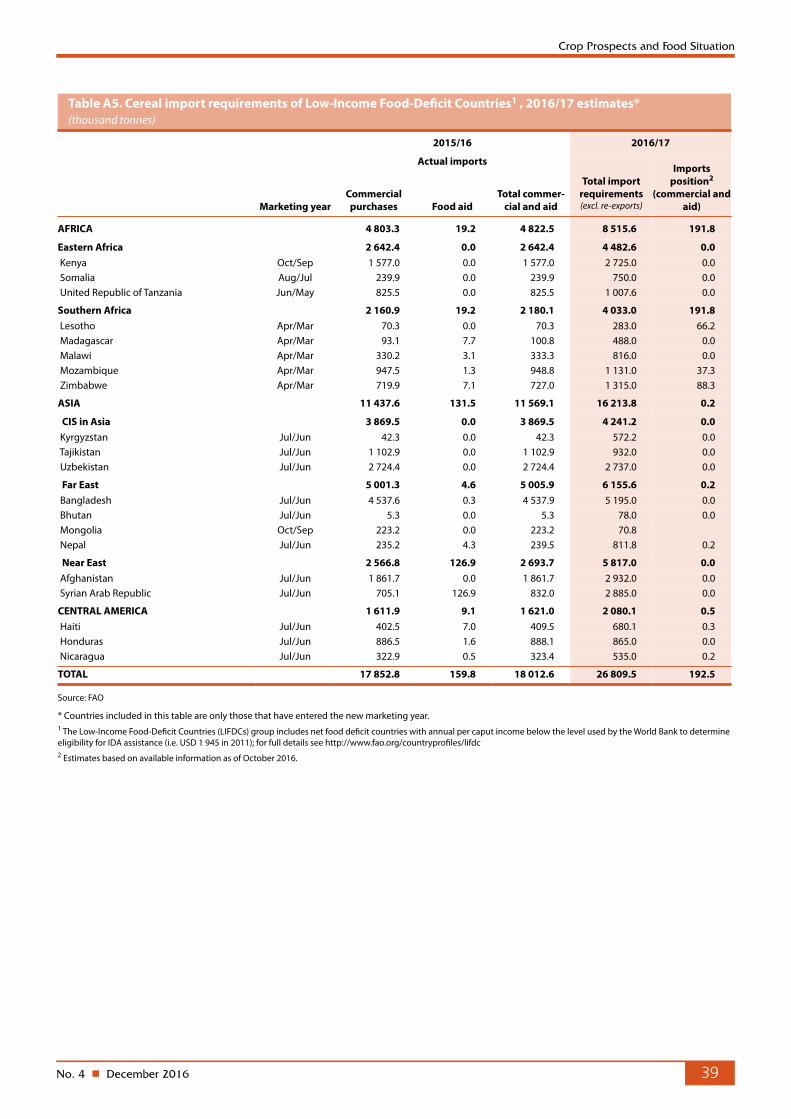
Low-Income Food-Deficit Countries Food Situation Overview2
2 The Low-Income Food-Deficit Countries (LIFDCs) group includes net food deficit countries with annual per caput income below the level used by the World Bank to determine eligibility for IDA assistance (i.e. USD 1 945 in 2011). The current list of the LIFDCs stands at 54 countries, one country less than in 2014 list but with some changes. The Congo, the Philippines and Sri Lanka all graduated out based on income criterion (for the Philippines in particular partly due to the World Bank revision of income data). The 2015 list of LIFDCs also includes South Sudan, for which data were previously unavailable, and the Syrian Arab Republic, which was previously taken off the list, but now does not satisfy the three criteria for exclusion. For full details see: http://www.fao.org/countryprofiles/lifdc/en/
Higher outputs in West Africa and India further augment cereal production of LIFDCs in 2016 FAO’s latest forecast for the aggregate
cereal production of Low‑Income
Food‑Deficit Countries (LIFDCs) in 2016
has been revised upward by 1 percent
(4.4 million tonnes) since the previous
issue of this publication in September,
to 433.9 million tonnes, implying a near
20‑million‑tonne increase on a yearly
basis. The recent increase is reflective of
upward adjustments to the forecasts in
West African countries and in India.
The aggregate production estimate
for LIFDCs in sub-Saharan Africa
stands at 117.7 million tonnes in 2016,
3.4 percent higher than the previous
year’s level. Improved cereal harvests in
East and West Africa are mainly behind
this year’s larger crop, mostly reflective
of beneficial weather conditions that
boosted yields, with large increases
forecast in Mali and the Sudan. In
Central Africa cereal production is
anticipated to remain unchanged and at
near‑average levels in 2016, as conflicts
continued to contain and depress
production despite generally beneficial
weather. In Southern Africa, with the
main harvest concluded earlier in the
year, 2016 production is estimated to be
sharply down from the five‑year average
due to El Niño‑related dryness.
LOW
-INC
OM
E FOO
D-D
EFICIT C
OU
NTR
IES
Table 3. Basic facts of the Low-Income Food-De�cit Countries (LIFDCs) cereal situation (million tonnes, rice in milled basis)
Utilization 463.3 464.6 477.7 2.8Food use 370.9 375.8 383.0 1.9 excluding India 178.5 182.5 186.1 2.0Per caput cereal food use (kg per year) 146.6 145.9 146.1 0.1 excluding India 144.5 144.3 143.8 -0.3Feed 36.1 35.7 36.5 2.3 excluding India 21.5 21.0 21.1 0.5
End of season stocks2 93.9 82.5 78.1 -5.3 excluding India 41.6 39.8 38.5 -3.1
1 Data refer to calendar year of the �rst year shown.2 May not equal the di�erence between supply and utilization because of di�erences in individual country marketing years.
Table 4. Cereal production1 of LIFDCs(million tonnes)
20142015
estimate2016
forecastChange: 2016 over 2015 (%)
Africa (37 countries) 119.7 113.8 117.7 3.4East Africa 51.5 46.1 48.6 5.5Southern Africa 11.0 9.1 8.3 -8.7West Africa 52.6 54.1 56.2 3.9Central Africa 4.6 4.4 4.5 1.2
Asia (12 countries) 316.1 299.5 314.4 5.0CIS in Asia 10.5 10.2 10.2 -0.1Far East 295.6 279.4 295.5 5.8 - India 244.4 228.9 243.8 6.5Near East 10.0 9.9 8.7 -11.9Central America and the Caribbean (3 countries) 1.5 1.2 1.7 40.8
Oceania (2 countries) 0.0 0.0 0.0 0.0
LIFDC (54 countries) 437.3 414.6 433.9 4.7
Note: Totals and percentage change computed from unrounded data.1 Includes rice in milled terms.
No. 4 n December 201610
Crop Prospects and Food Situation
Aggregate production of LIFDCs in
Asia is forecast at 314.4 million tonnes,
up 5 percent (14.9 million tonnes)
compared to the level in 2015. The
bulk of this year’s increase stems from
a 15‑million‑tonne recovery in India’s
output, reflecting normal monsoon
patterns that resulted in a rebound in
yields to average levels. Small production
gains are expected elsewhere in the
Table 5. Cereal imports of LIFDCs(thousand tonnes)
2014/15 2015/16 or 2016 2016/17 or 2017
or 2015
Actual
importsImport
forecastof which food aid
Import requirement 1
of which food aid
Africa (37 countries) 32 326 32 159 1 245 33 557 1 021East Africa 10 459 10 671 873 10 551 702Southern Africa 2 718 2 891 37 4 033 42West Africa 17 247 16 827 178 17 032 119Central Africa 1 903 1 770 156 1 941 157
Asia (12 countries) 19 601 22 894 803 22 490 809CIS in Asia 4 138 4 387 1 4 241 1Far East 6 455 8 335 201 8 132 198Near East 9 007 10 172 602 10 117 610Central America and the Caribbean (3 countries) 1 973 2 248 37 2 080 14
Note: Totals computed from unrounded data.1 The import requirement is the di�erence between utilization (food, feed, other uses, export plus closing stocks) and domestic availability (production plus opening stocks).
Larger requirements in Southern Africa boosts aggregate LIFDC import forecast in 2016/17 The forecast for
aggregate cereal imports
by LIFDCs in the 2016/17
marketing year points to
a 1.4 percent increase
compared to the previous
year, mostly reflecting
higher needs in Southern
Africa following the sharp
production decline in
2016. Imports by LIFDCs
in West and Central
Africa are also foreseen to
rise moderately, while in
East Africa the favourable
production outlook
contained increases. In Asia, cereal imports
are expected to decline in Far East and CIS
Asian countries, as a result of recoveries
in domestic outputs. In the Near East the
conflict continues to constrain import
capacities, although food aid needs are
likely to rise. In Central America, the partial
recovery in cereal production this year
is expected to instigate a drop in import
needs.
LOW
-IN
CO
ME
FOO
D-D
EFIC
IT C
OU
NTR
IES
subregion, notably in Nepal and similarly
due to weather‑augmented yields. In
the Near East, production is forecast
to be well below the five‑year average
and slightly down from 2015. Despite
generally favourable weather, the
conflicts in Afghanistan, the Syrian
Arab Republic and Yemen continued
to severely undermine the agriculture
sector.
No. 4 n December 2016 11
Crop Prospects and Food Situation
Regional reviews
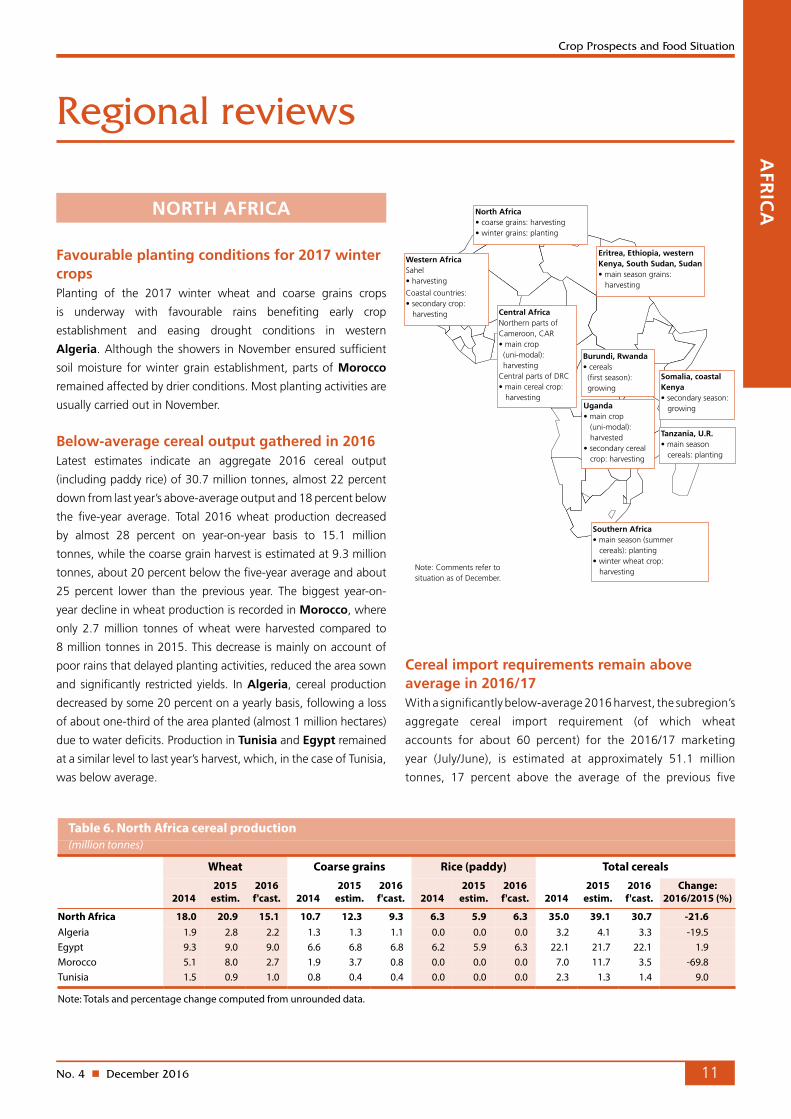
Cereal import requirements remain above average in 2016/17With a significantly below‑average 2016 harvest, the subregion’s
aggregate cereal import requirement (of which wheat
accounts for about 60 percent) for the 2016/17 marketing
year (July/June), is estimated at approximately 51.1 million
tonnes, 17 percent above the average of the previous five
NORTH AFRICA
Favourable planting conditions for 2017 winter crops Planting of the 2017 winter wheat and coarse grains crops
is underway with favourable rains benefiting early crop
establishment and easing drought conditions in western
Algeria. Although the showers in November ensured sufficient
soil moisture for winter grain establishment, parts of Morocco
remained affected by drier conditions. Most planting activities are
usually carried out in November.
Below-average cereal output gathered in 2016 Latest estimates indicate an aggregate 2016 cereal output
(including paddy rice) of 30.7 million tonnes, almost 22 percent
down from last year’s above‑average output and 18 percent below
the five‑year average. Total 2016 wheat production decreased
by almost 28 percent on year‑on‑year basis to 15.1 million
tonnes, while the coarse grain harvest is estimated at 9.3 million
tonnes, about 20 percent below the five‑year average and about
25 percent lower than the previous year. The biggest year‑on‑
year decline in wheat production is recorded in Morocco, where
only 2.7 million tonnes of wheat were harvested compared to
8 million tonnes in 2015. This decrease is mainly on account of
poor rains that delayed planting activities, reduced the area sown
and significantly restricted yields. In Algeria, cereal production
decreased by some 20 percent on a yearly basis, following a loss
of about one‑third of the area planted (almost 1 million hectares)
due to water deficits. Production in Tunisia and Egypt remained
at a similar level to last year’s harvest, which, in the case of Tunisia,
was below average.
AFR
ICA
North Africa •coarsegrains:harvesting•wintergrains:planting
Southern Africa•mainseason(summer cereals): planting•winterwheatcrop: harvesting Note: Comments refer to
Note: Totals and percentage change computed from unrounded data.1 Total cereals includes wheat, coarse grains and rice (paddy).
No. 4 n December 2016 13
Crop Prospects and Food Situation
However, the decline in production in the northeast was offset
by favourable weather and increased production in non‑affected
states. The aggregate cereal harvest in West Africa is expected to
be about 12 percent above the average of the previous five years,
mostly reflecting the record crops in the Sahelian countries.
Cereal prices stable or declining and generally at low levels, except in Nigeria In the Sahel, coarse grain prices remained unchanged or declined
in October and November, reflecting increased supplies from the
2016 harvests and adequate carryover stocks from last year’s
production. In Burkina Faso and Mali, millet and sorghum prices
were stable or declined in November but remained slightly above
their year‑earlier levels. In Niger, coarse grain prices dropped
steeply in most markets, notably millet prices in the capital,
Niamey, which declined by about 18 percent in the two months
to November. Prices, however, remained at levels well above
those of a year earlier after sustained increases in the previous
months, with seasonal trends exacerbated by concerns about
crop performance in some areas. In Chad, coarse grain prices
declined or remained stable in October, but were well below
their levels of a year earlier reflecting adequate regional supplies
and imports from neighbouring countries as well as favourable
prospects for the 2016 cereal production.
In coastal countries along the Gulf of Guinea, harvesting of the
2016 first season crops has put significant downward pressure on
prices in some countries, particularly in Benin and Togo where
maize prices in most markets declined further in October and
were below year‑earlier levels. In Nigeria, new supplies from
the 2016 harvest in the southern part of the country halted the
strong upward price trend of the previous months. However,
despite the generally favourable 2016 crop prospects in the
key‑producing regions of the north, a weak currency and civil
insecurity that continues to disrupt market activities kept prices at
record or near‑record highs. The depreciation of the Nigerian naira
also continues to affect price trends and trade flows, supporting
regional import demand for Nigerian cereals, which has resulted
in increased exports to neighbouring countries and consequently
exerted significant pressure on domestic food supplies. Moreover,
the currency weakness has increased fuel and input costs, and led
to reduced imports from neighbouring countries, which is affecting
households’ income and food security, notably in the Sahelian
countries that usually export livestock and cash crops to Nigeria.
Food security affected by civil insecurityIn spite of two consecutive years of above‑average cereal
harvests, the humanitarian situation remains critical, mainly
due to the continuing civil conflict in northern Nigeria, which
has resulted in large population displacements, both internally
and in the neighbouring countries of Cameroon, Chad and
the Niger. According to the United Nations Office for the
Coordination of Humanitarian Affairs (OCHA), about 2 million
people have been internally displaced. The conflict has also
caused widespread disruption to agricultural and marketing
activities. The recent Cadre Harmonisé (CH) analysis held in
November 2016, about 8 million people in Nigeria require
urgent life‑saving and livelihood‑saving interventions, including
about 6.2 million people in CH Phase 3: “Crisis”, about
1.8 million people in CH Phase: 4 “Emergency” and 55 000
people in CH Phase: 5 “Catastrophe”. The number of people in
need of urgent assistance is projected to increase to 11 million
between June and August 2017. Although the population
in Phase 4 “Emergency” is spread in five states, the majority
or 77 percent are located in the Northern Eastern states and
a further 23 percent located in Yobe areas affected by the
conflict. The vast majority (96 percent) of the population in
CH Phase 5: “Catastrophe” is located in Borno.
Chad has also seen increased numbers of refugees and
returnees due to the civil conflict in the Sudan, the Central
African Republic, Nigeria and Libya. Overall, about 388 000
refugees are estimated to be living in Chad, while about 95 000
Chadians have returned to their country. The refugee crisis
has exacerbated an already fragile food security situation. In
the Ebola Virus Disease‑affected countries of Guinea, Liberia
and Sierra Leone, in spite of the relatively low impact of the
outbreak on agricultural production in the previous years, the
lingering negative impact on economic activities and livelihoods
AFR
ICA
20152014 2016
14000
16000
18000
20000
22000
24000
26000
NOSAJJMAMFJDNOSAJJMAMFJDN
Niger Niamey
Figure 1. Millet prices in selected West Africanmarkets
CFA Franc BCEAO (XOF)/100kg Burkina Faso Ouagadougou
Source: Afrique Verte.
Mali Bamako
No. 4 n December 201614
Crop Prospects and Food Situation
continues to affect households’ food security. As a result of the
shocks mentioned above, the aggregate subregional number of
people in Phase 3: “Crisis” and above is estimated to be over
10 million, including 8 million in Nigeria according to the latest
“Cadre Harmonisé” analysis.
CENTRAL AFRICA
Average to below-average 2016 cereal harvest forecast, amid continued conflict in some countriesIn the Central African Republic, the bulk of the cereal harvest
was recently concluded except in some areas of the south
where harvesting of the secondary season crops has just started.
Note: Totals and percentage change computed from unrounded data.1 Total cereals includes wheat, coarse grains and rice (paddy).
No. 4 n December 2016 15
Crop Prospects and Food Situation
were 60 percent higher than 12 months earlier, mainly due to
reduced imports from neighbouring Zambia. In Gabon, prices of
imported wheat, the most important staple for urban consumers,
increased by 14 percent between August and October, when they
where 5 percent higher than their year‑earlier levels. Prices of
imported rice increased by 9 percent in September, subsequently
leveling off in October, and were 14 percent higher on a yearly
basis. In the Congo, the inflation rate is estimated at 4 percent in
2016, as prices of several commodities, including petrol, increased
due to the instability in the neighbouring Democratic Republic of
the Congo, which has disrupted trade flows. For instance, prices
of imported rice increased by about 10 percent on a monthly basis
in most monitored markets in October. By contrast, in Cameroon
the inflation rate in 2016 is estimated at 2.2 percent, down from
2.8 percent in the previous year. Prices of locally produced maize, the
most consumed cereal, declined by up to 18 percent between June
and September reflecting increased supplies from the main season
harvest. Maize prices in September were 2‑6 percent higher than
their year‑earlier levels. Prices of imported wheat, mostly consumed
in urban areas, were stable and at around their year‑earlier levels in
recent months in the capital, Yaoundé, and in Douala, the largest
urban centre and the main entry port for imports.
Conflict worsens food insecurity in the Central African Republic, Cameroon and parts of the Democratic Republic of the CongoContinued civil insecurity in the Central African Republic and
in the eastern Democratic Republic of the Congo has resulted in
massive population displacements and hindered access to food
for the affected population. As of October 2016, about 468 500
refugees from the Central African Republic have sought
refuge in neighbouring Cameroon (274 000), the Democratic
Republic of the Congo (96 500), Chad (68 700) and the Congo
(29 300), straining the already limited resources of the hosting
communities. The IDP caseload in the Central African Republic,
which declined in 2016 following a relative improvement of
the security situation in some areas of the country, increased
by about 36 000 in October, when it was estimated at about
421 000. The new displacements have been caused by the
resurgence of inter‑communal violence in Northern Vakaga and
northwestern Ouham‑Pendé prefectures. Three consecutive years
of reduced harvests, compounded by access constraints due to
market disruptions and declining purchasing power, resulted
in an alarming food security situation. According to the latest
Integrated Food Security Phase Classification (IPC), valid for the
period from August to December 2016, about 2 million people
(40 percent of the total population) are in need of urgent
assistance (IPC Phase 3: “Crisis” and IPC Phase 4: “Emergency”).
Ten out of sixteen prefectures are in IPC Phase 3: “Crisis”,
while Vakaga Prefecture, Kabo and Batangafo subprefectures
Pendè Prefecture) and Mbrès subPrefecture (Nana‑Gribizi
Prefecture) are in IPC Phase 4: “Emergency”. Similarly, in the
Democratic Republic of the Congo, the escalation of the
civil conflict since 2013, especially in the eastern provinces, has
severely damaged local livelihood systems and caused massive
population displacements. As of late September 2016, the IDP
caseload was estimated at 1.9 million, 100 000 more than the
AFR
ICA
201620152014
400
500
600
700
800
900
1000
1100
1200
1300
1400
1500
1600
OSAJJMAMFJDNOSAJJMAMFJDNO
Figure 2. Retail prices in Libreville, Gabon
CFA Franc/Kg
Source: Ministère de l’Economie et de la Prospective.
Wheat flour
Rice
201620152014
200
300
400
500
600
700
800
900
OSAJJMAMFJDNOSAJJMAMFJDNO
Goma (cassava flour)
Lubumbashi (maize flour)
Figure 3. Retail prices of cassava (flour) and maize(flour) in selected Democratic Republic of theCongo markets
CFA Franc/Kg
Source: Institut National de la Statistique, WFP/VAM
No. 4 n December 201616
Crop Prospects and Food Situation
previous estimate from April. About 40 percent of the displaced
population is located in North Kivu and the rest mainly reside
in South‑Kivu, Maniema and the former Katanga Province. The
country also hosts 96 500 refugees from the Central African
Republic, 60 300 from South Sudan and 33 900 from Burundi.
According to the latest available IPC analysis, in June 2016, the
number of people in acute food insecurity and livelihood crisis
(IPC Phase 3: “Crisis” and IPC Phase 4: “Emergency”) was
estimated at about 5.9 million, about 10 percent less than a year
earlier, due to a relative improvement in the security situation in
the conflict‑affected Tanganyika, Sud‑Kivu, Nord‑Kivu, Maniema
and Ituri provinces, where more than half of the total national
food insecure population reside. However, armed clashes in late
October‑early November in the Dibaya territory (Kasaï Central
Province) caused the destruction of standing crops and food
stocks and affected about 100 000 individuals, thus bringing the
food insecure total caseload to 6 million. In Cameroon, as of
mid‑November 2016, the Far North Region hosted about 86 000
refugees fleeing civil unrest in Nigeria, which has spread into
neighbouring countries and has also resulted in the displacement
of 200 000 Cameroonians. The number of food insecure people
in Cameroon is currently estimated at 2.6 million. The area most
affected by food insecurity is the Far North Region, where the
caseload is currently estimated at 1.5 million, 100 000 more than
the previous estimate in September 2015.
EAST AFRICA
Above-average 2016 cereal output expected despite unfavourable production prospects for “short-rains” season in Somalia, Kenya and parts of UgandaHarvesting of the 2016 main season cereal crop is well underway
in Ethiopia, the Sudan, South Sudan, western Kenya and
Eritrea, while it has recently started in Burundi, Rwanda and
southern and central Uganda. Production prospects are generally
good in major cropping areas of the subregion and the 2016
aggregate cereal output is estimated at about 50 million tonnes,
over 5 percent above last year’s drought‑affected harvest and
10 percent higher than the five‑year average. This figure includes
a below‑average forecast for the secondary season harvests to
be gathered early next year in southern and central Somalia
(“deyr”), southern and coastal lowlands of Kenya (“short‑rains”)
and the northern United Republic of Tanzania (“vuli”). In
these areas, under the influence of La Niña‑like conditions, the
October‑December short rains have so far been late and erratic,
with significant negative effects on the planted area and yields
of most staple food crops. Even if rains improve during the
remainder of the season, the recovery of crops is very unlikely in
these areas and production prospects are highly unfavourable.
In Ethiopia, production prospects for the main “meher” season
crops are generally favourable in the main western growing areas.
However, lower yields are expected in the lowlands of central and
eastern Oromia Region and in Southern Nations, Nationalities,
and Peoples’ Region (SNNPR) along the Rift Valley, where the
June‑to‑September “kiremt” rains have been unfavourable. In
bi‑modal rainfall areas of SNNPR, the significant delay of the 2016
secondary “belg” harvest prevented the timely preparation of
land for “meher” crops, and consequently farmers opted to plant
short cycle crops such as wheat, teff and legumes, instead of maize
and sorghum. In parts of the highlands of Amhara, Tigray and
Oromia regions, crops have been affected by torrential rains that
resulted in waterlogging and triggered floods in some locations.
In the Sudan, cereal production is expected at an above‑average
level as seasonal rains have been mostly favourable. Some standing
crops have been affected by dry spells in September in parts of
South Kordofan and North Darfur states and by localized flooding
in Kassala, Sennar, White Nile, Blue Nile, Al Gezira and El Gadarif
states due to torrential rains between June and August. An
ongoing nationwide Government‑led crop assessment will provide
detailed production estimates. In Kenya, the 2016 “long‑rains”
season maize production is forecast at an average level as recent
beneficial rains in most surplus producing areas had a positive
effect on yields, partly offsetting the moisture deficits caused by
the prolonged dry spell between the end May and early June.
Unfavourable prospects for cereal production are reported in
South Sudan and parts of Uganda. In South Sudan, the overall
cereal output is expected at a below‑average level as insecurity
often prevented farmers accessing their land to perform adequate
cultivation practices, with frequent cases of completely abandoned
fields. Significant decreases in the planted area were observed in
Northern Bahr el Ghazal State, one of the biggest cereal‑producing
states, as a large number of people migrated to the Sudan seeking
food and income opportunities following renewed fighting since
July. However, favourable rains (with only localized floods in
Greater Upper Nile Region) and increased plantings were recorded
in some counties due to a relatively peaceful context in April/May.
National 2016 crop production estimates will be provided by a joint
FAO/WFP Crop and Food Security Assessment Mission (CFSAM)
currently deployed in the country. Similarly, crop production from
the 2016 second season is estimated at below‑average levels in
southern and central areas of Uganda as severe dry weather
conditions in October and November affected plantings and
early crop development in most areas bordering Lake Victoria. In
Burundi production of the 2017A season harvest is also expected
at below‑average levels following erratic rains and insecurity
conditions, while production prospects are mostly favourable in
Rwanda, except in some eastern areas.
AFR
ICA
No. 4 n December 2016 17
Crop Prospects and Food Situation
Poor pasture conditions in several areas of Somalia, Kenya and Ethiopia Conditions of grazing resources are significantly below average in
most of southern and central Somalia, in southern and eastern
Kenya and in southern and southeastern Ethiopia. In these areas,
pasture and water availability failed to be adequately restored
during the April‑to‑June rainy season due to poor precipitations
and they were further depleted during the July‑to‑September
dry season. Subsequently, the poor performance of the ongoing
October‑December short rainy season has caused a further
deterioration of pasture conditions. Trekking distances have
increased and so have animal concentrations, causing a quicker
depletion of the remaining pastures. As a result, livestock body
conditions are generally poor and milk production is well below
average. Drought‑related deaths of animals have also been reported
in Kilifi, Kwale and Lamu counties in southern Kenya. Rangeland
conditions are expected to remain stressed for the remainder of the
season and a faster‑than‑normal depletion is expected during the
next dry season between January and March 2017.
By contrast, pasture and water availability have significantly
improved in Afar Region and in Sitti Zone in northern Somali
Region of Ethiopia, following two consecutive seasons of
favourable rains. However, although livestock body conditions
and productivity are gradually improving, herd sizes are still well
below average due to the low birth rates and the significant
losses in 2015 as a consequence of the El Niño‑induced drought.
Cereal prices at high levelsPrices of cereals increased in recent months and in November
were above their year‑earlier levels in several countries. In
Uganda, maize prices increased by 30‑45 percent between
August and November, as normal seasonal patterns were
compounded by concerns over the performance of the second
season harvest, to be gathered from December, and sustained
export demand by neighbouring countries. As a result, November
maize prices were at record
levels and up to 30 percent
higher than 12 months earlier.
In Somalia, prices of coarse
grains remained firm in recent
months in most key markets
of central and southern areas,
as the “gu” production was
significantly reduced by erratic
rainfall. Subsequently, prices
surged by up to 50 percent in
November in most monitored
markets including the capital
Mogadishu, as seasonal trends
were exacerbated by unfavourable prospects for the “deyr”
secondary harvest. November prices were up to 60 percent
higher than 12 months earlier. In the United Republic of
Tanzania, prices of maize increased seasonally in October and
November in all monitored markets and in Dar Es Salaam, the
largest urban centre, prices were around their year‑earlier levels.
By contrast, in Arusha, located in a bi‑modal rainfall area, maize
prices in November were 26 percent higher than one year earlier,
supported by a reduced “masika” season harvest in August and
by unfavorable prospects for the “vuli” harvest, to be gathered
early next year. In South Sudan, prices of maize and sorghum
declined in the capital Juba by about 30 percent between the
peak in July and October, as newly‑harvested crops, food aid
distributions and a partial resumption of imports from Uganda
increased supplies. Subsequently, maize and sorghum prices
AFR
ICA
Table 9. East Africa cereal production (million tonnes)
1 Marketing year July/June for most countries. Rice trade �gures are for the second year shown.
No. 4 n December 2016 23
Crop Prospects and Food Situation
from the Government’s efforts to lower the large national maize
inventories. As a result, imports of barley and sorghum in the
2016/17 marketing year are forecast to fall by 43 percent to
4.6 million tonnes and 40 percent to 5 million tonnes, respectively.
Similarly, maize imports by China (Mainland) are forecast to
decrease by almost 40 percent to 2 million tonnes. Aggregate
wheat imports in 2016/17 are set to increase to a record level
of 48.8 million tonnes, up 8 percent from last year’s high level,
mainly reflecting increased demand from Indonesia for low
quality wheat for animal feed . In the case of rice, imports in the
2017 calendar year are projected to decrease by 2 percent from
the reduced level in 2016, reflecting cuts by traditional buyers,
such as the Philippines and Indonesia, where purchases may be
discouraged by increased local availabilities and public steps to
advance self‑sufficiency policies. Aggregate cereal exports in
2016/17, consisting primarily of rice, are forecast to decrease
for the second consecutive year to 39.4 million tonnes, marking
the lowest level since 2011/12. Rice deliveries are expected to
recover only slightly in the 2017 calendar year, mostly on account
of expected subdued global demand.
Rice prices followed mixed trends, while wheat prices were stableDomestic prices of rice, in local currencies, have followed mixed
trends across the subregion in recent months. In Thailand, domestic
rice prices declined for the fourth consecutive month in November
and were below their year‑earlier levels as a result of a slow pace
of exports and harvest pressure. In an attempt to prevent prices
from decreasing further, the Government of Thailand implemented
a number of measures, including the temporary suspension of
Government stock releases and a mortgaging programme geared
at delaying farmer sales of main crop supplies. In Myanmar,
rice prices also declined further amid new crop arrivals and low
demand from China, the country’s main buyer, and were almost
20 percent down in November compared to a year earlier. In India,
prices eased with improved supplies from the bumper 2016 main
season harvest and a weak demand for export, although ongoing
Government procurement purchases limited the declines. In China,
the Philippines and Indonesia, rice prices were generally stable
and close to their year‑earlier levels reflecting adequate domestic
availabilities. By contrast, prices increased since September in Sri
Lanka, with seasonal tightness exacerbated by a reduction in the
2016 secondary “yala” crop. As for wheat and wheat flour, prices
remained stable or increased slightly and were around or below
their year‑earlier levels. In China, Indonesia and Sri Lanka, prices
were stable amid adequate domestic availabilities. Similarly, in
Bangladesh prices were unchanged and remain well below their
year‑earlier levels following large imports and continued Open
Market Sales (OMS) by the Government. By contrast, prices were
firmer in India, due to lower stocks compared to last year and
strong domestic demand. In an attempt to prevent sharp price
increases, the Government of India announced, in mid‑October,
its plans to distribute 1 million tonnes of wheat through the OMS
in addition to the 2.8 million tonnes which were released since the
beginning of the 2016/17 marketing year in April. In Pakistan,
prices of wheat strengthened following seasonal patterns, but
remained below their year‑earlier levels due to good availabilities
following a bumper 2016 crop.
ASIA
20152014 2016
0.2
0.3
0.4
0.5
0.6
0.7
0.8
0.9
NOSAJJMAMFJDNOSAJJMAMFJDN
USD/kg
Figure 6. Rice retail prices in selected Far Eastcountries
Sri Lanka (white rice) Colombo
Sources: Department of Census and Statistics, Sri Lanka; Ministry of Consumer Affairs, India; Bureau of Agriculture Statistics, Philippines; Agroinfo, Viet Nam.
Philippines (regular milled rice) national average
Viet Nam (wholesale, 25% broken milled) Dong Thap
India New Delhi
20152014 2016
0.2
0.3
0.4
0.5
0.6
0.7
0.8
NOSAJJMAMFJDNOSAJJMAMFJDN
USD/kg
Figure 7. Wheat and wheat flour retail prices in selected Far East countries
Sources: Pakistan Bureau of Statistics; Ministry of Consumer Affairs, India; Management Information System and Monitoring, Bangladesh; National Bureau of Statistics of China.
India (wheat)Mumbai
Pakistan (wheat)Lahore
BangladeshDhaka (wheat flour)
China (wheat flour)Average of main 50 cities
No. 4 n December 201624
Crop Prospects and Food Situation
NEAR EAST
Planting of 2017 winter season crops underway Land preparation and planting of the 2017 winter cereal crops
are proceeding under mixed conditions. As of late November,
the major winter wheat producing areas in central and
southeastern parts of Turkey suffered from drought, with rainfall
deficits between early September and the end of November
ranging from 50 to 65 percent. Similarly, early season drought
was reported in central and southern Iraq and western Iran
(Islamic Republic of). Elsewhere in the region, conditions
remained favourable for planting and establishment.
Above-average aggregate cereal crop harvested in 2016 The aggregate subregional 2016 cereal output (including paddy
rice) is put at 69.2 million tonnes, an decrease of about 4 percent
from last year’s exceptional crop but 3 percent above the five‑year
average. In Turkey, the main producer in the subregion, official
estimates indicate a 10 percent decrease in cereal production in
2016 compared to last year, of about 34.9 million tonnes, including
20.5 million tonnes of wheat (10 percent below the output in
2015) and 13.4 million tonnes of coarse grains (11 percent down
from the 2015 harvest). In Iran (Islamic Republic of), the second
biggest wheat producer in the subregion, the 2016 production of
13.5 million tonnes exceeds the 2015 harvest by 2 million tonnes
and the five‑year average by 38 percent. In Afghanistan, despite
higher‑than‑usual winter temperatures that diminished water
moisture, an about‑average 4.6 million tonnes of wheat where
harvested. In Iraq, the wheat harvest is estimated at an average
level of 3 million tonnes.
In the Syrian Arab Republic, the country’s agricultural
productive capacity has been severely eroded by several years of
conflict, which contributed to the lack of inputs and damage to
agricultural machinery, irrigation systems and storage facilities.
While the main growing area of Hassakeh in the east of the
country received above‑average rainfall, weather conditions were
less favourable in other cereal‑producing areas in Aleppo, Idlib
and Homs. A joint FAO/WFP Crop and Food Security Assessment
Mission (CFSAM) was conducted in June 2016. The Mission
estimated the 2016 wheat harvest at about 1.5 million tonnes,
some 37.5 percent lower than the relatively favourable harvest of
2015 and approximately 55 percent lower than the pre‑conflict
average (2007‑2011). Being predominantly rainfed and more
resilient than wheat, barley production was estimated at
877 000 tonnes, almost 10 percent lower than the record crop of
the last year, but about one‑quarter higher than the pre‑conflict
average (2007‑2011).
In Yemen, in many key producing areas such as Taiz and Sana’s,
rainfall in 2016 has been better than last year, boosting soil moisture
levels. However, as a result of the persistent conflict, almost all
governorates report shortage of agricultural supplies as well as high
prices of inputs with negative implications for the current agriculture
season. Most agricultural activities, particularly related to irrigated
agriculture, suffer from high fuel prices. Many rural households
rely on casual labour as a source of income. In the current conflict
situation and to cope with increased costs of production, hired
agricultural labour is usually replaced by family labour.
Overall, the above‑average aggregate cereal production
resulted in a lowering of the cereal import requirement forecast
to about 62.7 million tonnes, nearly the same as last year and
2.5 percent below the five‑year average.
No improvement in conflict-stricken Iraq, the Syrian Arab Republic, Yemen and AfghanistanIn the Syrian Arab Republic, as of June 2016, about 9.4 million
Syrians were estimated to be in need of food assistance, up
8 percent from September 2015. The rate of the increase is
most notable in Quneitra, Dara’a, Damascus, Idleb and Aleppo
governorates, which have experienced new displacement and
worsening food access conditions. In Iraq, over 4 million people
have been displaced from their homes, of whom nearly 2 million
ASI
A
Table 13. Near East cereal production (million tonnes)
Note: Totals and percentage change computed from unrounded data.
No. 4 n December 2016 25
Crop Prospects and Food Situation
36.7 million tonnes, nearly 8.4 percent up from the already high
level of last year. Wheat, which represents more than 60 percent
of total cereal output, is forecast at 28.7 million tonnes in 2016,
2.5 million tonnes above the level in 2015.
Most of the projected cereal increase (in absolute terms)
comes from Kazakhstan, the main producer of the subregion,
where cereal production increased from 15 percent to 20.6 million
tonnes. The bulk of the projected increase is on the back of a larger
wheat output, estimated at almost 16 million tonnes, the highest
level since 2011. The larger wheat output aided the replenishment
of stocks, which at the beginning of the 2016/17 marketing
year (July/June) were estimated at their lowest level since 2009.
However, the quality of wheat is reported to be lower than last
year, following unfavourable weather during the growing period.
In Georgia, the 2016 cereal production is projected at a record
level mainly resulting from an expansion in the area planted for
wheat that is expected to boost production. In Tajikistan, the
wheat output is also forecast to increase, following the favourable
weather during the spring and summer seasons. In Turkmenistan,
the wheat output is estimated at 1.6 million tonnes, 14 percent
up from last year. Improved yields following favourable weather
have resulted in small year‑on‑year increases in Uzbekistan’s
cereal production. By contrast, following a contraction in wheat
plantings, total cereal production in Kyrgyzstan is estimated to
decline by 17 percent. Similarly, small production declines are
estimated in Armenia and Azerbaijan.
Cereal import requirements forecast to decline in 2016/17 marketing yearExports from Kazakhstan, the main supplier of milling wheat
in the subregion, are forecast to decrease by 5 percent to
ASIA
since January 2014, many of them repeatedly. An estimated
2.4 million people are currently food insecure, including
1.5 million facing severe food insecurity conditions. A reduced
public budget resulted in disruptions to the Government’s Public
Distribution System (PDS), the main source of food for the poorest
Iraqis, and consequently increased the vulnerability of the affected
population, particularly those who are internally displaced. In
Yemen, the Integrated Food Security Phase Classification (IPC)
from June 2016 estimates that about 51 percent of the population
(14.12 million) is under IPC “Emergency” and “Crisis” phases
due to widespread conflict and insecurity, dwindling livelihood
opportunities, a sharp downturn in the economy, and disrupted
market network and access. The actual figures, however, are
likely to be higher. In Afghanistan, according to the IPC analysis
of April 2016, 8.4 million people are classified in the acute food
insecurity crisis and emergency situation. The most food insecure
population are in Ghor, Badakhshan, Nuristan and Nangarhar
provinces. Changes in refugee policies in Pakistan have led to
steep increases in returnees: up to 400 000 undocumented
returnees and around 200 000 documented returnees will arrive
in Afghanistan by the end of 2016 putting strain on limited local
resources, particularly in the eastern province of Nangarhar.
CIS IN ASIA3
Planting of 2017 winter crops nearly complete under generally favourable weather conditionsPlanting of the 2017 winter cereal crops to be harvested next
year is almost complete under generally favourable conditions.
Although in Kazakhstan cold
weather at the end of October
negatively impacted planting
activities, overall conditions of
winter cereals in the subregion
are reported to be satisfactory.
The total area planted in the
subregion is estimated to be
unchanged compared to last year.
Record cereal output estimated in 2016Harvesting of the 2016 cereal
crop is almost complete. The
subregional aggregate output
is estimated at record level of
3 Georgia is no longer a member of CIS but its inclusion in this group is maintained for the time being.
Table 14. CIS in Asia cereal production (million tonnes)
Note: Totals and percentage change computed from unrounded data.1 Total cereals includes wheat, coarse grains and rice (paddy).
No. 4 n December 201626
Crop Prospects and Food Situation
8 million tonnes in the 2016/17 marketing year (July/June),
following a reduction in grain quality. Traditional importers
of high quality wheat, such as the Islamic Republic of Iran,
Azerbaijan and China, are expected to import less Kazakh
wheat in the current marketing year. However, this decline
in shipments is expected to be partially offset by increased
exports to Afghanistan and other Central Asian countries. By
contrast, exports of barley are expected to increase as a result
of the good crop in 2016.
The aggregate subregional wheat import requirement is
expected to decrease by 1.6 percent, following better harvests in
Uzbekistan, Turkmenistan and Tajikistan.
Wheat flour prices remained generally stablePrices of wheat flour in importing countries of the subregion
remained generally stable over last three months and were
slightly below their year‑earlier levels. Despite a record harvest in
Kazakhstan, the subregion’s the main exporter, the shortage of
high quality wheat limited the decline of export prices.
In Armenia and Georgia, retail prices of wheat flour
remained virtually unchanged over the last three months and
were generally down from a year earlier reflecting adequate
supplies from the 2016 harvests and imports. Similarly, in
Tajikistan, prices of wheat flour remained unchanged in
November despite the 2016 bumper crop, but were 5 percent
below their record high values of January 2016. Despite an
estimated reduction in the 2016 wheat output, prices of wheat
flour in Kyrgyzstan declined by around 5 percent between
August and November. By contrast, in Azerbaijan, the strong
devaluation of the national currency remains the main factor for
food price increases. In November, the price of locally‑produced
wheat flour was more than 50 percent higher than in the
corresponding period of last year.
ASI
A
20162014 2015
0.4
0.5
0.6
0.7
0.8
0.9
1.0
1.1
NOSAJJMAMFJDNOSAJJMAMFJDN
USD/kg
Figure 8. Retail wheat flour prices in selected CIS in Asia countries
Sources: National Statistical Service of Republic of Armenia; National Statistical Committee of the Kyrgyz Republic; State Committee on Statistics, Republic of Tajikistan; State Statistical Committee of the Republic of Azerbaijan; National Statistics Office of Georgia.
Tajikistan (national average)
Kyrgyzstan (national average)Armenia (national average)
Azerbaijan (national average)
Georgia (national average)
No. 4 n December 2016 27
Crop Prospects and Food Situation
CENTRAL AMERICA AND THE CARIBBEAN
Recovery in yields boost wheat production in 2016 In Mexico, virtually the only wheat producer in the subregion,
the 2016 wheat production is estimated at 3.8 million tonnes,
2.7 percent up from the previous year and above the five‑year
average. The increase largely reflects a partial recovery in yields
from last year’s drought‑reduced levels as sowings were relatively
unchanged from the previous year.
Maize production in 2016 estimated at bumper level FAO’s latest forecast for the subregion’s aggregate 2016 maize
production remains relatively unchanged at 30.2 million tonnes,
higher than last year and the previous five‑year average. The
bumper 2016 maize crop mainly reflects good prospects in
Mexico, the subregion’s main producer accounting for 85 percent
of the aggregate maize output. In Mexico, the harvest of the
spring/summer maize crop is well advanced and prospects for
the season are favourable. The aggregate 2016 maize output is
anticipated to reach a record 25.6 million, reflecting the bumper
autumn/winter crop, harvested in August, and the good results
of the spring/summer crop. Elsewhere in the subregion, the
prospects for the 2016 maize crops (first and second season) are
good as the main “de primera” season, harvested in October and
which represents between 40 and 60 percent of the total maize
output in El Salvador, Guatemala, Honduras and Nicaragua,
significantly recovered from last year’s drought‑reduced levels.
Planting of the second season’s cereal crop, to be harvested from
late December, also concluded in early October under favourable
weather conditions. Production prospects are favourable as the
weather during the season has favoured crop development and
farmers received Government assistance in the form of inputs,
such as seeds and fertilizers. The current forecast puts the 2016
maize crop in the subregion, excluding Mexico, at 4.5 million
tonnes, up 18.4 percent from last year’s drought‑reduced output
and above the five‑year average.
In Haiti, cereal production was revised downward by
188 000 tonnes to 421 000 tonnes (milled rice equivalent)
following the impact of Hurricane Matthew, which made landfall
in the southwest of the country at the beginning of October and
caused significant damage to the recently‑planted cereal crops as
Note: Totals and percentage change computed from unrounded data.
LATIN
AM
ERIC
A A
ND
THE C
AR
RIB
EAN
No. 4 n December 201628
Crop Prospects and Food Situation
well as to cereal stocks that had been recently harvested. However,
this forecast assumes that yields have improved in some areas that
received above‑normal but beneficial rainfall, without incurring in
crop losses and that farmers in non‑affected departments will have
access to inputs for the second and third agricultural seasons, to
be harvested from December and February, respectively. At this
level, the 2016 cereal production is still anticipated to recover from
last year’s drought‑reduced level, but remains below the five‑year
average for a third consecutive year.
White maize prices decreased sharply in September-November period Maize prices decreased sharply in the September‑November
period, mainly reflecting new supplies from the good main season
harvest, which concluded in October, and, with the exception
of Mexico, prices were significantly below their levels from a
year earlier. The strongest declines were observed in Honduras
and Nicaragua where white maize prices declined by about
40 percent between September and November, reflecting the
strong recovery in 2016 output from last year’s drought‑reduced
level. In Haiti, prices for locally‑produced maize meal declined or
were stable in previous months reflecting new harvest supplies.
However, in Les Cayes market, in the southwest of the country that
was strongly affected by Hurricane Matthew, prices increased by
nearly 80 percent between September and November and were
more than 20 percent above their levels from November 2015,
reflecting tight supplies. White maize prices in Mexico remained
firm but at high levels that were sustained by the weak local
currency, despite the increase in this year’s production.
SOUTH AMERICA
Cereal production in 2016 estimated at high level, despite recent downward revisions reflecting significant output declines in key countriesFAO’s forecast for 2016 cereal production has been further
revised downward to 169.6 million tonnes, almost 9 percent
below last year’s record level. However, at this level the cereal
output is still anticipated to remain above the subregion’s
five‑year average. The latest downward revision mainly reflects
a much lower than previously anticipated 2016 maize crop in
Brazil, now estimated at 63.5 million tonnes, its lowest level in
more than five years. The impact of El Niño‑related dry weather
on the second season “de safrihna” maize crop was far worse
than earlier expected, causing yields and the area harvested to
decline significantly compared to the corresponding season in
2015. By contrast, the 2016 maize crop in Argentina, gathered
earlier in the year, is estimated at a record level of 39.8 million
tonnes. The removal of export controls and the weak national
currency that boosted demand for Argentine maize for export,
encouraged farmers to expand plantings. Moreover, good
weather during the season favoured crop development leading
to high yields. Elsewhere in the subregion, maize production is
anticipated to decline. In Bolivia (Plurinational State of), lower
plantings, drought conditions at the end of the main summer
season and pest infestations significantly reduced the 2016 maize
output. On 21 November, the Government declared a national
state of emergency as 162 000 families were affected by the
drought and 607 000 hectares of crop land were impacted,
including some 600 000 heads of cattle. In Chile and Paraguay,
sharp reductions in plantings, reflecting low commodity prices
and higher production costs, are anticipated to reduce this
year’s crops by at least 25 percent. In Colombia, the 2016
maize output is anticipated to remain relatively unchanged. In
Venezuela (Bolivarian Republic of), maize production in 2016
is forecast to remain at a below‑average level but above last
year’s drought‑reduced level, reflecting lower water availabilities
due to El Niño and farmers’ difficulty in accessing inputs despite
considerable Government efforts to facilitate access to seeds and
fertilizers.
The 2016 wheat crop in the subregion, harvest of which
will conclude in late December, is preliminarily estimated at
25.2 million tonnes, a record level. The increase mainly reflects
higher sowings in Argentina and Brazil, which account for
the bulk of the subregion’s wheat production, in response to
high prices and high domestic demand, particularly in the latter
country. In Chile, where the 2016 wheat crop was already
harvested in February, the latest official estimate puts production
2015 20162014
200
250
300
350
400
450
500
550
600
NOSAJJMAMFJDNOSAJJMAMFJDN
Nicaragua Managua (oriental)
Honduras Tegucigalpa
Guatemala Guatemala City
El Salvador San Salvador
USD/tonne
Figure 9. Wholesale white maize prices in selected countries in Central America
Sources: Secretaria de Agricultura y Ganaderia, Honduras; Ministerio de Agricultura, Ganadería y Alimentación, Guatemala; Ministerio agropecuario y forestal, Nicaragua, Dirección General de Economía Agropecuaria, El Salvador.
LATI
N A
MER
ICA
AN
D T
HE
CA
RR
IBEA
N
No. 4 n December 2016 29
Crop Prospects and Food Situation
at 1.7 million tonnes, 17 percent above last year’s level. By
contrast, in Paraguay, the wheat output in 2016 is anticipated
to decline by almost 25 percent to 800 000 tonnes, its lowest
level since 2013, as low commodity prices and high production
costs discouraged farmers to plant.
Planting of the 2017 maize crop is underway in several countries
of the subregion. In Argentina, maize plantings are forecasts
to increase 5.5 percent over last year’s high level reflecting the
prevailing local high prices and robust export demand. In Brazil,
planting of the first season 2017 maize crop is well advanced. Early
official estimates point to a significant increase in the area planted
over last year’s reduced level supported by high local prices and
favourable weather conditions. In Chile, planting of the 2017
maize crop is virtually concluded, official estimates are not yet
available, but the good weather conditions and prevailing high
prices are anticipated to support increased sowings. In Paraguay,
planting of the 2017 maize crop concluded in September, and
preliminary estimates point to a 3 percent contraction in the area
sown, mainly the result of low export prices. In Bolivia, planting
of the 2017 summer crop is nearly complete. Data on plantings
are not yet available, but prospects are uncertain as precipitations
were mostly below average during the September to October
period, when the bulk of the planting takes place.
Cereal exports in 2016/17 forecast below previous year’s record volume but still at high level The latest forecast for the subregion’s aggregate cereal exports
in the 2016/17 marketing year, the bulk of which is maize, has
been revised downward to 45.1 million tonnes, 21 percent
below last year’s record, but slightly above the five‑year average.
The downward revision reflects lower‑than‑anticipated maize
availabilities in Brazil, due to the reduced 2016 maize crop. In
Brazil, maize exports are forecast to decline some 48 percent
from last year’s high level in the 2016/17 marketing year (March/
February) and reach its lowest level in more than five years. By
contrast, in Argentina, maize exports in the 2016/17 marketing
year (March/February) are forecast at a record level of 24 million
tonnes. The higher forecast is largely underpinned by the removal
of export restrictions and ample availabilities from this year’s
record maize crop. The subregional wheat export forecast has
been revised from the previous estimate and is now expected
to remain at virtually the same high level as the previous year,
reflecting the bumper 2016 crop in Argentina, which accounts
for about 80 percent of the subregion’s exports.
Prices for wheat and maize followed mixed trends but remained at relatively high levels supported by tight supplies and high export demand Yellow maize prices followed mixed trends between September
and November 2016, but were generally above yearearlier levels
reflecting tight supplies as a result of the reduced maize harvests
or high export demand. In Argentina, the further depreciation
of the local currency and high export demand pressured prices
upward during the period and, in November, prices were more
than double the level compared to a year earlier. In Brazil, Bolivia,
Colombia and Peru, maize prices trended downward between
September and November, mainly reflecting the high influx of
imports. However, with the exception of Colombia, maize prices
in November remained generally above their levels from a year
earlier. In Chile and Ecuador, seasonal trends and tight supplies
pressured prices to move upwards in recent months.
Wheat grain and flour prices in the main subregional markets
followed mixed trends in the past few months. In Argentina,
wheat prices generally continued to be pressured by high export
demand partly as a result of the removal of export controls and
a weak national currency, and in November remained well above
their year‑earlier levels. Domestic wheat grain prices declined
during the September‑to‑November period reflecting increased
supplies from the 2016 harvest. By contrast, wheat flour prices
increased over the same period, as local supplies remained tight
reflecting large volumes of exports. In Brazil, Bolivia, Chile,
Ecuador and Peru, prices of wheat grain and wheat flour,
trended downward between September and November and were
down from their year‑earlier levels November, mainly reflecting
increased imports supplies. In Colombia, prices generally fell
in recent months due to higher import volumes, however, the
weak local currency kept prices in November 2016 above their
year‑earlier levels.
20162014 2015
100
200
300
400
500
600
700
800
900
1000
NOSAJJMAMFJDNOSAJJMAMFJDN
USD/tonne
Figure 10. Wholesale wheat flour prices in selected countries in South America
Sources: Servicio Informativo de Mercados Agropecuarios, Bolivia; Instituto de Economía Agrícola, Brazil; Bolsa de Cereales, Argentina.
Brazil, São Paulo
Argentina, Buenos Aires
Bolivia, Santa Cruz
LATIN
AM
ERIC
A A
ND
THE C
AR
RIB
EAN
No. 4 n December 201630
Crop Prospects and Food Situation
NORTH AMERICA
Early indications suggest small contraction in winter wheat plantings for 2017 harvestIn the United States of America, winter wheat planting for
the 2017 harvest was reported to be virtually complete by late
November and with 58 percent rated as good to excellent, the
condition ratings are a little above that at the same time last
year. Although the final estimates are not available yet, early
indications suggest that because of low prices, plantings of
winter wheat, which account for over 80 percent of the country’s
total wheat area, are likely to be down again for the third year in
succession and may be the lowest level for decades. Regarding
coarse grains, the latest official estimate puts the 2016 maize
output at almost 387 million tonnes, 11.9 percent up from last
year’s crop and a new record, above the previous high set in
2014. In Canada, the bulk of the wheat crop is planted in the
spring and the 2017 crop will not be sown until March‑April
next year. Latest information regarding the 2016 cereal harvest
puts the total wheat output at 31.5 million tonnes, a sharp
14 percent recovery from the previous year’s reduced crop.
However, because wet conditions have delayed harvesting,
there are concerns over the quality of this year’s crop.
Note: Totals and percentage change computed from unrounded data.
No. 4 n December 2016 31
Crop Prospects and Food Situation
EUROPE
European UnionEarly indications suggest little change in European Union’s winter wheat area for harvest in 2017 As of late November, the bulk of the winter grain crops for harvest
in 2017 had been sown throughout the European Union.
Conditions have generally been favourable although dryness
delayed planting somewhat in France. Early indications suggest
that the overall area sown to winter wheat is similar to that in
the previous year. Despite poor returns for wheat, the situation
for alternative crops is no more attractive, therefore, a similar
distribution of land among crops is expected as in the previous
year. The European Union’s cereal output in 2016 is now
estimated at some 300 million tonnes, 4.4 percent down from
2015, largely due to a drop in wheat production to the lowest
level in three years. Output slumped particularly in France due to
unfavourable weather.
CIS in EuropePlantings for 2017 winter cereal crop estimated to expandPlanting of the winter cereal crops, to be harvested in 2017, is
virtually complete in the European CIS countries. In the Russian
Federation, the planted‑area target of 17.3 million hectares
for winter crops, the bulk of which is wheat, was achieved by
the end of November and is 1 million hectares higher than the
corresponding period last year. Following generally above‑average
precipitation, soil moisture levels are reported to be adequate and
winter crop conditions are favourable.
In Ukraine, winter cereal planting is almost complete. After
some delays due to heavy rains at the beginning of the planting
season, sowings proceeded normally and the planted area nearly
reached the official target by the end of November. The official
target for wheat is set at 6.2 million hectares, approximately
3 percent up on last year. In Belarus and the Republic of
Moldova, the area planted for winter cereals is estimated to be
close to last year’s level.
Cereal harvest estimated at record high in 2016 Harvesting of the 2016 cereal crop is virtually complete. The
subregional’s aggregate cereal output is estimated at a record
level of 189 million tonnes, about 9 percent up on the 2015 level.
The estimated increase in cereal production mainly results from
a bumper wheat output, estimated at 102 million tonnes, up
11 percent from last year’s already high level.
In the Russian Federation, total cereal production is forecast
at 115 million tonnes, 13 percent up from 2016. The wheat
output is projected to reach a record high of 72 million tonnes,
17 percent higher than last year as a result of better yields and
the increase in area planted. However, the share of milling quality
wheat is reported to be lower than last year. Maize production,
which has increased in the last years, is estimated at 14.1 million
tonnes, up 4 percent from 2015. Similarly, the estimate for the
barley crop stands at 18.7 million tonnes in 2016, 7 percent up
from last year.
The aggregate cereal production is also estimated to increase
in Ukraine. Despite drought conditions during the planting of
winter cereals, the total cereal output is estimated at 63 million
tonnes, almost 6 percent higher than in 2015. The wheat
crop accounts for about 40 percent of the total harvest, and
is estimated at 26.1 million tonnes, just 2 percent below the
previous year’s record. The minor reduction in wheat output was
more than offset by a 10 percent production gain for maize,
estimated at 26 million tonnes and a 15 percent increase in barley
production, reflecting an increased planted area.
Cereal production in the Republic of Moldova is estimated
to increase by almost 30 percent from last year due to better
yields. Of this total, wheat production is estimated at 1.3 million
tonnes, a rebound of 40 percent from last year and the largest
output in the last five years.
By contrast, cereal production in Belarus is expected to
decline to 7.5 million tonnes. Unfavourable weather conditions
during crop development negatively affected yields, leading to a
9 percent year‑on‑year decline in cereal production.
Record 2016 cereal production anticipated to boost exportsCereal exports in the 2016/17 marketing year (July/June) are
expected to reach 76 million tonnes, about 2 million tonnes
(3 percent) above the previous year’s volume. This increase
is mainly attributed to the expectations of increased wheat
shipments from the Russian Federation and larger volumes of
maize exports from Ukraine. In the Russian Federation, total
exports are projected at 37 million tonnes, of which 28.5 million
tonnes is wheat. In Ukraine, maize shipments are set at 18 million
tonnes, a 5 percent increase on a yearly basis, while wheat export
are expected to decline by 11 percent.
Shortage of milling quality wheat results in price increases Despite the record crop production in the subregion, a shortage
of high quality wheat led to an increase in export and domestic
prices of milling wheat in the main exporters.
Export prices of wheat increased by more than 4 percent in
November, supported by demand from importers and pressured
by higher international prices. In the Russian Federation,
domestic prices of milling wheat grew by more than 2 percent in
NO
RTH
AM
ERIC
A, EU
RO
PE AN
D O
CEA
NIA
No. 4 n December 201632
Crop Prospects and Food Situation
November; despite a record harvest in the country as the share
of milling quality wheat is smaller this year. In Ukraine, domestic
wheat prices were rising over last three months due to a reduced
wheat harvest. Similarly, reflecting a lower production in 2016,
prices of wheat flour in Belarus rose in November and were
more than 7 percent higher than a year earlier. By contrast, in the
Republic of Moldova wheat prices declined slightly, as a result
of a bumper crop this year.
OCEANIA
Good prospects for 2016 winter grains harvest despite some frost lossesProspects for the upcoming winter grains harvest in Australia are
generally favourable with production of wheat set to reach a five‑
year high at some 28 million tonnes. Some Western Australian
crops were damaged by severe frosts earlier in the season but
nonetheless, with plentiful rainfall in other major producing
areas for this year’s crop, good yields are expected to boost the
output. Regarding sorghum, the main summer cereal, plantings
for the crop for harvest in 2017 are estimated to be down by
20162014 2015
100
150
200
250
300
350
400
450
500
NOSAJJMAMFJDNOSAJJMAMFJDN
Figure 11. Wholesale wheat and wheat flour pricesin Russian Federation and Ukraine
Source: APK‑Inform Agency.
Ukraine (wheat, national average)
Russian Federation (wheat flour, Southern region)
Ukraine (wheat flour, national average)
USD/tonne
Russian Federation (wheat, National average)
7 percent reflecting a sharp reduction in sorghum prices in 2016
and expectations that cotton will offer relatively higher returns
in 2017.
NO
RTH
AM
ERIC
A,
EUR
OPE
AN
D O
CEA
NIA
Crop Prospects and Food Situation
No. 4 n December 2016 33
Statistical appendix
Table A1. Global cereal supply and demand indicators ............................................................................................ .34
Table A2. World cereal stocks .................................................................................................................................. .35
Table A3. Selected international prices of wheat and coarse grains .......................................................................... .36
Table A4a. Cereal import requirements of Low‑Income Food‑Deficit Countries, 2015/16 or 2016 estimates ............... .37
Table A4b. Cereal import requirements of Low‑Income Food‑Deficit Countries, 2015/16 or 2016 estimates .............. .38
Utilization is de�ned as the sum of food use, feed and other uses.Cereals refer to wheat, coarse grains and rice; grains refer to wheat and coarse grains.
Major wheat exporters are Argentina, Australia, Canada, the European Union, Kazakhstan, the Russian Federation, Ukraine and the United States of America; major coarse grain exporters are Argentina, Australia, Brazil, Canada, the European Union, the Russian Federation, Ukraine and the United States of America; major rice exporters are India, Pakistan, Thailand, the United States of America and Viet Nam.
Normal market requirements for major grain exporters are de�ned as the average of domestic utilization plus exports in the three preceding seasons.Disappearance is de�ned as domestic utilization plus exports for any given season.
Price indices: The Wheat Price Index has been constructed based on the IGC Wheat Price Index, rebased to 2002-2004=100; for maize, the U.S. maize No.2 Yellow (delivered U.S. Gulf ports) with base 2002-2004=100; for rice, the FAO Rice Price Index, 2002-2004=100, is based on 16 rice export quotations.
Central America 5.6 5.6 6.6 7.5 9.0 9.4Mexico 2.3 2.6 3.3 3.6 4.6 5.2
South America 22.6 15.7 27.9 36.3 30.1 23.8Argentina 4.8 2.1 5.8 10.3 7.9 7.9Brazil 9.5 6.1 12.0 15.2 9.9 3.8
Note: Based on o�cial and uno�cial estimates. Totals computed from unrounded data.1 Stocks data are based on an aggregate of carryovers at the end of national crop years and do not represent world stock levels at any point in time.2 Major wheat exporters are Argentina, Australia, Canada, the European Union, Kazakhstan, the Russian Federation, Ukraine and the United States of America; major coarse grain exporters are Argentina, Australia, Brazil, Canada, the European Union, the Russian Federation, Ukraine and the United States of America; major rice exporters are India, Pakistan, Thailand, the United States of America and Viet Nam.
No. 4 n December 201636
Crop Prospects and Food Situation
Table A3. Selected international prices of wheat and coarse grains(USD/tonne)
Central Africa 1 753.7 149.3 1 903.0 1 770.1 999.5 Cameroon Jan/Dec 1 016.6 2.0 1 018.6 887.0 774.4 Central African Republic Jan/Dec 52.0 23.0 75.0 75.0 12.0 Democratic Republic of the Congo Jan/Dec 669.7 120.3 790.0 790.0 206.0 Sao Tome and Principe Jan/Dec 15.4 4.0 19.4 18.1 7.1
Source: FAO1 The Low-Income Food-De�cit Countries (LIFDCs) group includes net food de�cit countries with annual per caput income below the level used by the World Bank to determine eligibility for IDA assistance (i.e. USD 1 945 in 2011); for full details see http://www.fao.org/countrypro�les/lifdc2 Estimates based on available information as of October 2016.
No. 4 n December 201638
Crop Prospects and Food Situation
Table A4b. Cereal import requirements of Low-Income Food-De�cit Countries1 , 2015/16 or 2016 estimates(thousand tonnes)
Source: FAO1 The Low-Income Food-De�cit Countries (LIFDCs) group includes net food de�cit countries with annual per caput income below the level used by the World Bank to determine eligibility for IDA assistance (i.e. USD 1 945 in 2011); for full details see http://www.fao.org/countrypro�les/lifdc2 Estimates based on available information as of October 2016.
* Countries included in this table are only those that have entered the new marketing year.1 The Low-Income Food-De�cit Countries (LIFDCs) group includes net food de�cit countries with annual per caput income below the level used by the World Bank to determine eligibility for IDA assistance (i.e. USD 1 945 in 2011); for full details see http://www.fao.org/countrypro�les/lifdc2 Estimates based on available information as of October 2016.
GIEWS continuously monitors crop prospects and food security situation at global, regional, national and sub-national
levels and warns of impending food difficulties and emergencies. Established in the wake of the world food crisis of the
early 1970’s, GIEWS maintains a unique database on all aspects of food supply and demand for every country of the
world. The System regularly provides policy makers and the international community with up-to-date information so that
timely interventions can be planned and suffering avoided.
The Global Information and Early Warning System on Food and AgricultureGIEWS
Disclaimer
The designations employed and the presentation of material in this information product do not imply the expression of any opinion whatsoever on the part of the Food and Agriculture Organization of the United Nations (FAO) concerning the legal or development status of any country, territory, city or area or of its authorities, or concerning the delimitation of its frontiers or boundaries. The mention of specific companies or products of manufacturers, whether or not these have been patented, does not imply that these have been endorsed or recommended by FAO in preference to others of a similar nature that are not mentioned.
The views expressed in this information product are those of the author(s) and do not necessarily reflect the views or policies of FAO.
Crop Prospects and Food Situation is published by the Trade and Markets Division of FAO under the Global Information
and Early Warning System (GIEWS). It is published four times a year and focuses on developments affecting the food
situation of developing countries and the Low‑Income Food‑Deficit Countries (LIFDCs) in particular. The report provides
a review of the food situation by geographic region, a section dedicated to the LIFDCs and a list of countries requiring
external assistance for food. It also includes a global cereal supply and demand overview to complement the biannual
analysis in the Food Outlook publication. Crop Prospects and Food Situation is available in English, French and
Spanish in electronic format.
Crop Prospects and Food Situation and other GIEWS reports are available online at: http:/www.fao.org/giews/. In addition, GIEWS Special Reports and Special Alerts, when published, can be received by e‑mail through automatic
mailing lists. Subscription information is available at: http:/www.fao.org/giews/english/listserv.htm.
This report is based on information available as of November 2016.
Enquiries may be directed to: Global Information and Early Warning System on Food and Agriculture (GIEWS) Trade and Markets Division (EST) Food and Agriculture Organization of the United Nations (FAO) Viale delle Terme di Caracalla 00153 Rome ‑ Italy E-mail: [email protected]